Embed Size (px)
Citation preview

Market Consistent Embedded Value Solid growth amid a changing regulatory landscape

Contents
Introduction 1
Executive summary 2
Results 3
The market view of embedded value results 10
Disclosure 13
Methodology and assumptions 16
Conclusion 18
Appendix: Embedded value year-end 2013 assumptions summary 19
Contacts 23

This report summarises the 2013 embedded value results of fifteen major insurance companies in the UK and Europe and considers the key drivers of the embedded values.
2013 was a good year for market performance, with signs of recovery from the financial crisis.
Life insurance companies’ embedded values continue to be very sensitive to market performance. Higher reference rates, narrower sovereign debt spreads, improved equity markets and lower volatilities have all contributed to improved returns on embedded value.
Regulatory changes played a significant role in the value of new business over the year and we expect this to continue. We look at how insurers have responded to the regulatory challenges they are currently facing.
We continue to observe improving market sentiment towards the life insurance industry, and we explore in greater depth the market’s view of the industry.
This report also highlights any similarities or differences in approach used by the companies in our sample and any changes undertaken to align the current approaches to the latest Solvency II developments, now that there is more certainty around the regulation.
I hope you find this report insightful. If you would like to contribute to the debate or ask any questions, please do contact me or one of the team listed at the end of the report.
Roger SimlerPartner, Consulting
Introduction
Market Consistent Embedded Value Solid growth amid a changing regulatory landscape 1
To start a new section, hold down the apple+shift keys and click
to release this object and type the section title in the box below.
Results2013 was a good year in terms of market performance, with promising signs of recovery from the financial crisis. This was reflected in our 2013 year end survey of embedded value results with fourteen out of fifteen companies in our sample producing a positive return on embedded value, and the like for like growth in embedded value matching last year’s figure of 11 per cent.
Economic varianceThe majority of companies in our survey reported strong economic variance as a key driver behind the positive embedded value movements over 2013, driven by higher reference rates, narrower bond spreads, good equity market performance and lower volatilities.
New business and regulatory changesAnother notable driver of the positive embedded value movements in 2013 was the value of new business. Significant regulatory challenges, such as the Retail Distribution Review (RDR) in the UK, gender neutral pricing and workplace pension auto-enrolment, have all affected the way new business is written by insurers. We continue to see that, despite tough regulatory pressures, companies are adapting to changing circumstances with the aim of continuing to deliver strong new business results. However, insurers face further challenges, and recent events in the UK show how political and regulatory interventions can have seismic impacts on particular markets or segments therein. On March 19 2014, the Chancellor of the Exchequer announced the freeing up of access to Defined Contribution pension schemes and the elimination of any obligation to purchase an annuity. In one fell swoop his actions will have reduced the individual annuity market to a shadow of its former self. While one could argue that many people might still need products with the features of annuities, we anticipate significant changes in new business propositions from the companies that are currently writing significant amounts of annuity business.
Markets’ viewWe continue to observe the improving market sentiment towards the life insurance sector as seen through historic price/embedded value ratios. However, while the price/embedded value ratio is a useful tool, it can be distorted by many factors, one of which is the differences in approach to embedded value between companies that have long troubled analysts following the industry. Recent events in the UK have also shown how susceptible insurance companies’ share prices are to external factors, such as political and regulatory actions.
Methodology and assumptionsDespite the greater certainty around the timing and form of Solvency II, there has been no further guidance issued by the CFO Forum on the future form of embedded value reporting. Given this, it is perhaps unsurprising that we have not observed any further significant moves towards adoption of MCEV within the industry (Generali have formally reported on an MCEV basis for the first time, but this is primarily presentational as their previous methodology was heavily aligned with MCEV). Nor have the release of the Long-term Guarantee Assessment (where the allowance for credit risk changed compared to QIS5) and the additional detail on the calculation principles underlying the volatility adjustment and matching adjustment been reflected in embedded value methodologies in general. Two companies in our sample, however, updated their yield curve extrapolation methodology in line with the latest Solvency II advice.
Executive summary
2
To start a new section, hold down the apple+shift keys and click
to release this object and type the section title in the box below.
Results
1 This allows for currency movements over 2013.
2 Local currency EV figures were converted to GBP currency using exchange rates as at 31 December 2013.
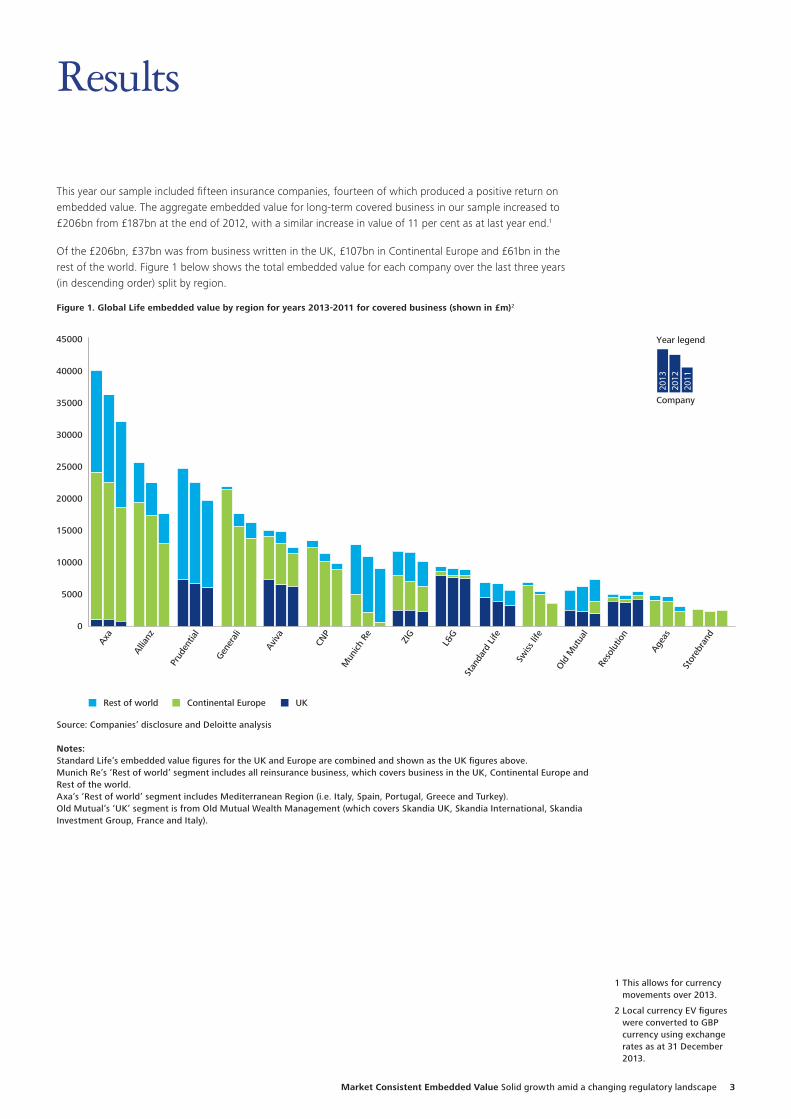
This year our sample included fifteen insurance companies, fourteen of which produced a positive return on embedded value. The aggregate embedded value for long-term covered business in our sample increased to £206bn from £187bn at the end of 2012, with a similar increase in value of 11 per cent as at last year end.1
Of the £206bn, £37bn was from business written in the UK, £107bn in Continental Europe and £61bn in the rest of the world. Figure 1 below shows the total embedded value for each company over the last three years (in descending order) split by region.
Figure 1. Global Life embedded value by region for years 2013-2011 for covered business (shown in £m)2
Source: Companies’ disclosure and Deloitte analysis
Notes:Standard Life’s embedded value figures for the UK and Europe are combined and shown as the UK figures above.Munich Re’s ‘Rest of world’ segment includes all reinsurance business, which covers business in the UK, Continental Europe and Rest of the world.Axa’s ‘Rest of world’ segment includes Mediterranean Region (i.e. Italy, Spain, Portugal, Greece and Turkey).Old Mutual’s ‘UK’ segment is from Old Mutual Wealth Management (which covers Skandia UK, Skandia International, Skandia Investment Group, France and Italy).
Continental Europe UKRest of world
Axa
Allia
nz
Prud
entia
l
Gene
rali
Aviv
a
CNP
Mun
ich R
e
ZIG
L&G
Stan
dard
Life
Swiss
life
Old
Mut
ual
Reso
lutio
n
Agea
s
Stor
ebra
nd
Year legend
Company
0
5000
10000
15000
20000
25000
30000
35000
40000
45000
2013
2012
2011
Market Consistent Embedded Value Solid growth amid a changing regulatory landscape 3
To start a new section, hold down the apple+shift keys and click
to release this object and type the section title in the box below.
Axa reported an eight per cent increase in its embedded value and remains the largest insurer in our sample with a considerable margin over the rest.
The largest increase in the embedded value was reported by Storebrand (27 per cent per cent return), followed by Swiss Life (23 per cent return), and Generali (22 per cent return). For comparison, last year’s top performers were Ageas (51 per cent return), followed by Swiss Life (47 per cent return), and Allianz (31 per cent return). It is interesting to note that last year’s top returns were almost double of what we see this year.
Storebrand’s return is mainly driven by NOK 3.5bn (£0.3bn) positive economic variance.
Swiss Life’s return is mainly driven by assumption changes (CHF 0.5bn or £0.3bn), expected contribution (CHF 0.4bn or £0.3bn) and new business (CHF 0.3bn or £0.2bn).
Generali’s 22 per cent return largely reflects a €4.7bn (£3.9bn) positive economic variance, €1.5bn (£1.3bn) expected contribution and €0.9bn (£0.8bn) of new business value.
From the above we note that, over 2013, economic variance and new business values remained the key drivers of the growth in the embedded values. In the rest of this section we will have a closer look at these two factors.
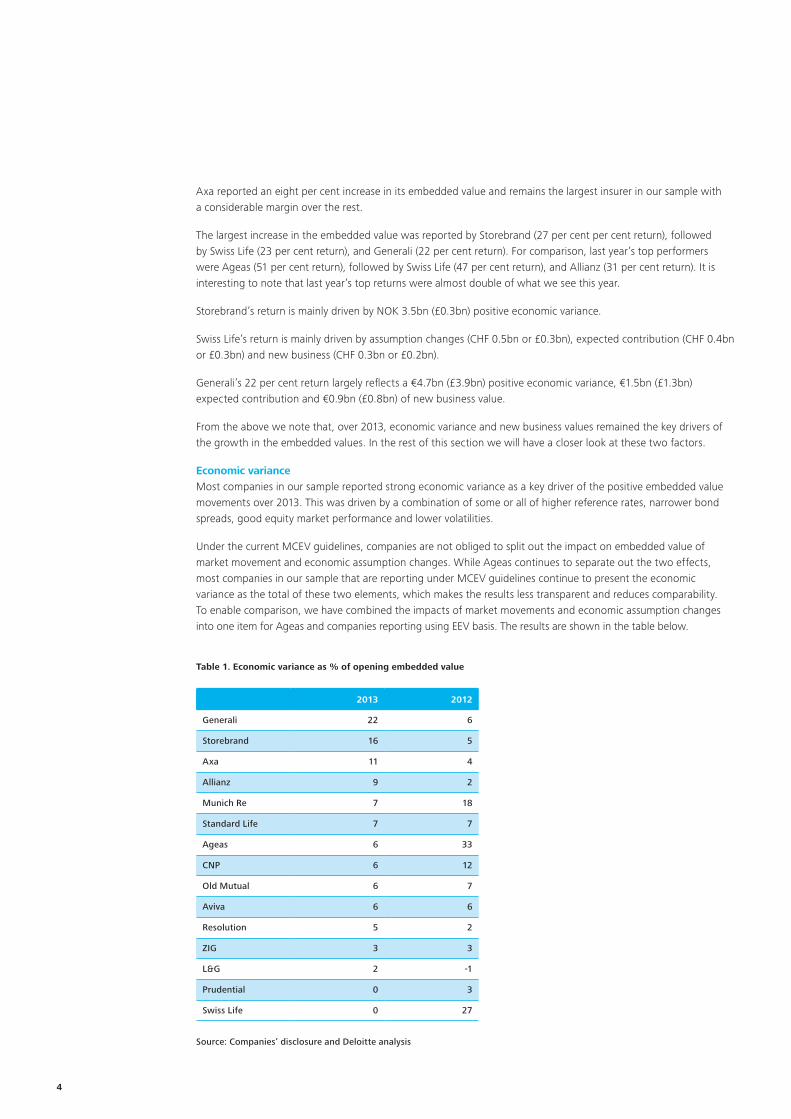
Economic varianceMost companies in our sample reported strong economic variance as a key driver of the positive embedded value movements over 2013. This was driven by a combination of some or all of higher reference rates, narrower bond spreads, good equity market performance and lower volatilities.
Under the current MCEV guidelines, companies are not obliged to split out the impact on embedded value of market movement and economic assumption changes. While Ageas continues to separate out the two effects, most companies in our sample that are reporting under MCEV guidelines continue to present the economic variance as the total of these two elements, which makes the results less transparent and reduces comparability. To enable comparison, we have combined the impacts of market movements and economic assumption changes into one item for Ageas and companies reporting using EEV basis. The results are shown in the table below.
Table 1. Economic variance as % of opening embedded value
2013 2012
Generali 22 6
Storebrand 16 5
Axa 11 4
Allianz 9 2
Munich Re 7 18
Standard Life 7 7
Ageas 6 33
CNP 6 12
Old Mutual 6 7
Aviva 6 6
Resolution 5 2
ZIG 3 3
L&G 2 -1
Prudential 0 3
Swiss Life 0 27
Source: Companies’ disclosure and Deloitte analysis
4
To start a new section, hold down the apple+shift keys and click
to release this object and type the section title in the box below.
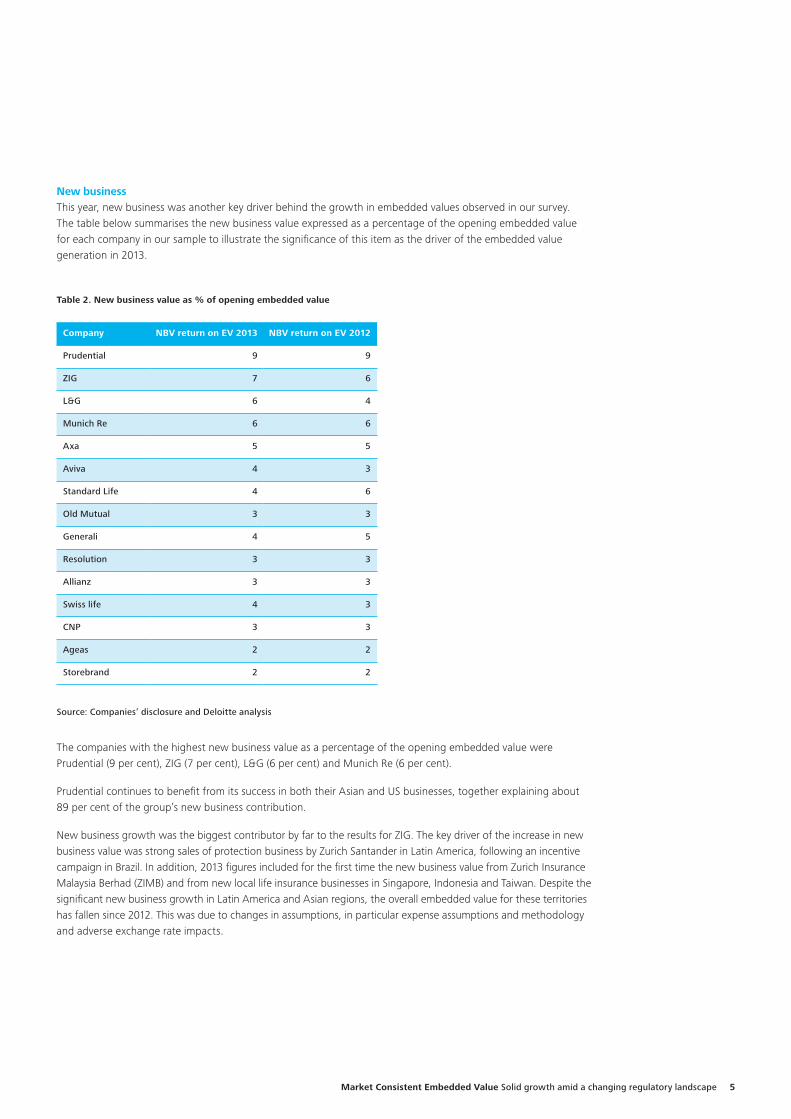
New businessThis year, new business was another key driver behind the growth in embedded values observed in our survey. The table below summarises the new business value expressed as a percentage of the opening embedded value for each company in our sample to illustrate the significance of this item as the driver of the embedded value generation in 2013.
Table 2. New business value as % of opening embedded value
Company NBV return on EV 2013 NBV return on EV 2012
Prudential 9 9
ZIG 7 6
L&G 6 4
Munich Re 6 6
Axa 5 5
Aviva 4 3
Standard Life 4 6
Old Mutual 3 3
Generali 4 5
Resolution 3 3
Allianz 3 3
Swiss life 4 3
CNP 3 3
Ageas 2 2
Storebrand 2 2
Source: Companies’ disclosure and Deloitte analysis
The companies with the highest new business value as a percentage of the opening embedded value were Prudential (9 per cent), ZIG (7 per cent), L&G (6 per cent) and Munich Re (6 per cent).
Prudential continues to benefit from its success in both their Asian and US businesses, together explaining about 89 per cent of the group’s new business contribution.
New business growth was the biggest contributor by far to the results for ZIG. The key driver of the increase in new business value was strong sales of protection business by Zurich Santander in Latin America, following an incentive campaign in Brazil. In addition, 2013 figures included for the first time the new business value from Zurich Insurance Malaysia Berhad (ZIMB) and from new local life insurance businesses in Singapore, Indonesia and Taiwan. Despite the significant new business growth in Latin America and Asian regions, the overall embedded value for these territories has fallen since 2012. This was due to changes in assumptions, in particular expense assumptions and methodology and adverse exchange rate impacts.
Market Consistent Embedded Value Solid growth amid a changing regulatory landscape 5
To start a new section, hold down the apple+shift keys and click
to release this object and type the section title in the box below.
For L&G, the 61 per cent increase in value compared to 2012 reflects the strong increase in the contribution from L&G Retirement, where sales increased to £4.1bn (2012: £2.3bn), split £1.3bn individual and £2.8bn for bulk annuities. It is the former that will be impacted most heavily by the recent Budget announcement referred to above.
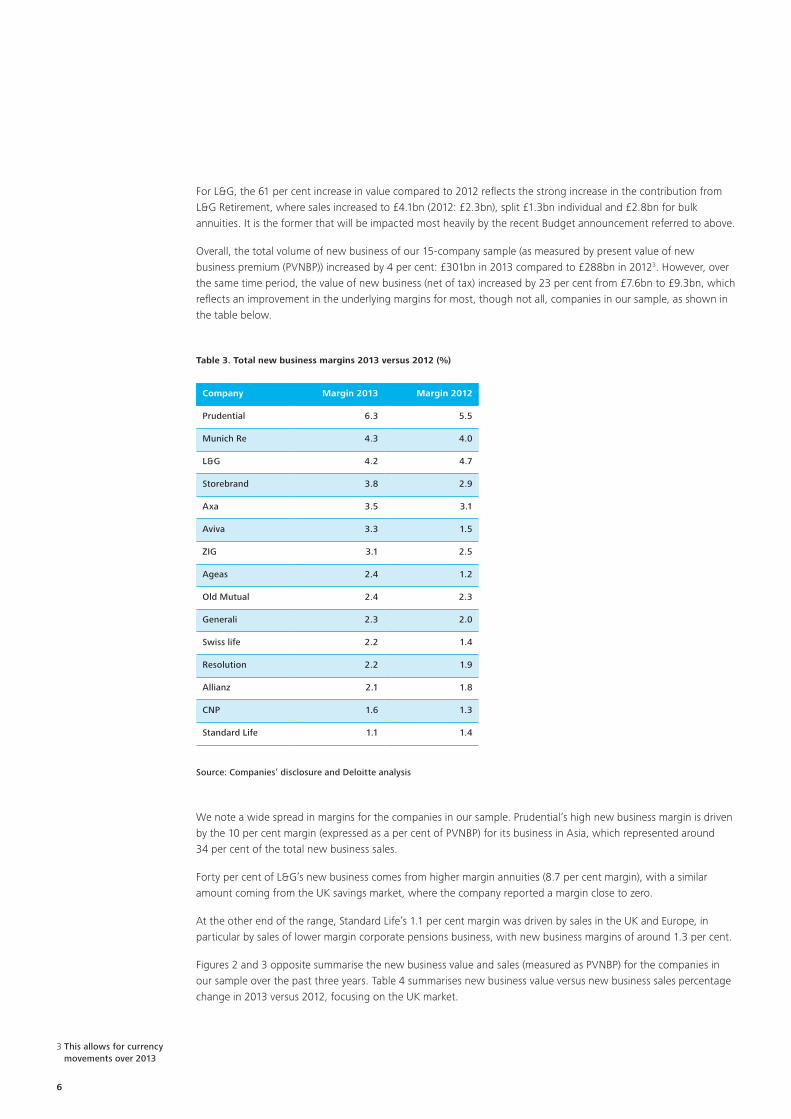
Overall, the total volume of new business of our 15-company sample (as measured by present value of new business premium (PVNBP)) increased by 4 per cent: £301bn in 2013 compared to £288bn in 20123. However, over the same time period, the value of new business (net of tax) increased by 23 per cent from £7.6bn to £9.3bn, which reflects an improvement in the underlying margins for most, though not all, companies in our sample, as shown in the table below.
Table 3. Total new business margins 2013 versus 2012 (%)
3 This allows for currency movements over 2013
Company Margin 2013 Margin 2012
Prudential 6.3 5.5
Munich Re 4.3 4.0
L&G 4.2 4.7
Storebrand 3.8 2.9
Axa 3.5 3.1
Aviva 3.3 1.5
ZIG 3.1 2.5
Ageas 2.4 1.2
Old Mutual 2.4 2.3
Generali 2.3 2.0
Swiss life 2.2 1.4
Resolution 2.2 1.9
Allianz 2.1 1.8
CNP 1.6 1.3
Standard Life 1.1 1.4
Source: Companies’ disclosure and Deloitte analysis
We note a wide spread in margins for the companies in our sample. Prudential’s high new business margin is driven by the 10 per cent margin (expressed as a per cent of PVNBP) for its business in Asia, which represented around 34 per cent of the total new business sales.
Forty per cent of L&G’s new business comes from higher margin annuities (8.7 per cent margin), with a similar amount coming from the UK savings market, where the company reported a margin close to zero.
At the other end of the range, Standard Life’s 1.1 per cent margin was driven by sales in the UK and Europe, in particular by sales of lower margin corporate pensions business, with new business margins of around 1.3 per cent.
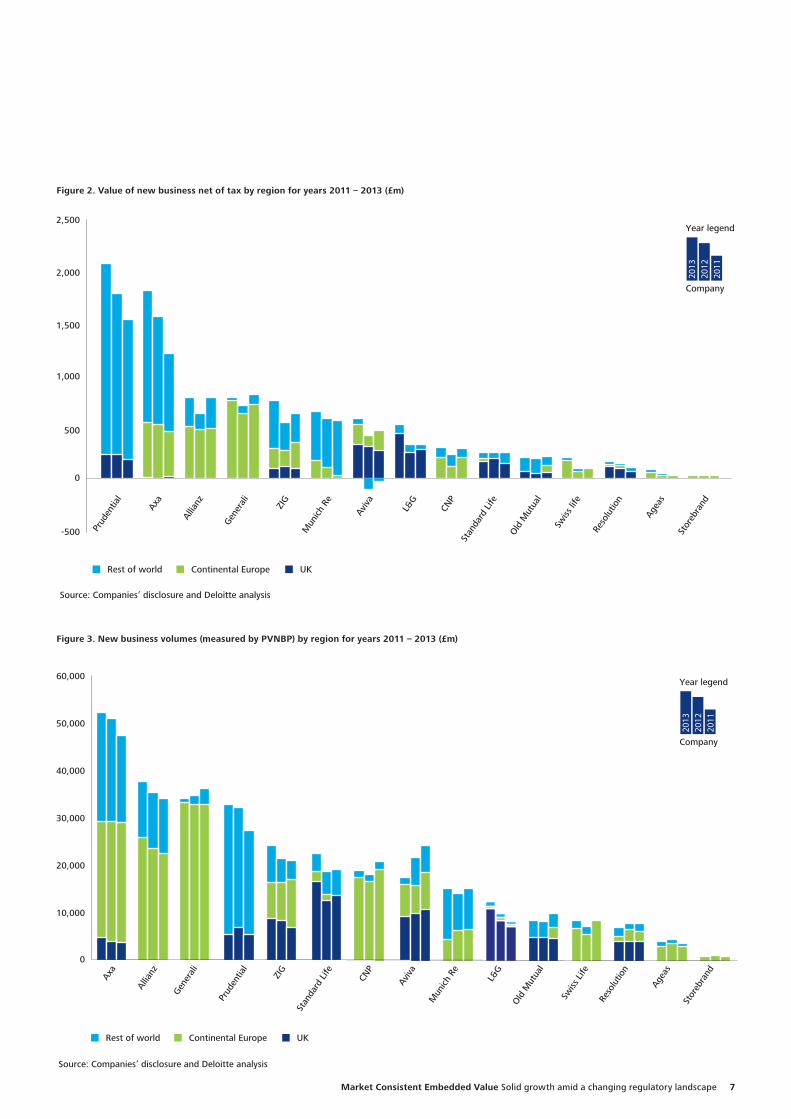
Figures 2 and 3 opposite summarise the new business value and sales (measured as PVNBP) for the companies in our sample over the past three years. Table 4 summarises new business value versus new business sales percentage change in 2013 versus 2012, focusing on the UK market.
6
To start a new section, hold down the apple+shift keys and click
to release this object and type the section title in the box below.
0
500
-500
1,000
1,500
2,000
2,500Year legend
Company
2013
2012
2011
Prud
entia
l
Axa
Allia
nz
Gene
rali
ZIG
Mun
ich R
e
Aviv
a
L&G
CNP
Stan
dard
Life
Old
Mut
ual
Reso
lutio
n
Agea
s
Stor
ebra
nd
Continental Europe UKRest of world
Source: Companies’ disclosure and Deloitte analysis
Swiss
life
Year legend
Company
2013
2012
2011
0
10,000
20,000
30,000
40,000
50,000
60,000
Continental Europe UKRest of world
Source: Companies’ disclosure and Deloitte analysis
Axa
Allia
nz
Gene
rali
Prud
entia
l
ZIG
Stan
dard
Life
CNP
Aviv
a
Mun
ich R
e
L&G
Old
Mut
ual
Swiss
Life
Reso
lutio
n
Agea
s
Stor
ebra
nd
Figure 2. Value of new business net of tax by region for years 2011 – 2013 (£m)
Figure 3. New business volumes (measured by PVNBP) by region for years 2011 – 2013 (£m)
Market Consistent Embedded Value Solid growth amid a changing regulatory landscape 7
To start a new section, hold down the apple+shift keys and click
to release this object and type the section title in the box below.
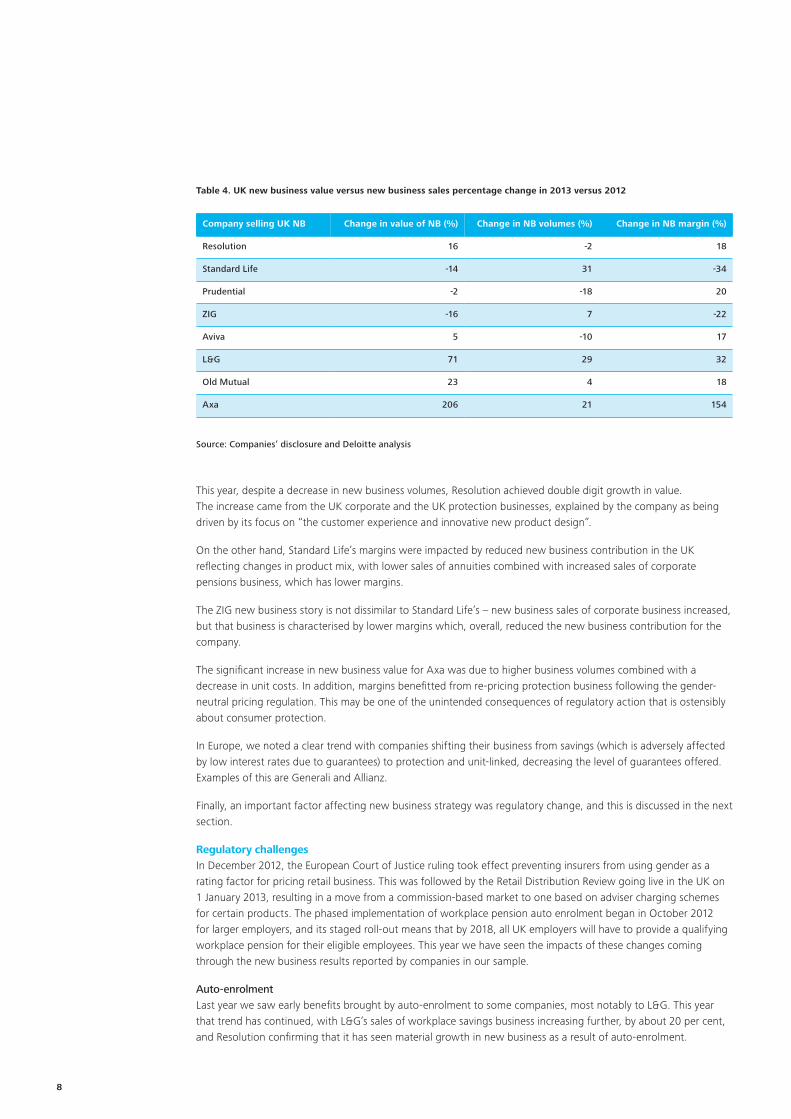
Table 4. UK new business value versus new business sales percentage change in 2013 versus 2012
This year, despite a decrease in new business volumes, Resolution achieved double digit growth in value. The increase came from the UK corporate and the UK protection businesses, explained by the company as being driven by its focus on “the customer experience and innovative new product design”.
On the other hand, Standard Life’s margins were impacted by reduced new business contribution in the UK reflecting changes in product mix, with lower sales of annuities combined with increased sales of corporate pensions business, which has lower margins.
The ZIG new business story is not dissimilar to Standard Life’s – new business sales of corporate business increased, but that business is characterised by lower margins which, overall, reduced the new business contribution for the company.
The significant increase in new business value for Axa was due to higher business volumes combined with a decrease in unit costs. In addition, margins benefitted from re-pricing protection business following the gender-neutral pricing regulation. This may be one of the unintended consequences of regulatory action that is ostensibly about consumer protection.
In Europe, we noted a clear trend with companies shifting their business from savings (which is adversely affected by low interest rates due to guarantees) to protection and unit-linked, decreasing the level of guarantees offered. Examples of this are Generali and Allianz.
Finally, an important factor affecting new business strategy was regulatory change, and this is discussed in the next section.
Regulatory challengesIn December 2012, the European Court of Justice ruling took effect preventing insurers from using gender as a rating factor for pricing retail business. This was followed by the Retail Distribution Review going live in the UK on 1 January 2013, resulting in a move from a commission-based market to one based on adviser charging schemes for certain products. The phased implementation of workplace pension auto enrolment began in October 2012 for larger employers, and its staged roll-out means that by 2018, all UK employers will have to provide a qualifying workplace pension for their eligible employees. This year we have seen the impacts of these changes coming through the new business results reported by companies in our sample.
Auto-enrolmentLast year we saw early benefits brought by auto-enrolment to some companies, most notably to L&G. This year that trend has continued, with L&G’s sales of workplace savings business increasing further, by about 20 per cent, and Resolution confirming that it has seen material growth in new business as a result of auto-enrolment.
Company selling UK NB Change in value of NB (%) Change in NB volumes (%) Change in NB margin (%)
Resolution 16 -2 18
Standard Life -14 31 -34
Prudential -2 -18 20
ZIG -16 7 -22
Aviva 5 -10 17
L&G 71 29 32
Old Mutual 23 4 18
Axa 206 21 154
Source: Companies’ disclosure and Deloitte analysis
8

To start a new section, hold down the apple+shift keys and click
to release this object and type the section title in the box below.
Standard Life is also capitalising on the opportunities created by auto-enrolment. The Company attracted 340,000 new customers in 2013 with PVNBP for its corporate pensions increasing by 73 per cent compared to year-end 2012. Standard Life’s strategy is to focus on high levels of customer service and the quality of the investment solutions it provides in order to maintain its competitive edge.
However, the full effects of auto enrolment are yet to be seen and we anticipate there being an even bigger impact on insurers’ performance once the auto enrolment staging dates are reached and the minimum contribution rates increase from two per cent to eight per cent by 2018. Offsetting this will be the continuing regulatory focus on margins, and the challenge for companies of offering auto-enrolment solutions cost effectively to the huge numbers of small employers.
RDROur expectation was that a post-RDR world was likely to bring reductions in sales volumes, changes in the type or mix of new business and pressure on margins, due to increased competition and costs of adjusting business models.
L&G reported that sales of savings business fell over the year. The new business margin for the company’s UK savings business also fell over the year. This may be partly explained by the effects of RDR.
Resolution reported a £17m loss due to worse than expected persistency as a result of RDR. In addition, for its corporate benefits business, the company reported that there had been heavy outflows from schemes secured by commission-paying competitors in the run up to the RDR.
ZIG reported that it had seen a decline in sales of individual savings business as a result of RDR.
Budget 2014More recent events included in the UK Chancellor’s Budget announcement on 19 March were the freeing up of access to Defined Contribution pension schemes and the elimination of any obligation to purchase an annuity. In one fell swoop his actions will have reduced the individual annuity market to a shadow of its former self. From April 2015, anyone who is aged 55 or over will be able to take their entire pension fund as cash. The market reaction was swift – the shares of the largest annuity writers fell substantially, wiping £6bn off the UK insurers’ market capitalisation. The market feared the loss of a substantial proportion of the £12 billion a year that is placed in annuities and the resulting loss of new business value, which for many UK life insurers equated to in excess of 50 per cent of total new business value in the UK.
While undoubtedly the number of annuities sold will decline, the impact on the market is likely to be more nuanced. Indeed a case can be made for an overall positive outcome, with the budget encouraging long-term savings.
Insurance providers can respond to the Budget announcement by expanding their at retirement options. We would expect many hybrid product structures to be developed that have some form of guarantee either to income levels or the capital value of the pension pot. Some guarantees will provide total certainty, while others might guarantee minimum values of income or income within a range depending on investment performance. In addition, those with health issues might still find the extra income offered by an enhanced or impaired annuity to be attractive. Compulsory annuitisation is not a requirement for a healthy annuity market to exist. In the United States, for example, there is no requirement to annuitise, yet US$220 billion in annuities were written in 2012 and annuities account for nine per cent of the US$20 trillion US retirement market.
Our expectation is that the annuity market will not disappear entirely. For many retirees an annuity might still be the right product given the certainty of income it provides. Under the new environment, the winners are likely to be those with innovative product options who can tailor these to the specific circumstances of key customer segments, and companies who provide bespoke solutions to their customers’ financial needs, rather than companies with a suite of products to sell.
Regulatory changes will always be challenging but can also provide opportunities, be they one-off sales benefits or a long-term opportunity. We see that companies, despite tough regulatory pressures, have been quick to react to the announcement and appear to be adapting relatively quickly. This will be vital if they are to continue to deliver strong results.
A case can be made for an overall positive outcome, with the budget encouraging long-term savings.
Market Consistent Embedded Value Solid growth amid a changing regulatory landscape 9
To start a new section, hold down the apple+shift keys and click
to release this object and type the section title in the box below.
In life insurance transactions, Price/Embedded Value (P/EV) is used alongside price earnings ratios, multiples of net asset value and dividend discount models to form a view of company value. In order to calibrate to market levels at a particular point in time, it is common to refer to the share price of listed insurance groups relative to their published embedded value.
This year, we have included the following analysis for a sample of companies in our survey:
• point in time comparisons of published embedded values for listed UK and European insurers against their market capitalisation; and
• historical tracker of movement in P/EV over time using share price.
Point-in-time comparisons of the embedded value and market capitalisation can be helpful in showing how the value the market places on a company differs from that of its management.
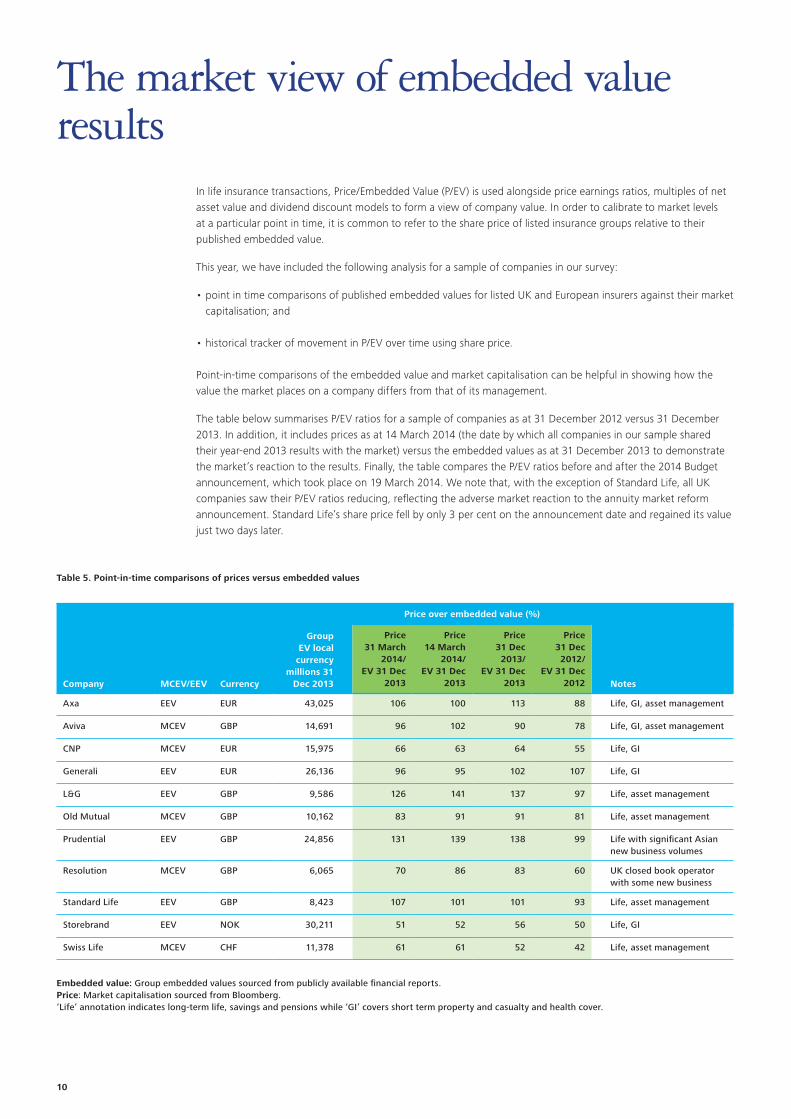
The table below summarises P/EV ratios for a sample of companies as at 31 December 2012 versus 31 December 2013. In addition, it includes prices as at 14 March 2014 (the date by which all companies in our sample shared their year-end 2013 results with the market) versus the embedded values as at 31 December 2013 to demonstrate the market’s reaction to the results. Finally, the table compares the P/EV ratios before and after the 2014 Budget announcement, which took place on 19 March 2014. We note that, with the exception of Standard Life, all UK companies saw their P/EV ratios reducing, reflecting the adverse market reaction to the annuity market reform announcement. Standard Life’s share price fell by only 3 per cent on the announcement date and regained its value just two days later.
The market view of embedded value results
Company MCEV/EEV Currency
Group EV local currency
millions 31 Dec 2013
Price over embedded value (%)
Price 31 March
2014/EV 31 Dec
2013
Price 14 March
2014/ EV 31 Dec
2013
Price 31 Dec 2013/
EV 31 Dec 2013
Price 31 Dec 2012/
EV 31 Dec 2012 Notes
Axa EEV EUR 43,025 106 100 113 88 Life, GI, asset management
Aviva MCEV GBP 14,691 96 102 90 78 Life, GI, asset management
CNP MCEV EUR 15,975 66 63 64 55 Life, GI
Generali EEV EUR 26,136 96 95 102 107 Life, GI
L&G EEV GBP 9,586 126 141 137 97 Life, asset management
Old Mutual MCEV GBP 10,162 83 91 91 81 Life, asset management
Prudential EEV GBP 24,856 131 139 138 99 Life with significant Asian new business volumes
Resolution MCEV GBP 6,065 70 86 83 60 UK closed book operator with some new business
Standard Life EEV GBP 8,423 107 101 101 93 Life, asset management
Storebrand EEV NOK 30,211 51 52 56 50 Life, GI
Swiss Life MCEV CHF 11,378 61 61 52 42 Life, asset management
Table 5. Point-in-time comparisons of prices versus embedded values
Embedded value: Group embedded values sourced from publicly available financial reports.Price: Market capitalisation sourced from Bloomberg.‘Life’ annotation indicates long-term life, savings and pensions while ‘GI’ covers short term property and casualty and health cover.
10
To start a new section, hold down the apple+shift keys and click
to release this object and type the section title in the box below.
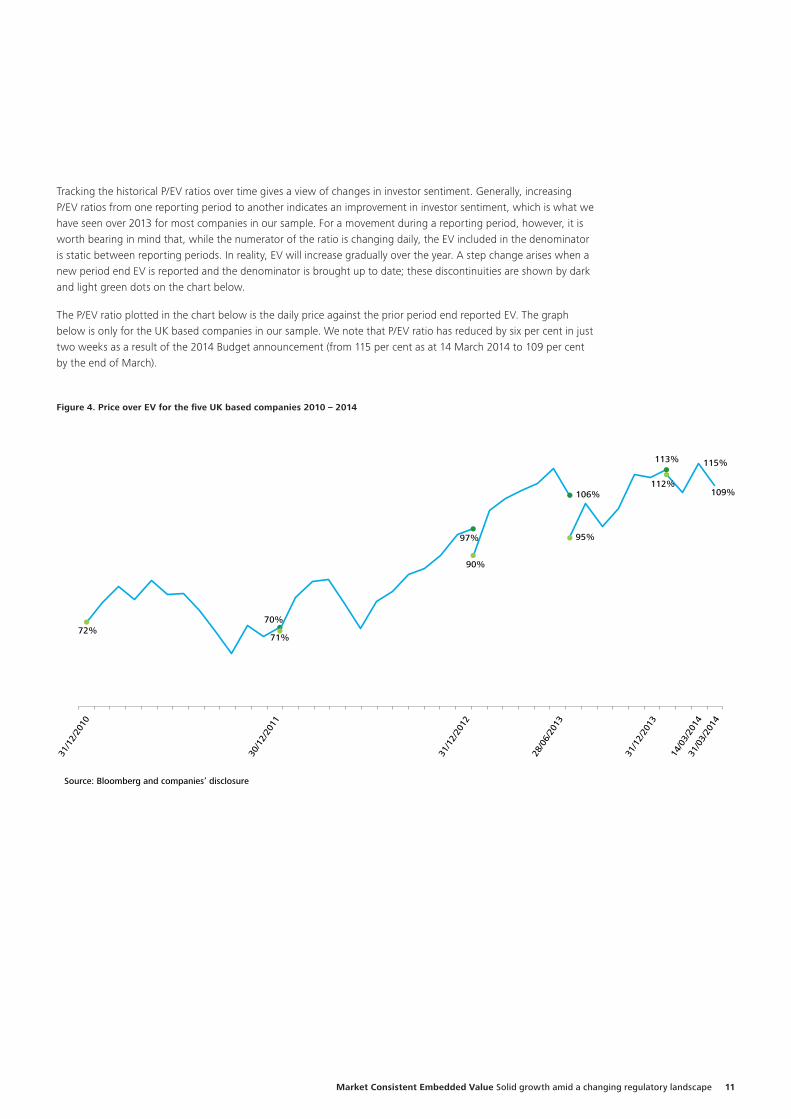
Tracking the historical P/EV ratios over time gives a view of changes in investor sentiment. Generally, increasing P/EV ratios from one reporting period to another indicates an improvement in investor sentiment, which is what we have seen over 2013 for most companies in our sample. For a movement during a reporting period, however, it is worth bearing in mind that, while the numerator of the ratio is changing daily, the EV included in the denominator is static between reporting periods. In reality, EV will increase gradually over the year. A step change arises when a new period end EV is reported and the denominator is brought up to date; these discontinuities are shown by dark and light green dots on the chart below.
The P/EV ratio plotted in the chart below is the daily price against the prior period end reported EV. The graph below is only for the UK based companies in our sample. We note that P/EV ratio has reduced by six per cent in just two weeks as a result of the 2014 Budget announcement (from 115 per cent as at 14 March 2014 to 109 per cent by the end of March).
Figure 4. Price over EV for the five UK based companies 2010 – 2014
72%
31/1
2/20
10
30/1
2/20
11
31/1
2/20
12
31/1
2/20
13
14/0
3/20
1431
/03/
2014
71%
70%
97%
90%
106%
95%
113%
112%
115%
109%
Source: Bloomberg and companies’ disclosure
28/0
6/20
13
Market Consistent Embedded Value Solid growth amid a changing regulatory landscape 11

To start a new section, hold down the apple+shift keys and click
to release this object and type the section title in the box below.
Limitations of Price/EV as a metricIn reality, comparisons of this type are distorted by many factors. Three general issues to bear in mind when comparing companies are:
The presence of general insurance or asset management businesses within the groupThe value of general insurance and asset management businesses is typically brought into group embedded value at net asset value. You would therefore expect groups with significant general insurance or asset management businesses to trade at a higher price relative to embedded value than those without, to reflect the contribution of these businesses to future profits and dividends over and above the net asset value.
Allowing for the value of new businessEmbedded value does not allow for goodwill whereas the market price does. The Price/EV ratio for a growth business would therefore be expected, all else being equal, to be higher than for a closed block consolidator.
The approach taken to calculating the embedded valueThe differences in approach to embedded value calculations between companies have long troubled analysts following the industry. Even under the less subjective MCEV approach, the flexibility allowed in the calculation of the discount rate, through the choice of illiquidity premium, the choice of extrapolation methodology, and the credit risk adjustments to swap curves, means that consideration of the valuation basis used is important for a fair comparison.
12
EEV vs MCEVWe note that Aviva does not appear to have published its own measure of embedded value, ‘EEV equivalent embedded value’ as part of their latest year-end results announcement. Aviva had previously deemed this to be more comparable to other UK insurers who publish EEV rather than MCEV.
AssumptionsWe note that companies generally do not explicitly define their chosen risk-free rate curves. For example, the definition of the Eurozone curve is unclear, and could be based on a single economy (e.g. Germany) or an average of various economies. This would give rise to unexplained variances between different companies’ results.
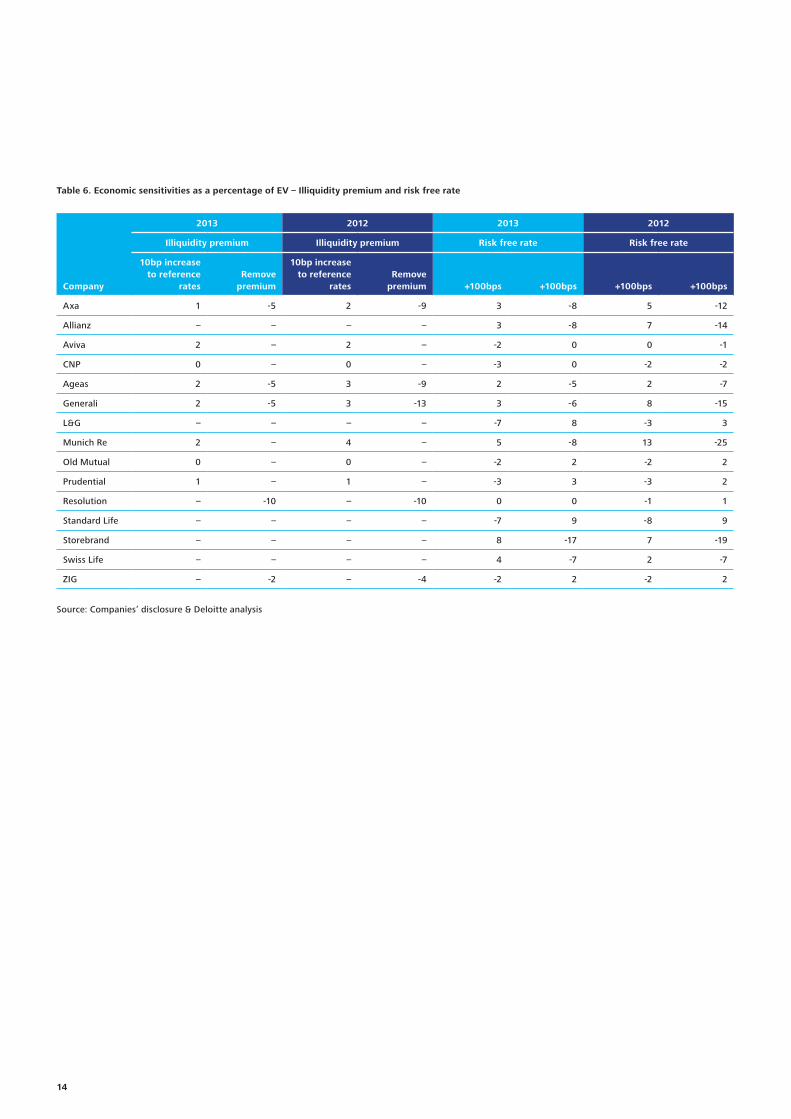
SensitivitiesDisclosure of sensitivities is one of the embedded value reporting principles. Sensitivity information is a valuable tool for enhancing the market’s understanding of insurers’ results. We continue to monitor the potential impact of market movements on the insurers’ embedded values using the economic sensitivities disclosed by the companies in our survey.
Notable changes in the sensitivities disclosed this year include a significant reduction in the sensitivity to a 100bps decrease in reference rates (for example, for Generali and Axa). In addition to higher reference rates this year, this could be due to the fact that these companies are actively shifting their business from savings business (which is adversely affected by low interest rates) to protection and unit-linked business, decreasing the level of guarantees offered.
Similar to last year, given lower illiquidity premium levels in 2013 compared to those seen in 2012, we would expect the sensitivities to changes in illiquidity premium assumption to reduce. This is demonstrated by the figures shown in Table 6. In particular, the impact of completely removing the illiquidity adjustment is, not surprisingly, significantly reduced.
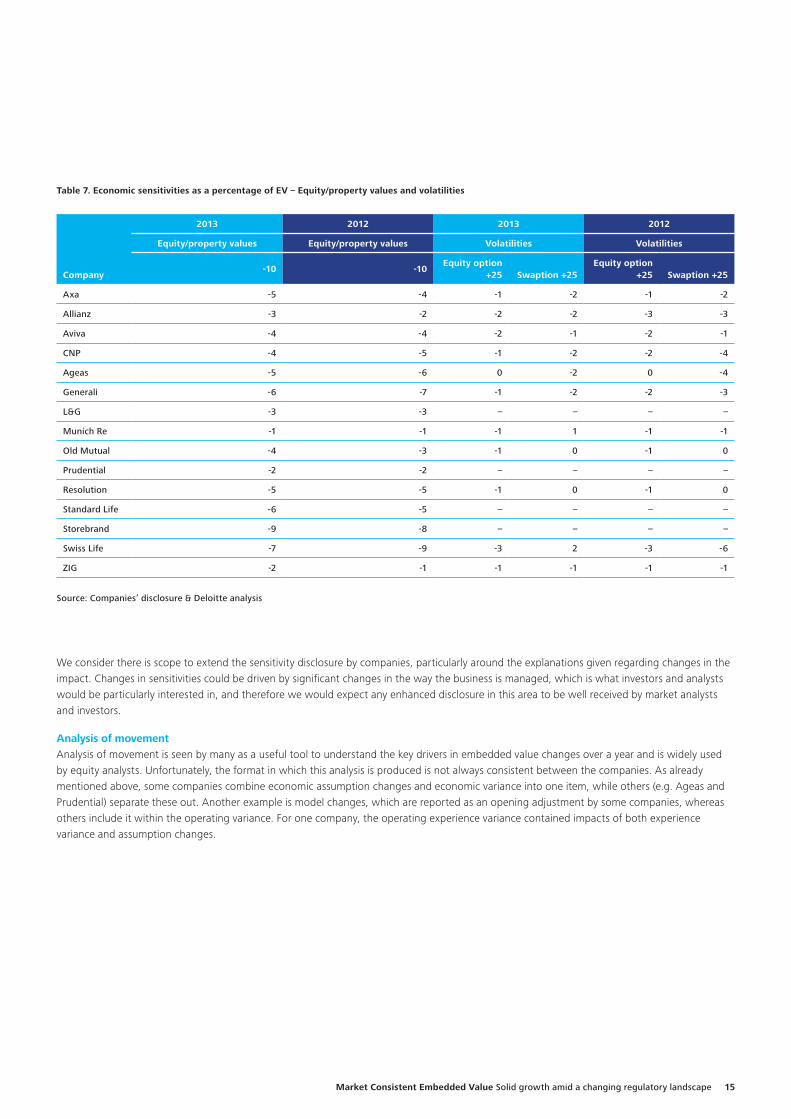
Perhaps it is also worth noting an unusual change in Munich Re’s and Swiss Life’s sensitivities to a 25 per cent increase in swaptions volatility from -1 per cent at end 2012 to +1 per cent for Munich Re and from -6 per cent at end 2012 to +2 per cent at end 2013 for Swiss Life. The positive direction of this sensitivity is not what we would usually expect to see. Swiss Life’s disclosure explained this by operating improvements in Swiss group life business. No explanation was provided in Munich Re’s report.
Disclosure
Sensitivity information is a valuable tool for enhancing the market’s understanding of insurers’ results.
Market Consistent Embedded Value Solid growth amid a changing regulatory landscape 13
To start a new section, hold down the apple+shift keys and click
to release this object and type the section title in the box below.
Company
2013 2012 2013 2012
Illiquidity premium Illiquidity premium Risk free rate Risk free rate
10bp increase to reference
rates
Remove
premium
10bp increase to reference
rates
Remove
premium +100bps +100bps +100bps +100bps
Axa 1 -5 2 -9 3 -8 5 -12
Allianz – – – – 3 -8 7 -14
Aviva 2 – 2 – -2 0 0 -1
CNP 0 – 0 – -3 0 -2 -2
Ageas 2 -5 3 -9 2 -5 2 -7
Generali 2 -5 3 -13 3 -6 8 -15
L&G – – – – -7 8 -3 3
Munich Re 2 – 4 – 5 -8 13 -25
Old Mutual 0 – 0 – -2 2 -2 2
Prudential 1 – 1 – -3 3 -3 2
Resolution – -10 – -10 0 0 -1 1
Standard Life – – – – -7 9 -8 9
Storebrand – – – – 8 -17 7 -19
Swiss Life – – – – 4 -7 2 -7
ZIG – -2 – -4 -2 2 -2 2
Source: Companies’ disclosure & Deloitte analysis
Table 6. Economic sensitivities as a percentage of EV – Illiquidity premium and risk free rate
14
To start a new section, hold down the apple+shift keys and click
to release this object and type the section title in the box below.
Table 7. Economic sensitivities as a percentage of EV – Equity/property values and volatilities
Company
2013 2012 2013 2012
Equity/property values Equity/property values Volatilities Volatilities
-10 -10Equity option
+25 Swaption +25Equity option
+25 Swaption +25
Axa -5 -4 -1 -2 -1 -2
Allianz -3 -2 -2 -2 -3 -3
Aviva -4 -4 -2 -1 -2 -1
CNP -4 -5 -1 -2 -2 -4
Ageas -5 -6 0 -2 0 -4
Generali -6 -7 -1 -2 -2 -3
L&G -3 -3 – – – –
Munich Re -1 -1 -1 1 -1 -1
Old Mutual -4 -3 -1 0 -1 0
Prudential -2 -2 – – – –
Resolution -5 -5 -1 0 -1 0
Standard Life -6 -5 – – – –
Storebrand -9 -8 – – – –
Swiss Life -7 -9 -3 2 -3 -6
ZIG -2 -1 -1 -1 -1 -1
Source: Companies’ disclosure & Deloitte analysis
We consider there is scope to extend the sensitivity disclosure by companies, particularly around the explanations given regarding changes in the impact. Changes in sensitivities could be driven by significant changes in the way the business is managed, which is what investors and analysts would be particularly interested in, and therefore we would expect any enhanced disclosure in this area to be well received by market analysts and investors.
Analysis of movementAnalysis of movement is seen by many as a useful tool to understand the key drivers in embedded value changes over a year and is widely used by equity analysts. Unfortunately, the format in which this analysis is produced is not always consistent between the companies. As already mentioned above, some companies combine economic assumption changes and economic variance into one item, while others (e.g. Ageas and Prudential) separate these out. Another example is model changes, which are reported as an opening adjustment by some companies, whereas others include it within the operating variance. For one company, the operating experience variance contained impacts of both experience variance and assumption changes.
Market Consistent Embedded Value Solid growth amid a changing regulatory landscape 15
To start a new section, hold down the apple+shift keys and click
to release this object and type the section title in the box below.
Methodology and assumptions
In April 2011, the CFO Forum withdrew its intention that MCEV should be the only recognised format of embedded value reporting from 31 December 2011. This decision was driven by the on-going development of insurance reporting under Solvency II and IFRS. Despite the improved certainty around the timing and form of Solvency II, there has been no further guidance issued by the CFO Forum on the future form of embedded value reporting. Given this, it is perhaps unsurprising that we have not observed any further significant moves towards adoption of MCEV within the industry (Generali has formally reported on an MCEV basis for the first time, but this is primarily presentational as their previous methodology was heavily aligned with MCEV). There is an opportunity for convergence over time between embedded value and elements of the Solvency II and IFRS methodologies (once finalised) to help smooth the impact when the new regulations are adopted.
We continue to believe that the provision of supplementary information, including embedded value, adds value to those seeking to understand the performance of insurers. We note, however, that the introduction of Solvency II will have a significant impact on insurers’ embedded values. It will be important for insurers to provide additional information that complements, rather than duplicates, the disclosures under Solvency II.
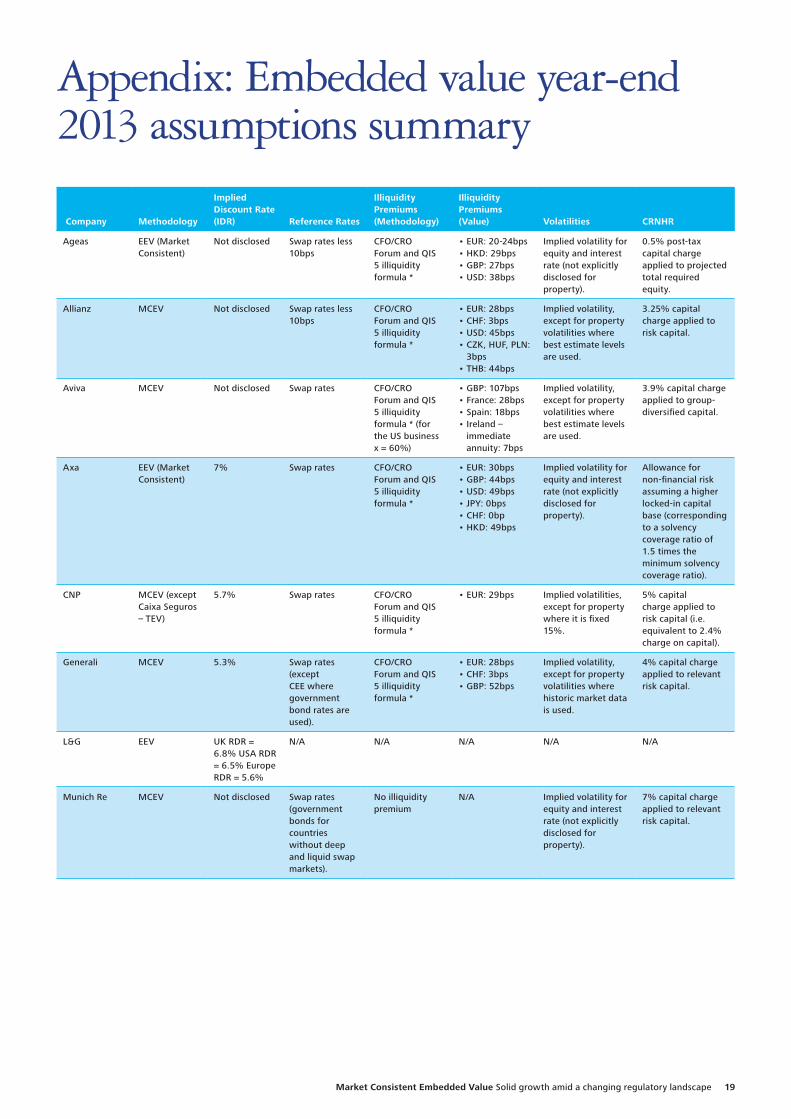
The tables in the Appendix show a summary of the main assumptions used by our sample companies. We comment only on the key ones in this section.
In previous years, we have commented upon the trend towards convergence between the key assumptions used in the embedded value calculations and the emerging Solvency II regulations – particularly in relation to the reference rate used (i.e. the choice of ‘risk-free’ yield curve, illiquidity premium and extrapolation methodology). We have not seen significant further convergence this year towards the emerging Solvency II assumptions, despite the release of the Long-Term Guarantee Assessment package of proposals (where the allowance for credit risk in the swap curve was 35bps, as opposed to a fixed 10bps under QIS5) and the additional detail on the calculation principles underlying the volatility adjustment and matching adjustment. We recognise that there have been a number of iterations of the Solvency II draft regulations and that it could have introduced undesired volatility into insurers’ embedded value results, had they adopted the draft regulations as they emerged. With increased certainty around Solvency II, we expect insurers will begin aligning elements of their key embedded value assumptions to the Solvency II regulations over the course of 2014.
Three quarters of the companies in our sample used the swap curve as a basis for the reference rate. Other methodologies included applying territory-specific risk discount rates, derived using a risk-free rate plus a risk margin, and calculating the liquid interest rate curve for durations of less than 10 years and a long-term assumption for the longer durations.
We also note that no companies in our sample changed the allowance for credit risk within the swap curve, with only two companies currently reducing the reference rate to reflect this risk. Emerging Solvency II regulation suggests that the allowance for credit risk is expected to vary between 10bps and 35bps (based on the difference between the swap curve and overnight indexed swap yields) and our expectation is that companies may begin to reflect this in their embedded value methodology.
Illiquidity premiumOver the year, the allowance for illiquidity premium for business written in EUR has reduced by an average of 60 per cent in contrast to what we observed last year, when we saw an increase of more than 150 per cent. The change was driven by narrowing spreads over the year. The table in the appendix summarises the illiquidity premium approach for those companies in our sample writing business in EUR that were affected by this. It is worth noting that some of the companies in our sample apply a Eurozone country-specific adjustment rather than a single Euro-specific adjustment.
We continue to believe that the provision of supplementary information, including embedded value, adds value to those seeking to understand the performance of insurers.
16
To start a new section, hold down the apple+shift keys and click
to release this object and type the section title in the box below.
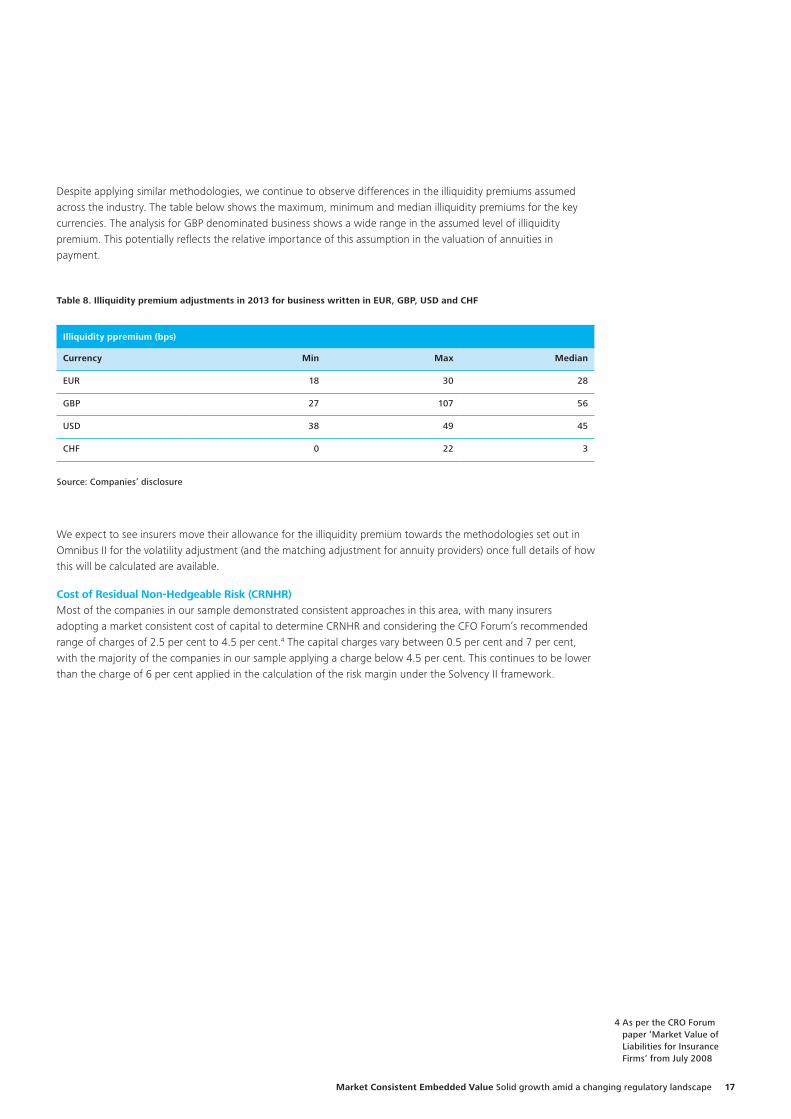
Despite applying similar methodologies, we continue to observe differences in the illiquidity premiums assumed across the industry. The table below shows the maximum, minimum and median illiquidity premiums for the key currencies. The analysis for GBP denominated business shows a wide range in the assumed level of illiquidity premium. This potentially reflects the relative importance of this assumption in the valuation of annuities in payment.
Table 8. Illiquidity premium adjustments in 2013 for business written in EUR, GBP, USD and CHF
Illiquidity ppremium (bps)
Currency Min Max Median
EUR 18 30 28
GBP 27 107 56
USD 38 49 45
CHF 0 22 3
Source: Companies’ disclosure
We expect to see insurers move their allowance for the illiquidity premium towards the methodologies set out in Omnibus II for the volatility adjustment (and the matching adjustment for annuity providers) once full details of how this will be calculated are available.
Cost of Residual Non-Hedgeable Risk (CRNHR)Most of the companies in our sample demonstrated consistent approaches in this area, with many insurers adopting a market consistent cost of capital to determine CRNHR and considering the CFO Forum’s recommended range of charges of 2.5 per cent to 4.5 per cent.4 The capital charges vary between 0.5 per cent and 7 per cent, with the majority of the companies in our sample applying a charge below 4.5 per cent. This continues to be lower than the charge of 6 per cent applied in the calculation of the risk margin under the Solvency II framework.
4 As per the CRO Forum paper ‘Market Value of Liabilities for Insurance Firms‘ from July 2008
Market Consistent Embedded Value Solid growth amid a changing regulatory landscape 17

To start a new section, hold down the apple+shift keys and click
to release this object and type the section title in the box below.
Life insurance companies’ embedded values continue to be very sensitive to market performance. Narrower sovereign debt spreads, improved equity markets and lower volatilities lead to improved returns on embedded values and lower economic variances.
Regulatory change continued to play a significant role in the value of new business over the year and, if recent events in the UK over Q1 2014 are anything to go by, this is not likely to change any time soon. Whilst the Budget announcement creates a lot of uncertainty for annuity providers, it also creates opportunities for those companies able to offer attractive solutions to their customers in the accumulation and decumulation phases of their lives.
We have not seen any significant changes in the quality or quantity of embedded value reporting, nor material convergence with Solvency II methodologies or assumptions. With Solvency II go-live now confirmed for 1 January 2016 we expect to see much more active convergence at the 2014 year-end. There is an opportunity now for companies to take stock and consider what the future state reporting should look like in order to provide investors and analysts with the information they really need.
If you would like to discuss any of the issues raised in this paper please speak to your usual Deloitte contacts, or one of the people listed in the contacts section at the back of this report.
Conclusion
There is an opportunity now for companies to take stock and consider what the future state reporting should look like in order to provide investors and analysts with the information they really need.
18
To start a new section, hold down the apple+shift keys and click
to release this object and type the section title in the box below.
Appendix: Embedded value year-end 2013 assumptions summary
Company Methodology
Implied Discount Rate (IDR) Reference Rates
Illiquidity Premiums (Methodology)
Illiquidity Premiums (Value) Volatilities CRNHR
Ageas EEV (Market Consistent)
Not disclosed Swap rates less 10bps
CFO/CRO Forum and QIS 5 illiquidity formula *
• EUR: 20-24bps • HKD: 29bps • GBP: 27bps • USD: 38bps
Implied volatility for equity and interest rate (not explicitly disclosed for property).
0.5% post-tax capital charge applied to projected total required equity.
Allianz MCEV Not disclosed Swap rates less 10bps
CFO/CRO Forum and QIS 5 illiquidity formula *
• EUR: 28bps • CHF: 3bps • USD: 45bps • CZK, HUF, PLN:
3bps • THB: 44bps
Implied volatility, except for property volatilities where best estimate levels are used.
3.25% capital charge applied to risk capital.
Aviva MCEV Not disclosed Swap rates CFO/CRO Forum and QIS 5 illiquidity formula * (for the US business x = 60%)
• GBP: 107bps • France: 28bps • Spain: 18bps • Ireland –
immediate annuity: 7bps
Implied volatility, except for property volatilities where best estimate levels are used.
3.9% capital charge applied to group-diversified capital.
Axa EEV (Market Consistent)
7% Swap rates CFO/CRO Forum and QIS 5 illiquidity formula *
• EUR: 30bps • GBP: 44bps • USD: 49bps • JPY: 0bps • CHF: 0bp • HKD: 49bps
Implied volatility for equity and interest rate (not explicitly disclosed for property).
Allowance for non-financial risk assuming a higher locked-in capital base (corresponding to a solvency coverage ratio of 1.5 times the minimum solvency coverage ratio).
CNP MCEV (except Caixa Seguros – TEV)
5.7% Swap rates CFO/CRO Forum and QIS 5 illiquidity formula *
• EUR: 29bps Implied volatilities, except for property where it is fixed 15%.
5% capital charge applied to risk capital (i.e. equivalent to 2.4% charge on capital).
Generali MCEV 5.3% Swap rates (except CEE where government bond rates are used).
CFO/CRO Forum and QIS 5 illiquidity formula *
• EUR: 28bps • CHF: 3bps • GBP: 52bps
Implied volatility, except for property volatilities where historic market data is used.
4% capital charge applied to relevant risk capital.
L&G EEV UK RDR = 6.8% USA RDR = 6.5% Europe RDR = 5.6%
N/A N/A N/A N/A N/A
Munich Re MCEV Not disclosed Swap rates (government bonds for countries without deep and liquid swap markets).
No illiquidity premium
N/A Implied volatility for equity and interest rate (not explicitly disclosed for property).
7% capital charge applied to relevant risk capital.
Market Consistent Embedded Value Solid growth amid a changing regulatory landscape 19

To start a new section, hold down the apple+shift keys and click
to release this object and type the section title in the box below.
Company Methodology
Implied Discount Rate (IDR) Reference Rates
Illiquidity Premiums (Methodology)
Illiquidity Premiums (Value) Volatilities CRNHR
Old Mutual MCEV Not disclosed Swap rates • South African Immediate Annuity business and Fixed Bond business: Illiquidity premium adjustments reflect the illiquidity premium component in non-government bond spreads over swap rates.
• All other business: No adjustments are made to swap yields to allow for illiquidity premiums or credit risk premiums.
50bps of illiquidity premium for South African Immediate Annuity business and 40bps for South African Fixed Bond business.
Implied volatility for deep and liquid market. Historic data and expert judgment elsewhere.
2.4% capital charge applied to Group diversified capital.
Prudential EEV N/A Weighted In-force RDR: • 7.2% (Asia), • 6.9%
(Jackson), • 8.3% (UK)
Top down UK annuity: 71bps
Combination of actual market data, historic market data and an assessment of longer-term economic conditions.
Allowed as a margin in the discount rate. Defined as: • 100 bps for UK
annuity business. • 50 bps for Group’s
other business. • additional 100
to 250 bps for Group’s Asian operations.
Resolution MCEV Not disclosed Swap rates Two approaches used: • A component
of the difference between the spread on corporate bonds and a credit default swap; and
• Use of option pricing techniques to decompose the spread into its components including illiquidity premium.
UK annuity (in force): 60bps
UK annuity (new business): 65-86bps
Implied volatility, except for property volatilities where initial volatility of 15%.
Capital charge of 1.2% on projected Group required capital.
20

To start a new section, hold down the apple+shift keys and click
to release this object and type the section title in the box below.
Company Methodology
Implied Discount Rate (IDR) Reference Rates
Illiquidity Premiums (Methodology)
Illiquidity Premiums (Value) Volatilities CRNHR
Standard Life EEV N/A RDR = risk free government bond yield + a risk margin: • 7.11% (UK
Heritage WPF) • 5.41% (UK
other) • 6.56%
(Canada) • 4.74% (Europe
Heritage WPF) • 3.44% (Europe
other) • 4.82% (Hong
Kong)• 5.21%
(Standard Life International Limited)
N/A N/A Implied volatility, except for property volatilities where historic market data is used.
Allowed as a margin in the discount rate. Breakdown per business not available since margin not divided into market and non-market risk as in previous years.
Storebrand MCEV 11.1% • Market interest rates are applied to the liquid part of the interest rate curve up to 10 years.
• A long-term equilibrium level is applied from 20 years and onwards.
• Linear interpolation is used between 10 years and 20 years.
No allowance No allowance Implied volatility, except for property volatilities where historic market data is used.
5% capital charge applied to risk capital (i.e. equivalent to 2.4% charge on capital).
Swiss Life MCEV Not disclosed Swap rates CFO/CRO Forum and QIS 5 illiquidity formula *, with different bucketing:• 0% for PPLI,
unit-linked and variable annuities business.
• 50% for health insurance and assumed external reinsurance.
• 75% for all participating and other business, including traditional annuities.
100% illiquidity premium:• EUR: 29bps• USD: 47bps• CHF: 22bps
Implied volatility, except for property volatilities where historic market data is used.
4% capital charge applied to capital at risk.
Market Consistent Embedded Value Solid growth amid a changing regulatory landscape 21

To start a new section, hold down the apple+shift keys and click
to release this object and type the section title in the box below.
Company Methodology
Implied Discount Rate (IDR) Reference Rates
Illiquidity Premiums (Methodology)
Illiquidity Premiums (Value) Volatilities CRNHR
ZIG MCEV Not disclosed Swap rates CFO/CRO Forum and QIS 5 illiquidity formula *
• EUR: 22bps• GBP: 44bps• USD: 45bps• CHF: 3bps
Implied volatility, except for property volatilities where historic market data is used.
4% capital charge applied to diversified non-hedgeable risk based.
* CFO/CRO Forum and QIS 5 illiquidity formula:Illiquidity premium = max (0, X * (spread – Y)), where X=50% and Y=40bps.Different proportions of the illiquidity premium adjustment (for example, 100%, 75%, 50% and 0%) are applied to different liability buckets, which are defined by the nature of liabilities and how liquid these are.
22

To start a new section, hold down the apple+shift keys and click
to release this object and type the section title in the box below.
Contacts
UKRichard Baddon+44 (0) 20 7303 [email protected]
David Hare+44 (0) 131 535 [email protected]
Roger Simler+44 (0) 20 7303 [email protected]
Andrew Smith+44 (0) 20 7303 [email protected]
AustraliaCaroline Bennet+61 (03) 9671 [email protected]
AustriaDaniel Thompson+43 15 3700 [email protected]
BelgiumChristophe Vandeweghe+32 2 800 [email protected]
Arno De Groote+32 2 800 [email protected]
Central EuropeKrzysztof Stroinski+48 22 [email protected]
CanadaDerek Wright+1 416 874 [email protected]
DenmarkThomas Ringsted+45 [email protected]
FranceClaude Chassain+33 1 40 88 24 [email protected]
GermanyBharat Bhayani+49 [email protected]
IrelandCiara Regan+353 1407 [email protected]
ItalyAlessandro Ghilarducci+39 028 332 [email protected]
NetherlandsFabian Kratz+31 882 883 [email protected]
SpainJosé Gabriel Puche+34 914 43 [email protected]
SwitzerlandStefan Rechtsteiner+41 (0) 58 279 67 [email protected]
USJason Morton+1 612 397 [email protected]
South AfricaCarl van der [email protected]
Hong KongSimon Walpole+852 2238 [email protected]
Market Consistent Embedded Value Solid growth amid a changing regulatory landscape 23

To start a new section, hold down the apple+shift keys and click
to release this object and type the section title in the box below.
Notes
24


Deloitte refers to one or more of Deloitte Touche Tohmatsu Limited (“DTTL”), a UK private company limited by guarantee, and its network of member firms, each of which is a legally separate and independent entity. Please see www.deloitte.co.uk/about for a detailed description of the legal structure of DTTL and its member firms.
Deloitte LLP is the United Kingdom member firm of DTTL.
This publication has been written in general terms and therefore cannot be relied on to cover specific situations; application of the principles set out will depend upon the particular circumstances involved and we recommend that you obtain professional advice before acting or refraining from acting on any of the contents of this publication. Deloitte LLP would be pleased to advise readers on how to apply the principles set out in this publication to their specific circumstances. Deloitte LLP accepts no duty of care or liability for any loss occasioned to any person acting or refraining from action as a result of any material in this publication.
© 2014 Deloitte LLP. All rights reserved.
Deloitte LLP is a limited liability partnership registered in England and Wales with registered number OC303675 and its registered office at 2 New Street Square, London EC4A 3BZ, United Kingdom. Tel: +44 (0) 20 7936 3000 Fax: +44 (0) 20 7583 1198.
Designed and produced by The Creative Studio at Deloitte, London. 35222A