Embed Size (px)
Citation preview
www.angelbroking.com
Market Outlook October 27, 2017
www.angelbroking.com
Market Cues
Indian markets are likely to open flat tracking global indices and SGX Nifty.
The U.S. Index opened positive and traded in narrow range, the major averages eventually ended Thursday's trading on the unchanged line. The House of Representatives also passed a budget blueprint, paving the way for the Senate to eventually pass a tax-reform package by a simple majority. The Dow Jones Industrial Average DJIA, rose 0.3%, to close at 23,401. The S&P 500 SPX, gained 0.1%, at 2,560, while the Nasdaq Composite Index COMP, edged down 0.1%, at 6,557. NASDAQ primarily weighed down by the biotechnology sector, which corrected 2.32% on Thursday.
U.K. stocks closed higher on Thursday, tracking a positive mood across Europe after the European Central Bank extended its bond-buying program and hinted rates will stay low at least until 2019. The FTSE 100 index rose 0.5% to end at 7,487.
The India share opened on negative note but rose in the last leg of the trade to end the day at fresh highs at October expiry with Nifty50 surpassing 10,350-mark. Traders are waiting for big event today such as ECB Outcome, ICICI Bank, ITC & Maruti Suzuki Q2 Earnings. At the closing bell, BSE Sensex settled at new high of 33,147, up 0.32% for the day. While, Nifty50 closed up by0.47% to finish at 10,344.
News Analysis
YES Bank under-reported `6k-cr NPAs in FY17, Q2 PAT up 25%
Detailed analysis on Pg2
Investor’s Ready Reckoner
Key Domestic & Global Indicators
Stock Watch: Latest investment recommendations on 150+ stocks
Refer Pg5 onwards
Top Picks Company Sector Rating CMP
(`) Target
(`) Upside
(%)
Blue Star Capital Goods Accumulate 796 867 9.0
Dewan Housing Finance Financials Accumulate 603 670 11.0
Asian Granito Other Buy 484 570 17.7
Navkar Corporation Other Buy 194 265 36.5
KEI Industries Capital Goods Buy 326 380 16.5 More Top Picks on Pg4
Key Upcoming Events Date Region Event Description
Previous Reading
Consensus Expectations
Oct 27 Euro Zone Euro-Zone Consumer Confidence (1.00)
Oct 30 US GDP Qoq (Annualised) 3.10 2.60
Oct 31 China PMI Manufacturing 52.40 52.20
Oct 31 UK PMI Manufacturing 55.90 56.20
Oct 31 US Consumer Confidence 119.80 120.75 More Events on Pg7
Domestic Indices Chg (%) (Pts) (Close)
BSE Sensex 0.3 105 33,147
Nifty 0.5 48 10,344
Mid Cap 0.5 85 16,334
Small Cap 0.6 97 17,257
Bankex 0.0 1 28,330
Global Indices Chg (%) (Pts) (Close)
Dow Jones 0.3 71 23,401
Nasdaq (0.1) (7) 6,557
FTSE 0.5 39 7,487
Nikkei 0.9 206 21,946
Hang Seng 0.9 267 28,469
Shanghai Com 0.2 6 3,413
Advances / Declines BSE NSE
Advances 1,374 922
Declines 1,343 801
Unchanged 151 60
Volumes (` Cr)
BSE 5,131
NSE 52,022
Net Inflows (` Cr) Net Mtd Ytd
FII 6,812 349 36,879
MFs 691 8,851 95,195
Top Gainers Price (`) Chg (%)
Polaris 291 20.0
Sail 77 14.4
Dbl 906 12.2
Ifci 26 8.4
Adanipower 33 7.8
Top Losers Price (`) Chg (%)
Jpassociat 18 (9.9)
Ucobank 34 (4.8)
Tatacomm 678 (4.8)
Mphasis 672 (4.3)
Coromandel 488 (4.3) As on October, 26 2017
www.angelbroking.com
Market Outlook October 27, 2017
www.angelbroking.com
News Analysis
YES Bank under-reported `6k-cr NPAs in FY17, Q2 PAT up 25%
Yes bank has reported stellar Q2 numbers, PAT saw jump of 25%, backed by growth in net interest income and fees. Its net interest income for Q2 rose by 33.5 per cent to `18,885cr. Other income, which includes fees and commissions rose by 35.4 per cent to `1,248cr. Total advances grew by 34.9 per cent to `1,48,675cr as of September 30, 2017.
The only concern was Asset quality, as per the RBI’s assessment GNPA are under reported to the tune of `4176cr and `6355cr for FY16 & FY17.
Economic and Political News Pension, insurance funds can finance infrastructure: Amitabh Kant
Government tightens screws on assets owned by deregistered companies
5 exclusive tourism zones under PPP mode on cards
Bank recap plan to help deal with bloated balance sheets: S&P
Corporate News
Bajaj Auto said it is unaffected by the Karnataka High Court ban.
Bad loans at Yes Bank double as regulator detects under-reporting
NDTV: Income tax department attaches the entire 29.12 % holding of promoter RRPR Holding
www.angelbroking.com
Market Outlook October 27, 2017
www.angelbroking.com
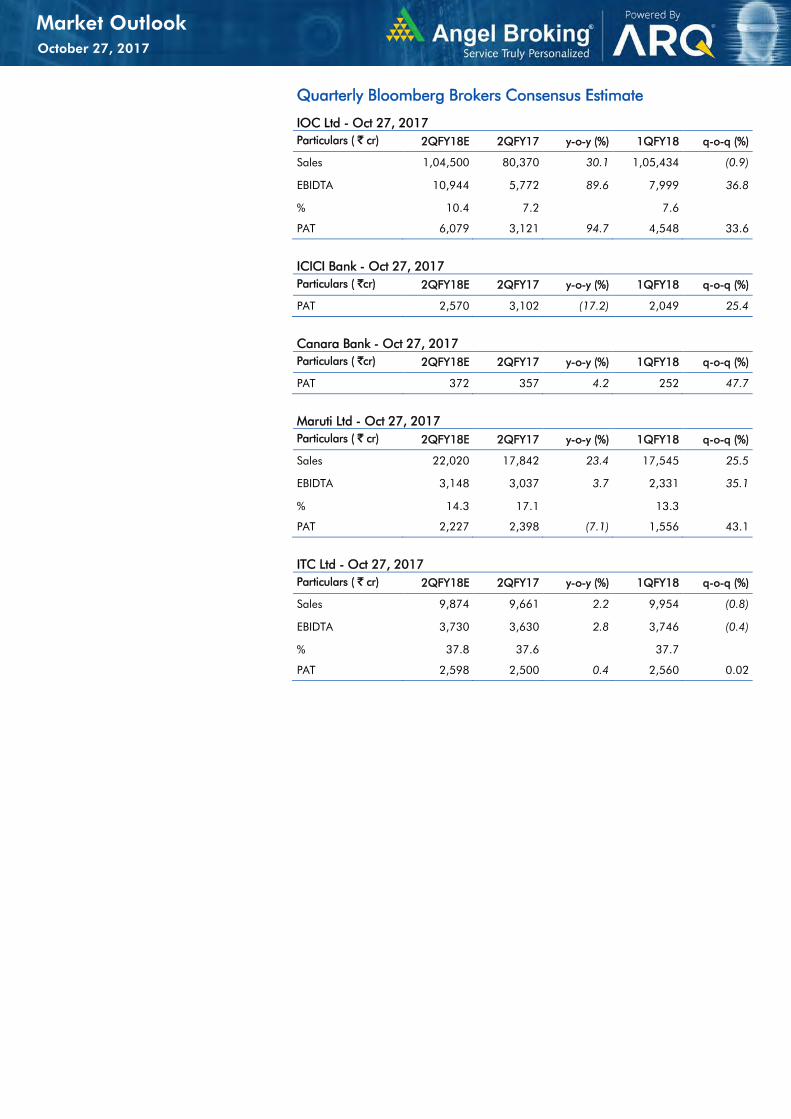
Quarterly Bloomberg Brokers Consensus Estimate
IOC Ltd - Oct 27, 2017 Particulars ( ` cr) 2QFY18E 2QFY17 y-o-y (%) 1QFY18 q-o-q (%)
Sales 1,04,500 80,370 30.1 1,05,434 (0.9)
EBIDTA 10,944 5,772 89.6 7,999 36.8
% 10.4 7.2 7.6
PAT 6,079 3,121 94.7 4,548 33.6
ICICI Bank - Oct 27, 2017 Particulars ( `cr) 2QFY18E 2QFY17 y-o-y (%) 1QFY18 q-o-q (%)
PAT 2,570 3,102 (17.2) 2,049 25.4
Canara Bank - Oct 27, 2017 Particulars ( `cr) 2QFY18E 2QFY17 y-o-y (%) 1QFY18 q-o-q (%)
PAT 372 357 4.2 252 47.7
Maruti Ltd - Oct 27, 2017 Particulars ( ` cr) 2QFY18E 2QFY17 y-o-y (%) 1QFY18 q-o-q (%)
Sales 22,020 17,842 23.4 17,545 25.5
EBIDTA 3,148 3,037 3.7 2,331 35.1
% 14.3 17.1 13.3
PAT 2,227 2,398 (7.1) 1,556 43.1
ITC Ltd - Oct 27, 2017 Particulars ( ` cr) 2QFY18E 2QFY17 y-o-y (%) 1QFY18 q-o-q (%)
Sales 9,874 9,661 2.2 9,954 (0.8)
EBIDTA 3,730 3,630 2.8 3,746 (0.4)
% 37.8 37.6 37.7
PAT 2,598 2,500 0.4 2,560 0.02
www.angelbroking.com
Market Outlook October 27, 2017
www.angelbroking.com
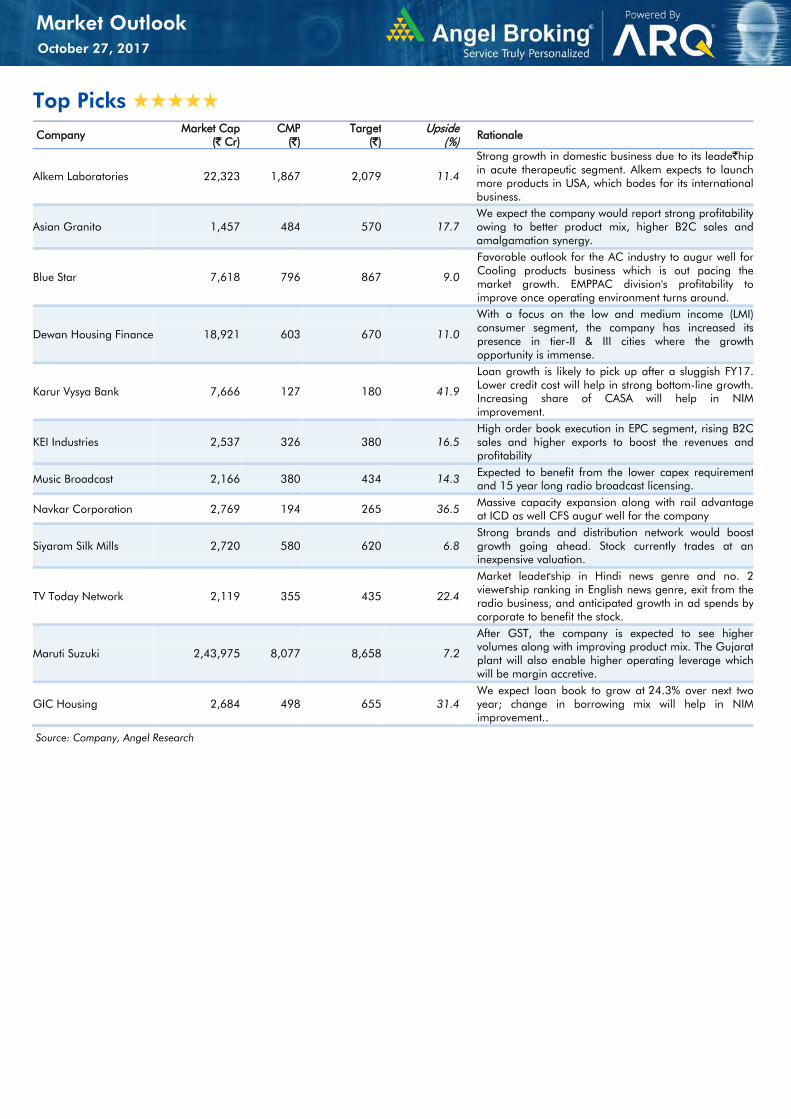
Top Picks ★★★★★ Company Market Cap
(` Cr) CMP
(`) Target
(`) Upside
(%) Rationale
Alkem Laboratories 22,323 1,867 2,079 11.4
Strong growth in domestic business due to its leade`hip in acute therapeutic segment. Alkem expects to launch more products in USA, which bodes for its international business.
Asian Granito 1,457 484 570 17.7 We expect the company would report strong profitability owing to better product mix, higher B2C sales and amalgamation synergy.
Blue Star 7,618 796 867 9.0
Favorable outlook for the AC industry to augur well for Cooling products business which is out pacing the market growth. EMPPAC division's profitability to improve once operating environment turns around.
Dewan Housing Finance 18,921 603 670 11.0
With a focus on the low and medium income (LMI) consumer segment, the company has increased its presence in tier-II & III cities where the growth opportunity is immense.
Karur Vysya Bank 7,666 127 180 41.9
Loan growth is likely to pick up after a sluggish FY17. Lower credit cost will help in strong bottom-line growth. Increasing share of CASA will help in NIM improvement.
KEI Industries 2,537 326 380 16.5 High order book execution in EPC segment, rising B2C sales and higher exports to boost the revenues and profitability
Music Broadcast 2,166 380 434 14.3 Expected to benefit from the lower capex requirement and 15 year long radio broadcast licensing.
Navkar Corporation 2,769 194 265 36.5 Massive capacity expansion along with rail advantage at ICD as well CFS augur well for the company
Siyaram Silk Mills 2,720 580 620 6.8 Strong brands and distribution network would boost growth going ahead. Stock currently trades at an inexpensive valuation.
TV Today Network 2,119 355 435 22.4
Market leadership in Hindi news genre and no. 2 viewership ranking in English news genre, exit from the radio business, and anticipated growth in ad spends by corporate to benefit the stock.
Maruti Suzuki 2,43,975 8,077 8,658 7.2
After GST, the company is expected to see higher volumes along with improving product mix. The Gujarat plant will also enable higher operating leverage which will be margin accretive.
GIC Housing
2,684 498 655 31.4 We expect loan book to grow at 24.3% over next two year; change in borrowing mix will help in NIM improvement..
Source: Company, Angel Research
2
www.angelbroking.com
Market Outlook
October 27, 2017
www.angelbr oki ng.com
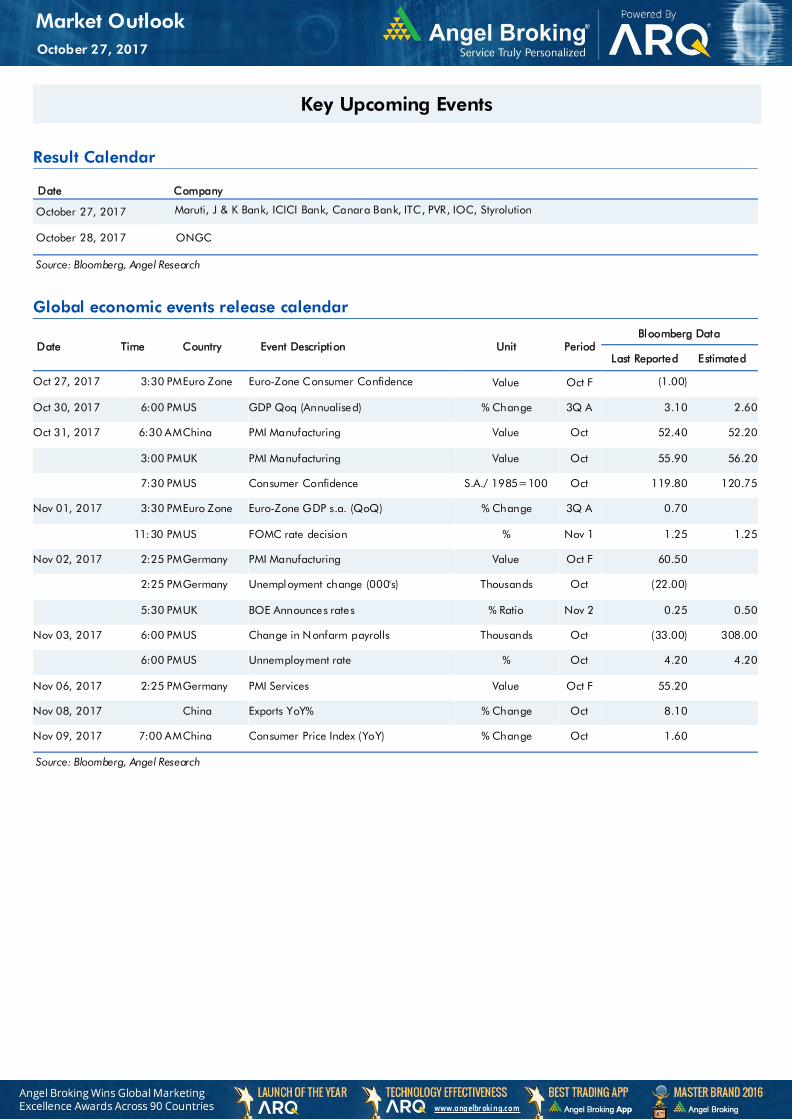
Key Upcoming Events
Result Calendar
Date Company
October 27, 2017 Maruti, J & K Bank, ICICI Bank, Canara Bank, ITC, PVR, IOC, Styrolution
October 28, 2017 ONGC
Source: Bloomberg, Angel Research
Global economic events release calendar
Date Time Country Event Description Unit Period
Bloomberg Data
Last Reported Estimated
Oct 27, 2017 3:30 PM Euro Zone Euro-Zone Consumer Confidence Value Oct F (1.00)
Oct 30, 2017 6:00 PM US GDP Qoq (Annualised) % Change 3Q A 3.10 2.60
Oct 31, 2017 6:30 AM China PMI Manufacturing Value Oct 52.40 52.20
3:00 PM UK PMI Manufacturing Value Oct 55.90 56.20
7:30 PM US Consumer Confidence S.A./ 1985=100 Oct 119.80 120.75
Nov 01, 2017 3:30 PM Euro Zone Euro-Zone GDP s.a. (QoQ) % Change 3Q A 0.70
11:30 PM US FOMC rate decision % Nov 1 1.25 1.25
Nov 02, 2017 2:25 PM Germany PMI Manufacturing Value Oct F 60.50
2:25 PM Germany Unemployment change (000's) Thousands Oct (22.00)
5:30 PM UK BOE Announces rates % Ratio Nov 2 0.25 0.50
Nov 03, 2017 6:00 PM US Change in Nonfarm payrolls Thousands Oct (33.00) 308.00
6:00 PM US Unnemployment rate % Oct 4.20 4.20
Nov 06, 2017 2:25 PM Germany PMI Services Value Oct F 55.20
Nov 08, 2017 China Exports YoY% % Change Oct 8.10
Nov 09, 2017 7:00 AM China Consumer Price Index (YoY) % Change Oct 1.60
Source: Bloomberg, Angel Research
3
www.angelbroking.com
Market Outlook
October 27, 2017
www.angelbr oki ng.com
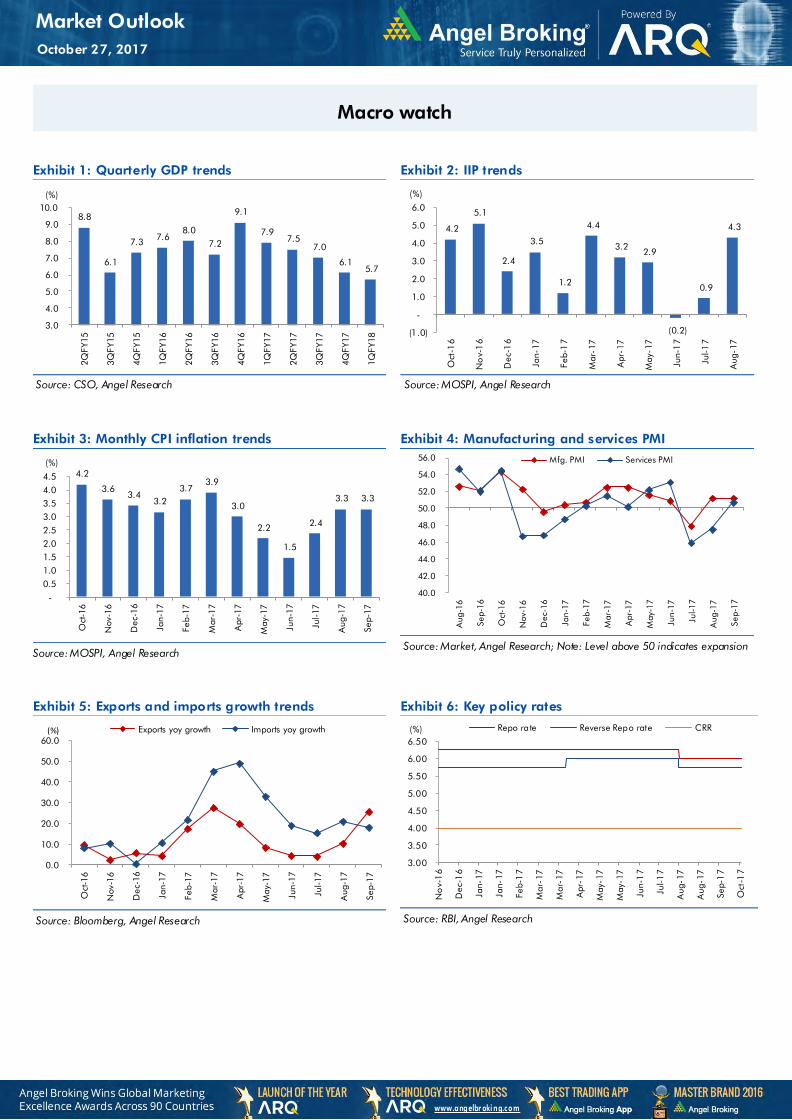
Macro watch
Exhibit 1: Quarterly GDP trends
Source: CSO, Angel Research
Exhibit 2: IIP trends
Source: MOSPI, Angel Research
Exhibit 3: Monthly CPI inflation trends
Source: MOSPI, Angel Research
Exhibit 4: Manufacturing and services PMI
Source: Market, Angel Research; Note: Level above 50 indicates expansion
Exhibit 5: Exports and imports growth trends
Source: Bloomberg, Angel Research
Exhibit 6: Key policy rates
Source: RBI, Angel Research
8.8
6.1
7.3 7.6
8.0
7.2
9.1
7.9
7.5
7.0
6.1
5.7
3.0
4.0
5.0
6.0
7.0
8.0
9.0
10.0
2Q
FY15
3Q
FY15
4Q
FY15
1Q
FY16
2Q
FY16
3Q
FY16
4Q
FY16
1Q
FY17
2Q
FY17
3Q
FY17
4Q
FY17
1Q
FY18
(%)
4.2
5.1
2.4
3.5
1.2
4.4
3.2 2.9
(0.2)
0.9
4.3
(1.0)
-
1.0
2.0
3.0
4.0
5.0
6.0
Oct-1
6
No
v-1
6
Dec-1
6
Jan-17
Feb-1
7
Mar-17
Apr-17
May-17
Jun-1
7
Jul-1
7
Aug-17
(%)
4.2
3.6
3.4
3.2
3.7
3.9
3.0
2.2
1.5
2.4
3.3 3.3
-
0.5
1.0
1.5
2.0
2.5
3.0
3.5
4.0
4.5
Oct-16
Nov-16
Dec-16
Jan-17
Feb-17
Mar-17
Apr-17
May-17
Jun-17
Jul-17
Aug-17
Sep-17
(%)
40.0
42.0
44.0
46.0
48.0
50.0
52.0
54.0
56.0 A
ug-16
Sep-16
Oct-16
Nov-16
Dec-16
Jan-17
Feb-17
Mar-17
Apr-17
May-17
Jun-17
Jul-17
Aug-17
Sep-17
Mfg. PMI Services PMI
0.0
10.0
20.0
30.0
40.0
50.0
60.0
Oct-16
Nov-16
Dec-16
Jan-17
Feb-17
Mar-17
Apr-17
May-17
Jun-17
Jul-17
Aug-17
Sep-17
Exports yoy growth Imports yoy growth(%)
3.00
3.50
4.00
4.50
5.00
5.50
6.00
6.50
No
v-1
6
Dec-1
6
Jan-17
Jan-17
Feb-1
7
Mar-17
Mar-17
Apr-17
May-17
May-17
Jun-1
7
Jul-1
7
Aug-17
Aug-17
Sep-1
7
Oct-1
7
Repo rate Reverse Repo rate CRR(%)

4
www.angelbroking.com
Market Outlook
October 27, 2017
www.angelbr oki ng.com
Global watch
Exhibit 1: Latest quarterly GDP Growth (%, yoy) across select developing and developed countries
Source: Bloomberg, Angel Research
Exhibit 2: 2017 GDP Growth projection by IMF (%, yoy) across select developing and developed countries
Source: IMF, Angel Research
Exhibit 3: One year forward P-E ratio across select developing and developed countries
Source: IMF, Angel Research
0.3
2.5
5.3
6.9
1.1
5.0
5.8
3.7
1.5
2.2
0.8
1.8
1.4
-
1.0
2.0
3.0
4.0
5.0
6.0
7.0
8.0
Bra
zil
Russia
Ind
ia
Ch
ina
South
Africa
Ind
onesia
Ma
laysia
Tha
ilan
d
UK
USA
Germ
any
France
Ja
pa
n
(%)
0.7
1.8
6.7 6.8
0.7
5.2 5.4
3.7
1.7
2.2 2.0
1.6 1.5
-
1.0
2.0
3.0
4.0
5.0
6.0
7.0
8.0
Brazil
Russia
India
China
South A
frica
Indonesia
Malaysia
Thailand
UK
USA
Germ
any
France
Japan
(%)
14
.0
5.4
19
.7
13
.5
16
.6
18
.1
16
.7
15
.9
14
.9
17
.8
13
.1
14
.7
15
.6
-
5.0
10.0
15.0
20.0
25.0
Brazil
Russia
India
China
South
Africa
Indonesia
Malaysia
Thailand
UK
USA
Germ
any
France
Japan
(x)
5
www.angelbroking.com
Market Outlook
October 27, 2017
www.angelbr oki ng.com
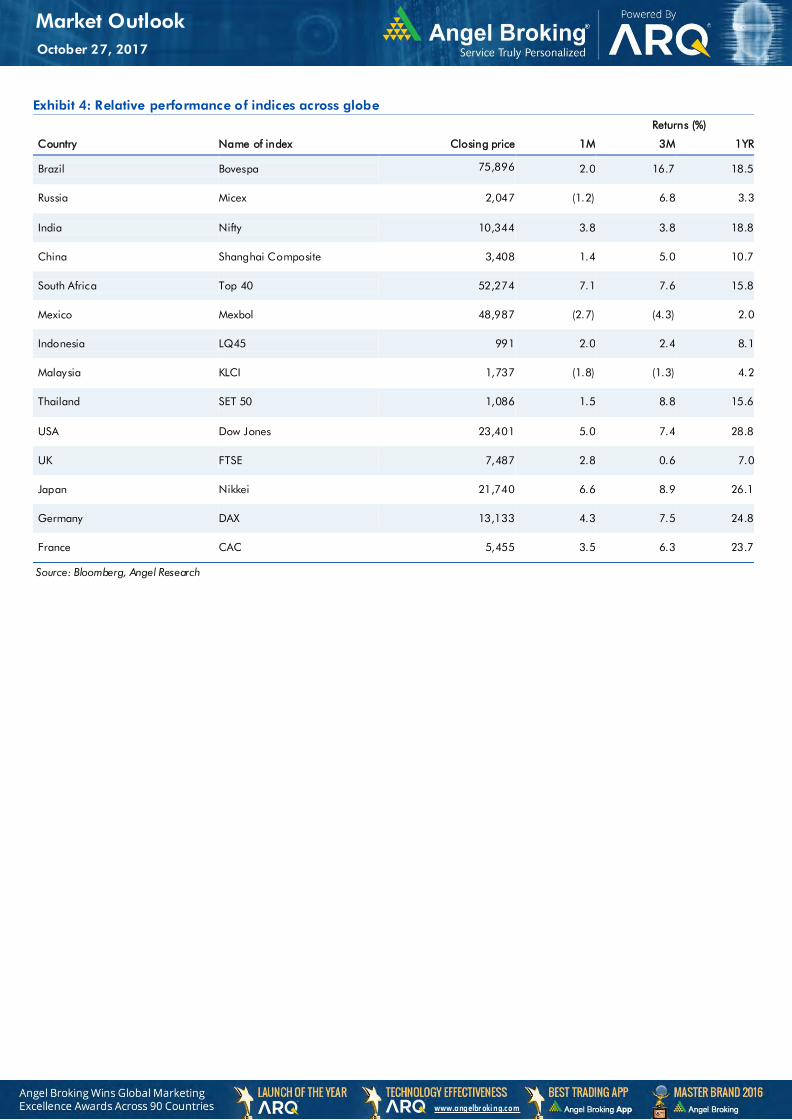
Exhibit 4: Relative performance of indices across globe
Returns (%)
Country Name of index Closing price 1M 3M 1YR
Brazil Bovespa 75,896 2.0 16.7 18.5
Russia Micex 2,047 (1.2) 6.8 3.3
India Nifty 10,344 3.8 3.8 18.8
China Shanghai Composite 3,408 1.4 5.0 10.7
South Africa Top 40 52,274 7.1 7.6 15.8
Mexico Mexbol 48,987 (2.7) (4.3) 2.0
Indonesia LQ45 991 2.0 2.4 8.1
Malaysia KLCI 1,737 (1.8) (1.3) 4.2
Thailand SET 50 1,086 1.5 8.8 15.6
USA Dow Jones 23,401 5.0 7.4 28.8
UK FTSE 7,487 2.8 0.6 7.0
Japan Nikkei 21,740 6.6 8.9 26.1
Germany DAX 13,133 4.3 7.5 24.8
France CAC 5,455 3.5 6.3 23.7
Source: Bloomberg, Angel Research p68in4
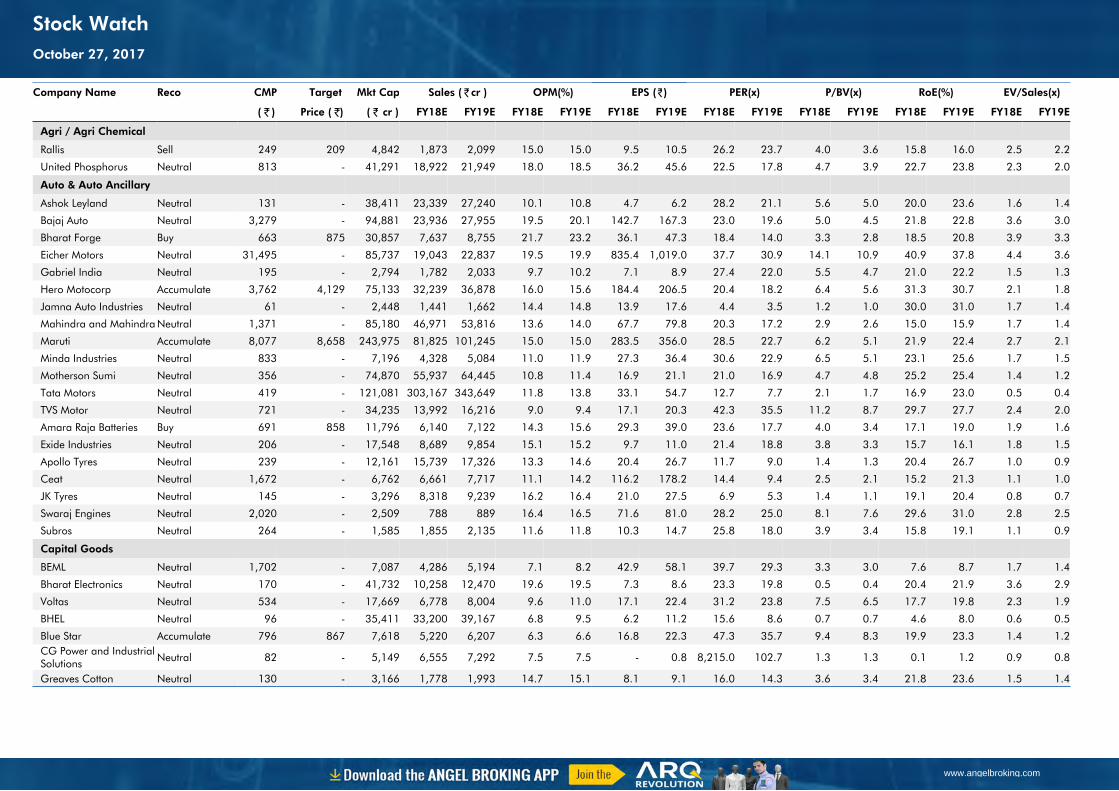
Company Name Reco CMP Target Mkt Cap Sales ( ₹cr ) OPM(%) EPS (₹) PER(x) P/BV(x) RoE(%) EV/Sales(x)
( ₹ ) Price ( ₹) ( ₹ cr ) FY18E FY19E FY18E FY19E FY18E FY19E FY18E FY19E FY18E FY19E FY18E FY19E FY18E FY19E
Agri / Agri Chemical
Rallis Sell 249 209 4,842 1,873 2,099 15.0 15.0 9.5 10.5 26.2 23.7 4.0 3.6 15.8 16.0 2.5 2.2
United Phosphorus Neutral 813 - 41,291 18,922 21,949 18.0 18.5 36.2 45.6 22.5 17.8 4.7 3.9 22.7 23.8 2.3 2.0
Auto & Auto Ancillary
Ashok Leyland Neutral 131 - 38,411 23,339 27,240 10.1 10.8 4.7 6.2 28.2 21.1 5.6 5.0 20.0 23.6 1.6 1.4
Bajaj Auto Neutral 3,279 - 94,881 23,936 27,955 19.5 20.1 142.7 167.3 23.0 19.6 5.0 4.5 21.8 22.8 3.6 3.0
Bharat Forge Buy 663 875 30,857 7,637 8,755 21.7 23.2 36.1 47.3 18.4 14.0 3.3 2.8 18.5 20.8 3.9 3.3
Eicher Motors Neutral 31,495 - 85,737 19,043 22,837 19.5 19.9 835.4 1,019.0 37.7 30.9 14.1 10.9 40.9 37.8 4.4 3.6
Gabriel India Neutral 195 - 2,794 1,782 2,033 9.7 10.2 7.1 8.9 27.4 22.0 5.5 4.7 21.0 22.2 1.5 1.3
Hero Motocorp Accumulate 3,762 4,129 75,133 32,239 36,878 16.0 15.6 184.4 206.5 20.4 18.2 6.4 5.6 31.3 30.7 2.1 1.8
Jamna Auto Industries Neutral 61 - 2,448 1,441 1,662 14.4 14.8 13.9 17.6 4.4 3.5 1.2 1.0 30.0 31.0 1.7 1.4
Mahindra and Mahindra Neutral 1,371 - 85,180 46,971 53,816 13.6 14.0 67.7 79.8 20.3 17.2 2.9 2.6 15.0 15.9 1.7 1.4
Maruti Accumulate 8,077 8,658 243,975 81,825 101,245 15.0 15.0 283.5 356.0 28.5 22.7 6.2 5.1 21.9 22.4 2.7 2.1
Minda Industries Neutral 833 - 7,196 4,328 5,084 11.0 11.9 27.3 36.4 30.6 22.9 6.5 5.1 23.1 25.6 1.7 1.5
Motherson Sumi Neutral 356 - 74,870 55,937 64,445 10.8 11.4 16.9 21.1 21.0 16.9 4.7 4.8 25.2 25.4 1.4 1.2
Tata Motors Neutral 419 - 121,081 303,167 343,649 11.8 13.8 33.1 54.7 12.7 7.7 2.1 1.7 16.9 23.0 0.5 0.4
TVS Motor Neutral 721 - 34,235 13,992 16,216 9.0 9.4 17.1 20.3 42.3 35.5 11.2 8.7 29.7 27.7 2.4 2.0
Amara Raja Batteries Buy 691 858 11,796 6,140 7,122 14.3 15.6 29.3 39.0 23.6 17.7 4.0 3.4 17.1 19.0 1.9 1.6
Exide Industries Neutral 206 - 17,548 8,689 9,854 15.1 15.2 9.7 11.0 21.4 18.8 3.8 3.3 15.7 16.1 1.8 1.5
Apollo Tyres Neutral 239 - 12,161 15,739 17,326 13.3 14.6 20.4 26.7 11.7 9.0 1.4 1.3 20.4 26.7 1.0 0.9
Ceat Neutral 1,672 - 6,762 6,661 7,717 11.1 14.2 116.2 178.2 14.4 9.4 2.5 2.1 15.2 21.3 1.1 1.0
JK Tyres Neutral 145 - 3,296 8,318 9,239 16.2 16.4 21.0 27.5 6.9 5.3 1.4 1.1 19.1 20.4 0.8 0.7
Swaraj Engines Neutral 2,020 - 2,509 788 889 16.4 16.5 71.6 81.0 28.2 25.0 8.1 7.6 29.6 31.0 2.8 2.5
Subros Neutral 264 - 1,585 1,855 2,135 11.6 11.8 10.3 14.7 25.8 18.0 3.9 3.4 15.8 19.1 1.1 0.9
Capital Goods
BEML Neutral 1,702 - 7,087 4,286 5,194 7.1 8.2 42.9 58.1 39.7 29.3 3.3 3.0 7.6 8.7 1.7 1.4
Bharat Electronics Neutral 170 - 41,732 10,258 12,470 19.6 19.5 7.3 8.6 23.3 19.8 0.5 0.4 20.4 21.9 3.6 2.9
Voltas Neutral 534 - 17,669 6,778 8,004 9.6 11.0 17.1 22.4 31.2 23.8 7.5 6.5 17.7 19.8 2.3 1.9
BHEL Neutral 96 - 35,411 33,200 39,167 6.8 9.5 6.2 11.2 15.6 8.6 0.7 0.7 4.6 8.0 0.6 0.5
Blue Star Accumulate 796 867 7,618 5,220 6,207 6.3 6.6 16.8 22.3 47.3 35.7 9.4 8.3 19.9 23.3 1.4 1.2CG Power and Industrial Solutions Neutral 82 - 5,149 6,555 7,292 7.5 7.5 - 0.8 8,215.0 102.7 1.3 1.3 0.1 1.2 0.9 0.8
Greaves Cotton Neutral 130 - 3,166 1,778 1,993 14.7 15.1 8.1 9.1 16.0 14.3 3.6 3.4 21.8 23.6 1.5 1.4
www.angelbroking.com
Stock WatchOctober 27, 2017
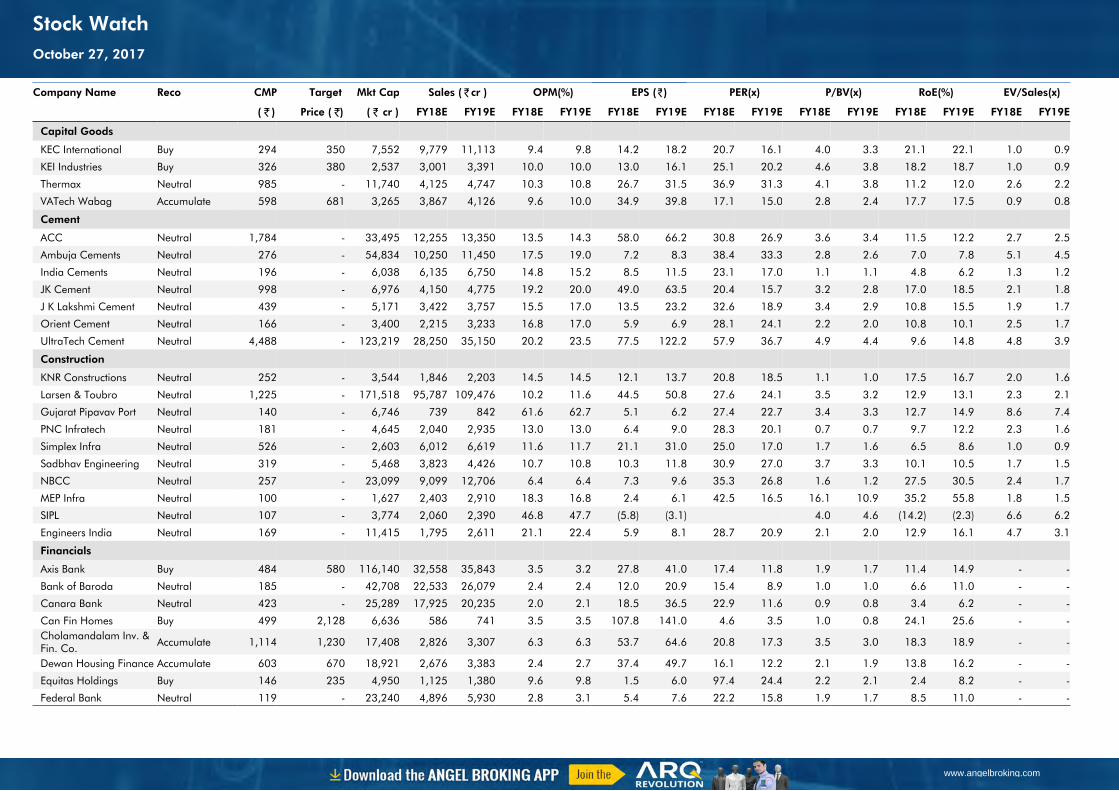
Company Name Reco CMP Target Mkt Cap Sales ( ₹cr ) OPM(%) EPS (₹) PER(x) P/BV(x) RoE(%) EV/Sales(x)
( ₹ ) Price ( ₹) ( ₹ cr ) FY18E FY19E FY18E FY19E FY18E FY19E FY18E FY19E FY18E FY19E FY18E FY19E FY18E FY19E
Capital Goods
KEC International Buy 294 350 7,552 9,779 11,113 9.4 9.8 14.2 18.2 20.7 16.1 4.0 3.3 21.1 22.1 1.0 0.9
KEI Industries Buy 326 380 2,537 3,001 3,391 10.0 10.0 13.0 16.1 25.1 20.2 4.6 3.8 18.2 18.7 1.0 0.9
Thermax Neutral 985 - 11,740 4,125 4,747 10.3 10.8 26.7 31.5 36.9 31.3 4.1 3.8 11.2 12.0 2.6 2.2
VATech Wabag Accumulate 598 681 3,265 3,867 4,126 9.6 10.0 34.9 39.8 17.1 15.0 2.8 2.4 17.7 17.5 0.9 0.8
Cement
ACC Neutral 1,784 - 33,495 12,255 13,350 13.5 14.3 58.0 66.2 30.8 26.9 3.6 3.4 11.5 12.2 2.7 2.5
Ambuja Cements Neutral 276 - 54,834 10,250 11,450 17.5 19.0 7.2 8.3 38.4 33.3 2.8 2.6 7.0 7.8 5.1 4.5
India Cements Neutral 196 - 6,038 6,135 6,750 14.8 15.2 8.5 11.5 23.1 17.0 1.1 1.1 4.8 6.2 1.3 1.2
JK Cement Neutral 998 - 6,976 4,150 4,775 19.2 20.0 49.0 63.5 20.4 15.7 3.2 2.8 17.0 18.5 2.1 1.8
J K Lakshmi Cement Neutral 439 - 5,171 3,422 3,757 15.5 17.0 13.5 23.2 32.6 18.9 3.4 2.9 10.8 15.5 1.9 1.7
Orient Cement Neutral 166 - 3,400 2,215 3,233 16.8 17.0 5.9 6.9 28.1 24.1 2.2 2.0 10.8 10.1 2.5 1.7
UltraTech Cement Neutral 4,488 - 123,219 28,250 35,150 20.2 23.5 77.5 122.2 57.9 36.7 4.9 4.4 9.6 14.8 4.8 3.9
Construction
KNR Constructions Neutral 252 - 3,544 1,846 2,203 14.5 14.5 12.1 13.7 20.8 18.5 1.1 1.0 17.5 16.7 2.0 1.6
Larsen & Toubro Neutral 1,225 - 171,518 95,787 109,476 10.2 11.6 44.5 50.8 27.6 24.1 3.5 3.2 12.9 13.1 2.3 2.1
Gujarat Pipavav Port Neutral 140 - 6,746 739 842 61.6 62.7 5.1 6.2 27.4 22.7 3.4 3.3 12.7 14.9 8.6 7.4
PNC Infratech Neutral 181 - 4,645 2,040 2,935 13.0 13.0 6.4 9.0 28.3 20.1 0.7 0.7 9.7 12.2 2.3 1.6
Simplex Infra Neutral 526 - 2,603 6,012 6,619 11.6 11.7 21.1 31.0 25.0 17.0 1.7 1.6 6.5 8.6 1.0 0.9
Sadbhav Engineering Neutral 319 - 5,468 3,823 4,426 10.7 10.8 10.3 11.8 30.9 27.0 3.7 3.3 10.1 10.5 1.7 1.5
NBCC Neutral 257 - 23,099 9,099 12,706 6.4 6.4 7.3 9.6 35.3 26.8 1.6 1.2 27.5 30.5 2.4 1.7
MEP Infra Neutral 100 - 1,627 2,403 2,910 18.3 16.8 2.4 6.1 42.5 16.5 16.1 10.9 35.2 55.8 1.8 1.5
SIPL Neutral 107 - 3,774 2,060 2,390 46.8 47.7 (5.8) (3.1) 4.0 4.6 (14.2) (2.3) 6.6 6.2
Engineers India Neutral 169 - 11,415 1,795 2,611 21.1 22.4 5.9 8.1 28.7 20.9 2.1 2.0 12.9 16.1 4.7 3.1
Financials
Axis Bank Buy 484 580 116,140 32,558 35,843 3.5 3.2 27.8 41.0 17.4 11.8 1.9 1.7 11.4 14.9 - -
Bank of Baroda Neutral 185 - 42,708 22,533 26,079 2.4 2.4 12.0 20.9 15.4 8.9 1.0 1.0 6.6 11.0 - -
Canara Bank Neutral 423 - 25,289 17,925 20,235 2.0 2.1 18.5 36.5 22.9 11.6 0.9 0.8 3.4 6.2 - -
Can Fin Homes Buy 499 2,128 6,636 586 741 3.5 3.5 107.8 141.0 4.6 3.5 1.0 0.8 24.1 25.6 - -Cholamandalam Inv. & Fin. Co. Accumulate 1,114 1,230 17,408 2,826 3,307 6.3 6.3 53.7 64.6 20.8 17.3 3.5 3.0 18.3 18.9 - -
Dewan Housing Finance Accumulate 603 670 18,921 2,676 3,383 2.4 2.7 37.4 49.7 16.1 12.2 2.1 1.9 13.8 16.2 - -
Equitas Holdings Buy 146 235 4,950 1,125 1,380 9.6 9.8 1.5 6.0 97.4 24.4 2.2 2.1 2.4 8.2 - -
Federal Bank Neutral 119 - 23,240 4,896 5,930 2.8 3.1 5.4 7.6 22.2 15.8 1.9 1.7 8.5 11.0 - -
www.angelbroking.com
Stock WatchOctober 27, 2017
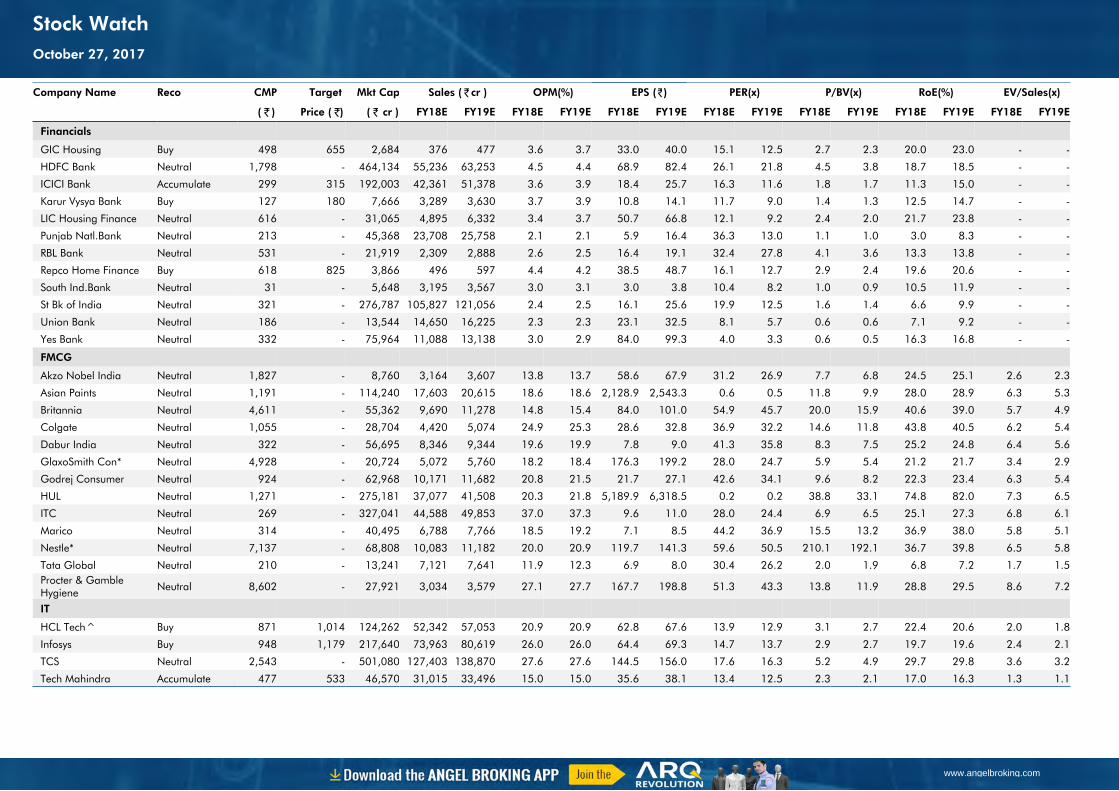
Company Name Reco CMP Target Mkt Cap Sales ( ₹cr ) OPM(%) EPS (₹) PER(x) P/BV(x) RoE(%) EV/Sales(x)
( ₹ ) Price ( ₹) ( ₹ cr ) FY18E FY19E FY18E FY19E FY18E FY19E FY18E FY19E FY18E FY19E FY18E FY19E FY18E FY19E
Financials
GIC Housing Buy 498 655 2,684 376 477 3.6 3.7 33.0 40.0 15.1 12.5 2.7 2.3 20.0 23.0 - -
HDFC Bank Neutral 1,798 - 464,134 55,236 63,253 4.5 4.4 68.9 82.4 26.1 21.8 4.5 3.8 18.7 18.5 - -
ICICI Bank Accumulate 299 315 192,003 42,361 51,378 3.6 3.9 18.4 25.7 16.3 11.6 1.8 1.7 11.3 15.0 - -
Karur Vysya Bank Buy 127 180 7,666 3,289 3,630 3.7 3.9 10.8 14.1 11.7 9.0 1.4 1.3 12.5 14.7 - -
LIC Housing Finance Neutral 616 - 31,065 4,895 6,332 3.4 3.7 50.7 66.8 12.1 9.2 2.4 2.0 21.7 23.8 - -
Punjab Natl.Bank Neutral 213 - 45,368 23,708 25,758 2.1 2.1 5.9 16.4 36.3 13.0 1.1 1.0 3.0 8.3 - -
RBL Bank Neutral 531 - 21,919 2,309 2,888 2.6 2.5 16.4 19.1 32.4 27.8 4.1 3.6 13.3 13.8 - -
Repco Home Finance Buy 618 825 3,866 496 597 4.4 4.2 38.5 48.7 16.1 12.7 2.9 2.4 19.6 20.6 - -
South Ind.Bank Neutral 31 - 5,648 3,195 3,567 3.0 3.1 3.0 3.8 10.4 8.2 1.0 0.9 10.5 11.9 - -
St Bk of India Neutral 321 - 276,787 105,827 121,056 2.4 2.5 16.1 25.6 19.9 12.5 1.6 1.4 6.6 9.9 - -
Union Bank Neutral 186 - 13,544 14,650 16,225 2.3 2.3 23.1 32.5 8.1 5.7 0.6 0.6 7.1 9.2 - -
Yes Bank Neutral 332 - 75,964 11,088 13,138 3.0 2.9 84.0 99.3 4.0 3.3 0.6 0.5 16.3 16.8 - -
FMCG
Akzo Nobel India Neutral 1,827 - 8,760 3,164 3,607 13.8 13.7 58.6 67.9 31.2 26.9 7.7 6.8 24.5 25.1 2.6 2.3
Asian Paints Neutral 1,191 - 114,240 17,603 20,615 18.6 18.6 2,128.9 2,543.3 0.6 0.5 11.8 9.9 28.0 28.9 6.3 5.3
Britannia Neutral 4,611 - 55,362 9,690 11,278 14.8 15.4 84.0 101.0 54.9 45.7 20.0 15.9 40.6 39.0 5.7 4.9
Colgate Neutral 1,055 - 28,704 4,420 5,074 24.9 25.3 28.6 32.8 36.9 32.2 14.6 11.8 43.8 40.5 6.2 5.4
Dabur India Neutral 322 - 56,695 8,346 9,344 19.6 19.9 7.8 9.0 41.3 35.8 8.3 7.5 25.2 24.8 6.4 5.6
GlaxoSmith Con* Neutral 4,928 - 20,724 5,072 5,760 18.2 18.4 176.3 199.2 28.0 24.7 5.9 5.4 21.2 21.7 3.4 2.9
Godrej Consumer Neutral 924 - 62,968 10,171 11,682 20.8 21.5 21.7 27.1 42.6 34.1 9.6 8.2 22.3 23.4 6.3 5.4
HUL Neutral 1,271 - 275,181 37,077 41,508 20.3 21.8 5,189.9 6,318.5 0.2 0.2 38.8 33.1 74.8 82.0 7.3 6.5
ITC Neutral 269 - 327,041 44,588 49,853 37.0 37.3 9.6 11.0 28.0 24.4 6.9 6.5 25.1 27.3 6.8 6.1
Marico Neutral 314 - 40,495 6,788 7,766 18.5 19.2 7.1 8.5 44.2 36.9 15.5 13.2 36.9 38.0 5.8 5.1
Nestle* Neutral 7,137 - 68,808 10,083 11,182 20.0 20.9 119.7 141.3 59.6 50.5 210.1 192.1 36.7 39.8 6.5 5.8
Tata Global Neutral 210 - 13,241 7,121 7,641 11.9 12.3 6.9 8.0 30.4 26.2 2.0 1.9 6.8 7.2 1.7 1.5Procter & Gamble Hygiene Neutral 8,602 - 27,921 3,034 3,579 27.1 27.7 167.7 198.8 51.3 43.3 13.8 11.9 28.8 29.5 8.6 7.2
IT
HCL Tech^ Buy 871 1,014 124,262 52,342 57,053 20.9 20.9 62.8 67.6 13.9 12.9 3.1 2.7 22.4 20.6 2.0 1.8
Infosys Buy 948 1,179 217,640 73,963 80,619 26.0 26.0 64.4 69.3 14.7 13.7 2.9 2.7 19.7 19.6 2.4 2.1
TCS Neutral 2,543 - 501,080 127,403 138,870 27.6 27.6 144.5 156.0 17.6 16.3 5.2 4.9 29.7 29.8 3.6 3.2
Tech Mahindra Accumulate 477 533 46,570 31,015 33,496 15.0 15.0 35.6 38.1 13.4 12.5 2.3 2.1 17.0 16.3 1.3 1.1
www.angelbroking.com
Stock WatchOctober 27, 2017
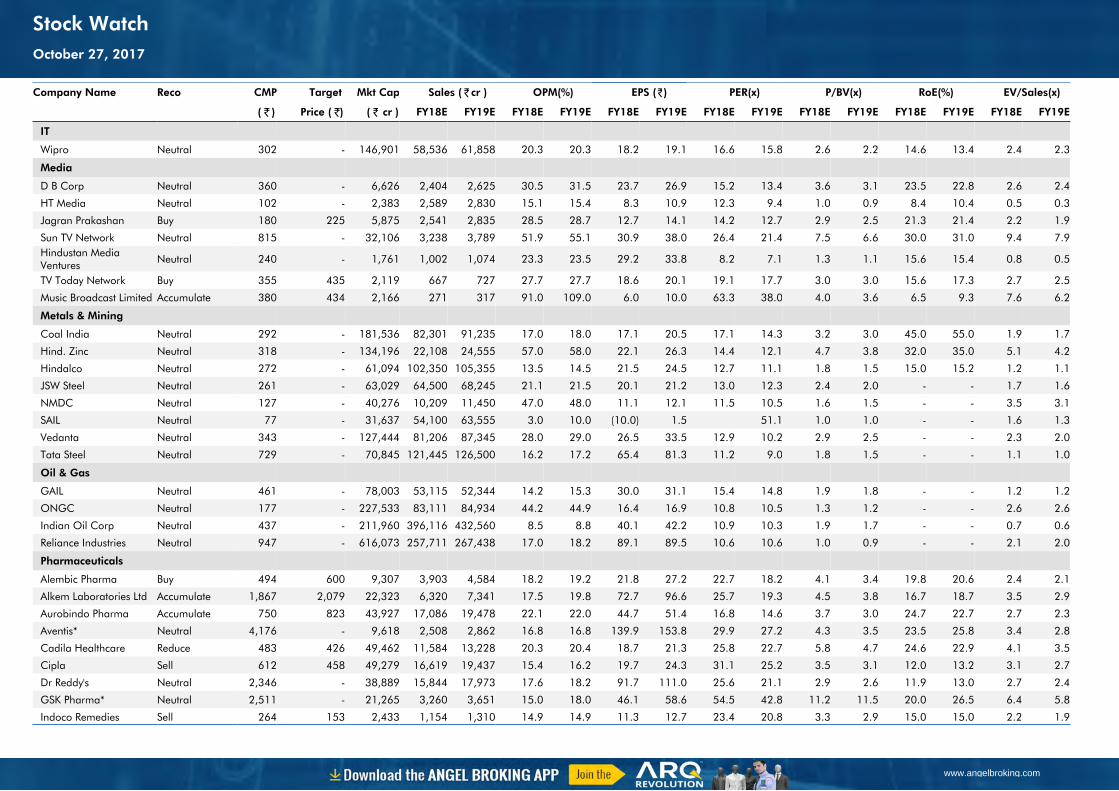
Company Name Reco CMP Target Mkt Cap Sales ( ₹cr ) OPM(%) EPS (₹) PER(x) P/BV(x) RoE(%) EV/Sales(x)
( ₹ ) Price ( ₹) ( ₹ cr ) FY18E FY19E FY18E FY19E FY18E FY19E FY18E FY19E FY18E FY19E FY18E FY19E FY18E FY19E
IT
Wipro Neutral 302 - 146,901 58,536 61,858 20.3 20.3 18.2 19.1 16.6 15.8 2.6 2.2 14.6 13.4 2.4 2.3
Media
D B Corp Neutral 360 - 6,626 2,404 2,625 30.5 31.5 23.7 26.9 15.2 13.4 3.6 3.1 23.5 22.8 2.6 2.4
HT Media Neutral 102 - 2,383 2,589 2,830 15.1 15.4 8.3 10.9 12.3 9.4 1.0 0.9 8.4 10.4 0.5 0.3
Jagran Prakashan Buy 180 225 5,875 2,541 2,835 28.5 28.7 12.7 14.1 14.2 12.7 2.9 2.5 21.3 21.4 2.2 1.9
Sun TV Network Neutral 815 - 32,106 3,238 3,789 51.9 55.1 30.9 38.0 26.4 21.4 7.5 6.6 30.0 31.0 9.4 7.9Hindustan Media Ventures Neutral 240 - 1,761 1,002 1,074 23.3 23.5 29.2 33.8 8.2 7.1 1.3 1.1 15.6 15.4 0.8 0.5
TV Today Network Buy 355 435 2,119 667 727 27.7 27.7 18.6 20.1 19.1 17.7 3.0 3.0 15.6 17.3 2.7 2.5
Music Broadcast Limited Accumulate 380 434 2,166 271 317 91.0 109.0 6.0 10.0 63.3 38.0 4.0 3.6 6.5 9.3 7.6 6.2
Metals & Mining
Coal India Neutral 292 - 181,536 82,301 91,235 17.0 18.0 17.1 20.5 17.1 14.3 3.2 3.0 45.0 55.0 1.9 1.7
Hind. Zinc Neutral 318 - 134,196 22,108 24,555 57.0 58.0 22.1 26.3 14.4 12.1 4.7 3.8 32.0 35.0 5.1 4.2
Hindalco Neutral 272 - 61,094 102,350 105,355 13.5 14.5 21.5 24.5 12.7 11.1 1.8 1.5 15.0 15.2 1.2 1.1
JSW Steel Neutral 261 - 63,029 64,500 68,245 21.1 21.5 20.1 21.2 13.0 12.3 2.4 2.0 - - 1.7 1.6
NMDC Neutral 127 - 40,276 10,209 11,450 47.0 48.0 11.1 12.1 11.5 10.5 1.6 1.5 - - 3.5 3.1
SAIL Neutral 77 - 31,637 54,100 63,555 3.0 10.0 (10.0) 1.5 51.1 1.0 1.0 - - 1.6 1.3
Vedanta Neutral 343 - 127,444 81,206 87,345 28.0 29.0 26.5 33.5 12.9 10.2 2.9 2.5 - - 2.3 2.0
Tata Steel Neutral 729 - 70,845 121,445 126,500 16.2 17.2 65.4 81.3 11.2 9.0 1.8 1.5 - - 1.1 1.0
Oil & Gas
GAIL Neutral 461 - 78,003 53,115 52,344 14.2 15.3 30.0 31.1 15.4 14.8 1.9 1.8 - - 1.2 1.2
ONGC Neutral 177 - 227,533 83,111 84,934 44.2 44.9 16.4 16.9 10.8 10.5 1.3 1.2 - - 2.6 2.6
Indian Oil Corp Neutral 437 - 211,960 396,116 432,560 8.5 8.8 40.1 42.2 10.9 10.3 1.9 1.7 - - 0.7 0.6
Reliance Industries Neutral 947 - 616,073 257,711 267,438 17.0 18.2 89.1 89.5 10.6 10.6 1.0 0.9 - - 2.1 2.0
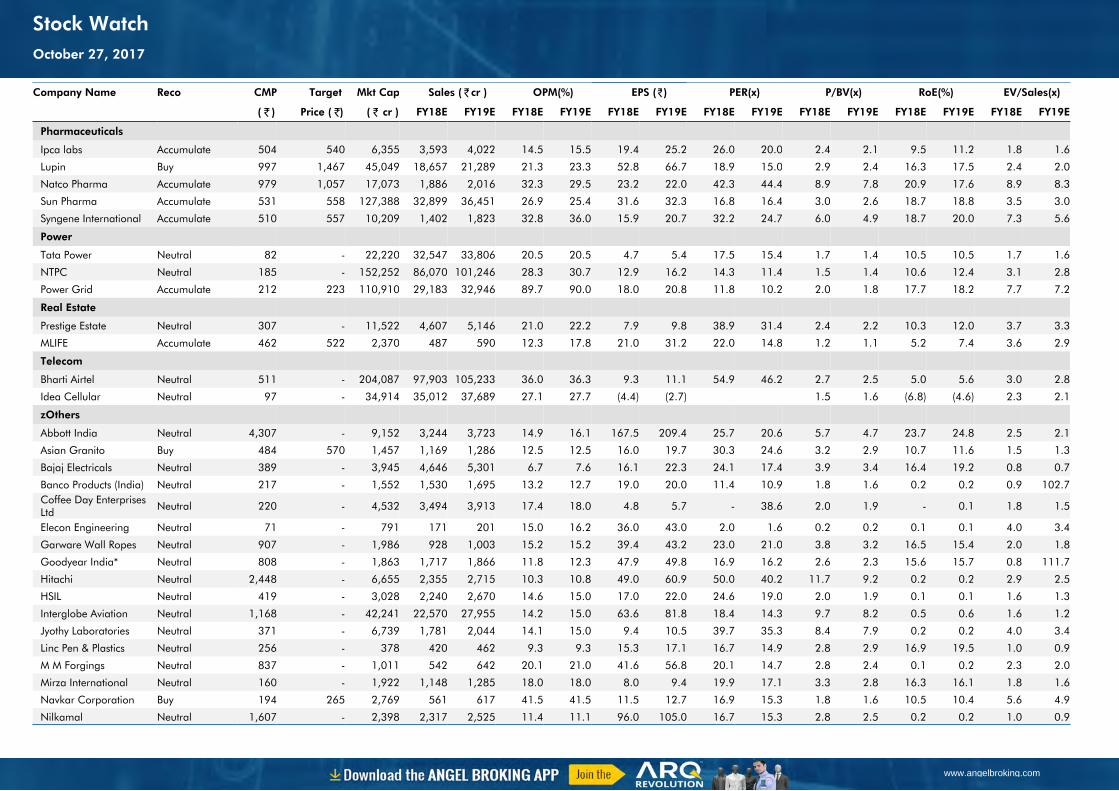
Pharmaceuticals
Alembic Pharma Buy 494 600 9,307 3,903 4,584 18.2 19.2 21.8 27.2 22.7 18.2 4.1 3.4 19.8 20.6 2.4 2.1
Alkem Laboratories Ltd Accumulate 1,867 2,079 22,323 6,320 7,341 17.5 19.8 72.7 96.6 25.7 19.3 4.5 3.8 16.7 18.7 3.5 2.9
Aurobindo Pharma Accumulate 750 823 43,927 17,086 19,478 22.1 22.0 44.7 51.4 16.8 14.6 3.7 3.0 24.7 22.7 2.7 2.3
Aventis* Neutral 4,176 - 9,618 2,508 2,862 16.8 16.8 139.9 153.8 29.9 27.2 4.3 3.5 23.5 25.8 3.4 2.8
Cadila Healthcare Reduce 483 426 49,462 11,584 13,228 20.3 20.4 18.7 21.3 25.8 22.7 5.8 4.7 24.6 22.9 4.1 3.5
Cipla Sell 612 458 49,279 16,619 19,437 15.4 16.2 19.7 24.3 31.1 25.2 3.5 3.1 12.0 13.2 3.1 2.7
Dr Reddy's Neutral 2,346 - 38,889 15,844 17,973 17.6 18.2 91.7 111.0 25.6 21.1 2.9 2.6 11.9 13.0 2.7 2.4
GSK Pharma* Neutral 2,511 - 21,265 3,260 3,651 15.0 18.0 46.1 58.6 54.5 42.8 11.2 11.5 20.0 26.5 6.4 5.8
Indoco Remedies Sell 264 153 2,433 1,154 1,310 14.9 14.9 11.3 12.7 23.4 20.8 3.3 2.9 15.0 15.0 2.2 1.9
www.angelbroking.com
Stock WatchOctober 27, 2017
Company Name Reco CMP Target Mkt Cap Sales ( ₹cr ) OPM(%) EPS (₹) PER(x) P/BV(x) RoE(%) EV/Sales(x)
( ₹ ) Price ( ₹) ( ₹ cr ) FY18E FY19E FY18E FY19E FY18E FY19E FY18E FY19E FY18E FY19E FY18E FY19E FY18E FY19E
Pharmaceuticals
Ipca labs Accumulate 504 540 6,355 3,593 4,022 14.5 15.5 19.4 25.2 26.0 20.0 2.4 2.1 9.5 11.2 1.8 1.6
Lupin Buy 997 1,467 45,049 18,657 21,289 21.3 23.3 52.8 66.7 18.9 15.0 2.9 2.4 16.3 17.5 2.4 2.0
Natco Pharma Accumulate 979 1,057 17,073 1,886 2,016 32.3 29.5 23.2 22.0 42.3 44.4 8.9 7.8 20.9 17.6 8.9 8.3
Sun Pharma Accumulate 531 558 127,388 32,899 36,451 26.9 25.4 31.6 32.3 16.8 16.4 3.0 2.6 18.7 18.8 3.5 3.0
Syngene International Accumulate 510 557 10,209 1,402 1,823 32.8 36.0 15.9 20.7 32.2 24.7 6.0 4.9 18.7 20.0 7.3 5.6
Power
Tata Power Neutral 82 - 22,220 32,547 33,806 20.5 20.5 4.7 5.4 17.5 15.4 1.7 1.4 10.5 10.5 1.7 1.6
NTPC Neutral 185 - 152,252 86,070 101,246 28.3 30.7 12.9 16.2 14.3 11.4 1.5 1.4 10.6 12.4 3.1 2.8
Power Grid Accumulate 212 223 110,910 29,183 32,946 89.7 90.0 18.0 20.8 11.8 10.2 2.0 1.8 17.7 18.2 7.7 7.2
Real Estate
Prestige Estate Neutral 307 - 11,522 4,607 5,146 21.0 22.2 7.9 9.8 38.9 31.4 2.4 2.2 10.3 12.0 3.7 3.3
MLIFE Accumulate 462 522 2,370 487 590 12.3 17.8 21.0 31.2 22.0 14.8 1.2 1.1 5.2 7.4 3.6 2.9
Telecom
Bharti Airtel Neutral 511 - 204,087 97,903 105,233 36.0 36.3 9.3 11.1 54.9 46.2 2.7 2.5 5.0 5.6 3.0 2.8
Idea Cellular Neutral 97 - 34,914 35,012 37,689 27.1 27.7 (4.4) (2.7) 1.5 1.6 (6.8) (4.6) 2.3 2.1
zOthers
Abbott India Neutral 4,307 - 9,152 3,244 3,723 14.9 16.1 167.5 209.4 25.7 20.6 5.7 4.7 23.7 24.8 2.5 2.1
Asian Granito Buy 484 570 1,457 1,169 1,286 12.5 12.5 16.0 19.7 30.3 24.6 3.2 2.9 10.7 11.6 1.5 1.3
Bajaj Electricals Neutral 389 - 3,945 4,646 5,301 6.7 7.6 16.1 22.3 24.1 17.4 3.9 3.4 16.4 19.2 0.8 0.7
Banco Products (India) Neutral 217 - 1,552 1,530 1,695 13.2 12.7 19.0 20.0 11.4 10.9 1.8 1.6 0.2 0.2 0.9 102.7Coffee Day Enterprises Ltd Neutral 220 - 4,532 3,494 3,913 17.4 18.0 4.8 5.7 - 38.6 2.0 1.9 - 0.1 1.8 1.5
Elecon Engineering Neutral 71 - 791 171 201 15.0 16.2 36.0 43.0 2.0 1.6 0.2 0.2 0.1 0.1 4.0 3.4
Garware Wall Ropes Neutral 907 - 1,986 928 1,003 15.2 15.2 39.4 43.2 23.0 21.0 3.8 3.2 16.5 15.4 2.0 1.8
Goodyear India* Neutral 808 - 1,863 1,717 1,866 11.8 12.3 47.9 49.8 16.9 16.2 2.6 2.3 15.6 15.7 0.8 111.7
Hitachi Neutral 2,448 - 6,655 2,355 2,715 10.3 10.8 49.0 60.9 50.0 40.2 11.7 9.2 0.2 0.2 2.9 2.5
HSIL Neutral 419 - 3,028 2,240 2,670 14.6 15.0 17.0 22.0 24.6 19.0 2.0 1.9 0.1 0.1 1.6 1.3
Interglobe Aviation Neutral 1,168 - 42,241 22,570 27,955 14.2 15.0 63.6 81.8 18.4 14.3 9.7 8.2 0.5 0.6 1.6 1.2
Jyothy Laboratories Neutral 371 - 6,739 1,781 2,044 14.1 15.0 9.4 10.5 39.7 35.3 8.4 7.9 0.2 0.2 4.0 3.4
Linc Pen & Plastics Neutral 256 - 378 420 462 9.3 9.3 15.3 17.1 16.7 14.9 2.8 2.9 16.9 19.5 1.0 0.9
M M Forgings Neutral 837 - 1,011 542 642 20.1 21.0 41.6 56.8 20.1 14.7 2.8 2.4 0.1 0.2 2.3 2.0
Mirza International Neutral 160 - 1,922 1,148 1,285 18.0 18.0 8.0 9.4 19.9 17.1 3.3 2.8 16.3 16.1 1.8 1.6
Navkar Corporation Buy 194 265 2,769 561 617 41.5 41.5 11.5 12.7 16.9 15.3 1.8 1.6 10.5 10.4 5.6 4.9
Nilkamal Neutral 1,607 - 2,398 2,317 2,525 11.4 11.1 96.0 105.0 16.7 15.3 2.8 2.5 0.2 0.2 1.0 0.9
www.angelbroking.com
Stock WatchOctober 27, 2017
Company Name Reco CMP Target Mkt Cap Sales ( ₹cr ) OPM(%) EPS (₹) PER(x) P/BV(x) RoE(%) EV/Sales(x)
( ₹ ) Price ( ₹) ( ₹ cr ) FY18E FY19E FY18E FY19E FY18E FY19E FY18E FY19E FY18E FY19E FY18E FY19E FY18E FY19E
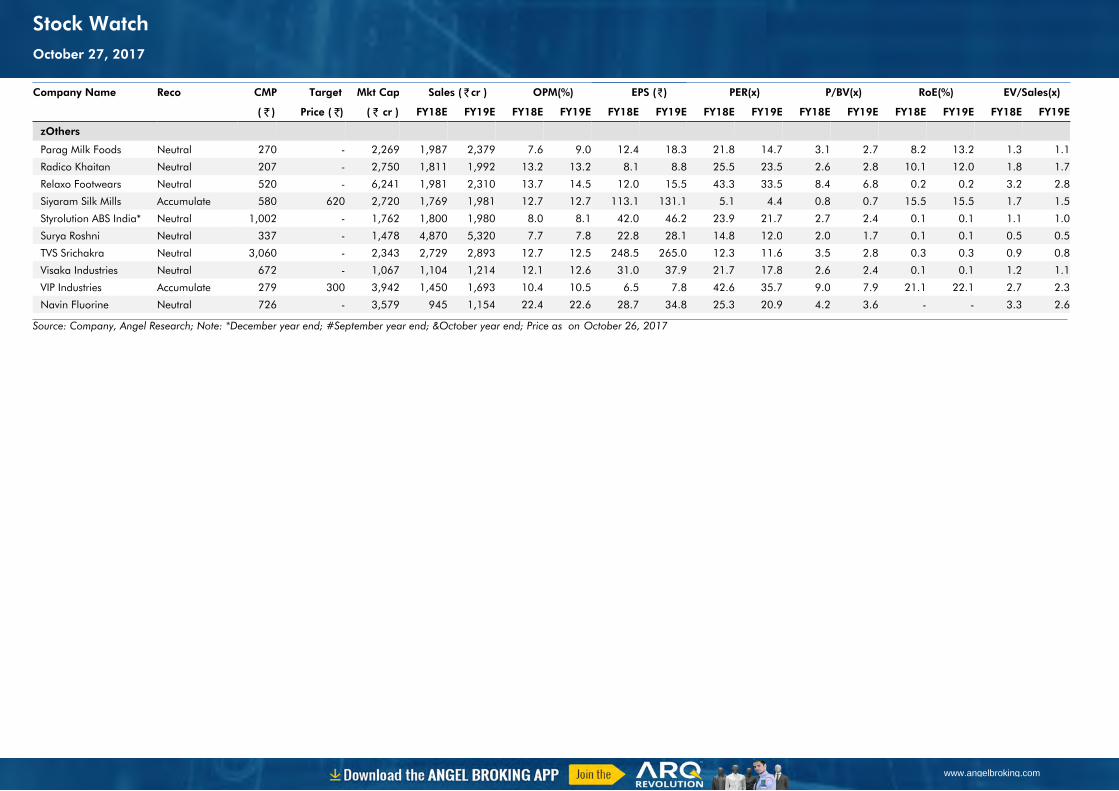
zOthers
Parag Milk Foods Neutral 270 - 2,269 1,987 2,379 7.6 9.0 12.4 18.3 21.8 14.7 3.1 2.7 8.2 13.2 1.3 1.1
Radico Khaitan Neutral 207 - 2,750 1,811 1,992 13.2 13.2 8.1 8.8 25.5 23.5 2.6 2.8 10.1 12.0 1.8 1.7
Relaxo Footwears Neutral 520 - 6,241 1,981 2,310 13.7 14.5 12.0 15.5 43.3 33.5 8.4 6.8 0.2 0.2 3.2 2.8
Siyaram Silk Mills Accumulate 580 620 2,720 1,769 1,981 12.7 12.7 113.1 131.1 5.1 4.4 0.8 0.7 15.5 15.5 1.7 1.5
Styrolution ABS India* Neutral 1,002 - 1,762 1,800 1,980 8.0 8.1 42.0 46.2 23.9 21.7 2.7 2.4 0.1 0.1 1.1 1.0
Surya Roshni Neutral 337 - 1,478 4,870 5,320 7.7 7.8 22.8 28.1 14.8 12.0 2.0 1.7 0.1 0.1 0.5 0.5
TVS Srichakra Neutral 3,060 - 2,343 2,729 2,893 12.7 12.5 248.5 265.0 12.3 11.6 3.5 2.8 0.3 0.3 0.9 0.8
Visaka Industries Neutral 672 - 1,067 1,104 1,214 12.1 12.6 31.0 37.9 21.7 17.8 2.6 2.4 0.1 0.1 1.2 1.1
VIP Industries Accumulate 279 300 3,942 1,450 1,693 10.4 10.5 6.5 7.8 42.6 35.7 9.0 7.9 21.1 22.1 2.7 2.3
Navin Fluorine Neutral 726 - 3,579 945 1,154 22.4 22.6 28.7 34.8 25.3 20.9 4.2 3.6 - - 3.3 2.6
Source: Company, Angel Research; Note: *December year end; #September year end; &October year end; Price as on October 26, 2017
www.angelbroking.com
Stock WatchOctober 27, 2017
Research Team Tel: 022 - 39357800 E-mail: [email protected] Website: www.angelbroking.com
DISCLAIMER
Angel Broking Private Limited (hereinafter referred to as “Angel”) is a registered Member of National Stock Exchange of India Limited,Bombay Stock Exchange Limited and Metropolitan Stock Exchange Limited. It is also registered as a Depository Participant with CDSL and Portfolio Manager with SEBI. It also has registration with AMFI as a Mutual Fund Distributor. Angel Broking Private Limited is a registered entity with SEBI for Research Analyst in terms of SEBI (Research Analyst) Regulations, 2014 vide registration number INH000000164. Angel or its associates has not been debarred/ suspended by SEBI or any other regulatory authority for accessing /dealing in securities Market. Angel or its associates/analyst has not received any compensation / managed or co-managed public offering of securities of the company covered by Analyst during the past twelve months.
This document is solely for the personal information of the recipient, and must not be singularly used as the basis of any investmentdecision. Nothing in this document should be construed as investment or financial advice. Each recipient of this document should make such investigations as they deem necessary to arrive at an independent evaluation of an investment in the securities of the companies referred to in this document (including the merits and risks involved), and should consult their own advisors to determine the merits and risks of such an investment.
Reports based on technical and derivative analysis center on studying charts of a stock's price movement, outstanding positions andtrading volume, as opposed to focusing on a company's fundamentals and, as such, may not match with a report on a company'sfundamentals. Investors are advised to refer the Fundamental and Technical Research Reports available on our website to evaluate the contrary view, if any.
The information in this document has been printed on the basis of publicly available information, internal data and other reliablesources believed to be true, but we do not represent that it is accurate or complete and it should not be relied on as such, as thisdocument is for general guidance only. Angel Broking Pvt. Limited or any of its affiliates/ group companies shall not be in any wayresponsible for any loss or damage that may arise to any person from any inadvertent error in the information contained in this report.Angel Broking Pvt. Limited has not independently verified all the information contained within this document. Accordingly, we cannottestify, nor make any representation or warranty, express or implied, to the accuracy, contents or data contained within this document.While Angel Broking Pvt. Limited endeavors to update on a reasonable basis the information discussed in this material, there may beregulatory, compliance, or other reasons that prevent us from doing so.
This document is being supplied to you solely for your information, and its contents, information or data may not be reproduced,redistributed or passed on, directly or indirectly.
Neither Angel Broking Pvt. Limited, nor its directors, employees or affiliates shall be liable for any loss or damage that may arise fromor in connection with the use of this information.
www.angelbroking.com
Market OutlookOctober 27, 2017