Embed Size (px)
Citation preview
MARKIN CONSULTING ■ MAPLE GROVE, MINNESOTA
BENTON COUNTY FAIR BOARD
MARKET DEMAND AND FINANCIAL FEASABILITY STUDY REPORT
March 2005
Submitted by:
i
MARKIN CONSULTING MAPLE GROVE, MINNESOTA
TO: Mr. Bart Noll FROM: Markin Consulting DATE: March 2005 SUBJECT: Market Demand and Financial Feasibility Study Report
This report presents the results of Markin Consulting’s study to identify and recommend market supportable and financially viable new or improved facilities at the Benton County Fairgrounds, located in Corvallis, Oregon (the Fairgrounds). Specifically, the objectives of this assistance were to: ■ Conduct research and analyses that identify potential opportunities – either new markets, affiliations or operating
approaches – that would increase overall usage of, and net revenues to, the Fairgrounds operations
■ Recommend facilities necessary to attract the potential opportunities
■ Prepare financial projections of operating the recommended facilities
■ Identify funding options for development of the recommended facilities
■ Offer best practices recommendations for the operation of the Fairgrounds
Benton County Fairgrounds Market Demand and Financial Feasibility Study Report
ii
Approach Markin Consulting, in conducting the market demand and financial assessment of the possible redevelopment options, performed the following work steps:
Toured Corvallis and surrounding area, including the facilities at the Fairgrounds
Interviewed representatives of the Benton County Fair Board (the Board) and its staff, Benton County, Corvallis, Corvallis Chamber of Commerce, Corvallis Tourism, Oregon State University, existing and potential Fairground users and other interested parties
Researched and analyzed historical usage trends of the Fairground facilities
Analyzed economic and demographic trends affecting the Corvallis/Benton County market area
Researched and assessed the area’s community resources (lodging, restaurants, retail, etc.)
Researched and assessed the impact of competitive facilities located in the Benton County area and the Central Oregon region on existing and potential events and facilities at the Fairgrounds
Surveyed and interviewed potential users of the possible new or improved facilities, including promoters of events and activities
Identified and quantified potential events, activities and opportunities for new or improved facilities at the Fairgrounds
Recommended facilities needed to accommodate the potential events, activities and opportunities at the Fairgrounds
Developed estimates of operating revenues and expenses associated with the recommended facilities
Identified the impacts of funding options on the operations of the Fairgrounds
Benton County Fairgrounds Market Demand and Financial Feasibility Study Report
iii
Conditions of the Study This report is to be used only for planning of improved facilities at the Benton County Fairgrounds. It is not to be used for any other purpose. This report may not be referred to or included in any prospectus, or as a part of any offering or representation made in connection with the sale of securities to the public.
Although we believe that the information and assumptions set forth in this report constitute a reasonable basis for the estimates of usage, operating revenues and expenses, the achievement of any estimate may be affected by fluctuating economic conditions and the occurrence of other future events that cannot be anticipated. Therefore, the actual results achieved will vary from the estimates and such variations may be material.
The terms of our engagement are that we have no responsibility to update this report or to revise the estimates because of events and transactions occurring subsequent to the date of this report.
****************************************************************************
We have appreciated the opportunity to work with you on this very important project.
Very truly yours,
Rod Markin, President
Benton County Fairgrounds Market Demand and Financial Feasibility Study Report
iv
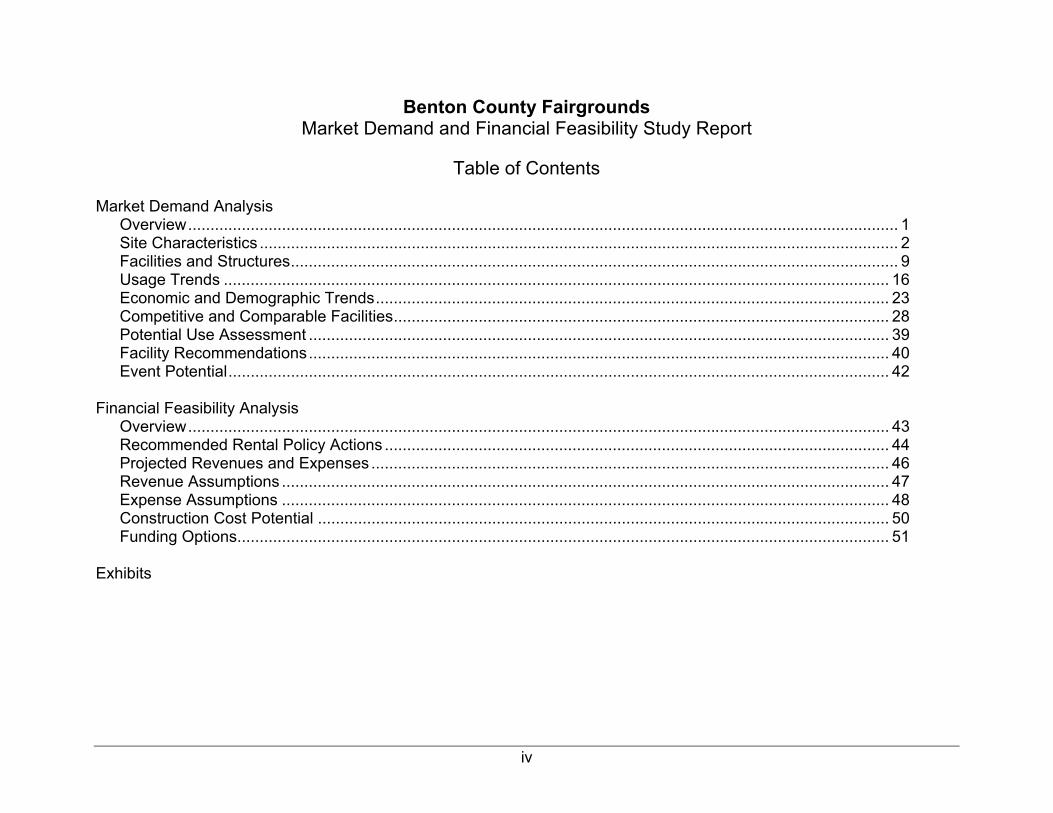
Table of Contents
Market Demand Analysis Overview............................................................................................................................................................... 1 Site Characteristics ............................................................................................................................................... 2 Facilities and Structures........................................................................................................................................ 9 Usage Trends ..................................................................................................................................................... 16 Economic and Demographic Trends................................................................................................................... 23 Competitive and Comparable Facilities............................................................................................................... 28
Potential Use Assessment .................................................................................................................................. 39 Facility Recommendations.................................................................................................................................. 40 Event Potential.................................................................................................................................................... 42
Financial Feasibility Analysis Overview............................................................................................................................................................. 43 Recommended Rental Policy Actions ................................................................................................................. 44 Projected Revenues and Expenses .................................................................................................................... 46 Revenue Assumptions ........................................................................................................................................ 47 Expense Assumptions ........................................................................................................................................ 48 Construction Cost Potential ................................................................................................................................ 50 Funding Options.................................................................................................................................................. 51 Exhibits
Benton County Fairgrounds Market Demand Analysis
1
Market Demand Overview
This section of this report presents our analyses, assessments, observations and recommendations related to market opportunities, operational factors and facility impacts related to the Benton County Fairgrounds. This section is organized in the following manner:
■ Site characteristics ■ Facilities and structures ■ Usage trends ■ Economic and demographic trends ■ Community resources ■ Competitive and comparable facilities ■ Potential use assessment ■ Facility recommendations ■ Event potential
Benton County Fairgrounds Market Demand Analysis
2
Site Characteristics
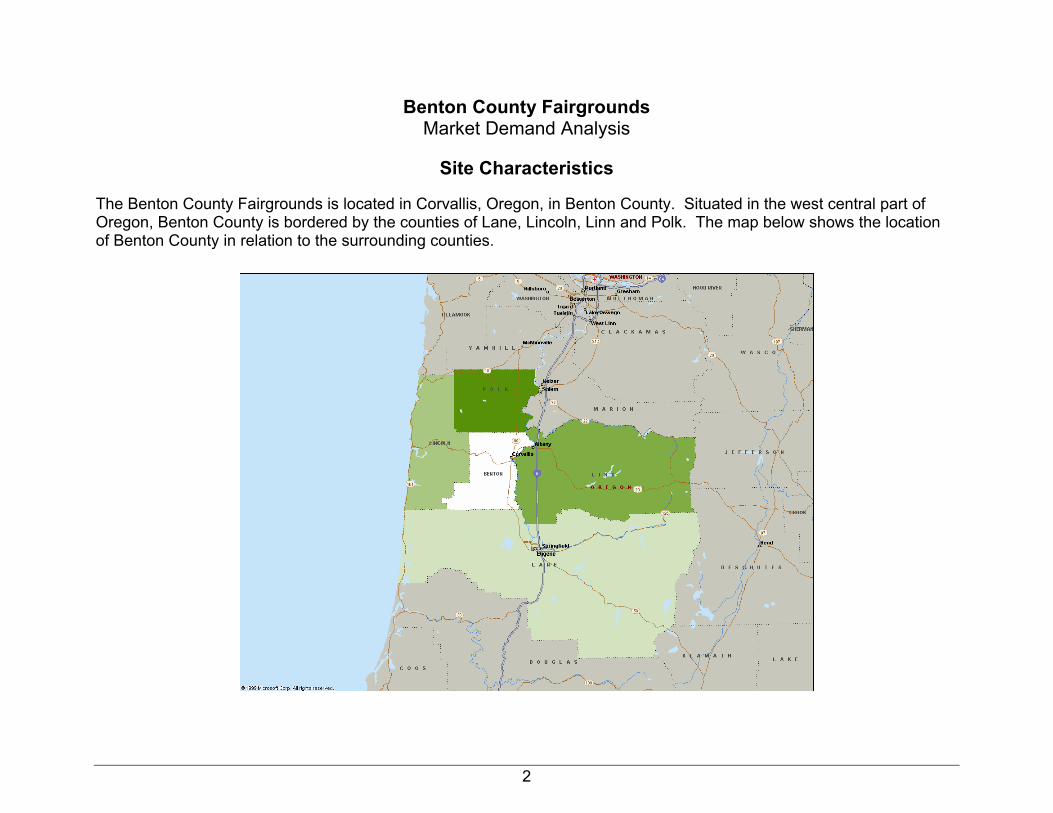
The Benton County Fairgrounds is located in Corvallis, Oregon, in Benton County. Situated in the west central part of Oregon, Benton County is bordered by the counties of Lane, Lincoln, Linn and Polk. The map below shows the location of Benton County in relation to the surrounding counties.
Benton County Fairgrounds Market Demand Analysis
3
Site Characteristics (continued)
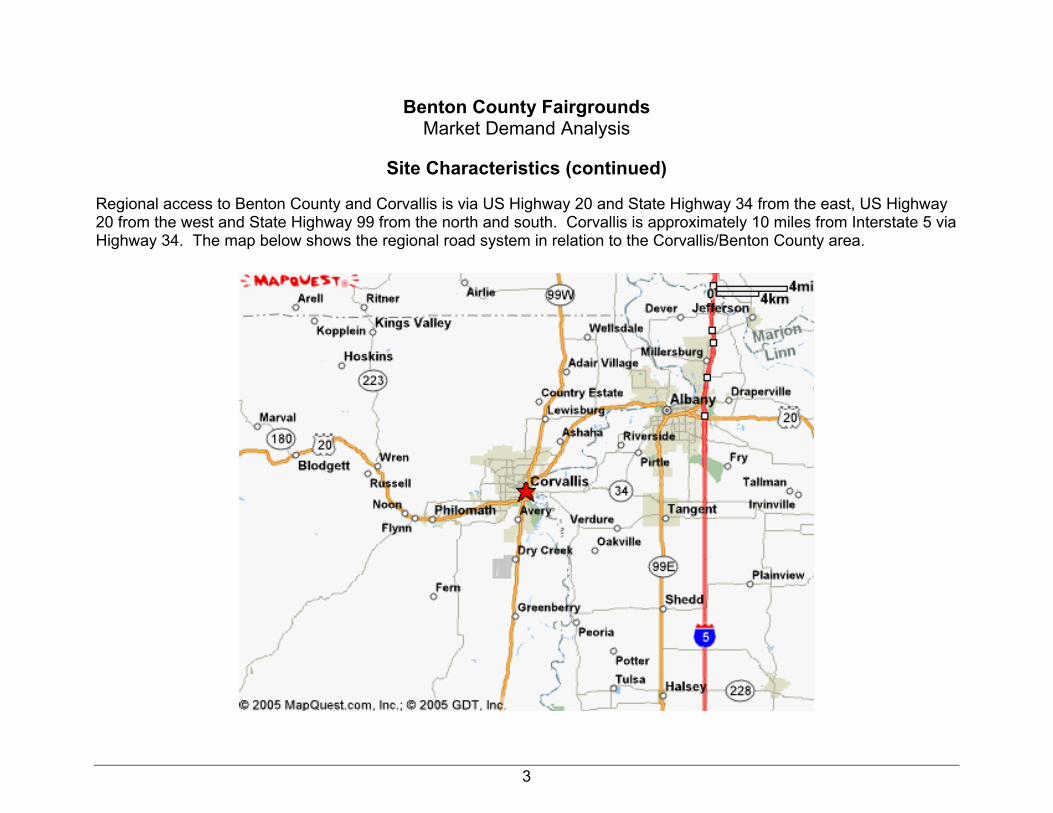
Regional access to Benton County and Corvallis is via US Highway 20 and State Highway 34 from the east, US Highway 20 from the west and State Highway 99 from the north and south. Corvallis is approximately 10 miles from Interstate 5 via Highway 34. The map below shows the regional road system in relation to the Corvallis/Benton County area.
Benton County Fairgrounds Market Demand Analysis
4
Site Characteristics (continued)
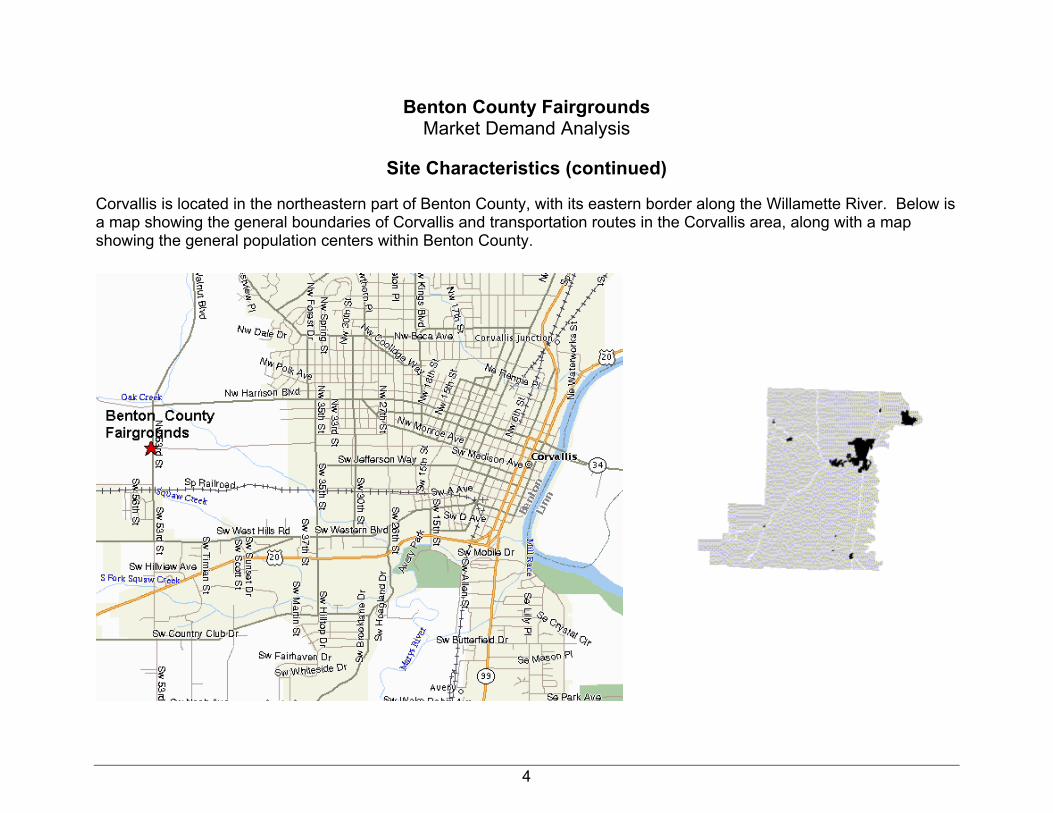
Corvallis is located in the northeastern part of Benton County, with its eastern border along the Willamette River. Below is a map showing the general boundaries of Corvallis and transportation routes in the Corvallis area, along with a map showing the general population centers within Benton County.
Benton County Fairgrounds Market Demand Analysis
5
Site Characteristics (continued)
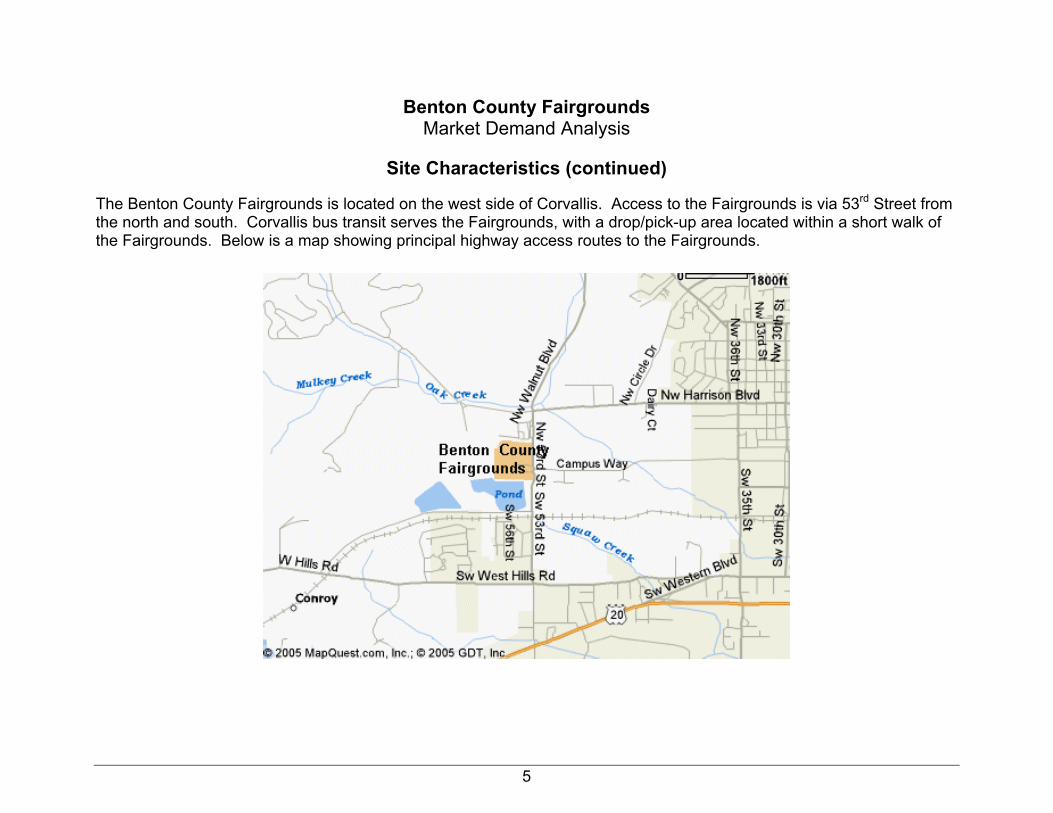
The Benton County Fairgrounds is located on the west side of Corvallis. Access to the Fairgrounds is via 53rd Street from the north and south. Corvallis bus transit serves the Fairgrounds, with a drop/pick-up area located within a short walk of the Fairgrounds. Below is a map showing principal highway access routes to the Fairgrounds.
Benton County Fairgrounds Market Demand Analysis
6
Site Characteristics (continued)
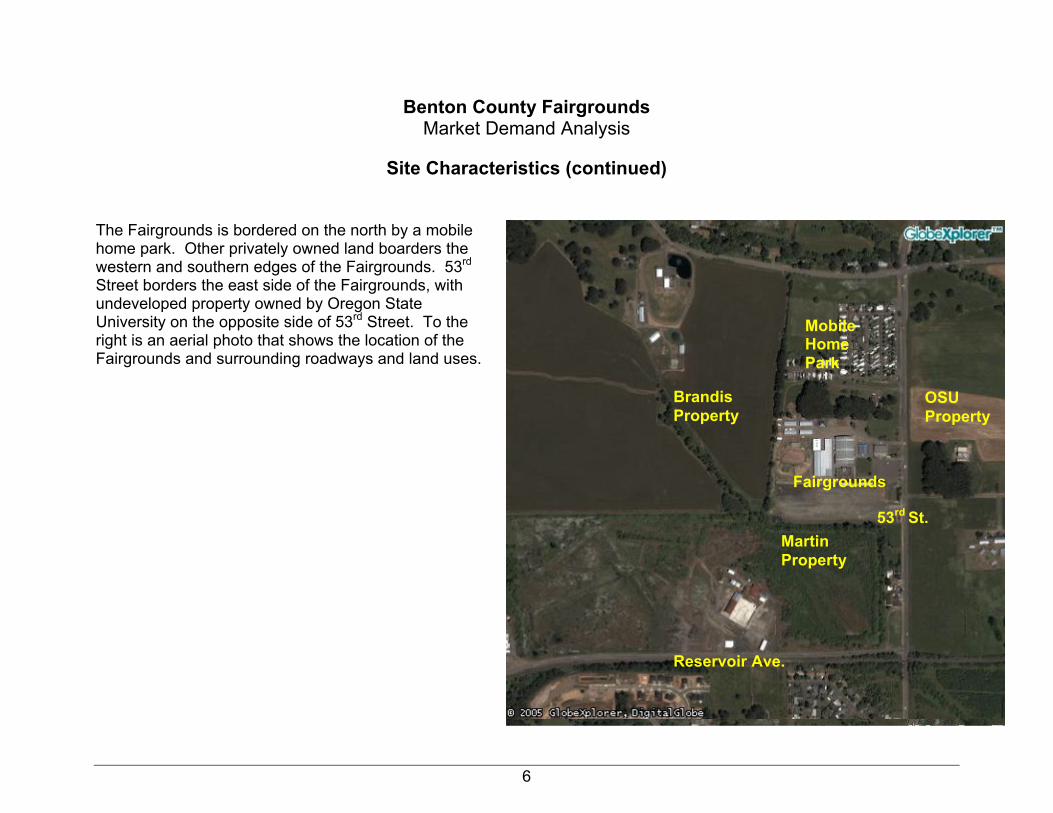
The Fairgrounds is bordered on the north by a mobile home park. Other privately owned land boarders the western and southern edges of the Fairgrounds. 53rd Street borders the east side of the Fairgrounds, with undeveloped property owned by Oregon State University on the opposite side of 53rd Street. To the right is an aerial photo that shows the location of the Fairgrounds and surrounding roadways and land uses.
OSU Property
53rd St. Martin Property
Brandis Property
Mobile Home Park
Fairgrounds
Reservoir Ave.
Benton County Fairgrounds Market Demand Analysis
7
Site Characteristics (continued)
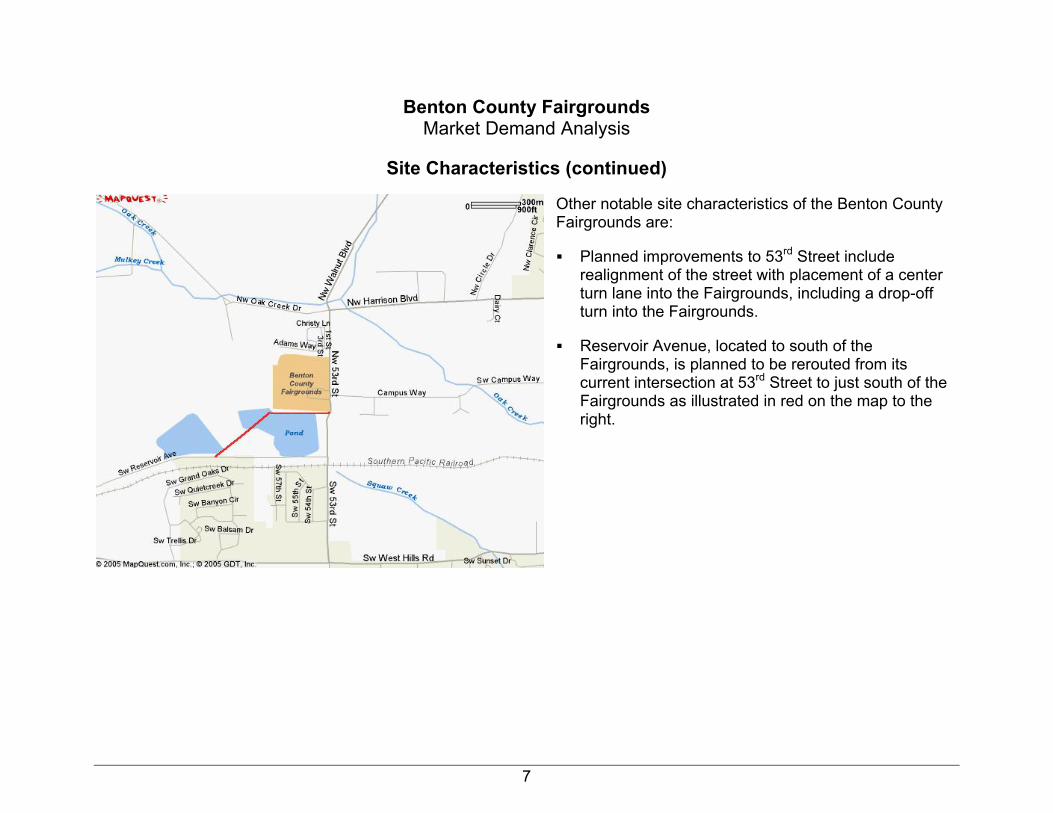
Other notable site characteristics of the Benton County Fairgrounds are:
Planned improvements to 53rd Street include realignment of the street with placement of a center turn lane into the Fairgrounds, including a drop-off turn into the Fairgrounds.
Reservoir Avenue, located to south of the Fairgrounds, is planned to be rerouted from its current intersection at 53rd Street to just south of the Fairgrounds as illustrated in red on the map to the right.
Benton County Fairgrounds Market Demand Analysis
8
Site Characteristics (continued)
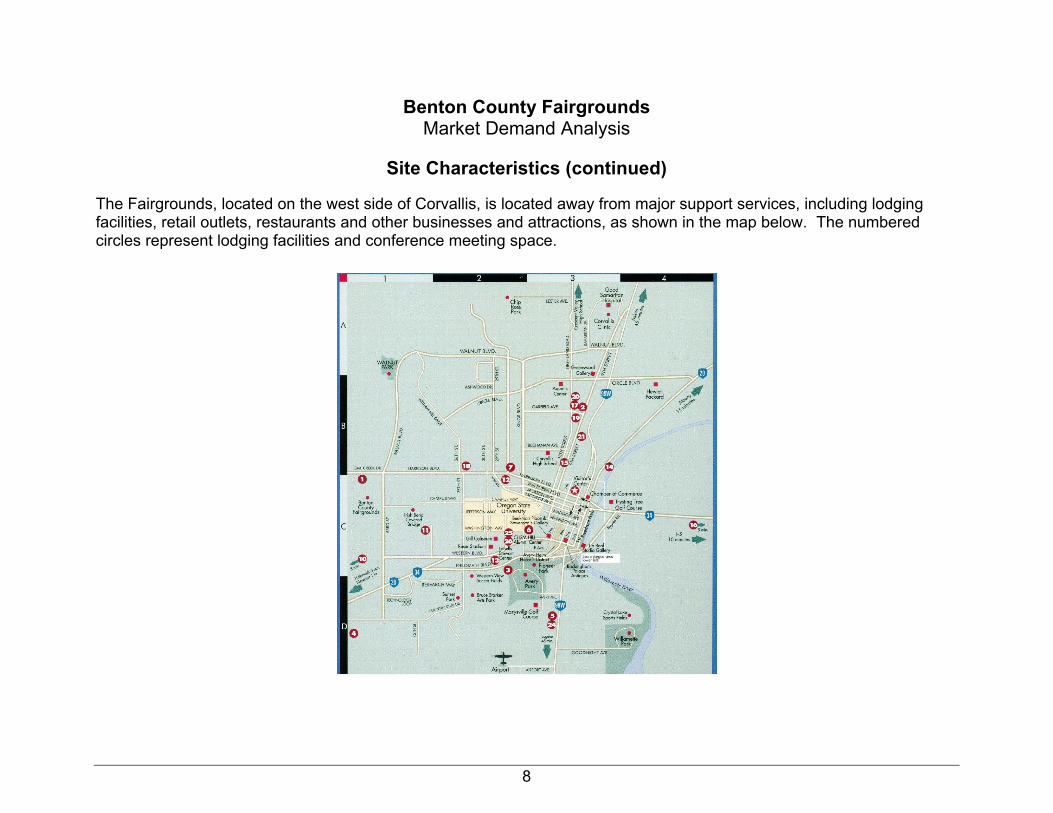
The Fairgrounds, located on the west side of Corvallis, is located away from major support services, including lodging facilities, retail outlets, restaurants and other businesses and attractions, as shown in the map below. The numbered circles represent lodging facilities and conference meeting space.
Benton County Fairgrounds Market Demand Analysis
9
Facilities and Structures
Major structures and features on the Fairgrounds include the following: Indoor Arena Auditorium Building Guerber Hall Carriage House Chapel Outdoor Arena Floral Courtyard
Horse Barns Cattle Barns Livestock Sheds RV Park Oak Grove Maintenance Building
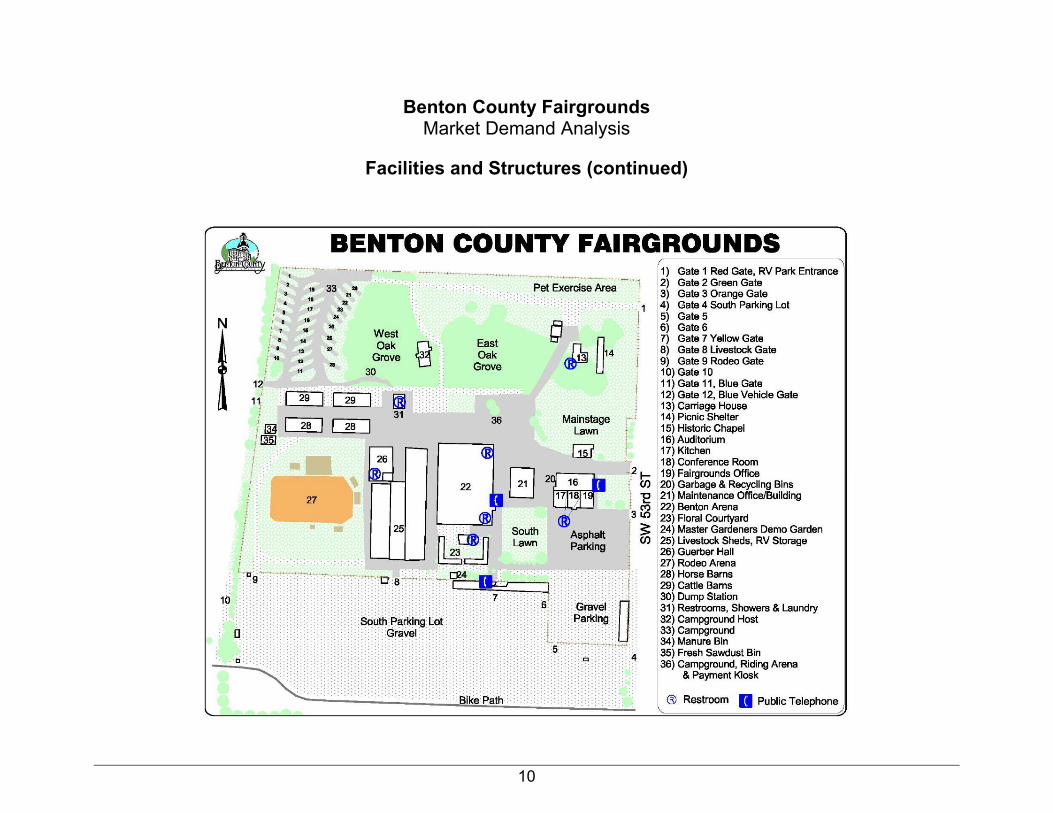
The map on the following page shows the approximate location of the major buildings, structures and features on the Fairgrounds property.
Benton County Fairgrounds Market Demand Analysis
10
Facilities and Structures (continued)
Benton County Fairgrounds Market Demand Analysis
11
Facilities and Structures (continued)
Indoor Arena The Indoor Arena is a 33,000 square foot building, built in 1970. This arena has a dirt floor ring (about 20,000 square feet) and an adjacent concrete apron (8,000 square feet) used for placement of bleacher seats or flat exhibit space. The arena is primarily used for horse practices (private, 4-H, OSU Polo, etc.) and horse related events (clinics, rodeos, etc.). Other uses include a few large consumer/public shows, circuses and some dog shows. During the annual Benton County Fair, this building is used for commercial exhibits. For dirt events, the Indoor Arena ring size is 100’ x 200’. Other amenities of this building include a concession stand, a 700 bleacher seat capacity, and two sets of rest rooms. The Indoor Arena has significant deferred maintenance and no heating or air conditioning. In 2004, the lights were replaced, creating a much better lighting of the arena. Auditorium Building Located on the east side of the Fairgrounds, the Auditorium Building is a 8,500 to 9,000 square foot, concrete block building, with 4 defined sections – Auditorium, Conference Room, Kitchen and Fairgrounds Office. The Auditorium is the largest section of this building (about 6,000 gross square feet), comprised of a large open, flat floor space, plus a small concession area, ticket office and access to rest rooms. This building has heat but no air conditioning. The Auditorium is used for banquets, receptions, meetings, consumer and public shows, 4-H, indoor archery, parties, dances and similar activities. During the annual Fair, the Auditorium Building is used for arts and crafts displays. The Conference Room, approximately 1,400 square feet, is accessed via an outside door, as well as by two separate entries from the Auditorium. This part of the building is used either in conjunction with events held in the Auditorium or for stand-alone activities, including meetings, banquets, parties, 4-H clubs and others. Adjacent to the Conference Room is a large kitchen facility that has stoves, refrigerators, sinks and work areas. The kitchen is rented in conjunction with meal activities in the Auditorium or Conference Room – banquets, receptions, dances and the like.
Benton County Fairgrounds Market Demand Analysis
12
Facilities and Structures (continued)
Guerber Hall Recently renovated, Guerber Hall is situated on the west side of the Indoor Arena and Livestock Sheds. This 4,300 square foot, metal-skinned building includes a large exhibition space, a small meeting room, rest rooms and small kitchen. In addition to regular entry doors, this building has one large overhead door for load-in/load-out access. Guerber Hall is used for parties, receptions, dog obedience classes, animal events and a community food drive. Guerber Hall houses animal exhibits during the annual Fair. Carriage House Originally built in 1895 and reassembled on the Fairgrounds in 1992, this 2-story structure has been refurbished with newer materials. The interior is modern with heat and air conditioning and 2 stoves in a small kitchen area. The main floor is about 600 square feet in size and the upper floor is about 790 square feet in size. The Carriage House is used for wedding receptions, parties, meetings and an annual retail fund raiser. During the annual Fair, the Carriage House serves as administrative offices. Chapel Built in the 1800s, this structure is very run down and marginally useable. On occasion it is used for dog obedience classes. During the Fair, the Chapel is used for lost and found and security. Outdoor Arena Located on the western side of the Fairgrounds, the Outdoor Arena is an uncovered ring of about 24,000 square feet with surrounding bleacher seating, announcer booth and holding pens. Used principally during the Fair, the outdoor arena has significant water drainage problems.
Benton County Fairgrounds Market Demand Analysis
13
Facilities and Structures (continued)
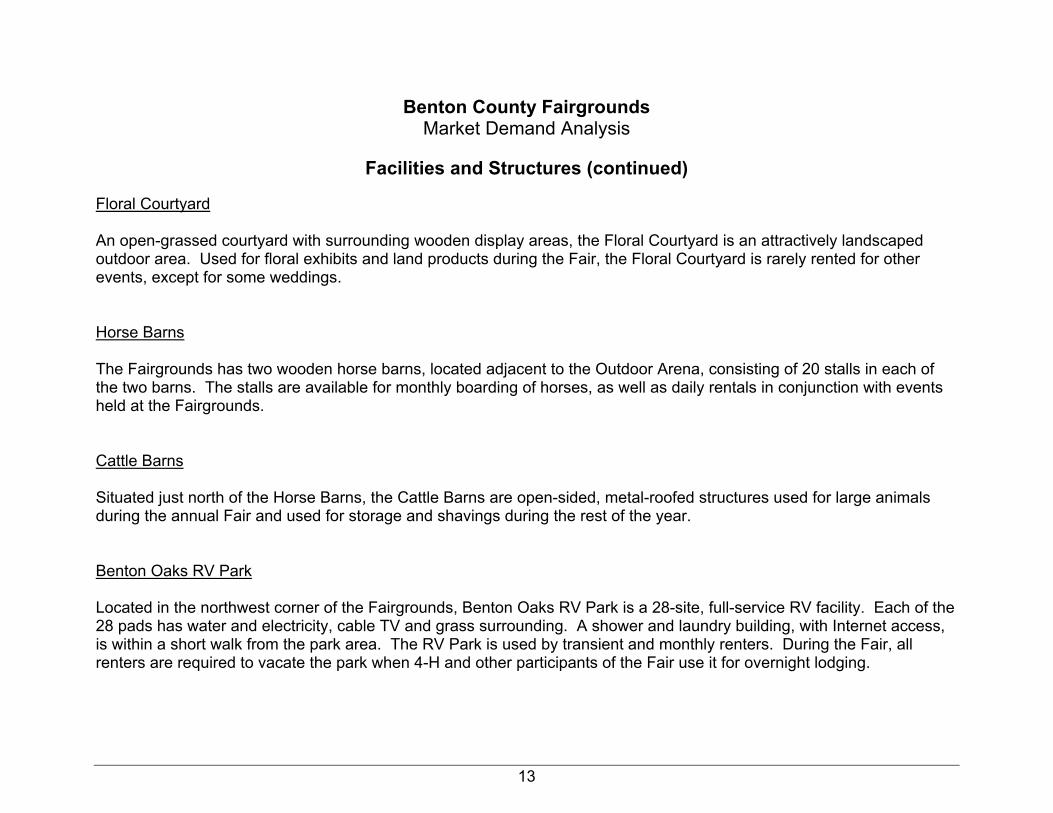
Floral Courtyard An open-grassed courtyard with surrounding wooden display areas, the Floral Courtyard is an attractively landscaped outdoor area. Used for floral exhibits and land products during the Fair, the Floral Courtyard is rarely rented for other events, except for some weddings. Horse Barns The Fairgrounds has two wooden horse barns, located adjacent to the Outdoor Arena, consisting of 20 stalls in each of the two barns. The stalls are available for monthly boarding of horses, as well as daily rentals in conjunction with events held at the Fairgrounds. Cattle Barns Situated just north of the Horse Barns, the Cattle Barns are open-sided, metal-roofed structures used for large animals during the annual Fair and used for storage and shavings during the rest of the year. Benton Oaks RV Park Located in the northwest corner of the Fairgrounds, Benton Oaks RV Park is a 28-site, full-service RV facility. Each of the 28 pads has water and electricity, cable TV and grass surrounding. A shower and laundry building, with Internet access, is within a short walk from the park area. The RV Park is used by transient and monthly renters. During the Fair, all renters are required to vacate the park when 4-H and other participants of the Fair use it for overnight lodging.
Benton County Fairgrounds Market Demand Analysis
14
Facilities and Structures (continued)
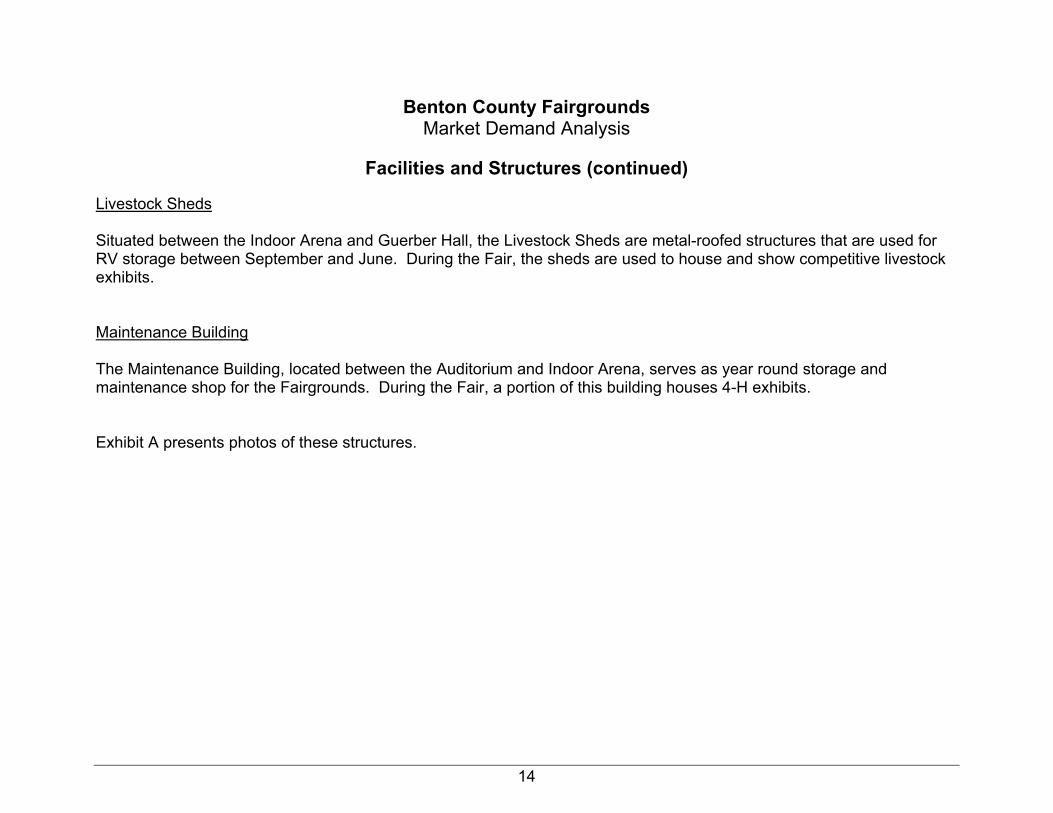
Livestock Sheds Situated between the Indoor Arena and Guerber Hall, the Livestock Sheds are metal-roofed structures that are used for RV storage between September and June. During the Fair, the sheds are used to house and show competitive livestock exhibits. Maintenance Building The Maintenance Building, located between the Auditorium and Indoor Arena, serves as year round storage and maintenance shop for the Fairgrounds. During the Fair, a portion of this building houses 4-H exhibits. Exhibit A presents photos of these structures.
Benton County Fairgrounds Market Demand Analysis
15
Facilities and Structures (continued)
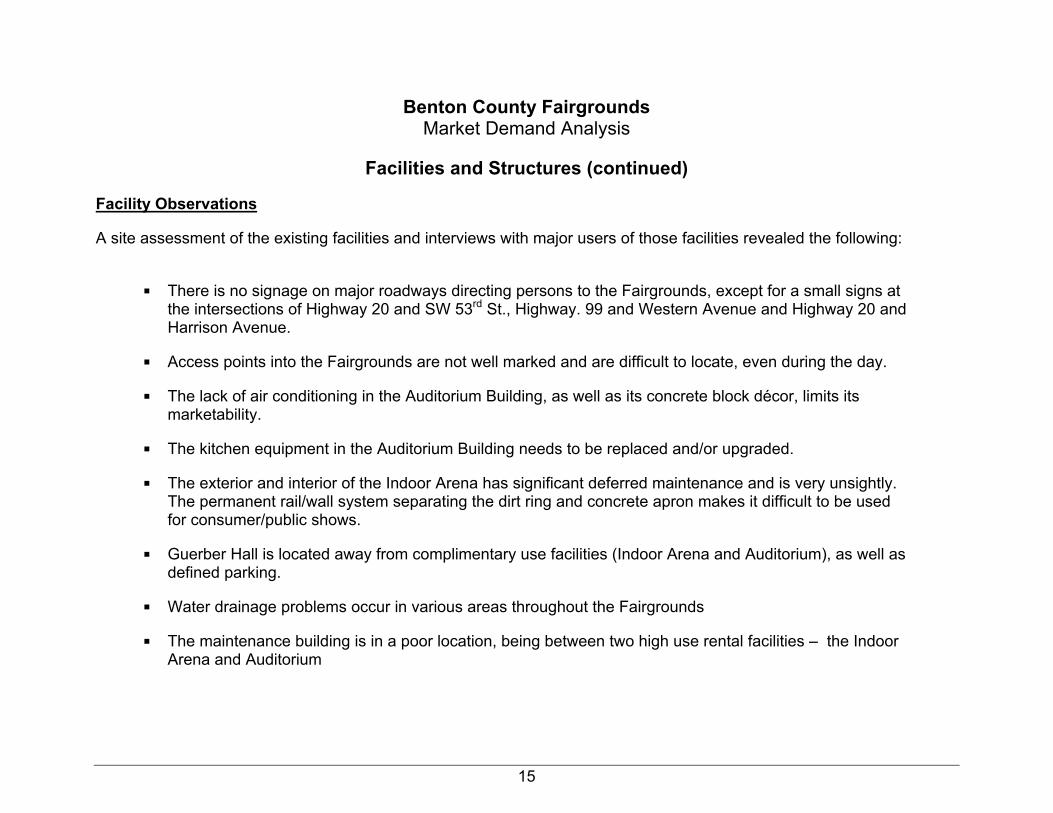
Facility Observations
A site assessment of the existing facilities and interviews with major users of those facilities revealed the following:
■ There is no signage on major roadways directing persons to the Fairgrounds, except for a small signs at
the intersections of Highway 20 and SW 53rd St., Highway. 99 and Western Avenue and Highway 20 and Harrison Avenue.
■ Access points into the Fairgrounds are not well marked and are difficult to locate, even during the day.
■ The lack of air conditioning in the Auditorium Building, as well as its concrete block décor, limits its marketability.
■ The kitchen equipment in the Auditorium Building needs to be replaced and/or upgraded.
■ The exterior and interior of the Indoor Arena has significant deferred maintenance and is very unsightly. The permanent rail/wall system separating the dirt ring and concrete apron makes it difficult to be used for consumer/public shows.
■ Guerber Hall is located away from complimentary use facilities (Indoor Arena and Auditorium), as well as defined parking.
■ Water drainage problems occur in various areas throughout the Fairgrounds
■ The maintenance building is in a poor location, being between two high use rental facilities – the Indoor Arena and Auditorium
Benton County Fairgrounds Market Demand Analysis
16
Usage Trends
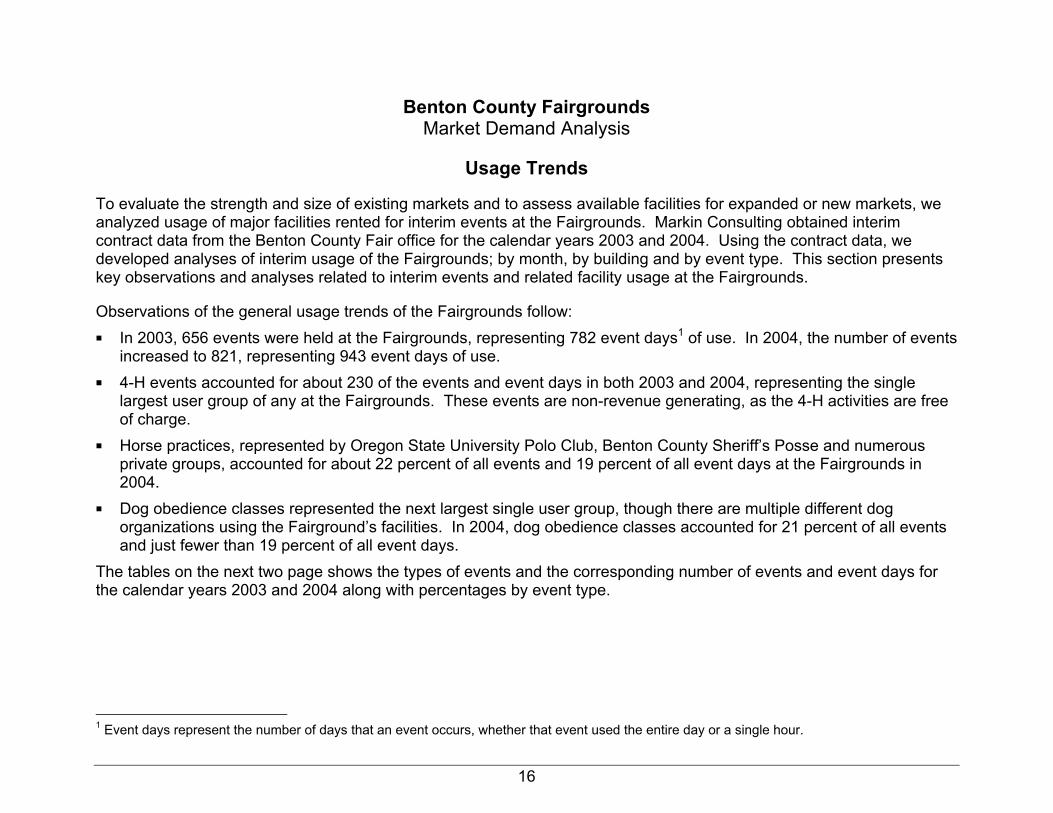
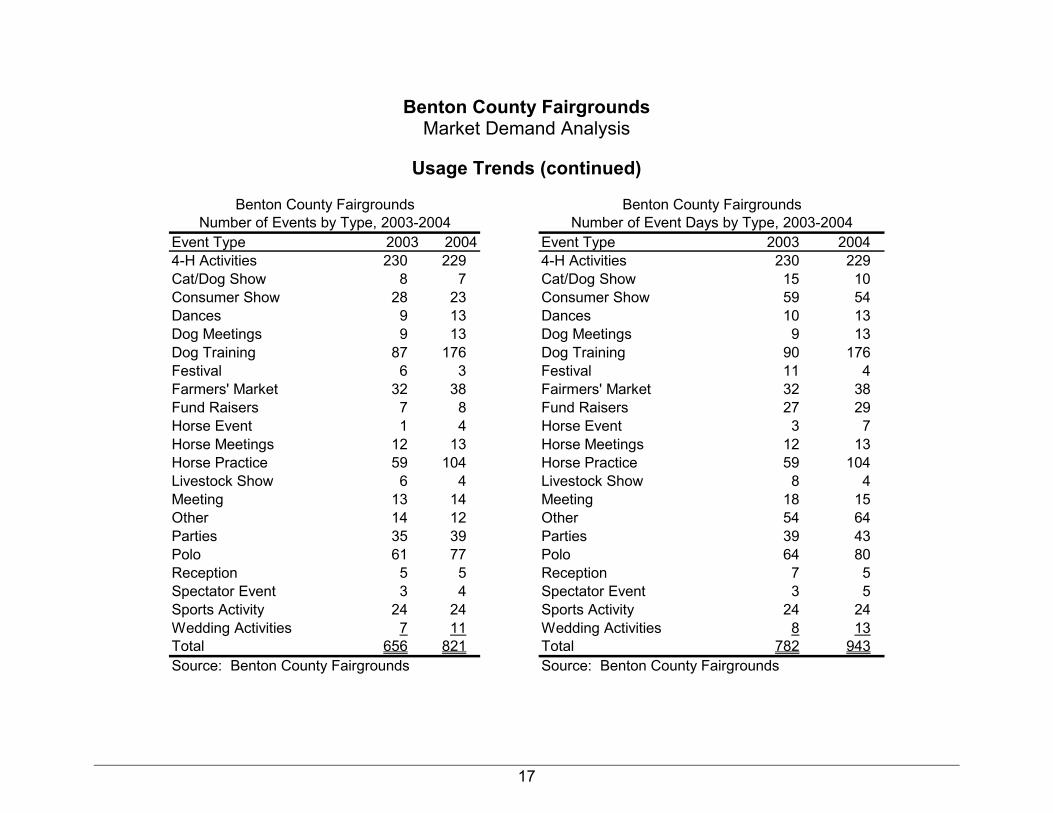
To evaluate the strength and size of existing markets and to assess available facilities for expanded or new markets, we analyzed usage of major facilities rented for interim events at the Fairgrounds. Markin Consulting obtained interim contract data from the Benton County Fair office for the calendar years 2003 and 2004. Using the contract data, we developed analyses of interim usage of the Fairgrounds; by month, by building and by event type. This section presents key observations and analyses related to interim events and related facility usage at the Fairgrounds.
Observations of the general usage trends of the Fairgrounds follow: ■ In 2003, 656 events were held at the Fairgrounds, representing 782 event days1 of use. In 2004, the number of events
increased to 821, representing 943 event days of use. ■ 4-H events accounted for about 230 of the events and event days in both 2003 and 2004, representing the single
largest user group of any at the Fairgrounds. These events are non-revenue generating, as the 4-H activities are free of charge.
■ Horse practices, represented by Oregon State University Polo Club, Benton County Sheriff’s Posse and numerous private groups, accounted for about 22 percent of all events and 19 percent of all event days at the Fairgrounds in 2004.
■ Dog obedience classes represented the next largest single user group, though there are multiple different dog organizations using the Fairground’s facilities. In 2004, dog obedience classes accounted for 21 percent of all events and just fewer than 19 percent of all event days.
The tables on the next two page shows the types of events and the corresponding number of events and event days for the calendar years 2003 and 2004 along with percentages by event type.
1 Event days represent the number of days that an event occurs, whether that event used the entire day or a single hour.
Benton County Fairgrounds Market Demand Analysis
17
Usage Trends (continued)
Event Type 2003 2004 Event Type 2003 20044-H Activities 230 229 4-H Activities 230 229Cat/Dog Show 8 7 Cat/Dog Show 15 10Consumer Show 28 23 Consumer Show 59 54Dances 9 13 Dances 10 13Dog Meetings 9 13 Dog Meetings 9 13Dog Training 87 176 Dog Training 90 176Festival 6 3 Festival 11 4Farmers' Market 32 38 Fairmers' Market 32 38Fund Raisers 7 8 Fund Raisers 27 29Horse Event 1 4 Horse Event 3 7Horse Meetings 12 13 Horse Meetings 12 13Horse Practice 59 104 Horse Practice 59 104Livestock Show 6 4 Livestock Show 8 4Meeting 13 14 Meeting 18 15Other 14 12 Other 54 64Parties 35 39 Parties 39 43Polo 61 77 Polo 64 80Reception 5 5 Reception 7 5Spectator Event 3 4 Spectator Event 3 5Sports Activity 24 24 Sports Activity 24 24Wedding Activities 7 11 Wedding Activities 8 13Total 656 821 Total 782 943Source: Benton County Fairgrounds Source: Benton County Fairgrounds
Benton County Fairgrounds Benton County FairgroundsNumber of Events by Type, 2003-2004 Number of Event Days by Type, 2003-2004
Benton County Fairgrounds Market Demand Analysis
18
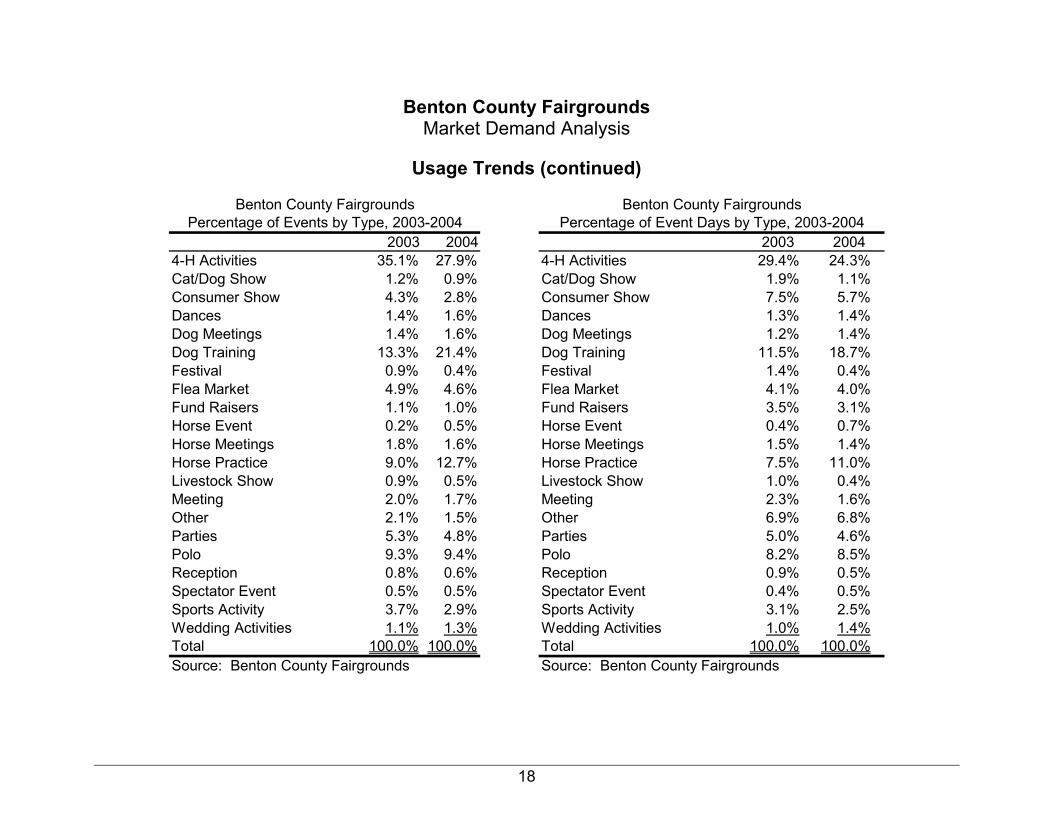
Usage Trends (continued)
2003 2004 2003 20044-H Activities 35.1% 27.9% 4-H Activities 29.4% 24.3%Cat/Dog Show 1.2% 0.9% Cat/Dog Show 1.9% 1.1%Consumer Show 4.3% 2.8% Consumer Show 7.5% 5.7%Dances 1.4% 1.6% Dances 1.3% 1.4%Dog Meetings 1.4% 1.6% Dog Meetings 1.2% 1.4%Dog Training 13.3% 21.4% Dog Training 11.5% 18.7%Festival 0.9% 0.4% Festival 1.4% 0.4%Flea Market 4.9% 4.6% Flea Market 4.1% 4.0%Fund Raisers 1.1% 1.0% Fund Raisers 3.5% 3.1%Horse Event 0.2% 0.5% Horse Event 0.4% 0.7%Horse Meetings 1.8% 1.6% Horse Meetings 1.5% 1.4%Horse Practice 9.0% 12.7% Horse Practice 7.5% 11.0%Livestock Show 0.9% 0.5% Livestock Show 1.0% 0.4%Meeting 2.0% 1.7% Meeting 2.3% 1.6%Other 2.1% 1.5% Other 6.9% 6.8%Parties 5.3% 4.8% Parties 5.0% 4.6%Polo 9.3% 9.4% Polo 8.2% 8.5%Reception 0.8% 0.6% Reception 0.9% 0.5%Spectator Event 0.5% 0.5% Spectator Event 0.4% 0.5%Sports Activity 3.7% 2.9% Sports Activity 3.1% 2.5%Wedding Activities 1.1% 1.3% Wedding Activities 1.0% 1.4%Total 100.0% 100.0% Total 100.0% 100.0%
Percentage of Events by Type, 2003-2004 Percentage of Event Days by Type, 2003-2004
Source: Benton County Fairgrounds Source: Benton County Fairgrounds
Benton County Fairgrounds Benton County Fairgrounds
Benton County Fairgrounds Market Demand Analysis
19
Usage Trends (continued)
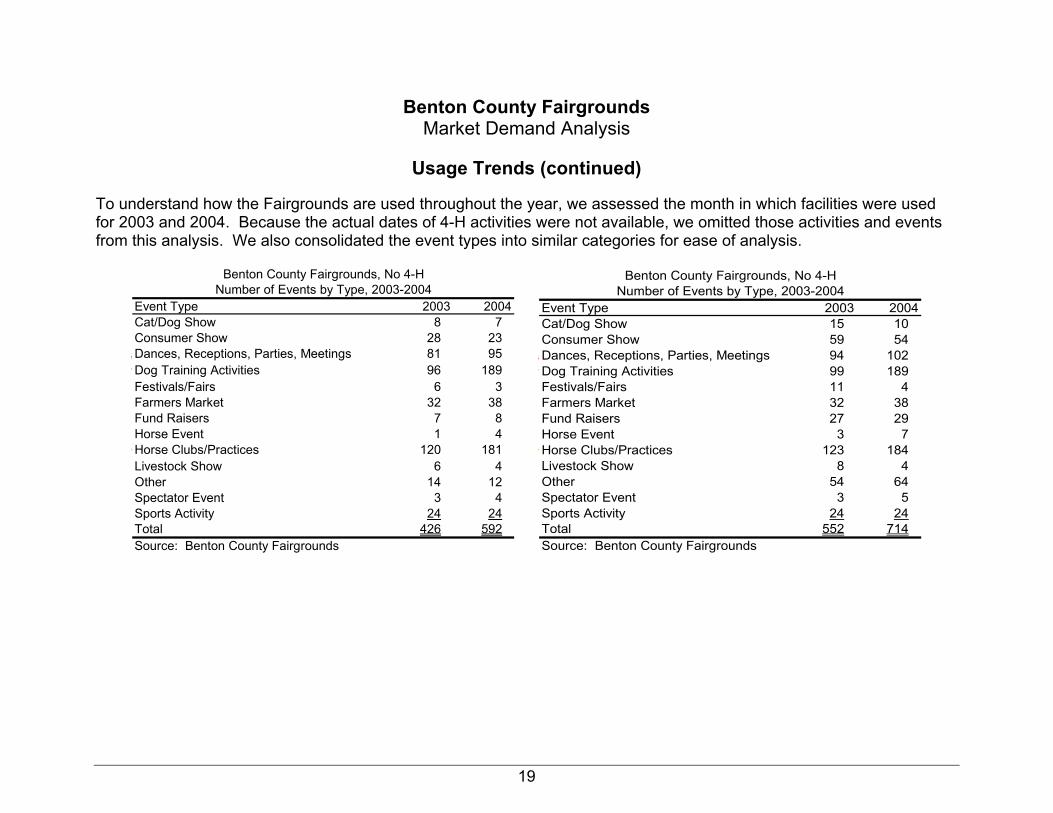
To understand how the Fairgrounds are used throughout the year, we assessed the month in which facilities were used for 2003 and 2004. Because the actual dates of 4-H activities were not available, we omitted those activities and events from this analysis. We also consolidated the event types into similar categories for ease of analysis.
Event Type 2003 2004Cat/Dog Show 8 7Consumer Show 28 23Dances, Receptions, Parties, Meetings 81 95Dog Training Activities 96 189Festivals/Fairs 6 3Farmers Market 32 38Fund Raisers 7 8Horse Event 1 4Horse Clubs/Practices 120 181Livestock Show 6 4Other 14 12Spectator Event 3 4Sports Activity 24 24Total 426 592Source: Benton County Fairgrounds
Number of Events by Type, 2003-2004Benton County Fairgrounds, No 4-H
Event Type 2003 2004Cat/Dog Show 15 10Consumer Show 59 54Dances, Receptions, Parties, Meetings 94 102Dog Training Activities 99 189Festivals/Fairs 11 4Farmers Market 32 38Fund Raisers 27 29Horse Event 3 7Horse Clubs/Practices 123 184Livestock Show 8 4Other 54 64Spectator Event 3 5Sports Activity 24 24Total 552 714Source: Benton County Fairgrounds
Benton County Fairgrounds, No 4-HNumber of Events by Type, 2003-2004
Benton County Fairgrounds Market Demand Analysis
20
Usage Trends (continued)
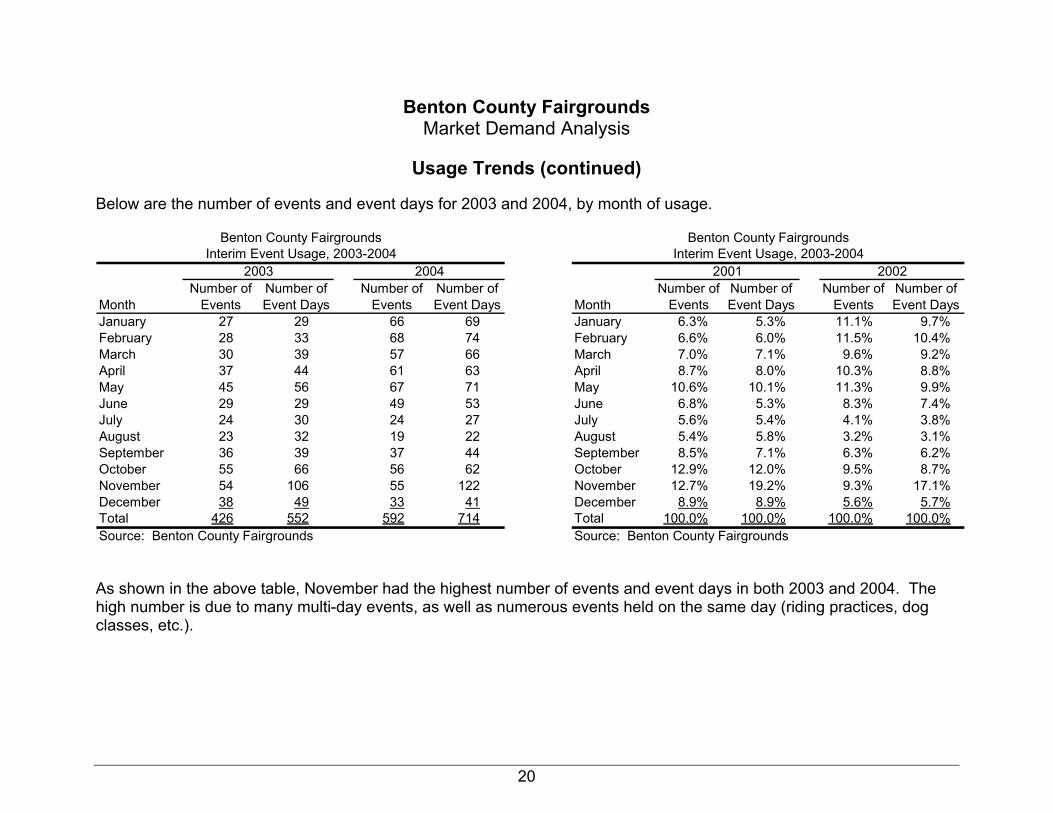
Below are the number of events and event days for 2003 and 2004, by month of usage.
MonthNumber of
EventsNumber of Event Days
Number of Events
Number of Event Days Month
Number of Events
Number of Event Days
Number of Events
Number of Event Days
January 27 29 66 69 January 6.3% 5.3% 11.1% 9.7%February 28 33 68 74 February 6.6% 6.0% 11.5% 10.4%March 30 39 57 66 March 7.0% 7.1% 9.6% 9.2%April 37 44 61 63 April 8.7% 8.0% 10.3% 8.8%May 45 56 67 71 May 10.6% 10.1% 11.3% 9.9%June 29 29 49 53 June 6.8% 5.3% 8.3% 7.4%July 24 30 24 27 July 5.6% 5.4% 4.1% 3.8%August 23 32 19 22 August 5.4% 5.8% 3.2% 3.1%September 36 39 37 44 September 8.5% 7.1% 6.3% 6.2%October 55 66 56 62 October 12.9% 12.0% 9.5% 8.7%November 54 106 55 122 November 12.7% 19.2% 9.3% 17.1%December 38 49 33 41 December 8.9% 8.9% 5.6% 5.7%Total 426 552 592 714 Total 100.0% 100.0% 100.0% 100.0%Source: Benton County Fairgrounds Source: Benton County Fairgrounds
Benton County FairgroundsInterim Event Usage, 2003-2004
2001 2002
Benton County FairgroundsInterim Event Usage, 2003-2004
2003 2004
As shown in the above table, November had the highest number of events and event days in both 2003 and 2004. The high number is due to many multi-day events, as well as numerous events held on the same day (riding practices, dog classes, etc.).
Benton County Fairgrounds Market Demand Analysis
21
Usage Trends (continued)
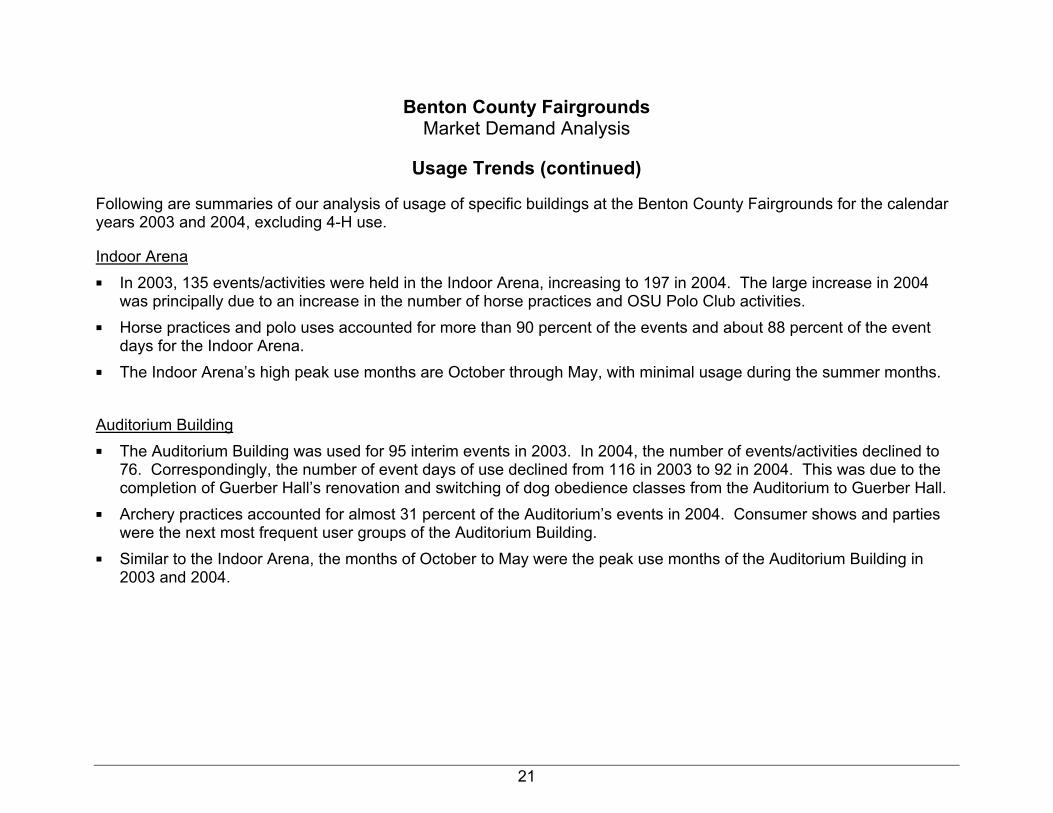
Following are summaries of our analysis of usage of specific buildings at the Benton County Fairgrounds for the calendar years 2003 and 2004, excluding 4-H use.
Indoor Arena ■ In 2003, 135 events/activities were held in the Indoor Arena, increasing to 197 in 2004. The large increase in 2004
was principally due to an increase in the number of horse practices and OSU Polo Club activities. ■ Horse practices and polo uses accounted for more than 90 percent of the events and about 88 percent of the event
days for the Indoor Arena. ■ The Indoor Arena’s high peak use months are October through May, with minimal usage during the summer months. Auditorium Building ■ The Auditorium Building was used for 95 interim events in 2003. In 2004, the number of events/activities declined to
76. Correspondingly, the number of event days of use declined from 116 in 2003 to 92 in 2004. This was due to the completion of Guerber Hall’s renovation and switching of dog obedience classes from the Auditorium to Guerber Hall.
■ Archery practices accounted for almost 31 percent of the Auditorium’s events in 2004. Consumer shows and parties were the next most frequent user groups of the Auditorium Building.
■ Similar to the Indoor Arena, the months of October to May were the peak use months of the Auditorium Building in 2003 and 2004.
Benton County Fairgrounds Market Demand Analysis
22
Usage Trends (continued)
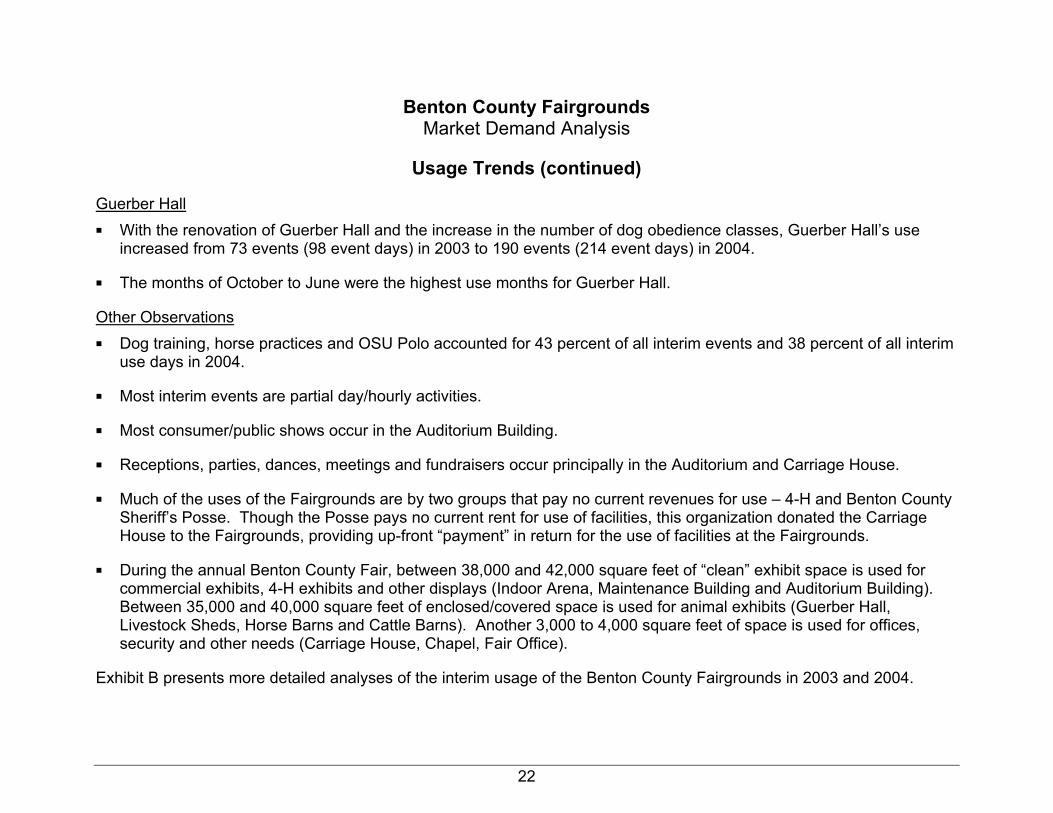
Guerber Hall ■ With the renovation of Guerber Hall and the increase in the number of dog obedience classes, Guerber Hall’s use
increased from 73 events (98 event days) in 2003 to 190 events (214 event days) in 2004.
■ The months of October to June were the highest use months for Guerber Hall.
Other Observations ■ Dog training, horse practices and OSU Polo accounted for 43 percent of all interim events and 38 percent of all interim
use days in 2004.
■ Most interim events are partial day/hourly activities.
■ Most consumer/public shows occur in the Auditorium Building.
■ Receptions, parties, dances, meetings and fundraisers occur principally in the Auditorium and Carriage House.
■ Much of the uses of the Fairgrounds are by two groups that pay no current revenues for use – 4-H and Benton County Sheriff’s Posse. Though the Posse pays no current rent for use of facilities, this organization donated the Carriage House to the Fairgrounds, providing up-front “payment” in return for the use of facilities at the Fairgrounds.
■ During the annual Benton County Fair, between 38,000 and 42,000 square feet of “clean” exhibit space is used for commercial exhibits, 4-H exhibits and other displays (Indoor Arena, Maintenance Building and Auditorium Building). Between 35,000 and 40,000 square feet of enclosed/covered space is used for animal exhibits (Guerber Hall, Livestock Sheds, Horse Barns and Cattle Barns). Another 3,000 to 4,000 square feet of space is used for offices, security and other needs (Carriage House, Chapel, Fair Office).
Exhibit B presents more detailed analyses of the interim usage of the Benton County Fairgrounds in 2003 and 2004.
Benton County Fairgrounds Market Demand Analysis
23
Economic and Demographic Trends
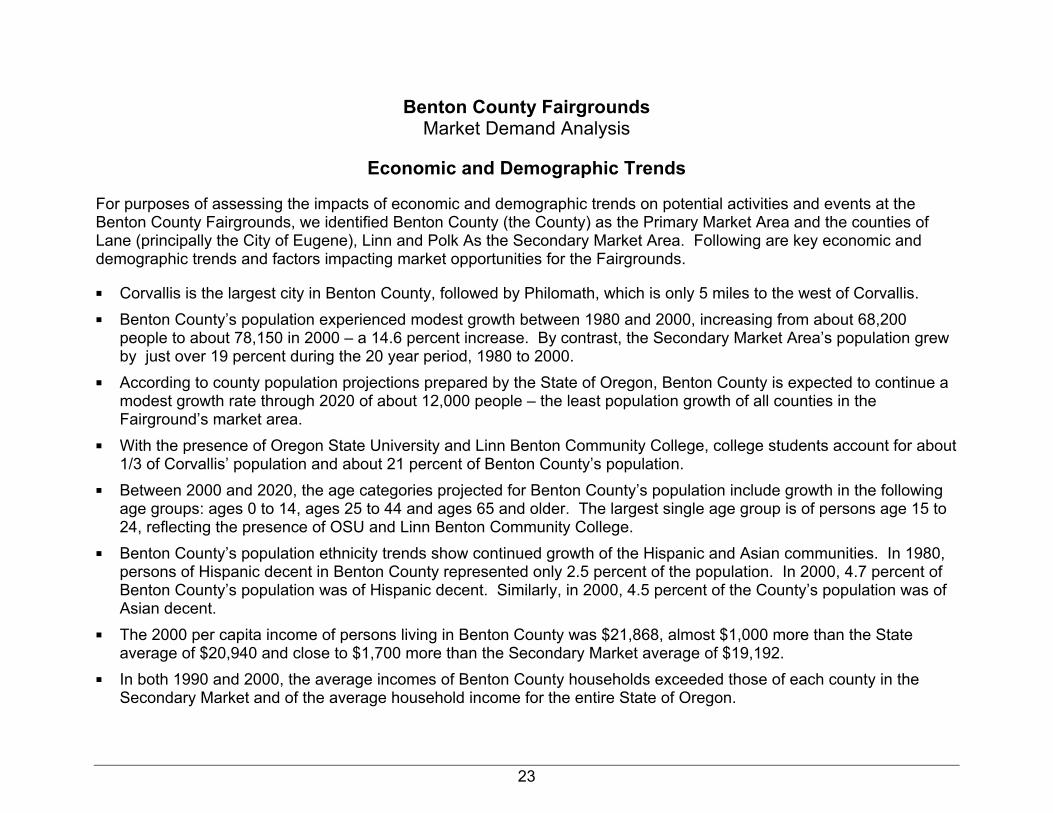
For purposes of assessing the impacts of economic and demographic trends on potential activities and events at the Benton County Fairgrounds, we identified Benton County (the County) as the Primary Market Area and the counties of Lane (principally the City of Eugene), Linn and Polk As the Secondary Market Area. Following are key economic and demographic trends and factors impacting market opportunities for the Fairgrounds.
■ Corvallis is the largest city in Benton County, followed by Philomath, which is only 5 miles to the west of Corvallis. ■ Benton County’s population experienced modest growth between 1980 and 2000, increasing from about 68,200
people to about 78,150 in 2000 – a 14.6 percent increase. By contrast, the Secondary Market Area’s population grew by just over 19 percent during the 20 year period, 1980 to 2000.
■ According to county population projections prepared by the State of Oregon, Benton County is expected to continue a modest growth rate through 2020 of about 12,000 people – the least population growth of all counties in the Fairground’s market area.
■ With the presence of Oregon State University and Linn Benton Community College, college students account for about 1/3 of Corvallis’ population and about 21 percent of Benton County’s population.
■ Between 2000 and 2020, the age categories projected for Benton County’s population include growth in the following age groups: ages 0 to 14, ages 25 to 44 and ages 65 and older. The largest single age group is of persons age 15 to 24, reflecting the presence of OSU and Linn Benton Community College.
■ Benton County’s population ethnicity trends show continued growth of the Hispanic and Asian communities. In 1980, persons of Hispanic decent in Benton County represented only 2.5 percent of the population. In 2000, 4.7 percent of Benton County’s population was of Hispanic decent. Similarly, in 2000, 4.5 percent of the County’s population was of Asian decent.
■ The 2000 per capita income of persons living in Benton County was $21,868, almost $1,000 more than the State average of $20,940 and close to $1,700 more than the Secondary Market average of $19,192.
■ In both 1990 and 2000, the average incomes of Benton County households exceeded those of each county in the Secondary Market and of the average household income for the entire State of Oregon.
Benton County Fairgrounds Market Demand Analysis
24
Economic and Demographic Trends (continued) ■ The labor force in Benton County increased from 39,893 in 1999 to 41,251 in October 2004. The unemployment rate
of Benton County has remained relatively low, compared with the State of Oregon’s average, ranging between 2.4 percent and 4.2 percent between 1999 and October 2004.
■ Benton County’s largest employer is Oregon State University, followed by Hewlett-Packard, Good Samaritan Hospital and Corvallis School District; representing a good mix of higher education, health care, technology and government operations.
Exhibit C presents detailed tables of these economic and demographic trends.
Benton County Fairgrounds Market Demand Analysis
25
Economic and Demographic Trends (continued)
In addition to reviewing economic and demographic data provided by the US Census Bureau and the State of Oregon, we obtained and reviewed PRIZM NE1 cluster reports for households within 5 and 15 mile radii of the Fairgrounds. Exhibit D presents a detailed description of the PRIZM cluster reports, along with detailed descriptions of each type of all 62 different household clusters used in the PRIZM analysis. A map showing the radius markers is shown in Exhibit E. Some of the highlights of the PRIZM reports are: ■ There are about 24,000 households within 5 miles of the Fairgrounds and another 24,000 households residing
between 5 and 15 miles of the Fairgrounds, including those within the City of Albany. ■ Within 15 miles of the Fairgrounds, 25 percent of the households fall into a cluster referred to as Micro-City Blues.
Micro-City Blues was created via the predominantly downscale residents living in the affordable housing found throughout the nation's smaller cities. A diverse social group, these five segments contain a mix of old and young, singles and widowers, whites, African-Americans and Hispanics. Most of the workers hold blue-collar jobs–hence the name–and their marketplace behaviors reflect the segments' varied lifestyles. This is one of the few social groups where consumers have a high index for video games and bingo, aerobic exercise and fishing, BET and the Country Music Network. Household incomes for this cluster segment range from $22,000 to just under $30,000 per year.
■ The next largest cluster within 15 miles of the Fairgrounds is called the City Centers (24 percent of the households within 15 miles). The segments in the City Centers social group consist of a mix of Americans–old and young, homeowners and renters, families and singles–who've settled in the nation's satellite cities. What they share is a middle-class status, some college educations and a lifestyle heavy on leisure and recreation. The members of City Centers tend to be big fans of home-centered activities: computer surfing, video renting, TV viewing and playing games and musical instruments. Outside their homes, they go to movies, museums and bowling alleys at high rates. Average household incomes for this cluster range from $37,000 to $48,000.
1 Prepared by Claritas, Inc., 2005
Benton County Fairgrounds Market Demand Analysis
26
Economic and Demographic Trends (continued) ■ The third largest cluster within 15 miles of the Fairgrounds, representing almost 13 percent of the households, is called
Landed Gentry. Widely scattered throughout the nation, the segments in the Landed Gentry social group consist of wealthy Americans who migrated to the smaller boomtowns beyond the nation's beltways. Many of the households contain Boomer families and couples with college degrees, professional jobs–they're twice as likely as average Americans to telecommute–and expansive homes. With their upscale incomes, they can afford to spend heavily on consumer electronics, wireless and computer technology, luxury cars, powerboats, books and magazines, children's toys and exercise equipment. Household incomes in this cluster range between $77,000 and $98,000.
■ Country Comfort describes another cluster of household segments within 15 miles of the Fairgrounds, representing about 11 percent of all households in this radius. The segments in Country Comfort are filled with predominantly white, middle-class homeowners. In their placid towns and scenic bedroom communities, these Americans tend to be married, between the ages of 25 and 54, with or without children. They enjoy comfortable upscale lifestyles, exhibiting high indices for barbecuing, bar-hopping and playing golf as well as home-based activities such as gardening, woodworking and crafts. Reflecting their rural, family environment, they prefer trucks, SUVs and minivans to cars. Average household incomes range from the high $30K to mid $50k.
■ The last large group, called the 2nd City Society, is represented by about 8 percent of the households within 15 miles of the Fairgrounds. Among second-tier cities, Second City Society stands at the top of the heap, a social group consisting of the wealthiest families who live outside the nation's metropolitan core. The segments in this group are dominated with married couples with children, college degrees, large homes, and executive jobs. Ethnically, the residents are predominantly white with above-average rates of Asian Americans. In the marketplace, they spend big on digital and wireless technology, business and cultural media, casual-dining restaurants, upscale retailers, foreign travel and luxury cars. Household incomes range between $67,000 and $77,000 per year.
Benton County Fairgrounds Market Demand Analysis
27
Economic and Demographic Trends (continued)
Summary Observations
■ The modest population growth projections for the County (500 to 700 people per year through 2020) will limit the growth potential for new events and activities demanded by the resident population.
■ With OSU’s presence in Corvallis and the inherent nature of campus life and activities, it is doubtful that many events and activities could be tailored for college students at the Fairgrounds, except for a continuation of dances and parties already held there.
■ Larger population centers within the Fairgrounds market area (Albany, Eugene) have significant facilities which will limit the ability for events held at the Fairgrounds to attract persons from those areas.
■ Key interests of the households within 15 miles of the Fairgrounds include technology, outdoor recreation, entertainment, Internet, and family activities – all which could be exploited with consumer/public shows and other activities.
Benton County Fairgrounds Market Demand Analysis
28
Competitive and Comparable Facilities
To further assess the growth potential for non-fair events and activities, competitive and comparable facilities were identified, researched and analyzed. During the course of the study, we identified a number of potentially competitive facilities in Corvallis and the Willamette Valley that are used to stage events and activities similar to those identified for the Fairgrounds. The types of facilities we identified include the following:
■ Horse Facilities – These are facilities that are used for horse-related shows, events and activities.
■ Exhibition Facilities – These are facilities that are host to larger meetings, consumer shows, swap meets and similar events.
■ Arena and Spectator Facilities – These are facilities able to host horse shows and horse events, as well as ticketed events – concerts, sporting events, rodeos, and other spectator events.
■ Meeting and Banquet Facilities
■ RV Parks – Campgrounds/parks for transient use and for rallies and reunions.
This section presents a summary of our research and assessment of the impact of these competitive facilities.
Benton County Fairgrounds Market Demand Analysis
29
Competitive and Comparable Facilities (continued)
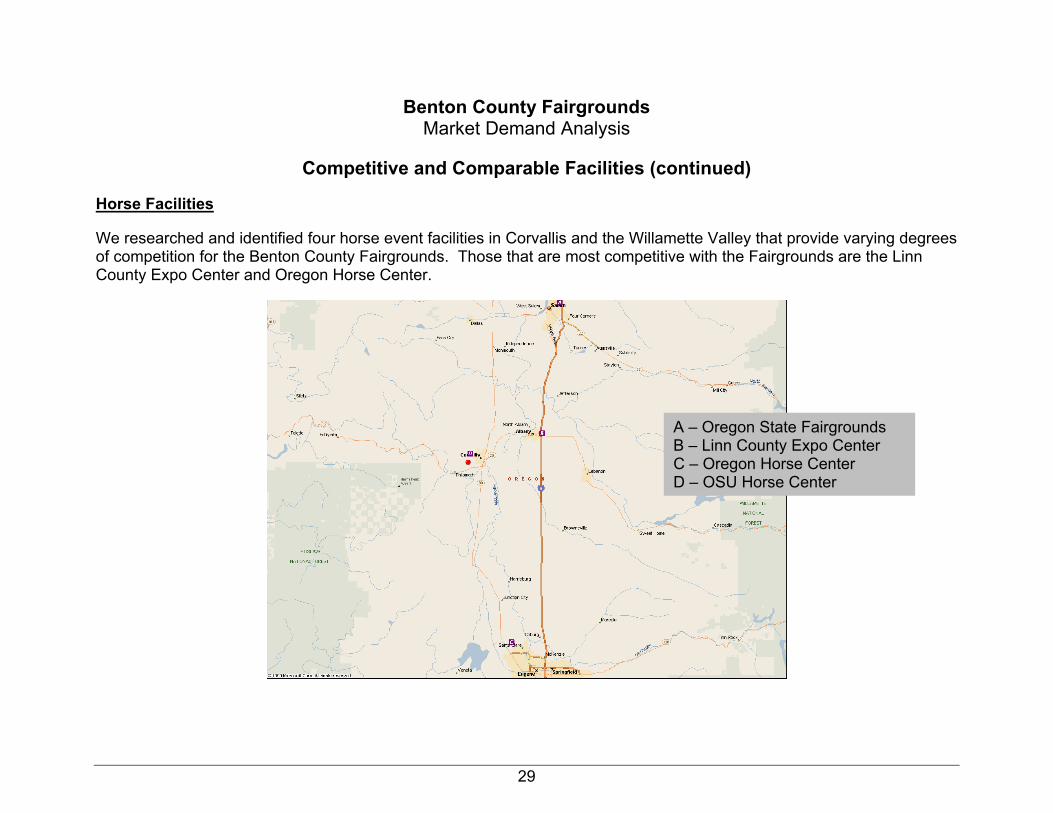
Horse Facilities
We researched and identified four horse event facilities in Corvallis and the Willamette Valley that provide varying degrees of competition for the Benton County Fairgrounds. Those that are most competitive with the Fairgrounds are the Linn County Expo Center and Oregon Horse Center.
A – Oregon State Fairgrounds B – Linn County Expo Center C – Oregon Horse Center D – OSU Horse Center
Benton County Fairgrounds Market Demand Analysis
30
Competitive and Comparable Facilities (continued)
Horse Facilities (continued)
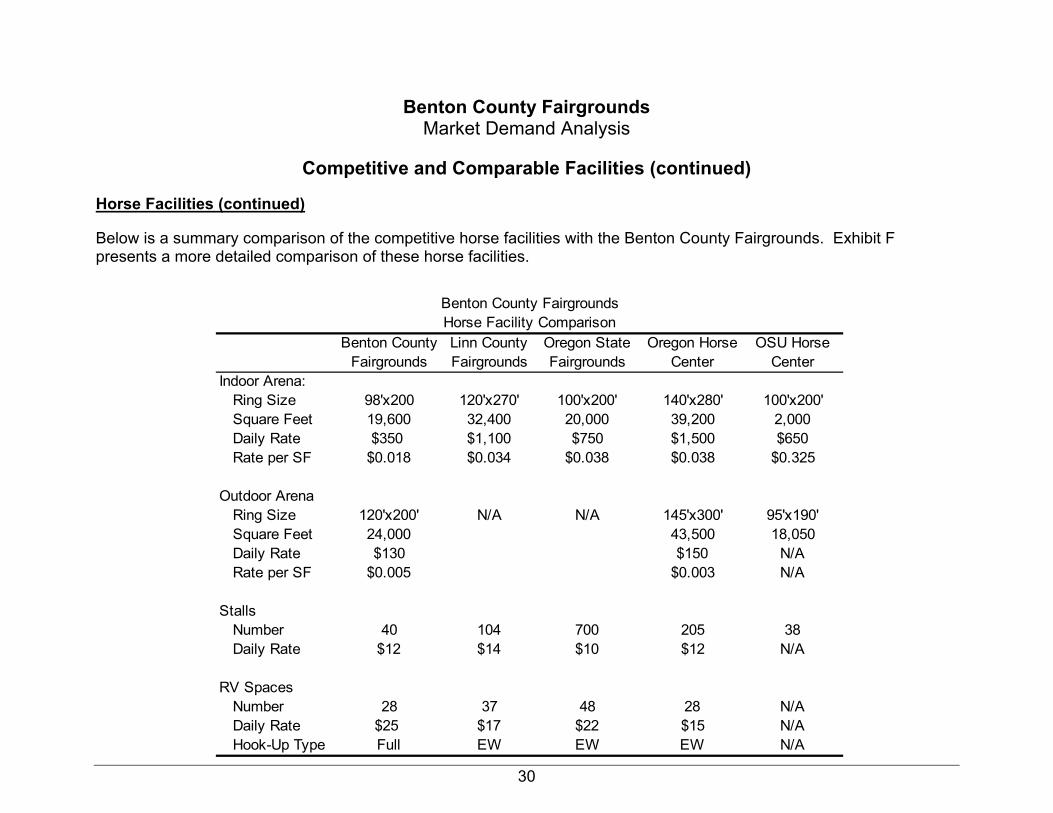
Below is a summary comparison of the competitive horse facilities with the Benton County Fairgrounds. Exhibit F presents a more detailed comparison of these horse facilities.
Benton County Linn County Oregon State Oregon Horse OSU HorseFairgrounds Fairgrounds Fairgrounds Center Center
Indoor Arena:Ring Size 98'x200 120'x270' 100'x200' 140'x280' 100'x200'Square Feet 19,600 32,400 20,000 39,200 2,000Daily Rate $350 $1,100 $750 $1,500 $650Rate per SF $0.018 $0.034 $0.038 $0.038 $0.325
Outdoor ArenaRing Size 120'x200' N/A N/A 145'x300' 95'x190'Square Feet 24,000 43,500 18,050Daily Rate $130 $150 N/ARate per SF $0.005 $0.003 N/A
StallsNumber 40 104 700 205 38Daily Rate $12 $14 $10 $12 N/A
RV SpacesNumber 28 37 48 28 N/ADaily Rate $25 $17 $22 $15 N/AHook-Up Type Full EW EW EW N/A
Benton County FairgroundsHorse Facility Comparison
Benton County Fairgrounds Market Demand Analysis
31
Competitive and Comparable Facilities (continued)
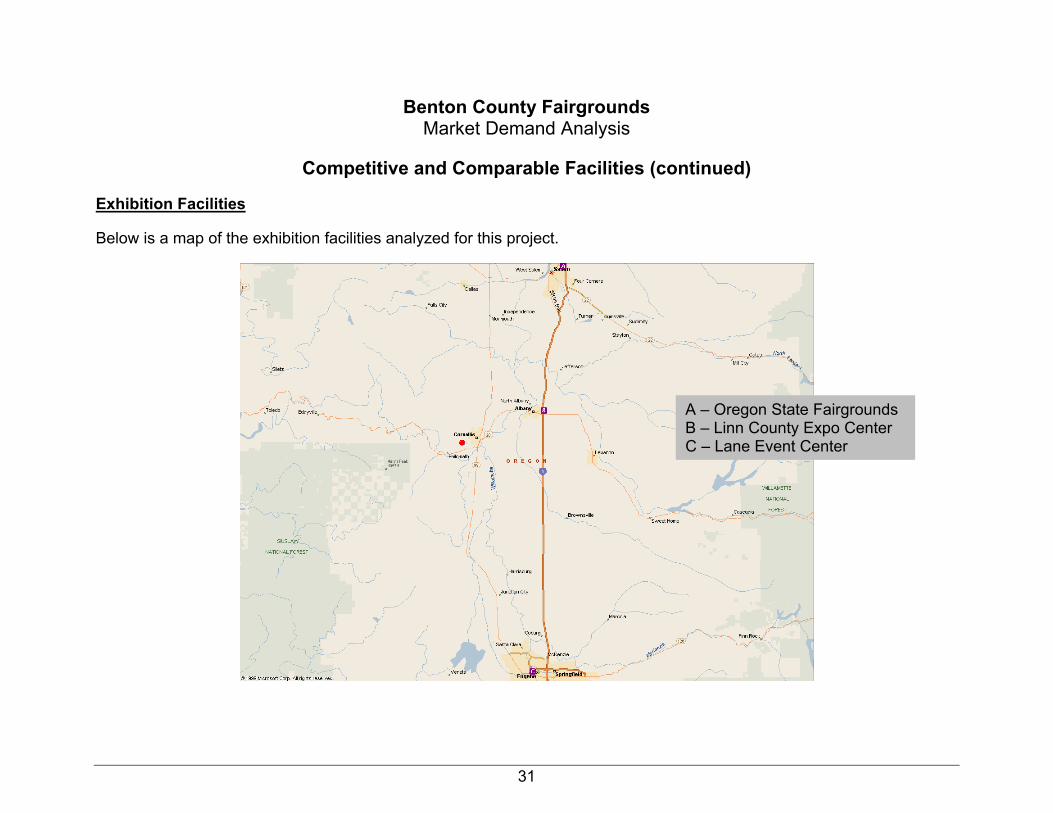
Exhibition Facilities
Below is a map of the exhibition facilities analyzed for this project.
A – Oregon State Fairgrounds B – Linn County Expo Center C – Lane Event Center
Benton County Fairgrounds Market Demand Analysis
32
Competitive and Comparable Facilities (continued)
Exhibition Facilities
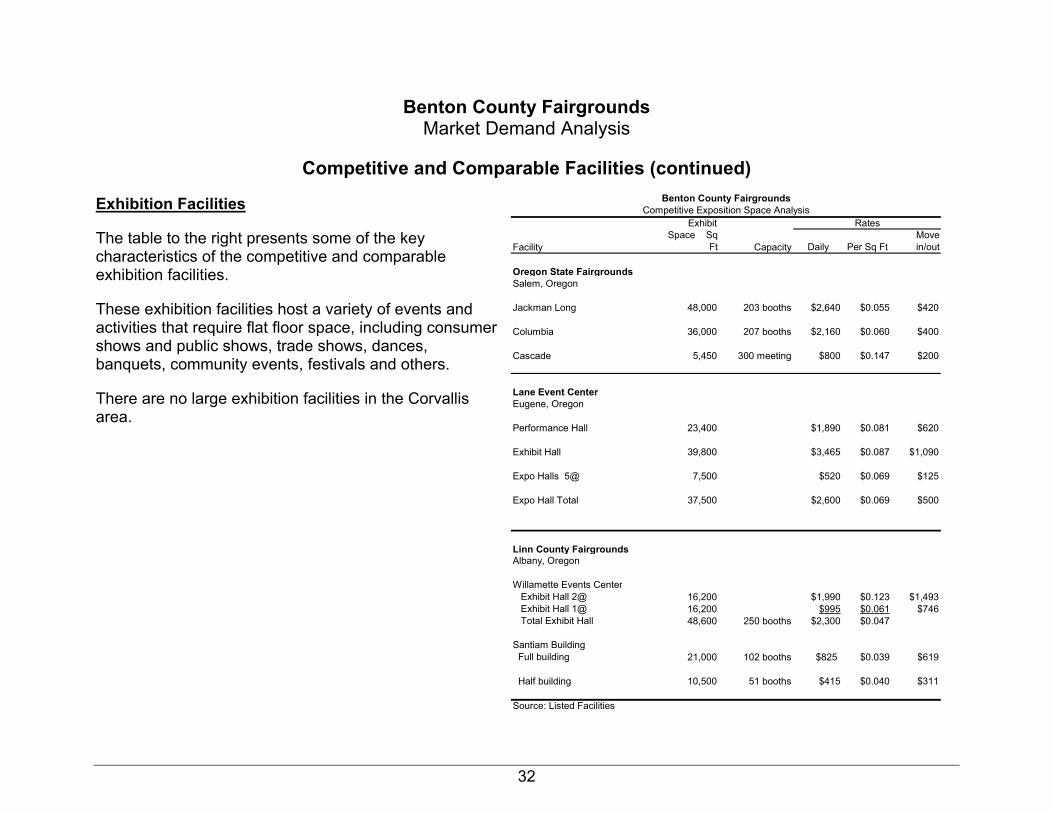
The table to the right presents some of the key characteristics of the competitive and comparable exhibition facilities.
These exhibition facilities host a variety of events and activities that require flat floor space, including consumer shows and public shows, trade shows, dances, banquets, community events, festivals and others.
There are no large exhibition facilities in the Corvallis area.
Exhibit Rates
FacilitySpace Sq
Ft Capacity Daily Per Sq FtMove in/out
Oregon State FairgroundsSalem, Oregon
Jackman Long 48,000 203 booths $2,640 $0.055 $420
Columbia 36,000 207 booths $2,160 $0.060 $400
Cascade 5,450 300 meeting $800 $0.147 $200
Lane Event CenterEugene, Oregon
Performance Hall 23,400 $1,890 $0.081 $620
Exhibit Hall 39,800 $3,465 $0.087 $1,090
Expo Halls 5@ 7,500 $520 $0.069 $125
Expo Hall Total 37,500 $2,600 $0.069 $500
Linn County FairgroundsAlbany, Oregon
Willamette Events CenterExhibit Hall 2@ 16,200 $1,990 $0.123 $1,493Exhibit Hall 1@ 16,200 $995 $0.061 $746Total Exhibit Hall 48,600 250 booths $2,300 $0.047
Santiam Building Full building 21,000 102 booths $825 $0.039 $619
Half building 10,500 51 booths $415 $0.040 $311
Source: Listed Facilities
Benton County FairgroundsCompetitive Exposition Space Analysis
Benton County Fairgrounds Market Demand Analysis
33
Competitive and Comparable Facilities (continued)
Spectator and Concert Facilities
Existing and proposed spectator facilities were researched and assessed as to their impact on the market potential for events and activities at the Fairgrounds. Three existing and one proposed spectator facilities were identified:
■ Gill Coliseum – OSU Campus, Corvallis ■ McArthur Court – University of Oregon Campus, Eugene ■ The Pavilion – Oregon State Fair and Exposition Center Campus, Salem ■ Proposed Pavilion – Corvallis Gill Coliseum Located on the campus of Oregon State University, Gill Coliseum is a 10,000 seat sports and spectator facility. Used principally for OSU sports (basketball and volleyball) and student related activities (i.e., concerts), Gill Coliseum is rarely available for rent by an outside promoter.
McArthur Court Located on the campus of the University of Oregon in Eugene, McArthur Court is a 7,600 seat sports arena, principally used for University of Oregon athletics and student activities/concerts. As an example, Sting will be in concert at McArthur Court in April 2005.
The Pavilion Opened in 2004, the Pavilion is a 5,000 fixed-seat arena facility located on the campus of the Oregon State Fair and Exposition Center in Salem, Oregon. This new facility hosts sporting activities, concerts, wheel events, family shows and other spectator events.
Benton County Fairgrounds Market Demand Analysis
34
Competitive and Comparable Facilities (continued)
Spectator and Concert Facilities (continued)
Proposed Pavilion A local landowner, Jack Brandis, has proposed the development of a multi-purpose arena-type facility, to be located on property bordering the western edge of the Fairgrounds. The concept for this facility envisions use by a variety of local organizations, including the Fairgrounds and the Oregon State University (Department of Animal Sciences). Events anticipated to be hosted at the proposed pavilion are concerts, equine events, livestock shows and a variety of spectator events. Size, amenities, ownership and management of this proposed facility have not yet been determined. Our assessment of this concept, as well as discussions with both OSU and Fairgrounds personnel, revealed the following:
OSU officials indicated strong support for a University owned and controlled animal sciences facility that would be located close to the main OSU campus and not the proposed pavilion.
Development of the proposed pavilion would be of little benefit to the overall operations of the Fairgrounds, though use of it during the annual Fair could be appealing.
We believe that given the small size of the overall population of Corvallis, combined with the presence of other spectator facilities within the local and regional market place and the nature of campus activity offerings to its students (1/3 of Corvallis’ population), would result in the proposed pavilion not being financially viable.
Benton County Fairgrounds Market Demand Analysis
35
Competitive and Comparable Facilities (continued)
Local Meeting and Banquet Facilities
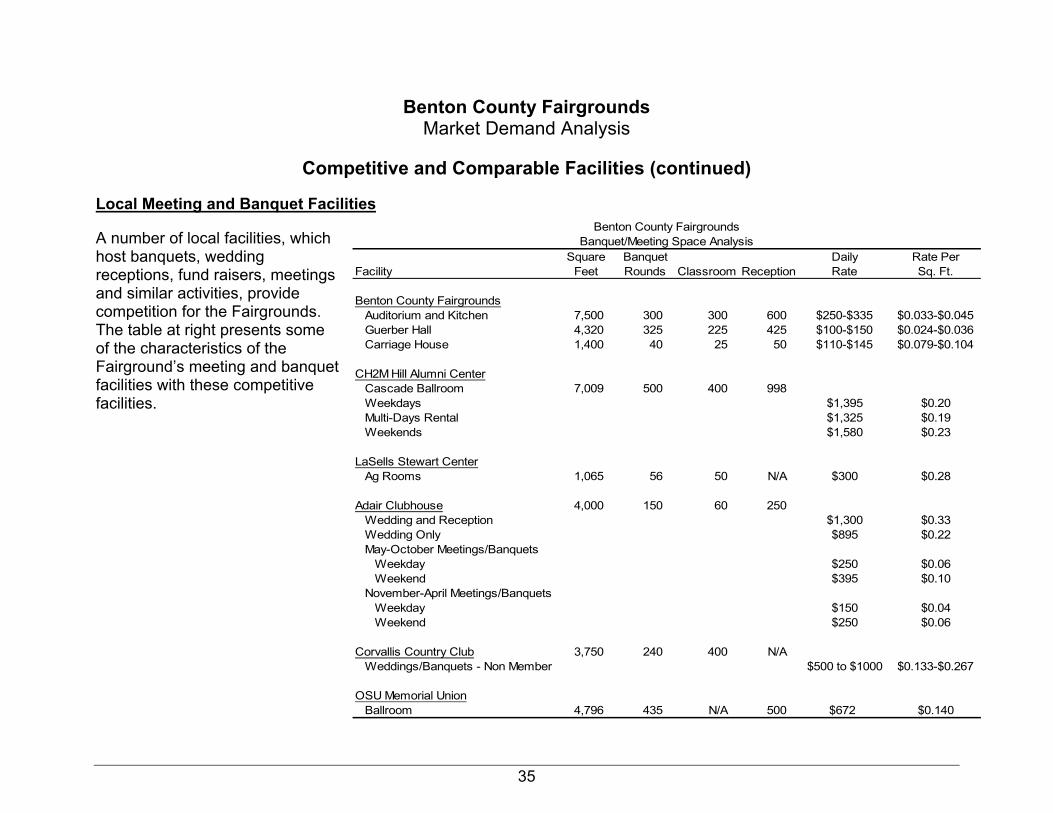
A number of local facilities, which host banquets, wedding receptions, fund raisers, meetings and similar activities, provide competition for the Fairgrounds. The table at right presents some of the characteristics of the Fairground’s meeting and banquet facilities with these competitive facilities.
Square Banquet Daily Rate PerFacility Feet Rounds Classroom Reception Rate Sq. Ft.
Benton County FairgroundsAuditorium and Kitchen 7,500 300 300 600 $250-$335 $0.033-$0.045Guerber Hall 4,320 325 225 425 $100-$150 $0.024-$0.036Carriage House 1,400 40 25 50 $110-$145 $0.079-$0.104
CH2M Hill Alumni CenterCascade Ballroom 7,009 500 400 998Weekdays $1,395 $0.20Multi-Days Rental $1,325 $0.19Weekends $1,580 $0.23
LaSells Stewart CenterAg Rooms 1,065 56 50 N/A $300 $0.28
Adair Clubhouse 4,000 150 60 250Wedding and Reception $1,300 $0.33Wedding Only $895 $0.22May-October Meetings/Banquets
Weekday $250 $0.06Weekend $395 $0.10
November-April Meetings/BanquetsWeekday $150 $0.04Weekend $250 $0.06
Corvallis Country Club 3,750 240 400 N/AWeddings/Banquets - Non Member $500 to $1000 $0.133-$0.267
OSU Memorial UnionBallroom 4,796 435 N/A 500 $672 $0.140
Benton County FairgroundsBanquet/Meeting Space Analysis
Benton County Fairgrounds Market Demand Analysis
36
Competitive and Comparable Facilities (continued)
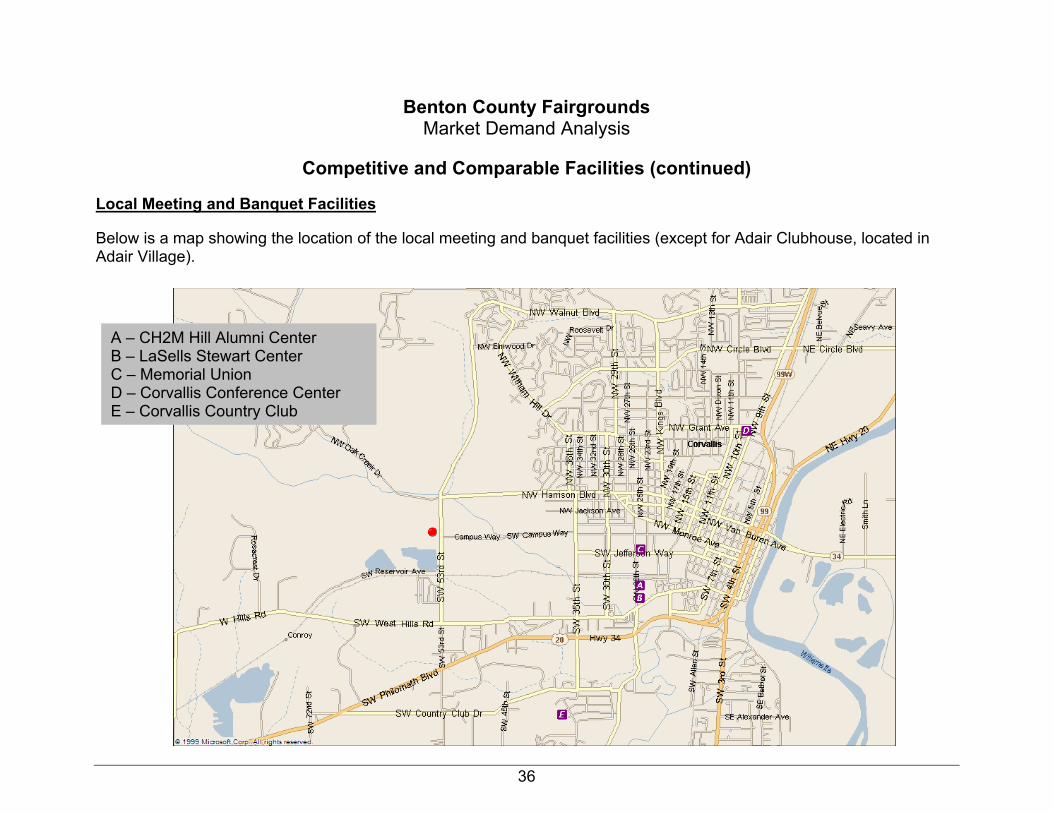
Local Meeting and Banquet Facilities
Below is a map showing the location of the local meeting and banquet facilities (except for Adair Clubhouse, located in Adair Village).
A – CH2M Hill Alumni Center B – LaSells Stewart Center C – Memorial Union D – Corvallis Conference Center E – Corvallis Country Club
Benton County Fairgrounds Market Demand Analysis
37
Competitive and Comparable Facilities (continued)
RV Facilities
Aside from the RV facilities at the Fairgrounds, there are no other private campgrounds/RV parks in the Corvallis area. The next closest RV Park is located in the Albany area (10 miles from the Fairgrounds) – the Albany KOA, with 105 RV pads, showers, playground, store and other amenities. Rates for the Albany KOA are comparable with those of the Fairgrounds’ RV Park.
Benton County Fairgrounds Market Demand Analysis
38
Competitive and Comparable Facilities (continued)
Summary Observations
On the basis of our review of competitive and comparable facilities, we noted the following:
The Fairgrounds has had (and will continue to have) strong competition from horse event facilities within the market area, especially for arena type facilities and larger horse events.
The local market area has a significant number of “Class A” banquet and meeting facilities.
There are 3 large (5,000 plus seats) spectator event facilities with a 1 to 1½ hour drive of Corvallis, including OSU’s Gill Coliseum, as well as the Linn County Expo Center that hosts rodeos, wheel events and similar spectator events.
The Fairgrounds has little competition from local facilities for exhibition space and lower cost banquet and meeting facilities.
Benton County Fairgrounds Market Demand Analysis
39
Potential Use Assessment
On the basis of factors affecting demand for facilities at the Benton County Fairgrounds (location, area economics and demographics, competitive factors), interviews and surveys of current and potential users of Fairgrounds facilities and our assessment of the optional market opportunities1 for the future of the Fairgrounds, we believe the following market opportunities exist for the Fairgrounds: ■ Local/regional consumer and industry trade shows – medium market potential, but needs development ■ Regional dog/cat shows – medium market potential ■ Banquets and receptions – medium market potential ■ Smaller single and multi-day horse shows – medium market potential ■ Smaller RV rallies – weak to medium market potential ■ Concerts and spectator events – weak market potential ■ Livestock shows – weak market potential
1 Weak market potential refers to a minimal number of events that can be attracted to the Fairgrounds, for which specific investment in facilities would not be recommended.
Benton County Fairgrounds Market Demand Analysis
40
Facility Recommendations For the Benton County Fairgrounds to take advantage of existing and potential market opportunities, the following facility improvements and changes are recommended Exhibition Facilities Focusing marketing efforts on expanding the consumer and public show market, large banquets, trade shows and dog/cat shows will require large exhibition facilities with the following characteristics: ■ 30,000 square feet of net rentable exhibit space in one building, dividable into three 10,000 sq. ft. sections, with high
ceiling
■ Concessions/kitchen area
■ 3 to 4 breakout meeting rooms that can be combined into one large room
■ Restrooms and public entry area
■ Full climate controls, appropriate technology and communication utilities
■ Dedicated, adjacent parking areas
■ Multiple load-in/load-out access doors
In addition, the Fair office could be located in this building. The approximate gross square footage for this structure, including public spaces, office spaces, exhibition space and storage is estimated at about 42,000 square feet. We recommend locating this building in the place of the existing Indoor Arena.
Benton County Fairgrounds Market Demand Analysis
41
Facility Recommendations (continued) Covered Outdoor Arena
With the replacement of the existing Indoor Arena with a new exhibition building, it is recommended that in the place of the existing outdoor arena, a covered arena be constructed, with seating tucked under the roof or with additional overhangs for seating areas. This covered arena could be used for all of the dirt events currently being held in the existing Indoor Arena. It would also be an attractive venue for single day and small multi-day horse shows. Exhibit G shows pictures of examples of the type of covered arena recommended.
Other Facility Recommendations
Other recommendations for facility improvements/enhancements include: Renovate the interior of the Auditorium Building to make it more attractive for smaller banquets, receptions, dances
and the like.
Relocate the maintenance building to another part of the Fairgrounds, freeing up space for parking and servicing of the recommended Exhibition Building.
Upgrade kitchen equipment in the Auditorium Building.
Explore expansion of the Fairgrounds via possible donation of property located on the west side of the Fairgrounds.
An “historic village” concept was explored as an option for a portion of the Fairgrounds – in and around the location of the Carriage House. The concept includes redevelopment of the northeast corner of the Fairgrounds with the addition of smaller buildings and structures for meetings, a performance green, fountain and other structures with “historic” architectural façades and features. We believe that the Fairgrounds would have difficulty filling smaller meeting space and making it financial feasible. The recommended upgrades to the Auditorium Building and the construction of the recommended Exhibition Building (with meeting rooms) would provide multi-function space that would better serve both interim and Fair uses.
Benton County Fairgrounds Market Demand Analysis
42
Event Potential Our assessment of the potential market segments identified the following events and building uses for the recommended facilities at the Fairgrounds each year (potential to be realized by the third year of operation): Exhibit Building ■ 18 new consumer/public shows, using from 10,000 sq. ft. to 30,000 sq. ft. of exhibit space ■ 4 trade and private shows, averaging 30,000 sq. ft. of space use and 3 event days ■ 2 new regional dog shows ■ 15 to 20 new banquets, receptions, dances or local seminars/meetings ■ 6 new dances (2 large and 4 small) ■ 12 new banquets, wedding receptions or fundraisers ■ 4 new community events (i.e., larger public meetings, special gatherings) ■ 6 other events (i.e., health fair, etc.) ■ 400 hours per year of meeting room rentals ■ 9 existing events that now use the Indoor Arena (consumer shows and dog shows) would use the Exhibition Building
Covered Arena In addition to moving existing dirt events from the Indoor Arena to the recommended Covered Arena (OSU Polo, Sheriff’s Posse, circus, etc.), the covered arena could attract: ■ 2 to 4 wheel events (moto-cross, etc.) ■ 8 to 10 single day horse shows ■ 6 to 8 multiple day horse shows – average 2 days per show and 50 stalls per night
Benton County Fairgrounds Financial Feasibility Analysis
43
Overview
This section presents the projected cash flows before debt service for the recommended facilities for the Benton County Fairgrounds.
The projected statements of revenues and expenses are based on (1) the projected utilization of the recommended facilities, recommended rental rates and operating policies presented in this document, (2) the estimated revenues that could be realized from operating the recommended facilities and (3) the estimated expenses associated with operating the improvements and additions. The projections, and assumptions herein, represent revenues and expenses associated with operating the proposed master plan components. There will usually be differences between the estimated and actual results because events and circumstances frequently do not occur as expected, and those differences may be material.
Benton County Fairgrounds Financial Feasibility Analysis
44
Recommended Rental Policy Actions
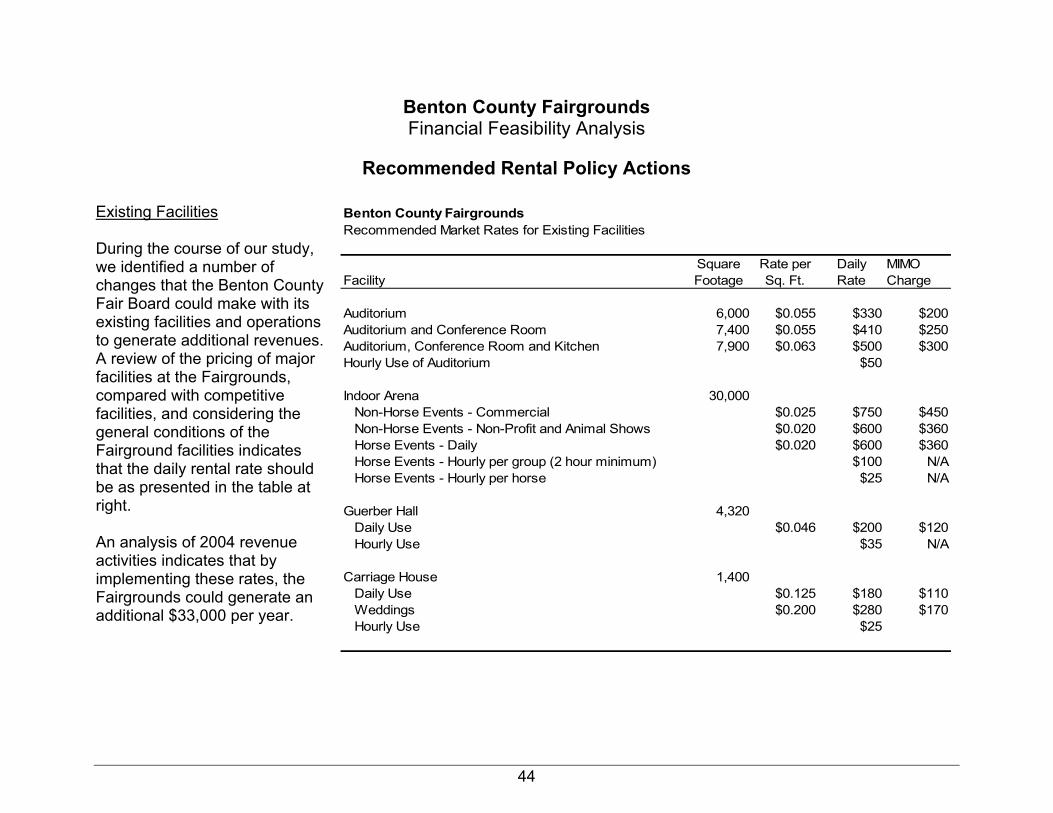
Existing Facilities During the course of our study, we identified a number of changes that the Benton County Fair Board could make with its existing facilities and operations to generate additional revenues. A review of the pricing of major facilities at the Fairgrounds, compared with competitive facilities, and considering the general conditions of the Fairground facilities indicates that the daily rental rate should be as presented in the table at right. An analysis of 2004 revenue activities indicates that by implementing these rates, the Fairgrounds could generate an additional $33,000 per year.
Benton County FairgroundsRecommended Market Rates for Existing Facilities
Square Rate per Daily MIMOFacility Footage Sq. Ft. Rate Charge
Auditorium 6,000 $0.055 $330 $200Auditorium and Conference Room 7,400 $0.055 $410 $250Auditorium, Conference Room and Kitchen 7,900 $0.063 $500 $300Hourly Use of Auditorium $50
Indoor Arena 30,000Non-Horse Events - Commercial $0.025 $750 $450Non-Horse Events - Non-Profit and Animal Shows $0.020 $600 $360Horse Events - Daily $0.020 $600 $360Horse Events - Hourly per group (2 hour minimum) $100 N/AHorse Events - Hourly per horse $25 N/A
Guerber Hall 4,320Daily Use $0.046 $200 $120Hourly Use $35 N/A
Carriage House 1,400Daily Use $0.125 $180 $110Weddings $0.200 $280 $170Hourly Use $25
Benton County Fairgrounds Financial Feasibility Analysis
45
Recommended Rental Policy Actions (continued)
Recommended Facilities
■ For the Exhibition Building, we recommend a daily rate equal to $0.055 per square foot with a move-in/move-out rate equal to ½ of the daily rate. At that rate, the entire facility would rent for $1,650 per day and have a $825 move-in/move-out rate. For community events, we recommend the daily and move-in/move-out rates be set at about 80 percent of the daily rate. Meeting rooms should be rented at a rate of $35 per hour.
■ With the level of activity estimated for the recommended exhibition building, we recommend that the Fair Board enter into a contract with a third party concessionaire to run all interim concession operations. We believe that a payment of an average of 30 percent of the gross concession sales would be achievable.
■ Because no large exhibition facilities currently exist in the Corvallis area, we believe that the Fairgrounds could promote or co-promote some of the new events identified as market potential – principally consumer and public shows.
■ For the Covered Arena, we recommend a daily rate for commercial events (circus, wheel events, etc.) of $500. For horse and animal events and non-profit uses, we recommend a daily rate of $400. For horse practices, groups should be charged $150 for a 4 hour minimum and hourly individuals should be charged $25 per horse.
■ Historically, for most events and activities held at the Fairgrounds, the policy is to allow the users to unlock, open, operate, clean-up and lock-up the facilities they use. To best operate, maintain and manage the recommended facilities, we strongly recommend that this policy is abandoned and that the Fairground’s staff provide all building access control (un-locking and locking up the buildings), as well as certain clean-up activities.
Benton County Fairgrounds Financial Feasibility Analysis
46
Projected Revenues and Expenses
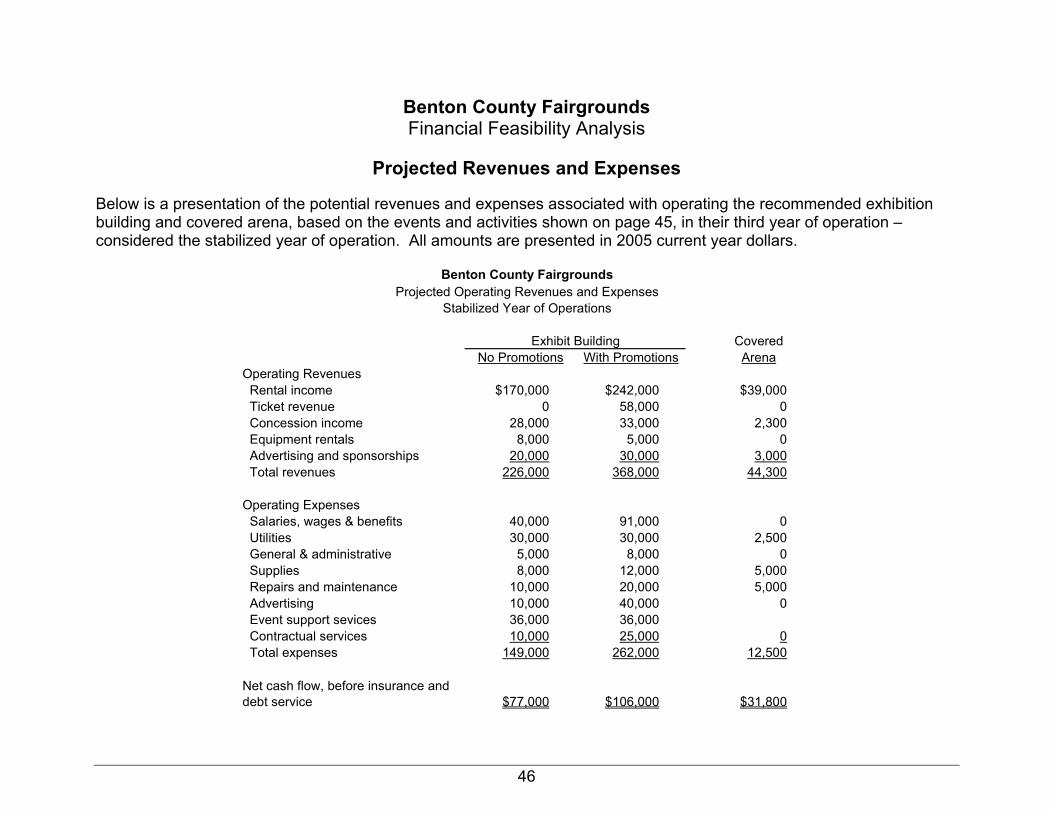
Below is a presentation of the potential revenues and expenses associated with operating the recommended exhibition building and covered arena, based on the events and activities shown on page 45, in their third year of operation – considered the stabilized year of operation. All amounts are presented in 2005 current year dollars.
CoveredNo Promotions With Promotions Arena
Operating Revenues Rental income $170,000 $242,000 $39,000 Ticket revenue 0 58,000 0 Concession income 28,000 33,000 2,300 Equipment rentals 8,000 5,000 0 Advertising and sponsorships 20,000 30,000 3,000 Total revenues 226,000 368,000 44,300
Operating Expenses Salaries, wages & benefits 40,000 91,000 0 Utilities 30,000 30,000 2,500 General & administrative 5,000 8,000 0 Supplies 8,000 12,000 5,000 Repairs and maintenance 10,000 20,000 5,000 Advertising 10,000 40,000 0 Event support sevices 36,000 36,000 Contractual services 10,000 25,000 0 Total expenses 149,000 262,000 12,500
Net cash flow, before insurance and debt service $77,000 $106,000 $31,800
Exhibit Building
Projected Operating Revenues and ExpensesStabilized Year of Operations
Benton County Fairgrounds
Benton County Fairgrounds Financial Feasibility Analysis
47
Revenue Assumptions
For purposes of projecting rental income, ticket revenue, concession income, and equipment rentals, certain existing and new events are assumed to use the exhibition building and covered arena as described on page 43 and detailed in Exhibits H – L. The projection of revenues and expenses present two alternative scenarios for operating the recommended exhibit building.
Rental Income – For the exhibition building, rental income represents the estimated income from existing events and new events listed on page 45 and the recommended rental rates shown on page 47. No Promotions assumes the rental of facilities to third party promoters, as are most of the Fairgrounds’ operations. With Promotions assumes that the Fairgrounds operation promotes or co-promotes certain events held in the recommended exhibition building. Rental income for promoted events also includes both space rentals to exhibitors of consumer and public shows as detailed in Exhibit K. For the covered arena, rental income represents rental of the arena, stalls and RV revenues related to the events listed on page 45.
Ticket Revenue – For those events that are assumed to be promoted or co-promoted by the Fairgrounds, ticket revenues represents the sale of admission to certain consumer shows as detailed in Exhibit K.
Concession Income – Concession income is expected to be generated from the sale of food and beverages at consumer shows, animal shows, community events, horse shows, wheel events and others. For purposes of the projections, it is assumed that these shows would have average per capita gross concession sales of $1.25 for horse shows and $1.50 for all other events. For these concession sales, it is assumed that the Benton County Fair Board would contract these services with a third party and receive 30 percent of gross concession sales.
Equipment Rentals – Equipment rental income represents the estimated charges for rental of tables, chairs and other services in connection with events and activities held in the recommended exhibition building.
Advertising and Sponsorship Revenues – These revenues represent the estimated revenues that could be realized from sponsors and advertisers of events and activities held at the Fairgrounds, including building signage and naming rights.
Exhibits H – L contain the detailed calculation of the revenues associated with the recommended exhibit building and covered arena.
Benton County Fairgrounds Financial Feasibility Analysis
48
Expense Assumptions
Projected operating expenses for the recommended facilities are based on the cost of operating the existing Fairground facilities, the recommended staffing plan and the required marketing expenditures to successfully attract and retain events and activities identified in this study. A description of the nature of the operating expenses is presented below.
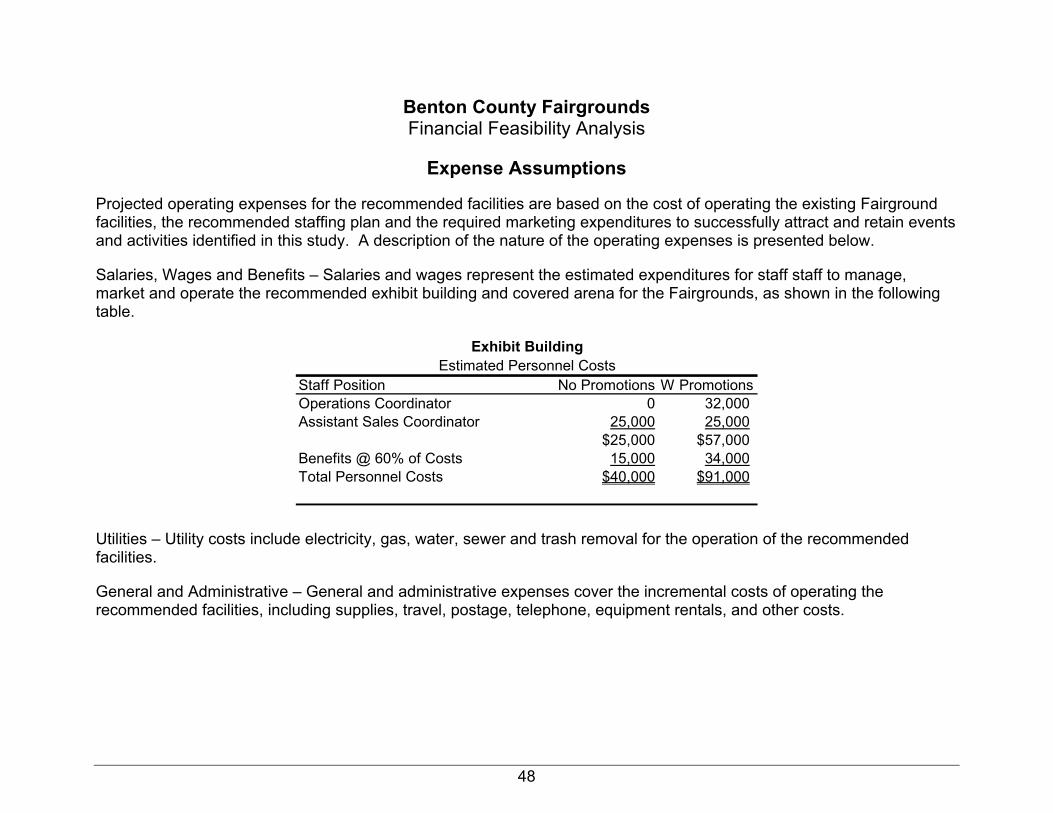
Salaries, Wages and Benefits – Salaries and wages represent the estimated expenditures for staff staff to manage, market and operate the recommended exhibit building and covered arena for the Fairgrounds, as shown in the following table.
Staff Position No Promotions W PromotionsOperations Coordinator 0 32,000Assistant Sales Coordinator 25,000 25,000
$25,000 $57,000Benefits @ 60% of Costs 15,000 34,000Total Personnel Costs $40,000 $91,000
Exhibit BuildingEstimated Personnel Costs
Utilities – Utility costs include electricity, gas, water, sewer and trash removal for the operation of the recommended facilities.
General and Administrative – General and administrative expenses cover the incremental costs of operating the recommended facilities, including supplies, travel, postage, telephone, equipment rentals, and other costs.
Benton County Fairgrounds Financial Feasibility Analysis
49
Expense Assumptions (continued)
Supplies – Supply costs include supplies used in the operation and maintenance of the facilities, such as rest room supplies and those supplies used in cleaning and maintaining the facilities.
Repairs and maintenance – Repairs and maintenance costs include the cost of normal repairs and maintenance of the facilities; not extraordinary costs associated with new facilities.
Advertising – Advertising and marketing costs include the cost of brochures and mailings, as well as advertising in trade publications and other direct marketing expenses.
Event Support Services – These costs represent the estimated cost of contract labor to assist in set-up, tear down and clean up related to events held in the recommended exhibition building.
Contractual Services – Contractual services include refuse collection, temporary help and other services provided by third party vendors.
Benton County Fairgrounds Financial Feasibility Analysis
50
Construction Cost Potential
The following estimated ranges of construction costs for the recommended facilities are based on similar projects that we have worked on within the past 12 months. The purpose of presenting these construction cost estimates is to enable the Benton County Fairgrounds board and management to get some idea of the magnitude of funding needs. We make no representation as to the accuracy of these estimates as they relate to facilities that may be built at the Fairgrounds. An architectural firm should be engaged to prepare cost estimates specific to the Corvallis/Benton County building codes and construction cost experience. Exhibit Building Assuming a gross square footage of 40,000 to 42,000 square feet, an average cost per square foot of $80 to $90, $100,000 for miscellaneous equipment, the total cost of the arena, before contingencies, additional bleacher seating or soft costs, could range from $3.3 million to $3.9 million. Covered Arena The cost of covering the existing outdoor arena, located west of the indoor arena, could range from $500,000 to $600,000 plus another $70,000 to $100,000 for seating, lighting, announcers booth and pens.
Benton County Fairgrounds Financial Feasibility Analysis
51
Funding Options
A review of funding options for the Fairgrounds to invest in new and upgraded facilities appears to limit the options to the following:
■ Grants and endowments ■ Cash flow potential applied to debt service ■ General Obligation bonds
Under the With Promotions operating scenario, net revenue projected to be available for debt service could be about $100,000 per year. These dollars could support between $1.0 million and $1.25 million, based on a 20 year debt at 5% annual interest rate (governmental rate). Should General Obligation bonds be issued to assist in funding the capital improvements at the Fairgrounds, the impact on resident taxpayers would be about $1.18 per year for a $100,000 property for every $100,000 of annual debt service. For example, a $5 million GO bond issue could require about $400,000 in annual debt service. For a home valued at $100,000, the additional annual property tax assessed would be about $4.70.