Embed Size (px)
Citation preview
Market Feasibility and Impact Study of
Proposed Mega Plex Theatre
in Lincoln, Nebraska
R-T Associates May 2005
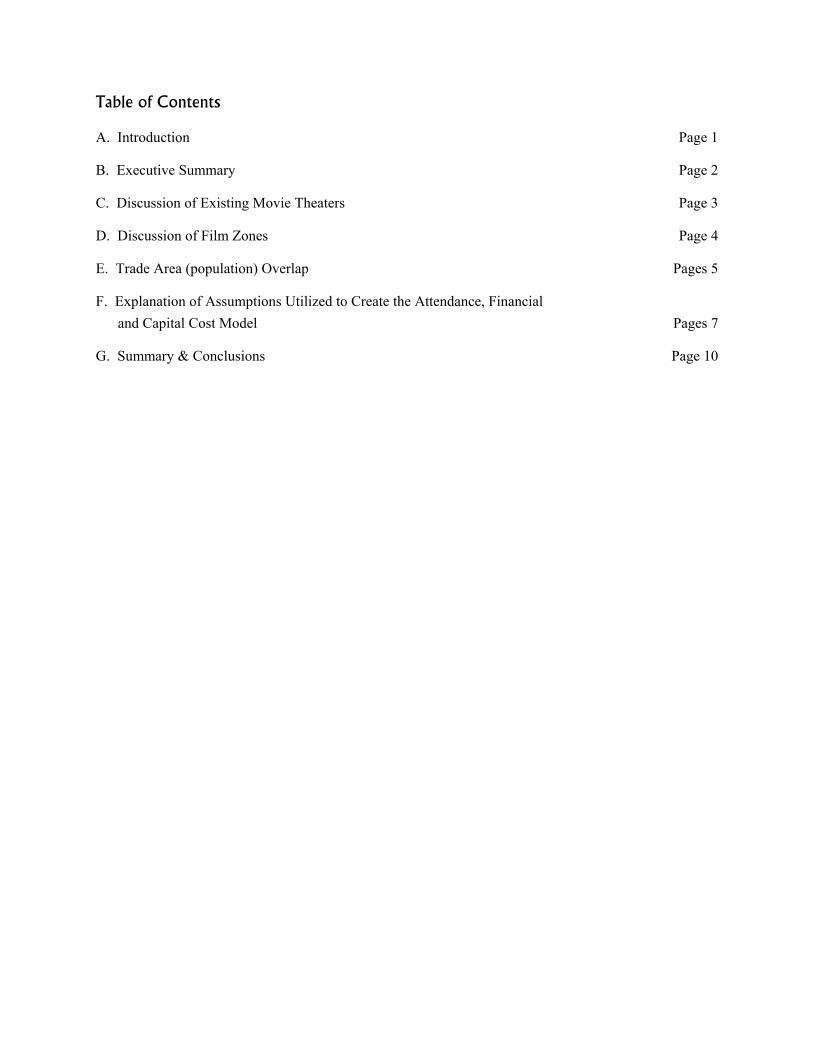
Table of Contents
A. Introduction Page 1
B. Executive Summary Page 2
C. Discussion of Existing Movie Theaters Page 3
D. Discussion of Film Zones Page 4
E. Trade Area (population) Overlap Pages 5
F. Explanation of Assumptions Utilized to Create the Attendance, Financial and Capital Cost Model Pages 7
G. Summary & Conclusions Page 10
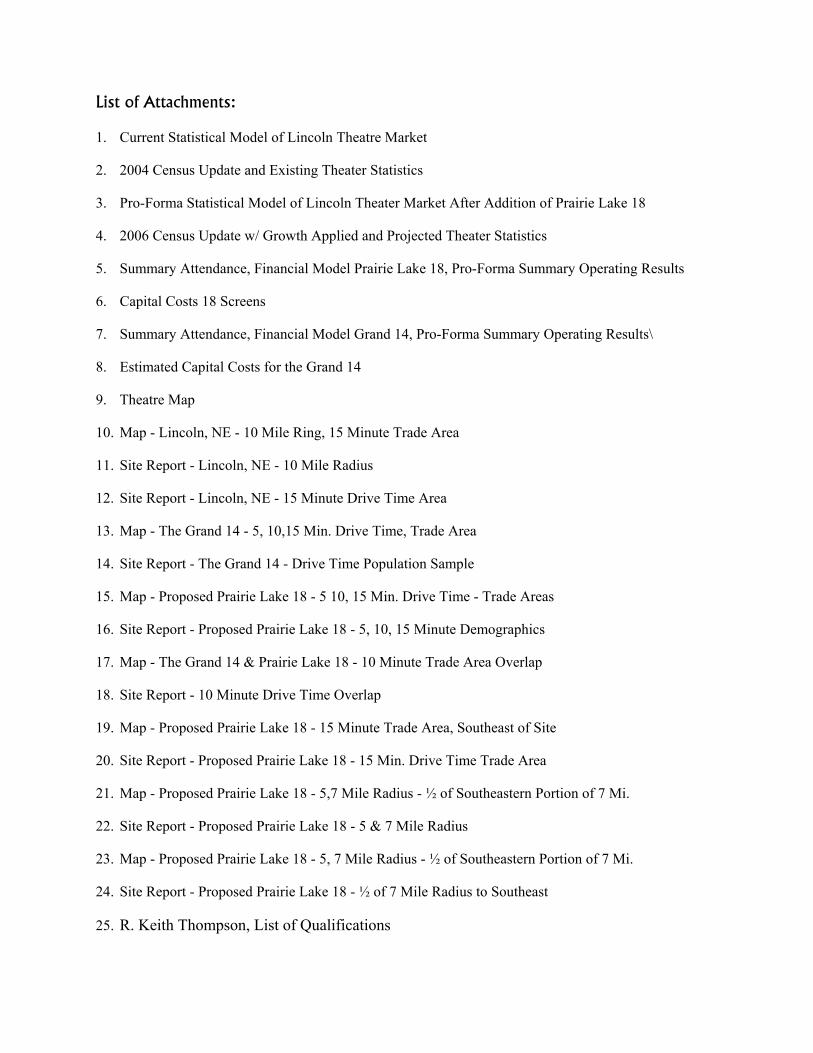
List of Attachments:
1. Current Statistical Model of Lincoln Theatre Market
2. 2004 Census Update and Existing Theater Statistics
3. Pro-Forma Statistical Model of Lincoln Theater Market After Addition of Prairie Lake 18
4. 2006 Census Update w/ Growth Applied and Projected Theater Statistics
5. Summary Attendance, Financial Model Prairie Lake 18, Pro-Forma Summary Operating Results
6. Capital Costs 18 Screens
7. Summary Attendance, Financial Model Grand 14, Pro-Forma Summary Operating Results\
8. Estimated Capital Costs for the Grand 14
9. Theatre Map
10. Map - Lincoln, NE - 10 Mile Ring, 15 Minute Trade Area
11. Site Report - Lincoln, NE - 10 Mile Radius
12. Site Report - Lincoln, NE - 15 Minute Drive Time Area
13. Map - The Grand 14 - 5, 10,15 Min. Drive Time, Trade Area
14. Site Report - The Grand 14 - Drive Time Population Sample
15. Map - Proposed Prairie Lake 18 - 5 10, 15 Min. Drive Time - Trade Areas
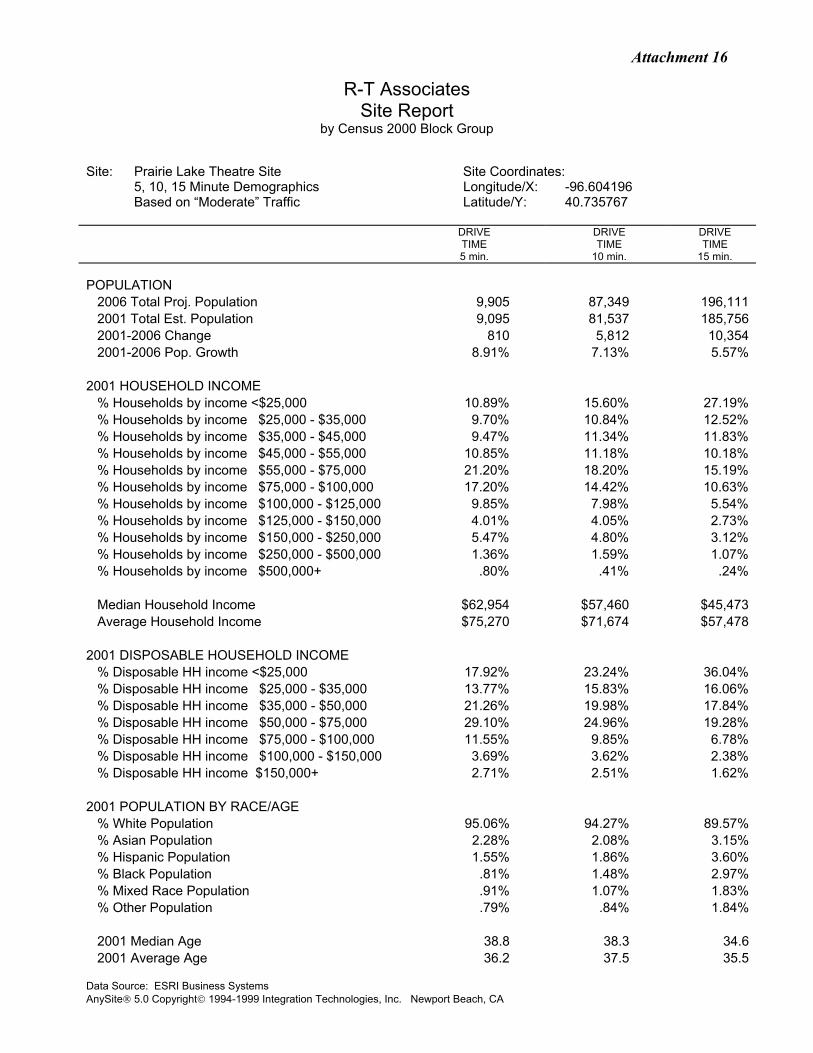
16. Site Report - Proposed Prairie Lake 18 - 5, 10, 15 Minute Demographics
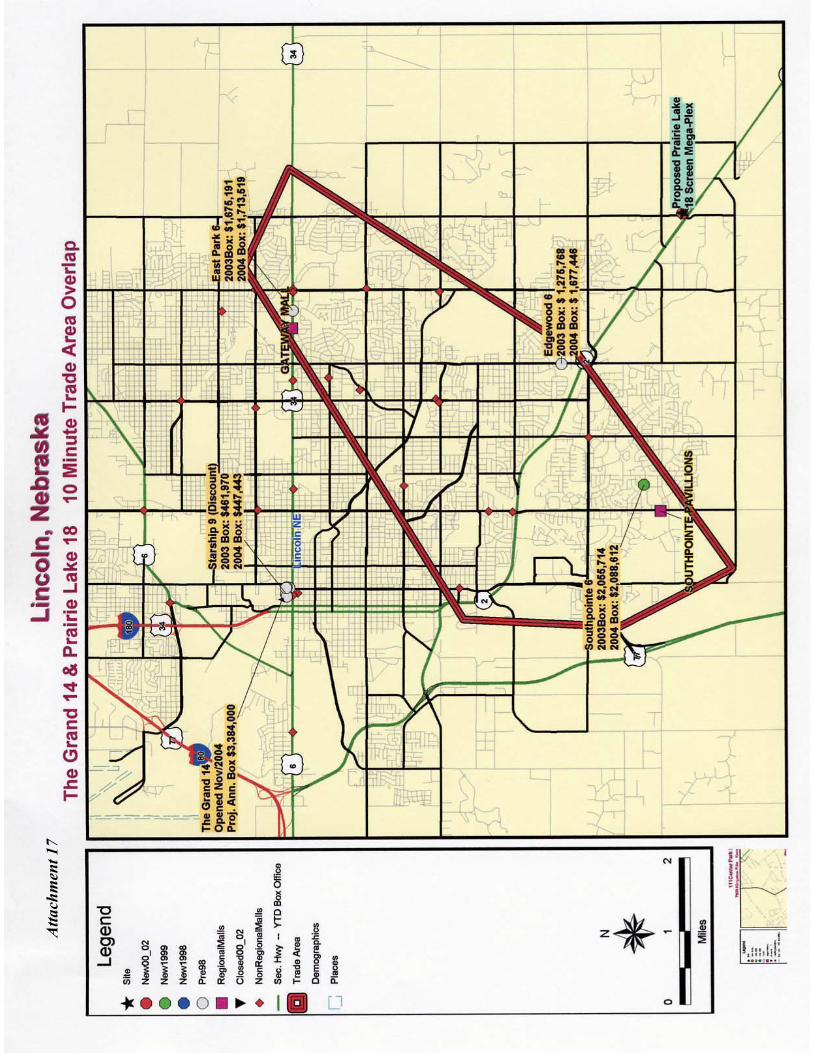
17. Map - The Grand 14 & Prairie Lake 18 - 10 Minute Trade Area Overlap
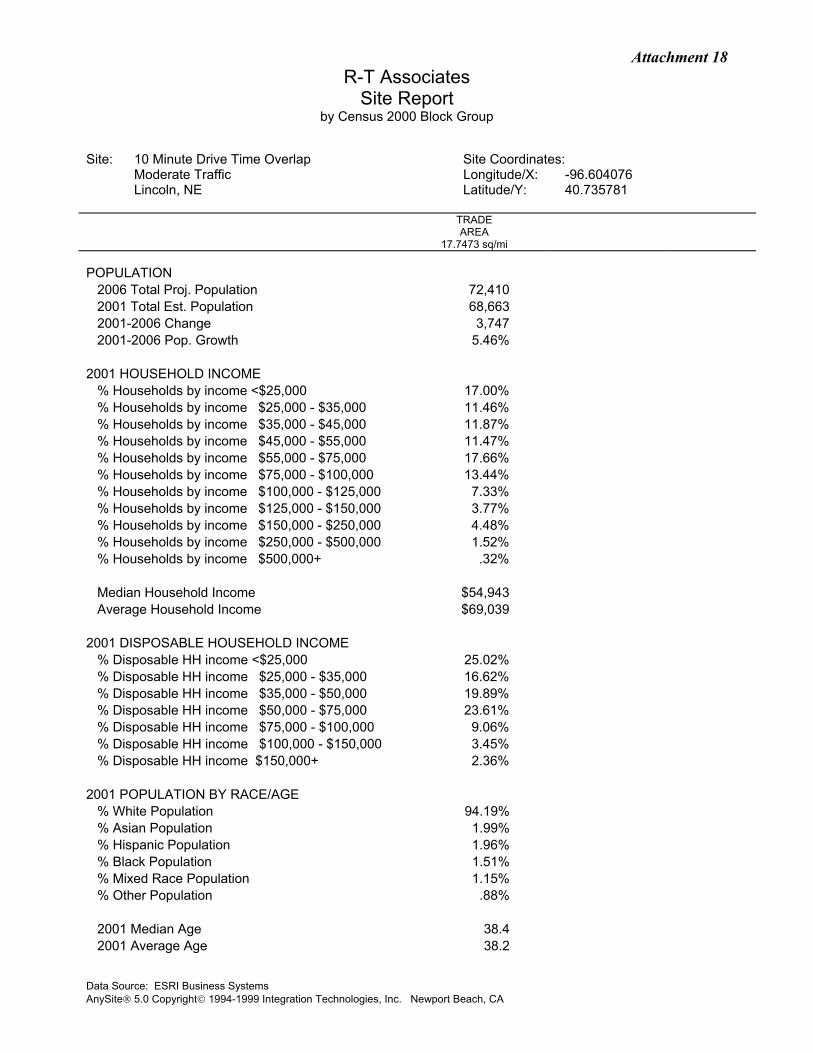
18. Site Report - 10 Minute Drive Time Overlap
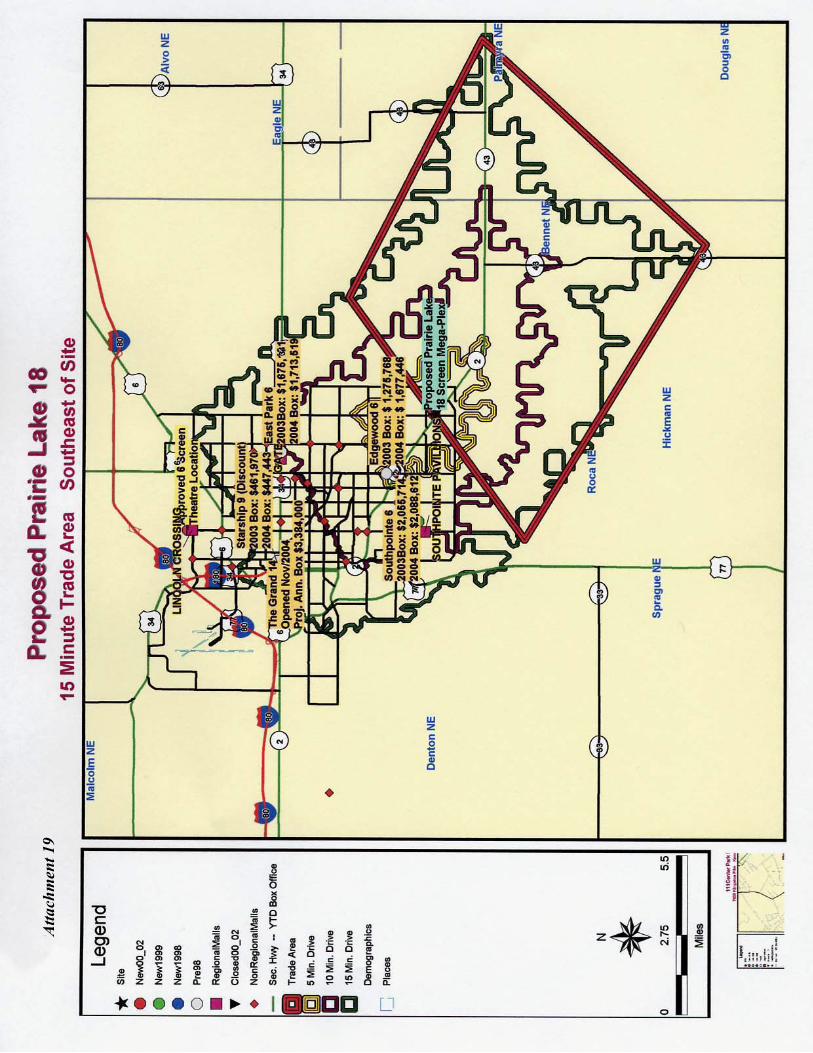
19. Map - Proposed Prairie Lake 18 - 15 Minute Trade Area, Southeast of Site
20. Site Report - Proposed Prairie Lake 18 - 15 Min. Drive Time Trade Area
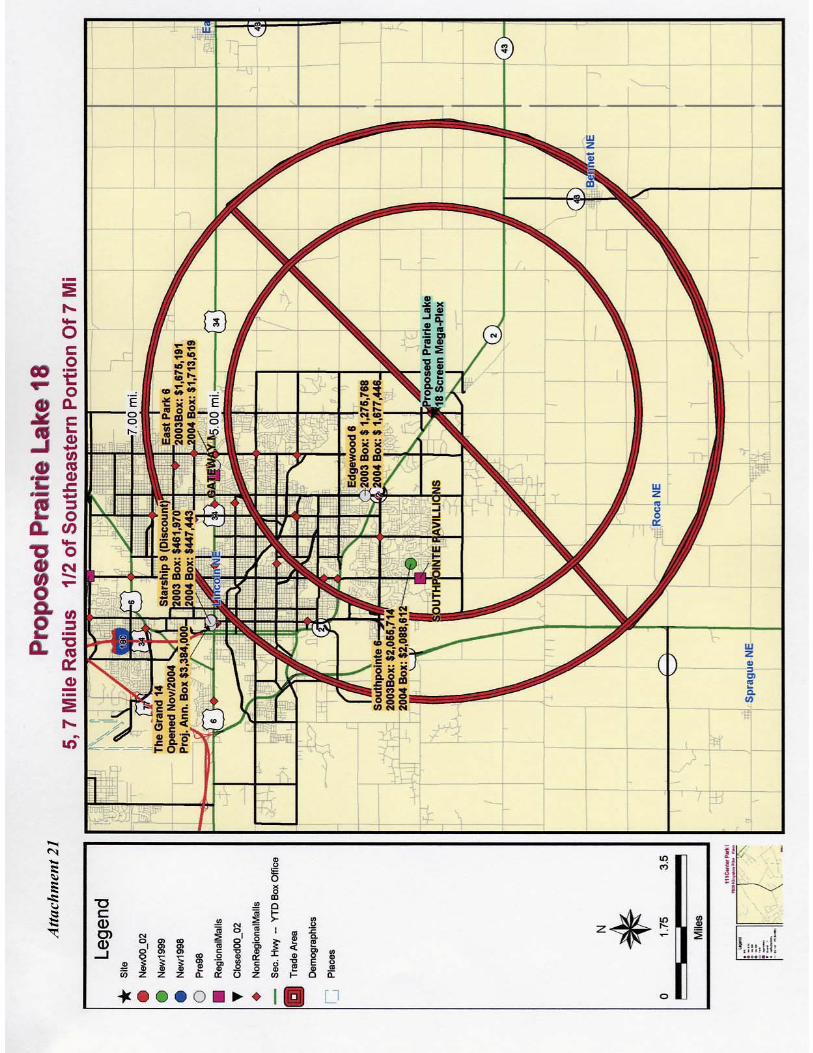
21. Map - Proposed Prairie Lake 18 - 5,7 Mile Radius - ½ of Southeastern Portion of 7 Mi.
22. Site Report - Proposed Prairie Lake 18 - 5 & 7 Mile Radius
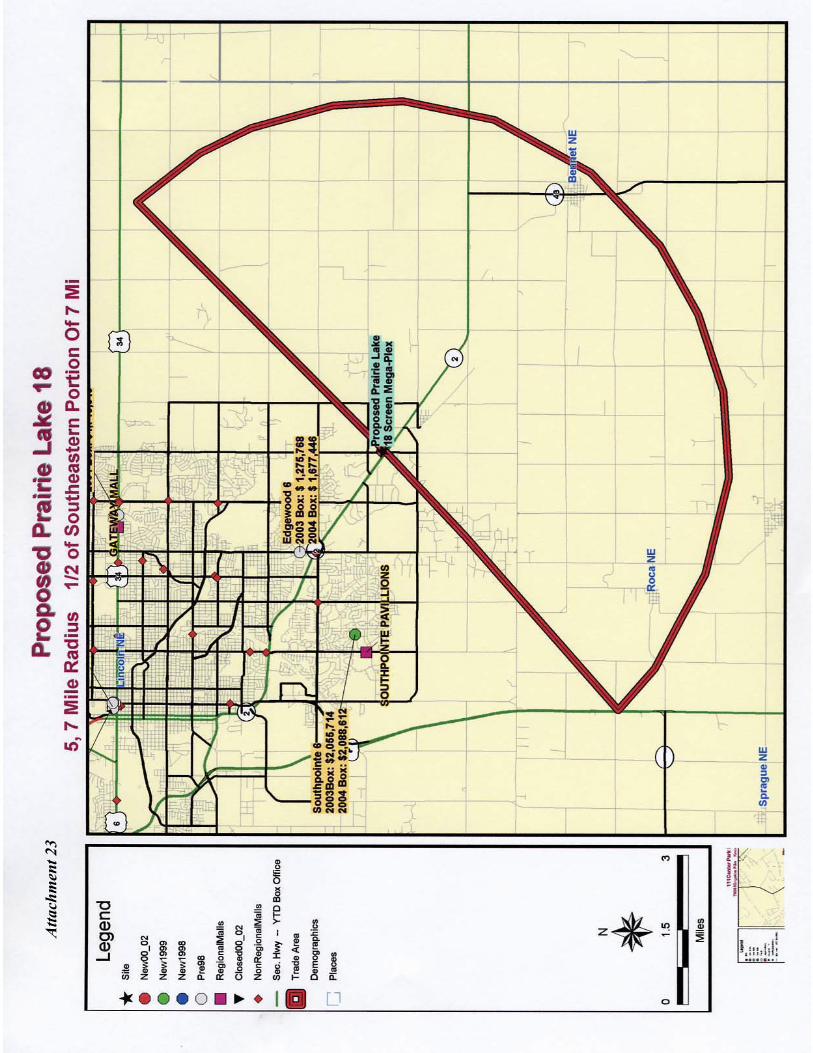
23. Map - Proposed Prairie Lake 18 - 5, 7 Mile Radius - ½ of Southeastern Portion of 7 Mi.
24. Site Report - Proposed Prairie Lake 18 - ½ of 7 Mile Radius to Southeast
25. R. Keith Thompson, List of Qualifications
Lincoln, NE May 2005-1-
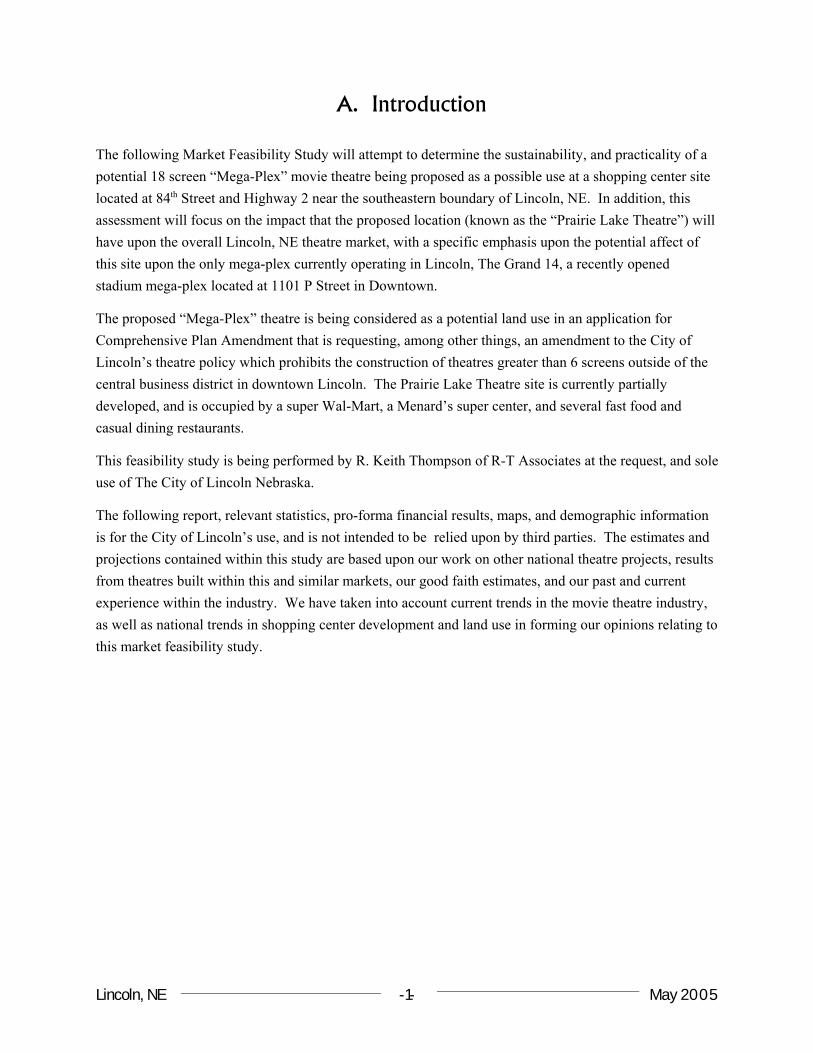
A. Introduction
The following Market Feasibility Study will attempt to determine the sustainability, and practicality of apotential 18 screen “Mega-Plex” movie theatre being proposed as a possible use at a shopping center sitelocated at 84th Street and Highway 2 near the southeastern boundary of Lincoln, NE. In addition, thisassessment will focus on the impact that the proposed location (known as the “Prairie Lake Theatre”) willhave upon the overall Lincoln, NE theatre market, with a specific emphasis upon the potential affect ofthis site upon the only mega-plex currently operating in Lincoln, The Grand 14, a recently openedstadium mega-plex located at 1101 P Street in Downtown.
The proposed “Mega-Plex” theatre is being considered as a potential land use in an application forComprehensive Plan Amendment that is requesting, among other things, an amendment to the City ofLincoln’s theatre policy which prohibits the construction of theatres greater than 6 screens outside of thecentral business district in downtown Lincoln. The Prairie Lake Theatre site is currently partiallydeveloped, and is occupied by a super Wal-Mart, a Menard’s super center, and several fast food andcasual dining restaurants.
This feasibility study is being performed by R. Keith Thompson of R-T Associates at the request, and soleuse of The City of Lincoln Nebraska.
The following report, relevant statistics, pro-forma financial results, maps, and demographic informationis for the City of Lincoln’s use, and is not intended to be relied upon by third parties. The estimates andprojections contained within this study are based upon our work on other national theatre projects, resultsfrom theatres built within this and similar markets, our good faith estimates, and our past and currentexperience within the industry. We have taken into account current trends in the movie theatre industry,as well as national trends in shopping center development and land use in forming our opinions relating tothis market feasibility study.
Theater Feasibility Study
Lincoln, NE May 2005-2-
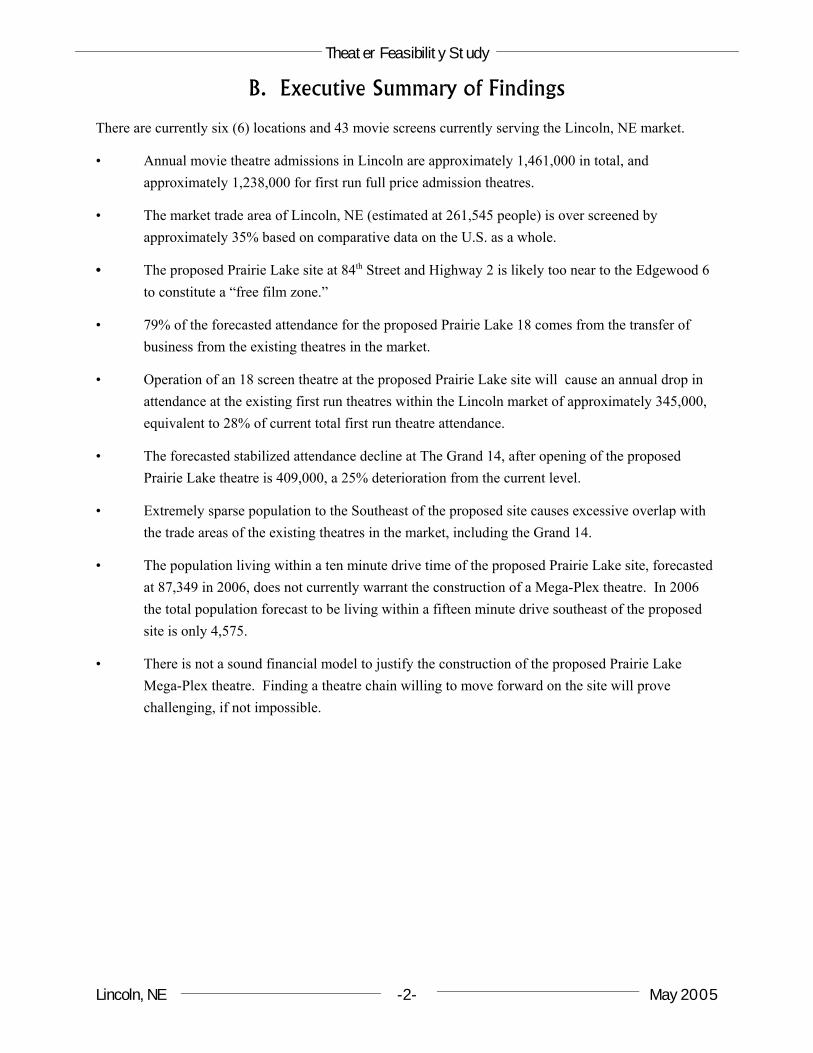
B. Executive Summary of Findings
There are currently six (6) locations and 43 movie screens currently serving the Lincoln, NE market.
• Annual movie theatre admissions in Lincoln are approximately 1,461,000 in total, andapproximately 1,238,000 for first run full price admission theatres.
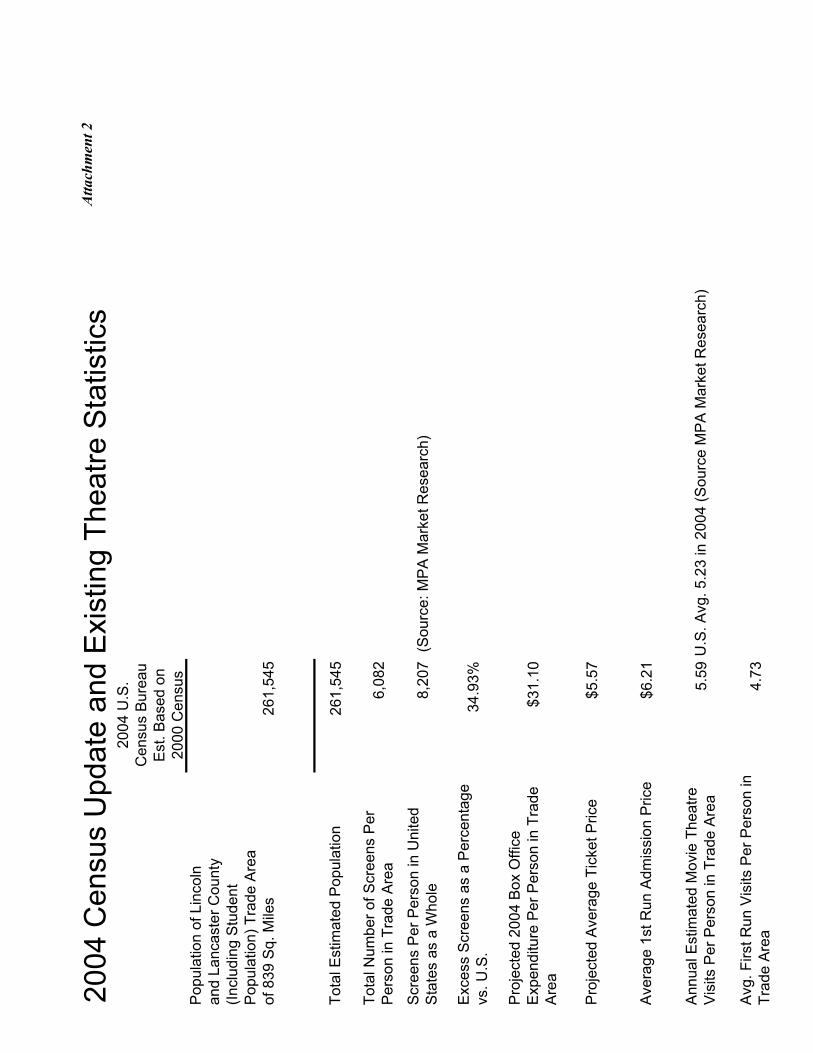
• The market trade area of Lincoln, NE (estimated at 261,545 people) is over screened byapproximately 35% based on comparative data on the U.S. as a whole.
• The proposed Prairie Lake site at 84th Street and Highway 2 is likely too near to the Edgewood 6to constitute a “free film zone.”
• 79% of the forecasted attendance for the proposed Prairie Lake 18 comes from the transfer ofbusiness from the existing theatres in the market.
• Operation of an 18 screen theatre at the proposed Prairie Lake site will cause an annual drop inattendance at the existing first run theatres within the Lincoln market of approximately 345,000,equivalent to 28% of current total first run theatre attendance.
• The forecasted stabilized attendance decline at The Grand 14, after opening of the proposedPrairie Lake theatre is 409,000, a 25% deterioration from the current level.
• Extremely sparse population to the Southeast of the proposed site causes excessive overlap withthe trade areas of the existing theatres in the market, including the Grand 14.
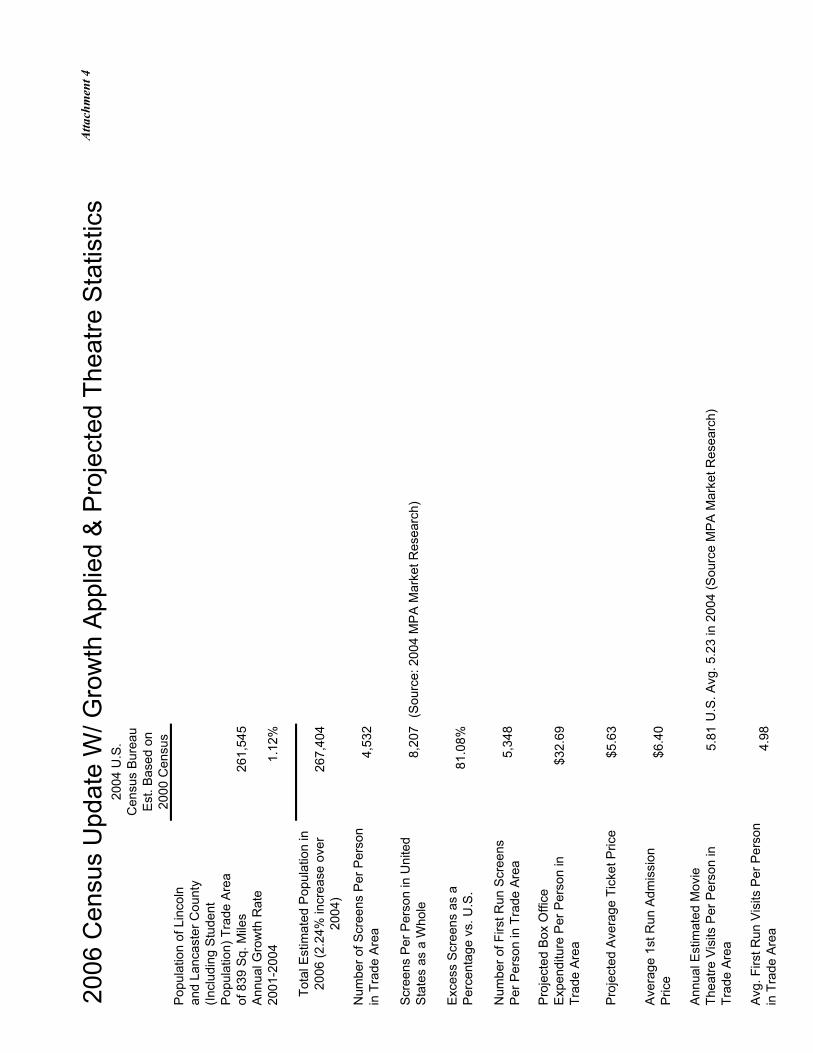
• The population living within a ten minute drive time of the proposed Prairie Lake site, forecastedat 87,349 in 2006, does not currently warrant the construction of a Mega-Plex theatre. In 2006the total population forecast to be living within a fifteen minute drive southeast of the proposedsite is only 4,575.
• There is not a sound financial model to justify the construction of the proposed Prairie LakeMega-Plex theatre. Finding a theatre chain willing to move forward on the site will provechallenging, if not impossible.
Theater Feasibility Study
Lincoln, NE May 2005-3-
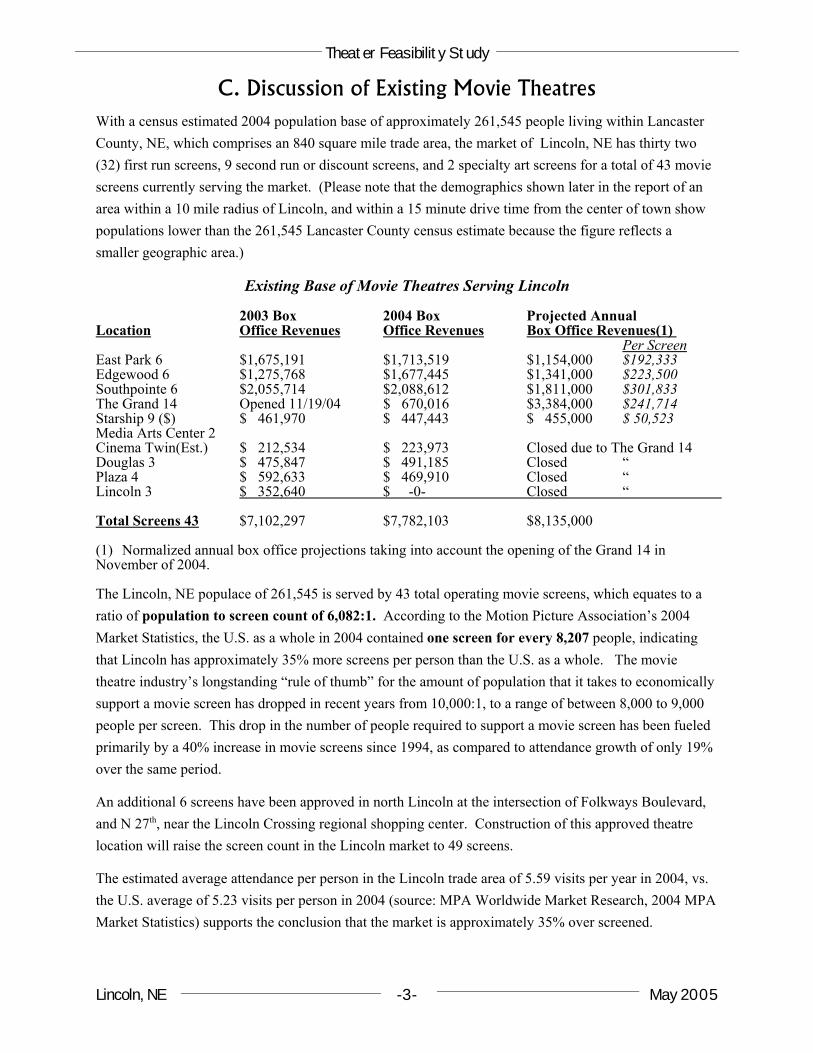
C. Discussion of Existing Movie TheatresWith a census estimated 2004 population base of approximately 261,545 people living within LancasterCounty, NE, which comprises an 840 square mile trade area, the market of Lincoln, NE has thirty two(32) first run screens, 9 second run or discount screens, and 2 specialty art screens for a total of 43 moviescreens currently serving the market. (Please note that the demographics shown later in the report of anarea within a 10 mile radius of Lincoln, and within a 15 minute drive time from the center of town showpopulations lower than the 261,545 Lancaster County census estimate because the figure reflects asmaller geographic area.)
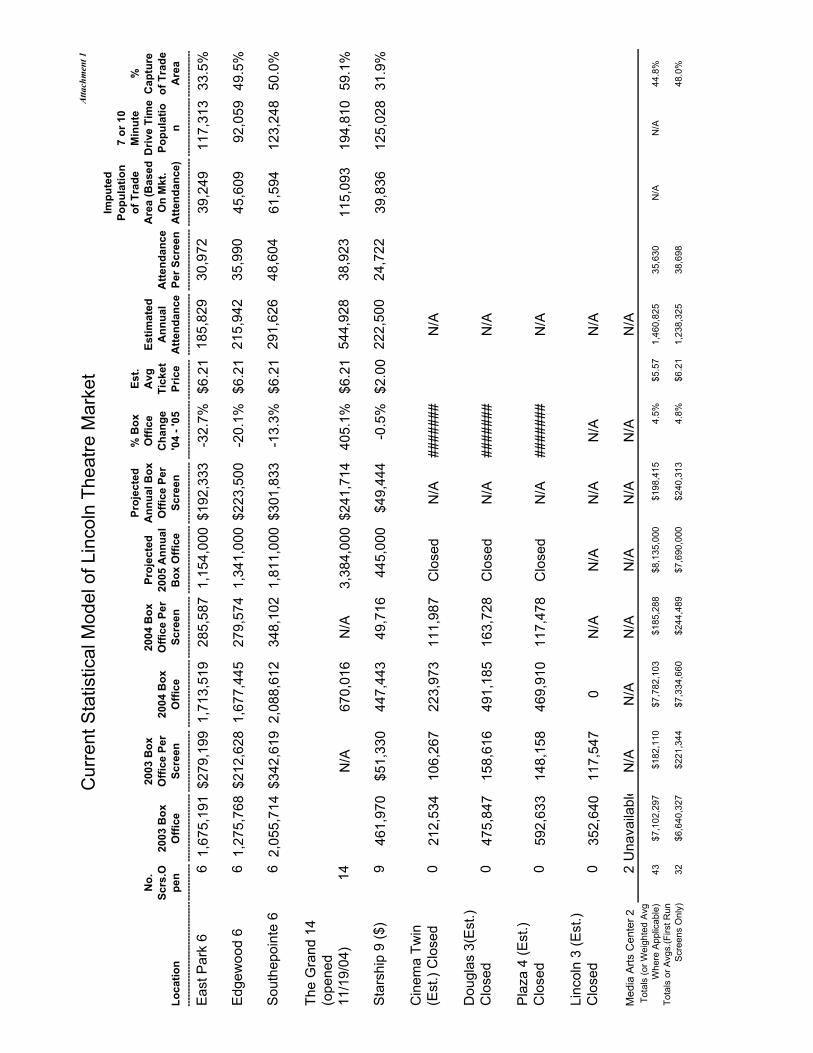
Existing Base of Movie Theatres Serving Lincoln
2003 Box 2004 Box Projected AnnualLocation Office Revenues Office Revenues Box Office Revenues(1)
Per ScreenEast Park 6 $1,675,191 $1,713,519 $1,154,000 $192,333Edgewood 6 $1,275,768 $1,677,445 $1,341,000 $223,500Southpointe 6 $2,055,714 $2,088,612 $1,811,000 $301,833The Grand 14 Opened 11/19/04 $ 670,016 $3,384,000 $241,714Starship 9 ($) $ 461,970 $ 447,443 $ 455,000 $ 50,523Media Arts Center 2Cinema Twin(Est.) $ 212,534 $ 223,973 Closed due to The Grand 14Douglas 3 $ 475,847 $ 491,185 Closed “Plaza 4 $ 592,633 $ 469,910 Closed “Lincoln 3 $ 352,640 $ -0- Closed “
Total Screens 43 $7,102,297 $7,782,103 $8,135,000
(1) Normalized annual box office projections taking into account the opening of the Grand 14 inNovember of 2004.
The Lincoln, NE populace of 261,545 is served by 43 total operating movie screens, which equates to aratio of population to screen count of 6,082:1. According to the Motion Picture Association’s 2004Market Statistics, the U.S. as a whole in 2004 contained one screen for every 8,207 people, indicatingthat Lincoln has approximately 35% more screens per person than the U.S. as a whole. The movietheatre industry’s longstanding “rule of thumb” for the amount of population that it takes to economicallysupport a movie screen has dropped in recent years from 10,000:1, to a range of between 8,000 to 9,000people per screen. This drop in the number of people required to support a movie screen has been fueledprimarily by a 40% increase in movie screens since 1994, as compared to attendance growth of only 19%over the same period.
An additional 6 screens have been approved in north Lincoln at the intersection of Folkways Boulevard,and N 27th, near the Lincoln Crossing regional shopping center. Construction of this approved theatrelocation will raise the screen count in the Lincoln market to 49 screens.
The estimated average attendance per person in the Lincoln trade area of 5.59 visits per year in 2004, vs.the U.S. average of 5.23 visits per person in 2004 (source: MPA Worldwide Market Research, 2004 MPAMarket Statistics) supports the conclusion that the market is approximately 35% over screened.
Theater Feasibility Study
Lincoln, NE May 2005-4-
D. Discussion of Film ZonesTheatre attendance is affected by a myriad of different variables, but probably the most misunderstood,yet most important factor is “film zones.” A film zone is simply a geographic area determined by boththe various film distribution companies and theatre operator’s (exhibition companies), where movietheatres located within the “zone” or geographical area (because of their physical proximity to oneanother, and the costs of distributing film prints), are not allowed to license and exhibit the same films. All theatres in the United States are entitled to license film product, but those located within the same filmzone, do not license or exhibit the same films simultaneously.
The proposed Prairie Lake location, at 2.5 air miles and 2.7 driving miles from the Edgewood 6, is tooclose by historical distribution practices for the two locations to exhibit the same films at the same time(or in industry terms, to “play day and date”). Typical geographic separation between theatre locationshas been 4-5 miles in order for theatres to play “day and date.” In this case, unless the Edgewood 6closes, a theatre developed upon the proposed site at 84th Street and Hwy. 2 would “share the film zone”with the Edgewood 6, and split film product with this existing 6 screen movie theatre. In other words, ifthe proposed new theatre site were open this summer, only one of the movie theatres would be allocated aprint of May 19, 2005’s blockbuster release, “Star Wars - Episode III - Revenge of the Sith.” Likewiseonly one of these two theatres would receive a “print” of “Madagascar,” “Batman,” etc.
Film allocation between competitive theatres is not simply a mathematical equation based on screencount. While screen count does play a role, in practice both the number of films and the quality of filmsfrom each separate distributor is also a factor. “A” titles (those expected to produce big box officegrosses) are more evenly allocated between locations or exhibitors than a pure mathematical allocationwould indicate, as film distributors do not want to be accused of “favoring” one location over another. The overall history and relationship between the exhibitor and the film company(s) also plays a role infilm allocation. At its best, film allocation is quite subjective, taking into account many factors, includingoverall market penetration of the exhibitor, as well as the booking savvy and ability of the particularexhibitor to predict a film’s success, and to ultimately position itself in the film rotation to receive themost lucrative film allocations.
The economic success of modern, stadium style mega-plex movie theatres, especially in smaller tradeareas, is very dependent upon achieving a “free film zone.” Film allocation among theatres located withina film zone directly affects the economic health and viability of those theatres, as particular films will beallocated to one or the other of the locations, but not to each of them. This phenomenon negativelyaffects the revenue streams of the theatres located within the same film zone, many times rendering one ormore of the locations operating in a competitive film zone economically unviable.
Theater Feasibility Study
Lincoln, NE May 2005-5-
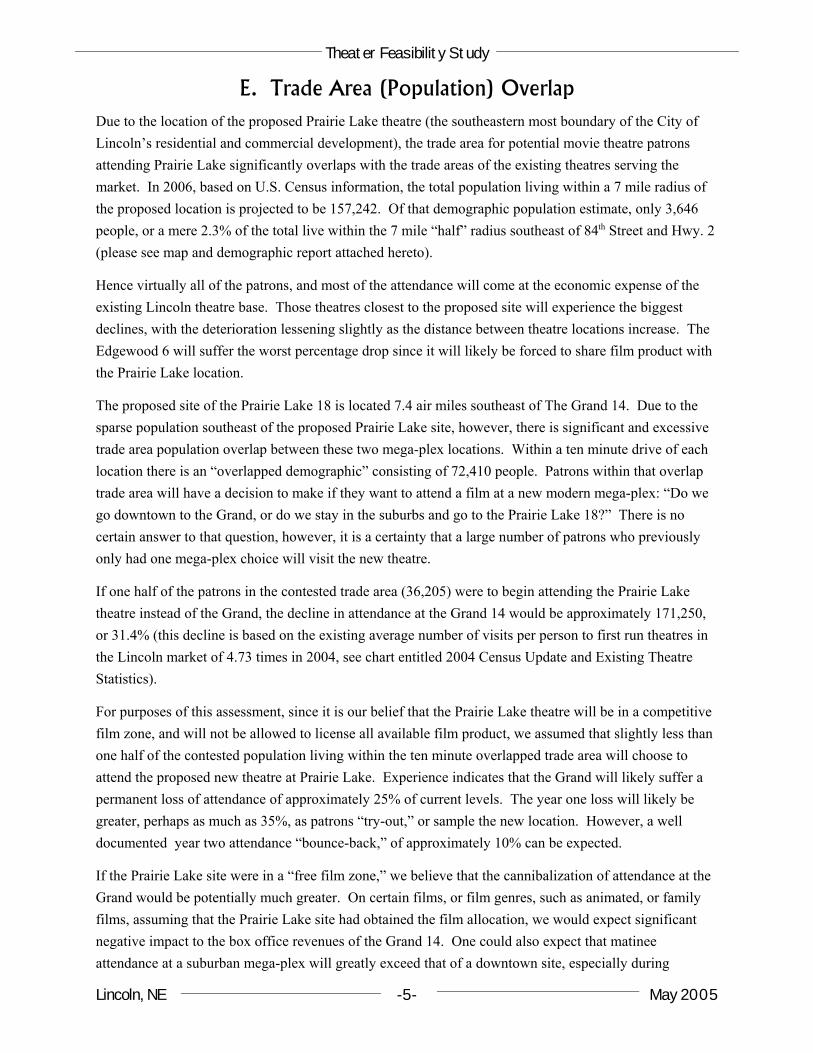
E. Trade Area (Population) OverlapDue to the location of the proposed Prairie Lake theatre (the southeastern most boundary of the City ofLincoln’s residential and commercial development), the trade area for potential movie theatre patronsattending Prairie Lake significantly overlaps with the trade areas of the existing theatres serving themarket. In 2006, based on U.S. Census information, the total population living within a 7 mile radius ofthe proposed location is projected to be 157,242. Of that demographic population estimate, only 3,646people, or a mere 2.3% of the total live within the 7 mile “half” radius southeast of 84th Street and Hwy. 2(please see map and demographic report attached hereto).
Hence virtually all of the patrons, and most of the attendance will come at the economic expense of theexisting Lincoln theatre base. Those theatres closest to the proposed site will experience the biggestdeclines, with the deterioration lessening slightly as the distance between theatre locations increase. TheEdgewood 6 will suffer the worst percentage drop since it will likely be forced to share film product withthe Prairie Lake location.
The proposed site of the Prairie Lake 18 is located 7.4 air miles southeast of The Grand 14. Due to thesparse population southeast of the proposed Prairie Lake site, however, there is significant and excessivetrade area population overlap between these two mega-plex locations. Within a ten minute drive of eachlocation there is an “overlapped demographic” consisting of 72,410 people. Patrons within that overlaptrade area will have a decision to make if they want to attend a film at a new modern mega-plex: “Do wego downtown to the Grand, or do we stay in the suburbs and go to the Prairie Lake 18?” There is nocertain answer to that question, however, it is a certainty that a large number of patrons who previouslyonly had one mega-plex choice will visit the new theatre.
If one half of the patrons in the contested trade area (36,205) were to begin attending the Prairie Laketheatre instead of the Grand, the decline in attendance at the Grand 14 would be approximately 171,250,or 31.4% (this decline is based on the existing average number of visits per person to first run theatres inthe Lincoln market of 4.73 times in 2004, see chart entitled 2004 Census Update and Existing TheatreStatistics).
For purposes of this assessment, since it is our belief that the Prairie Lake theatre will be in a competitivefilm zone, and will not be allowed to license all available film product, we assumed that slightly less thanone half of the contested population living within the ten minute overlapped trade area will choose toattend the proposed new theatre at Prairie Lake. Experience indicates that the Grand will likely suffer apermanent loss of attendance of approximately 25% of current levels. The year one loss will likely begreater, perhaps as much as 35%, as patrons “try-out,” or sample the new location. However, a welldocumented year two attendance “bounce-back,” of approximately 10% can be expected.
If the Prairie Lake site were in a “free film zone,” we believe that the cannibalization of attendance at theGrand would be potentially much greater. On certain films, or film genres, such as animated, or familyfilms, assuming that the Prairie Lake site had obtained the film allocation, we would expect significantnegative impact to the box office revenues of the Grand 14. One could also expect that matineeattendance at a suburban mega-plex will greatly exceed that of a downtown site, especially during
Theater Feasibility Study
Lincoln, NE May 2005-6-
summer months and holidays, when many public and private schools are closed.
Mega-Plex theatres, due to their ability to exhibit both more films, and to exhibit the most popular filmson numerous screens at multiple show times, have significantly larger trade areas than typical multiplextheatres. Many mega-plex theatres, due to their locations, and amenities, draw patronage from entiremarkets. Given the relatively low amount of traffic congestion in Lincoln, combined with the off peaktraffic time of most movie theatre attendance (nights, and weekends) the trade area for a mega-plex mighteasily extend to a 15 minute drive, or beyond.
In the analysis of the Prairie Lake site’s potential impact upon The Grand, it is important to note that the15 minute drive time population overlap between the two sites swells to 194,809 people. This overlapequates to 79% of the total population living within a 15 minute drive of the Grand 14, and 99.3% of thetotal population living within a 15 minute drive of the proposed Prairie Lake location. For this reason,our expected attendance decline of 25% at The Grand, should be viewed as a minimum. The potentialmagnitude of the attendance decline of The Grand 14 could be much greater.
Executive Summary of Statistical & Financial Model
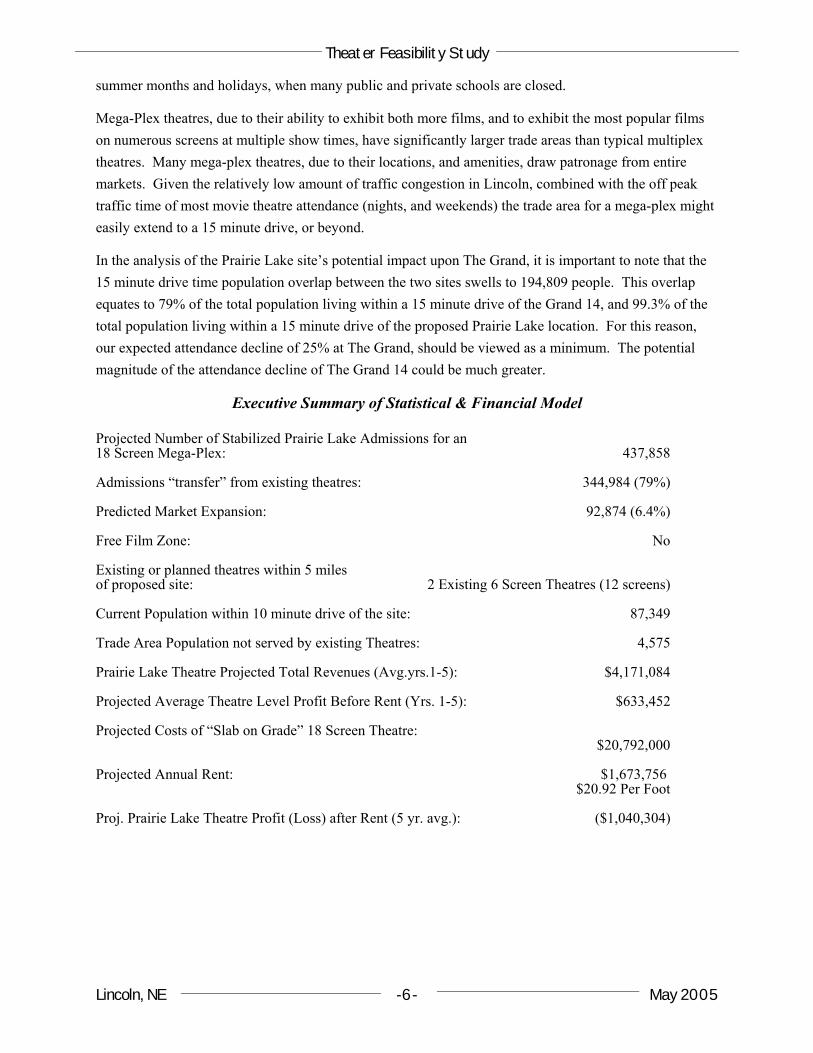
Projected Number of Stabilized Prairie Lake Admissions for an 18 Screen Mega-Plex: 437,858
Admissions “transfer” from existing theatres: 344,984 (79%)
Predicted Market Expansion: 92,874 (6.4%)
Free Film Zone: No
Existing or planned theatres within 5 milesof proposed site: 2 Existing 6 Screen Theatres (12 screens)
Current Population within 10 minute drive of the site: 87,349
Trade Area Population not served by existing Theatres: 4,575
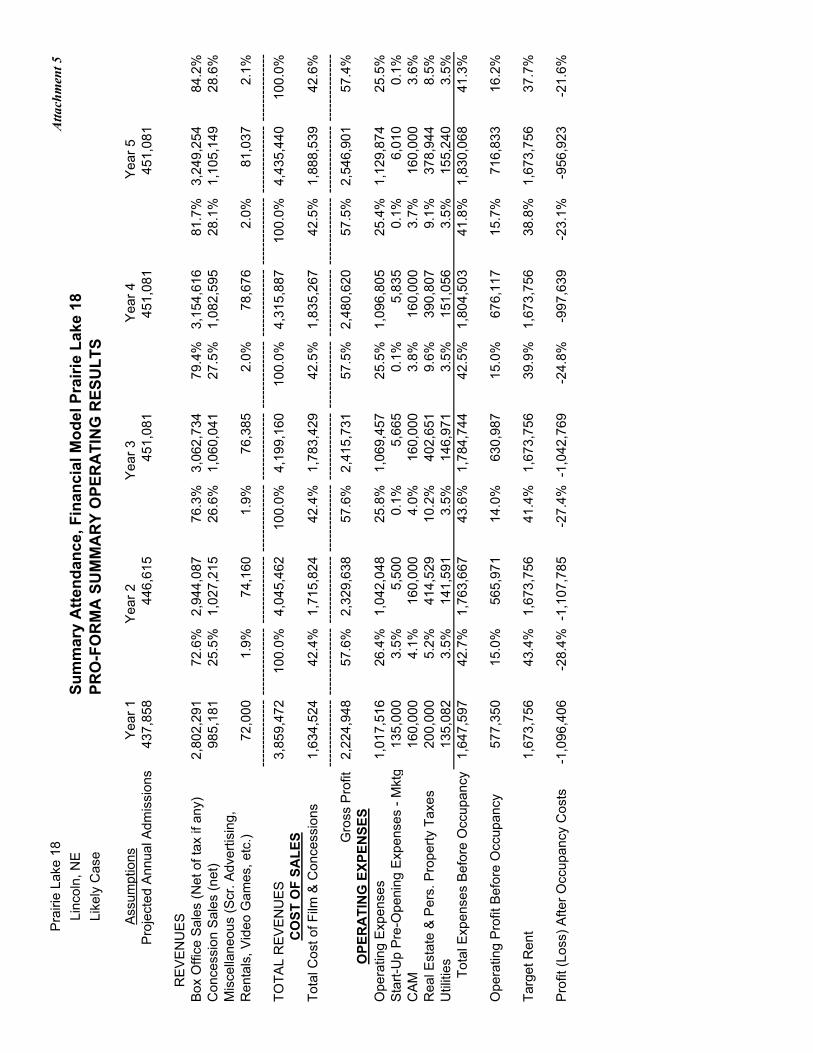
Prairie Lake Theatre Projected Total Revenues (Avg.yrs.1-5): $4,171,084
Projected Average Theatre Level Profit Before Rent (Yrs. 1-5): $633,452
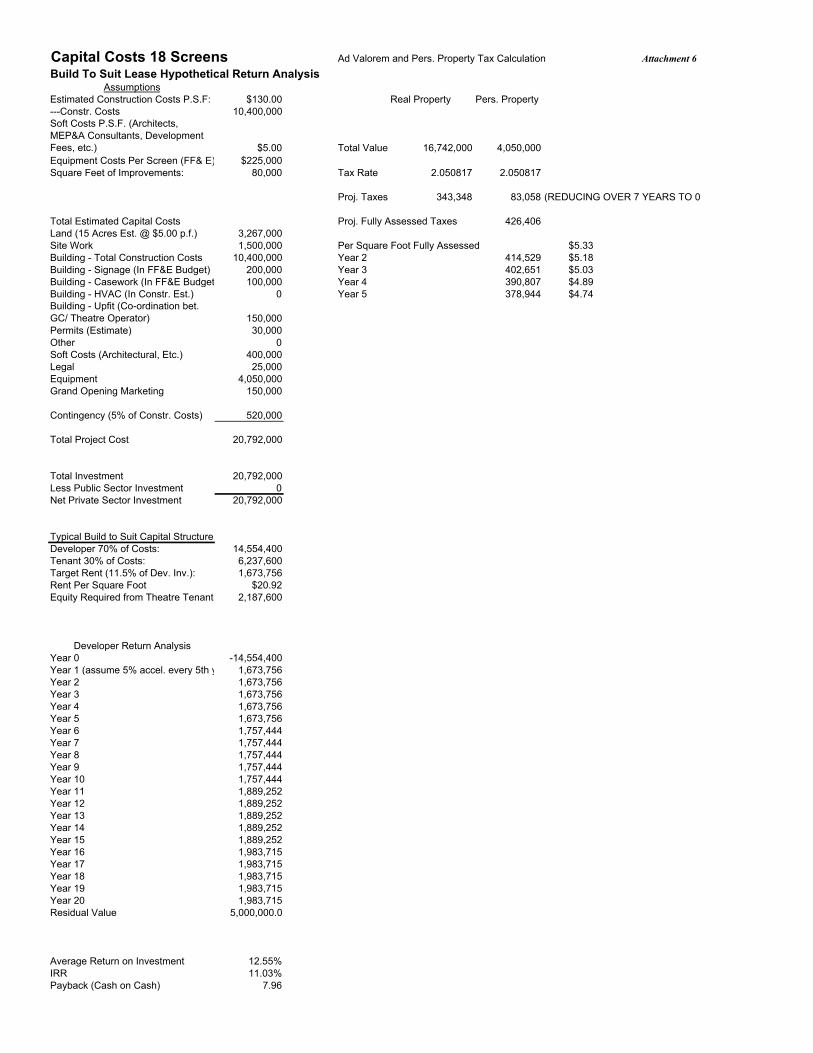
Projected Costs of “Slab on Grade” 18 Screen Theatre:$20,792,000
Projected Annual Rent: $1,673,756 $20.92 Per Foot
Proj. Prairie Lake Theatre Profit (Loss) after Rent (5 yr. avg.): ($1,040,304)
Theater Feasibility Study
Lincoln, NE May 2005-7-
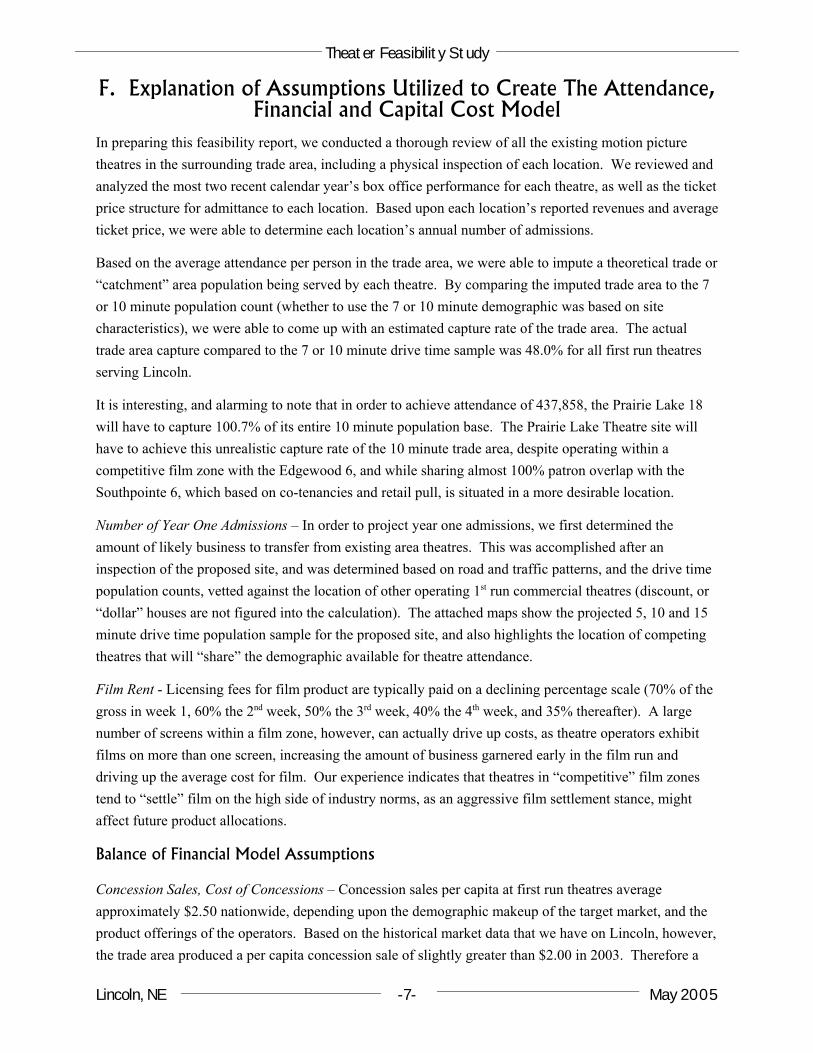
F. Explanation of Assumptions Utilized to Create The Attendance,Financial and Capital Cost Model
In preparing this feasibility report, we conducted a thorough review of all the existing motion picturetheatres in the surrounding trade area, including a physical inspection of each location. We reviewed andanalyzed the most two recent calendar year’s box office performance for each theatre, as well as the ticketprice structure for admittance to each location. Based upon each location’s reported revenues and averageticket price, we were able to determine each location’s annual number of admissions.
Based on the average attendance per person in the trade area, we were able to impute a theoretical trade or“catchment” area population being served by each theatre. By comparing the imputed trade area to the 7or 10 minute population count (whether to use the 7 or 10 minute demographic was based on sitecharacteristics), we were able to come up with an estimated capture rate of the trade area. The actualtrade area capture compared to the 7 or 10 minute drive time sample was 48.0% for all first run theatresserving Lincoln.
It is interesting, and alarming to note that in order to achieve attendance of 437,858, the Prairie Lake 18will have to capture 100.7% of its entire 10 minute population base. The Prairie Lake Theatre site willhave to achieve this unrealistic capture rate of the 10 minute trade area, despite operating within acompetitive film zone with the Edgewood 6, and while sharing almost 100% patron overlap with theSouthpointe 6, which based on co-tenancies and retail pull, is situated in a more desirable location.
Number of Year One Admissions – In order to project year one admissions, we first determined theamount of likely business to transfer from existing area theatres. This was accomplished after aninspection of the proposed site, and was determined based on road and traffic patterns, and the drive timepopulation counts, vetted against the location of other operating 1st run commercial theatres (discount, or“dollar” houses are not figured into the calculation). The attached maps show the projected 5, 10 and 15minute drive time population sample for the proposed site, and also highlights the location of competingtheatres that will “share” the demographic available for theatre attendance.
Film Rent - Licensing fees for film product are typically paid on a declining percentage scale (70% of thegross in week 1, 60% the 2nd week, 50% the 3rd week, 40% the 4th week, and 35% thereafter). A largenumber of screens within a film zone, however, can actually drive up costs, as theatre operators exhibitfilms on more than one screen, increasing the amount of business garnered early in the film run anddriving up the average cost for film. Our experience indicates that theatres in “competitive” film zonestend to “settle” film on the high side of industry norms, as an aggressive film settlement stance, mightaffect future product allocations.
Balance of Financial Model Assumptions
Concession Sales, Cost of Concessions – Concession sales per capita at first run theatres averageapproximately $2.50 nationwide, depending upon the demographic makeup of the target market, and theproduct offerings of the operators. Based on the historical market data that we have on Lincoln, however,the trade area produced a per capita concession sale of slightly greater than $2.00 in 2003. Therefore a
Theater Feasibility Study
Lincoln, NE May 2005-8-
$2.25 average concession sale was extrapolated due to inflation. A 15%-18% cost of concession itemsshould be anticipated depending upon the mix of sales, and buying power of the operator. Larger chainsare able to drive their cost of concessions much lower based on volume purchase discounts, and purchaserebates. Some chains have concession costs that are well below 10%.
Annual Lease Costs Per Square Foot – The rent figure of approximately $1,600,000 was calculated byapplying an 11.5% “cap rate” to the “developer’s” 70% of the projected costs of the Prarie Lake theatre,and then dividing the result by the projected square feet of the theatre building, which at 80,000 squarefeet results in a $20.00 per foot rent. This per square foot rent is a bit high for an 80,000 square footanchor, but unless the developer is willing to subsidize the theatre (which many times does happen), dueto its inherent costs and intensive land use, the projected rent is in a realistic range. In order to absorbthese very high rent factors, most mega-plex theatres are built with the anticipation of achieving year oneadmissions of 800,000 to 1,000,000. With this number of admissions required to cover the occupancycosts, and produce a profit, it is easy to understand why most mega-plex theatres are constructed in largermarkets, with trade area population draws of 150,000 to 200,000.
Common Area Maintenance Expense (CAM); Real and Personal Property Taxes – Common areamaintenance is an estimated cost based on past experience of approximately $2.00 per square feet ofbuilding area, which may include some subsidy from the “small shop” tenants. This line item includesthe cleaning, sweeping, snow removal, and maintenance of the exterior grounds, and parking lot. The realestate and personal property taxes, are calculated on the current levy within the City of Lincoln, which is$2.0508170 per $100 dollars in assessed value. The declining amount reflects the depreciation (for taxpurposes) of the personal property at an accelerated rate of 7 years.
Operating Expenses - The pro-forma operating expenses are based upon our industry knowledge of thecosts to operate mega-plex theatres, and include appropriate estimates for labor, repair and maintenance,appropriate service contracts, and estimations of utilities, phone service, etc.
Capital Required to Complete the Project
Construction Costs - Based upon our past experience constructing motion pictures theatres, as well ascurrent trends regarding the cost of construction, we estimate that the per square foot construction costs,to build a theatre upon the proposed site is $130.00 per foot. This estimate assumes a “pad ready” sitewith utilities stubbed to within 5 feet of the building’s “utility” entrance. This cost estimate does notinclude any cost for rough, or fine grading, pad preparation, parking lot construction, curbs, side walks, orlandscaping.
Other Capital Costs - In addition to the $130.00 per square foot for construction, other expense items thatwill be incurred include: building permits; architectural design fees (including mechanical, structural,plumbing, electrical, and acoustical engineering fees); legal costs; costs for coordination of theatre up-fitbetween general contractor and equipment installer’s; the theatre equipment (FF&E) including screens,frames, drapes & wall coverings, seats, sound systems, projectors, concession stand and equipment, boxoffice mill work, point of sale system, and building signage both interior and exterior). We estimate thatthe cost of all FF&E items, including signage, to approximate $225,000 per screen. We have included a
Theater Feasibility Study
Lincoln, NE May 2005-9-
contingency equal to 5% of the costs of construction. This contingent figure should be budgeted tohandle RFI’s (requests for information or drawing clarifications), change orders, adverse weatherconditions, etc.
Land Cost; Site Work - According to the City of Lincoln’s property assessment office, equivalent land inthe immediate area surrounding the proposed Prairie Lake site, has been valued in a range of $3.50 persquare foot to in excess of $6.50 per foot for smaller, “frontage” parcels. For a large tract to handle atheatre, with access, utilities and zoning, we estimate the value of land at approximately $5.00 per squarefoot, or $174,240 per acre. This estimate places a value on 15 acres at the proposed site of approximately$3,267,000. A reasonable estimate for site work and site engineering is $100,000 per acre, producing anestimated cost for 15 acres equal to $1,500,000. The estimated grand total cost of the project, including avalue for 15 acres of land, the estimated site work, the equipment, signage, soft costs and contingency is$20,792,000, or $1,155,111 per screen.
Financial Model Summary – The financial model is the synthesis of the market demographic research,and combines the projected attendance and projected costs into a single model that can be utilized tomake a “go, no go” decision. In most cases, chain retailers look for cash on cash returns that average20% or more, as there is little residual value at the end of the term in a leased location. In the attachedmodel, based on a twenty year building lease, and an investment of approximately $6,000,000 (FF&Eplus architectural and up fit, and leasehold costs), we predict that a theatre operator at Prairie Lake willnever achieve a return on investment, and that no prudent theatre operator would build the proposedtheatre on the proposed site.
Theater Feasibility Study
Lincoln, NE May 2005-10-
G. Summary & ConclusionsThe successful operation of movie theatres is highly dependent upon achieving reasonable volumes ofattendance. Once break even attendance is achieved, theatres can prosper into lucrative businesses. Dueto the embedded and inelastic cost structure of operating mega-plex theatres (i.e., high fixed costs forlabor, occupancy [or debt amortization], utilities and upkeep), if appropriate volumes are not attained,locations may never achieve positive cash flow.
Based on the predicted attendance decline at the Grand 14 due to the opening of a mega-plex at PrairieLake, it will be difficult if not impossible for the Grand to produce enough profit to cover its estimateddebt service, or to produce a return on investment for the operator. An attendance shift to the proposedPrairie Lake Mega-Plex Theatre will cause economic hardship not only to the existing theatres alreadyserving an over screened market, but also to the nearby retail and food establishments relying upon thetraffic (business) generated by theatre patrons.
Due to the abundance of screens already serving the Lincoln, NE market, it is unlikely that a prudenttheatre operator would incur the economic risk of constructing a mega-plex upon the proposed PrairieLake site. The trade area population overlap, combined with the sparse population to the southeast, andthe proximity to the Edgewood 6 significantly diminish the economic prospects for a theatre at theproposed location.
I:\Downtown\Movie Theater Policy\REPORT\Theatre_Feasibility_Study.wpd
Cur
rent
Sta
tistic
al M
odel
of L
inco
ln T
heat
re M
arke
tA
ttach
men
t 1
Loca
tion
No.
Scrs
.Ope
n20
03 B
ox
Offi
ce
2003
Box
O
ffice
Per
Sc
reen
2004
Box
O
ffice
2004
Box
O
ffice
Per
Sc
reen
Proj
ecte
d20
05 A
nnua
l B
ox O
ffice
Proj
ecte
dA
nnua
l Box
O
ffice
Per
Sc
reen
% B
ox
Offi
ceC
hang
e'0
4 - '
05
Est.
Avg
Tick
etPr
ice
Estim
ated
Ann
ual
Atte
ndan
ceA
ttend
ance
Per S
cree
n
Impu
ted
Popu
latio
nof
Tra
de
Are
a (B
ased
O
n M
kt.
Atte
ndan
ce)
7 or
10
Min
ute
Driv
e Ti
me
Popu
latio
n
%C
aptu
reof
Tra
de
Are
a---
------
------
------
------
------
-----
------
-----
------
------
------
-----
------
------
-----
------
------
------
------
------
------
-----
------
------
------
-----
------
------
------
-----
------
------
------
------
----
------
------
------
-----
------
------
-----
------
------
------
-----
------
------
------
------
------
---E
ast P
ark
66
1,67
5,19
1$2
79,1
991,
713,
519
285,
587
1,15
4,00
0$1
92,3
33-3
2.7%
$6.2
118
5,82
930
,972
39,2
4911
7,31
333
.5%
Edg
ewoo
d6
61,
275,
768
$212
,628
1,67
7,44
527
9,57
41,
341,
000
$223
,500
-20.
1%$6
.21
215,
942
35,9
9045
,609
92,0
5949
.5%
Sou
thep
oint
e6
62,
055,
714
$342
,619
2,08
8,61
234
8,10
21,
811,
000
$301
,833
-13.
3%$6
.21
291,
626
48,6
0461
,594
123,
248
50.0
%
The
Gra
nd 1
4 (o
pene
d11
/19/
04)
14N
/A67
0,01
6N
/A3,
384,
000
$241
,714
405.
1%$6
.21
544,
928
38,9
2311
5,09
319
4,81
059
.1%
Sta
rshi
p 9
($)
946
1,97
0$5
1,33
044
7,44
349
,716
445,
000
$49,
444
-0.5
%$2
.00
222,
500
24,7
2239
,836
125,
028
31.9
%
Cin
ema
Twin
(E
st.)
Clo
sed
021
2,53
410
6,26
722
3,97
311
1,98
7C
lose
dN
/A##
####
#N
/A
Dou
glas
3(E
st.)
Clo
sed
047
5,84
715
8,61
649
1,18
516
3,72
8C
lose
dN
/A##
####
#N
/A
Pla
za 4
(Est
.) C
lose
d0
592,
633
148,
158
469,
910
117,
478
Clo
sed
N/A
####
###
N/A
Linc
oln
3 (E
st.)
Clo
sed
035
2,64
011
7,54
70
N/A
N/A
N/A
N/A
N/A
Med
ia A
rts C
ente
r 22
Una
vaila
ble
N/A
N/A
N/A
N/A
N/A
N/A
N/A
Tota
ls (o
r Wei
ghte
d A
vg
Whe
re A
pplic
able
)43
$7,1
02,2
97$1
82,1
10$7
,782
,103
$185
,288
$8,1
35,0
00$1
98,4
154.
5%$5
.57
1,46
0,82
535
,630
N/A
N/A
44.8
%To
tals
or A
vgs.
(Firs
t Run
S
cree
ns O
nly)
32$6
,640
,327
$221
,344
$7,3
34,6
60$2
44,4
89$7
,690
,000
$240
,313
4.8%
$6.2
11,
238,
325
38,6
9848
.0%
2004
Cen
sus
Upd
ate
and
Exi
stin
g Th
eatre
Sta
tistic
sA
ttach
men
t 2
2004
U.S
. C
ensu
s B
urea
u E
st. B
ased
on
2000
Cen
sus
Pop
ulat
ion
of L
inco
ln
and
Lanc
aste
r Cou
nty
(Incl
udin
g S
tude
nt
Pop
ulat
ion)
Tra
de A
rea
of 8
39 S
q. M
iles
261,
545
261,
545
6,08
2
8,20
7 (S
ourc
e: M
PA
Mar
ket R
esea
rch)
34.9
3%
$31.
10
$5.5
7
$6.2
1
5.59
4.73
Avg
. Firs
t Run
Vis
its P
er P
erso
n in
Tr
ade
Are
a
U.S
. Avg
. 5.2
3 in
200
4 (S
ourc
e M
PA
Mar
ket R
esea
rch)
Tota
l Est
imat
ed P
opul
atio
n
Tota
l Num
ber o
f Scr
eens
Per
P
erso
n in
Tra
de A
rea
Scr
eens
Per
Per
son
in U
nite
d S
tate
s as
a W
hole
Exc
ess
Scr
eens
as
a P
erce
ntag
e vs
. U.S
.
Pro
ject
ed 2
004
Box
Offi
ce
Exp
endi
ture
Per
Per
son
in T
rade
A
rea
Pro
ject
ed A
vera
ge T
icke
t Pric
e
Ave
rage
1st
Run
Adm
issi
on P
rice
Ann
ual E
stim
ated
Mov
ie T
heat
re
Vis
its P
er P
erso
n in
Tra
de A
rea

Pro
-For
ma
Sta
tistic
al M
odel
of L
inco
ln T
heat
re M
arke
t Afte
r Add
ition
of P
rarie
Lak
e 18
Atta
chm
ent 3
Loca
tion
No.
Scrs
.O
pen
Exis
ting
Ann
ual
Atte
ndan
ce
Stab
ilize
dA
ttend
ance
Dro
p D
ue to
N
ewC
onst
ruct
ion
(1)
Proj
ecte
dM
arke
tA
ttend
ance
Expa
nsio
n
Proj
ecte
dA
nnua
lA
ttend
ance
Post
Pra
irie
Lake
Proj
ecte
dA
nnua
lA
ttend
ance
Per S
cree
n
Proj
ecte
dA
nnua
l Box
O
ffice
Rev
enue
sPo
st P
rairi
e La
ke
Proj
ecte
dA
nnua
l Box
O
ffice
Per
Sc
reen
Est.
Ave
rage
Tick
etPr
ice
Impu
ted
Trad
e A
rea
Bas
ed o
n A
ttend
ance
at 1
st R
un
Thea
tres
7 or
10
Min
ute
Driv
e Ti
me
Popu
latio
n
% C
aptu
re
of T
rade
A
rea
Trad
e A
rea
Ove
rlap
W/
Prop
osed
Site
% O
verla
p
15 M
inut
e Po
pula
tion
Sam
ple
Popu
latio
nO
verla
p%
Ove
rlap
------
------
------
------
------
----
------
-----
------
------
-----
------
------
------
------
-----
------
------
-----
------
------
------
-----
------
------
------
------
------
------
-----
------
------
------
-----
------
------
------
------
------
-----
------
------
-----
------
------
------
------
------
------
------
------
----
------
------
------
----
------
------
----
------
------
---E
ast P
ark
66
185,
829
-15.
0%15
7,95
526
,326
1,01
0,91
1$1
68,4
85$6
.40
31,7
2911
7,31
327
.0%
37,0
7631
.6%
Edg
ewoo
d 6
621
5,94
2-5
0.0%
107,
971
17,9
9569
1,01
4$1
15,1
69$6
.40
21,6
8992
,059
23.6
%79
,912
86.8
%
Sou
thep
oint
e 6
629
1,62
6-2
5.0%
218,
720
36,4
531,
399,
807
$233
,301
$6.4
043
,935
117,
852
37.3
%10
7,28
291
.0%
The
Gra
nd 1
4 (o
pene
d11
/19/
04)
1454
4,92
8-2
5.0%
408,
696
29,1
932,
615,
652
$186
,832
$6.4
082
,096
194,
810
42.1
%72
,410
37.2
%24
7,30
819
4,80
978
.8%
Sta
rshi
p 9
($)
922
2,50
0N
/A22
2,50
024
,722
222,
500
$24,
722
$2.0
038
,294
125,
028
30.6
%
Cin
ema
Twin
(E
st.)
Clo
sed
0C
lose
dN
/AN
/A
Dou
glas
3(E
st.)
Clo
sed
0C
lose
dN
/AN
/A
Pla
za 4
(Est
.) C
L0
Clo
sed
N/A
N/A
Linc
oln
3 (E
st.)
CL
0N
/AN
/AN
/A
Med
ia A
rts C
entN
/AN
/AN
/AN
/A
Pro
pose
dP
rarie
Lak
e 18
18A
tt.Tr
ansf
er:
344,
984
92,8
7443
7,85
824
,325
2,80
2,29
3$1
55,6
83$6
.40
87,9
5487
,349
100.
7%19
6,11
1To
tals
(or
Wei
ghte
d A
vg.
Whe
reA
pplic
able
)59
1,46
0,82
51,
553,
700
26,3
34$8
,742
,178
$26,
334
$5.6
326
7,40
4N
/A32
.1%
Tota
ls o
r A
vgs.
(Firs
t Run
S
cree
ns O
nly)
501,
238,
325
1,33
1,20
026
,624
$8,5
19,6
78$2
6,62
4$6
.40
32.5
%
2006
Cen
sus
Upd
ate
W/ G
row
th A
pplie
d &
Pro
ject
ed T
heat
re S
tatis
tics
Atta
chm
ent 4
2004
U.S
. C
ensu
s B
urea
u E
st. B
ased
on
2000
Cen
sus
Pop
ulat
ion
of L
inco
ln
and
Lanc
aste
r Cou
nty
(Incl
udin
g S
tude
nt
Pop
ulat
ion)
Tra
de A
rea
of 8
39 S
q. M
iles
261,
545
Ann
ual G
row
th R
ate
2001
-200
41.
12%
267,
404
4,53
2
8,20
7 (S
ourc
e: 2
004
MP
A M
arke
t Res
earc
h)
81.0
8%
5,34
8
$32.
69
$5.6
3
$6.4
0
5.81
4.98
Avg
. Firs
t Run
Vis
its P
er P
erso
n in
Tra
de A
rea
U.S
. Avg
. 5.2
3 in
200
4 (S
ourc
e M
PA
Mar
ket R
esea
rch)
Tota
l Est
imat
ed P
opul
atio
n in
20
06 (2
.24%
incr
ease
ove
r 20
04)
Num
ber o
f Scr
eens
Per
Per
son
in T
rade
Are
a
Scr
eens
Per
Per
son
in U
nite
d S
tate
s as
a W
hole
Exc
ess
Scr
eens
as
a P
erce
ntag
e vs
. U.S
.
Num
ber o
f Firs
t Run
Scr
eens
P
er P
erso
n in
Tra
de A
rea
Pro
ject
ed B
ox O
ffice
E
xpen
ditu
re P
er P
erso
n in
Tr
ade
Are
a
Pro
ject
ed A
vera
ge T
icke
t Pric
e
Ave
rage
1st
Run
Adm
issi
on
Pric
e
Ann
ual E
stim
ated
Mov
ie
Thea
tre V
isits
Per
Per
son
in
Trad
e A
rea
Pra
irie
Lake
18
Atta
chm
ent 5
Linc
oln,
NE
Sum
mar
y A
ttend
ance
, Fin
anci
al M
odel
Pra
irie
Lake
18
Like
ly C
ase
PRO
-FO
RM
A S
UM
MA
RY
OPE
RA
TIN
G R
ESU
LTS
Ass
umpt
ions
Yea
r 1Y
ear 2
Yea
r 3Y
ear 4
Yea
r 5P
roje
cted
Ann
ual A
dmis
sion
s 43
7,85
844
6,61
545
1,08
145
1,08
145
1,08
1
R
EV
EN
UE
SB
ox O
ffice
Sal
es (N
et o
f tax
if a
ny)
2,80
2,29
172
.6%
2,94
4,08
776
.3%
3,06
2,73
479
.4%
3,15
4,61
681
.7%
3,24
9,25
484
.2%
Con
cess
ion
Sal
es (n
et)
985,
181
25.5
%1,
027,
215
26.6
%1,
060,
041
27.5
%1,
082,
595
28.1
%1,
105,
149
28.6
%M
isce
llane
ous
(Scr
. Adv
ertis
ing,
R
enta
ls, V
ideo
Gam
es, e
tc.)
72,0
001.
9%74
,160
1.9%
76,3
852.
0%78
,676
2.0%
81,0
372.
1%--
----
----
----
---
----
----
----
---
----
----
----
---
----
----
----
---
----
----
----
---
----
----
----
---
----
----
----
---
----
----
----
---
----
----
----
---
----
----
----
-TO
TAL
RE
VE
NU
ES
3,85
9,47
210
0.0%
4,04
5,46
210
0.0%
4,19
9,16
010
0.0%
4,31
5,88
710
0.0%
4,43
5,44
010
0.0%
CO
ST O
F SA
LES
Tota
l Cos
t of F
ilm &
Con
cess
ions
1,63
4,52
442
.4%
1,71
5,82
442
.4%
1,78
3,42
942
.5%
1,83
5,26
742
.5%
1,88
8,53
942
.6%
----
----
----
---
----
----
----
---
----
----
----
---
----
----
----
---
----
----
----
---
----
----
----
---
----
----
----
---
----
----
----
---
----
----
----
---
----
----
----
---
Gro
ss P
rofit
2,22
4,94
857
.6%
2,32
9,63
857
.6%
2,41
5,73
157
.5%
2,48
0,62
057
.5%
2,54
6,90
157
.4%
OPE
RA
TIN
G E
XPEN
SES
Ope
ratin
g E
xpen
ses
1,01
7,51
626
.4%
1,04
2,04
825
.8%
1,06
9,45
725
.5%
1,09
6,80
525
.4%
1,12
9,87
425
.5%
Sta
rt-U
p P
re-O
peni
ng E
xpen
ses
- Mkt
g13
5,00
03.
5%5,
500
0.1%
5,66
50.
1%5,
835
0.1%
6,01
00.
1%C
AM
160,
000
4.1%
160,
000
4.0%
160,
000
3.8%
160,
000
3.7%
160,
000
3.6%
Rea
l Est
ate
& P
ers.
Pro
perty
Tax
es20
0,00
05.
2%41
4,52
910
.2%
402,
651
9.6%
390,
807
9.1%
378,
944
8.5%
Util
ities
135,
082
3.5%
141,
591
3.5%
146,
971
3.5%
151,
056
3.5%
155,
240
3.5%
Tota
l Exp
ense
s B
efor
e O
ccup
ancy
1,64
7,59
742
.7%
1,76
3,66
743
.6%
1,78
4,74
442
.5%
1,80
4,50
341
.8%
1,83
0,06
841
.3%
Ope
ratin
g P
rofit
Bef
ore
Occ
upan
cy57
7,35
015
.0%
565,
971
14.0
%63
0,98
715
.0%
676,
117
15.7
%71
6,83
316
.2%
Targ
et R
ent
1,67
3,75
643
.4%
1,67
3,75
641
.4%
1,67
3,75
639
.9%
1,67
3,75
638
.8%
1,67
3,75
637
.7%
Pro
fit (L
oss)
Afte
r Occ
upan
cy C
osts
-1,0
96,4
06-2
8.4%
-1,1
07,7
85-2
7.4%
-1,0
42,7
69-2
4.8%
-997
,639
-23.
1%-9
56,9
23-2
1.6%
Capital Costs 18 Screens Ad Valorem and Pers. Property Tax Calculation Attachment 6Build To Suit Lease Hypothetical Return Analysis
AssumptionsEstimated Construction Costs P.S.F: $130.00 Real Property Pers. Property---Constr. Costs 10,400,000Soft Costs P.S.F. (Architects, MEP&A Consultants, Development Fees, etc.) $5.00 Total Value 16,742,000 4,050,000Equipment Costs Per Screen (FF& E) $225,000Square Feet of Improvements: 80,000 Tax Rate 2.050817 2.050817
Proj. Taxes 343,348 83,058 (REDUCING OVER 7 YEARS TO 0
Total Estimated Capital Costs Proj. Fully Assessed Taxes 426,406Land (15 Acres Est. @ $5.00 p.f.) 3,267,000Site Work 1,500,000 Per Square Foot Fully Assessed $5.33Building - Total Construction Costs 10,400,000 Year 2 414,529 $5.18Building - Signage (In FF&E Budget) 200,000 Year 3 402,651 $5.03Building - Casework (In FF&E Budget 100,000 Year 4 390,807 $4.89Building - HVAC (In Constr. Est.) 0 Year 5 378,944 $4.74Building - Upfit (Co-ordination bet. GC/ Theatre Operator) 150,000Permits (Estimate) 30,000Other 0Soft Costs (Architectural, Etc.) 400,000Legal 25,000Equipment 4,050,000Grand Opening Marketing 150,000
Contingency (5% of Constr. Costs) 520,000
Total Project Cost 20,792,000
Total Investment 20,792,000Less Public Sector Investment 0Net Private Sector Investment 20,792,000
Typical Build to Suit Capital StructureDeveloper 70% of Costs: 14,554,400Tenant 30% of Costs: 6,237,600Target Rent (11.5% of Dev. Inv.): 1,673,756Rent Per Square Foot $20.92Equity Required from Theatre Tenant 2,187,600
Developer Return AnalysisYear 0 -14,554,400Year 1 (assume 5% accel. every 5th y 1,673,756Year 2 1,673,756Year 3 1,673,756Year 4 1,673,756Year 5 1,673,756Year 6 1,757,444Year 7 1,757,444Year 8 1,757,444Year 9 1,757,444Year 10 1,757,444Year 11 1,889,252Year 12 1,889,252Year 13 1,889,252Year 14 1,889,252Year 15 1,889,252Year 16 1,983,715Year 17 1,983,715Year 18 1,983,715Year 19 1,983,715Year 20 1,983,715Residual Value 5,000,000.0
Average Return on Investment 12.55%IRR 11.03%Payback (Cash on Cash) 7.96
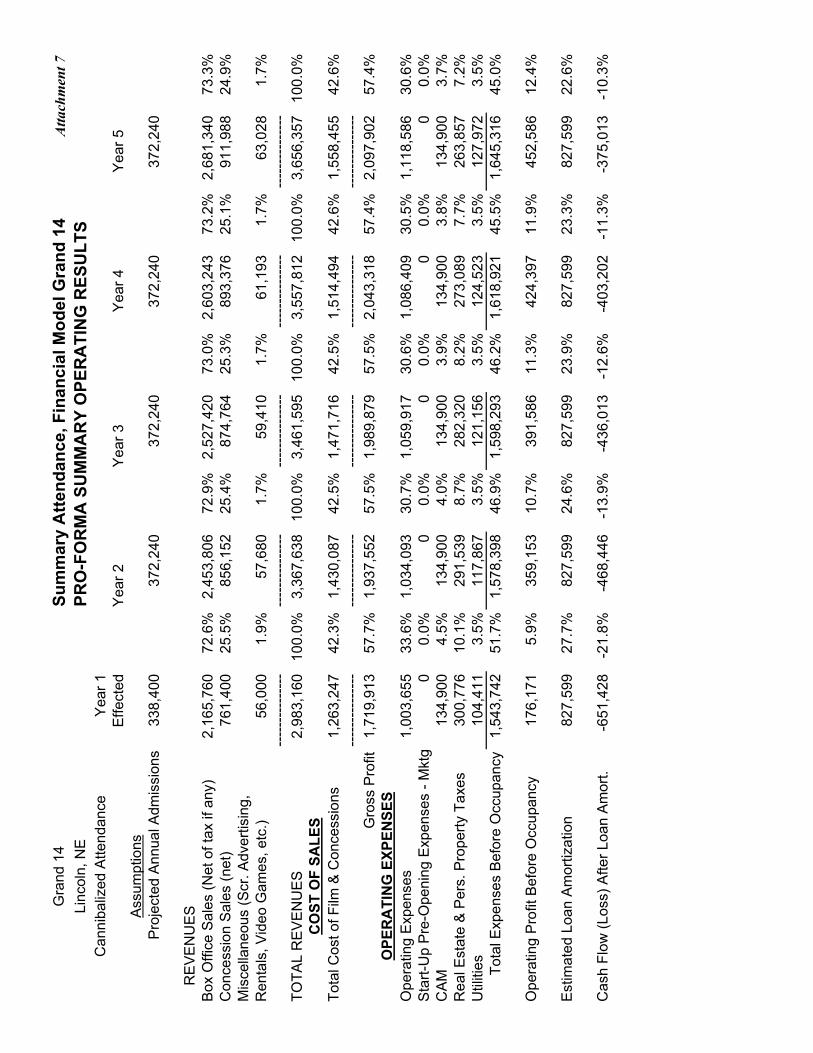
Gra
nd 1
4Su
mm
ary
Atte
ndan
ce, F
inan
cial
Mod
el G
rand
14
Atta
chm
ent 7
Linc
oln,
NE
PRO
-FO
RM
A S
UM
MA
RY
OPE
RA
TIN
G R
ESU
LTS
Can
niba
lized
Atte
ndan
ceY
ear 1
Effe
cted
Yea
r 2Y
ear 3
Yea
r 4Y
ear 5
Ass
umpt
ions
Pro
ject
ed A
nnua
l Adm
issi
ons
338,
400
372,
240
372,
240
372,
240
372,
240
R
EV
EN
UE
SB
ox O
ffice
Sal
es (N
et o
f tax
if a
ny)
2,16
5,76
072
.6%
2,45
3,80
672
.9%
2,52
7,42
073
.0%
2,60
3,24
373
.2%
2,68
1,34
073
.3%
Con
cess
ion
Sal
es (n
et)
761,
400
25.5
%85
6,15
225
.4%
874,
764
25.3
%89
3,37
625
.1%
911,
988
24.9
%M
isce
llane
ous
(Scr
. Adv
ertis
ing,
R
enta
ls, V
ideo
Gam
es, e
tc.)
56,0
001.
9%57
,680
1.7%
59,4
101.
7%61
,193
1.7%
63,0
281.
7%--
----
----
----
---
----
----
----
---
----
----
----
---
----
----
----
---
----
----
----
-TO
TAL
RE
VE
NU
ES
2,98
3,16
010
0.0%
3,36
7,63
810
0.0%
3,46
1,59
510
0.0%
3,55
7,81
210
0.0%
3,65
6,35
710
0.0%
CO
ST O
F SA
LES
Tota
l Cos
t of F
ilm &
Con
cess
ions
1,26
3,24
742
.3%
1,43
0,08
742
.5%
1,47
1,71
642
.5%
1,51
4,49
442
.6%
1,55
8,45
542
.6%
----
----
----
---
----
----
----
---
----
----
----
---
----
----
----
---
----
----
----
---
Gro
ss P
rofit
1,71
9,91
357
.7%
1,93
7,55
257
.5%
1,98
9,87
957
.5%
2,04
3,31
857
.4%
2,09
7,90
257
.4%
OPE
RA
TIN
G E
XPEN
SES
Ope
ratin
g E
xpen
ses
1,00
3,65
533
.6%
1,03
4,09
330
.7%
1,05
9,91
730
.6%
1,08
6,40
930
.5%
1,11
8,58
630
.6%
Sta
rt-U
p P
re-O
peni
ng E
xpen
ses
- Mkt
g0
0.0%
00.
0%0
0.0%
00.
0%0
0.0%
CA
M13
4,90
04.
5%13
4,90
04.
0%13
4,90
03.
9%13
4,90
03.
8%13
4,90
03.
7%R
eal E
stat
e &
Per
s. P
rope
rty T
axes
300,
776
10.1
%29
1,53
98.
7%28
2,32
08.
2%27
3,08
97.
7%26
3,85
77.
2%U
tiliti
es10
4,41
13.
5%11
7,86
73.
5%12
1,15
63.
5%12
4,52
33.
5%12
7,97
23.
5%To
tal E
xpen
ses
Bef
ore
Occ
upan
cy1,
543,
742
51.7
%1,
578,
398
46.9
%1,
598,
293
46.2
%1,
618,
921
45.5
%1,
645,
316
45.0
%
Ope
ratin
g P
rofit
Bef
ore
Occ
upan
cy17
6,17
15.
9%35
9,15
310
.7%
391,
586
11.3
%42
4,39
711
.9%
452,
586
12.4
%
Est
imat
ed L
oan
Am
ortiz
atio
n82
7,59
927
.7%
827,
599
24.6
%82
7,59
923
.9%
827,
599
23.3
%82
7,59
922
.6%
Cas
h Fl
ow (L
oss)
Afte
r Loa
n A
mor
t.-6
51,4
28-2
1.8%
-468
,446
-13.
9%-4
36,0
13-1
2.6%
-403
,202
-11.
3%-3
75,0
13-1
0.3%
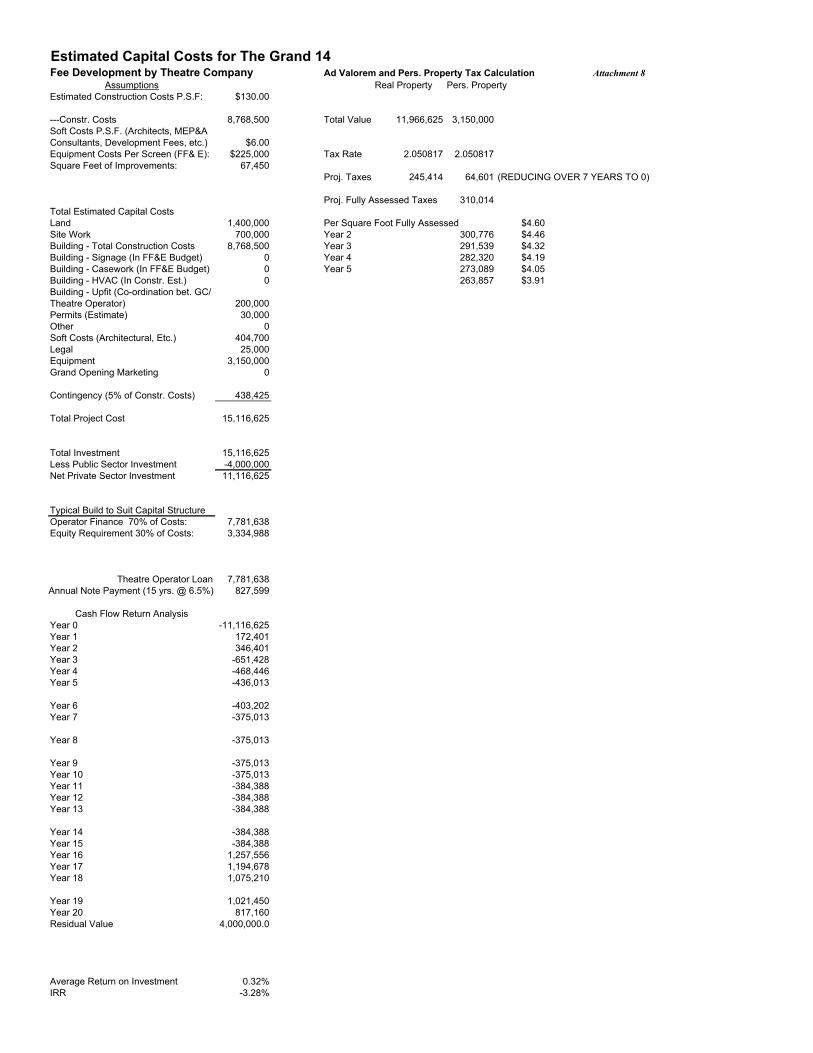
Estimated Capital Costs for The Grand 14 Fee Development by Theatre Company Ad Valorem and Pers. Property Tax Calculation Attachment 8
Assumptions Real Property Pers. PropertyEstimated Construction Costs P.S.F: $130.00
---Constr. Costs 8,768,500 Total Value 11,966,625 3,150,000Soft Costs P.S.F. (Architects, MEP&A Consultants, Development Fees, etc.) $6.00Equipment Costs Per Screen (FF& E): $225,000 Tax Rate 2.050817 2.050817Square Feet of Improvements: 67,450
Proj. Taxes 245,414 64,601 (REDUCING OVER 7 YEARS TO 0)
Proj. Fully Assessed Taxes 310,014Total Estimated Capital CostsLand 1,400,000 Per Square Foot Fully Assessed $4.60Site Work 700,000 Year 2 300,776 $4.46Building - Total Construction Costs 8,768,500 Year 3 291,539 $4.32Building - Signage (In FF&E Budget) 0 Year 4 282,320 $4.19Building - Casework (In FF&E Budget) 0 Year 5 273,089 $4.05Building - HVAC (In Constr. Est.) 0 263,857 $3.91Building - Upfit (Co-ordination bet. GC/ Theatre Operator) 200,000Permits (Estimate) 30,000Other 0Soft Costs (Architectural, Etc.) 404,700Legal 25,000Equipment 3,150,000Grand Opening Marketing 0
Contingency (5% of Constr. Costs) 438,425
Total Project Cost 15,116,625
Total Investment 15,116,625Less Public Sector Investment -4,000,000Net Private Sector Investment 11,116,625
Typical Build to Suit Capital StructureOperator Finance 70% of Costs: 7,781,638Equity Requirement 30% of Costs: 3,334,988
Theatre Operator Loan 7,781,638Annual Note Payment (15 yrs. @ 6.5%) 827,599
Cash Flow Return AnalysisYear 0 -11,116,625Year 1 172,401Year 2 346,401Year 3 -651,428Year 4 -468,446Year 5 -436,013
Year 6 -403,202Year 7 -375,013
Year 8 -375,013
Year 9 -375,013Year 10 -375,013Year 11 -384,388Year 12 -384,388Year 13 -384,388
Year 14 -384,388Year 15 -384,388Year 16 1,257,556Year 17 1,194,678Year 18 1,075,210
Year 19 1,021,450Year 20 817,160Residual Value 4,000,000.0
Average Return on Investment 0.32%IRR -3.28%
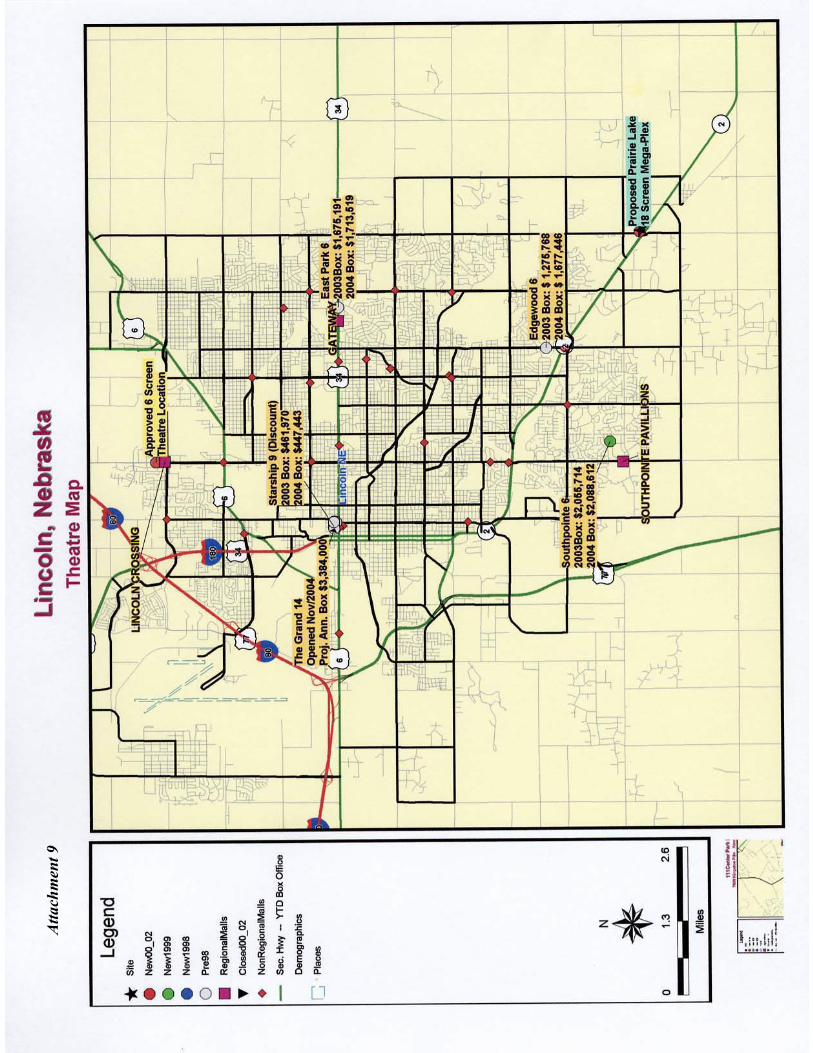
Atta
chm
ent 9
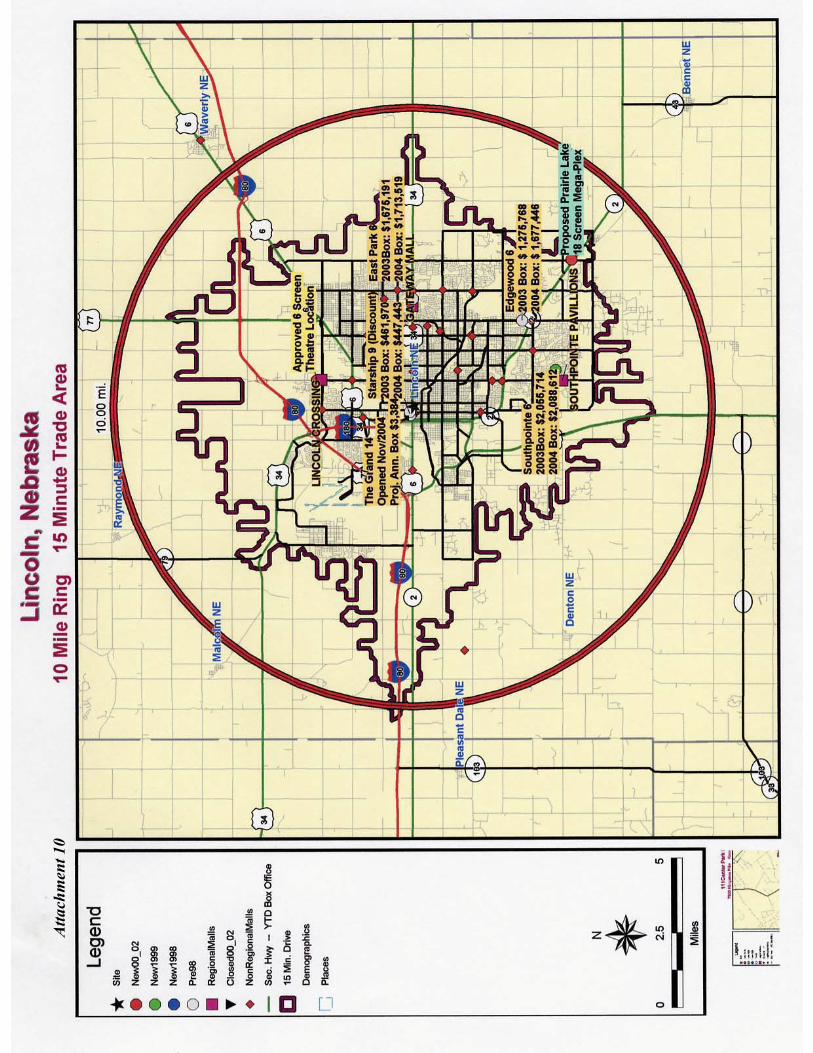
Atta
chm
ent 1
0
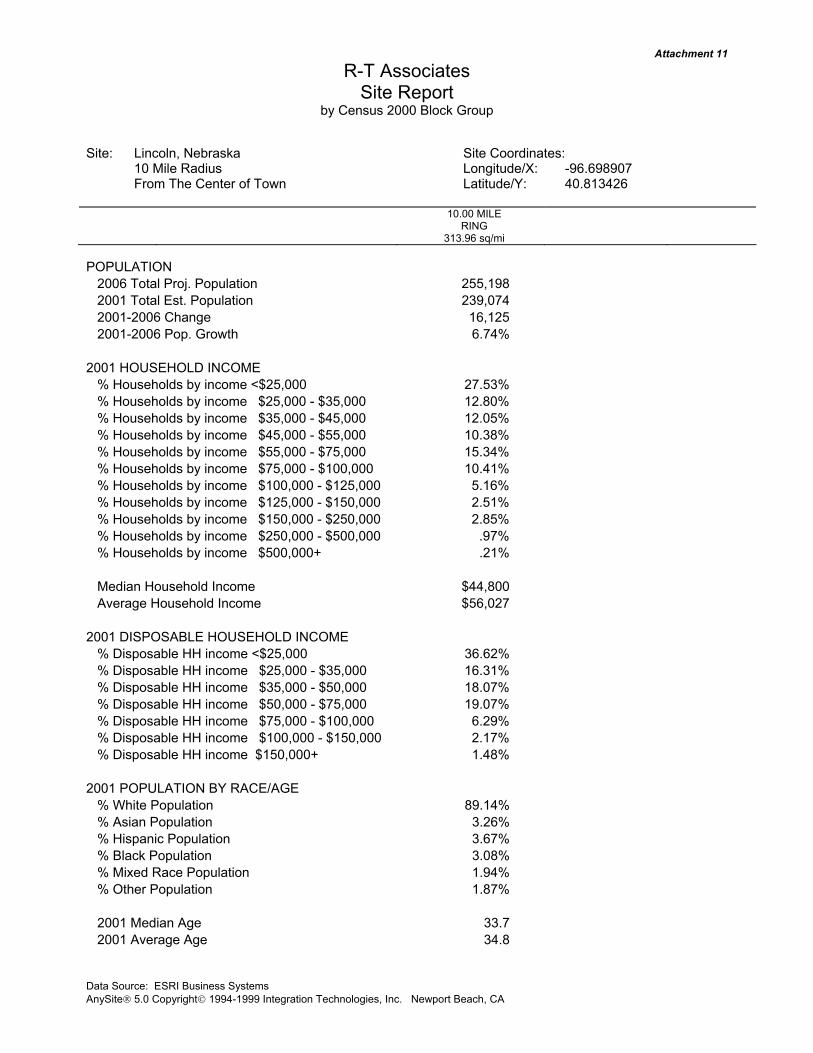
Attachment 11
R-T Associates Site Report
by Census 2000 Block Group
Site: Lincoln, Nebraska Site Coordinates: 10 Mile Radius Longitude/X: -96.698907 From The Center of Town Latitude/Y: 40.813426
10.00 MILE RING 313.96 sq/mi
Data Source: ESRI Business Systems AnySite 5.0 Copyright 1994-1999 Integration Technologies, Inc. Newport Beach, CA
POPULATION 2006 Total Proj. Population 255,198 2001 Total Est. Population 239,074 2001-2006 Change 16,125 2001-2006 Pop. Growth 6.74%
2001 HOUSEHOLD INCOME % Households by income <$25,000 27.53% % Households by income $25,000 - $35,000 12.80% % Households by income $35,000 - $45,000 12.05% % Households by income $45,000 - $55,000 10.38% % Households by income $55,000 - $75,000 15.34% % Households by income $75,000 - $100,000 10.41% % Households by income $100,000 - $125,000 5.16% % Households by income $125,000 - $150,000 2.51% % Households by income $150,000 - $250,000 2.85% % Households by income $250,000 - $500,000 .97% % Households by income $500,000+ .21%
Median Household Income $44,800 Average Household Income $56,027
2001 DISPOSABLE HOUSEHOLD INCOME % Disposable HH income <$25,000 36.62% % Disposable HH income $25,000 - $35,000 16.31% % Disposable HH income $35,000 - $50,000 18.07% % Disposable HH income $50,000 - $75,000 19.07% % Disposable HH income $75,000 - $100,000 6.29% % Disposable HH income $100,000 - $150,000 2.17% % Disposable HH income $150,000+ 1.48%
2001 POPULATION BY RACE/AGE % White Population 89.14% % Asian Population 3.26% % Hispanic Population 3.67% % Black Population 3.08% % Mixed Race Population 1.94% % Other Population 1.87%
2001 Median Age 33.7 2001 Average Age 34.8

Attachment 12R-T Associates
Site Report by Census 2000 Block Group
Site: Lincoln, Nebraska Site Coordinates: 15 Minute Drive Time Area Longitude/X: -96.698907 From Center of Town Latitude/Y: 40.813426
DRIVE TIME 15 min.
Data Source: ESRI Business Systems AnySite 5.0 Copyright 1994-1999 Integration Technologies, Inc. Newport Beach, CA
POPULATION 2006 Total Proj. Population 247,125 2001 Total Est. Population 231,739 2001-2006 Change 15,386 2001-2006 Pop. Growth 6.64%
2001 HOUSEHOLD INCOME % Households by income <$25,000 27.84% % Households by income $25,000 - $35,000 12.87% % Households by income $35,000 - $45,000 12.10% % Households by income $45,000 - $55,000 10.35% % Households by income $55,000 - $75,000 15.22% % Households by income $75,000 - $100,000 10.27% % Households by income $100,000 - $125,000 5.09% % Households by income $125,000 - $150,000 2.49% % Households by income $150,000 - $250,000 2.82% % Households by income $250,000 - $500,000 .96% % Households by income $500,000+ .19%
Median Household Income $44,406 Average Household Income $55,646
2001 DISPOSABLE HOUSEHOLD INCOME % Disposable HH income <$25,000 36.97% % Disposable HH income $25,000 - $35,000 16.34% % Disposable HH income $35,000 - $50,000 18.00% % Disposable HH income $50,000 - $75,000 18.87% % Disposable HH income $75,000 - $100,000 6.21% % Disposable HH income $100,000 - $150,000 2.15% % Disposable HH income $150,000+ 1.46%
2001 POPULATION BY RACE/AGE % White Population 88.92% % Asian Population 3.34% % Hispanic Population 3.74% % Black Population 3.14% % Mixed Race Population 1.96% % Other Population 1.91%
2001 Median Age 33.5 2001 Average Age 34.8
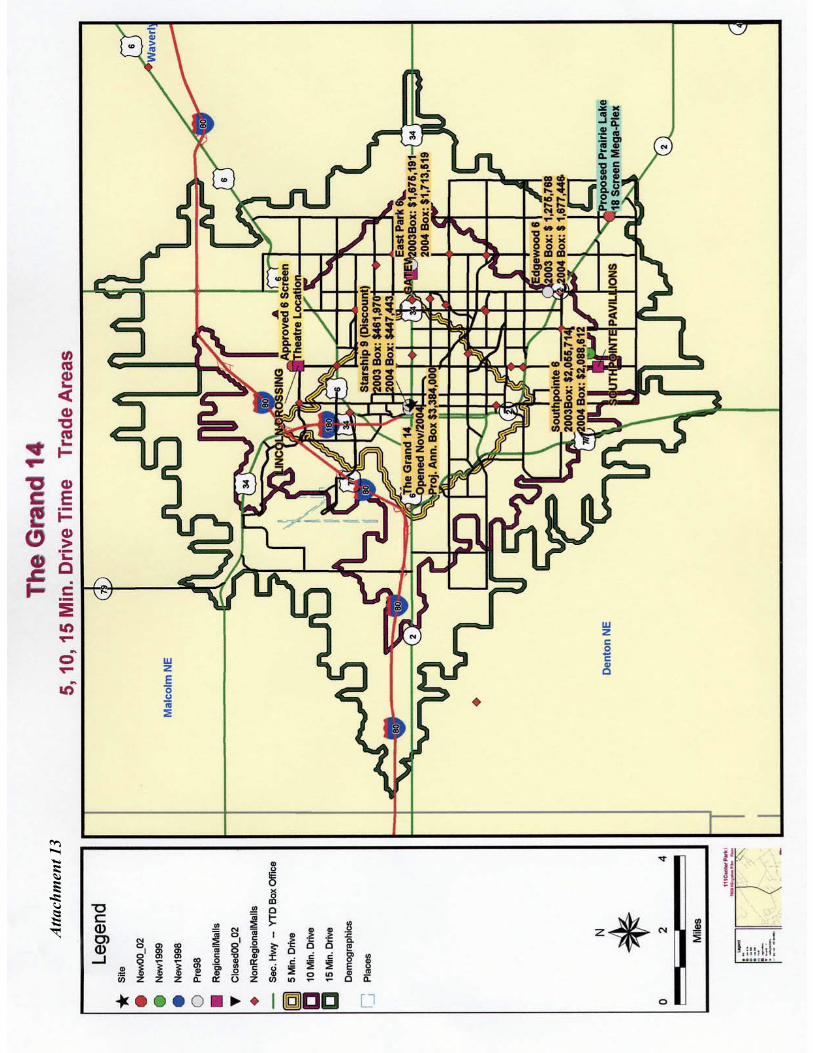
Atta
chm
ent 1
3
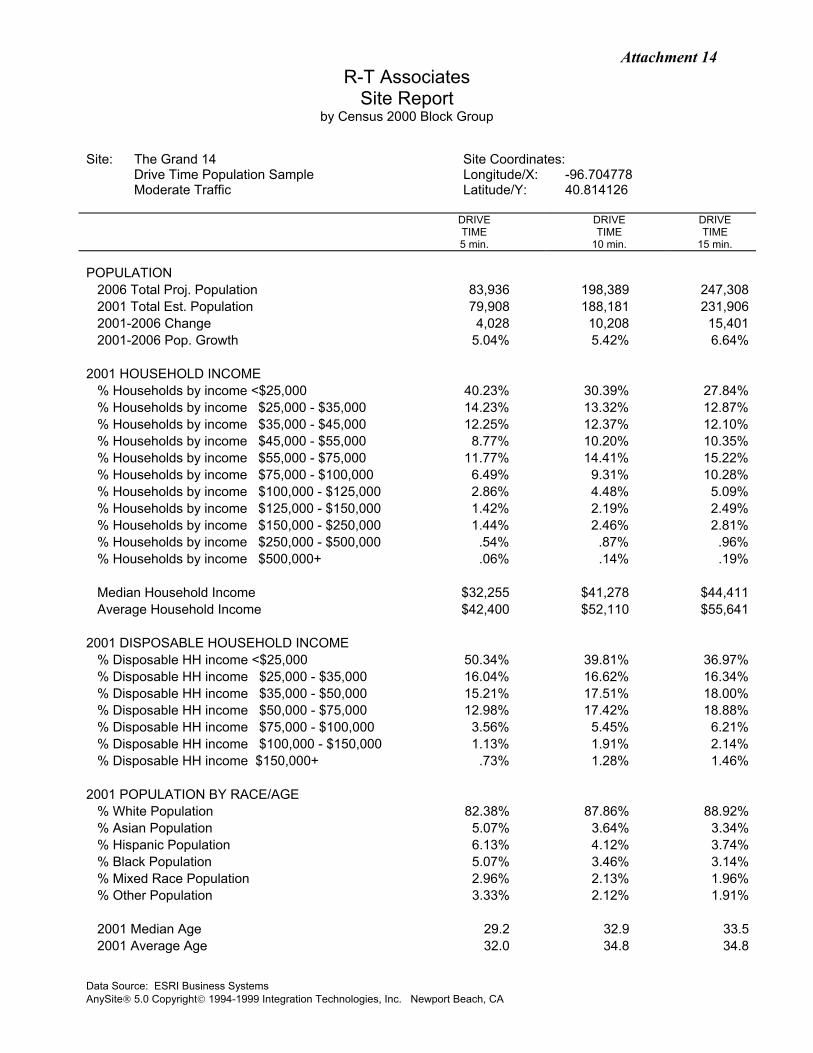
Attachment 14R-T Associates
Site Report by Census 2000 Block Group
Site: The Grand 14 Site Coordinates: Drive Time Population Sample Longitude/X: -96.704778 Moderate Traffic Latitude/Y: 40.814126
DRIVE DRIVE DRIVE TIME TIME TIME 5 min. 10 min. 15 min.
Data Source: ESRI Business Systems AnySite 5.0 Copyright 1994-1999 Integration Technologies, Inc. Newport Beach, CA
POPULATION 2006 Total Proj. Population 83,936 198,389 247,308 2001 Total Est. Population 79,908 188,181 231,906 2001-2006 Change 4,028 10,208 15,401 2001-2006 Pop. Growth 5.04% 5.42% 6.64%
2001 HOUSEHOLD INCOME % Households by income <$25,000 40.23% 30.39% 27.84% % Households by income $25,000 - $35,000 14.23% 13.32% 12.87% % Households by income $35,000 - $45,000 12.25% 12.37% 12.10% % Households by income $45,000 - $55,000 8.77% 10.20% 10.35% % Households by income $55,000 - $75,000 11.77% 14.41% 15.22% % Households by income $75,000 - $100,000 6.49% 9.31% 10.28% % Households by income $100,000 - $125,000 2.86% 4.48% 5.09% % Households by income $125,000 - $150,000 1.42% 2.19% 2.49% % Households by income $150,000 - $250,000 1.44% 2.46% 2.81% % Households by income $250,000 - $500,000 .54% .87% .96% % Households by income $500,000+ .06% .14% .19%
Median Household Income $32,255 $41,278 $44,411 Average Household Income $42,400 $52,110 $55,641
2001 DISPOSABLE HOUSEHOLD INCOME % Disposable HH income <$25,000 50.34% 39.81% 36.97% % Disposable HH income $25,000 - $35,000 16.04% 16.62% 16.34% % Disposable HH income $35,000 - $50,000 15.21% 17.51% 18.00% % Disposable HH income $50,000 - $75,000 12.98% 17.42% 18.88% % Disposable HH income $75,000 - $100,000 3.56% 5.45% 6.21% % Disposable HH income $100,000 - $150,000 1.13% 1.91% 2.14% % Disposable HH income $150,000+ .73% 1.28% 1.46%
2001 POPULATION BY RACE/AGE % White Population 82.38% 87.86% 88.92% % Asian Population 5.07% 3.64% 3.34% % Hispanic Population 6.13% 4.12% 3.74% % Black Population 5.07% 3.46% 3.14% % Mixed Race Population 2.96% 2.13% 1.96% % Other Population 3.33% 2.12% 1.91%
2001 Median Age 29.2 32.9 33.5 2001 Average Age 32.0 34.8 34.8
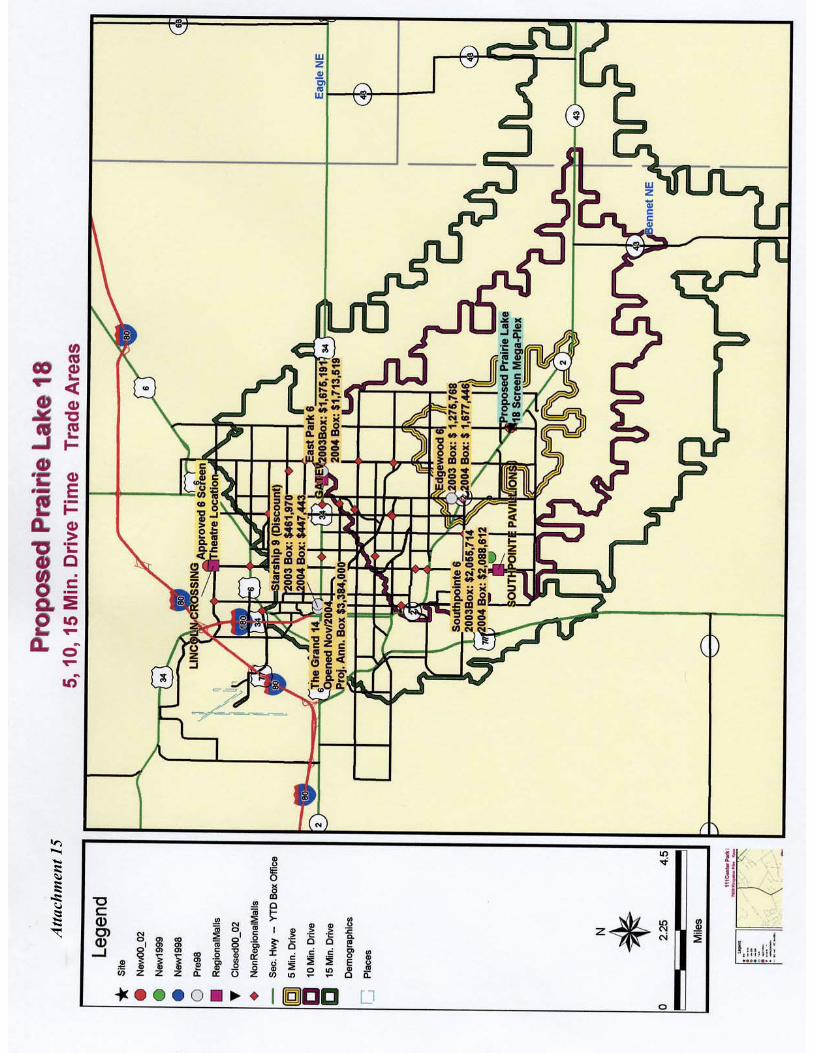
Atta
chm
ent 1
5
Attachment 16
R-T Associates Site Report
by Census 2000 Block Group
Site: Prairie Lake Theatre Site Site Coordinates: 5, 10, 15 Minute Demographics Longitude/X: -96.604196 Based on “Moderate” Traffic Latitude/Y: 40.735767
DRIVE DRIVE DRIVE TIME TIME TIME 5 min. 10 min. 15 min.
Data Source: ESRI Business Systems AnySite 5.0 Copyright 1994-1999 Integration Technologies, Inc. Newport Beach, CA
POPULATION 2006 Total Proj. Population 9,905 87,349 196,111 2001 Total Est. Population 9,095 81,537 185,756 2001-2006 Change 810 5,812 10,354 2001-2006 Pop. Growth 8.91% 7.13% 5.57%
2001 HOUSEHOLD INCOME % Households by income <$25,000 10.89% 15.60% 27.19% % Households by income $25,000 - $35,000 9.70% 10.84% 12.52% % Households by income $35,000 - $45,000 9.47% 11.34% 11.83% % Households by income $45,000 - $55,000 10.85% 11.18% 10.18% % Households by income $55,000 - $75,000 21.20% 18.20% 15.19% % Households by income $75,000 - $100,000 17.20% 14.42% 10.63% % Households by income $100,000 - $125,000 9.85% 7.98% 5.54% % Households by income $125,000 - $150,000 4.01% 4.05% 2.73% % Households by income $150,000 - $250,000 5.47% 4.80% 3.12% % Households by income $250,000 - $500,000 1.36% 1.59% 1.07% % Households by income $500,000+ .80% .41% .24%
Median Household Income $62,954 $57,460 $45,473 Average Household Income $75,270 $71,674 $57,478
2001 DISPOSABLE HOUSEHOLD INCOME % Disposable HH income <$25,000 17.92% 23.24% 36.04% % Disposable HH income $25,000 - $35,000 13.77% 15.83% 16.06% % Disposable HH income $35,000 - $50,000 21.26% 19.98% 17.84% % Disposable HH income $50,000 - $75,000 29.10% 24.96% 19.28% % Disposable HH income $75,000 - $100,000 11.55% 9.85% 6.78% % Disposable HH income $100,000 - $150,000 3.69% 3.62% 2.38% % Disposable HH income $150,000+ 2.71% 2.51% 1.62%
2001 POPULATION BY RACE/AGE % White Population 95.06% 94.27% 89.57% % Asian Population 2.28% 2.08% 3.15% % Hispanic Population 1.55% 1.86% 3.60% % Black Population .81% 1.48% 2.97% % Mixed Race Population .91% 1.07% 1.83% % Other Population .79% .84% 1.84%
2001 Median Age 38.8 38.3 34.6 2001 Average Age 36.2 37.5 35.5
Atta
chm
ent 1
7
Attachment 18R-T Associates
Site Report by Census 2000 Block Group
Site: 10 Minute Drive Time Overlap Site Coordinates: Moderate Traffic Longitude/X: -96.604076 Lincoln, NE Latitude/Y: 40.735781
TRADE AREA 17.7473 sq/mi
Data Source: ESRI Business Systems AnySite 5.0 Copyright 1994-1999 Integration Technologies, Inc. Newport Beach, CA
POPULATION 2006 Total Proj. Population 72,410 2001 Total Est. Population 68,663 2001-2006 Change 3,747 2001-2006 Pop. Growth 5.46%
2001 HOUSEHOLD INCOME % Households by income <$25,000 17.00% % Households by income $25,000 - $35,000 11.46% % Households by income $35,000 - $45,000 11.87% % Households by income $45,000 - $55,000 11.47% % Households by income $55,000 - $75,000 17.66% % Households by income $75,000 - $100,000 13.44% % Households by income $100,000 - $125,000 7.33% % Households by income $125,000 - $150,000 3.77% % Households by income $150,000 - $250,000 4.48% % Households by income $250,000 - $500,000 1.52% % Households by income $500,000+ .32%
Median Household Income $54,943 Average Household Income $69,039
2001 DISPOSABLE HOUSEHOLD INCOME % Disposable HH income <$25,000 25.02% % Disposable HH income $25,000 - $35,000 16.62% % Disposable HH income $35,000 - $50,000 19.89% % Disposable HH income $50,000 - $75,000 23.61% % Disposable HH income $75,000 - $100,000 9.06% % Disposable HH income $100,000 - $150,000 3.45% % Disposable HH income $150,000+ 2.36%
2001 POPULATION BY RACE/AGE % White Population 94.19% % Asian Population 1.99% % Hispanic Population 1.96% % Black Population 1.51% % Mixed Race Population 1.15% % Other Population .88%
2001 Median Age 38.4 2001 Average Age 38.2
Atta
chm
ent 1
9
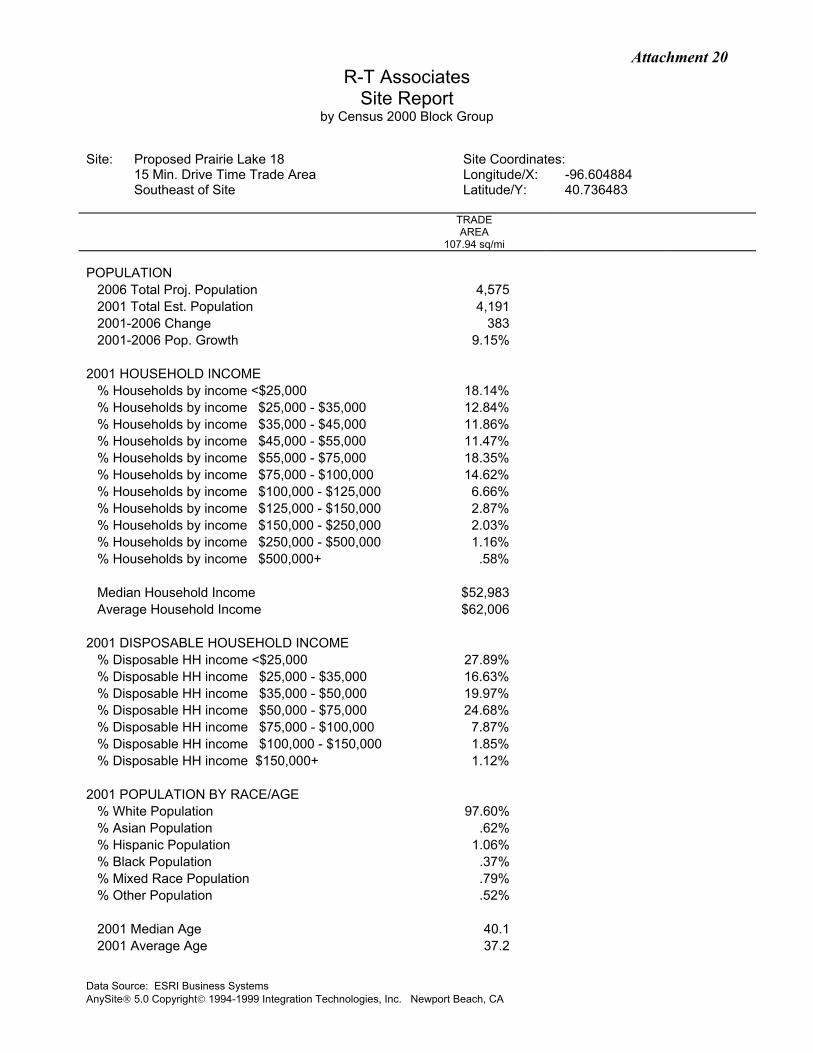
Attachment 20R-T Associates
Site Report by Census 2000 Block Group
Site: Proposed Prairie Lake 18 Site Coordinates: 15 Min. Drive Time Trade Area Longitude/X: -96.604884 Southeast of Site Latitude/Y: 40.736483
TRADE AREA 107.94 sq/mi
Data Source: ESRI Business Systems AnySite 5.0 Copyright 1994-1999 Integration Technologies, Inc. Newport Beach, CA
POPULATION 2006 Total Proj. Population 4,575 2001 Total Est. Population 4,191 2001-2006 Change 383 2001-2006 Pop. Growth 9.15%
2001 HOUSEHOLD INCOME % Households by income <$25,000 18.14% % Households by income $25,000 - $35,000 12.84% % Households by income $35,000 - $45,000 11.86% % Households by income $45,000 - $55,000 11.47% % Households by income $55,000 - $75,000 18.35% % Households by income $75,000 - $100,000 14.62% % Households by income $100,000 - $125,000 6.66% % Households by income $125,000 - $150,000 2.87% % Households by income $150,000 - $250,000 2.03% % Households by income $250,000 - $500,000 1.16% % Households by income $500,000+ .58%
Median Household Income $52,983 Average Household Income $62,006
2001 DISPOSABLE HOUSEHOLD INCOME % Disposable HH income <$25,000 27.89% % Disposable HH income $25,000 - $35,000 16.63% % Disposable HH income $35,000 - $50,000 19.97% % Disposable HH income $50,000 - $75,000 24.68% % Disposable HH income $75,000 - $100,000 7.87% % Disposable HH income $100,000 - $150,000 1.85% % Disposable HH income $150,000+ 1.12%
2001 POPULATION BY RACE/AGE % White Population 97.60% % Asian Population .62% % Hispanic Population 1.06% % Black Population .37% % Mixed Race Population .79% % Other Population .52%
2001 Median Age 40.1 2001 Average Age 37.2
Atta
chm
ent 2
1
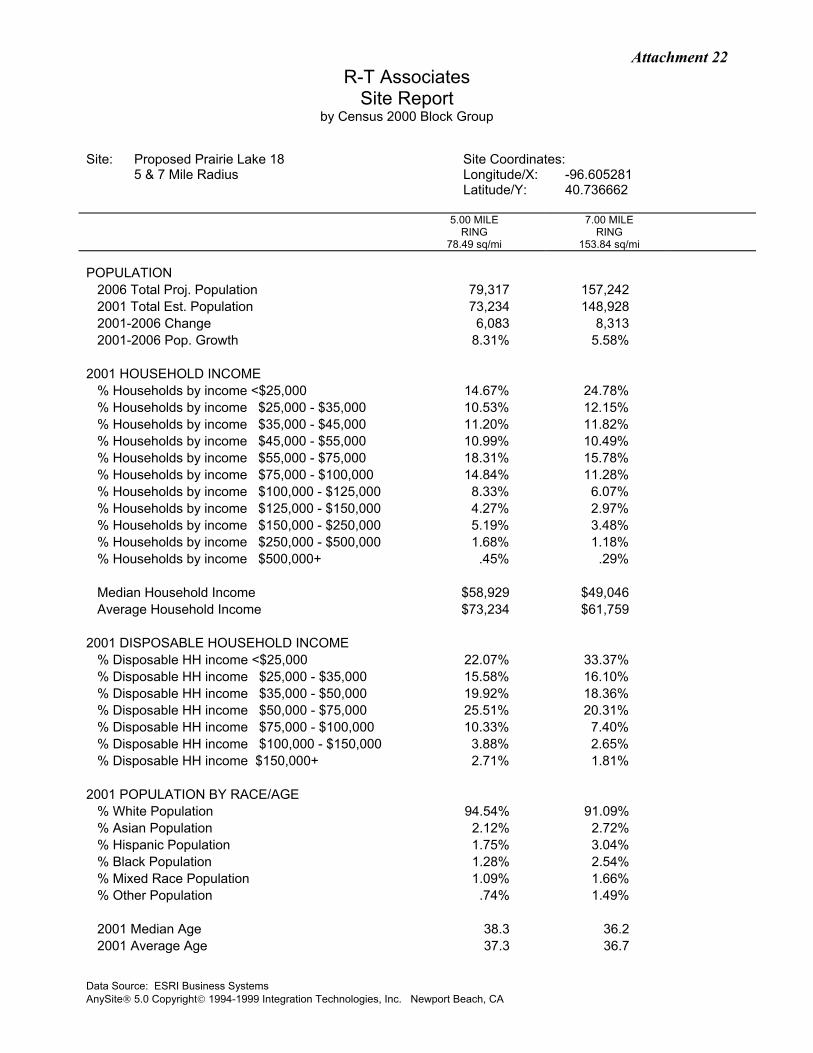
Attachment 22R-T Associates
Site Report by Census 2000 Block Group
Site: Proposed Prairie Lake 18 Site Coordinates: 5 & 7 Mile Radius Longitude/X: -96.605281 Latitude/Y: 40.736662
5.00 MILE 7.00 MILE RING RING 78.49 sq/mi 153.84 sq/mi
Data Source: ESRI Business Systems AnySite 5.0 Copyright 1994-1999 Integration Technologies, Inc. Newport Beach, CA
POPULATION 2006 Total Proj. Population 79,317 157,242 2001 Total Est. Population 73,234 148,928 2001-2006 Change 6,083 8,313 2001-2006 Pop. Growth 8.31% 5.58%
2001 HOUSEHOLD INCOME % Households by income <$25,000 14.67% 24.78% % Households by income $25,000 - $35,000 10.53% 12.15% % Households by income $35,000 - $45,000 11.20% 11.82% % Households by income $45,000 - $55,000 10.99% 10.49% % Households by income $55,000 - $75,000 18.31% 15.78% % Households by income $75,000 - $100,000 14.84% 11.28% % Households by income $100,000 - $125,000 8.33% 6.07% % Households by income $125,000 - $150,000 4.27% 2.97% % Households by income $150,000 - $250,000 5.19% 3.48% % Households by income $250,000 - $500,000 1.68% 1.18% % Households by income $500,000+ .45% .29%
Median Household Income $58,929 $49,046 Average Household Income $73,234 $61,759
2001 DISPOSABLE HOUSEHOLD INCOME % Disposable HH income <$25,000 22.07% 33.37% % Disposable HH income $25,000 - $35,000 15.58% 16.10% % Disposable HH income $35,000 - $50,000 19.92% 18.36% % Disposable HH income $50,000 - $75,000 25.51% 20.31% % Disposable HH income $75,000 - $100,000 10.33% 7.40% % Disposable HH income $100,000 - $150,000 3.88% 2.65% % Disposable HH income $150,000+ 2.71% 1.81%
2001 POPULATION BY RACE/AGE % White Population 94.54% 91.09% % Asian Population 2.12% 2.72% % Hispanic Population 1.75% 3.04% % Black Population 1.28% 2.54% % Mixed Race Population 1.09% 1.66% % Other Population .74% 1.49%
2001 Median Age 38.3 36.2 2001 Average Age 37.3 36.7
Atta
chm
ent 2
3

Attachment 24R-T Associates
Site Report by Census 2000 Block Group
Site: Proposed Prairie Lake 18 Site Coordinates: ½ of 7 Mile Radius to Southeast Longitude/X: -96.605281 Latitude/Y: 40.736662
TRADE AREA 76.4604 sq/mi
Data Source: ESRI Business Systems AnySite 5.0 Copyright 1994-1999 Integration Technologies, Inc. Newport Beach, CA
POPULATION 2006 Total Proj. Population 3,646 2001 Total Est. Population 3,343 2001-2006 Change 303 2001-2006 Pop. Growth 9.06%
2001 HOUSEHOLD INCOME % Households by income <$25,000 16.91% % Households by income $25,000 - $35,000 12.35% % Households by income $35,000 - $45,000 11.17% % Households by income $45,000 - $55,000 11.46% % Households by income $55,000 - $75,000 18.74% % Households by income $75,000 - $100,000 15.59% % Households by income $100,000 - $125,000 7.13% % Households by income $125,000 - $150,000 3.09% % Households by income $150,000 - $250,000 2.29% % Households by income $250,000 - $500,000 1.28% % Households by income $500,000+ .70%
Median Household Income $54,903 Average Household Income $64,168
2001 DISPOSABLE HOUSEHOLD INCOME % Disposable HH income <$25,000 26.33% % Disposable HH income $25,000 - $35,000 15.96% % Disposable HH income $35,000 - $50,000 20.06% % Disposable HH income $50,000 - $75,000 25.89% % Disposable HH income $75,000 - $100,000 8.47% % Disposable HH income $100,000 - $150,000 2.03% % Disposable HH income $150,000+ 1.27%
2001 POPULATION BY RACE/AGE % White Population 97.57% % Asian Population .65% % Hispanic Population .98% % Black Population .39% % Mixed Race Population .82% % Other Population .47%
2001 Median Age 40.1 2001 Average Age 37.1
Attachment 25R. Keith Thompson, CLS
List of Qualifications, Past & Present Offices:
Present – Co-Founder and Principal of Hemisphere Property Group, a diversified developer and owner of mixed use and retail real estate.
Principal of R-T Associates, a national real estate consulting business specializing in adapting theatres within shopping centers and mixed use developments.
2001-2005 Co-Founder and managing member of Phoenix Theatres, LLC a theatre management and operating company operating theatres in Florida, Kentucky, South Carolina, and Virginia. Sold interest in Phoenix Theatres, LLC in March of 2005 to pursue start up and management of Hemisphere Property Group.
1991 - 2000 Regal Cinemas, Inc. - One of the original members of Regal Cinemas, Inc.’s Management Team.
1993-2000 -Vice President of Development, Regal Cinemas, Inc. - later promoted to Senior Vice President of Real Estate.
Accomplishments: Formed the Company’s Real Estate Department, consisting of Development, Property Management, and Construction. Developed financial models to assess real estate transactions, and locations. Oversaw the Development, Construction and Expansion of over 150 Locations, in 28 states.
Have performed extensive work with developers, brokers, attorneys, architects, and contractors in the procurement of locations for corporate expansion, involving extensive travel to virtually every state and major city in the U.S. Have first hand and oversight knowledge of Site Selection and Negotiation; Pro-Forma Preparation; Lease, Purchase and Option Contract Negotiation; Governmental Land Use Approval, including Zoning, Use and Site Plan Approval, Architectural and Permit Review; Construction Process including Site (civil) Engineering, Plan Preparation, Construction Bidding, Contract Negotiation, and Project Management; Property Management, including Lease and Real Property Administration.
1991-1993 - Vice President of Finance, Regal Cinemas, Inc. - responsible for the financial management of the company, including the Acquisition of Capital, Bank and Investor Relations.
International Council of Shopping Centers – Served 6 years (1998-2004) as a Trustee of ICSC, the Retail Real Estate Industry’s Premiere Trade Organization. Frequent speaker, panel leader, and faculty instructor at various ICSC and ULI functions, including ICSC University, and the ULI Entertainment Conference.
Attachment 25R. Keith Thompson List of Qualifications Page Two
1984-1991 Citizens Fidelity Bank & Trust Company (merged with PNC in 1988). Hired by PNC in 1984 as Commercial Lending Trainee. In 1985 joined the U.S. Lending Group as a Commercial Loan Officer. Promoted to Assistant Vice President in 1987. In 1989 Promoted to Vice President, and transferred to Orlando, FL Loan Production Office (LPO). The Florida LPO was active in Corporate Banking, Merchant Banking, Mortgage Banking, Leasing and Financial Services. Left in July of 1991 to join Regal Cinemas, Inc.
Other Serve on Board of Directors of HDC Medical, Inc. a supplier to the Kidney Dialysis Industry.
Serve on Board of Directors of The Interfaith Health Clinic, a not-for-profit clinic providing health care to the working uninsured.
Education - Graduated with a Bachelor of Science Degree from Centre College of Kentucky in 1984. Major: Economics & Management; Minor: Psychology. Member of Sigma Chi Fraternity, as well as the Intercollegiate Football Team. Studied numerous post graduate courses in Finance, Management, and Real Estate.
PERSONAL
Married with three children. Active member of Cokesbury United Methodist Church, andmember of the Finance Committee.