Embed Size (px)
Citation preview
www.dbsvickers.com
ed: JS / sa: WMT
KLCIKLCIKLCIKLCI :::: 1,817.131,817.131,817.131,817.13
Analyst Bernard CHING 603 2604 3918 [email protected] Malaysia Research Team 603 2604 3333 [email protected] TOP STOCK PICKS
Source: AllianceDBS
DBS Group Research . Equity DBS Group Research . Equity DBS Group Research . Equity DBS Group Research . Equity
3 Mar 2015
Malaysia Market Focus
Results Roundup Refer to important disclosures at the end of this report
Another uninspiring results season
• Still uninspiring despite more corporates meeting earnings expectations
• FBMKLCI’s 2014 earnings growth in negative territory; 2015 earnings cut by 1.5%
• Valuation is rich amid dismal earnings outlook
• Stay defensive and focus on bottom up stock picking
More met expectations in 4Q14. 65% of stocks in our coverage universe met our expectations, as compared to 52% in 3Q14 while the percentage of stocks missing estimates declined from 45% to 21%. Despite the improvement, we still deem 4Q14 earnings season as uninspiring as we cut CY15F earnings by 1.5% while FBMKLCI’s CY14 earnings shrunk 4.0% y-o-y.
Earnings risk moderated but not over yet. Despite our earnings cut, sectors that contributed to earnings downgrade such as banks and plantation still make up 46.4% of CY15 earnings growth. We expect earnings risk to remain high over the next 1-2 quarters given weak domestic growth drivers (dampened consumer sentiment, impending GST implementation) and normalization in the credit market (cyclical slowdown in loan growth, rising delinquencies).
Rich valuation. We find it difficult to justify FBMKLCI’s CY15 PE valuation of 16.7x (mean 15.7x) in view of the earnings risk and macro headwinds ahead. We maintain our base case end-2015 KLCI target of 1,750 (14.5x 2016 PE) while the worst case target is 1,600 (13.3x PE at -1SD). We continue to advocate a defensive strategy and focus on a bottom-up stock selection strategy.
Sector weightings. We continue to like construction (capex spending), technology (cyclical demand recovery and stronger USD) and utilities (resilient demand amid sector reform) sectors. We upgraded shipping to Overweight as lower bunker cost, following the recent crude oil price slump, will boost bottomline. We downgraded the gloves sector to Neutral as potential upside has narrowed following recent share price run up.
Bottom-up stock picks have outperformed. Our top stock picks (refer to our strategy report dated 15 Dec 2014) have generally done well with a simple average return of 9.6% YTD, outperforming the FBMKLCI by 6.4%. We dropped Hartalega and Globetronics from our top buy list following the recent price run up which has narrowed potential upside. We replaced these stocks with Time dotComTime dotComTime dotComTime dotCom and MISCMISCMISCMISC.
Price Price Price Price Mkt Mkt Mkt Mkt CapCapCapCap
Target Target Target Target PricePricePricePrice
Performance (%)Performance (%)Performance (%)Performance (%)
RMRMRMRM US$mUS$mUS$mUS$m RMRMRMRM 3 mth3 mth3 mth3 mth 12 mth12 mth12 mth12 mth RatingRatingRatingRating Tenaga Nasional 14.72 22,973 16.00 3.2 23.3 BUY Petronas Gas Bhd 23.06 12,618 25.40 1.5 (2.0) BUY MISC 8.42 10,394 9.30 15.2 32.4 BUY Gamuda 5.26 3,416 6.00 (0.6) 18.7 BUY IJM Corp 7.18 2,969 7.75 5.9 24.7 BUY TIME dotCom Bhd 5.59 887 6.00 12.9 53.2 BUY Unisem 2.10 392 2.40 16.7 96.3 BUY Muhibbah Engineering
2.29 273 3.50 (1.3) (7.7) BUY Pantech Group 0.77 127 0.95 (13.5) (14.9) BUY Sasbadi Holdings 1.51 53 2.25 (3.2) N.A BUY
Market Focus
Results Roundup
Page 2
Despite improvement, 4Q14 results were still uninspiring
65% of stocks in our coverage universe reported 4Q14 results
which met our expectations, as compared to 52% in 3Q14
while the percentage of stocks missing estimates declined from
45% to 21%. Despite the improvement, we still deem 4Q14
earnings season to be uninspiring as there were 1.5
disappointments for every one that beat estimates, while
earnings downgrades were twice as many as upgrades.
4Q14 summary of financial performance
PerformancePerformancePerformancePerformance vs vs vs vs AAAAlliancelliancelliancellianceDBSDBSDBSDBS (%)(%)(%)(%) vs Consensus (%)vs Consensus (%)vs Consensus (%)vs Consensus (%)
Above 14 15
In line 65 54
Below 21 31
Source: AllianceDBS
Automotive (lower volume), building materials (intense
competition), consumer (weak sentiment), and plantation (low
ASP) sectors reported results that were below expectations,
while shipping (lower bunker cost) and utilities (lower fuel cost)
sectors exceeded expectations. Furthermore, oil & gas and
telco sectors reported a mixed set of results.
Among big caps (top 30 stocks), IOI (lower tax, higher
associates contribution), KLK (oleochemicals contribution not
as weak as expected), MISC (LNG segment not as weak as
expected), Telekom (higher ARPU for internet services), and
Tenaga (lower fuel cost and better generation mix) beat
expectations while notable disappointments came from CIMB
(higher provisions and opex), Petronas Dagangan (drop in
ASP), Astro (lower subscriber net adds and weaker ARPU
growth), Sime (lower FFB output and weaker industrial
contribution), FGV (loss making downstream business), Axiata
(consolidation of Axis, weaker IDR and weaker Celcom
revenues), Maxis (higher traffic related costs and sales &
marketing expenses), and UMW Holdings (lower contribution
from auto segment and derivative losses).
Sector performance
SectorSectorSectorSector 4444Q14Q14Q14Q14 (RM m)(RM m)(RM m)(RM m)
4444Q13Q13Q13Q13 (RM m)(RM m)(RM m)(RM m)
YYYY----oooo----y y y y change %change %change %change %
vs vs vs vs expectationexpectationexpectationexpectation
CommentsCommentsCommentsComments
AutomotiveAutomotiveAutomotiveAutomotive 116.62 141.99 (17.9%) Below UMW’s earnings declined due to lower volume and unfavourable product mix, though MBM saw higher Perodua contributions due to good sales of its Axia launch.
AviationAviationAviationAviation 73.94 95.61 (22.7%) In line Long-haul yields remain depressed, but there were signs of improvement for shorter-haul yields. Capacity management is the core strategy for AirAsia and AAX in 2015.
BankingBankingBankingBanking 5,395.47 5,822.54 (7.3%) In line Higher provisions and weak non-interest income were key drags on earnings.
Building MaterialsBuilding MaterialsBuilding MaterialsBuilding Materials 93.88 172.96 (45.7%) Below ASP and margins eroded as competition in Peninsular Malaysia cement market intensified due to new incoming supply.
ChemicalsChemicalsChemicalsChemicals 500.00 450.00 11.1% In line Weak quarter as expected. Improved plant utilisation and availability were offset by declining petrochemical prices.
ConglomerateConglomerateConglomerateConglomerate 480.59 321.65 49.4% In line MMC's earnings were lifted by a lower effective tax rate, while there was growth at its energy & utilities segment and throughput at PTP.
ConstructionConstructionConstructionConstruction 373.37 776.64 (51.9%) In line Results were largely in line barring lumpy items, though construction earnings were relatively soft. However, our top picks like IJM and Muhibbah continue to secure orders.
ConsumerConsumerConsumerConsumer 347.00 465.87 (25.5%) Below The weaker consumer sentiment was reflected in the largely soft quarter, and Petronas Dagangan’s performance was dragged by the steep decline in oil prices.
Financial nonFinancial nonFinancial nonFinancial non----bankbankbankbank 134.09 118.91 12.8% In line Growth was mainly from BURSA, where earnings were driven by equities revenue.
Market Focus
Results Roundup
Page 3
Sector performance (cont’d)
SectorSectorSectorSector 4444Q14Q14Q14Q14 (RM m)(RM m)(RM m)(RM m)
4444Q13Q13Q13Q13 (RM m)(RM m)(RM m)(RM m)
yyyy----oooo----y y y y change %change %change %change %
vs vs vs vs expectationexpectationexpectationexpectation
CommentsCommentsCommentsComments
GamingGamingGamingGaming 1,053.60 875.54 20.3% In line Genting counters benefited from foreign exchange gains and non-gaming segments, but NFOs and gaming operations felt the adverse impact of weaker consumer sentiment.
GloveGloveGloveGlove 160.40 170.32 (5.8%) In line The decline in unit profitability seems to have bottomed out this quarter, with some glove makers even reporting q-o-q increases in EBIT/k gloves. Capacity expansion is the core theme for this sector in 2015.
HealthcareHealthcareHealthcareHealthcare 267.66 252.68 5.9% In line Both KPJ and IHH reported improvements in operating margin during the results season.
MediaMediaMediaMedia 233.68 273.58 (14.6%) In line Adex sales remained weak for media companies amid poor consumer sentiment.
Oil & GasOil & GasOil & GasOil & Gas 549.25 649.18 (15.4%) Mixed Earnings from Bumi Armada and MMHE were weaker on allowances for trade receivables and depleting orderbook respectively. Other companies were in line, reporting weak results which were expected due to the monsoon season and also cut backs in workflow from the likes of PETRONAS.
PlantationPlantationPlantationPlantation 983.40 2,330.47 (57.8%) Below Upstream planters were affected by low CPO prices and production was plagued by bad weather. Refiners reported weak margins as the M'sian and Indonesian governments waived export taxes.
PortPortPortPort 9.88 11.41 (13.4%) Below Suria's earnings were dampened by higher port operation expenses; we are still awaiting the launch of the Jesselton Quay project as its re-rating catalyst.
PropertyPropertyPropertyProperty 450.69 448.20 0.6% In line Profit recognition driven by progressive milestone completions of unbilled sales.
REITREITREITREIT 427.02 410.98 3.9% In line Rental reversions were still positive at retail assets, though flattish for office due to oversupply conditions.
ShippingShippingShippingShipping 663.40 597.70 11.0% Above Petroleum shipping rates were on a firm uptrend, with average time-charter rates up by 44-77% y-o-y in the quarter. Chemical and LNG shipping rates remain lacklustre. Cheaper bunker prices could provide a respite to chemical shipping operations which mainly trade in the spot market.
TechnologyTechnologyTechnologyTechnology 65.46 (2.78) 2450.5% In line Apart from robust demand, the better performances for tech companies were also partly driven by the stronger USD.
TelecommunicationTelecommunicationTelecommunicationTelecommunication 1,845.75 2,103.51 (12.3%) Mixed Mobile operators suffered from weaker than expected margins amid tepid industry growth. Fixed-line operators fared better due to internet and data services.
UtilitiesUtilitiesUtilitiesUtilities 2,790.94 1,980.60 40.9% Above Lifted by TNB's strong earnings due to lower coal prices, more favourable fuel mix and lower effective tax rate.
Source: AllianceDBS
Market Focus
Results Roundup
Page 4
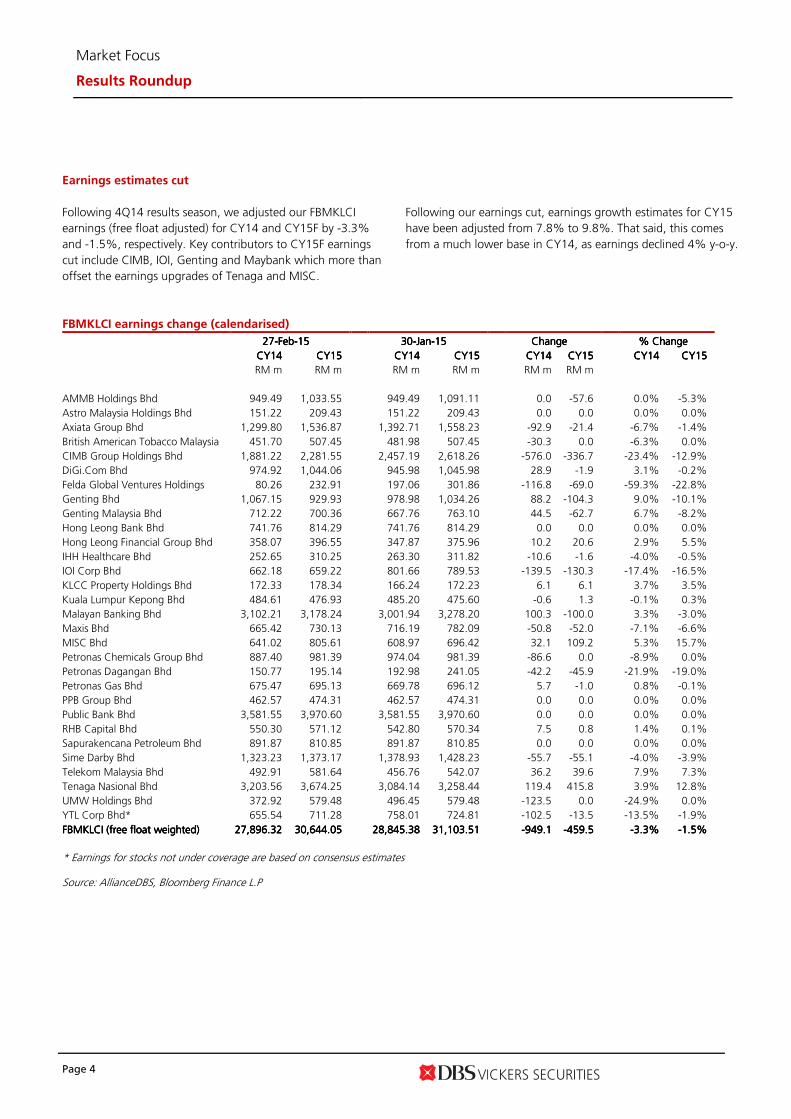
Earnings estimates cut
Following 4Q14 results season, we adjusted our FBMKLCI
earnings (free float adjusted) for CY14 and CY15F by -3.3%
and -1.5%, respectively. Key contributors to CY15F earnings
cut include CIMB, IOI, Genting and Maybank which more than
offset the earnings upgrades of Tenaga and MISC.
Following our earnings cut, earnings growth estimates for CY15
have been adjusted from 7.8% to 9.8%. That said, this comes
from a much lower base in CY14, as earnings declined 4% y-o-y.
FBMKLCI earnings change (calendarised)
27272727----FebFebFebFeb----11115555
30303030----JanJanJanJan----11115555
ChangeChangeChangeChange
% Change% Change% Change% Change
CY14CY14CY14CY14 CY15CY15CY15CY15
CY14CY14CY14CY14 CY15CY15CY15CY15
CY14CY14CY14CY14 CY15CY15CY15CY15
CY14CY14CY14CY14 CY15CY15CY15CY15
RM m RM m
RM m RM m
RM m RM m
AMMB Holdings Bhd 949.49 1,033.55 949.49 1,091.11 0.0 -57.6 0.0% -5.3%
Astro Malaysia Holdings Bhd 151.22 209.43 151.22 209.43 0.0 0.0 0.0% 0.0%
Axiata Group Bhd 1,299.80 1,536.87 1,392.71 1,558.23 -92.9 -21.4 -6.7% -1.4%
British American Tobacco Malaysia 451.70 507.45 481.98 507.45 -30.3 0.0 -6.3% 0.0%
CIMB Group Holdings Bhd 1,881.22 2,281.55 2,457.19 2,618.26 -576.0 -336.7 -23.4% -12.9%
DiGi.Com Bhd 974.92 1,044.06 945.98 1,045.98 28.9 -1.9 3.1% -0.2%
Felda Global Ventures Holdings 80.26 232.91 197.06 301.86 -116.8 -69.0 -59.3% -22.8%
Genting Bhd 1,067.15 929.93 978.98 1,034.26 88.2 -104.3 9.0% -10.1%
Genting Malaysia Bhd 712.22 700.36 667.76 763.10 44.5 -62.7 6.7% -8.2%
Hong Leong Bank Bhd 741.76 814.29 741.76 814.29 0.0 0.0 0.0% 0.0%
Hong Leong Financial Group Bhd 358.07 396.55 347.87 375.96 10.2 20.6 2.9% 5.5%
IHH Healthcare Bhd 252.65 310.25 263.30 311.82 -10.6 -1.6 -4.0% -0.5%
IOI Corp Bhd 662.18 659.22 801.66 789.53 -139.5 -130.3 -17.4% -16.5%
KLCC Property Holdings Bhd 172.33 178.34 166.24 172.23 6.1 6.1 3.7% 3.5%
Kuala Lumpur Kepong Bhd 484.61 476.93 485.20 475.60 -0.6 1.3 -0.1% 0.3%
Malayan Banking Bhd 3,102.21 3,178.24 3,001.94 3,278.20 100.3 -100.0 3.3% -3.0%
Maxis Bhd 665.42 730.13 716.19 782.09 -50.8 -52.0 -7.1% -6.6%
MISC Bhd 641.02 805.61 608.97 696.42 32.1 109.2 5.3% 15.7%
Petronas Chemicals Group Bhd 887.40 981.39 974.04 981.39 -86.6 0.0 -8.9% 0.0%
Petronas Dagangan Bhd 150.77 195.14 192.98 241.05 -42.2 -45.9 -21.9% -19.0%
Petronas Gas Bhd 675.47 695.13 669.78 696.12 5.7 -1.0 0.8% -0.1%
PPB Group Bhd 462.57 474.31 462.57 474.31 0.0 0.0 0.0% 0.0%
Public Bank Bhd 3,581.55 3,970.60 3,581.55 3,970.60 0.0 0.0 0.0% 0.0%
RHB Capital Bhd 550.30 571.12 542.80 570.34 7.5 0.8 1.4% 0.1%
Sapurakencana Petroleum Bhd 891.87 810.85 891.87 810.85 0.0 0.0 0.0% 0.0%
Sime Darby Bhd 1,323.23 1,373.17 1,378.93 1,428.23 -55.7 -55.1 -4.0% -3.9%
Telekom Malaysia Bhd 492.91 581.64 456.76 542.07 36.2 39.6 7.9% 7.3%
Tenaga Nasional Bhd 3,203.56 3,674.25 3,084.14 3,258.44 119.4 415.8 3.9% 12.8%
UMW Holdings Bhd 372.92 579.48 496.45 579.48 -123.5 0.0 -24.9% 0.0%
YTL Corp Bhd* 655.54 711.28 758.01 724.81 -102.5 -13.5 -13.5% -1.9%
FBMKLCI (free float weighted)FBMKLCI (free float weighted)FBMKLCI (free float weighted)FBMKLCI (free float weighted) 27,896.32 27,896.32 27,896.32 27,896.32 30,644.05 30,644.05 30,644.05 30,644.05 28,845.38 28,845.38 28,845.38 28,845.38 31,103.51 31,103.51 31,103.51 31,103.51 ----949.1949.1949.1949.1 ----459.5459.5459.5459.5 ----3.3%3.3%3.3%3.3% ----1.5%1.5%1.5%1.5%
* Earnings for stocks not under coverage are based on consensus estimates Source: AllianceDBS, Bloomberg Finance L.P
Market Focus
Results Roundup
Page 5
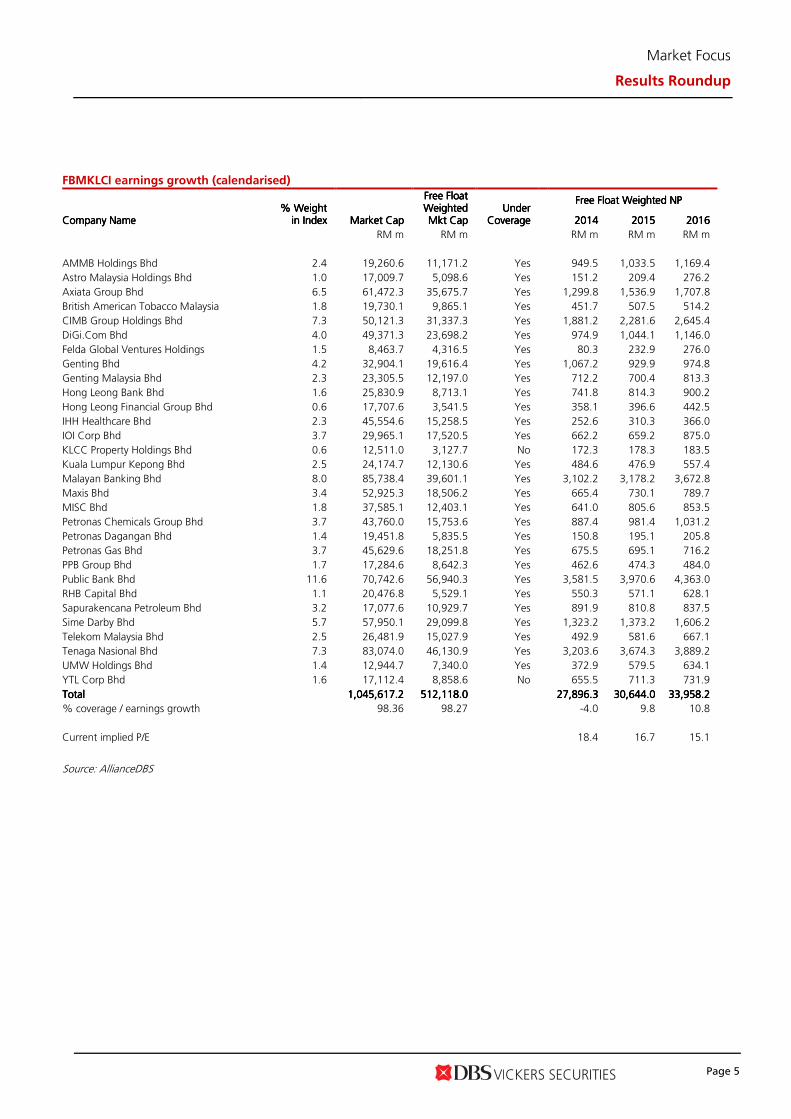
FBMKLCI earnings growth (calendarised)
% Weight % Weight % Weight % Weight in Indexin Indexin Indexin Index Market CapMarket CapMarket CapMarket Cap
Free Float Free Float Free Float Free Float Weighted Weighted Weighted Weighted Mkt CapMkt CapMkt CapMkt Cap
Under Under Under Under CoverageCoverageCoverageCoverage
FrFrFrFree Float Weighted NPee Float Weighted NPee Float Weighted NPee Float Weighted NP
Company NameCompany NameCompany NameCompany Name
2014201420142014 2015201520152015 2016201620162016
RM m RM m
RM m RM m RM m
AMMB Holdings Bhd 2.4 19,260.6 11,171.2 Yes
949.5 1,033.5 1,169.4
Astro Malaysia Holdings Bhd 1.0 17,009.7 5,098.6 Yes
151.2 209.4 276.2
Axiata Group Bhd 6.5 61,472.3 35,675.7 Yes
1,299.8 1,536.9 1,707.8
British American Tobacco Malaysia 1.8 19,730.1 9,865.1 Yes
451.7 507.5 514.2
CIMB Group Holdings Bhd 7.3 50,121.3 31,337.3 Yes
1,881.2 2,281.6 2,645.4
DiGi.Com Bhd 4.0 49,371.3 23,698.2 Yes
974.9 1,044.1 1,146.0
Felda Global Ventures Holdings 1.5 8,463.7 4,316.5 Yes
80.3 232.9 276.0
Genting Bhd 4.2 32,904.1 19,616.4 Yes
1,067.2 929.9 974.8
Genting Malaysia Bhd 2.3 23,305.5 12,197.0 Yes
712.2 700.4 813.3
Hong Leong Bank Bhd 1.6 25,830.9 8,713.1 Yes
741.8 814.3 900.2
Hong Leong Financial Group Bhd 0.6 17,707.6 3,541.5 Yes
358.1 396.6 442.5
IHH Healthcare Bhd 2.3 45,554.6 15,258.5 Yes
252.6 310.3 366.0
IOI Corp Bhd 3.7 29,965.1 17,520.5 Yes
662.2 659.2 875.0
KLCC Property Holdings Bhd 0.6 12,511.0 3,127.7 No
172.3 178.3 183.5
Kuala Lumpur Kepong Bhd 2.5 24,174.7 12,130.6 Yes
484.6 476.9 557.4
Malayan Banking Bhd 8.0 85,738.4 39,601.1 Yes
3,102.2 3,178.2 3,672.8
Maxis Bhd 3.4 52,925.3 18,506.2 Yes
665.4 730.1 789.7
MISC Bhd 1.8 37,585.1 12,403.1 Yes
641.0 805.6 853.5
Petronas Chemicals Group Bhd 3.7 43,760.0 15,753.6 Yes
887.4 981.4 1,031.2
Petronas Dagangan Bhd 1.4 19,451.8 5,835.5 Yes
150.8 195.1 205.8
Petronas Gas Bhd 3.7 45,629.6 18,251.8 Yes
675.5 695.1 716.2
PPB Group Bhd 1.7 17,284.6 8,642.3 Yes
462.6 474.3 484.0
Public Bank Bhd 11.6 70,742.6 56,940.3 Yes
3,581.5 3,970.6 4,363.0
RHB Capital Bhd 1.1 20,476.8 5,529.1 Yes
550.3 571.1 628.1
Sapurakencana Petroleum Bhd 3.2 17,077.6 10,929.7 Yes
891.9 810.8 837.5
Sime Darby Bhd 5.7 57,950.1 29,099.8 Yes
1,323.2 1,373.2 1,606.2
Telekom Malaysia Bhd 2.5 26,481.9 15,027.9 Yes
492.9 581.6 667.1
Tenaga Nasional Bhd 7.3 83,074.0 46,130.9 Yes
3,203.6 3,674.3 3,889.2
UMW Holdings Bhd 1.4 12,944.7 7,340.0 Yes
372.9 579.5 634.1
YTL Corp Bhd 1.6 17,112.4 8,858.6 No
655.5 711.3 731.9
TotalTotalTotalTotal
1,045,617.21,045,617.21,045,617.21,045,617.2 512,118.0512,118.0512,118.0512,118.0
27,896.327,896.327,896.327,896.3 30,644.030,644.030,644.030,644.0 33,958.233,958.233,958.233,958.2
% coverage / earnings growth
98.36 98.27
-4.0 9.8 10.8
Current implied P/E
18.4 16.7 15.1
Source: AllianceDBS
Market Focus
Results Roundup
Page 6
Valuation is expensive
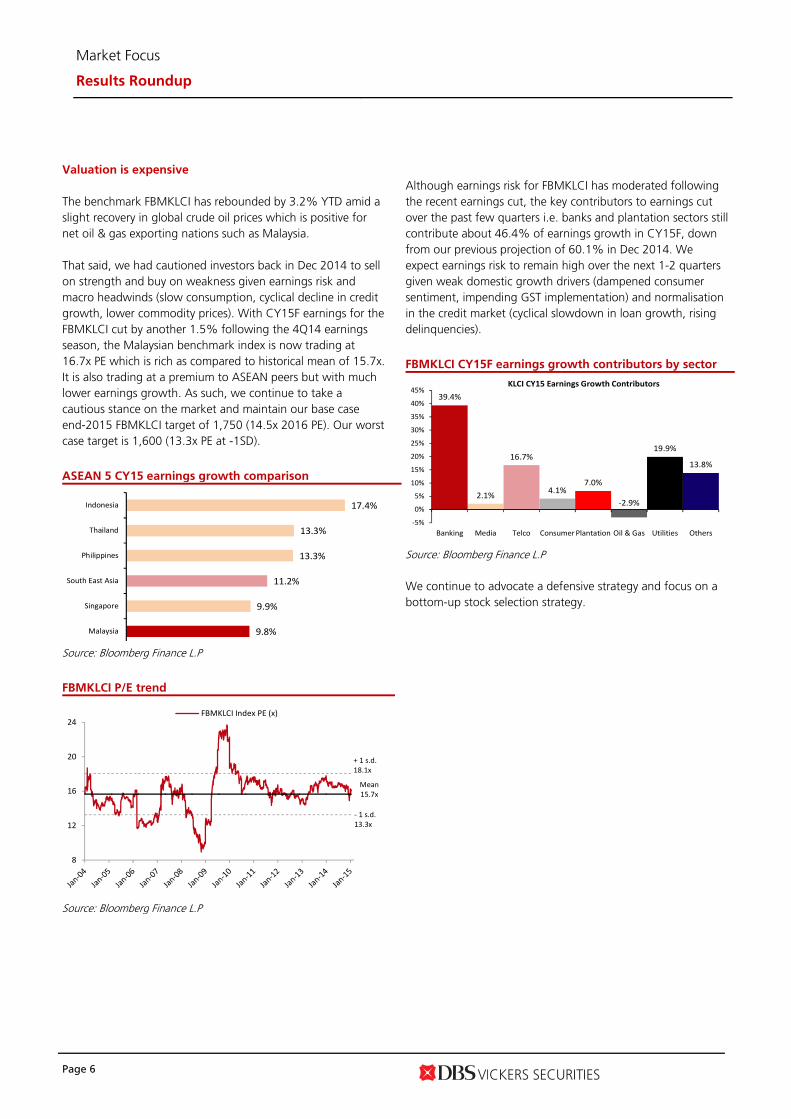
The benchmark FBMKLCI has rebounded by 3.2% YTD amid a
slight recovery in global crude oil prices which is positive for
net oil & gas exporting nations such as Malaysia.
That said, we had cautioned investors back in Dec 2014 to sell
on strength and buy on weakness given earnings risk and
macro headwinds (slow consumption, cyclical decline in credit
growth, lower commodity prices). With CY15F earnings for the
FBMKLCI cut by another 1.5% following the 4Q14 earnings
season, the Malaysian benchmark index is now trading at
16.7x PE which is rich as compared to historical mean of 15.7x.
It is also trading at a premium to ASEAN peers but with much
lower earnings growth. As such, we continue to take a
cautious stance on the market and maintain our base case
end-2015 FBMKLCI target of 1,750 (14.5x 2016 PE). Our worst
case target is 1,600 (13.3x PE at -1SD).
ASEAN 5 CY15 earnings growth comparison
9.8%
9.9%
11.2%
13.3%
13.3%
17.4%
Malaysia
Singapore
South East Asia
Philippines
Thailand
Indonesia
Source: Bloomberg Finance L.P
FBMKLCI P/E trend
8
12
16
20
24FBMKLCI Index PE (x)
Mean
15.7x
- 1 s.d.
13.3x
+ 1 s.d.
18.1x
Source: Bloomberg Finance L.P
Although earnings risk for FBMKLCI has moderated following
the recent earnings cut, the key contributors to earnings cut
over the past few quarters i.e. banks and plantation sectors still
contribute about 46.4% of earnings growth in CY15F, down
from our previous projection of 60.1% in Dec 2014. We
expect earnings risk to remain high over the next 1-2 quarters
given weak domestic growth drivers (dampened consumer
sentiment, impending GST implementation) and normalisation
in the credit market (cyclical slowdown in loan growth, rising
delinquencies).
FBMKLCI CY15F earnings growth contributors by sector
39.4%
2.1%
16.7%
4.1%7.0%
-2.9%
19.9%
13.8%
-5%
0%
5%
10%
15%
20%
25%
30%
35%
40%
45%
Banking Media Telco Consumer Plantation Oil & Gas Utilities Others
KLCI CY15 Earnings Growth Contributors
Source: Bloomberg Finance L.P
We continue to advocate a defensive strategy and focus on a
bottom-up stock selection strategy.
Market Focus
Results Roundup
Page 7
Sector weightings
Sector Views
OverweightOverweightOverweightOverweight
Construction Shipping (↑) Technology Utilities
NeutralNeutralNeutralNeutral
Automotive Aviation Banks Gaming Gloves (↓) Healthcare Oil & Gas Plantation Property REITs Telecommunication
UnderweightUnderweightUnderweightUnderweight Consumer
Source: AllianceDBS
We continue to favour sectors which are resilient amid a
slowdown in domestic consumption. ConstructionConstructionConstructionConstruction remains an
Overweight due to continued government spending on
infrastructure projects as well as projects under the Economic
Transformation Programme (ETP). This is further supported by
PM’s reassurance in mid-Jan that development expenditure for
2015 will not be cut despite the slump in oil-related revenue.
We continue to like the TTTTechnologyechnologyechnologyechnology sector as the steady
recovery in the US has boosted exports of E&E products, which
led to a cyclical recovery of this sector. Although export
growth may slow down, it will be from a higher base in 2014.
Furthermore, these companies will also benefit from a weaker
MYR against the USD.
UUUUtilitiestilitiestilitiestilities sector also remains an Overweight as we continue to
like its resiliency. It is also a beneficiary of energy sector reform
in Malaysia which will lead to improved earnings visibility over
the longer term, boosting the prospects of higher dividend
payouts going forward.
We upgrade the SSSShippinghippinghippinghipping sector to Overweight as lower
bunker cost following the recent crude oil price slump will
boost bottomline.
We downgraded the GlovesGlovesGlovesGloves sector from overweight to Neutral
as stocks within our coverage have performed well since our
recommendation upgrade in Dec and thereby, narrowing
further potential upside.
We continue to keep the CCCConsumeronsumeronsumeronsumer sector Underweight,
which is vindicated judging by the earnings disappointment in
4Q14. The current weak consumer sentiment is unlikely to
change for the better in view of implementation of GST in
April 2015, which will lead to another round of inflationary
pressure. Nevertheless, we like the education sub-segment for
its resilience towards economic cycles.
Top stock picks
Our top stock picks (refer to our strategy report dated 15 Dec
2014) have generally done well with a simple average return of
9.6% YTD, outperforming the FBMKLCI by 6.4%.
Performance of top stock picks
Stock 31-Dec-14 2-Mar-15 YTD perf
Tenaga Nasional 13.80 14.66 6.2%
Petronas Gas 22.16 23.10 4.2%
Gamuda 5.01 5.29 5.6%
IJM Corp 6.57 7.20 9.6%
Muhibbah Engineering 1.87 2.29 22.5%
Hartalega 7.03 8.00 13.8%
Globetronics 4.30 4.88 13.5%
Unisem 1.78 2.10 18.0%
Pantech 0.77 0.76 -1.3%
Sasbadi 1.48 1.54 4.1%
Simple average 9.6%
Price at
Source: Bloomberg Finance L.P
We dropped Hartalega and Globetronics from our top buy list
following recent price run up which has narrowed potential
upside. We replaced these stocks with Time dotComTime dotComTime dotComTime dotCom and
MISCMISCMISCMISC.
Please refer to page 14 to 16 for detailed key investment merits
of our top stock picks.
Market Focus
Results Roundup
Page 8
Sector Outlook
SectorSectorSectorSector OutlookOutlookOutlookOutlook Top Stock PicksTop Stock PicksTop Stock PicksTop Stock Picks
AutomotiveAutomotiveAutomotiveAutomotive
Neutral
• The uncertainty over direction of car prices with the implementation of GST will likely
result in muted volume sales in the coming months. Tighter financing conditions
could further dampen consumer sentiment. For manufacturers, the appreciating US$
would increase the cost of imported materials and pressure margins.
• Hence, we expect 2015 to be a challenging year for auto players. We maintain Hold
recommendations for the auto stocks under our coverage.
-
AviationAviationAviationAviation
Neutral
• MAS has been delisted, and is currently undergoing restructuring. We expect MAS to
rationalise its capacity, but the near-term focus will likely be onshort-haul routes.
Channel checks indicate that long-haul routes will only be reviewed at a later stage of
the restructuring (beyond 2Q15). If so, AirAsia, which focuses on short-haul routes,
would see its competitive environment turn positive, ahead of AAX which focuses on
long-haul routes.
• The cheaper fuel cost is a boon for the airlines, but we expect the airlines to pass on
a significant portion of the fuel cost savings to consumers. AirAsia and AAX’s
decision to remove fuel surcharge suggests that the group could pass on c.70% of
cost savings to consumers. Meanwhile, the stronger USD will offset some of the fuel
cost savings, as USD-denominated OPEX (maintenance, lease, fuel) and finance cost
(from USD-borrowings) will be more expensive.
• MAS’ renewed focus on yield management is negative for MAHB. With airline toning
down capacity growth and higher airfares going forward, passenger traffic will likely
normalise and be slower than 2013. The implementation of GST could also reduce
consumers’ discretionary spending, which is another dampener for travel demand.
The airport operator is only targeting a 3%growth in passenger traffic in 2015.
-
BanksBanksBanksBanks
Neutral
• Revenue growth will be capped by a flat loan growth (our sector loan growth
assumption is 9%) and will be largely business driven amid weaker consumer
sentiment from fiscal tightening measures and stricter consumer lending rules.
• NIM compression will persist in 2015, pressured mainly by deposit competition as
banks prepare to meet the Liquidity Coverage Ratio requirements under Basel III. The
outlook for capital markets is sluggish. Provisions are likely to normalise with fewer
recoveries, and with the softer macro environment, we would not discount credit
costs inching up.
• We would stay defensive and stick to PBK and HLB. Both banks have the advantage
of strong credit culture and liquidity. However, HLB may consider a capital raising
exercise to beef up its capital position.
Public Bank, Hong Leong
Bank
Building materialsBuilding materialsBuilding materialsBuilding materials
Neutral
• Competition in Peninsular Malaysia cement industry could get worse as YTL Cement
will add another 8% to industry capacity when its expansion is completed in early
2015. Meanwhile, domestic cement demand growth is only expected to grow by 3-
5% in 2015, according to Lafarge.
• CMS is in a better position given its natural monopoly in the Sarawak market. The
company is also not impacted by the electricity tariff hike suffered by Peninsular
players.
-
Market Focus
Results Roundup
Page 9
Sector Outlook (cont’d)
SectorSectorSectorSector OutlookOutlookOutlookOutlook Top Stock PicksTop Stock PicksTop Stock PicksTop Stock Picks
ConstructionConstructionConstructionConstruction
Overweight
• The Prime Minister reiterated his commitment towards several high multiplier
construction contracts inspite of the still low oil price environment. This includes
among others MRT Line 2, High Speed Rail, LRT 3, RAPID and other highway projects.
• We expect an official announcement on MMC-Gamuda's PDP contract for MRT Line
2 by 2Q15 where it should not be worse off as compared to its role for Line 1.
Tenders will open in 3Q15 and some works should start by 1Q16.
• Our top picks for the sector remain the large caps - IJM and Gamuda. IJM's
orderbook is now at its peak at c.RM7bn and comprises of higher margin local jobs.
Gamuda also remains the best proxy to the MRT story in Malaysia. In the mid cap
space, we still like Muhibbah Engineering where we think its infrastructure division
should show stronger growth this year.
Gamuda, IJM Corp,
Muhibbah Engineering
ConsumerConsumerConsumerConsumer
Underweight
• 4Q2014 consumer sentiment index fell 15 points q-o-q to settle below the threshold
of 100 at 83 points (3Q2014: 98 points), indicating consumers are concerned about
the future and becoming more cautious due to the rising cost of living.
• 4QCY14 results were unexciting. We observe that the sector has been generally
plagued by rising cost pressures and the inability to pass on the higher costs due to
(1) a slowdown in consumer spending, and (2) increasingly competitive operating
environment. As such, margins may continue to be suppressed.
• We keep the sector as Underweight, as earnings remain unexciting and sentiment is
not likely to see a swift turnaround. Sasbadi is our top pick due to its exposure to the
resilient pre-university education industry, and will be a key beneficiary to potential
new policies in the Malaysia Education Blueprint 2013-2025.
Sasbadi
GamingGamingGamingGaming
Neutral
• We do not foresee any significant catalysts to re-rate the sector in the near term.
Falling domestic consumer sentiment could slow down discretionary spending, which
may in turn drag the leisure & hospitality business of Genting Malaysia’s domestic
operations and ticket sales of NFOs.
• On the other hand, even though the sector was spared of sin tax hikes in the Budget
2015, GST implementation in April 2015 will impact margins.
-
GlovesGlovesGlovesGloves
Neutral
• Malaysian glovemakers are set to grow production capacity by 16%/13% in 2015/16.
While this surpasses the expectations of global glove consumption growth of 6-8%
p.a., the additional capacity will be absorbed due to: (1) the progressive
commissioning of production lines, (2) potential delays in some expansion plans, and
(3) closure of Halyard Health’s Thai glove facility which will remove 3bn capacity in
CY15. In short, we expect Malaysian glovemakers to gain global market share.
• Despite this, competition could still heat-up among the glovemakers. Hartalega with
its best-in-class operating structure (i.e. lowest breakeven utilisation) could choose to
be more aggressive in its pricing to: (1) grab market share, (2) maximise utilisation
and profits, and (3) derail competitors expansion plans by depressing IRRs for future
projects.
• Our top pick for the sector is Hartalega, as it is best-positioned to weather an
industry-wide price war. We expect the stock to offer decent 16% earnings CAGR in
FY15-17F, even after assuming severe margin compression.
Hartalega
Market Focus
Results Roundup
Page 10
Sector Outlook (cont’d)
SectorSectorSectorSector OutlookOutlookOutlookOutlook Top Stock PicksTop Stock PicksTop Stock PicksTop Stock Picks
HealthcareHealthcareHealthcareHealthcare
Neutral
• We remain optimistic of the growth prospects for private hospitals operators due to
increasing demand for quality healthcare amid rising disposable income. Capacity
constraints at government healthcare facilities are also expected to drive affluent
patients to private hospitals. The constraint is expected to worsen with public
healthcare development expenditure cut from RM3.7bn in 2010 to RM1.6bn in 2015.
• Generic pharmaceutical players are expected to enter a new growth phase with the
approach of the patent cliff. This provides an opportunity for them to launch new
products and improve sales. Valuations are also more palatable vis-à-vis the hospital
operators.
• There is increasing competition within the retail pharmacy segment with the
emergence of several independent retail pharmacies. The exceptionally high ROEs of
30-40% will be a thing of the past. We expect an industry-wide price war to drive
margins down going forward.
-
MediaMediaMediaMedia
Neutral
• We expect adex to be softer for the rest of this year as further subsidy rationalisation
measures and the introduction of GST in 2015 would dampen consumer sentiment.
• Nonetheless, downside risks are limited given decent dividend yields of 4-6% for the
sector.
-
Oil & GasOil & GasOil & GasOil & Gas
Neutral
• PETRONAS recently re-affirmed its stance on cutting capex and opex after reporting
losses in 4Q14 and overall FY14 earnings that was 27% lower y-o-y. There has
already been noise in the market of asset charter rates and work order rates, and
volumes being negotiated downward and we expect these cost cutting measures to
continue.
• With a change in guard in PETRONAS starting April, we believe that it will further
slow contract flow over 2015 as the new management settles in, implying that 2015
will be a very quiet year for the sector.
• Downstream will be the only active area as investments to develop RAPID continue.
We like Pantech as it is poised to benefit from demand for pipes, valves and fittings.
• On a positive note, crude oil prices have stabilised and Brent prices are starting to
creep up. Further recovery in crude oil prices would brighten 2016 outlook as PSC’s
may decide to revive capex growth.
• We have 2 BUY recommendations within our coverage - SapuraKencana and Pantech
(as explained above). SAKP’s results should progressively improve after a dip in 4Q14
and 1Q15 as crude oil prices recover. Furthermore, its orderbook of RM27bn is
largely intact.
SapuraKencana
Petroleum, Pantech
Market Focus
Results Roundup
Page 11
Sector Outlook (cont’d)
SectorSectorSectorSector OutlookOutlookOutlookOutlook Top Stock PicksTop Stock PicksTop Stock PicksTop Stock Picks
PlantationPlantationPlantationPlantation
Neutral
• We expect palm oil prices to remain under pressure in the near term, given the (1)
record US soybean crop, (2) prospective demand shifts to soybean oil from India due
to a hike in import taxes, and (3) soft biodiesel demand. Further downside risks are
extra soybean supplies from Argentina flooding the export market in the event of a
Peso-devaluation. This may occur before/during South American harvest season
(1Q15).
• Refiners are also expected to see continued low margins due to the waiver of export
taxes and underlying overcapacity issues.
• However, slower supply in 2H15 from the dryness in 1Q & 3Q14 (which will affect FFB
yields) is anticipated to help lower the stock/usage ratio by year-end, which can
support CPO prices.
• We recommend younger planters such Genting Plantations and TSH Resources which
can offset lower ASPs with higher volume.
Genting Plantations TSH Resources
PropertyPropertyPropertyProperty
Neutral
• We expect slower property sales volumes in 2015 although prices should continue to
hold up due to cost push factors. While sentiment should remain subdued given
recent tightening measures and inflationary pressures, mass-market products at
strategic locations continue to enjoy robust sales as affordability remains a key issue
among property purchasers.
• Rising building material prices as well as tight foreign labour supply could heighten
execution risk and dampen developers' margins. There is no property bubble for now
but we fear an oversupply of KL office space, hybrid high-rise units and Iskandar
Malaysia high-end condos.
• MKH is our top pick for the sector given its large exposure to affordable housing and
landed properties in the Kajang-Semenyih growth corridor. We also like Sunway
given its clear earnings visibility and superior ‘build-own-manage’ integrated model
which is unrivalled by most of its peers.
MKH, Sunway
REITsREITsREITsREITs
Neutral
• Retail REITs saw its peak rental reversion cycle in 2014, but may see reversions
moderated by weaker retail sales going forward, due to the softer consumer
sentiment. Office spaces are still in oversupply, restricting rental growth and
presenting some risk towards occupancy levels. Overall we expect earnings and DPU
growth to be lukewarm.
• Our house economist is not expecting an interest rate hike in 2015, which is positive
for yield-sensitive securities like REITs. However the spread of larger cap REIT yields
over the 10-year Malaysian Government Securities are relatively narrow at <2%.
• Given the largely unexciting environment, REITs which can achieve inorganic growth
through yield-accretive asset growth should generate interest. We like Sunway REIT
due to the impending completion of refurbishment works at Sunway Putra, and its
large asset injection pipeline from sponsor Sunway Bhd.
Sunway REIT
Market Focus
Results Roundup
Page 12
Sector Outlook (cont’d)
SectorSectorSectorSector OutlookOutlookOutlookOutlook Top Stock PicksTop Stock PicksTop Stock PicksTop Stock Picks
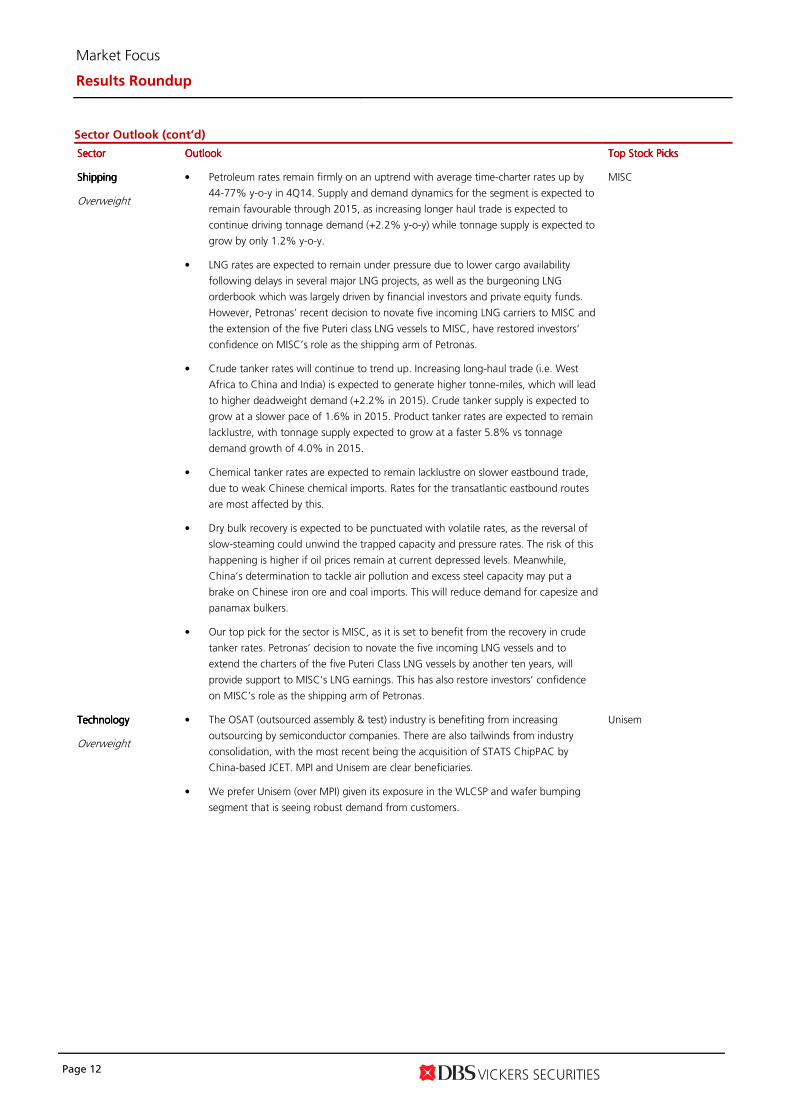
ShippingShippingShippingShipping
Overweight
• Petroleum rates remain firmly on an uptrend with average time-charter rates up by
44-77% y-o-y in 4Q14. Supply and demand dynamics for the segment is expected to
remain favourable through 2015, as increasing longer haul trade is expected to
continue driving tonnage demand (+2.2% y-o-y) while tonnage supply is expected to
grow by only 1.2% y-o-y.
• LNG rates are expected to remain under pressure due to lower cargo availability
following delays in several major LNG projects, as well as the burgeoning LNG
orderbook which was largely driven by financial investors and private equity funds.
However, Petronas’ recent decision to novate five incoming LNG carriers to MISC and
the extension of the five Puteri class LNG vessels to MISC, have restored investors’
confidence on MISC’s role as the shipping arm of Petronas.
• Crude tanker rates will continue to trend up. Increasing long-haul trade (i.e. West
Africa to China and India) is expected to generate higher tonne-miles, which will lead
to higher deadweight demand (+2.2% in 2015). Crude tanker supply is expected to
grow at a slower pace of 1.6% in 2015. Product tanker rates are expected to remain
lacklustre, with tonnage supply expected to grow at a faster 5.8% vs tonnage
demand growth of 4.0% in 2015.
• Chemical tanker rates are expected to remain lacklustre on slower eastbound trade,
due to weak Chinese chemical imports. Rates for the transatlantic eastbound routes
are most affected by this.
• Dry bulk recovery is expected to be punctuated with volatile rates, as the reversal of
slow-steaming could unwind the trapped capacity and pressure rates. The risk of this
happening is higher if oil prices remain at current depressed levels. Meanwhile,
China’s determination to tackle air pollution and excess steel capacity may put a
brake on Chinese iron ore and coal imports. This will reduce demand for capesize and
panamax bulkers.
• Our top pick for the sector is MISC, as it is set to benefit from the recovery in crude
tanker rates. Petronas’ decision to novate the five incoming LNG vessels and to
extend the charters of the five Puteri Class LNG vessels by another ten years, will
provide support to MISC’s LNG earnings. This has also restore investors’ confidence
on MISC’s role as the shipping arm of Petronas.
MISC
TechnologyTechnologyTechnologyTechnology
Overweight
• The OSAT (outsourced assembly & test) industry is benefiting from increasing
outsourcing by semiconductor companies. There are also tailwinds from industry
consolidation, with the most recent being the acquisition of STATS ChipPAC by
China-based JCET. MPI and Unisem are clear beneficiaries.
• We prefer Unisem (over MPI) given its exposure in the WLCSP and wafer bumping
segment that is seeing robust demand from customers.
Unisem
Market Focus
Results Roundup
Page 13
Sector Outlook (cont’d)
SectorSectorSectorSector OutlookOutlookOutlookOutlook Top Stock PicksTop Stock PicksTop Stock PicksTop Stock Picks
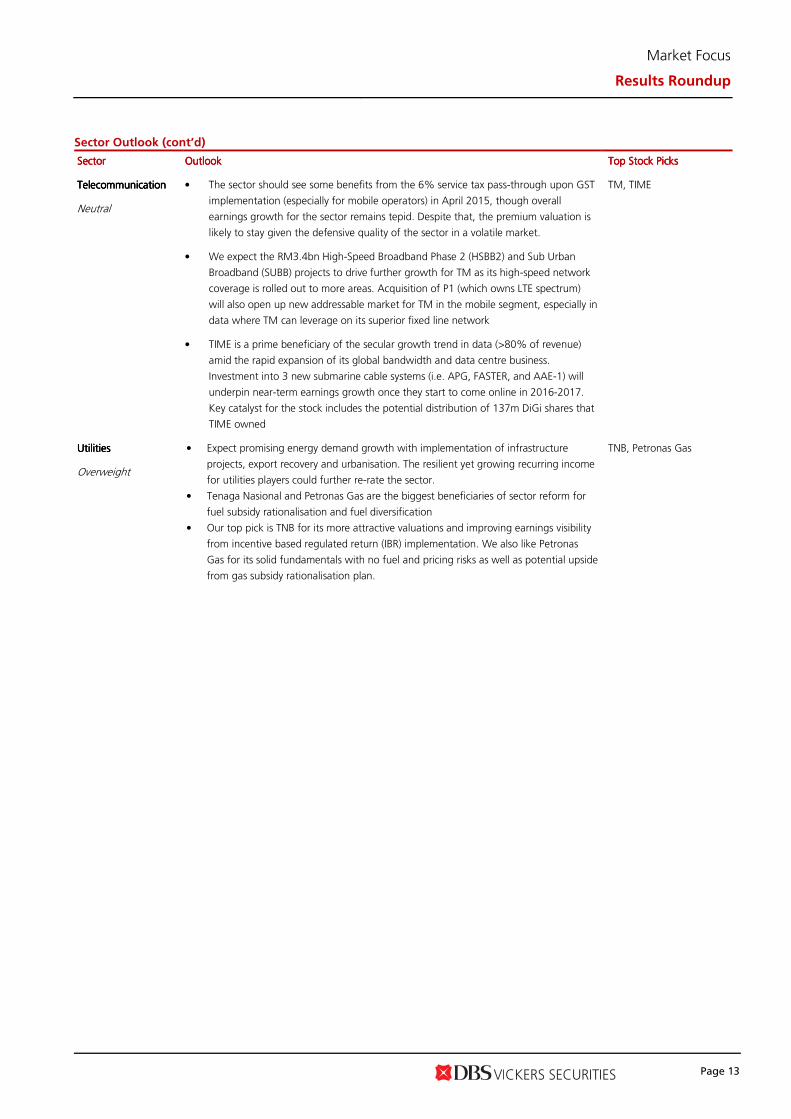
TelecommunicationTelecommunicationTelecommunicationTelecommunication
Neutral
• The sector should see some benefits from the 6% service tax pass-through upon GST
implementation (especially for mobile operators) in April 2015, though overall
earnings growth for the sector remains tepid. Despite that, the premium valuation is
likely to stay given the defensive quality of the sector in a volatile market.
• We expect the RM3.4bn High-Speed Broadband Phase 2 (HSBB2) and Sub Urban
Broadband (SUBB) projects to drive further growth for TM as its high-speed network
coverage is rolled out to more areas. Acquisition of P1 (which owns LTE spectrum)
will also open up new addressable market for TM in the mobile segment, especially in
data where TM can leverage on its superior fixed line network
• TIME is a prime beneficiary of the secular growth trend in data (>80% of revenue)
amid the rapid expansion of its global bandwidth and data centre business.
Investment into 3 new submarine cable systems (i.e. APG, FASTER, and AAE-1) will
underpin near-term earnings growth once they start to come online in 2016-2017.
Key catalyst for the stock includes the potential distribution of 137m DiGi shares that
TIME owned
TM, TIME
UtilitiesUtilitiesUtilitiesUtilities
Overweight
• Expect promising energy demand growth with implementation of infrastructure
projects, export recovery and urbanisation. The resilient yet growing recurring income
for utilities players could further re-rate the sector.
• Tenaga Nasional and Petronas Gas are the biggest beneficiaries of sector reform for
fuel subsidy rationalisation and fuel diversification
• Our top pick is TNB for its more attractive valuations and improving earnings visibility
from incentive based regulated return (IBR) implementation. We also like Petronas
Gas for its solid fundamentals with no fuel and pricing risks as well as potential upside
from gas subsidy rationalisation plan.
TNB, Petronas Gas
Market Focus
Results Roundup
Page 14
Top Stock Picks
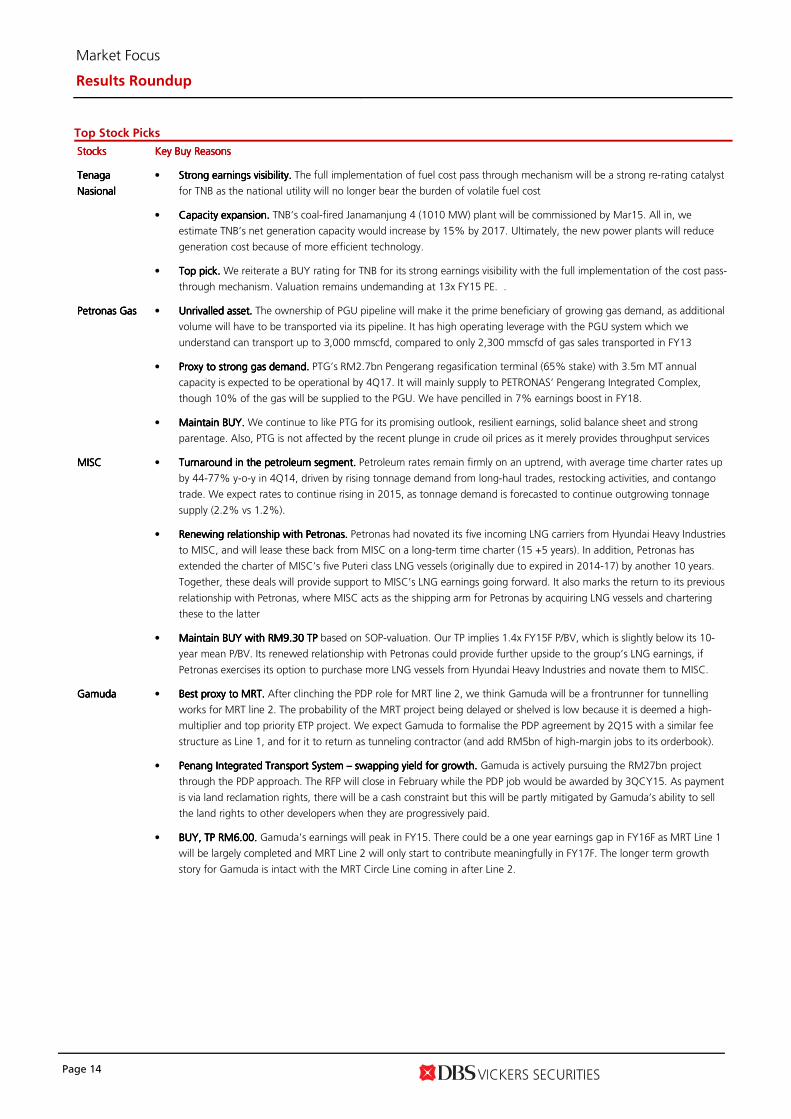
StocksStocksStocksStocks Key Buy Reasons Key Buy Reasons Key Buy Reasons Key Buy Reasons
Tenaga Tenaga Tenaga Tenaga
NasionalNasionalNasionalNasional
• Strong earnings visibility. Strong earnings visibility. Strong earnings visibility. Strong earnings visibility. The full implementation of fuel cost pass through mechanism will be a strong re-rating catalyst
for TNB as the national utility will no longer bear the burden of volatile fuel cost
• Capacity expansion. Capacity expansion. Capacity expansion. Capacity expansion. TNB’s coal-fired Janamanjung 4 (1010 MW) plant will be commissioned by Mar15. All in, we
estimate TNB’s net generation capacity would increase by 15% by 2017. Ultimately, the new power plants will reduce
generation cost because of more efficient technology.
• Top pick. Top pick. Top pick. Top pick. We reiterate a BUY rating for TNB for its strong earnings visibility with the full implementation of the cost pass-
through mechanism. Valuation remains undemanding at 13x FY15 PE. .
Petronas GasPetronas GasPetronas GasPetronas Gas • Unrivalled asset. Unrivalled asset. Unrivalled asset. Unrivalled asset. The ownership of PGU pipeline will make it the prime beneficiary of growing gas demand, as additional
volume will have to be transported via its pipeline. It has high operating leverage with the PGU system which we
understand can transport up to 3,000 mmscfd, compared to only 2,300 mmscfd of gas sales transported in FY13
• Proxy to strong gas demand. Proxy to strong gas demand. Proxy to strong gas demand. Proxy to strong gas demand. PTG’s RM2.7bn Pengerang regasification terminal (65% stake) with 3.5m MT annual
capacity is expected to be operational by 4Q17. It will mainly supply to PETRONAS’ Pengerang Integrated Complex,
though 10% of the gas will be supplied to the PGU. We have pencilled in 7% earnings boost in FY18.
• Maintain BUY. Maintain BUY. Maintain BUY. Maintain BUY. We continue to like PTG for its promising outlook, resilient earnings, solid balance sheet and strong
parentage. Also, PTG is not affected by the recent plunge in crude oil prices as it merely provides throughput services
MISCMISCMISCMISC • Turnaround in the petroleum segment.Turnaround in the petroleum segment.Turnaround in the petroleum segment.Turnaround in the petroleum segment. Petroleum rates remain firmly on an uptrend, with average time charter rates up
by 44-77% y-o-y in 4Q14, driven by rising tonnage demand from long-haul trades, restocking activities, and contango
trade. We expect rates to continue rising in 2015, as tonnage demand is forecasted to continue outgrowing tonnage
supply (2.2% vs 1.2%).
• Renewing relationship with Petronas.Renewing relationship with Petronas.Renewing relationship with Petronas.Renewing relationship with Petronas. Petronas had novated its five incoming LNG carriers from Hyundai Heavy Industries
to MISC, and will lease these back from MISC on a long-term time charter (15 +5 years). In addition, Petronas has
extended the charter of MISC’s five Puteri class LNG vessels (originally due to expired in 2014-17) by another 10 years.
Together, these deals will provide support to MISC’s LNG earnings going forward. It also marks the return to its previous
relationship with Petronas, where MISC acts as the shipping arm for Petronas by acquiring LNG vessels and chartering
these to the latter
• Maintain BUY with RM9.30 TPMaintain BUY with RM9.30 TPMaintain BUY with RM9.30 TPMaintain BUY with RM9.30 TP based on SOP-valuation. Our TP implies 1.4x FY15F P/BV, which is slightly below its 10-
year mean P/BV. Its renewed relationship with Petronas could provide further upside to the group’s LNG earnings, if
Petronas exercises its option to purchase more LNG vessels from Hyundai Heavy Industries and novate them to MISC.
GamudaGamudaGamudaGamuda • Best proxy to MRT. Best proxy to MRT. Best proxy to MRT. Best proxy to MRT. After clinching the PDP role for MRT line 2, we think Gamuda will be a frontrunner for tunnelling
works for MRT line 2. The probability of the MRT project being delayed or shelved is low because it is deemed a high-
multiplier and top priority ETP project. We expect Gamuda to formalise the PDP agreement by 2Q15 with a similar fee
structure as Line 1, and for it to return as tunneling contractor (and add RM5bn of high-margin jobs to its orderbook).
• Penang Integrated Transport System Penang Integrated Transport System Penang Integrated Transport System Penang Integrated Transport System –––– swapping yield for growth. swapping yield for growth. swapping yield for growth. swapping yield for growth. Gamuda is actively pursuing the RM27bn project
through the PDP approach. The RFP will close in February while the PDP job would be awarded by 3QCY15. As payment
is via land reclamation rights, there will be a cash constraint but this will be partly mitigated by Gamuda’s ability to sell
the land rights to other developers when they are progressively paid.
• BUY, TP RM6.00. BUY, TP RM6.00. BUY, TP RM6.00. BUY, TP RM6.00. Gamuda’s earnings will peak in FY15. There could be a one year earnings gap in FY16F as MRT Line 1
will be largely completed and MRT Line 2 will only start to contribute meaningfully in FY17F. The longer term growth
story for Gamuda is intact with the MRT Circle Line coming in after Line 2.
Market Focus
Results Roundup
Page 15
Top Stock Picks (cont’d)
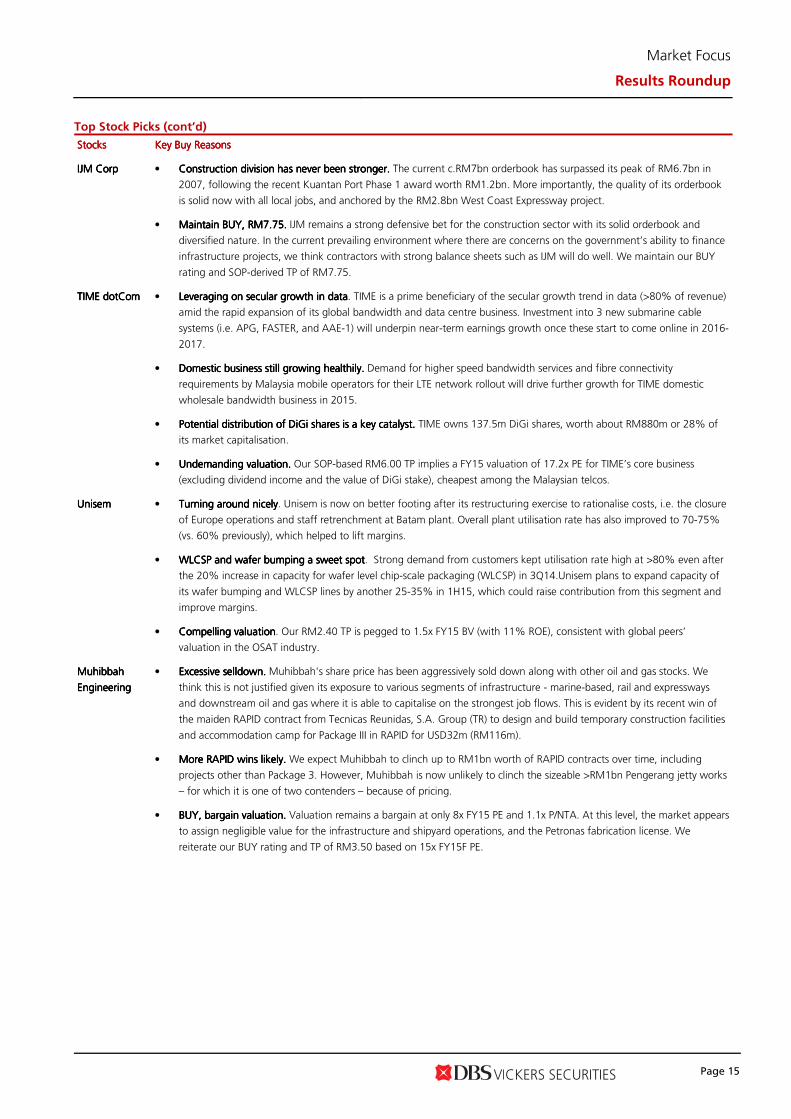
StocksStocksStocksStocks Key Buy Reasons Key Buy Reasons Key Buy Reasons Key Buy Reasons
IJM CorpIJM CorpIJM CorpIJM Corp • Construction division has never been stronger. Construction division has never been stronger. Construction division has never been stronger. Construction division has never been stronger. The current c.RM7bn orderbook has surpassed its peak of RM6.7bn in
2007, following the recent Kuantan Port Phase 1 award worth RM1.2bn. More importantly, the quality of its orderbook
is solid now with all local jobs, and anchored by the RM2.8bn West Coast Expressway project.
• Maintain BUY, RM7.75. Maintain BUY, RM7.75. Maintain BUY, RM7.75. Maintain BUY, RM7.75. IJM remains a strong defensive bet for the construction sector with its solid orderbook and
diversified nature. In the current prevailing environment where there are concerns on the government’s ability to finance
infrastructure projects, we think contractors with strong balance sheets such as IJM will do well. We maintain our BUY
rating and SOP-derived TP of RM7.75.
TIME dotComTIME dotComTIME dotComTIME dotCom • Leveraging on secular growth in dataLeveraging on secular growth in dataLeveraging on secular growth in dataLeveraging on secular growth in data. TIME is a prime beneficiary of the secular growth trend in data (>80% of revenue)
amid the rapid expansion of its global bandwidth and data centre business. Investment into 3 new submarine cable
systems (i.e. APG, FASTER, and AAE-1) will underpin near-term earnings growth once these start to come online in 2016-
2017.
• Domestic business still growing healthily. Domestic business still growing healthily. Domestic business still growing healthily. Domestic business still growing healthily. Demand for higher speed bandwidth services and fibre connectivity
requirements by Malaysia mobile operators for their LTE network rollout will drive further growth for TIME domestic
wholesale bandwidth business in 2015.
• Potential distribution of DiGi shares is a key catalyst. Potential distribution of DiGi shares is a key catalyst. Potential distribution of DiGi shares is a key catalyst. Potential distribution of DiGi shares is a key catalyst. TIME owns 137.5m DiGi shares, worth about RM880m or 28% of
its market capitalisation.
• Undemanding valuation. Undemanding valuation. Undemanding valuation. Undemanding valuation. Our SOP-based RM6.00 TP implies a FY15 valuation of 17.2x PE for TIME’s core business
(excluding dividend income and the value of DiGi stake), cheapest among the Malaysian telcos.
UnisemUnisemUnisemUnisem • Turning Turning Turning Turning around nicelyaround nicelyaround nicelyaround nicely. Unisem is now on better footing after its restructuring exercise to rationalise costs, i.e. the closure
of Europe operations and staff retrenchment at Batam plant. Overall plant utilisation rate has also improved to 70-75%
(vs. 60% previously), which helped to lift margins.
• WLCSP and wafer bumping a sweet spotWLCSP and wafer bumping a sweet spotWLCSP and wafer bumping a sweet spotWLCSP and wafer bumping a sweet spot. Strong demand from customers kept utilisation rate high at >80% even after
the 20% increase in capacity for wafer level chip-scale packaging (WLCSP) in 3Q14.Unisem plans to expand capacity of
its wafer bumping and WLCSP lines by another 25-35% in 1H15, which could raise contribution from this segment and
improve margins.
• Compelling valuationCompelling valuationCompelling valuationCompelling valuation. Our RM2.40 TP is pegged to 1.5x FY15 BV (with 11% ROE), consistent with global peers’
valuation in the OSAT industry.
Muhibbah Muhibbah Muhibbah Muhibbah
EngineeringEngineeringEngineeringEngineering
• Excessive selldown. Excessive selldown. Excessive selldown. Excessive selldown. Muhibbah's share price has been aggressively sold down along with other oil and gas stocks. We
think this is not justified given its exposure to various segments of infrastructure - marine-based, rail and expressways
and downstream oil and gas where it is able to capitalise on the strongest job flows. This is evident by its recent win of
the maiden RAPID contract from Tecnicas Reunidas, S.A. Group (TR) to design and build temporary construction facilities
and accommodation camp for Package III in RAPID for USD32m (RM116m).
• More More More More RAPID wins likely. RAPID wins likely. RAPID wins likely. RAPID wins likely. We expect Muhibbah to clinch up to RM1bn worth of RAPID contracts over time, including
projects other than Package 3. However, Muhibbah is now unlikely to clinch the sizeable >RM1bn Pengerang jetty works
– for which it is one of two contenders – because of pricing.
• BUY, BUY, BUY, BUY, bargain valuationbargain valuationbargain valuationbargain valuation. . . . Valuation remains a bargain at only 8x FY15 PE and 1.1x P/NTA. At this level, the market appears
to assign negligible value for the infrastructure and shipyard operations, and the Petronas fabrication license. We
reiterate our BUY rating and TP of RM3.50 based on 15x FY15F PE.
Market Focus
Results Roundup
Page 16
Top Stock Picks (cont’d)
StocksStocksStocksStocks Key Buy Reasons Key Buy Reasons Key Buy Reasons Key Buy Reasons
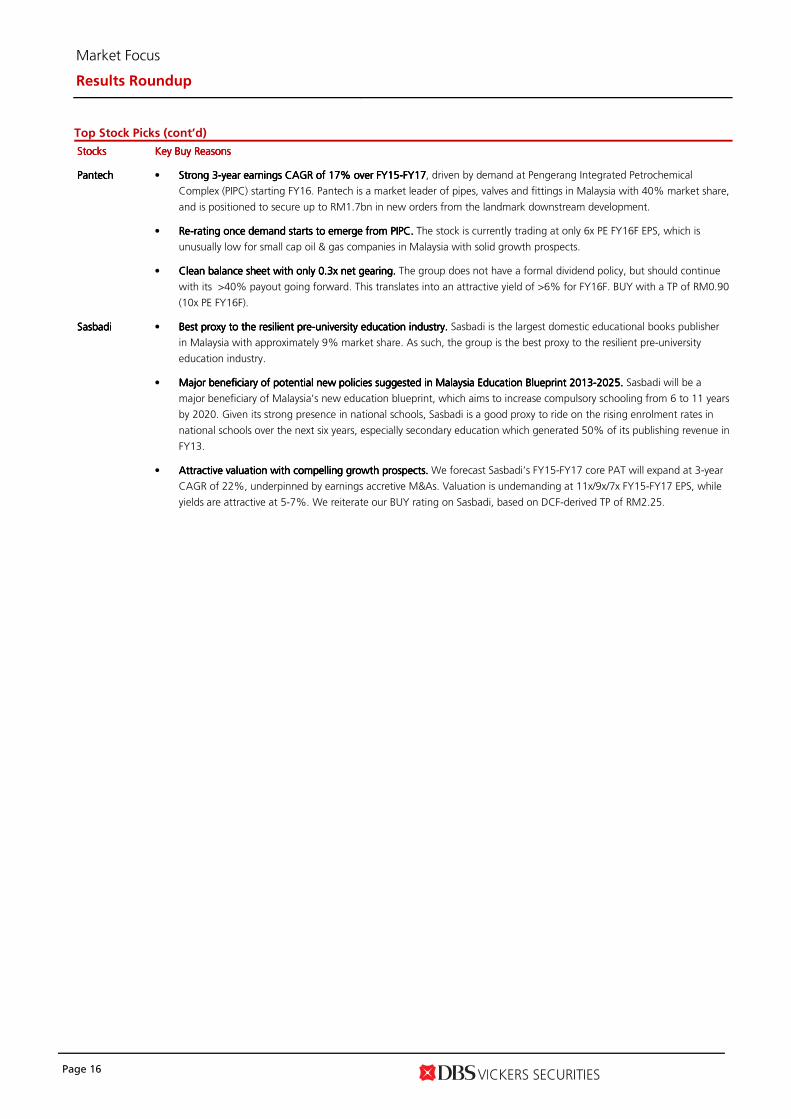
PantechPantechPantechPantech • Strong 3Strong 3Strong 3Strong 3----year earnings CAGR year earnings CAGR year earnings CAGR year earnings CAGR of 17% over FY15of 17% over FY15of 17% over FY15of 17% over FY15----FY17FY17FY17FY17, driven by demand at Pengerang Integrated Petrochemical
Complex (PIPC) starting FY16. Pantech is a market leader of pipes, valves and fittings in Malaysia with 40% market share,
and is positioned to secure up to RM1.7bn in new orders from the landmark downstream development.
• ReReReRe----rating once demand starts to emerge from PIPC.rating once demand starts to emerge from PIPC.rating once demand starts to emerge from PIPC.rating once demand starts to emerge from PIPC. The stock is currently trading at only 6x PE FY16F EPS, which is
unusually low for small cap oil & gas companies in Malaysia with solid growth prospects.
• Clean balaClean balaClean balaClean balance sheet with only 0.3x net gearing.nce sheet with only 0.3x net gearing.nce sheet with only 0.3x net gearing.nce sheet with only 0.3x net gearing. The group does not have a formal dividend policy, but should continue
with its >40% payout going forward. This translates into an attractive yield of >6% for FY16F. BUY with a TP of RM0.90
(10x PE FY16F).
SasbadiSasbadiSasbadiSasbadi
• Best proxy to the resilient preBest proxy to the resilient preBest proxy to the resilient preBest proxy to the resilient pre----university education industry. university education industry. university education industry. university education industry. Sasbadi is the largest domestic educational books publisher
in Malaysia with approximately 9% market share. As such, the group is the best proxy to the resilient pre-university
education industry.
• Major beneficiary of potential new policies suggested in Malaysia Education Blueprint 2013Major beneficiary of potential new policies suggested in Malaysia Education Blueprint 2013Major beneficiary of potential new policies suggested in Malaysia Education Blueprint 2013Major beneficiary of potential new policies suggested in Malaysia Education Blueprint 2013----2025. 2025. 2025. 2025. Sasbadi will be a
major beneficiary of Malaysia’s new education blueprint, which aims to increase compulsory schooling from 6 to 11 years
by 2020. Given its strong presence in national schools, Sasbadi is a good proxy to ride on the rising enrolment rates in
national schools over the next six years, especially secondary education which generated 50% of its publishing revenue in
FY13.
• AtAtAtAttractive valuation with compelling growth prospects. tractive valuation with compelling growth prospects. tractive valuation with compelling growth prospects. tractive valuation with compelling growth prospects. We forecast Sasbadi’s FY15-FY17 core PAT will expand at 3-year
CAGR of 22%, underpinned by earnings accretive M&As. Valuation is undemanding at 11x/9x/7x FY15-FY17 EPS, while
yields are attractive at 5-7%. We reiterate our BUY rating on Sasbadi, based on DCF-derived TP of RM2.25.
Market Focus
Results Roundup
Page 17
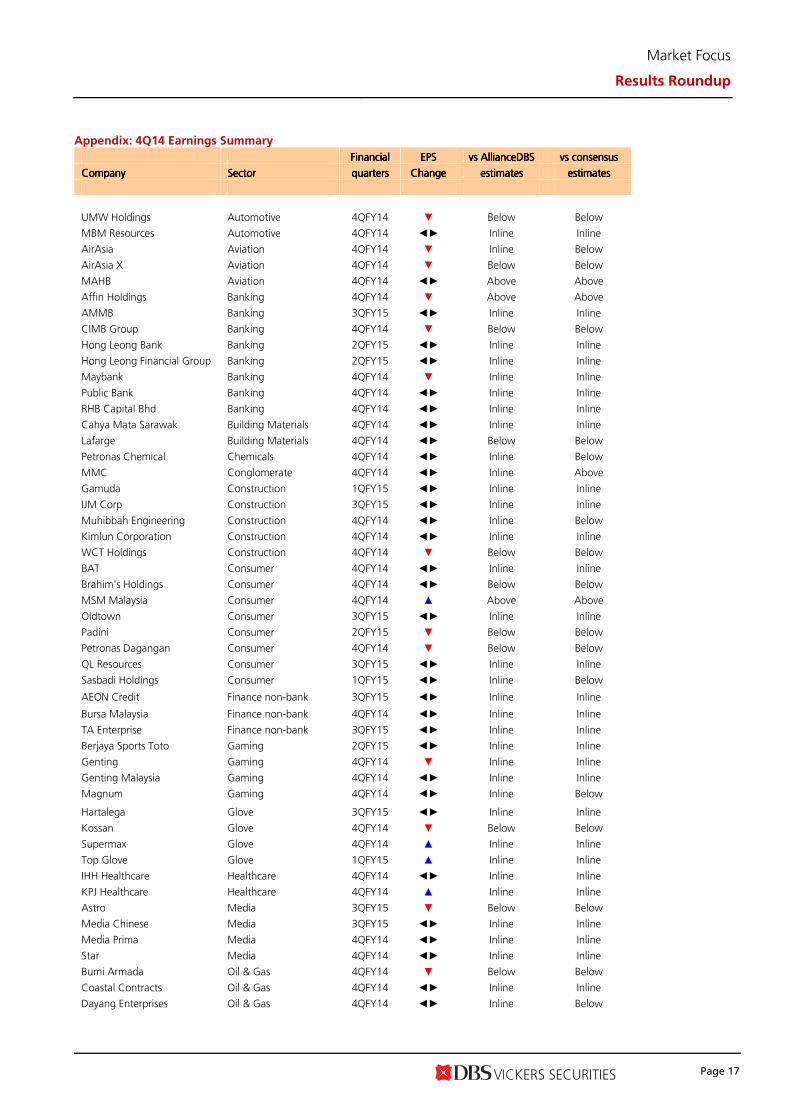
Appendix: 4Q14 Earnings Summary
FinancialFinancialFinancialFinancial EPSEPSEPSEPS vs Avs Avs Avs AlliancelliancelliancellianceDBSDBSDBSDBS vs consensusvs consensusvs consensusvs consensus
CompanyCompanyCompanyCompany SectorSectorSectorSector quartersquartersquartersquarters ChangeChangeChangeChange estimatesestimatesestimatesestimates estimatesestimatesestimatesestimates
UMW Holdings Automotive 4QFY14 ▼ Below Below
MBM Resources Automotive 4QFY14 ◄► Inline Inline
AirAsia Aviation 4QFY14 ▼ Inline Below
AirAsia X Aviation 4QFY14 ▼ Below Below
MAHB Aviation 4QFY14 ◄► Above Above
Affin Holdings Banking 4QFY14 ▼ Above Above
AMMB Banking 3QFY15 ◄► Inline Inline
CIMB Group Banking 4QFY14 ▼ Below Below
Hong Leong Bank Banking 2QFY15 ◄► Inline Inline
Hong Leong Financial Group Banking 2QFY15 ◄► Inline Inline
Maybank Banking 4QFY14 ▼ Inline Inline
Public Bank Banking 4QFY14 ◄► Inline Inline
RHB Capital Bhd Banking 4QFY14 ◄► Inline Inline
Cahya Mata Sarawak Building Materials 4QFY14 ◄► Inline Inline
Lafarge Building Materials 4QFY14 ◄► Below Below
Petronas Chemical Chemicals 4QFY14 ◄► Inline Below
MMC Conglomerate 4QFY14 ◄► Inline Above
Gamuda Construction 1QFY15 ◄► Inline Inline
IJM Corp Construction 3QFY15 ◄► Inline Inline
Muhibbah Engineering Construction 4QFY14 ◄► Inline Below
Kimlun Corporation Construction 4QFY14 ◄► Inline Inline
WCT Holdings Construction 4QFY14 ▼ Below Below
BAT Consumer 4QFY14 ◄► Inline Inline
Brahim's Holdings Consumer 4QFY14 ◄► Below Below
MSM Malaysia Consumer 4QFY14 ▲ Above Above
Oldtown Consumer 3QFY15 ◄► Inline Inline
Padini Consumer 2QFY15 ▼ Below Below
Petronas Dagangan Consumer 4QFY14 ▼ Below Below
QL Resources Consumer 3QFY15 ◄► Inline Inline
Sasbadi Holdings Consumer 1QFY15 ◄► Inline Below
AEON Credit Finance non-bank 3QFY15 ◄► Inline Inline
Bursa Malaysia Finance non-bank 4QFY14 ◄► Inline Inline
TA Enterprise Finance non-bank 3QFY15 ◄► Inline Inline
Berjaya Sports Toto Gaming 2QFY15 ◄► Inline Inline
Genting Gaming 4QFY14 ▼ Inline Inline
Genting Malaysia Gaming 4QFY14 ◄► Inline Inline
Magnum Gaming 4QFY14 ◄► Inline Below
Hartalega Glove 3QFY15 ◄► Inline Inline
Kossan Glove 4QFY14 ▼ Below Below
Supermax Glove 4QFY14 ▲ Inline Inline
Top Glove Glove 1QFY15 ▲ Inline Inline
IHH Healthcare Healthcare 4QFY14 ◄► Inline Inline
KPJ Healthcare Healthcare 4QFY14 ▲ Inline Inline
Astro Media 3QFY15 ▼ Below Below
Media Chinese Media 3QFY15 ◄► Inline Inline
Media Prima Media 4QFY14 ◄► Inline Inline
Star Media 4QFY14 ◄► Inline Inline
Bumi Armada Oil & Gas 4QFY14 ▼ Below Below
Coastal Contracts Oil & Gas 4QFY14 ◄► Inline Inline
Dayang Enterprises Oil & Gas 4QFY14 ◄► Inline Below
Market Focus
Results Roundup
Page 18
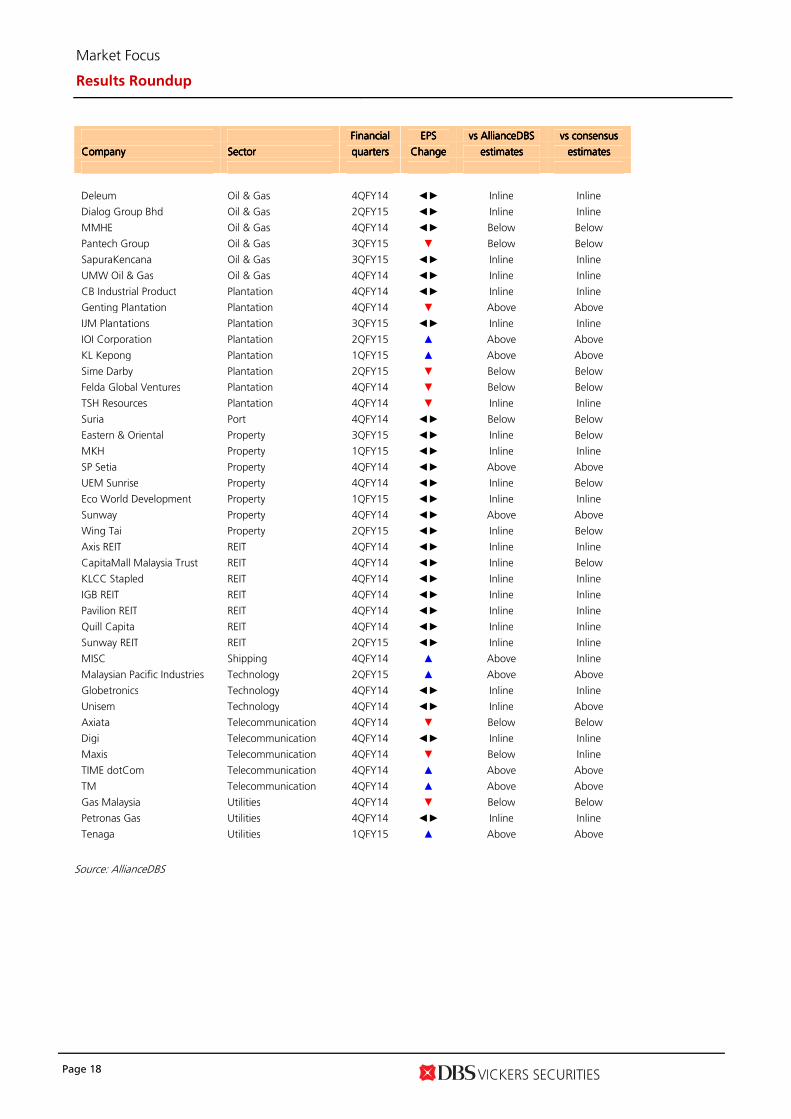
FinancialFinancialFinancialFinancial EPSEPSEPSEPS vs Avs Avs Avs AlliancelliancelliancellianceDBSDBSDBSDBS vs consensusvs consensusvs consensusvs consensus
CompanyCompanyCompanyCompany SectorSectorSectorSector quartersquartersquartersquarters ChangeChangeChangeChange estimatesestimatesestimatesestimates estimatesestimatesestimatesestimates
Deleum Oil & Gas 4QFY14 ◄► Inline Inline
Dialog Group Bhd Oil & Gas 2QFY15 ◄► Inline Inline
MMHE Oil & Gas 4QFY14 ◄► Below Below
Pantech Group Oil & Gas 3QFY15 ▼ Below Below
SapuraKencana Oil & Gas 3QFY15 ◄► Inline Inline
UMW Oil & Gas Oil & Gas 4QFY14 ◄► Inline Inline
CB Industrial Product Plantation 4QFY14 ◄► Inline Inline
Genting Plantation Plantation 4QFY14 ▼ Above Above
IJM Plantations Plantation 3QFY15 ◄► Inline Inline
IOI Corporation Plantation 2QFY15 ▲ Above Above
KL Kepong Plantation 1QFY15 ▲ Above Above
Sime Darby Plantation 2QFY15 ▼ Below Below
Felda Global Ventures Plantation 4QFY14 ▼ Below Below
TSH Resources Plantation 4QFY14 ▼ Inline Inline
Suria Port 4QFY14 ◄► Below Below
Eastern & Oriental Property 3QFY15 ◄► Inline Below
MKH Property 1QFY15 ◄► Inline Inline
SP Setia Property 4QFY14 ◄► Above Above
UEM Sunrise Property 4QFY14 ◄► Inline Below
Eco World Development Property 1QFY15 ◄► Inline Inline
Sunway Property 4QFY14 ◄► Above Above
Wing Tai Property 2QFY15 ◄► Inline Below
Axis REIT REIT 4QFY14 ◄► Inline Inline
CapitaMall Malaysia Trust REIT 4QFY14 ◄► Inline Below
KLCC Stapled REIT 4QFY14 ◄► Inline Inline
IGB REIT REIT 4QFY14 ◄► Inline Inline
Pavilion REIT REIT 4QFY14 ◄► Inline Inline
Quill Capita REIT 4QFY14 ◄► Inline Inline
Sunway REIT REIT 2QFY15 ◄► Inline Inline
MISC Shipping 4QFY14 ▲ Above Inline
Malaysian Pacific Industries Technology 2QFY15 ▲ Above Above
Globetronics Technology 4QFY14 ◄► Inline Inline
Unisem Technology 4QFY14 ◄► Inline Above
Axiata Telecommunication 4QFY14 ▼ Below Below
Digi Telecommunication 4QFY14 ◄► Inline Inline
Maxis Telecommunication 4QFY14 ▼ Below Inline
TIME dotCom Telecommunication 4QFY14 ▲ Above Above
TM Telecommunication 4QFY14 ▲ Above Above
Gas Malaysia Utilities 4QFY14 ▼ Below Below
Petronas Gas Utilities 4QFY14 ◄► Inline Inline
Tenaga Utilities 1QFY15 ▲ Above Above
Source: AllianceDBS
Market Focus
Results Roundup
Page 19
AllianceDBS recommendations are based an Absolute Total Return* Rating system, defined as follows:
STRONG BUYSTRONG BUYSTRONG BUYSTRONG BUY (>20% total return over the next 3 months, with identifiable share price catalysts within this time frame)
BUY BUY BUY BUY (>15% total return over the next 12 months for small caps, >10% for large caps)
HOLDHOLDHOLDHOLD (-10% to +15% total return over the next 12 months for small caps, -10% to +10% for large caps)
FFFFULLY VALUEDULLY VALUEDULLY VALUEDULLY VALUED (negative total return i.e.> -10% over the next 12 months)
SELL SELL SELL SELL (negative total return of > -20% over the next 3 months, with identifiable catalysts within this time frame)
Share price appreciation + dividends GENERAL DISCLOSURE/DISCLAIMER GENERAL DISCLOSURE/DISCLAIMER GENERAL DISCLOSURE/DISCLAIMER GENERAL DISCLOSURE/DISCLAIMER This report is prepared by AllianceDBS Research Sdn Bhd (“ADBSR”) (formerly known as HwangDBS Vickers Research Sdn Bhd), a subsidiary of Alliance Investment Bank Berhad (“AIBB”) and an associate of DBS Vickers Securities Holdings Pte Ltd (“DBSVH”). This report is solely intended for the clients of DBS Bank Ltd and DBS Vickers Securities (Singapore) Pte Ltd, its respective connected and associated corporations and affiliates (collectively, the “DBS Vickers Group”) only and no part of this document may be (i) copied, photocopied or duplicated in any form or by any means or (ii) redistributed without the prior written consent of ADBSR. The research set out in this report is based on information obtained from sources believed to be reliable and ADBSR, its holding company AIBB, their respective connected and associated corporations, affiliates and their respective directors, officers, employees and agents (collectively, the “Alliance Bank Group”) do not make any representation or warranty as to its accuracy, completeness or correctness. Opinions expressed are subject to change without notice. This document is prepared for general circulation. Any recommendation contained in this document does not have regard to the specific investment objectives, financial situation and the particular needs of any specific addressee. This document is for the information of addressees only and is not to be taken in substitution for the exercise of judgement by addressees, who should obtain separate independent legal or financial advice. The Alliance Bank Group accepts no liability whatsoever for any direct, indirect and/or consequential loss (including any claims for loss of profit) arising from any use of and/or reliance upon this document and/or further communication given in relation to this document. This document is not to be construed as an offer or a solicitation of an offer to buy or sell any securities. The Alliance Bank Group, along with its affiliates and/or persons associated with any of them may from time to time have interests in the securities mentioned in this document. The Alliance Bank Group may have positions in, and may effect transactions in securities mentioned herein and may also perform or seek to perform broking, investment banking/corporate advisory and other banking services for these companies. They may also have received compensation and/or seek to obtain compensation for broking, investment banking/corporate advisory and other services from the subject companies. Any valuations, opinions, estimates, forecasts, ratings or risk assessments herein constitutes a judgment as of the date of this report, and there can be no assurance that future results or events will be consistent with any such valuations, opinions, estimates, forecasts, ratings or risk assessments. The information in this document is subject to change without notice, its accuracy is not guaranteed, it may be incomplete or condensed and it may not contain all material information concerning the company (or companies) referred to in this report. The valuations, opinions, estimates, forecasts, ratings or risk assessments described in this report were based upon a number of estimates and assumptions and are inherently subject to significant uncertainties and contingencies. It can be expected that one or more of the estimates on which the valuations, opinions, estimates, forecasts, ratings or risk assessments were based will not materialize or will vary significantly from actual results. Therefore, the inclusion of the valuations, opinions, estimates, forecasts, ratings or risk assessments described herein IS NOT TO BE RELIED UPON as a representation and/or warranty by the Alliance Bank Group (and/or any persons associated with the aforesaid entities), that:
(a) such valuations, opinions, estimates, forecasts, ratings or risk assessments or their underlying assumptions will be achieved, and
(b) there is any assurance that future results or events will be consistent with any such valuations, opinions, estimates, forecasts, ratings or risk assessments stated therein.
Any assumptions made in this report that refers to commodities, are for the purposes of making forecasts for the company (or companies) mentioned herein.They are not to be construed as recommendations to trade in the physical commodity or in the futures contract relating to the commodity referred to in this report.
DBS Vickers Securities (USA) Inc ("DBSVUSA")"), a U.S.-registered broker-dealer, does not have its own investment banking or research department, nor has it participated in any investment banking transaction as a manager or co-manager in the past twelve months.
ANALYST CERTIFICATIONANALYST CERTIFICATIONANALYST CERTIFICATIONANALYST CERTIFICATION
The research analyst primarily responsible for the content of this research report, in part or in whole, certifies that the views about the companies and their securities expressed in this report accurately reflect his/her personal views. The analyst also certifies that no part of his/her compensation was, is, or will be, directly, or indirectly, related to specific recommendations or views expressed in this report. As of 31 July 2014, the analyst and his/her spouse and/or relatives who are financially dependent on the analyst, do not hold interests in the securities recommended in this report (“interest” includes direct or indirect ownership of securities).
COMPANYCOMPANYCOMPANYCOMPANY----SPECIFIC / REGULATORY DISCLOSURES SPECIFIC / REGULATORY DISCLOSURES SPECIFIC / REGULATORY DISCLOSURES SPECIFIC / REGULATORY DISCLOSURES
1.1.1.1. DBS Vickers Securities (Singapore) Pte Ltd (“DBSVS”), their subsidiaries and/or other affiliates do not have a proprietary position in the securities recommended in this report as of 27 Feb 2015.
2.2.2.2. DBS Bank Ltd., DBSVS, DBSVUSA, their subsidiaries and/or other affiliates may beneficially own a total of 1% of any class of common equity securities of the company mentioned as of 3 Mar 2015.
Market Focus
Results Roundup
Page 20
3.3.3.3.
Compensation for investment banking services:Compensation for investment banking services:Compensation for investment banking services:Compensation for investment banking services:
DBS Bank Ltd., DBSVS, DBSVUSA, their subsidiaries and/or other affiliates may have received compensation, within the past 12 months, and within the next 3 months may receive or intends to seek compensation for investment banking services from the company mentioned.
DBSVUSA does not have its own investment banking or research department, nor has it participated in any investment banking transaction as a manager or co-manager in the past twelve months. Any US persons wishing to obtain further information, including any clarification on disclosures in this disclaimer, or to effect a transaction in any security discussed in this document should contact DBSVUSA exclusively.
RESTRICTIONS ON DISTRIBUTIONRESTRICTIONS ON DISTRIBUTIONRESTRICTIONS ON DISTRIBUTIONRESTRICTIONS ON DISTRIBUTION
GeneralGeneralGeneralGeneral This report is not directed to, or intended for distribution to or use by, any person or entity who is a citizen or resident of or located in any locality, state, country or other jurisdiction where such distribution, publication, availability or use would be contrary to law or regulation.
AustraliaAustraliaAustraliaAustralia This report is not for distribution into Australia.
Hong KongHong KongHong KongHong Kong This report is being distributed in Hong Kong by DBS Vickers (Hong Kong) Limited which is licensed and regulated by the Hong Kong Securities and Futures Commission.
IndonesiaIndonesiaIndonesiaIndonesia This report is being distributed in Indonesia by PT DBS Vickers Securities Indonesia.
MalaysiaMalaysiaMalaysiaMalaysia This report is distributed in Malaysia by AllianceDBS Research Sdn Bhd ("ADBSR") (formerly known as HwangDBS Vickers Research Sdn Bhd). Recipients of this report, received from ADBSR are to contact the undersigned at 603-2604 3333in respect of any matters arising from or in connection with this report. In addition to the General Disclosure/Disclaimerfound at the preceding page, recipients of this report are advised that ADBSR (the preparer of this report), its holding company Alliance Investment Bank Berhad, their respective connected and associated corporations, affiliates, their directors, officers, employees, agents and parties related or associated with any of them may have positions in, and may effect transactions in the securities mentioned herein and may also perform or seek to perform broking, investmentbanking/corporate advisory and other services for the subject companies. They may also have received compensation and/or seek to obtain compensation for broking, investment banking/corporate advisory and other services from the subject companies.
Wong Ming Tek, Executive Director, ADBSR
SingaporeSingaporeSingaporeSingapore This report is distributed in Singapore by DBS Bank Ltd (Company Regn. No. 196800306E) or DBSVS (Company Regn No. 198600294G), both of which are Exempt Financial Advisers as defined in the Financial Advisers Act and regulated by the Monetary Authority of Singapore. DBS Bank Ltd and/or DBSVS, may distribute reports produced by its respective foreign entities, affiliates or other foreign research houses pursuant to an arrangement under Regulation 32C of the Financial Advisers Regulations. Where the report is distributed in Singapore to a person who is not an Accredited Investor, Expert Investor or an Institutional Investor, DBS Bank Ltd accepts legal responsibility for the contents of the report to such persons only to the extent required by law.Singapore recipients should contact DBS Bank Ltd at 6327 2288 for matters arising from, or in connection with the report.
ThailandThailandThailandThailand This report is being distributed in Thailand by DBS Vickers Securities (Thailand) Co Ltd. Research reports distributed are only intended for institutional clients only and no other person may act upon it.
United United United United KingdomKingdomKingdomKingdom
This report is being distributed in the UK by DBS Vickers Securities (UK) Ltd, who is an authorised person in the meaning of the Financial Services and Markets Act and is regulated by The Financial Conduct Authority. Research distributed in the UK is intended only for institutional clients.
DubaiDubaiDubaiDubai
This research report is being distributed in The Dubai International Financial Centre (“DIFC”) by DBS Bank Ltd., (DIFC Branch) having its office at PO Box 506538, 3rd Floor, Building 3, East Wing, Gate Precinct, Dubai International Financial Centre (DIFC), Dubai, United Arab Emirates. DBS Bank Ltd., (DIFC Branch) is regulated by The Dubai Financial Services Authority. This research report is intended only for professional clients (as defined in the DFSA rulebook) and no other person may act upon it.
United StatesUnited StatesUnited StatesUnited States Neither this report nor any copy hereof may be taken or distributed into the United States or to any U.S. person except in compliance with any applicable U.S. laws and regulations. It is being distributed in the United States by DBSVUSA, which accepts responsibility for its contents. Any U.S. person receiving this report who wishes to effect transactions in any securities referred to herein should contact DBSVUSA directly and not its affiliate.
Other Other Other Other jurisdicjurisdicjurisdicjurisdictionstionstionstions
In any other jurisdictions, except if otherwise restricted by laws or regulations, this report is intended only for qualified, professional, institutional or sophisticated investors as defined in the laws and regulations of such jurisdictions.
AlliAlliAlliAllianceDBS Research Sdn BhdanceDBS Research Sdn BhdanceDBS Research Sdn BhdanceDBS Research Sdn Bhd (128540 U)
(formerly known as HwangDBS Vickers Research Sdn Bhd)
19th Floor, Menara Multi-Purpose, Capital Square,
8 Jalan Munshi Abdullah 50100
Kuala Lumpur, Malaysia.
Tel.: +603 2604 3333 Fax:+603 2604 3921 email : [email protected]