Embed Size (px)
Citation preview

Market Forces and Sex DiscriminationAuthor(s): Judith K. Hellerstein, David Neumark, Kenneth R. TroskeSource: The Journal of Human Resources, Vol. 37, No. 2 (Spring, 2002), pp. 353-380Published by: University of Wisconsin PressStable URL: http://www.jstor.org/stable/3069651Accessed: 06/09/2010 16:58
Your use of the JSTOR archive indicates your acceptance of JSTOR's Terms and Conditions of Use, available athttp://www.jstor.org/page/info/about/policies/terms.jsp. JSTOR's Terms and Conditions of Use provides, in part, that unlessyou have obtained prior permission, you may not download an entire issue of a journal or multiple copies of articles, and youmay use content in the JSTOR archive only for your personal, non-commercial use.
Please contact the publisher regarding any further use of this work. Publisher contact information may be obtained athttp://www.jstor.org/action/showPublisher?publisherCode=uwisc.
Each copy of any part of a JSTOR transmission must contain the same copyright notice that appears on the screen or printedpage of such transmission.
JSTOR is a not-for-profit service that helps scholars, researchers, and students discover, use, and build upon a wide range ofcontent in a trusted digital archive. We use information technology and tools to increase productivity and facilitate new formsof scholarship. For more information about JSTOR, please contact [email protected].
University of Wisconsin Press is collaborating with JSTOR to digitize, preserve and extend access to TheJournal of Human Resources.
http://www.jstor.org
Market Forces and Sex Discrimination
Judith K. Hellerstein David Neumark Kenneth R. Troske
ABSTRACT
We report new evidence on the existence of sex discrimination in wages and whether competitive market forces reduce or eliminate discrimination, based on plant- and firm-level data on profitability, growth and ownership changes, product market power, and workforce sex composition. Our strongest finding is that among plants with high levels of product market power, those employing more women are more profitable, consistent with sex discrimination in the short run when plants have product market power. We do not find that these discriminatory employers are punished over time through lower growth, or are bought out by nondiscriminators.
I. Introduction
The residual wage gap between men and women has been docu- mented in an extensive body of research. Some view the residual wage gap as evi-
Judith K. Hellerstein is an associate professor of economics at the University of Maryland, and a re- search associate of the National Bureau of Economic Research (NBER). David Neumark is a professor of economics at Michigan State University, a visiting fellow at the Public Policy Institute of California, and a research associate of the NBER. Kenneth R. Troske is an associate professor of economics at the University of Missouri, and a researcher at the U.S. Census Bureau's Center for Economic Studies. The authors are grateful to Kim Bayard, Nicole Nestoriak, and Gigi Foster for outstanding research as- sistance, and to Bob Frank, anonymous referees, and seminar participants at Carnegie-Mellon, Cor- nell, Johns Hopkins, the University of Maryland, Michigan State, the University of Missouri, Wharton, and the NBER Summer Institute for helpful comments. This research was supported by NSF grant SBR95-10876 through the NBER. All opinions, findings, and conclusions expressed herein are those of the authors and do not in any way reflect the views of the U.S. Census Bureau. The data used in this article were collected under the provisions of Title 13 U.S. Code and are only available at the Center for Economic Studies, U.S. Census Bureau. To obtain access to these data, contact the Center for Eco- nomic Studies, U.S. Census Bureau, Rm. 211/WPII, Washington, D.C. 20233. [Submitted February 2000; accepted December 2000] ISSN 022-166X ? 2002 by the Board of Regents of the University of Wisconsin
THE JOURNAL OF HUMAN RESOURCES * XXXVII * 2
354 The Journal of Human Resources
dence of sex discrimination in wages, arguing that if a gap remains after controlling for variables measuring workers' productivity, it must reflect discrimination. This interpretation of the evidence comes directly from Becker's (1971) classic model of employer discrimination, in which discrimination is reflected in a gap between wages and marginal products. Others, citing the same model, focus on Becker's conclusion that under sufficiently competitive conditions discriminatory employers will fail to thrive, and eventually will be competed out of existence; because the sex-wage dif- ferential has persisted, it must reflect unobserved productivity differences rather than discrimination (Fuchs 1988; O'Neill 1994). In this paper, we report new evidence on both of these issues: whether sex discrimination exists, and whether competitive market forces act to reduce or eliminate discrimination. Specifically, we use plant- and firm-level data to examine short-run profitability and longer-run growth and ownership changes, in relation to the sex composition of a plant's or firm's work- force, and we explore how these relationships vary with the strength of product market competition.
In our view, this evidence is far more informative than what we can learn from analyzing wage regressions. Given that the individual-level data sets used to estimate unexplained or residual wage gaps between men and women contain only proxies for workers' productivity, it is difficult to refute the argument that the residual wage gap reflects unobserved productivity differences. Furthermore, because we do not know how quickly nondiscriminatory sources of the residual sex-wage gap might be changing, evidence on changes in the sex-wage gap over time may not be particularly informative regarding the role of competition in eliminating or reducing discrimina- tion.
We begin with a simple test for sex discrimination. If there is no discrimination against women, then there should be no cross-sectional relationship between profit- ability and the sex composition of the workforce. Any sex difference in wages must reflect only observed or unobserved productivity differentials between men and women, and firms or plants that employ more women should earn no higher profits. Evidence that plants or firms that employ relatively more women earn higher profits, in contrast, would be consistent with sex discrimination. We determine which of these hypotheses holds empirically by estimating the cross-sectional relationship be- tween plant or firm profitability and the sex composition of the workforce.
Next, we explore the more direct static implication of Becker's model that discrim- ination is likely to exist only where there is product market power, and conversely that product market competition hinders discrimination. We test whether-as the Becker model predicts-there is a positive short-run relationship between profitabil- ity and the sex composition of the workforce only among plants with product market power, because only among such plants are there positive economic profits that may be exploited to indulge the discriminatory tastes of some employers.
This evidence is arguably more decisive than that obtained from wage regressions with individual-level controls, because firm or plant profitability, unlike wages, is a direct measure of performance, obviating the need to find proxies for workers' productivity. In addition, the results incorporating market power are informative about the role of competitive market forces, which Becker's model highlights.
However, higher profits at a point in time in plants or firms employing more women (possibly only where there is product market power) does not contradict the
Hellerstein, Neumark and Troske 355
dynamic implication of Becker's model that market forces may eliminate discrimina- tion over the longer run. Market forces may undermine discrimination in different ways, depending on the nature of product market competition, barriers to entry, trans- ferability of assets, and the form of employers' discriminatory tastes. We use longitu- dinal data on the plants in our data set to test the dynamic implications of Becker's model, asking whether nondiscriminatory plants-those that, according to the cross- sectional evidence, employ more women and earn higher profits-grow faster or are less likely to undergo a change of ownership, compared with discriminatory plants. The combined static and dynamic evidence provides us with a better under- standing of sex discrimination in labor markets and the role of competitive market forces in reducing or eliminating this discrimination than can be obtained from con- ventional wage equation approaches to discrimination, or even from more convincing cross-sectional tests for discrimination (such as audit studies), which cannot say any- thing about the dynamic implications of Becker's model.'
This evidence is complementary to and builds upon our research testing whether wage differences between men and women are larger than productivity differences (Hellerstein, Neumark, and Troske 1999). In that research, we specify a plant-level production function, with explicit assumptions about its functional form, including the role of male and female labor inputs in production. Conditional on those assump- tions, we estimate the relative marginal products of men and women, and compare them with relative wages.2 This paper differs from our previous one in two funda- mental ways. First, the results do not hinge on the specification of a structural produc- tion function. More importantly, we present new evidence on competitive market forces and discrimination, allowing richer tests of Becker's model of discrimination.
II. The Becker Model
Our empirical work is framed by the Becker (1971) model of em- ployer discrimination. Consider a wage-taking firm with a production function Y that uses two inputs: the labor of men, M, and the labor of women, F. Employers have a distaste for hiring female workers, and do not maximize profits but rather maximize utility defined as
(1) U(T, M, F) = P Y(M, F) - WMM- WFF-d (F/M),
where d is the discrimination coefficient capturing this distaste, P is output price, and WM and WF are the market wages of men and women respectively. Short-run utility maximization then implies
1. There is virtually no existing work attempting to draw conclusions regarding discrimination from data on profitability. One exception is Hersch (1991), who studies the effects of charges of EEO violations on the equity value of firms, finding that these charges reduce firm value. This evidence is indirect at best, as EEO charges may bring about not only a reduction in discrimination, but also high legal and settlement costs. 2. Hellerstein and Neumark (1999) also implement the production function approach using data on Israeli manufacturing plants. In those data, in contrast to the U.S. data, the pay and productivity gaps are of similar magnitude, consistent with no discrimination. There is no obvious explanation for the differences across the two countries, although the institutional, legal, and cultural environments are arguably quite different.
356 The Journal of Human Resources
(2) MRPM + d (F/M2) = WM, MRPF - dIM = WF.
The marginal revenue product of male labor is set below its input price, because male labor increases the employer's utility, the marginal revenue product of female labor is discounted by the nonpecuniary cost of discrimination to the employer and hence is above the input price of female labor. The discrimination coefficient d will lead the firm in the short run to hire fewer women and more men than profit maximi- zation would dictate.3 In other words, Becker models discrimination as a price differ- ential needed to induce employers to hire women, which in turn leads to employment differences between men and women that would not exist absent the discrimination.
The discrimination coefficient d is assumed to vary across firms. Firms with weaker discriminatory tastes (smaller d) will tend to hire relatively more women and relatively fewer men, and vice versa. Thus, tastes provide the exogenous source of variation in the proportion female across otherwise identical plants or firms that is the basis of our empirical tests. Since males are paid more than their marginal revenue product, and women less, plants or firms that hire relatively more men and relatively fewer women are less profitable, ceteris paribus, motivating our basic test for discrimination.
Becker then goes on to show that with this type of employer utility function, under some conditions market forces will cause discrimination to disappear in the long run. If product markets are perfectly competitive, then discrimination will disappear over time through competition in product markets provided there are sufficient poten- tial employers with nondiscriminatory tastes. If product markets are not perfectly competitive but some entry is possible, then discrimination will be competed away if there are nondecreasing returns to scale and at least one potential employer has nondiscriminatory tastes. In the case of total barriers to entry in product markets, even with decreasing returns to scale, if businesses are transferable and there is a potential nondiscriminating employer, discrimination may disappear through compe- tition in the market for firms. Although Becker's model was not inherently dynamic, the implication of discriminatory tastes in each of these cases is that discriminating employers not only give up current profits to indulge their tastes for discrimination but also sacrifice future profits, because they will earn lower profits in the future because of reduced market share. Finally, Becker (1971) notes that if employers' tastes are nepotistic rather than discriminatory, discrimination will not be eliminated by competition in the market for firms, although product market competition still may suffice. In our view the conditions for competition to eliminate discrimination have been glossed over by those who interpret the Becker model as implying that discrimination cannot persist, which is another motivation for testing these implica- tions empirically.
In addition to the employer discrimination model, Becker (1971) also develops models of employee discrimination and customer discrimination. It is of interest to ask whether evidence consistent with the employer discrimination model-that plants employing more women are more profitable-is equally consistent with either
3. This formulation comes from Arrow (1973). In Becker's original model d simply multiplies F in the employer's utility function, which generates complete sex segregation across all but the marginal employer. The utility function based on the relative number of female workers generates an equilibrium less at odds with observed employment patterns.
Hellerstein, Neumark and Troske 357
of these other two models, or instead points explicitly to employer discrimination. In a fundamental sense, these alternative models do not predict a relationship between employment of women (or whatever group bears the brunt of discrimination) and profitability; because employers do not have discriminatory tastes, it is not they who are willing to pay a pecuniary cost to avoid contact with women. For example, in the simplest employee discrimination model firms are completely segregated, with no effect on profits. Discrimination also has no effect on profits in a richer model of employee discrimination with supervisory inputs in which complete desegregation does not occur (Arrow 1972). In Becker's model of customer discrimination, the effects on prices of customers' tastes regarding transactions with particular groups should be fully reflected in wages of workers involved in these transactions so that profitability should be unaffected by such discrimination. We do not claim that one cannot construct a model with discriminatory tastes on the part of employees or customers that affect both the proportion female and profitability. However, we inter- pret the evidence we ultimately find of a positive relationship between profitability and the proportion female (among plants with product market power) as consistent primarily with employer discrimination.
III. Data
Our data come from the Worker-Establishment Characteristics Data- base (WECD) and the Longitudinal Research Datafile (LRD).4 The WECD is based on the 1990 Sample Edited Detail File (SEDF), which includes all household re- sponses to the 1990 Decennial Census long form, and the 1990 Standard Statistical Establishment List (SSEL), a complete list of all establishments in the U.S. In the first step, manufacturing workers in the SEDF are matched to establishments in the SSEL using the detailed location and industry information available in both data sets. To help ensure that we have a representative sample of workers in a plant, we only keep plants with at least three workers matched to the plant; the average number of workers matched to a plant is around 30. To form the WECD, these records are then linked to the LRD, a longitudinal panel of establishments drawn from each Census of Manufactures (CM) conducted since 1963 (1963, 1967, 1972, 1977, 1982, 1987) as well as the 1973-93 Annual Survey of Manufactures (ASM). Since much of the labor market information in the Decennial Census refers to 1989, we link the worker records to establishments in the LRD in 1989 for our main cross-sectional analysis.
The matched worker data are used to construct the proportion female, as well as the proportions of the workforce in each of a number of other categories (age, educa- tion, race, marital status, and occupation). The plant-level data are used to construct
4. This section provides a brief discussion of the data; for more details see Hellerstein, Neumark, and Troske (1999). 5. Each CM is a complete census of manufacturing establishments, and the ASM is a probability sample of establishments, surveyed over a five-year period including CM years. A new ASM sample is drawn two years after a CM, with the probability of an establishment being included in the ASM increasing with its total employment in the previous CM. Establishments with more than 250 employees in the previous CM are in the ASM with certainty.
358 The Journal of Human Resources
a number of controls for plant-level characteristics that may be related to profitability and growth, such as plant age and industry.
Finally, we define two measures of performance that we use as proxies for profit- ability. The first is operating income (sales + inventory accumulation - labor costs - material costs) divided by inventory-adjusted sales (that is, current year sales plus the change in inventories). The second also subtracts out from the numerator pur- chased business services or overhead costs (such as purchased electricity, legal ser- vices, advertising, and repairs). These firm performance measures used as proxies for profitability are essentially price cost-margins (see, for example, Domowitz, Hub- bard, and Peterson 1986).6 The one obvious omission from this performance measure is that the numerator does not subtract off the costs of capital flow expenditures. In CM years, the Census Bureau collects detailed data on the book value of capital of each plant but there is no straightforward method to transform this book value mea- sure into a capital flow measure, or to recover the rental rate of capital (see Caballero, Haltiwanger, and Engel 1995). Instead, we control for the ratio of book value of capital to shipments on the right-hand side of the regressions when appropriate, pro- viding some accounting for the variation across plants in capital expenditures. Using 1987 data to construct the capital/shipments variable should mitigate endogeneity bias.
Since the Becker model of employer discrimination is based on the actions of owners, focusing solely on plants could be somewhat misleading if decision making is done at the firm level. The Census Bureau focuses on plants in its data collection, but in CM years we can link together all plants that belong to the same parent firm and obtain information on employment and costs at the nonproduction facilities of these firms. We therefore also construct a firm-level data set paralleling our 1989 plant-level data set by matching workers in the WECD to plants in the 1987 CM and combining data on all establishments belonging to the same firm. Because infor- mation on the demographic characteristics of the workforces of these firms comes from the Census of Population, we are forced to assume that the demographic compo- sition of each firm's workforce was the same in 1987. We also use these firm-level data to estimate cross-sectional profitability regressions.
Because of difficulties in defining and tracking firms over time, in our dynamic analysis we study only plants. Moreover, we cannot follow changes in workforce characteristics over time with the WECD. We can, though, study growth in plants (in terms of both employment and shipments) by matching plants in the WECD to the 1990 and 1995 ASMs. We also look at the issue of plant ownership changes by identifying plants in the 1990 ASM that have a different owner in 1995. Because the Census Bureau drew a new ASM sample for 1994, some plants are not in the 1995 ASM simply because they were not included in the new sample; these plants are omitted from this analysis. Finally, we note that the period 1990-95 may represent a
6. Beginning in 1987, the book value of capital is only collected in the CM, so we use 1987 capital data. In addition, overhead costs are only collected in the ASM sample in CM years, so the overhead costs we use are from the 1987 ASM. Because not all plants in the 1989 ASM appear in the 1987 ASM, we lose some observations as a result of this linkage. We experimented with the full sample of observations from 1989, using the profitability measure that does not include overhead costs; the results were very similar to those obtained for the restricted sample for which we have data in 1987.
Hellerstein, Neumark and Troske 359
window that is short relative to the long run that is the focus of Becker's model, but 1995 is the most recent year of data available.
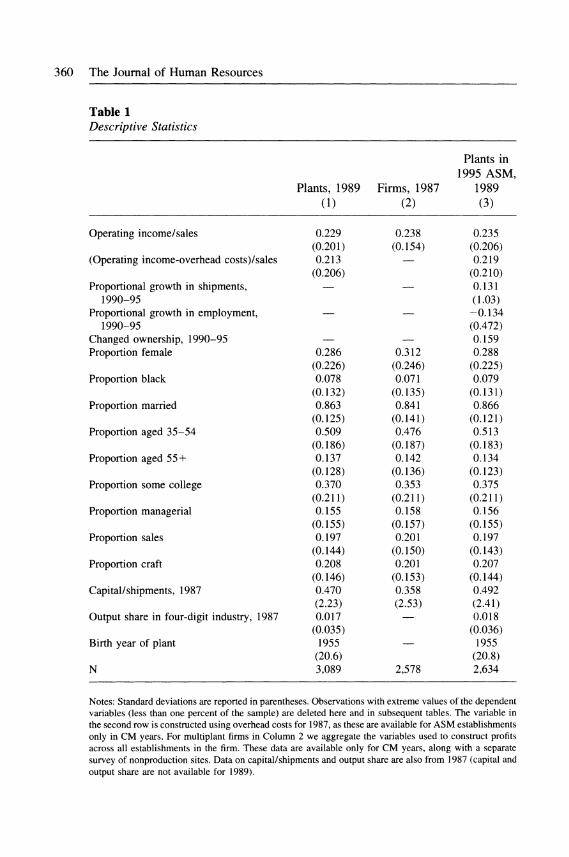
Table 1 presents descriptive statistics. Column 1 covers the full sample of 3,089 plants in the 1989 ASM that appear in the WECD. Column 2 covers the sample of 2,578 firms constructed by linking plants together with units from the same firm, using the 1987 CM. Column 3 again reports statistics on data from plants in 1989, but only for the subsample of 2,634 plants for which we also have data in the 1995 ASM.7 The similarities between Columns 1 and 3 suggest that our analysis of plant growth and ownership change between 1990 and 1995 does not suffer from sample selection bias attributable to changes in the ASM sample. Finally, we note that the proportion female varies widely across plants and that the data do not reflect com- plete or nearly complete segregation. In particular, in 49 percent of the plants 0-25 percent of the workers are female (in 14 percent 0-5 percent are female), in 32 percent of the plants 25-50 percent are female, in 15 percent of the plants 50- 75 percent are female, and in 5 percent of the plants 75-100 percent are female.
IV. Empirical Approach and Results
We first examine the relationship between profitability and the pro- portion female. We include as controls other demographic characteristics of the workforce and plant or firm characteristics that are likely to be associated with profitability, such as age, industry, and measures of market power. The controls for plant age are particularly important, as women are on average newer entrants and hence may work in newer plants, which are more profitable. As discussed previously, we also control for the ratio of capital to shipments because the profit rate measures do not account for capital expenditures. In the idealized case, in which the data reflect perfect competition in the long run, our measures of profitability would be unrelated to all of these variables except the capital/shipments variable as long as these measures capture economic profits rather than accounting profits or if diver- gences between accounting and economic profits are unrelated to these variables. On the other hand, if some employers are discriminating against women, those that employ more women should eam higher profits.
In fact, the more direct implication of the Becker model is that the relationship between profitability and the proportion female should be particularly strong among plants or firms that have product market power. For such plants or firms, competitive market forces may play less of a role in punishing discriminating employers, at least in the short run. Thus, after presenting the simple regressions of profitability on the proportion female, we proceed to what we regard as the most convincing cross- sectional test of the Becker model, asking whether market power strengthens the positive relationship between profitability and the proportion female.
Following this analysis, we turn to the question of the longer-run prospects of plants that appear to discriminate by hiring fewer women compared with those that
7. Plants in the 1989 WECD are those that were in both the 1989 and 1987 ASMs, as we use overhead costs from the 1987 ASM. Therefore WECD plants in 1989 are disproportionately selected into ASMs as certainty selections, so many of them appear again in the 1995 ASM.
360 The Journal of Human Resources
Table 1 Descriptive Statistics
Plants in 1995 ASM,
Plants, 1989 Firms, 1987 1989 (1) (2) (3)
Operating income/sales 0.229 0.238 0.235 (0.201) (0.154) (0.206)
(Operating income-overhead costs)/sales 0.213 0.219 (0.206) (0.210)
Proportional growth in shipments, 0.131 1990-95 (1.03)
Proportional growth in employment, -0.134 1990-95 (0.472)
Changed ownership, 1990-95 0.159 Proportion female 0.286 0.312 0.288
(0.226) (0.246) (0.225) Proportion black 0.078 0.071 0.079
(0.132) (0.135) (0.131) Proportion married 0.863 0.841 0.866
(0.125) (0.141) (0.121) Proportion aged 35-54 0.509 0.476 0.513
(0.186) (0.187) (0.183) Proportion aged 55+ 0.137 0.142 0.134
(0.128) (0.136) (0.123) Proportion some college 0.370 0.353 0.375
(0.211) (0.211) (0.211) Proportion managerial 0.155 0.158 0.156
(0.155) (0.157) (0.155) Proportion sales 0.197 0.201 0.197
(0.144) (0.150) (0.143) Proportion craft 0.208 0.201 0.207
(0.146) (0.153) (0.144) Capital/shipments, 1987 0.470 0.358 0.492
(2.23) (2.53) (2.41) Output share in four-digit industry, 1987 0.017 0.018
(0.035) (0.036) Birth year of plant 1955 1955
(20.6) (20.8) N 3,089 2,578 2,634
Notes: Standard deviations are reported in parentheses. Observations with extreme values of the dependent variables (less than one percent of the sample) are deleted here and in subsequent tables. The variable in the second row is constructed using overhead costs for 1987, as these are available for ASM establishments only in CM years. For multiplant firms in Column 2 we aggregate the variables used to construct profits across all establishments in the firm. These data are available only for CM years, along with a separate survey of nonproduction sites. Data on capital/shipments and output share are also from 1987 (capital and output share are not available for 1989).
Hellerstein, Neumark and Troske 361
do not. For the subsample of plants that do not change ownership between 1990 and 1995, we estimate models of growth in output or employment as functions of the same plant and workforce characteristics used in the profitability regressions. Plants that fail during this period are included in the sample, assigned shipments and em- ployment growth (measured as the proportional change) of -1, and no ownership change. We do not include plants that changed ownership in the growth regressions because the mechanism by which discrimination is potentially competed away for these plants is through the market for plants, not the product market. We also take all the plants for which we have data in 1990 and 1995 and estimate ownership- change models using the same covariates.
Our empirical tests have some potential limitations that bear consideration. First, although our tests (and data) are well-suited to testing for employer discrimination and testing other implications of Becker's model, they are not well-suited to unravel- ing the mechanism by which discrimination arises because they do not permit any sort of detailed look at firm hiring practices or the availability of applicants for different positions. Second, there may be unobservable determinants of productivity (such as physical strength) that are correlated with sex. As we noted in the Introduc- tion, however, if wages adjust to reflect unobservable productivity differences, there should be no relationship between profitability and the proportion female. On the other hand, if there are constraints on paying men and women different wages despite these productivity differences (because of equal pay laws), then firms using more women will be less, rather than more profitable. There is bias in the direction of a positive relationship between profitability and the employment of women only if the unobservables are positively correlated with female labor. This is the opposite of what is often claimed by researchers studying the sex wage gap who assume that productive attributes of workers are negatively correlated with female labor. Third, as usual there are other potential explanations of our findings. For example, plants or firms that are doing badly may have contracted recently, and if they have discrimi- natory tastes against women may have fired women first, generating a positive associ- ation between the proportion female and profitability. This scenario still entails discrimination, but not necessarily differences in discriminatory tastes across em- ployers. As an empirical matter, we cannot rule out this scenario. However, we regard it as a less plausible interpretation of our evidence for two reasons. First, it implies that the firms that are doing the worst engage in the behavior that is most damaging to profits-discriminating against women-which seems an unlikely response. Sec- ond, it assumes that the labor supply curve of men to the plant is upward sloping, which is why the plant cannot continually hire more men as it grows.
A. Profitability and the Proportion Female
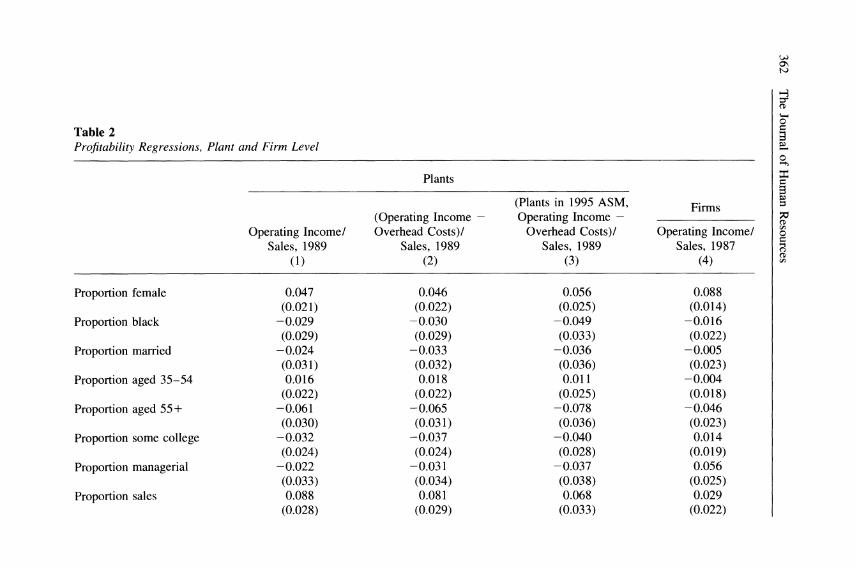
Table 2 reports OLS estimates of the cross-sectional relationship between profitabil- ity and the proportion female. Columns 1 and 2 report regressions using the full sample, and Column 3 using the subsample of plants in 1989 for which we also have data in 1995. The specifications include four-digit industry dummy variables, to control as well as possible for unobserved heterogeneity across plants. This is potentially important because plant-level characteristics may be associated with the proportion female. In addition, we use output share as a measure of market power,
362 T
he Journal of Hum
an Resources
Table
2 P
rofitability
Regressions,
Plant
and
Firm
Level
Plants
(Plants
in
1995
ASM
,
Firm
s
(Operating
Income-
Operating
Income-
Operating
Income/
Overhead
Costs)/
Overhead
Costs)/
Operating
Income/
Sales,
1989
Sales,
1989
Sales,
1989
Sales,
1987
(1)
(2)
(3)
(4)
Proportion
female
0.047
0.046
0.056
0.088
(0.021)
(0.022)
(0.025)
(0.014)
Proportion
black
-0.029
-0.030
-0.049
-0.016
(0.029)
(0.029)
(0.033)
(0.022)
Proportion
married
-0.024
-0.033
-0.036
-0.005
(0.031)
(0.032)
(0.036)
(0.023)
Proportion
aged
35-54
0.016
0.018
0.011
-0.004
(0.022)
(0.022)
(0.025)
(0.018)
Proportion
aged
55+
-0.061
-0.065
-0.078
-0.046
(0.030)
(0.031)
(0.036)
(0.023)
Proportion
some
college
-0.032
-0.037
-0.040
0.014
(0.024)
(0.024)
(0.028)
(0.019)
Proportion
managerial
-0.022
-0.031
-0.037
0.056
(0.033)
(0.034)
(0.038)
(0.025)
Proportion
sales
0.088
0.081
0.068
0.029
(0.028)
(0.029)
(0.033)
(0.022)

Hellerstein, N
eumark and T
roske 363
Proportion
craft
0.022
0.014
-0.019
0.031
(0.029)
(0.030)
(0.034)
(0.022)
Multiplant
firm
-0.011
-0.009
-0.005
0.038
(0.014)
(0.014)
(0.019)
(0.007)
Capital/shipm
ents
-0.0025
-0.0026
-0.0024
-0.018
(0.0014)
(0.0015)
(0.0015)
(0.012)
Second
output
share
quartile
0.045
0.047
0.054
(0.010)
(0.011)
(0.012)
Third
output
share
quartile
0.096
0.103
0.112
(0.012)
(0.012)
(0.014)
Fourth
output
share
quartile
0.159
0.168
0.182
(0.013)
(0.014)
(0.015)
Plant
11-20
years
old
-0.024
-0.024
-0.022
(0.014)
(0.015)
(0.016)
Plant
21-30
years
old
-0.037
-0.039
-0.034
(0.013)
(0.014)
(0.015)
Plant
31-40
years
old
-0.053
-0.055
-0.052
(0.014)
(0.014)
(0.015)
Plant
41-50
years
old
-0.051
-0.053
-0.053
(0.019)
(0.019)
(0.021)
Plant
51 +
years
old
-0.051
-0.054
-0.049
(0.015)
(0.016)
(0.017)
R-squared
0.374
0.370
0.395
0.135
N
3,089
3,089
2,634
2,578
Notes:
Four-digit
industry
dumm
y
variables
(in
Colum
ns
1-3)
and
three
Census
region
dumm
y
variables
also
are
included.
364 The Journal of Human Resources
which is likely to be a more reliable measure within finely disaggregated industries, in which other factors influencing market power (such as transportation costs) are more homogeneous. The results indicate that, whether or not we subtract overhead costs from income, and irrespective of the sample, the proportion female in a plant's workforce is significantly positively related to profitability. For example, the point estimate in Column 2 indicates that a ten percentage point increase in the proportion female raises the profit rate by 0.46 percentage point.
To get some sense of the magnitudes of these estimates, consider the following simple example of an upper-bound estimate of how increasing the proportion female could change profitability. Suppose men and women are equally productive, so that the entire 30 percent market wage differential (in these data) arises solely because of discrimination. Suppose further that output is constant, that men and women are perfect substitutes in production, and that labor's share in total sales is 75 percent (also an upper bound, since this figure is closer to labor's share in total costs). As- sume a discriminating plant is forced to increase the proportion female in its work- force by ten percentage points while decreasing the proportion male by ten percent- age points (therefore holding the total labor input fixed). This would lead to an increase in the profit rate of 2.3 percentage points, about five times what we find.
Aside from the findings for the proportion female, the results in the first three columns of Table 2 provide little evidence of other workforce variables that are significantly related to profitability. Of the other demographic characteristics, only the proportion of workers aged 55 and over is consistently significantly related to profitability. This is unlikely to reflect plant life-cycle effects, because we have in- cluded detailed plant age dummy variables. Rather, we suspect it reflects shocks to plants' profitability; for example, a negative shock would reduce hiring and lead to an older workforce, more so if there are seniority rules regarding layoffs. The absence of any positive relationship between profitability and the proportion black in the workforce is consistent with no discrimination against blacks. Of the variables repre- senting the proportions of workers in different occupations, only the proportion of the workforce in sales is significantly related to profitability. However, in the firm- level specification this estimate becomes small and insignificant, suggesting that the estimates in Columns 1-3 may be attributable to higher measured profitability in the plants (within firms) in which sales workers are based. The absence of any systematic relationship between profitability and so many of the demographic characteristics suggests that there are not large problems with unobservable characteristics of work- ers biasing our results for the proportion female, since if there were we would expect many unobservables that were correlated with the proportion female also to be corre- lated with other worker characteristics.
Turning to the plant-level controls, the estimated coefficient of the capital/ship- ments ratio, although statistically insignificant, is negative. This is not the sign one would expect, but capital is measured as book value, which is a nondepreciated measure of past capital investments. This is one motivation for the inclusion of a set of dummy variables for the age of the plant; plant age is negatively and significantly correlated with profitability.
We also include in the first three columns of Table 2 a measure of the market power of a plant in its output market. The question of how best to measure market power is an old one, and, in the context of cross-industry studies such as this one,
Hellerstein, Neumark and Troske 365
comes down to whether one wants to use an industry-based measure of concentration, such as the four-firm concentration ratio or Herfindahl index, or a firm- or establish- ment-based measure, such as output share.8 An establishment-based measure of mar- ket power is preferable in this case. First, we want to be able to control for industry characteristics aside from market power at a detailed level by including disaggre- gated industry dummy variables. This precludes estimating effects of market power defined at the same level of disaggregation as the industry dummy variables. Second, from a theoretical perspective, we want to investigate profitability differences among plants competing in the same industry, because the Becker model points to the poten- tial role of competition from firms or plants in the same industry in eliminating or reducing discrimination. We therefore use the output market share of an establish- ment within its industry as a proxy for market power. This can be rationalized theo- retically. For example, in a Cournot model of competition, a firm's price-cost margin is proportional to the industry output share of that firm (Tirole 1989). To construct this measure we use the 1987 CM to calculate the share of shipments produced in 1987 by a plant, relative to total shipments in 1987 in the four-digit industry.9 A potential problem is that this market power measure may be endogenously deter- mined with profitability, but there are two reasons why the potential endogeneity of market power is mitigated. First, the output share variable is based on lagged data from 1987. Second, we do not use a continuous measure of output share directly in the regression. Instead we use industry-specific rankings of the output share of plants in our sample to form dummy variables for the quartile in which the plant is located. The use of these dummy variables also allows profitability to be nonlinearly related to output share.
In Columns 1-3 of Table 2, the estimated coefficients of the dummy variables for the quartile of the plant's industry-specific output share distribution are monotoni- cally increasing across the quartiles and highly significant. These results indicate that plants with higher output shares earn higher profit rates than plants with lower shares of output relative to other plants in their four-digit industries, suggesting that output share is a good proxy for product market power. As the included four-digit industry dummy variables should capture industry-based market power, the relation- ship between output share and profitability in these specifications points to variation in market power across plants within an industry. Finally, we note that when we experimented with using the four-firm concentration ratio as our measure of market power (and removed the industry dummy variables), its relationship to profitability was not monotonically positive, and the overall strength of the relationship was low.
The estimates in Column 2 use overhead costs in the profitability measure, with nearly identical results to those in Column 1, while those in Column 3 use the smaller subsample. The similarity of the latter results to those in Column 2 again suggests that we do not have a sample selection problem resulting from the selection of a new sample of plants in 1994 that is used for the dynamic analysis that follows. In the rest of our cross-section analyses using 1989 data, we therefore only report results
8. For a review of studies on the relationship between profitability and market power, see Salinger (1990). 9. When output share was included in these specifications, the estimated effects of plant size (defined in terms of employment) became small and insignificant, so size variables are excluded. Of course, size and output share are positively correlated.
366 The Journal of Human Resources
for the full sample of 3,089 plants, the sample represented in the first two columns of Table 2.
In Column 4, we present results for the sample of firms (rather than plants) that we constructed by aggregating together plants in the 1987 CM that belong to the same firm. Because firms produce in a variety of four-digit industries, we cannot define or construct a firm-level market power measure analogous to the output share categories we used in the plant-level regressions. We therefore report results using a specification that excludes market power measures. Nonetheless, the point esti- mates of the coefficients of variables for which we can construct firm-level data are quite similar to the plant-level results (and are also similar to plant-level results excluding the output share dummy variables, which we do not report). In particular, the coefficient on proportion female is 0.088 with a standard error of 0.014, implying a 0.88 percentage point increase in a firm's profit rate from a ten percentage point increase in the proportion of workers who are female in the firm. The similarity of the plant-level and firm-level results suggests that examining plant-level data is not biasing our results.
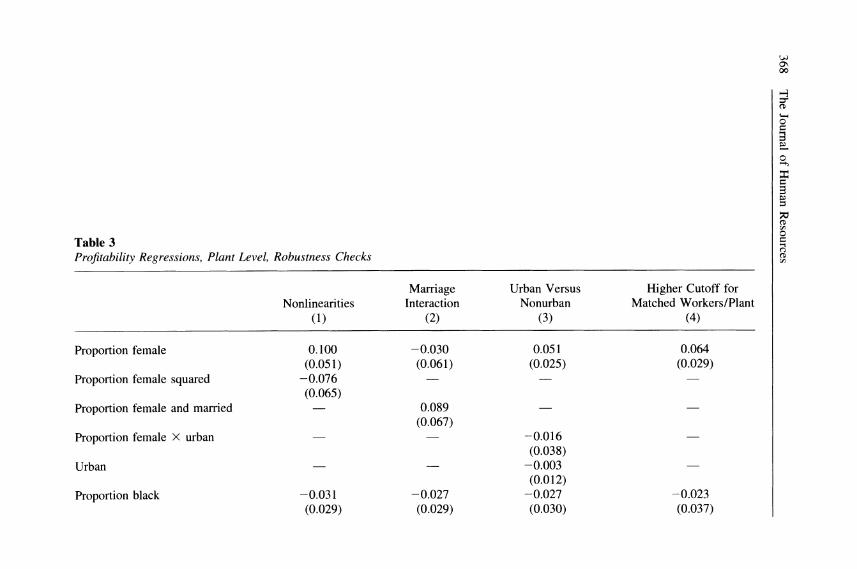
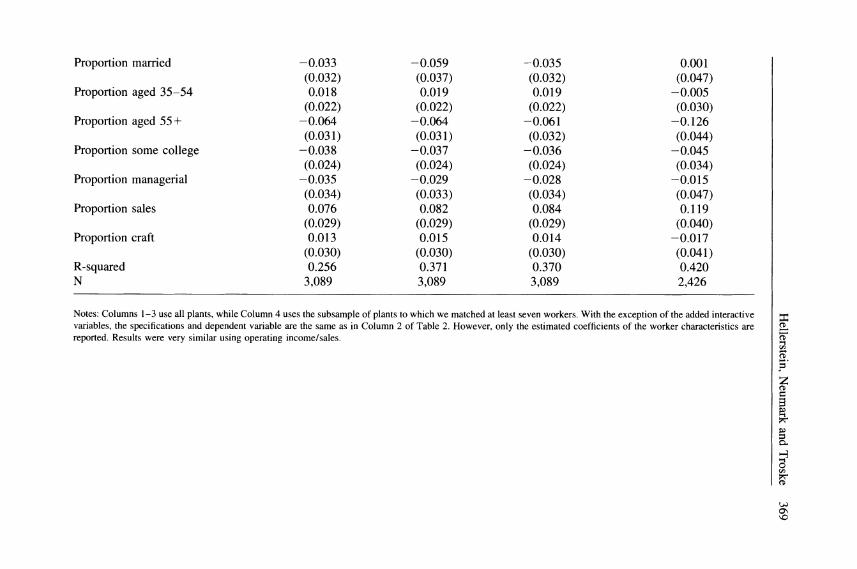
The results in Table 2 indicate that plants that employ a higher proportion of women are more profitable, consistent with sex discrimination in the labor market. But this evidence cannot identify the mechanism by which this discrimination occurs. In Table 3, we provide some limited evidence on this issue, and on the robustness of the results to differences in specification or sample. First, the linear specification constrains the effect of proportion female on profitability to be constant. Column 1 of Table 3 reports estimates where we add a quadratic term in the proportion female to the specification. The estimated coefficient on the linear term rises (to 0.100), remaining statistically significant at the 5 percent level. The estimated coefficient of the quadratic term is negative, although insignificant. The data are therefore con- sistent with a diminishing effect, although a linear model cannot be rejected."'
The evidence also can be further examined in light of research based on the human capital model suggesting that the sex-wage gap results in large part from specializa- tion within marriage, leading to lower human capital investment among married women so that the shortfall in women's wages emerges (and grows) within marriage (for example, Mincer and Polachek 1974). In Column 2 of Table 3, we augment the specification by adding a variable measuring the proportion of females that are mar- ried. This results in insignificant coefficient estimates for the proportion female vari- able as well as this new variable. However, the point estimates are consistent with little or no relationship between profitability and the proportion of unmarried fe- males, but higher profitability when the proportion of married females is high. If the estimates were statistically significant, this would be consistent with discrimination against married women, in contrast to the human capital hypothesis, which implies that both wages and productivity of married women are lower.'1
10. The coefficients imply that the relationship is positive up to a proportion female of 0.66. However, it is hard to identify the curvature accurately because there is not much data at the right-hand tail of the distribution of the proportion female. 11. We also attempted to include in our specifications the proportion of the workforce that is female in each of the occupation categories, to attempt to isolate the 'location" of the discrimination, and hence perhaps learn more about its nature (for example, a 'glass ceiling" restricting women's access to manage-
Hellerstein, Neumark and Troske 367
We conducted three additional robustness checks. First, we tested whether there are any differences in the relationship of the proportion female to profitability be- tween rural and urban plants, which may arise if employers in isolated locations have monopsony power over female employees. However, the urban-rural difference in the estimated effect of the proportion female, reported in Column 3, is very small (0.016) and insignificant. Second, as noted in Section III, we imposed a low cutoff (three) on the number of workers that had to be matched to a plant for the plant to be included. To reduce the potential measurement error from using a sample of matched workers, we reestimated the basic specification for the subsample with seven or more matched workers. As Column 4 shows, the estimated coefficient of the proportion female becomes more strongly positive. Finally, because the newest plants may have qualitatively different technology, which could be correlated with the proportion female and profitability, we divided up the younger plant age category more finely, breaking out plants aged zero-to-five years. Although not reported in the table, this had essentially no effect on the estimated coefficient of the proportion female. Thus, our basic test for sex discrimination provides a robust finding of a positive relationship between employment of women and profitability.
B. Market Forces and Discrimination, a Cross-Sectional Test
As discussed earlier, the Becker model predicts that product market power can inhibit the influence of competitive forces in eliminating discrimination (although competi- tion in the market for firms may still exert such influence over the long run). This implies that for plants with considerable product market power there will be a posi- tive relationship between employment of women and profitability, whereas for plants with little market power, the relationship will be non-existent or at least weaker. (Ashenfelter and Hannan 1986 and Cavalluzzo, Cavalluzzo, and Wolken 1999 study the relationship between market power and discrimination, but not profitability.)
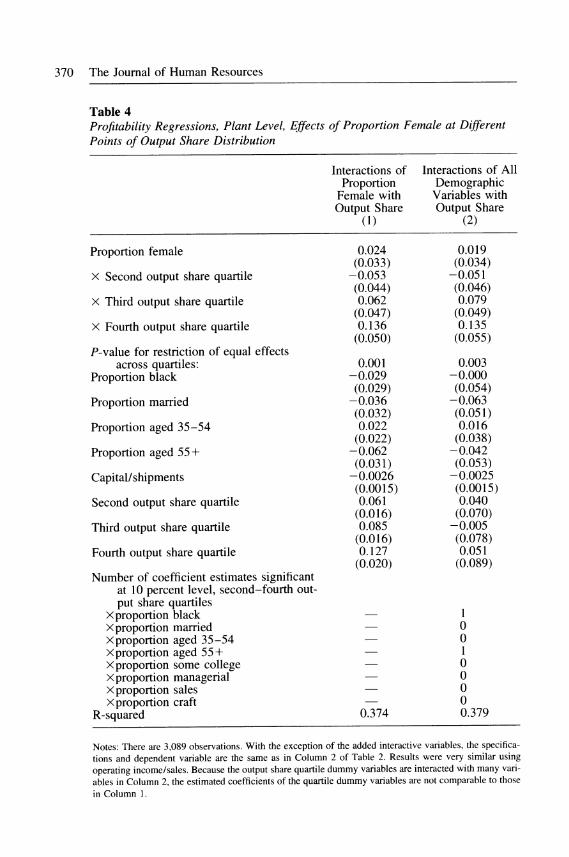
We first test this prediction in Column 1 of Table 4, where we report results from a plant-level profitability regression adding interactions between the output share dummy variables and the proportion female in the plant. Compared with Table 2 (Column 2), the linear coefficient on proportion female is smaller (0.024), and is statistically insignificant. The second quartile interaction is negative and also statisti- cally insignificant. More importantly, the third and fourth quartile interactions indi- cate a strengthening relationship between profitability and the proportion female at higher output shares, with the fourth quartile interaction large (0.136) and strongly significant. Adding together the linear and interactive variables, the implied effects of the proportion female in the first through fourth quartiles are 0.024, -0.029, 0.086, and 0.160, respectively. The p-value for the test of a constant effect of the proportion female in the lower three quartiles is approximately 0.05. On the other hand, the equality of the effect of proportion female across all four quartiles is strongly re- jected, with a p-value of 0.001. Especially coupled with the results in Column 2 (see discussion later in this article), for which the t-statistic for the proportion female X third quartile interaction is 1.6, we read our estimates as indicating no relationship
rial positions). However, this yielded imprecise estimates, in part because we construct these proportions only from the sample of workers that we match to a plant.
368 T
he Journal of Hum
an Resources
Table
3 P
rofitability
Regressions,
Plant
Level,
Robustness
Checks
Marriage
Urban
Versus
Higher
Cutoff
for
Nonlinearities
Interaction
Nonurban
Matched
Workers/P
lant
(1)
(2)
(3)
(4)
Proportion
female
0.100
-0.030
0.051
0.064
(0.051)
(0.061)
(0.025)
(0.029)
Proportion
female
squared
-0.076 (0.065)
Proportion
female
and
married
0.089 (0.067)
Proportion
female
X
urban
-0.016 (0.038)
Urban
- -0.003 (0.012)
Proportion
black
-0.031
-0.027
-0.027
-0.023
(0.029)
(0.029)
(0.030)
(0.037)
Hellerstein, N
eumark and T
roske 369
Proportion
married
-0.033
-0.059
-0.035
0.001
(0.032)
(0.037)
(0.032)
(0.047)
Proportion
aged
35-54
0.018
0.019
0.019
-0.005
(0.022)
(0.022)
(0.022)
(0.030)
Proportion
aged
55+
-0.064
-0.064
-0.061
-0.126
(0.031)
(0.031)
(0.032)
(0.044)
Proportion
some
college
-0.038
-0.037
-0.036
-0.045
(0.024)
(0.024)
(0.024)
(0.034)
Proportion
managerial
-0.035
-0.029
-0.028
-0.015
(0.034)
(0.033)
(0.034)
(0.047)
Proportion
sales
0.076
0.082
0.084
0.119
(0.029)
(0.029)
(0.029)
(0.040)
Proportion
craft
0.013
0.015
0.014
-0.017
(0.030)
(0.030)
(0.030)
(0.041)
R-squared
0.256
0.371
0.370
0.420
N
3,089
3,089
3,089
2,426
Notes:
Colum
ns
1-3
use all
plants,
while
Colum
n 4 uses
the
subsample
of
plants to
which
we
matched
at
least
seven
workers.
With
the
exception of
the
added
interactive
variables,
the
specifications
and
dependent
variable
are
the
same
as in
Colum
n 2 of
Table
2.
How
ever,
only
the
estimated
coefficients of
the
worker
characteristics
are
reported.
Results
were
very
similar
using
operating
income/sales.
370 The Journal of Human Resources
Table 4 Profitability Regressions, Plant Level, Effects of Proportion Female at Different Points of Output Share Distribution
Interactions of Interactions of All Proportion Demographic
Female with Variables with Output Share Output Share
(1) (2)
Proportion female 0.024 0.019 (0.033) (0.034)
X Second output share quartile -0.053 -0.051 (0.044) (0.046)
X Third output share quartile 0.062 0.079 (0.047) (0.049)
X Fourth output share quartile 0.136 0.135 (0.050) (0.055)
P-value for restriction of equal effects across quartiles: 0.001 0.003
Proportion black -0.029 -0.000 (0.029) (0.054)
Proportion married -0.036 -0.063 (0.032) (0.051)
Proportion aged 35-54 0.022 0.016 (0.022) (0.038)
Proportion aged 55+ -0.062 -0.042 (0.031) (0.053)
Capital/shipments -0.0026 -0.0025 (0.0015) (0.0015)
Second output share quartile 0.061 0.040 (0.016) (0.070)
Third output share quartile 0.085 -0.005 (0.016) (0.078)
Fourth output share quartile 0.127 0.051 (0.020) (0.089)
Number of coefficient estimates significant at 10 percent level, second-fourth out- put share quartiles
X proportion black I X proportion married 0 Xproportion aged 35-54 0 Xproportion aged 55 + 1 Xproportion some college 0 X proportion managerial 0 Xproportion sales 0 X proportion craft 0
R-squared 0.374 0.379
Notes: There are 3,089 observations. With the exception of the added interactive variables, the specifica- tions and dependent variable are the same as in Column 2 of Table 2. Results were very similar using
operating income/sales. Because the output share quartile dummy variables are interacted with many vari-
ables in Column 2, the estimated coefficients of the quartile dummy variables are not comparable to those
in Column 1.
Hellerstein, Neumark and Troske 371
between profitability and the proportion female over the lower half of the market share distribution, and then a strengthening positive relationship, which becomes strongly significant in the fourth quartile. Using the same calculation as before, for plants with the most market power the estimated coefficients imply that a ten percent- age point increase in the proportion female raises the profit rate by 1.60 percentage points (10 X {0.024 + 0.136)). This can be compared to the example discussed earlier, which indicated that a 2.3 percentage point increase is a reasonable upper- bound estimate.
This positive relationship between the proportion female and profitability among plants with high output share is consistent with the predictions of the Becker model relating discrimination to market power.'2 In plants that operate in a competitive output market, there is no performance advantage to hiring women; since discrimina- tory employers are unable to indulge their tastes for discrimination, wages in this sector are quickly bid to equality with marginal products. But in (typically larger) plants where there is market power and where plants can discriminate if they wish, at least in the short run, those that do not discriminate and hire more women- who cost less-achieve better performance. Below, we discuss how these different behaviors can coexist within industries.
We report one other analysis in Table 4. If the proportion female is a proxy for other unobservable characteristics of the plant (including its workforce) that may affect profitability differently for plants with different levels of market power, it is reasonable to think that other demographic characteristics of the plant's workforce also might be proxies for such unobservables. This suggests that we should include in the regression a full set of interactions between the output share quartile dummy variables and all the demographic characteristics of workers in a plant, and verify whether the results for the proportion female-market power relationship hold up. We do this in Column 2. The first thing to note is that the coefficients on the third and fourth quartile interactions between output share and the proportion female are simi- lar to those in Column 1, although, as noted above, larger for the third quartile interaction. Second, at the bottom of the columns we report some results for the interactions of the output share quartiles with the other demographic characteristics; of all the interactions estimated, only one interaction with black and one with age are significant at the 10 percent level. The fact that so few of these interactions are significant, and that the proportion female results persist, suggest to us that the results for the proportion female are not being driven primarily by unobservables. It appears to be specifically the hiring of women among plants with market power that is associ- ated with higher profitability."3
12. These results are also consistent with tabulations from the 1940 Census reported by Becker, indicating that relative to firms operating in competitive industries, firms operating in monopolistic industries appear to engage in discriminatory behavior (1971, Table 2, p. 48); Becker's results, however, refer to hiring of nonwhites. 13. Because of the counterintuitive negative coefficient on the ratio of book value of capital to shipments, we experimented with including this variable nonlinearly in the regression; the results were not qualitatively affected. We also reran the regressions restricting the coefficient on the book value of capital to be positive (0.06, at the suggestion of Caballero, Haltiwanger, and Engel 1995). The results for the proportion female effects were unchanged. This is not surprising, given that the correlation between book value of capital and proportion female is only -0.03.
372 The Journal of Human Resources
To summarize, although there is no clear evidence of a relationship between profitability and proportion female for plants falling into the bottom part of the output share distribution, there is clear evidence of a positive relationship between profit- ability and a more female workforce for plants with considerable market power. We interpret this evidence as being most consistent with Becker's model of employer taste discrimination, where plants that have market power are able to indulge their discriminatory tastes against women, but forfeit profits as a result.
C. Interpreting the Cross-Sectional Results
It is worth discussing in the context of our results the market forces in Becker's model relating market power to discrimination. If wages are set competitively,"4 plants that do not discriminate will hire men and women until the ratio of marginal revenue products between men and women is equal to the ratio of market wages, regardless of whether the plant has product market power. In plants with technologies where men and women are perfect substitutes in production, the ratio of marginal revenue products is determined exogenously by the technology, and competition in the labor market will work to equate the ratio of wages to that of marginal revenue products. In that case, nondiscriminatory employers will be indifferent between hiring men and women. If men and women are not perfect substitutes, the ratio of relative mar- ginal products will be a function of the sex mix of the plant's workforce, and will therefore be a decision variable for the plant. Once again, however, labor market competition will determine the relative wages of men and women.
We interpret our cross-sectional results as suggesting that among the set of plants with product market power-which are typically larger plants-some exploit the supra-competitive profits stemming from their product market power to indulge in discriminatory behavior against women. Higher profitability among those plants in the less-competitive sector that have a higher proportion female must imply a gap between relative marginal products and relative wages of women in this less-compet- itive sector. Similarly, the fact that profitability is unrelated to the proportion female among plants in the more-competitive sector must imply that this gap does not exist in this sector. Evidence presented in our earlier work (Hellerstein, Neumark, and Troske 1999) is consistent with this, as the gap between relative wages and relative marginal products of women and men is much smaller among small plants than large plants.
Given that wages are set by the market, we do not expect the wage gap between men and women to differ between the less- and more-competitive sectors. Rather, a larger gap between relative wages and relative marginal products in the less-com- petitive sector would have to reflect higher relative productivity of women in the less-competitive sector, possibly because of technological differences (the perfect substitutes case), or because fewer women are employed than would be the case in the absence of discrimination (in the imperfect substitutes case) in this sector. The
14. The Becker model presumes that wages are set competitively and that there is therefore one market wage differential between men and women. Our data are consistent with this; when we estimate individual- level wage regressions, the estimated coefficient of the female dummy variable remains large when plant fixed effects are included.
Hellerstein, Neumark and Troske 373
data are consistent with these predictions. In our earlier research, we found no pro- ductivity gap between men and women among larger firms, but we found that in smaller firms women were less productive than men. Moreover, wage regressions using plant-level data indicate that the relative wage of women is not particularly low among plants in the less-competitive sector that employ a high proportion female (the estimated coefficients of interactions between output share and the proportion female were small and insignificant).
Finally, this scenario is consistent with labor market equilibrium. As long as plants in the less-competitive sector compete for workers with plants in the more-competi- tive sector, and as long as the latter sector is large enough, the market wage ratio between men and women will be determined in the more-competitive sector and will be equal to the relative marginal products of men and women in the more- competitive sector. Then, despite discrimination against women by some employers in the less-competitive sector, women have no incentive to switch sectors. This equi- librium will persist unless or until competitive forces in the product market or in the market for firms begin to work and eventually bid up the wages of women in the less-competitive sector. The question then is whether, and how quickly, the com- petitive process works to undermine discrimination. We turn to evidence on this question in the next section.
D. Market Forces and Discrimination, Dynamic Tests
The preceding cross-sectional results suggest that plants or firms can indulge their discriminatory tastes only when they enjoy product market power. Nonetheless, mar- ket forces may reduce or eliminate discrimination as the more profitable plants or firms among those with market power grow relative to the less profitable ones, or as discriminating employers are bought out by nondiscriminating employers. Be- cause in our cross-sectional analysis the relationship between profitability and the proportion female is large and statistically significant only for plants in the fourth quartile of the market power measure, and because the test of equality of all four quartile coefficients is strongly rejected, we focus on these fourth quartile plants in the analysis of plant dynamics. Specifically, for plants in the top quartile of the output share distribution, we estimate regressions for growth of both employment and ship- ments, and probits for ownership change, as functions of, among other things, the proportion female in a plant's workforce. This should make it more likely that we find evidence, if there is any, consistent with the dynamic implications of Becker's model, since we focus on the plants for which we are most likely to see growth or ownership change related to the proportion female.
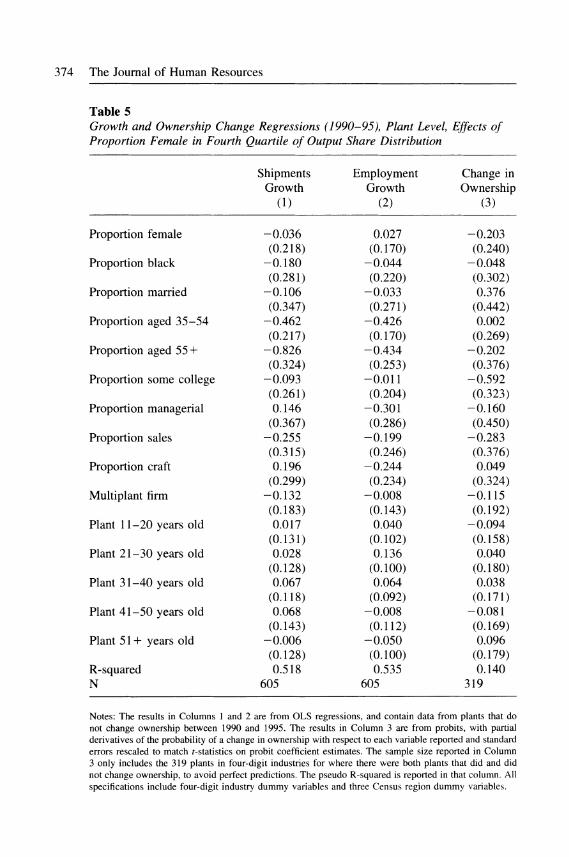
In Columns 1 and 2 of Table 5 we examine whether discrimination is eliminated through competition in the product market by asking whether plants that initially employ more women and earn higher profits grow faster than otherwise similar plants. We examine two different measures of changes in performance-growth in employment and growth in shipments-from 1990 to 1995, using the same covari- ates as in the first cross-section profitability regressions. The only exception is that we do not include as a regressor the capital/shipments ratio because the dependent variable no longer suffers from a missing measure of the return to capital.
All the estimated coefficients on the proportion female are small and statistically
374 The Journal of Human Resources
Table 5 Growth and Ownership Change Regressions (1990-95), Plant Level, Effects of Proportion Female in Fourth Quartile of Output Share Distribution
Shipments Employment Change in Growth Growth Ownership
(1) (2) (3)
Proportion female -0.036 0.027 -0.203 (0.218) (0.170) (0.240)
Proportion black -0.180 -0.044 -0.048 (0.281) (0.220) (0.302)
Proportion married -0.106 -0.033 0.376 (0.347) (0.271) (0.442)
Proportion aged 35-54 -0.462 -0.426 0.002 (0.217) (0.170) (0.269)
Proportion aged 55+ -0.826 -0.434 -0.202 (0.324) (0.253) (0.376)
Proportion some college -0.093 -0.011 -0.592 (0.261) (0.204) (0.323)
Proportion managerial 0.146 -0.301 -0.160 (0.367) (0.286) (0.450)
Proportion sales -0.255 -0.199 -0.283 (0.315) (0.246) (0.376)
Proportion craft 0.196 -0.244 0.049 (0.299) (0.234) (0.324)
Multiplant firm -0.132 -0.008 -0.115 (0.183) (0.143) (0.192)
Plant 11-20 years old 0.017 0.040 -0.094 (0.131) (0.102) (0.158)
Plant 21-30 years old 0.028 0.136 0.040 (0.128) (0.100) (0.180)
Plant 31-40 years old 0.067 0.064 0.038 (0.118) (0.092) (0.171)
Plant 41-50 years old 0.068 -0.008 -0.081 (0.143) (0.112) (0.169)
Plant 51 + years old -0.006 -0.050 0.096 (0.128) (0.100) (0.179)
R-squared 0.518 0.535 0.140 N 605 605 319
Notes: The results in Columns I and 2 are from OLS regressions, and contain data from plants that do not change ownership between 1990 and 1995. The results in Column 3 are from probits, with partial derivatives of the probability of a change in ownership with respect to each variable reported and standard errors rescaled to match t-statistics on probit coefficient estimates. The sample size reported in Column 3 only includes the 319 plants in four-digit industries for where there were both plants that did and did not change ownership, to avoid perfect predictions. The pseudo R-squared is reported in that column. All specifications include four-digit industry dummy variables and three Census region dummy variables.
Hellerstein, Neumark and Troske 375
insignificant.'5 There is therefore no evidence that sex discrimination in wages is reduced or eliminated by market forces that cause nondiscriminatory plants to expand relative to discriminatory plants. We also examined the relationships between growth of both shipments and employment, and the proportion female for other quartiles of the output share distribution. Given that we found no significant cross-sectional relationship between the proportion female and profitability for plants in these quartiles in the cross-section, we would not have expected to find such a relationship in the growth results if the relationship between growth and the proportion female is being driven by market forces affecting discrimination. Indeed, the results from the other quartiles (not reported) also show no relationship between the proportion female and growth, with the estimated coefficients small and insignificant.
In Column 3 of Table 5 we analyze the effect of higher relative employment of women in the base year on the probability of changing ownership between 1990 and 1995, again for plants in the top quartile of the output share distribution. Becker's model predicts that in the case of discriminatory tastes on the part of employers (as opposed to nepotistic tastes), plants with discriminatory owners who hire too few women will tend to be bought out by nondiscriminating owners. We test whether the data are consistent with this prediction of the model by estimating probits in which the dependent variable is one if the plant changed ownership and zero other- wise. The point estimate of the effect of the proportion female is negative, consistent with plants employing fewer women being more likely to change ownership, as predicted by Becker's model. However, the relationship is not statistically signifi- cant.
Overall, the results in Table 5 provide little evidence of market forces that bid away the sex discrimination reflected in the cross-sectional relationship between profitability and the proportion female for plants with product market power. We emphasize, however, that these results on growth and ownership change are derived from five-year changes, and it is possible that this is not a long enough period of time to be able to measure the effect of competitive market forces on discriminatory practices. To put this in perspective, the wage gap between men and women has persisted (although it has narrowed) for decades. Of course, at the level of individual plants or firms, we might expect market forces to have effects that are manifested more quickly.
E. A Retrospective Look at Growth
To get some sense of whether examining growth and ownership change over the period 1990-95 is sufficient to draw conclusions about long-term competitive market forces, one can think retrospectively about how competitive market forces during the 1980s may have impacted a plant's choices about the composition of its labor force in 1990.16 First, if competitive forces were working in the 1980s to reduce
15. In fact, the only significant coefficients in Column 1 are for the worker age variables, which are negative. As mentioned earlier, we interpret such results as reflecting plant-specific shocks. 16. There is evidence that the wage gap between men and women shrank during the 1980s but not during the 1990s (Blau, Ferber, and Winkler 1997). This is consistent with the notion that competitive market forces were bidding away discrimination during the 1980s, but that these market pressures weakened in the 1990s.
376 The Journal of Human Resources
Table 6 Lagged Shipments and Employment Growth Regressions (1982- 87), Plant Level, Continuing Plants Not Changing Ownership
Shipments Employment (1) (2)
Proportion female 0.947 0.606 (0.338) (0.189)
Proportion black 0.140 -0.238 (0.437) (0.244)
Proportion married 1.45 0.734 (0.497) (0.278)
Proportion aged 35-54 -1.30 -0.775 (0.351) (0.196)
Proportion aged 55+ -1.14 -0.611 (0.469) (0.262)
Proportion some college 0.141 -0.071 (0.381) (0.213)
Proportion managerial -0.661 -0.040 (0.528) (0.295)
Proportion sales 1.08 0.861 (0.438) (0.244)
Proportion craft 0.352 -0.242 (0.470) (0.262)
Multiplant firm -0.162 -0.171 (0. 199) (0.111)
Second output share quartile -0.562 -0.175 (0.162) (0.090)
Third output share quartile -0.741 -0.245 (0.188) (0.105)
Fourth output share quartile -0.902 -0.309 (0.214) (0.120)
Plant 11-20 years old -0.744 -0.175 (0.232) (0.129)
Plant 21-30 years old -1.23 -0.426 (0.224) (0.125)
Plant 31-40 years old -1.10 -0.392 (0.225) (0.126)
Plant 41-50 years old -1.07 -0.386 (0.308) (0.172)
Plant 51 + years old -0.112 -0.465 (0.248) (0.139)
R-squared 0.240 0.184
Notes: There are 1,968 observations. Four-digit industry dummy variables and three Census region dummy variables also are included. We construct the output share quartile dummies using data from the 1982 CM.
Hellerstein, Neumark and Troske 377
discrimination, we would expect that by 1990 nondiscriminating employers would have a higher proportion of female employees and, as a result of their profitable nondiscriminatory behavior, would have a relatively larger market share. This pattern is confirmed in the cross-sectional data for 1990. The correlation between the propor- tion female variable and the fourth quartile output share dummy is positive (0.05) and statistically significant, whereas the correlations between the proportion female and the first three output share quartile dummies are negative (-0.01, -0.03, and -0.01 for the first, second, and third quartile dummies).
Second, if competitive market forces in the 1980s were bidding away discrimina- tion, one would expect that, all else equal, plants that by 1990 had a higher proportion of female workers were those that should have grown the most during the 1980s. We cannot conduct a formal test of this hypothesis, since it is impossible for us to hold "all else equal" and examine the relationship between growth in the 1980s and the proportion female in a plant in 1990. For example, we have no data on the characteristics of workers in plants prior to 1990. However, a positive relationship between growth in the 1980s and the proportion female in 1990 is at least consistent with the hypothesis that market forces in the 1980s were working to reduce discrimi- nation.
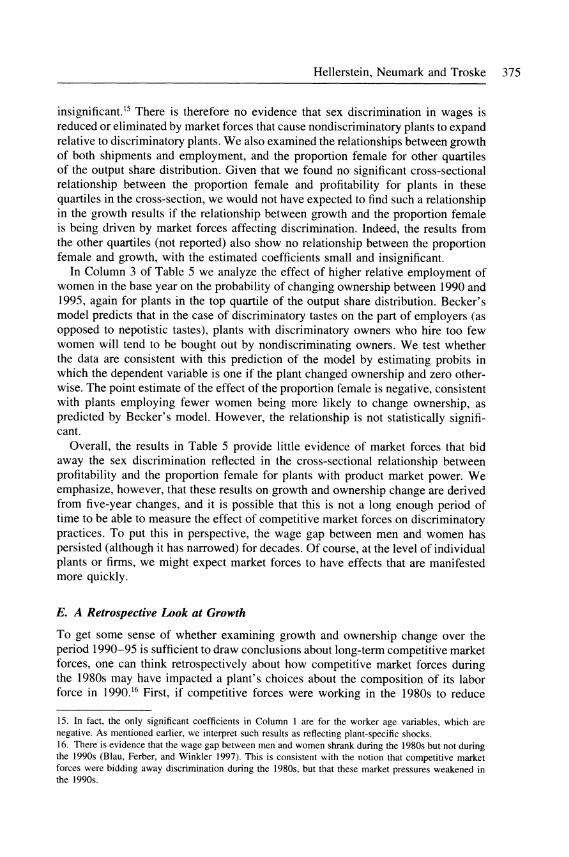
To see whether this relationship holds, we have constructed data on proportional growth in employment and shipments from 1982 to 1987 for the subset of 1,968 plants in the WECD that existed in 1982, using data on these plants from the 1982 and 1987 CMs. We use these lagged growth measures to examine whether lagged growth is at all related to the characteristics of plants in 1990. In Table 6, we report results from regressions of lagged growth in both shipments and employment from 1982 to 1987 on the same set of characteristics of plants in 1990 that we used in Table 2. The results in Table 6 indicate that employment and shipments growth between 1982 and 1987 are positively and significantly related to the proportion female in 1990. The magnitudes of the coefficients on proportion female in these regressions are very large (with large standard errors), but we emphasize that they do not have any causal interpretation. Rather, we interpret the positive and significant relationship between lagged growth and proportion female in 1990 as simply sug- gesting that one may need to look over a longer period than just 1990-95 in order to observe whether the dynamics of competition are eliminating discrimination.
V. Conclusions
We find that among plants with high levels of product market power, those that employ relatively more women are more profitable. No such relationship exists for plants with apparently low levels of market power. This is consistent with sex discrimination in wages in the short run in markets where plants have product market power. We also find a positive relationship at the firm level between profit- ability and the proportion of the workforce that is female.
We then turn to evidence on the longer-run effects of market forces on discrimina- tion, asking whether discriminatory employers with market power as evidenced in the cross-sectional results are punished over time through lower growth than nondis- criminatory employers, or whether discriminatory employers are bought out by non-
378 The Journal of Human Resources
discriminators. We find little conclusive evidence that this occurs over a five-year period, as growth and ownership change for plants with market power are generally not significantly related to the sex composition of a plant's workforce. Indeed, evi- dence on the wage gap coupled with suggestive results in our data indicate that it is possible that market forces combating discrimination may have been stronger in the period preceding the five-year period we analyze to test for longer-run effects of market forces.
Overall, the results are consistent with the short-run implications of Becker's model of employer discrimination. There is evidence of discrimination in the short run for plants with product market power, which indicates that market power may be a prerequisite to the exercise of discriminatory tastes by employers. The evidence does not allow us to reject the hypothesis that market forces do not punish those discriminatory employers with market power in ways that tend to drive them from the market, or at least to shrink them relative to the market. This longer-run evidence is therefore not consistent with the dynamic or long-run implications of Becker's model for discriminatory employers, which, as Becker explained, would hold under only some conditions regarding barriers to entry, returns to scale, and the nature of discriminatory tastes. Our analysis does not identify which of these conditions might be violated, nor does it assess other possible explanations for the failure of competi- tive market forces to discipline discriminatory employers in the long run. This is obviously an important unanswered question, and is probably related to the same factors that lead to a persistent relationship between market power and profitability in the first place."7 Of course, we only have data to test for the effect of market forces over a specific five-year period, and it is quite possible that this window of time is too short for these market forces to have been detectable in our data. In addition, failure to reject no effect of the proportion female on longer-run growth or changes in ownership does not necessarily imply that these relationships do not exist but may instead reflect an inability to detect significant relationships. Nonetheless, this evidence does not provide support for the conclusion that market forces tend to eliminate discrimination by punishing discriminatory employers.
Empirical evidence on the role of competitive market forces in eliminating or reducing discrimination-such as that presented in this paper-is critical in assess- ing government policies to combat discrimination. The direct tools at the govern- ment's disposal are equal pay or employment legislation and affirmative action. If market forces reduce or eliminate discrimination, then these direct tools may be unnecessary, and efforts to enhance competition may represent better policies. The results in this paper suggest that product market competition deters discrimination, in that plants and firms with relatively little market power appear not to discriminate, while discrimination only occurs among those plants or firms that are large relative to the market. The evidence also suggests that competitive market forces are unlikely
17. Some recent research points to two potential barriers to competitive pressures that might otherwise discipline discriminatory employers, although also indicating that in some cases it may be possible to increase these pressures. Looking at the banking sector, Black and Strahan (2001) find that the wages of women relative to men rose when deregulation increased competitive pressures on banks. Similarly, Black and Brainerd (1999) report that increased product market competition via international trade raised the relative wages of women in manufacturing industries.
Hellerstein, Neumark and Troske 379
to be completely sufficient to eliminate discrimination among these large plants or firms. In particular, there is little evidence that, among employers with product mar- ket power, longer-run product market competition or competition in the market for ownership acts to undermine or eliminate discrimination. As long as the government is unlikely to enact policies that substantially reduce the product market power of the largest plants or firms, direct government intervention in the labor market may be required if the goal is to eliminate discrimination entirely.
References
Arrow, Kenneth J. 1973. "The Theory of Discrimination." In Discrimination in Labor Markets, eds. Orley Ashenfelter and Albert Rees, 3-33. Princeton, N.J.: Princeton Uni- versity Press.
Arrow, Kenneth J. 1972. "Some Mathematical Models of Race Discrimination in the La- bor Market." In Racial Discrimination in Economic Life, ed. A. H. Pascal, 187-204. Lexington, Mass.: D.C. Heath.
Ashenfelter, Orley, and Timothy Hannan. 1986. "Sex Discrimination and Product Market Competition: The Case of the Banking Industry." Quarterly Journal of Economics 101(1): 149-73.
Becker, Gary S. 1971. The Economics of Discrimination. Chicago: University of Chicago Press.
Black, Sandra E., and Elizabeth Brainerd. 1999. "Importing Equality? The Effects of In- creased Competition on the Gender-Wage Gap." Working Paper. New York: Federal Re- serve Bank of New York.
Black, Sandra E., and Phillip E. Strahan. 2001. "The Division of Spoils: Rent Sharing and Discrimination in a Regulated Industry." American Economic Review 91(4):814-31.
Blau, Francine D., Marianne A. Ferber, and Anne E. Winkler. 1997. The Economics of Men, Women, and Work, Third Edition. Englewood Cliffs, N.J.: Prentice-Hall.
Caballero, Ricardo, John Haltiwanger, and Eduardo Engel. 1995. "Plant-Level Adjustment and Aggregative Investment Dynamics." Brookings Papers on Economic Activity 2:1 - 39.
Cavalluzzo, Ken, Cavalluzzo, Linda, and John Wolken. 1999. "Competition, Small Busi- ness Financing, and Discrimination: Evidence from a New Survey." Mimeo. Washing- ton, D.C.: Georgetown University.
Domowitz, Ian, R. Glenn Hubbard, and Bruce C. Peterson. 1986. "Business Cycles and the Relationship Between Concentration and Price-Cost Margins." Rand Journal of Eco- nomics l(17):1-17.
Fuchs, Victor R. 1988. Women's Quest for Economic Equality. Cambridge, Mass.: Harvard University Press.
Hellerstein, Judith K., and David Neumark. 1999. "Sex, Wages, and Productivity: An Em- pirical Analysis of Israeli Firm-Level Data." International Economic Review 40(1):95- 123.
Hellerstein, Judith K., David Neumark, and Kenneth R. Troske. 1999. "Wages, Productiv- ity, and Worker Characteristics: Evidence from Plant-Level Production Functions and Wage Equations." Journal of Labor Economics 17(3):409-46.
Hersch, Joni. 1991. "Equal Employment Opportunity Law and Firm Profitability." Journal of Human Resources 26(1): 139-53.
Mincer, Jacob, and Solomon Polachek. 1974. "Family Investment in Human Capital: Earn- ings of Women." Journal of Political Economy 82(2, Part II):S76-S108.

380 The Journal of Human Resources
O'Neill, June. 1994. "Discrimination and Income Differences." In Race and Gender in the American Economy, ed. Susan F. Feiner, 13-7. Englewood Cliffs, N.J.: Prentice- Hall, Inc.
Salinger, Michael. 1990. "The Concentration-Margins Relationship Reconsidered," Brook- ings Papers on Economic Activity, Microeconomics, Special Issue: 287-335.
Tirole, Jean. 1989. The Theorv of Industrial Organization. Cambridge, Mass. The MIT Press.


![Sex Discrimination Act 1984 Discrimination... · Part I—Preliminary 1 Short title [see Note 1] This Act may be cited as the Sex Discrimination Act 1984. 2 Commencement [see Note](https://img.pdfslide.net/doc/110x75/5f3d3e4f54813b21861440e1/sex-discrimination-act-discrimination-part-iapreliminary-1-short-title-see.jpg)