Embed Size (px)
Citation preview

London’s lettings & sales agent
Market Index Review Q3, 2019
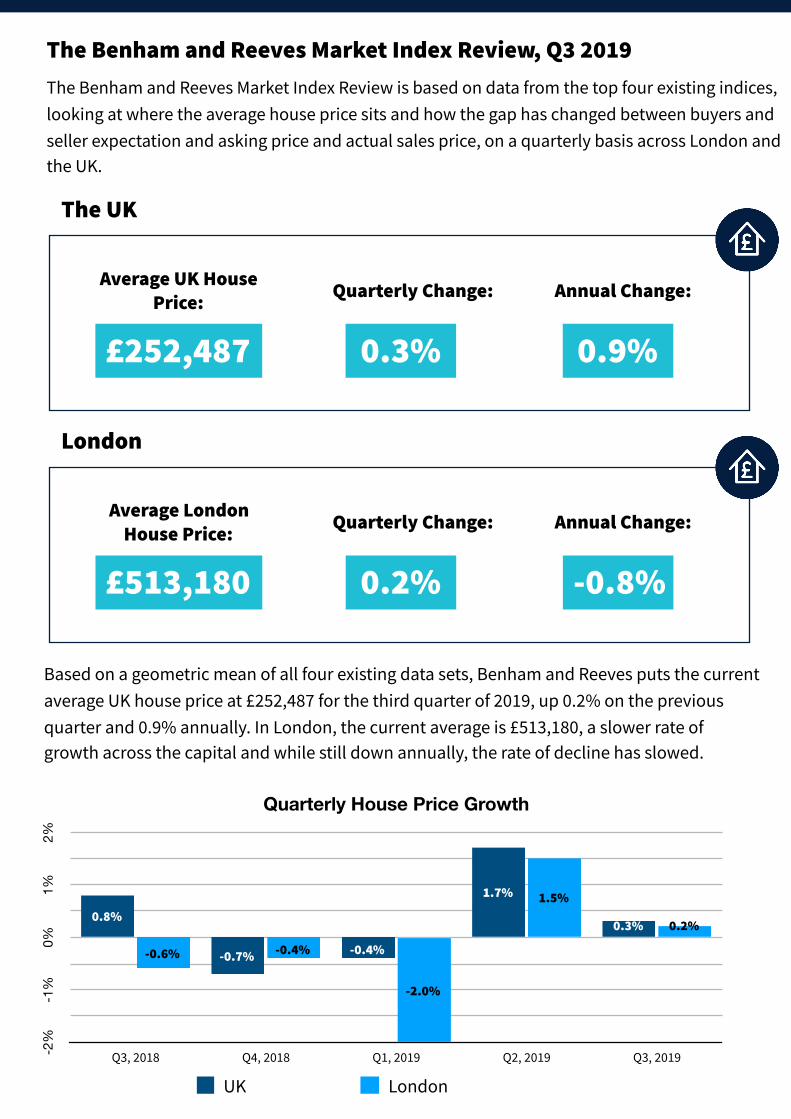
The Benham and Reeves Market Index Review, Q3 2019The Benham and Reeves Market Index Review is based on data from the top four existing indices, looking at where the average house price sits and how the gap has changed between buyers and seller expectation and asking price and actual sales price, on a quarterly basis across London and the UK.
The UK
Based on a geometric mean of all four existing data sets, Benham and Reeves puts the current average UK house price at £252,487 for the third quarter of 2019, up 0.2% on the previous quarter and 0.9% annually. In London, the current average is £513,180, a slower rate of growth across the capital and while still down annually, the rate of decline has slowed.
Average UK House Price:
£252,487
Quarterly Change:
0.3%
Annual Change:
0.9%
London
Average London House Price:
£513,180
Quarterly Change:
0.2%
Annual Change:
-0.8%
Quarterly House Price Growth
-2%
-1%
0%1%
2%
Q3, 2018 Q4, 2018 Q1, 2019 Q2, 2019 Q3, 2019
0.2%
1.5%
-2.0%
-0.4%-0.6%
0.3%
1.7%
-0.4%-0.7%
0.8%
UK London
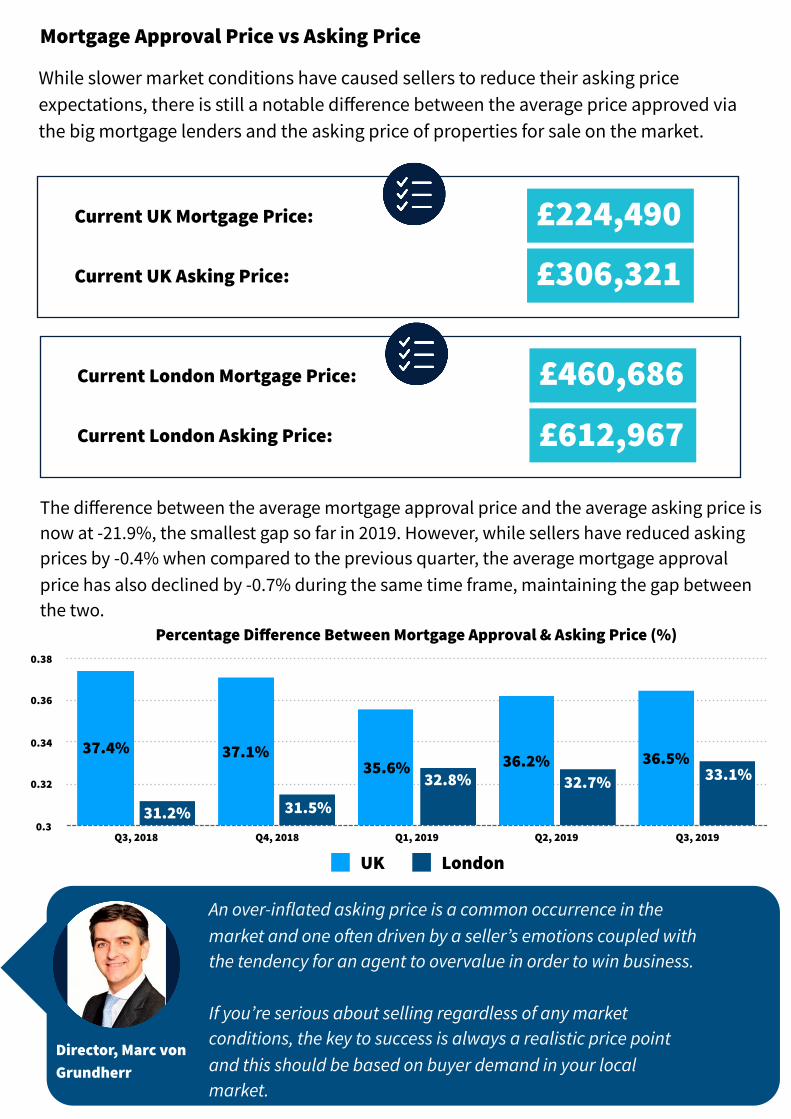
While slower market conditions have caused sellers to reduce their asking price expectations, there is still a notable difference between the average price approved via the big mortgage lenders and the asking price of properties for sale on the market.
Mortgage Approval Price vs Asking Price
Current UK Mortgage Price: £224,490
Current UK Asking Price: £306,321
The difference between the average mortgage approval price and the average asking price is now at -21.9%, the smallest gap so far in 2019. However, while sellers have reduced asking prices by -0.4% when compared to the previous quarter, the average mortgage approval price has also declined by -0.7% during the same time frame, maintaining the gap between the two.
Percentage Difference Between Mortgage Approval & Asking Price (%)
0.3
0.32
0.34
0.36
0.38
Q3, 2018 Q4, 2018 Q1, 2019 Q2, 2019 Q3, 2019
33.1%32.7%32.8%
31.5%31.2%
36.5%36.2%35.6%37.1%37.4%
UK London
Current London Mortgage Price: £460,686
Current London Asking Price: £612,967
An over-inflated asking price is a common occurrence in the market and one often driven by a seller’s emotions coupled with the tendency for an agent to overvalue in order to win business.
If you’re serious about selling regardless of any market conditions, the key to success is always a realistic price point and this should be based on buyer demand in your local market.
Director, Marc von Grundherr
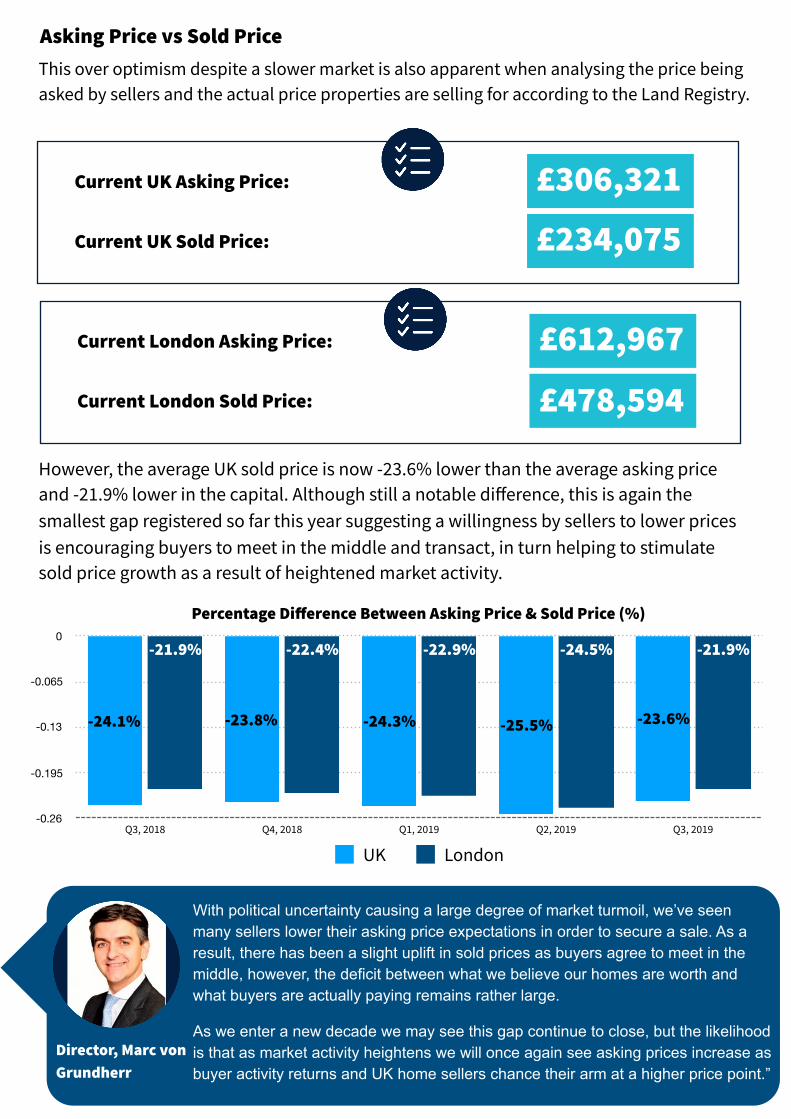
Asking Price vs Sold Price
Current UK Asking Price: £306,321
Current UK Sold Price: £234,075
However, the average UK sold price is now -23.6% lower than the average asking price and -21.9% lower in the capital. Although still a notable difference, this is again the smallest gap registered so far this year suggesting a willingness by sellers to lower prices is encouraging buyers to meet in the middle and transact, in turn helping to stimulate sold price growth as a result of heightened market activity.
Percentage Difference Between Asking Price & Sold Price (%)
-0.26
-0.195
-0.13
-0.065
0
Q3, 2018 Q4, 2018 Q1, 2019 Q2, 2019 Q3, 2019
-21.9%-24.5%-22.9%-22.4%-21.9%
-23.6%-25.5%-24.3%-23.8%-24.1%
UK London
Current London Asking Price: £612,967
Current London Sold Price: £478,594
Director, Marc von Grundherr
This over optimism despite a slower market is also apparent when analysing the price being asked by sellers and the actual price properties are selling for according to the Land Registry.
With political uncertainty causing a large degree of market turmoil, we’ve seen many sellers lower their asking price expectations in order to secure a sale. As a result, there has been a slight uplift in sold prices as buyers agree to meet in the middle, however, the deficit between what we believe our homes are worth and what buyers are actually paying remains rather large.
As we enter a new decade we may see this gap continue to close, but the likelihood is that as market activity heightens we will once again see asking prices increase as buyer activity returns and UK home sellers chance their arm at a higher price point.”
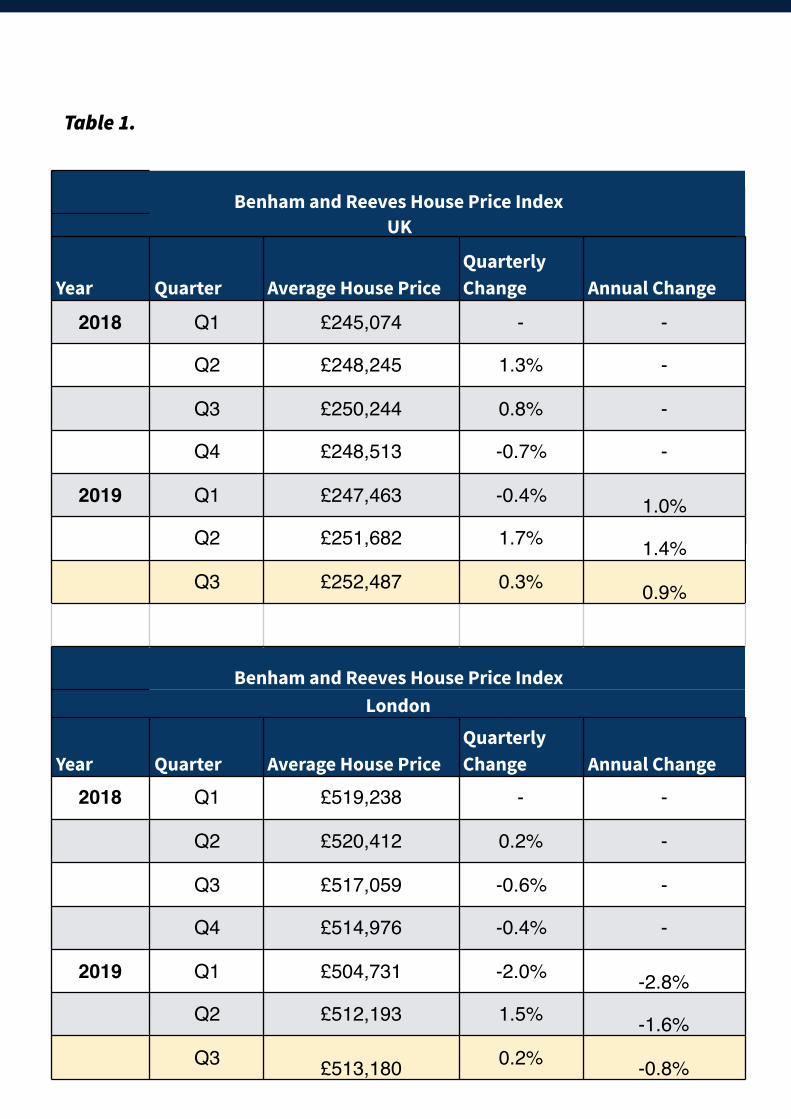
Table 1.
Benham and Reeves House Price IndexUK
Year Quarter Average House PriceQuarterly Change Annual Change
2018 Q1 £245,074 - -
Q2 £248,245 1.3% -
Q3 £250,244 0.8% -
Q4 £248,513 -0.7% -
2019 Q1 £247,463 -0.4% 1.0%Q2 £251,682 1.7% 1.4%Q3 £252,487 0.3% 0.9%
Benham and Reeves House Price IndexLondon
Year Quarter Average House PriceQuarterly Change Annual Change
2018 Q1 £519,238 - -
Q2 £520,412 0.2% -
Q3 £517,059 -0.6% -
Q4 £514,976 -0.4% -
2019 Q1 £504,731 -2.0% -2.8%Q2 £512,193 1.5% -1.6%Q3 £513,180 0.2% -0.8%
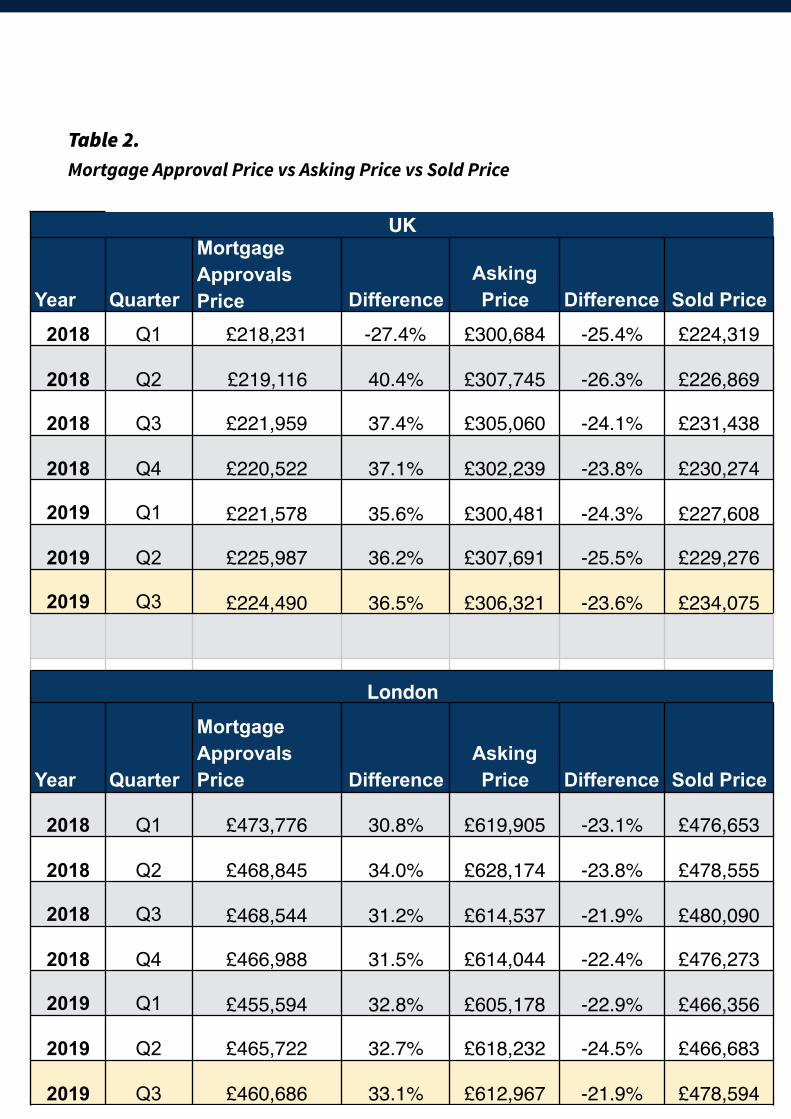
Mortgage Approval Price vs Asking Price vs Sold Price
Table 2.
UK
Year Quarter
Mortgage Approvals Price Difference
Asking Price Difference Sold Price
2018 Q1 £218,231 -27.4% £300,684 -25.4% £224,319
2018 Q2 £219,116 40.4% £307,745 -26.3% £226,869
2018 Q3 £221,959 37.4% £305,060 -24.1% £231,438
2018 Q4 £220,522 37.1% £302,239 -23.8% £230,274
2019 Q1 £221,578 35.6% £300,481 -24.3% £227,608
2019 Q2 £225,987 36.2% £307,691 -25.5% £229,276
2019 Q3 £224,490 36.5% £306,321 -23.6% £234,075
London
Year Quarter
Mortgage Approvals Price Difference
Asking Price Difference Sold Price
2018 Q1 £473,776 30.8% £619,905 -23.1% £476,653
2018 Q2 £468,845 34.0% £628,174 -23.8% £478,555
2018 Q3 £468,544 31.2% £614,537 -21.9% £480,090
2018 Q4 £466,988 31.5% £614,044 -22.4% £476,273
2019 Q1 £455,594 32.8% £605,178 -22.9% £466,356
2019 Q2 £465,722 32.7% £618,232 -24.5% £466,683
2019 Q3 £460,686 33.1% £612,967 -21.9% £478,594
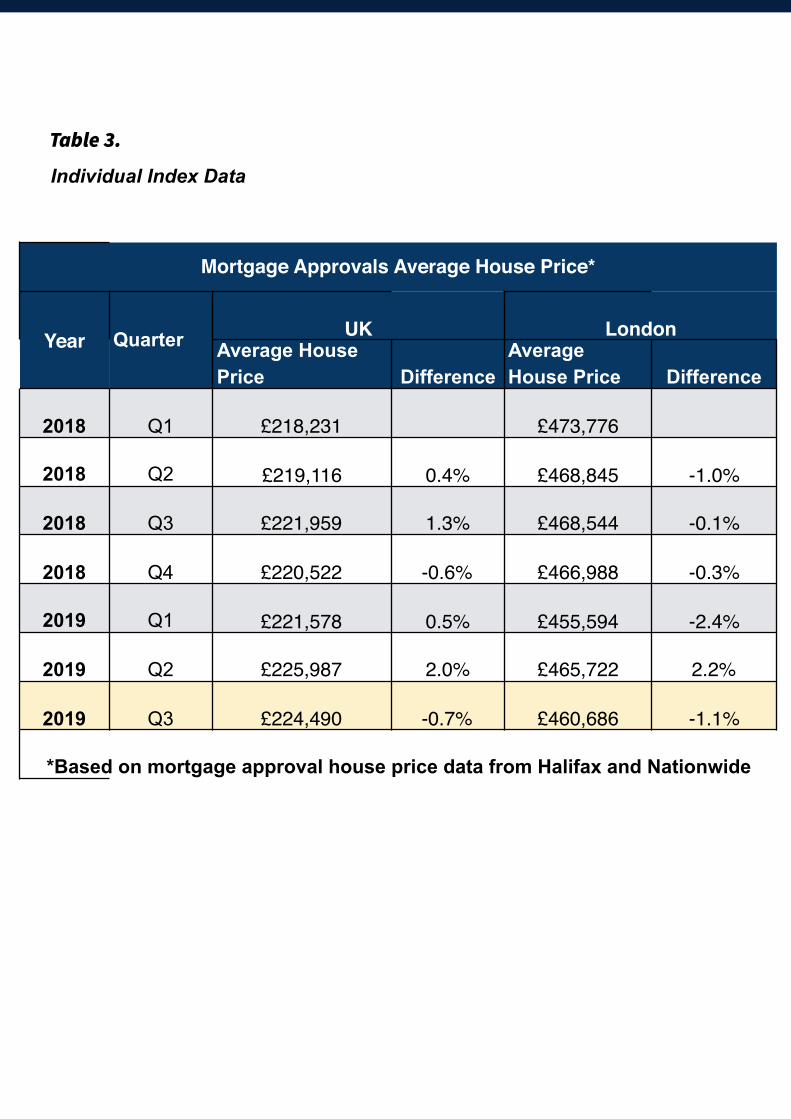
Individual Index Data
Table 3.
Mortgage Approvals Average House Price*
Year Quarter UK LondonAverage House Price Difference
Average House Price Difference
2018 Q1 £218,231 £473,776
2018 Q2 £219,116 0.4% £468,845 -1.0%
2018 Q3 £221,959 1.3% £468,544 -0.1%
2018 Q4 £220,522 -0.6% £466,988 -0.3%
2019 Q1 £221,578 0.5% £455,594 -2.4%
2019 Q2 £225,987 2.0% £465,722 2.2%
2019 Q3 £224,490 -0.7% £460,686 -1.1%
*Based on mortgage approval house price data from Halifax and Nationwide
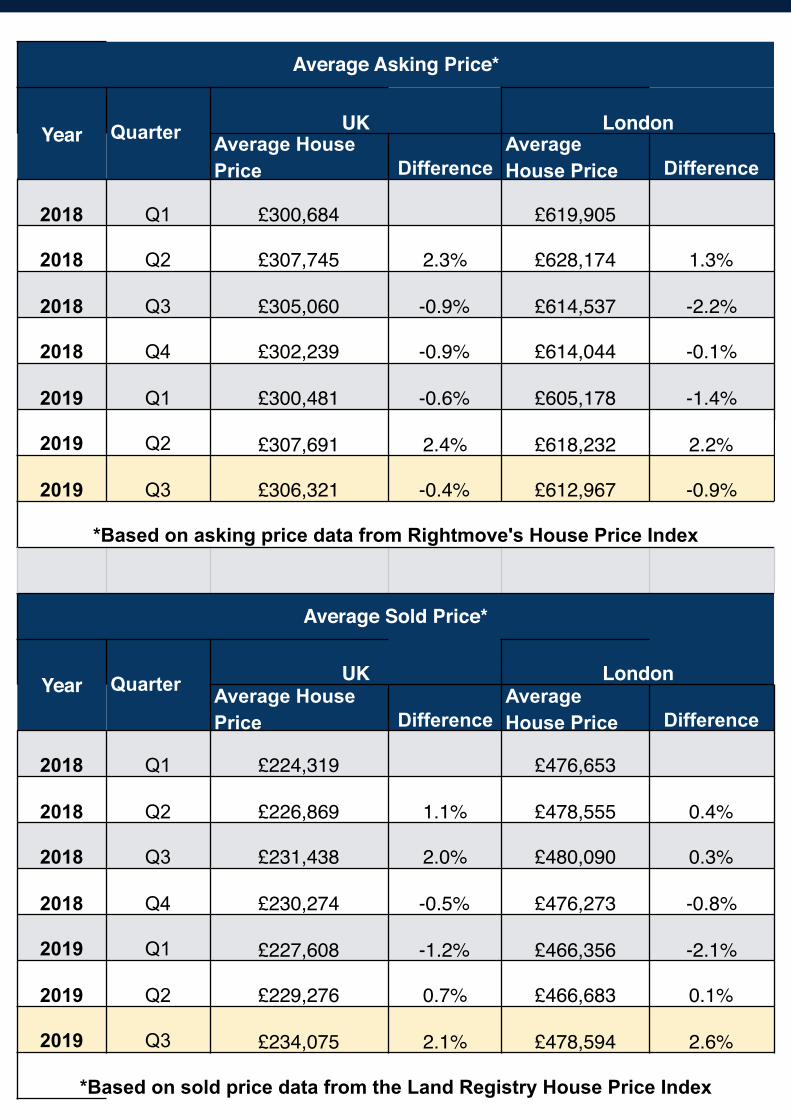
Average Asking Price*
Year Quarter UK LondonAverage House Price Difference
Average House Price Difference
2018 Q1 £300,684 £619,905
2018 Q2 £307,745 2.3% £628,174 1.3%
2018 Q3 £305,060 -0.9% £614,537 -2.2%
2018 Q4 £302,239 -0.9% £614,044 -0.1%
2019 Q1 £300,481 -0.6% £605,178 -1.4%
2019 Q2 £307,691 2.4% £618,232 2.2%
2019 Q3 £306,321 -0.4% £612,967 -0.9%
*Based on asking price data from Rightmove's House Price Index
Average Sold Price*
Year Quarter UK LondonAverage House Price Difference
Average House Price Difference
2018 Q1 £224,319 £476,653
2018 Q2 £226,869 1.1% £478,555 0.4%
2018 Q3 £231,438 2.0% £480,090 0.3%
2018 Q4 £230,274 -0.5% £476,273 -0.8%
2019 Q1 £227,608 -1.2% £466,356 -2.1%
2019 Q2 £229,276 0.7% £466,683 0.1%
2019 Q3 £234,075 2.1% £478,594 2.6%
*Based on sold price data from the Land Registry House Price Index
OfficesLondon
Canary Wharf City of London Colindale Ealing Fulham Greenwich
Hammersmith Hampstead Highgate Hyde Park Kensington Kew
Knightsbridge Nine Elms Surrey Quays Wapping West End
International
China Hong Kong India Malaysia Singapore
www.benhams.com