Embed Size (px)
Citation preview

CINCINNATI/DAYTON COLUMBUS INDIANAPOLIS KANSAS CITY MINNEAPOLIS OMAHA ST. LOUIS TOLEDO
Previous Page Home Next Page
MARKET INSIGHTCENTRAL MIDWEST MULTIFAMILY REPORT | THIRD QUARTER 2017
CUSHMAN & WAKEFIELD CENTRAL MIDWEST MULTIFAMILY RESEARCH
The Cushman & Wakefield Central Midwest Multifamily Research Team provides in-depth coverage of primary, secondary, and tertiary cities across the Midwest. In addition to analyzing multifamily rent and sales trends, these reports examine employment data, job growth trends, key economic announcements, and development pipeline news.
CINCINNATI/DAYTON INDIANAPOLIS
MINNEAPOLIS
IN THIS EDITION
Effective as of third quarter 2017, multifamily trends included in this and future reports reflect a shift in data sources. Therefore, trends in prior reports will not match going forward.
RESEARCH TEAM
COLUMBUS KANSAS CITY
OMAHA
BRENDAN DUNBARST. LOUIS [email protected]
JARRETT HICKSCINCINNATI/DAYTON, COLUMBUS, [email protected]
MATTHEW NEVINGERKANSAS [email protected]
MATT NIEHOFFINDIANAPOLIS [email protected]
SARA [email protected]
SHARON [email protected]
ST. LOUIS TOLEDO
Don MurphySenior Director +1 513 763 [email protected]
Scott PollomDirector+1 317 639 [email protected]
Phillip BrimbleManaging Director+1 816 412 [email protected]
Mike HanrahanExecutive Director+1 314 746 [email protected]
Scott KoetheDirector +1 402 548 [email protected]
Lance SteigerSenior Director+1 952 893 [email protected]
Don MurphySenior Director +1 513 763 [email protected]
Don MurphySenior Director +1 513 763 [email protected]
INTERACTIVE CONTENT

CINCINNATI/DAYTON

Previous Page Home Next Page
CINCINNATI/DAYTON COLUMBUS INDIANAPOLIS KANSAS CITY MINNEAPOLIS OMAHA ST. LOUIS TOLEDO
1CI N CI N N AT I / DAY TONMARKET INSIGHTThird Quarter 2017
The following are select announcements from the third quarter of 2017:
• According to the U.S. Bureau of Economic Analysis (BEA), Greater Cincinnati is now the largest metropolitan economy in Ohio, with a GMP of $132 billion. Nationally, Greater Cincinnati is the 28th largest local economy, followed by Columbus (29th) and Cleveland (30th).
• At 4.7%, unemployment in the combined Cincinnati/Dayton market is now slightly higher than the national average.
• Multifamily vacancy should remain between 5.5% and 6.0% with effective rent rates continuing to grow steadily.
Average Q3 employment increased by 25,000 jobs.
Average Q3 unemployment increased to 4.7%.
+2.0 +37% Y O Y B P S Y O Y
ECONOMIC EXPANSION
OUTLOOKJOB GROWTH & UNEMPLOYMENT RATE
Paycor is planning to double the size of its Norwood corporate headquarters, as it adds 1,064 new jobs.
In Monroe, a 1.3 million-square-foot fulfillment center is being built for Amazon, which will result in the creation of more than 1,000 full-time jobs.
UPS Supply Chain Solutions will add 130 jobs at a new West Chester facility by the end of 2020.
Automotive manufacturer Hematite is constructing a 106,000-square-foot U.S. headquarters / manufacturing facility in Englewood, which will create 100 jobs.
As part of its expansion, East Price Hill-based Q Laboratories is planning to add 90 new jobs.
Dayton-based manufacturer Composite Advantage LLC is looking to double its area workforce, by adding 90 new jobs.
a
a
a
a
a
The combined Cincinnati/Dayton region added more than 25,000 net jobs year-over-year per the Bureau of Labor Statistics’ (BLS) total employment average for the third quarter of 2017. The 25,000 new jobs represent a job growth rate of 2.0%, which is slightly higher than the growth rates from the prior three quarters. Industries that led job growth in the third quarter were Leisure & Hospitality (+9,800 net jobs), Professional & Business Services (+6,300 net jobs), and Trade/Transportation & Utilities (+5,500 net jobs).
EMPLOYMENT & UNEMPLOYMENT TRENDS
CINCINNATI/DAYTON JOB GROWTH TRENDS
0.0%
0.5%
1.0%
1.5%
2.0%
2.5%
1.42
1.43
1.44
1.45
1.46
1.47
1.48
1.49
1.50
1.51
Q4 Q1 Q2 Q3
CINCINNATI/DAYTON JOB GROWTH TRENDSEMPLOYMENT IN MILLIONS
2015-2016 2016-2017 YOY % Job Growth
CINCINNATI/DAYTON, OH
Q3 2015 Q3 2016 Q3 2017 FORECAST
U.S. UNEMPLOYMENT RATE 5.1% 4.9% 4.4%
EMPLOYMENT (% Change) 2.1% 1.5% 2.0%
LOCAL UNEMPLOYMENT RATE 4.4% 4.4% 4.7%
a
Forecast is 12-month outlook
EMPLOYMENT IN MILLIONS & JOB GROWTH (%)
Source: Moody’s Analytics
Previous Page Home Next Page
CINCINNATI/DAYTON COLUMBUS INDIANAPOLIS KANSAS CITY MINNEAPOLIS OMAHA ST. LOUIS TOLEDO
2CI N CI N N AT I / DAY TONMARKET INSIGHTThird Quarter 2017
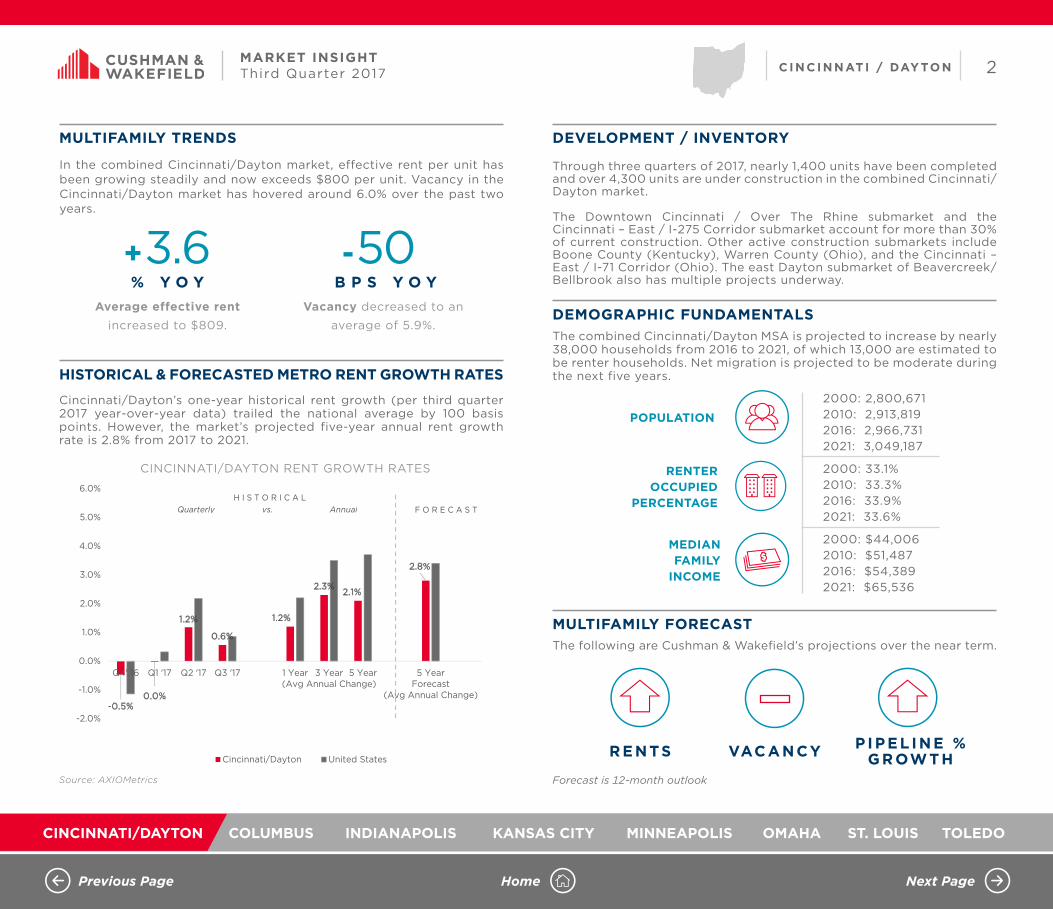
In the combined Cincinnati/Dayton market, effective rent per unit has been growing steadily and now exceeds $800 per unit. Vacancy in the Cincinnati/Dayton market has hovered around 6.0% over the past two years.
Cincinnati/Dayton’s one-year historical rent growth (per third quarter 2017 year-over-year data) trailed the national average by 100 basis points. However, the market’s projected five-year annual rent growth rate is 2.8% from 2017 to 2021.
Through three quarters of 2017, nearly 1,400 units have been completed and over 4,300 units are under construction in the combined Cincinnati/Dayton market.
The Downtown Cincinnati / Over The Rhine submarket and the Cincinnati – East / I-275 Corridor submarket account for more than 30% of current construction. Other active construction submarkets include Boone County (Kentucky), Warren County (Ohio), and the Cincinnati – East / I-71 Corridor (Ohio). The east Dayton submarket of Beavercreek/Bellbrook also has multiple projects underway.
The combined Cincinnati/Dayton MSA is projected to increase by nearly 38,000 households from 2016 to 2021, of which 13,000 are estimated to be renter households. Net migration is projected to be moderate during the next five years.
The following are Cushman & Wakefield’s projections over the near term.
MULTIFAMILY TRENDS
HISTORICAL & FORECASTED METRO RENT GROWTH RATES
DEVELOPMENT / INVENTORY
DEMOGRAPHIC FUNDAMENTALSAverage effective rentincreased to $809.
Vacancy decreased to an
average of 5.9%.
-0.5%0.0%
1.2%
0.6%
1.2%
2.3%2.1%
2.8%
-2.0%
-1.0%
0.0%
1.0%
2.0%
3.0%
4.0%
5.0%
6.0%
Q4' 16 Q1 '17 Q2 '17 Q3 '17 1 Year 3 Year(Avg Annual Change)
5 Year 5 YearForecast
(Avg Annual Change)
CINCINNATI/DAYTON RENT GROWTH RATESHISTORICAL AND FORECAST
Cincinnati/Dayton United States
Quarterly vs. AnnualH I S T O R I C A L
F O R E C A S T
CINCINNATI/DAYTON RENT GROWTH RATES
+3.6 -50% Y O Y B P S Y O Y
2000: 2,800,6712010: 2,913,8192016: 2,966,7312021: 3,049,187
2000: 33.1%2010: 33.3%2016: 33.9%2021: 33.6%
2000: $44,0062010: $51,4872016: $54,3892021: $65,536
MULTIFAMILY FORECAST
VACANCYREN TS P IP EL INE % G ROWTH
Source: AXIOMetrics Forecast is 12-month outlook
POPULATION
MEDIANFAMILY
INCOME
RENTER OCCUPIED
PERCENTAGE
Previous Page Home Next Page
CINCINNATI/DAYTON COLUMBUS INDIANAPOLIS KANSAS CITY MINNEAPOLIS OMAHA ST. LOUIS TOLEDO
3CI N CI N N AT I / DAY TONMARKET INSIGHTThird Quarter 2017
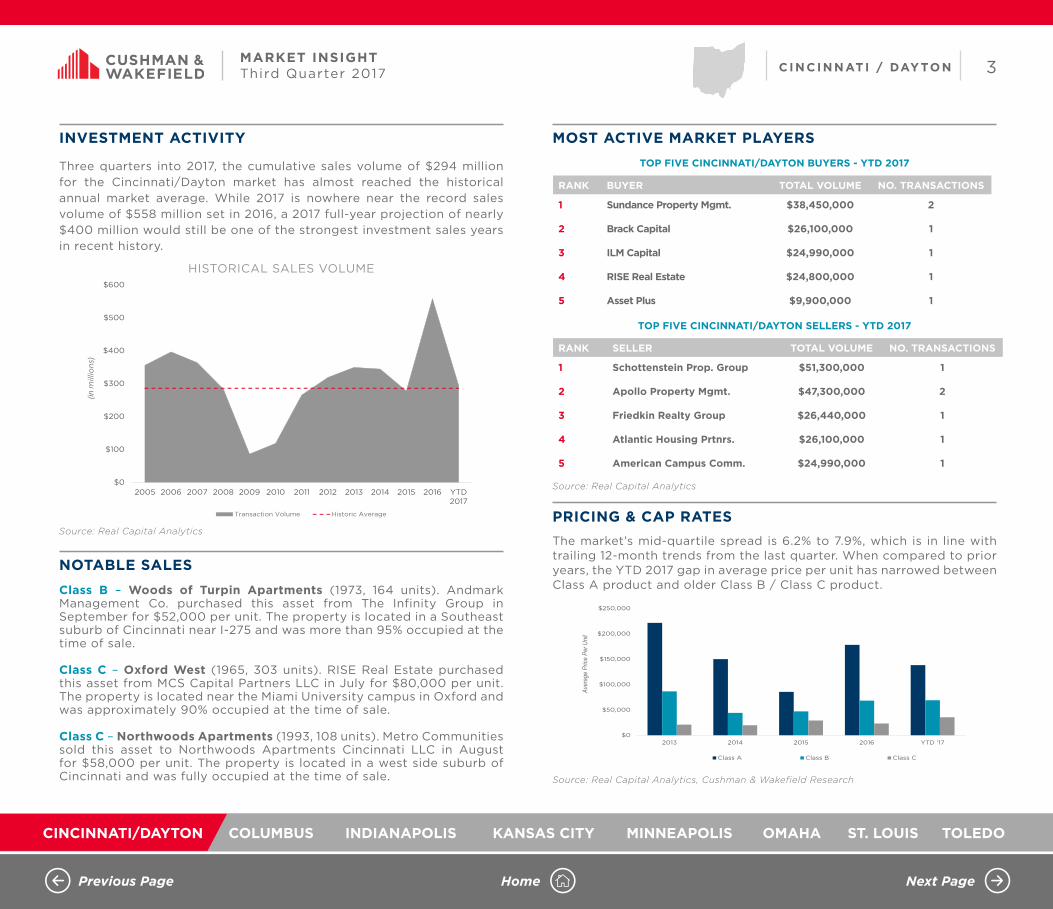
Three quarters into 2017, the cumulative sales volume of $294 million for the Cincinnati/Dayton market has almost reached the historical annual market average. While 2017 is nowhere near the record sales volume of $558 million set in 2016, a 2017 full-year projection of nearly $400 million would still be one of the strongest investment sales years in recent history.
Class B – Woods of Turpin Apartments (1973, 164 units). Andmark Management Co. purchased this asset from The Infinity Group in September for $52,000 per unit. The property is located in a Southeast suburb of Cincinnati near I-275 and was more than 95% occupied at the time of sale.
Class C – Oxford West (1965, 303 units). RISE Real Estate purchased this asset from MCS Capital Partners LLC in July for $80,000 per unit. The property is located near the Miami University campus in Oxford and was approximately 90% occupied at the time of sale.
Class C – Northwoods Apartments (1993, 108 units). Metro Communities sold this asset to Northwoods Apartments Cincinnati LLC in August for $58,000 per unit. The property is located in a west side suburb of Cincinnati and was fully occupied at the time of sale.
The market’s mid-quartile spread is 6.2% to 7.9%, which is in line with trailing 12-month trends from the last quarter. When compared to prior years, the YTD 2017 gap in average price per unit has narrowed between Class A product and older Class B / Class C product.
INVESTMENT ACTIVITY
NOTABLE SALES
MOST ACTIVE MARKET PLAYERS
PRICING & CAP RATES
$0
$100
$200
$300
$400
$500
$600
2005 2006 2007 2008 2009 2010 2011 2012 2013 2014 2015 2016 YTD2017
CINCINNATI/DAYTON ANNUAL SALES VOLUMEANNUAL SALES VOLUME ($ MILLIONS)
Transaction Volume Historic Average
(inm
illio
ns)
$0
$50,000
$100,000
$150,000
$200,000
$250,000
2013 2014 2015 2016 YTD '17
Class A Class B Class C
CINCINNATI/DAYTON PRICING TRENDSPRICE / UNIT & CAP RATE
Aver
age
Price
Per
Uni
t
TOP FIVE CINCINNATI/DAYTON BUYERS - YTD 2017
Source: Real Capital Analytics
TOP FIVE CINCINNATI/DAYTON SELLERS - YTD 2017
HISTORICAL SALES VOLUME
RANK BUYER TOTAL VOLUME NO. TRANSACTIONS
1 Sundance Property Mgmt. $38,450,000 2
2 Brack Capital $26,100,000 1
3 ILM Capital $24,990,000 1
4 RISE Real Estate $24,800,000 1
5 Asset Plus $9,900,000 1
RANK SELLER TOTAL VOLUME NO. TRANSACTIONS
1 Schottenstein Prop. Group $51,300,000 1
2 Apollo Property Mgmt. $47,300,000 2
3 Friedkin Realty Group $26,440,000 1
4 Atlantic Housing Prtnrs. $26,100,000 1
5 American Campus Comm. $24,990,000 1
Source: Real Capital Analytics, Cushman & Wakefield Research
Source: Real Capital Analytics

Previous Page Home Next Page
CINCINNATI/DAYTON COLUMBUS INDIANAPOLIS KANSAS CITY MINNEAPOLIS OMAHA ST. LOUIS TOLEDO
4CI N CI N N AT I / DAY TONMARKET INSIGHTThird Quarter 2017
Clifton/Corryville
• Developer Trinitas Ventures, along with Harrison Street Real Estate Capital, has purchased multiple properties near the University of Cincinnati campus, including the former Deaconess Hospital. A mixed-used development is being planned for the area, including a 357-unit apartment complex called the Collegiate. This complex will feature fully-furnished units and is scheduled to be complete in the fall of 2019.
Oakley
• To meet growing multifamily demand, Nashville-based Hickory Capital Group is building an 82,000-square foot indoor self-storage facility on the site of a former restaurant on Madison Road. CubeSmart will be three stories tall and climate-controlled. The project is expected to be complete in April of 2018.
Covington
• Following the demolition of a former bank building, construction will begin on a 187-unit luxury apartment complex called River Haus. The $40 million project is being built on Fifth Street in Covington’s MainStrasse Village and is being developed by Flaherty & Collins Properties.
Downtown Dayton
• In the mixed-use Water Street District, Crawford Hoying and Woodard Development are in the early stages of developing a 100-unit apartment complex. The project would be located on the site of a soon-to-be demolished industrial building on East First Street. The complex is expected to be complete in 2019.
SUBMARKET OVERVIEW SELECT SUBMARKET NEWS
RENTS & VACANCY BY SUBMARKET
$969
$781
$733
$736
$694
$1,007
$1,355
$619
$576
$628
$996
$623
$664
$810
$946
$835
$761
$888
$832
$824
$974
Warren County
Miamisburg/Moraine
Miami County
Kenton County
Fairborn/WPAFB
Downtown Dayton/Oregon Dist.
Downtown Cincinnati/O-T-R
Dayton - North/West
Dayton - East
Dayton - Central/West
Clifton/Corryville
Clark County
Cincinnati - West
Cincinnati - North
Cincinnati - East / I-71 Corr.
Cincinnati - East / I-275 Corr.
Centerville/Kettering
Campbell County
Butler County
Boone County
Beavercreek/Bellbrook
CINCINNATI/DAYTON SUBMARKET TRENDSRENTS & VACANCY
5.0%
7.4%
5.5%
4.1%
4.6%
10.0%
7.1%
5.1%
4.7%
9.3%
4.7%
3.9%
5.8%
4.4%
5.1%
3.9%
6.1%
4.7%
6.0%
6.3%
6.7%
Warren County
Miamisburg/Moraine
Miami County
Kenton County
Fairborn/WPAFB
Downtown Dayton/Oregon…
Downtown Cincinnati/O-T-R
Dayton - North/West
Dayton - East
Dayton - Central/West
Clifton/Corryville
Clark County
Cincinnati - West
Cincinnati - North
Cincinnati - East / I-71 Corr.
Cincinnati - East / I-275 Corr.
Centerville/Kettering
Campbell County
Butler County
Boone County
Beavercreek/Bellbrook
RENTS & VACANCY BY SUBMARKET
356
528
218
76
355
700
406
114
804
11058
226
428
0
100
200
300
400
500
600
700
800
900
CINCINNATI/DAYTON SUBMARKET TRENDSUnder ConstructionUNDER CONSTRUCTION BY SUBMARKET
Source: CoStar, Cushman & Wakefield ResearchNote: Submarkets are defined by Cushman & Wakefield Research

COLUMBUS

Previous Page Home Next Page
CINCINNATI/DAYTON COLUMBUS INDIANAPOLIS KANSAS CITY MINNEAPOLIS OMAHA ST. LOUIS TOLEDO
1COLUMB USMARKET INSIGHTThird Quarter 2017
The following are select announcements from the third quarter of 2017:
• Greater Columbus was one of North America’s “most competitive cities” in both automotive and logistics by a recent Site Selection magazine report
• At 4.4%, unemployment in the Columbus area remains on-par with the national average.
• Columbus is the largest multifamily market in Ohio with more than 7,600 apartment units under construction and increasing effective rental rates.
Average Q3 employment increased by 13,000 jobs.
Average Q3 unemployment increased to 4.4%.
+2.0 +27% Y O Y B P S Y O Y
ECONOMIC EXPANSION
OUTLOOKJOB GROWTH & UNEMPLOYMENT RATE
Honda is adding 300 new jobs between its manufacturing plants in Marysville and Anna.
Meijer is hiring 300 new employees across 13 of its Central Ohio area stores.
Housing developer Woda Group is relocating its Central Ohio office to the Brewery District and plans to add 100 new jobs.
Facebook will be building a new 900,000-square-foot data center in New Albany that will create 100 jobs.
Ascena Retail Group, the parent company of Catherines stores, will add 100 jobs in Central Ohio, as it relocates operations from Philadelphia.
Fluvitex USA, an Ikea bedding supplier, is planning to add 80 full-time equivalent jobs to its Groveport facility.
a
a
a
a
a
The Columbus market added more than 13,000 net jobs year-over-year per the Bureau of Labor Statistics’ (BLS) total employment average for the third quarter of 2017. The 13,000 new jobs represent a job growth rate of 2.0%, which is similar to the growth rates from each the prior three quarters. Industries that led job growth in the third quarter were Mining/Logging/Construction (+5,800 net jobs), Manufacturing (+5,600 net jobs), and Government (+3,600 net jobs).
EMPLOYMENT & UNEMPLOYMENT TRENDS
COLUMBUS JOB GROWTH TRENDS
0.0%
0.5%
1.0%
1.5%
2.0%
2.5%
3.0%
3.5%
1.02
1.03
1.04
1.05
1.06
1.07
1.08
1.09
1.10
Q4 Q1 Q2 Q3
COLUMBUS JOB GROWTH TRENDSEMPLOYMENT IN MILLIONS
2015-2016 2016-2017 YOY % Job Growth
COLUMBUS, OH
Q3 2015 Q3 2016 Q3 2017 FORECAST
U.S. UNEMPLOYMENT RATE 5.1% 4.9% 4.4%
EMPLOYMENT (% Change) 2.2% 2.3% 2.0%
LOCAL UNEMPLOYMENT RATE 4.0% 4.1% 4.4%
a
Forecast is 12-month outlook
EMPLOYMENT IN MILLIONS & JOB GROWTH (%)
Source: Moody’s Analytics

Previous Page Home Next Page
CINCINNATI/DAYTON COLUMBUS INDIANAPOLIS KANSAS CITY MINNEAPOLIS OMAHA ST. LOUIS TOLEDO
2COLUMB USMARKET INSIGHTThird Quarter 2017
Effective rent per unit has been growing significantly in the Columbus market over the past few years. For the first time ever, effective rent now exceeds $860 per unit. Vacancy in the Columbus market has ranged between 5.0% and 6.0% over the past two years.
Columbus’ one-year historical rent growth (per third quarter 2017 year-over-year data) was ahead of the national average by 50 basis points. Furthermore, the market’s projected five-year annual rent growth rate is 3.0% from 2017 to 2021.
Through three quarters of 2017, nearly 2,600 units have been completed and more than 7,600 units are under construction in the eight-county Columbus Metro Area.
Downtown Columbus is currently the most active development submarket. Activity is also strong in the northern Dublin/Hilliard submarket and the New Albany submarket, along with the far northern counties of Delaware, Morrow and Union.
The Columbus MSA is projected to increase by more than 43,000 households from 2016 to 2021, of which 16,000 are estimated to be renter households. Net migration is projected to accelerate during the next five years.
The following are Cushman & Wakefield’s projections over the near term.
MULTIFAMILY TRENDS
HISTORICAL & FORECASTED METRO RENT GROWTH RATES
DEVELOPMENT / INVENTORY
DEMOGRAPHIC FUNDAMENTALSAverage effective rentincreased to $864.
Vacancy decreased to an
average of 5.3%.
-0.6%
0.3%
2.5%
1.4%
3.5% 3.4%3.2% 3.0%
-2.0%
-1.0%
0.0%
1.0%
2.0%
3.0%
4.0%
5.0%
6.0%
Q4' 16 Q1 '17 Q2 '17 Q3 '17 1 Year 3 Year(Avg Annual Change)
5 Year 5 YearForecast
(Avg Annual Change)
COLUMBUS RENT GROWTH RATESHISTORICAL AND FORECAST
Columbus United States
Quarterly vs. AnnualH I S T O R I C A L
F O R E C A S T
COLUMBUS RENT GROWTH RATES
+5.1 -20% Y O Y B P S Y O Y
2000: 1,674,6532010: 1,901,9792016: 2,022,1052021: 2,122,571
2000: 36.1%2010: 37.1%2016: 37.7%2021: 37.2%
2000: $44,4452010: $51,1882016: $56,6652021: $67,923
MULTIFAMILY FORECAST
VACANCYREN TS P IP EL INE % G ROWTH
Source: AXIOMetrics Forecast is 12-month outlook
POPULATION
MEDIANFAMILY
INCOME
RENTER OCCUPIED
PERCENTAGE

Previous Page Home Next Page
CINCINNATI/DAYTON COLUMBUS INDIANAPOLIS KANSAS CITY MINNEAPOLIS OMAHA ST. LOUIS TOLEDO
3COLUMB USMARKET INSIGHTThird Quarter 2017
Three quarters into 2017, the cumulative sales volume of $280 million for the Columbus market is on-pace to reach nearly $375 million for the year. The 2017 projection would fall short of the record-breaking multifamily investment sales years of 2014, 2015, and 2016, which were $861 million, $702 million and $448 milion respectively.
Class B – Sterling Place (1990, 300 units). Connor Group purchased this asset from CORE Realty Holdings in September for $108,000 per unit. The property is located in Northwest Columbus and was almost fully occupied at the time of sale.
Class B – Alkire Glen (2000, 252 units). Crawford Hoying sold this asset to RealSource Management LLC in July for $79,000 per unit. The property is located near I-270 in Southeast Columbus and was over 95% occupied at the time of sale.
Class C – Creekside at Taylor Square (2001, 532 units). Crawford Hoying sold this asset to Monarch Investments in August for $97,000 per unit. The property is located in the eastern suburb of Reynoldsburg and was 100% occupied at the time of sale.
The market’s mid-quartile spread is 5.9% to 7.3%, which is similar to the trailing 12-month trend from the last quarter.
INVESTMENT ACTIVITY
NOTABLE SALES
MOST ACTIVE MARKET PLAYERS
PRICING & CAP RATES
$0
$100
$200
$300
$400
$500
$600
$700
$800
$900
$1,000
2005 2006 2007 2008 2009 2010 2011 2012 2013 2014 2015 2016 YTD2017
COLUMBUS ANNUAL SALES VOLUMEANNUAL SALES VOLUME ($ MILLIONS)
Transaction Volume Historic Average
(inm
illio
ns)
$0
$25,000
$50,000
$75,000
$100,000
$125,000
$150,000
2013 2014 2015 2016 YTD '17
Class A Class B Class C
COLUMBUS PRICING TRENDSPRICE / UNIT & CAP RATE
Aver
age
Pric
e Pe
r Uni
t
TOP FIVE COLUMBUS BUYERS - YTD 2017
Source: Real Capital Analytics
TOP FIVE COLUMBUS SELLERS - YTD 2017
HISTORICAL SALES VOLUME
RANK BUYER TOTAL VOLUME NO. TRANSACTIONS
1 Albion Residential $55,450,000 1
2 Independence Realty Trust $50,900,000 2
3 Cortland Partners $49,000,000 1
4 Connor Group $32,500,000 1
5 CDEC $30,000,000 1
RANK SELLER TOTAL VOLUME NO. TRANSACTIONS
1 Connor Group $55,450,000 1
2 Hamilton Point Investments $50,900,000 2
3 Crawford Hoying $49,000,000 1
4 CORE Realty Holdings $32,500,000 1
5 UBS $30,000,000 1
Source: Real Capital Analytics, Cushman & Wakefield Research
Source: Real Capital Analytics

Previous Page Home Next Page
CINCINNATI/DAYTON COLUMBUS INDIANAPOLIS KANSAS CITY MINNEAPOLIS OMAHA ST. LOUIS TOLEDO
4COLUMB USMARKET INSIGHTThird Quarter 2017
SUBMARKET OVERVIEW SELECT SUBMARKET NEWS
RENTS & VACANCY BY SUBMARKET
Italian Village
• Dublin-based Borror Properties is close to breaking ground on an unnamed multi-story apartment complex on East Fifth Street. The 89-unit complex will be built on the site of the former Acme Taxi building and is expected to be complete by the Spring of 2019.
Grandview Heights
• Plans are underway to redevelop the current White Castle corporate headquarters into a $65 million mixed-use complex, located west of downtown. In addition to new offices, the project will include 270 new housing units and a community center.
Downtown
• Denver-based Charles Street Investment Partners LLC is proposing a six story mixed-used development on East Long Street, with a unique block-O structure. The project would include 225 apartment units.
Short North
• A 100-unit apartment complex is being planned by Columbus-based Pizzuti Companies on a West First Avenue site. The six-story complex will be located adjacent to another new Pizzuti office and retail development project.
Westerville
• The Fenimore will be a 180-unit apartment complex which soon begin construction on Hamilton Road. The project will be built on an 11-acre site adjacent to a number of other multifamily complexes by developers Robert Weiler Co. and Donald W. Kelley & Associates.
$988
$753
$756
$728
$994
$747
$813
$965
$1,270
$945
$732
Upper Arlington/OSU
Southwest Columbus /Madison Co.
Southeast Columbus
Northeast Columbus
New Albany
Licking Co.
Fairfield Co. / Pickaway Co.
Dublin/Hilliard
Downtown/ShortNorth/Brewery
Delaware Co. / Morrow Co. /Union Co.
Bexley/Whitehall
COLUMBUS SUBMARKET TRENDSRENTS & VACANCY
4.8%
5.3%
8.0%
4.9%
4.8%
5.0%
3.4%
5.2%
3.7%
6.1%
5.2%
Upper Arlington/OSU
Southwest Columbus /Madison Co.
Southeast Columbus
Northeast Columbus
New Albany
Licking Co.
Fairfield Co. /Pickaway Co.
Dublin/Hilliard
Downtown/ShortNorth/Brewery
Delaware Co. / MorrowCo. / Union Co.
Bexley/Whitehall
RENTS & VACANCY BY SUBMARKET
199
1,011
2,242
2,001
53
1,314
136
665
0
500
1,000
1,500
2,000
2,500
COLUMBUS SUBMARKET TRENDSUnder ConstructionUNDER CONSTRUCTION BY SUBMARKET
Source: CoStar, Cushman & Wakefield ResearchNote: Submarkets are defined by Cushman & Wakefield Research

INDIANAPOLIS

Previous Page Home Next Page
CINCINNATI/DAYTON COLUMBUS INDIANAPOLIS KANSAS CITY MINNEAPOLIS OMAHA ST. LOUIS TOLEDO
MARKET INSIGHTINDIANAPOLIS MULTIFAMILY REPORT | THIRD QUARTER 2017
CUSHMAN & WAKEFIELD INDIANAPOLIS MULTIFAMILY RESEARCH
The Cushman & Wakefield Multifamily Research Team provides in-depth coverage of the Indianapolis Metropolitan Statistical Area. In addition to analyzing multifamily rent and sale trends, these reports examine employment data, key economic announcements, and development pipeline news.
RESEARCH TEAM
IN THIS EDITION
32
32
32
36
38
9
9
9
9
9
9
9
9
9
44
44
44
44
37
37
37
37
67
6739
39
39
39
39
39
4747
38
38
38
38
19
19
3232
32
42
42
75
75
75
75
42
42
67
67
44
67
67
37
37
36
36
36
36
40
40
4040
40
52
52
31
31
31
31
31
31
31
31
31
52
4040
13
38
128
213
109
234
135
144
144
142
135
135
135
252252
267
267
267
267
236
234
236
252
234
109
28
37
9
37
36
52
52
52
52
52
136
421
421
421
421
421
136
36
Greenfield
Anderson
Pendleton
Elwood
Bud
Edinburgh
Martinsville
Franklin
Whiteland
Greenwood
IMS
IndianapolisInternational
Airport
Mooresville
Plainfield
DanvilleAvon
Brownsburg
Zionsville
MeridianHills
Lawrence
Beech Grove
Indianapolis
Southport
Fairland
Shelbyville
Fishers
Carmel
Noblesville
Lebanon
Speedway
69
69
69
70
70
70
70
74
74
74
74
74
74
74
65
65
65
65
65
65
65
65
74
465
465
465
465
865465
465
70
Bud
CARMEL
NORTHWEST
NORTHEAST
DOWNTOWNWEST
CARMELZIONSVILLEZIONSVILLE
NORTHNORTH
FISHERSFISHERS
NORTHWEST
NORTHEAST
SOUTHSOUTH
SOUTHWESTSOUTHWEST
SOUTHEASTSOUTHEAST
GREENWOODGREENWOOD
DOWNTOWN
CENTERCENTER
EASTEASTWEST
Downtown
Center
North
Northeast
East
Southeast
South
Southwest
West
Northwest
Zionsville
Carmel
Fishers
Greenwood
SCOTT POLLOM, CCIMDIRECTOR, CAPITAL [email protected]
MATT NIEHOFFRESEARCH [email protected]
MITCH OSTROWSKIRESEARCH [email protected]

Previous Page Home Next Page
CINCINNATI/DAYTON COLUMBUS INDIANAPOLIS KANSAS CITY MINNEAPOLIS OMAHA ST. LOUIS TOLEDO
2I N DI A N A POL I SMARKET INSIGHTThird Quarter 2017
+1.5% Y O Y
Average Q3 employment increased by 19,200.
-80B P S Y O Y
Average Q3 unemployment decreased to 3.2%.
ECONOMIC EXPANSIONThe following are select announcements from third quarter 2017:
OUTLOOK• The industrial market inventory continues to expand. By year-end,
construction deliveries are expected to set a new market high.• Construction (+7.3% YOY), Financial Activities (+6.5% YOY) and Trade
(+2.0% YOY) jobs all grew at above-average rates.• Job growth in Indianapolis will slow in the short-term as its current
expansion cycle matures, with Manufacturing employment staying steady and Technology jobs continuing to grow.
JOB GROWTH & UNEMPLOYMENT RATE
EMPLOYMENT & UNEMPLOYMENT TRENDSThe Indianapolis market added 19,200 net jobs year-over-year for third quarter 2017. The 19,200 new jobs represent a job growth rate of 1.5%, which is 70 basis points less than the growth rate from the prior quarter. The top sectors leading the way were Financial Activities (+4,300 net jobs), Education and Health Services (+4,000 net jobs), Construction (+3,700 net jobs), Government (+3,300 net jobs).
INDIANAPOLIS JOB GROWTH TRENDSEMPLOYMENT IN MILLIONS & JOB GROWTH (%)
0.0%
0.5%
1.0%
1.5%
2.0%
2.5%
3.0%
1.00
1.01
1.02
1.03
1.04
1.05
1.06
1.07
Q4 Q1 Q2 Q3
INDIANAPOLIS JOB GROWTH TRENDSEMPLOYMENT IN MILLIONS
2015-2016 2016-2017 YOY % Job Growth
INDIANAPOLIS
Q3 2015 Q3 2016 Q3 2017 FORECAST
NATIONAL UNEMPLOYMENT 5.1% 4.9% 4.4%
EMPLOYMENT (% Change) 2.9% 2.3% 1.5%
UNEMPLOYMENT RATE (%) 4.4% 4.4% 3.2%
Forecast is 12-month outlook
Source: Moody’s Analytics
a Amazon expects to hire more than 120,000 holiday jobs in 33 states, 7,000 jobs will be added locally.
a KAR Auction Services announced plans to build an $80-mil-lion corporate campus which will add 400 jobs.
a FedEx Corporation will build a $259-million distribution center in Greenwood and expects to hire 450 employees.
a Clean Slate Technology Group expects to invest $1 million to expand which will add 50 jobs by 2020.
aFuzic will add 250 jobs when it completes the build-out of just under 12,000-square-foot space in the newly constructed Braden Building.
a TechPoint received a $5.7-million grant to expand its tech- focused talent acquisition programs locally.
Previous Page Home Next Page
CINCINNATI/DAYTON COLUMBUS INDIANAPOLIS KANSAS CITY MINNEAPOLIS OMAHA ST. LOUIS TOLEDO
3I N DI A N A POL I SMARKET INSIGHTThird Quarter 2017
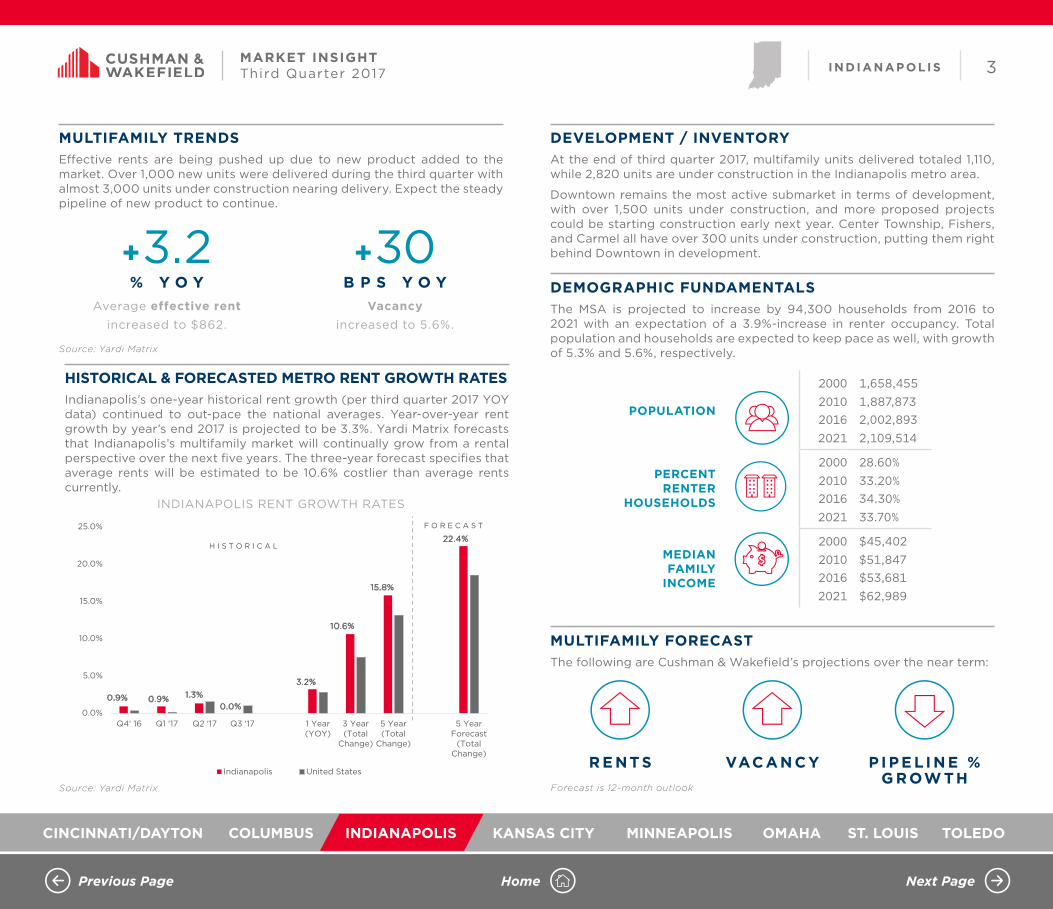
0.9% 0.9% 1.3% 0.0%
3.2%
10.6%
15.8%
22.4%
0.0%
5.0%
10.0%
15.0%
20.0%
25.0%
Q4' 16 Q1 '17 Q2 '17 Q3 '17 1 Year(YOY)
3 Year(Total
Change)
5 Year(Total
Change)
5 YearForecast
(TotalChange)
INDIANAPOLIS RENT GROWTH RATES HISTORICAL AND FORECAST
Indianapolis United States
H I S T O R I C A L
F O R E C A S T
INDIANAPOLIS RENT GROWTH RATES
Forecast is 12-month outlook
MULTIFAMILY TRENDSEffective rents are being pushed up due to new product added to the market. Over 1,000 new units were delivered during the third quarter with almost 3,000 units under construction nearing delivery. Expect the steady pipeline of new product to continue.
DEVELOPMENT / INVENTORYAt the end of third quarter 2017, multifamily units delivered totaled 1,110, while 2,820 units are under construction in the Indianapolis metro area.
Downtown remains the most active submarket in terms of development, with over 1,500 units under construction, and more proposed projects could be starting construction early next year. Center Township, Fishers, and Carmel all have over 300 units under construction, putting them right behind Downtown in development.
DEMOGRAPHIC FUNDAMENTALSThe MSA is projected to increase by 94,300 households from 2016 to 2021 with an expectation of a 3.9%-increase in renter occupancy. Total population and households are expected to keep pace as well, with growth of 5.3% and 5.6%, respectively.
MULTIFAMILY FORECASTThe following are Cushman & Wakefield’s projections over the near term:
HISTORICAL & FORECASTED METRO RENT GROWTH RATESIndianapolis’s one-year historical rent growth (per third quarter 2017 YOY data) continued to out-pace the national averages. Year-over-year rent growth by year’s end 2017 is projected to be 3.3%. Yardi Matrix forecasts that Indianapolis’s multifamily market will continually grow from a rental perspective over the next five years. The three-year forecast specifies that average rents will be estimated to be 10.6% costlier than average rents currently.
+3.2% Y O Y
Average effective rent increased to $862.
+30B P S Y O Y
Vacancy
increased to 5.6%.
R E NT S
VAC A N C Y P I P E L I N E % G ROW TH
POPULATION
2000 1,658,4552010 1,887,8732016 2,002,8932021 2,109,514
PERCENTRENTER
HOUSEHOLDS
2000 28.60%2010 33.20%2016 34.30%2021 33.70%
MEDIAN FAMILY
INCOME
2000 $45,4022010 $51,8472016 $53,6812021 $62,989
Source: Yardi Matrix
Source: Yardi Matrix

Previous Page Home Next Page
CINCINNATI/DAYTON COLUMBUS INDIANAPOLIS KANSAS CITY MINNEAPOLIS OMAHA ST. LOUIS TOLEDO
4I N DI A N A POL I SMARKET INSIGHTThird Quarter 2017
$0
$100
$200
$300
$400
$500
$600
$700
$800
$900
$1,000
2005 2006 2007 2008 2009 2010 2011 2012 2013 2014 2015 2016 YTD2017
INDIANAPOLIS ANNUAL SALES VOLUMEANNUAL SALES VOLUME ($ MILLIONS)
Transaction Volume Historic Average
(in m
illio
ns)
INDIANAPOLIS PRICING TRENDSPRICE / UNIT & CAP RATE
$0
$50,000
$100,000
$150,000
$200,000
2013 2014 2015 2016 YTD '17
Class A Class B Class C
TOP FIVE INDIANAPOLIS BUYERS - YTD 2017
Source: Real Capital Analytics
TOP FIVE INDIANAPOLIS SELLERS - YTD 2017
HISTORICAL SALES VOLUME
RANK BUYER TOTAL VOLUME NO. TRANSACTIONS
1 Sterling Group/Virtus RE Capital $98,119,702 1
2 Pedcor Management $88,050,000 2
3 Birge & Held $60,693,750 2
4 Covenant Capital Group $52,900,000 2
5 Lighthouse Group $52,500,000 3
RANK SELLER TOTAL VOLUME NO. TRANSACTIONS
1 Harbor Group Int'l. $117,250,000 2
2Bluestone Holdings / QVT Mount
Auburn Cap$98,119,702 1
3 Meridian Realty $74,300,000 2
4 Sinclair Broadcast Group $72,250,000 1
5 Sheehan Development $56,900,000 2
Source: Real Capital Analytics, Cushman & Wakefield Research
Source: Real Capital Analytics
INVESTMENT ACTIVITYThrough the third quarter, YTD investment activity is tracking over $200 million above the historical average. Nearly $150 million was invested during the third quarter.
Investment activity already outpaces the total market investment in 2015 and is nearing levels seen in 2016. With announcements of additional technology and warehouse jobs coming to the market, investor dollars should continue to steadily pour into the market due to demand of space by the millennial workforce.
PRICING & CAP RATESIn 2017, the average cap rate for Class A product is up from 5.6% in 2016 to 6.2% in 2017. Conversely, average Class B cap rate declined to 5.9% proving favorable for landlords. The following graph reflects price per unit trends by asset class.
MOST ACTIVE MARKET PLAYERS
NOTABLE SALES
• Milhaus Development sold Mozzo Apartments (2013, 65 units, $215,385 per unit) and The Maxwell (2008, 105 units, $190,476 per unit) to Birge & Held for a total of $34 million. Both are Class A assets.
• Samuel Geltman & Co. sold Columns of Castleton (1969, 398 units) for $76,000 per unit to Covenant Capital Group. The asset is located in the Northeast submarket.
• Domo Development Company sold Eaglepoint Apartments (2015, 240 units) in July to AR Building Co. for $28 million at nearly $117,000 per unit.

Previous Page Home Next Page
CINCINNATI/DAYTON COLUMBUS INDIANAPOLIS KANSAS CITY MINNEAPOLIS OMAHA ST. LOUIS TOLEDO
5I N DI A N A POL I SMARKET INSIGHTThird Quarter 2017
SUBMARKET OVERVIEW SELECT SUBMARKET NEWS
Downtown
• Flaherty & Collins’ 28-story, 292-unit, luxury mixed-use development, 360 Market Square Apartments, is under construction and is expected to be finished in the early part of 2018.
North
• Requests For Qualifications (RFQs) for the potential White River Development Plan are now being considered for the Broad Ripple area.
• TWG Development received approvals to build a $27.1-million, 186-unit complex despite opposition from the Nora community. The “Notch at Nora” includes 18 studio, 98 one-bedroom, and 70 two-bedroom units.
Carmel
• Midtown Carmel announced plans to widen the Monon Trail to accommodate the $210-million mixed-use investment being made in the area. The Midtown development will include office, retail and multifamily developments clustered within a 17-acre area.
Fishers
• IKEA and Topgolf have officially opened in Fishers. IKEA is expected to average $90-million in annual revenue while Topgolf is projected to average $24.5 million.
Zionsville
• Anson in Whitestown—a $1-billion commercial, retail and housing development—just announced the Shoppes at Whitestown. The $50-million project is expected to feature 275,000 square feet of retail, services, and restaurants.
$1,058
$692
$813
$907
$734
$736
$721
$853
$815
$1,138
$640
$1,423
$932
$1,128
Zionsville
West
Southwest
Southeast
South
Northwest
Northeast
North
Greenwood
Fishers
East
Downtown
Center
Carmel
INDIANAPOLIS SUBMARKET TRENDSRENTS & VACANCY
3.5%
7.5%
5.4%
7.2%
5.8%
6.0%
7.6%
5.2%
5.1%
8.5%
6.2%
4.8%
7.5%
6.7%
Zionsville
West
Southwest
Southeast
South
Northwest
Northeast
North
Greenwood
Fishers
East
Downtown
Center
Carmel
305343
1,515
354
194110
0
200
400
600
800
1,000
1,200
1,400
1,600
Carmel Center Downtown Fishers North Southeast
INDIANAPOLIS SUBMARKET TRENDSUnder Construction
RENTS & VACANCY BY SUBMARKET
UNDER CONSTRUCTION BY SUBMARKET
Source: Yardi Matrix, Cushman & Wakefield ResearchNote: Submarkets are defined by Cushman & Wakefield Research

KANSAS CITY

Previous Page Home Next Page
CINCINNATI/DAYTON COLUMBUS INDIANAPOLIS KANSAS CITY MINNEAPOLIS OMAHA ST. LOUIS TOLEDO
1KA N SAS C I T YMARKET INSIGHTThird Quarter 2017
The following are select announcements from third quarter 2017:
• Demand for residential space continued to outpace supply as the combined inventory of homes for sale in the Kansas City metro area has fallen 16.7% over the past twelve months.
• Johnson County, KS has the highest percentage of residents ages 25 and over with at least a Bachelor’s degree of any county in the United States with a population of at least 250,000.
• There are 3,704 units under construction in Downtown Kansas City as development in the area remains at a record high.
Kansas City has averaged 1,800
new jobs per month since Q3 2014.
Kansas City’s unemployment rate
reamains below the US level.
+1.3 -30% Y O Y B P S Y O Y
ECONOMIC EXPANSION
OUTLOOKJOB GROWTH & UNEMPLOYMENT RATE
Creative Planning is hoping to double employment to 400 in their new headquarters.
Horizons Global will create 150 jobs at their new distribution facility at Logistics Park Kansas City.
Cerner continues to add hundreds of jobs as it moves forward with its contract for the Department of Defense.
Amazon continues to hire for at least 1,000 full-time jobs at their new fulfillment center near I-70 and the Turner Diagonal, in addition to seasonal workers.
Sioux Chief is aiming to create 100 additional jobs at their new headquarters in the Centerpoint Intermodal.
Spring Venture Group will be initiating the hiring of 1,000 employees as the move into their new offices.
a
a
a
a
a
The Kansas City job market remains in robust health, with an umemployment rate of just 4.1%. More importantly, job growth remains strong with a 3.6% increase in the seasonally adjusted number of non-farm payroll over the past 24 months. The biggest constraint on job growth in Kansas City has been the low unemployment rate, although an increase in total population is helping in that area. According to estimates by the United States Census, the total population for Kansas City increased 2.4% from 2015 to 2016, the latest timeframe for which numbers are available.
EMPLOYMENT & UNEMPLOYMENT TRENDS
KANSAS CITY
Q3 2015 Q3 2016 Q3 2017 FORECAST
NATIONAL UNEMPLOYMENT 5.1% 4.9% 4.4%
EMPLOYMENT (% Change) 2.1% 2.3% 1.3%
UNEMPLOYMENT RATE (%) 4.7% 4.4% 4.1%
a
Forecast is 12-month outlook
Source: Bureau of Labor Statistics
KANSAS CITY JOB GROWTH TRENDSEMPLOYMENT IN MILLIONS & JOB GROWTH (%)
0.0%
0.5%
1.0%
1.5%
2.0%
2.5%
3.0%
1,020
1,030
1,040
1,050
1,060
1,070
1,080
1,090
Q4 Q1 Q2 Q3
2015-2016 2016-2017 YOY % Job Growth

Previous Page Home Next Page
CINCINNATI/DAYTON COLUMBUS INDIANAPOLIS KANSAS CITY MINNEAPOLIS OMAHA ST. LOUIS TOLEDO
2KA N SAS C I T YMARKET INSIGHTThird Quarter 2017
-0.4%
-0.1%
1.4%
0.5%
1.4%
7.0%
13.1%13.9%
-5.0%
0.0%
5.0%
10.0%
15.0%
20.0%
Q4'16 Q1'17 Q2'17 Q3'17 1 Year(YOY)
3 Year 5 Year 5 YearForecast
Kansas City U.S.
H I S T O R I C A L F O R E C A S T
Effective rents moved slightly higher, driven in large part by the continued development of new, higher-priced units Downtown. Developments in the Central Business District, Crossroads, and the River Market should drive rates higher over the next 12 months.
The rate of growth for rent rates in Kansas City has been slowing. Over the past 12 months the growth rate in Kansas City was only 60.5% of the national average, while over the last five years Kansas City’s growth rate has been 74.4% of the national average. Forecasts show that over the next five years Kansas City growth rates should accelerate and come more in line with national trends.
For the 12-month period ending September 30, 2017, 8,660 units were completed and approximately 6,300 were under construction at the time. These rates are at all-time highs, but the overall rate of development has remained steady for at least 24 months.
The downtown urban revival remains the focus of new development, with over 3,700 units currently under construction in and around the area.
Kansas City’s population is projected to increase by almost 100,000 people over the next five years, while the percentage of renters is expected to remain steady at just over one-third of the total population.
The following are Cushman & Wakefield’s projections over the near term.
MULTIFAMILY TRENDS
HISTORICAL & FORECASTED METRO RENT GROWTH RATES
DEVELOPMENT / INVENTORY
DEMOGRAPHIC FUNDAMENTALSAverage effective rentincreased to $961.
Vacancy decreased to an
average of 4.2%.
+1.4 -118% Y O Y B P S Y O Y
2000: 1,811,2082010: 2,009,3402016: 2,093,4382021: 2,188,903
2010: 32.8% 2016: 34.0% 2021: 33.8%
2000: $45,9312010: $54,8752016: $58,5212021: $68,965
POPULATION
RENTER OCCUPIED
PERCENTAGE
MEDIAN FAMILY
INCOME
MULTIFAMILY FORECAST
VACANCYREN TS P IP EL INE % G ROWTH
Forecast is 12-month outlookSource: AXIOMetrics
KANSAS CITY RENT GROWTH RATES

Previous Page Home Next Page
CINCINNATI/DAYTON COLUMBUS INDIANAPOLIS KANSAS CITY MINNEAPOLIS OMAHA ST. LOUIS TOLEDO
3KA N SAS C I T YMARKET INSIGHTThird Quarter 2017
The volume of investment activity in the Kansas City market was strong through the first six months of the year, but the pace slowed in the third quarter. Year-to-date there has been $426.6 million in total transactions, which puts the market behind pace to match the five-year average of $639.3 million. However there were some encouraging signs during the third quarter.
The per-unit-price jumped up significantly in the third quarter, and three-quarters of the way through 2017, Class A and Class B transactions have accounted for 84.3% of the total number of units transacted. Increased investment in higher-end properties could quickly bring volume back in line with historical averages.
Class A – The most significant Class transaction of the third quarter was the Province of Briarcliff, which was purchased by Forum Real Estate Group for $18.8 million, or $156,000 per unit. A few years ago Northland Apartments trading at those values would have been a major surprise, but the last few years have seen a drastic increase in the value of apartments north of the river, especially those around Briarcliff.
Class B – A local partnership led by Jones Development Co. purchased a total of 588 units spread across five different complexes in Prairie Village, KS. The group now owns 73% of all apartments in the Kansas City suburb.
The spread of cap rates for the middle fifty percent of transactions was 5.8% to 6.6% for the twelve months ending September 30, 2017. The median cap rate during that period of time was 6.0%.
INVESTMENT ACTIVITY
NOTABLE SALES
MOST ACTIVE MARKET PLAYERS
PRICING & CAP RATES
TOP FIVE KANSAS CITY BUYERS - YTD 2017
Source: Real Capital Analytics
TOP FIVE KANSAS CITY SELLERS - YTD 2017
RANK BUYER TOTAL VOLUME NO. TRANSACTIONS
1 CRES Management $70,083,000 1
2 PRG Managment $58,250,000 1
3 BH Managment Services, LLC $55,550,000 2
4 Fogelman Management Group $48,100,000 1
5 Starwood Capital $42,800,000 1
RANK SELLER TOTAL VOLUME NO. TRANSACTIONS
1 MAA REIT $70,083,000 1
2 Somerset Partners $58,250,000 1
3 Preferred Apartment Comm. $48,100,000 1
4 Milestone Apartments REIT $42,800,000 1
5 Banner Apartments $28,000,000 1
Source: Real Capital Analytics
$0
$100
$200
$300
$400
$500
$600
$700
$800
$900
2011 2012 2013 2014 2015 2016 YTD 2017
Transaction Volume Historic Average
(in m
illio
ns)
$221
,495
$150
,210
$85,
558
$178
,247
$171
,247
$ 86,
624
$44,
317
$47,
201
$68,
464
$79,
372
$ 21,1
79
$19,
928
$29,
251
$23,
177
$22,
875
$0
$50,000
$100,000
$150,000
$200,000
$250,000
2013 2014 2015 2016 YTD '17
Class A Class B Class C
Source: Real Capital Analytics, Cushman & Wakefield Research

Previous Page Home Next Page
CINCINNATI/DAYTON COLUMBUS INDIANAPOLIS KANSAS CITY MINNEAPOLIS OMAHA ST. LOUIS TOLEDO
4KA N SAS C I T YMARKET INSIGHTThird Quarter 2017
SUBMARKET OVERVIEW SELECT SUBMARKET NEWS
Downtown Area
• Work is now getting started on new apartments near the Berkley Riverfront. Additionally, plans are moving forward on an extension for the KC Streetcar to serve the area, which could accelerate even more development.
Plaza & Midtown
• Renovations have been completed at Plaza Club City Apartments near the Country Club Plaza. The total investment in upgrading the complex was over $7 million and included substantial upgrades to the common space amenities along with improvements to the units.
North Johnson County
• Jones Development Co. led a group of investors that purchased a total of 588 units at Kenilworth Apartments, Corinth Place, Corinth Paddock, Corinth Gardens, and Corith Mission Valley. The price has not yet been disclosed and upgrades and rebranding are planned for the near future, but the group now owns 73% of all the apartments in Prairie Village.
South Johnson County
• After suffering a construction fire earlier this year, work is continuing on the mixed-use development at CityPlace. The fire has not caused any significant setbacks and residents are continuing to move into the 205-unit Royale View.
East & Southeast Jackson County
• The Manor Homes of Arborwalk were part of a national portfolio purchase by Starwood Capital. The 280-unit Lee’s Summit property was valued at $42.8 million.
RENTS & VACANCY BY SUBMARKET
UNDER CONSTRUCTION BY SUBMARKET
Source: AXIOMetrics, Cushman & Wakefield ResearchNote: Submarkets are defined by Cushman & Wakefield Research
$804
$977
$832
$1,125
$1,490
$959
$909
$865
$956
$803
$830
$963
$709
$1,107
$1,237
$877
$695
Wyandotte County
Western 435
South Kansas City
South Johnson County
Plaza
Olathe
North Kansas City
North Johnson County
Midtown
Independence
I-35 Northland
I-29 Northland
Eastern 435
East & SE Jackson County
Downtown
College Boulevard
Brookside & Waldo
7.8%
4.6%
5.8%
5.2%
8.5%
3.6%
5.3%
3.8%
4.0%
5.4%
6.0%
8.0%
6.5%
2.5%
6.6%
4.6%
7.9%
Wyandotte County
Western 435
South Kansas City
South Johnson County
Plaza
Olathe
North Kansas City
North Johnson County
Midtown
Independence
I-35 Northland
I-29 Northland
Eastern 435
East & SE Jackson County
Downtown
College Boulevard
Brookside & Waldo
1,026
3,704
646
315 292 337
1,168
547
0
500
1,000
1,500
2,000
2,500
3,000
3,500
4,000
Overland ParkNorth
Downtown East & SEJacksonCounty
I-29 NorthlandI-35 Northland Plaza & SouthKC
Western 435 Plaza

MINNEAPOLIS

Previous Page Home Next Page
CINCINNATI/DAYTON COLUMBUS INDIANAPOLIS KANSAS CITY MINNEAPOLIS OMAHA ST. LOUIS TOLEDO
MARKET INSIGHTMINNEAPOLIS MULTIFAMILY REPORT | THIRD QUARTER 2017
CUSHMAN & WAKEFIELD MINNEAPOLIS MULTIFAMILY RESEARCH
The Cushman & Wakefield Multifamily Research Team provides in-depth coverage of the Minneapolis Metropolitan Statistical Area. In addition to analyzing multifamily rent and sale trends, these reports examine employment data, key economic announcements, and development pipeline news.
MARKET TEAM
IN THIS EDITION
ROBERT DULINSENIOR ASSOCIATE, CAPITAL [email protected]
LANCE STEIGERSENIOR DIRECTOR, CAPITAL [email protected]
SouthwestSouthwest
NorthwestNorthwest
SoutheastSoutheast
NortheastNortheast
SouthSouthCentralCentral
NorthNorthCentralCentral
MinneapolisMinneapolis
MinneapolisMinneapolisCBDCBD Saint PaulSaint Paul
Saint PaulSaint PaulCBDCBD
!"b$
!"b$
%&h(
%&h(
%&f(
%&f(
%&f(
%&f(
%&e(
!"b$ !"b$!"b$
%&d(
%&d(
%&d(
%&d(
%&c(
%&c(
%&c(
%&c(
)y
)y
)y
)y
!"�$
)n
)z
?�A@
?�A@
?�A@
)m
?�A@
?�A@
?�A@
?�A@
?�A@
?ØA@
?�A@
)p
)s
)p
)s
?'A@
?�A@
)s?�A@
?�A@
!"b$
S�
► Minneapolis
► Minneapolis - DT
► St. Paul
► St. Paul - DT
► North Central
► South Central
► Northwest Metro
► Southwest Metro
► Northeast Metro
► Southeast Metro

Previous Page Home Next Page
CINCINNATI/DAYTON COLUMBUS INDIANAPOLIS KANSAS CITY MINNEAPOLIS OMAHA ST. LOUIS TOLEDO
1MINNEAPOLISMARKET INSIGHTThird Quarter 2017
The following are select announcements from third quarter 2017:
• Minneapolis is in an economic expansion phase with job growth rates projected at 1.1% to 1.6% annually through 2019.
• Fortune 500 companies are expected to continue to fuel in-migration, attracting candidates from other markets such as Chicago, St. Cloud, and Duluth due to the metro’s tight labor market.
• In addition to healthcare and technology, the logistics sector is projected to drive future growth with Amazon’s growing presence.
Average Q3 employment increased by 39,450 jobs.
Average Q3 unemployment decreased to 3.5%.
+2.0 -10% Y O Y B P S Y O Y
ECONOMIC EXPANSION
OUTLOOKJOB GROWTH & UNEMPLOYMENT RATE
St. Paul City Council approved the master plan and zoning layout for the 135-acre former Ford Assembly Plant. The redevelopment is expected to provide 1,500 jobs.
Minnesota United FC, a North America Soccer League team, broke ground on the 20,000 seat Allianz field at I-94 and Snelling Avenue in St. Paul. The stadium is the beginning of a 34.5 acre urban village redevelopment that includes retail, residential and open space.
Emerson Automated Solutions recently completed a $10 million renovation in Shakopee, adding 100 jobs. They also announced a $14 million conversion project in Chanhassen, adding another 80 jobs.
Calyxt broke ground on a new 40,000 square foot headquarters in Roseville and expect to add 100 jobs.
The Minneapolis MSA added more than 39,450 net jobs year-over-year per BLS’ third quarter 2017 average. . The Education & Health Services sector led job growth with a 4.4% increase from September 2016 to September 2017. The unemployment rate in Minneapolis continues to trend well below the U.S. rate due to the market’s highly educated workforce and the presence of corporate headquarters such as UnitedHealth Group, Target, Best Buy, and 3M.
EMPLOYMENT & UNEMPLOYMENT TRENDS
MINNEAPOLIS JOB GROWTH TRENDS
0.0%
0.5%
1.0%
1.5%
2.0%
2.5%
3.0%
1.90
1.92
1.94
1.96
1.98
2.00
2.02
Q4 Q1 Q2 Q3
2015-2016 2016-2017 YOY % Job Growth
MINNEAPOLIS, MN
Q3 2015 Q3 2016 Q3 2017 FORECAST
NATIONAL UNEMPLOYMENT 5.1% 4.9% 4.4%
EMPLOYMENT (% Change) 1.6% 2.0% 2.0%
UNEMPLOYMENT RATE (%) 3.5% 3.6% 3.5%
Forecast is 12-month outlook
EMPLOYMENT IN MILLIONS & JOB GROWTH (%)
Source: Moody’s Analytics
Previous Page Home Next Page
CINCINNATI/DAYTON COLUMBUS INDIANAPOLIS KANSAS CITY MINNEAPOLIS OMAHA ST. LOUIS TOLEDO
3MINNEAPOLISMARKET INSIGHTThird Quarter 2017
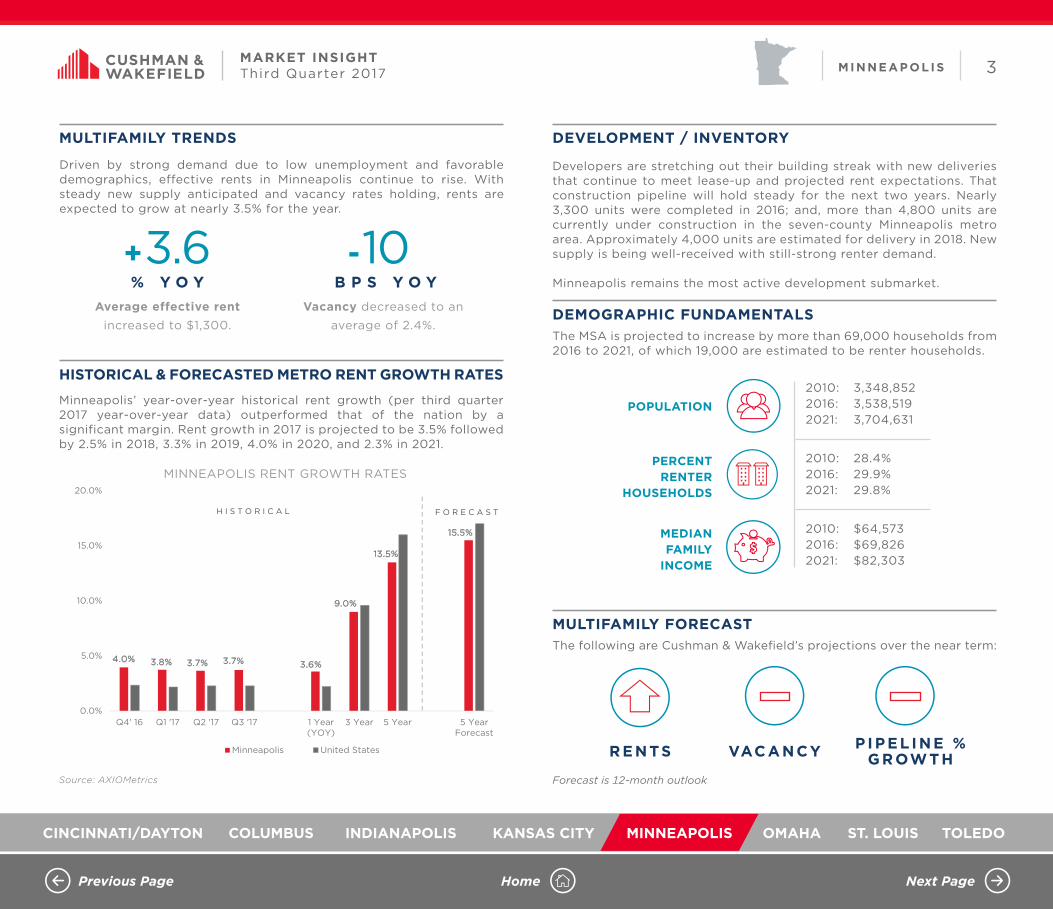
Driven by strong demand due to low unemployment and favorable demographics, effective rents in Minneapolis continue to rise. With steady new supply anticipated and vacancy rates holding, rents are expected to grow at nearly 3.5% for the year.
Minneapolis’ year-over-year historical rent growth (per third quarter 2017 year-over-year data) outperformed that of the nation by a significant margin. Rent growth in 2017 is projected to be 3.5% followed by 2.5% in 2018, 3.3% in 2019, 4.0% in 2020, and 2.3% in 2021.
Developers are stretching out their building streak with new deliveries that continue to meet lease-up and projected rent expectations. That construction pipeline will hold steady for the next two years. Nearly 3,300 units were completed in 2016; and, more than 4,800 units are currently under construction in the seven-county Minneapolis metro area. Approximately 4,000 units are estimated for delivery in 2018. New supply is being well-received with still-strong renter demand.
Minneapolis remains the most active development submarket.
The MSA is projected to increase by more than 69,000 households from 2016 to 2021, of which 19,000 are estimated to be renter households.
The following are Cushman & Wakefi eld’s projections over the near term:
MULTIFAMILY TRENDS
HISTORICAL & FORECASTED METRO RENT GROWTH RATES
DEVELOPMENT / INVENTORY
DEMOGRAPHIC FUNDAMENTALSAverage effective rentincreased to $1,300.
Vacancy decreased to an
average of 2.4%.
4.0% 3.8% 3.7% 3.7% 3.6%
9.0%
13.5%
15.5%
0.0%
5.0%
10.0%
15.0%
20.0%
Q4' 16 Q1 '17 Q2 '17 Q3 '17 1 Year(YOY)
3 Year 5 Year 5 YearForecast
Minneapolis United States
H I S T O R I C A L F O R E C A S T
MINNEAPOLIS RENT GROWTH RATES
+3.6 -10% Y O Y B P S Y O Y
2010: 3,348,8522016: 3,538,5192021: 3,704,631
2010: 28.4%2016: 29.9%2021: 29.8%
2010: $64,5732016: $69,8262021: $82,303
POPULATION
PERCENTRENTER
HOUSEHOLDS
MEDIANFAMILY
INCOME
MULTIFAMILY FORECAST
VAC ANCYRENTS PI PEL I NE % G ROW T H
Source: AXIOMetrics Forecast is 12-month outlook
Previous Page Home Next Page
CINCINNATI/DAYTON COLUMBUS INDIANAPOLIS KANSAS CITY MINNEAPOLIS OMAHA ST. LOUIS TOLEDO
4MINNEAPOLISMARKET INSIGHTThird Quarter 2017
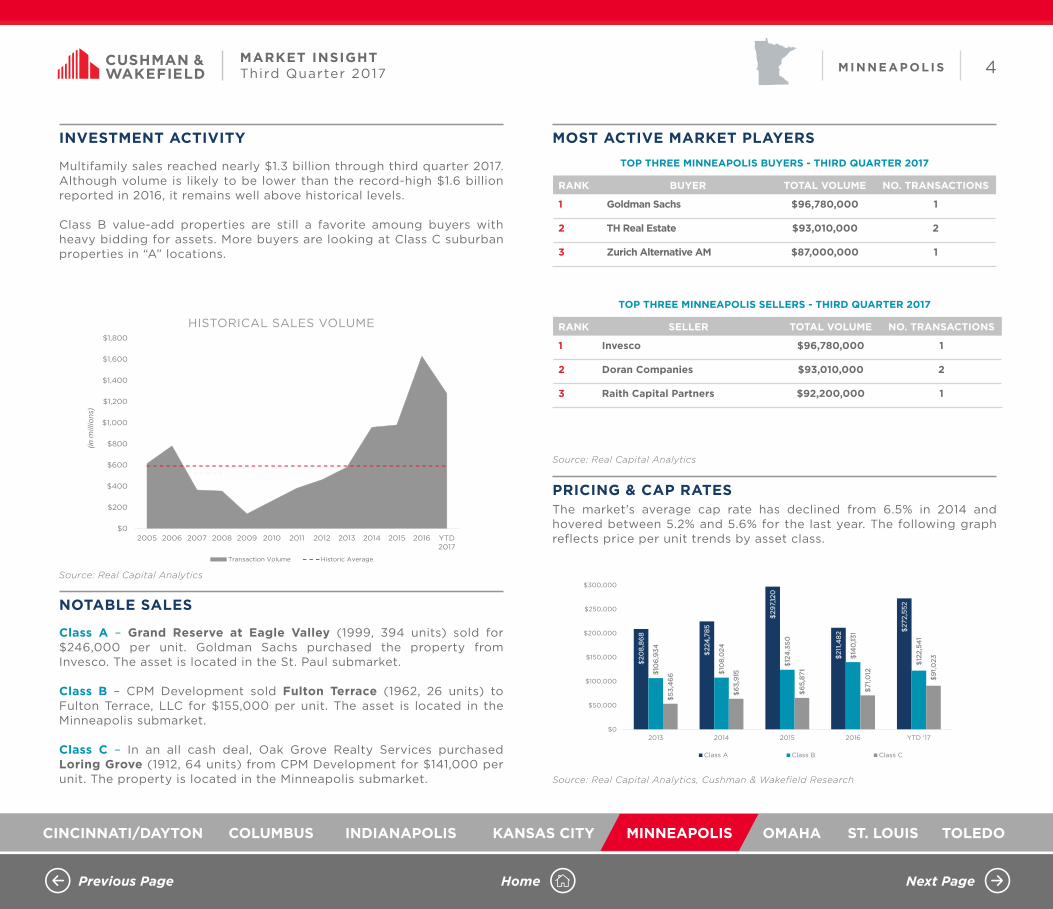
Multifamily sales reached nearly $1.3 billion through third quarter 2017. Although volume is likely to be lower than the record-high $1.6 billion reported in 2016, it remains well above historical levels.
Class B value-add properties are still a favorite amoung buyers with heavy bidding for assets. More buyers are looking at Class C suburban properties in “A” locations.
Class A – Grand Reserve at Eagle Valley (1999, 394 units) sold for $246,000 per unit. Goldman Sachs purchased the property from Invesco. The asset is located in the St. Paul submarket.
Class B – CPM Development sold Fulton Terrace (1962, 26 units) to Fulton Terrace, LLC for $155,000 per unit. The asset is located in the Minneapolis submarket.
Class C – In an all cash deal, Oak Grove Realty Services purchased Loring Grove (1912, 64 units) from CPM Development for $141,000 per unit. The property is located in the Minneapolis submarket.
The market’s average cap rate has declined from 6.5% in 2014 and hovered between 5.2% and 5.6% for the last year. The following graph reflects price per unit trends by asset class.
INVESTMENT ACTIVITY
NOTABLE SALES
MOST ACTIVE MARKET PLAYERS
PRICING & CAP RATES
$0
$200
$400
$600
$800
$1,000
$1,200
$1,400
$1,600
$1,800
2005 2006 2007 2008 2009 2010 2011 2012 2013 2014 2015 2016 YTD2017
Transaction Volume Historic Average
(inm
illio
ns)
$2
08
,86
8
$22
4,7
85
$29
7,12
0
$21
1,4
82
$27
2,5
52
$10
6,9
34
$10
8,0
24
$12
4,3
50
$14
0,13
1
$12
2,5
41
$5
3,4
66
$6
3,9
15
$6
5,8
71
$7
1,0
12
$9
1,0
23
$0
$50,000
$100,000
$150,000
$200,000
$250,000
$300,000
2013 2014 2015 2016 YTD '17
Class A Class B Class C
TOP THREE MINNEAPOLIS BUYERS - THIRD QUARTER 2017
Source: Real Capital Analytics
TOP THREE MINNEAPOLIS SELLERS - THIRD QUARTER 2017
HISTORICAL SALES VOLUME
RANK BUYER TOTAL VOLUME NO. TRANSACTIONS
1 Goldman Sachs $96,780,000 1
2 TH Real Estate $93,010,000 2
3 Zurich Alternative AM $87,000,000 1
RANK SELLER TOTAL VOLUME NO. TRANSACTIONS
1 Invesco $96,780,000 1
2 Doran Companies $93,010,000 2
3 Raith Capital Partners $92,200,000 1
Source: Real Capital Analytics, Cushman & Wakefield Research
Source: Real Capital Analytics
Previous Page Home Next Page
CINCINNATI/DAYTON COLUMBUS INDIANAPOLIS KANSAS CITY MINNEAPOLIS OMAHA ST. LOUIS TOLEDO
5MINNEAPOLISMARKET INSIGHTThird Quarter 2017
SUBMARKET OVERVIEW SELECT SUBMARKET NEWS
RENTS & VACANCY BY SUBMARKET
Minneapolis - Uptown
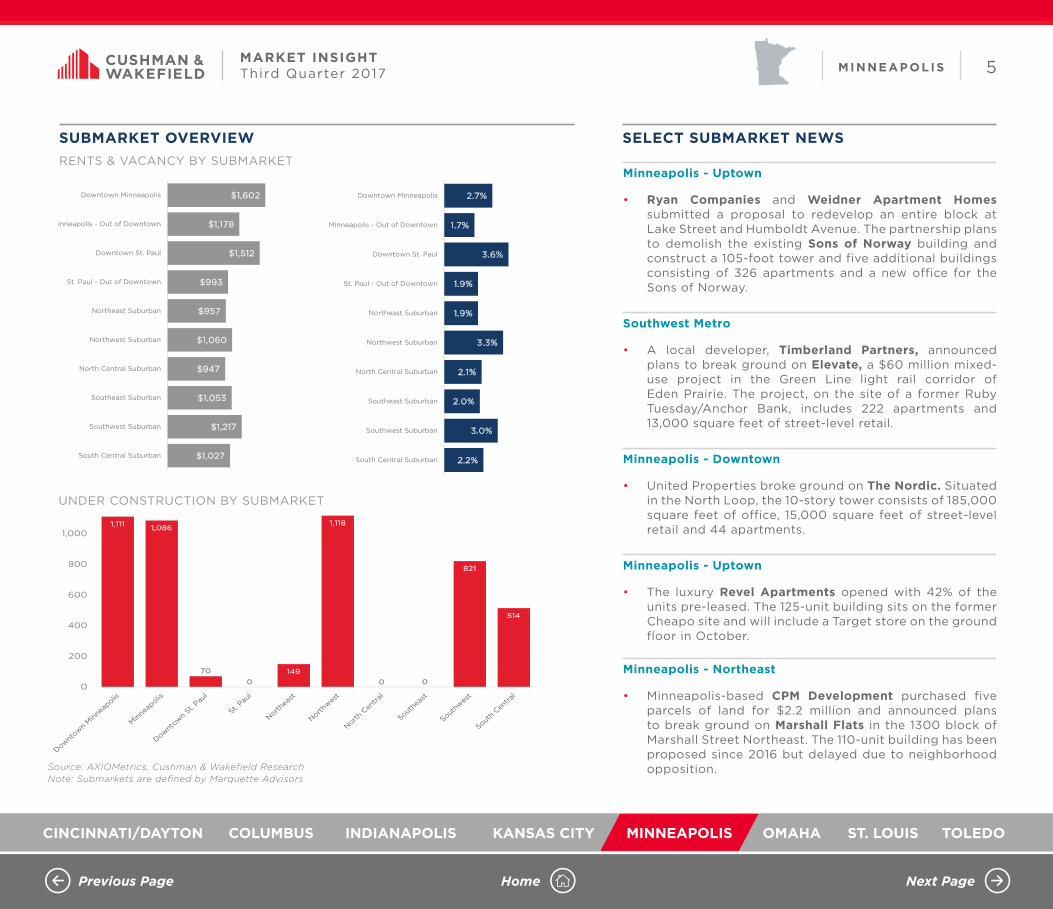
• Ryan Companies and Weidner Apartment Homes submitted a proposal to redevelop an entire block at Lake Street and Humboldt Avenue. The partnership plans to demolish the existing Sons of Norway building and construct a 105-foot tower and five additional buildings consisting of 326 apartments and a new office for the Sons of Norway.
Southwest Metro
• A local developer, Timberland Partners, announced plans to break ground on Elevate, a $60 million mixed-use project in the Green Line light rail corridor of Eden Prairie. The project, on the site of a former Ruby Tuesday/Anchor Bank, includes 222 apartments and 13,000 square feet of street-level retail.
Minneapolis - Downtown
• United Properties broke ground on The Nordic. Situated in the North Loop, the 10-story tower consists of 185,000 square feet of office, 15,000 square feet of street-level retail and 44 apartments.
Minneapolis - Uptown
• The luxury Revel Apartments opened with 42% of the units pre-leased. The 125-unit building sits on the former Cheapo site and will include a Target store on the ground floor in October.
Minneapolis - Northeast
• Minneapolis-based CPM Development purchased five parcels of land for $2.2 million and announced plans to break ground on Marshall Flats in the 1300 block of Marshall Street Northeast. The 110-unit building has been proposed since 2016 but delayed due to neighborhood opposition.
$1,027
$1,217
$1,053
$947
$1,060
$957
$993
$1,512
$1,178
$1,602
South Central Suburban
Southwest Suburban
Southeast Suburban
North Central Suburban
Northwest Suburban
Northeast Suburban
St. Paul - Out of Downtown
Downtown St. Paul
inneapolis - Out of Downtown
Downtown Minneapolis
2.2%
3.0%
2.0%
2.1%
3.3%
1.9%
1.9%
3.6%
1.7%
2.7%
South Central Suburban
Southwest Suburban
Southeast Suburban
North Central Suburban
Northwest Suburban
Northeast Suburban
St. Paul - Out of Downtown
Downtown St. Paul
Minneapolis - Out of Downtown
Downtown Minneapolis
RENTS & VACANCY BY SUBMARKET
1,111 1,086
70
0149
1,118
0 0
821
514
0
200
400
600
800
1,000
UNDER CONSTRUCTION BY SUBMARKET
Source: AXIOMetrics, Cushman & Wakefield ResearchNote: Submarkets are defined by Marquette Advisors

OMAHA METRO

Previous Page Home Next Page
CINCINNATI/DAYTON COLUMBUS INDIANAPOLIS KANSAS CITY MINNEAPOLIS OMAHA ST. LOUIS TOLEDO
1MARKET INSIGHTThird Quarter 2017 OMA HA MET RO
The following are metro area expansion announcements as of third quarter 2017:
Average Q3 employment increased by 8,800 jobs.
Average Q3 unemployment decreased to 2.9%.
ECONOMIC EXPANSION
JOB GROWTH & UNEMPLOYMENT RATE
Work began on the initial stages of a $1.2 billion Boys Town development that will eventually feature 2.3 million square feet of commercial space, 2,000 residences, and a food, dining and retail area. The property includes land formerly occupied by a Boys Town farm near 144th Street and West Dodge. As planned, the nearly 500 acres of undeveloped land west of historic Boys Town would showcase a food and dining plaza, a retail center and an entertainment hub for live bands and festivals. The $370 million Buffett Cancer Center opened in June 2017 as part of the Nebraska Medicine campus is adding 4,657 new jobs. The 615,000-square-foot facility is a joint venture between the University of Nebraska Medical Center and clinical partner Nebraska Medicine that will pull all cancer-related functions — research, outpatient and inpatient — together under one roof.
The $205 million Capital District is Omaha’s newest downtown entertainment district. The District surrounds a technology-smart, modern town square and will feature a 218-unit high rise apartment tower, a full-service 333-room Marriott hotel, Class A office space, plenty of adjacent parking and over 20 diverse restaurants and bars – all within walking distance of Omaha’s best civic, cultural and entertainment venues and the Riverfront.
a
a
a
Average effective rent growth year-over-year as of the third quarter slowed a bit to the 1.6% range. Vacancy increased by a nominal amount year-over-year and remained below 5.0% as of the third quarter. Rents are projected to increase by 13.3% from 2017 to 2022 per AXIOMetrics, with an average annual rate of 2.7%. This trend is in line with current rent growth trends in the market.
MULTIFAMILY TRENDS
Average effective rentincreased to $884.
Vacancy decreased to an
average of 4.0%.
+1.6 +.68% Y O Y B P S Y O Y
The Omaha–Council Bluffs Metro added approximately 8,800 new jobs from third quarter 2016 to third quarter 2017. The major job producers as of September 2017 are Professional & Business Services and Education & Health Services. Omaha’s unemployment rate is very low at 2.9% - 150 basis points below that of the nation - indicating that the metro is experiencing a tight labor market.
EMPLOYMENT & UNEMPLOYMENT TRENDS
OMAHA JOB GROWTH TRENDS
0.0%
0.2%
0.4%
0.6%
0.8%
1.0%
1.2%
1.4%
1.6%
1.8%
2.0%
400
420
440
460
480
500
520
540
Q4 Q1 Q2 Q3
OMAHA/COUNCIL BLUFFS JOB GROWTH TRENDSEMPLOYMENT IN THOUSANDS
2015-2016 2016-2017 YOY % Job Growth
+1.8 -50% Y O Y B P S Y O Y
OMAHA - COUNCIL BLUFFS
Source: U.S. Bureau of Labor Statistics (BLS)

Previous Page Home Next Page
CINCINNATI/DAYTON COLUMBUS INDIANAPOLIS KANSAS CITY MINNEAPOLIS OMAHA ST. LOUIS TOLEDO
2MARKET INSIGHTThird Quarter 2017 OMA HA MET RO
The Omaha Market has continued to heat up through the third quarter. Transaction volume on a unit basis is up substantially over 2016, with a 2017 year-to-date total of 2,120 units compared to just over 1,200 units in 2016. A total of 882 units traded in the third quarter alone. The pipeline of product under contract, on the market, and coming to the market has the Omaha MSA tracking toward a 3,000-unit year. Cap rates have remained low despite the increased supply, hovering between 6.0% and 7.0% depending upon the class, condition, and age of the asset. Notably, Willow Creek (1998, 156 units) had the low trailing cap of the third quarter at 6.38%, and Fox Ridge (1988, 120 units) had the high trailing cap of the third quarter at 7.42%.
There are six notable properties under construction or in lease up competing for tenants in the downtown market, totaling more than 1,000 total new units: Capital District (218 units), The Breakers (214 units), Zag Apartments (193 units), The Conrad (153 units), The Triangle (134 units), The Yard (101 units). Suburban Omaha has fewer but larger projects, with 752 units under construction in two projects. Andover Pointe is finishing up Phase II, adding 390 units to the southwest Omaha market near 132nd and Chandler. The Lumberyard in Millard is finishing up its 346 units, completing the mixed-use redevelopment project.
INVESTMENT ACTIVITY & CAP RATES
DEVELOPMENT / INVENTORY NOTABLE SALES
REGIONAL SALES VOLUME / CAP RATES
The following are Cushman & Wakefield’s projections for the near term.
DEMOGRAPHIC FUNDAMENTALS
2000: 767,0522010: 865,3542017: 917,5172022: 960,358
2010: 33.2%2016: 33.9%2021: 33.4%
2000: $44,6742010: $55,4072016: $56,9592021: $68,079
POPULATION
RENTER OCCUPIED
PERCENTAGE
MEDIAN HOUSEHOLD
INCOME
MULTIFAMILY FORECAST
VACANCYREN TS P IP EL INE % G ROWTH
Forecast is 12-month outlook
PricePerUnit(avg.)CapRate(avg.)2010 $47,312 6.46% The Region is experiencing a cultural shift , where people are moving to revitalized downtown areas that offer live/work/play environments not typically seen in smaller Midwest metros.2011 $53,135 8.96% Market Velocity is up and transaction volume in units sold for 2017 YTD (2,120) has surpassed 2016 (1,200), with an additional 1,271+ units under contract and set to close in Q4 20172012 $53,814 7.18% Absorption remains steady, but concessions are up in the downtown areas due the amount of new product delivered and under construction, suburban rents remain steady and strong2013 $49,643 7.63%2014 $57,596 7.40%2015 $65,068 7.99%2016 $80,377 7.03%
2017 YTD $72,376 6.63%
0.00%
1.00%
2.00%
3.00%
4.00%
5.00%
6.00%
7.00%
8.00%
9.00%
10.00%
$0
$10,000
$20,000
$30,000
$40,000
$50,000
$60,000
$70,000
$80,000
$90,000
2010 2011 2012 2013 2014 2015 2016 2017 YTD
Regional Sale Price Per Unit / Cap Rate
Price Per Unit (avg.) Cap Rate (avg.)
The Region is experiencing a cultural shift , where people are moving to revitalized downtown areas that offer live/work/play environments not typically seen in smaller Midwest metros.Market Velocity is up and transaction volume in units sold for 2017 YTD (2,120) has surpassed 2016 (1,200), with an additional 1,271+ units under contract and set to close in Q4 2017Absorption remains steady, but concessions are up in the downtown areas due the amount of new product delivered and under construction, suburban rents remain steady and strong
PROPERTY YEAR BUILT
BUYER SELLER # OF UNITS
PURCHASE PRICE
PRICE PER UNIT
Maple View 1991 Briar Capital Maxx 108 $6,270,000 $58,056
Fox Valley 1997 Briar Capital Maxx 228 $14,980,000 $65,702
Willow Creek 1998 Briar Capital Maxx 156 $8,420,000 $53,974
Edgewater Court 1975 Briar Capital Maxx 108 $6,270,000 $58,056
Fox Ridge 1988 Briar Capital Maxx 120 $6,175,000 $51,458
Howard Street 1986 Briar Capital Maxx 90 $4,659,000 $51,767
Briar Hills 1999 JB Group NewStreet 72 $6,550,000 $90,972
Median household income rose by 24.0% from 2000 to 2010. It is projected to increase by another 19.5% from 2016 to 2021, thereby fueling future rent growth in the market.
Source: CoStar
Source: Site To Do Business

ST. LOUIS

Previous Page Home Next Page
CINCINNATI/DAYTON COLUMBUS INDIANAPOLIS KANSAS CITY MINNEAPOLIS OMAHA ST. LOUIS TOLEDO
MARKET INSIGHTST. LOUIS MULTIFAMILY REPORT | THIRD QUARTER 2017
CUSHMAN & WAKEFIELD ST. LOUIS MULTIFAMILY RESEARCH
The Cushman & Wakefield Multifamily Research Team provides in-depth coverage of the St. Louis Metropolitan Statistical Area. In addition to analyzing multifamily rent and sale trends, these reports examine employment data, key economic announcements, and development pipeline news.
MARKET TEAM
IN THIS EDITION
NORTH COUNTY
67
67
67
67
61
61
61
94
94
94
94
94
47
47
47
100
100
50
94
141
141
141
141
364
364
141
ST. CHARLES COUNTY
JEFFERSON COUNTY
CHESTERFIELD
MARYLAND HEIGHTS / CREVE COEUR
BALLWIN
KIRKWOODSOUTH
SOUTH ST. LOUIS CITY
RICHMOND HEIGHTS
CLAYTONCBD
CENTRAL WEST END DOWNTOWNCBD
NORTHST. LOUIS CITY
UNIVERSITY CITY
OLIVETTE
METROEAST
170
270
270
70
70
70
270
64
64
70
270
70
44
44
44
44
64
44
44
270270
55
70 55
64
64
255
255
255
255
255
170
70
370
370
21
55
55
55
64
64
64
70
70
Downton Clayton
Downtown CBD
St. Louis City
Mid County
West County
St. Charles County
North County
South County
Metro East
BOBBY MILLSASSOCIATE, CAPITAL [email protected]
PAUL HILTONEXECUTIVE DIRECTOR, CAPITAL [email protected]
MICHAEL HANRAHANEXECUTIVE DIRECTOR, CAPITAL [email protected]
BRENDAN DUNBARST. LOUIS RESEARCH [email protected]
Previous Page Home Next Page
CINCINNATI/DAYTON COLUMBUS INDIANAPOLIS KANSAS CITY MINNEAPOLIS OMAHA ST. LOUIS TOLEDO
2MARKET INSIGHTThird Quarter 2017 ST. LOUI S
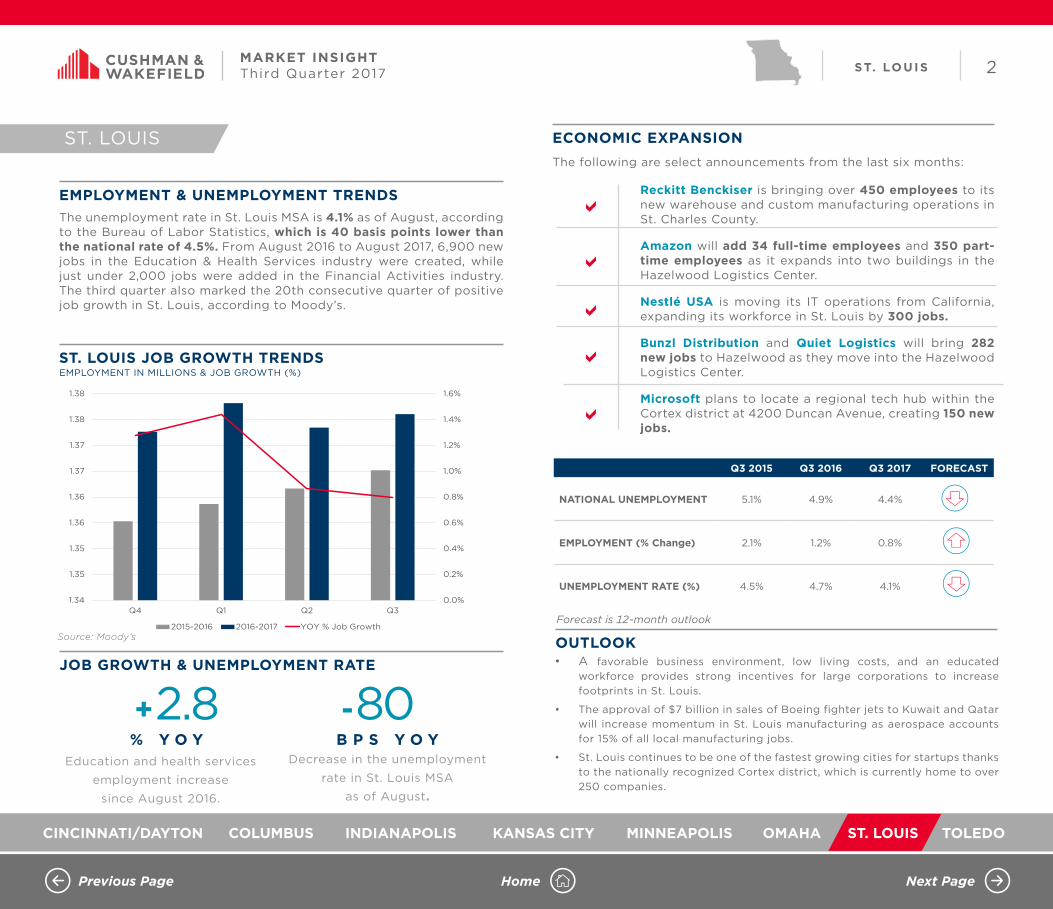
The following are select announcements from the last six months:
• A favorable business environment, low living costs, and an educated workforce provides strong incentives for large corporations to increase footprints in St. Louis.
• The approval of $7 billion in sales of Boeing fighter jets to Kuwait and Qatar will increase momentum in St. Louis manufacturing as aerospace accounts for 15% of all local manufacturing jobs.
• St. Louis continues to be one of the fastest growing cities for startups thanks to the nationally recognized Cortex district, which is currently home to over 250 companies.
Education and health services
employment increase
since August 2016.
Decrease in the unemployment
rate in St. Louis MSA
as of August.
+2.8 -80% Y O Y B P S Y O Y
ECONOMIC EXPANSION
OUTLOOKJOB GROWTH & UNEMPLOYMENT RATE
Reckitt Benckiser is bringing over 450 employees to its new warehouse and custom manufacturing operations in St. Charles County.
Amazon will add 34 full-time employees and 350 part-time employees as it expands into two buildings in the Hazelwood Logistics Center.
Nestlé USA is moving its IT operations from California, expanding its workforce in St. Louis by 300 jobs.
Bunzl Distribution and Quiet Logistics will bring 282 new jobs to Hazelwood as they move into the Hazelwood Logistics Center.
Microsoft plans to locate a regional tech hub within the Cortex district at 4200 Duncan Avenue, creating 150 new jobs.
a
a
a
a
The unemployment rate in St. Louis MSA is 4.1% as of August, according to the Bureau of Labor Statistics, which is 40 basis points lower than the national rate of 4.5%. From August 2016 to August 2017, 6,900 new jobs in the Education & Health Services industry were created, while just under 2,000 jobs were added in the Financial Activities industry. The third quarter also marked the 20th consecutive quarter of positive job growth in St. Louis, according to Moody’s.
EMPLOYMENT & UNEMPLOYMENT TRENDS
ST. LOUIS JOB GROWTH TRENDS
0.0%
0.2%
0.4%
0.6%
0.8%
1.0%
1.2%
1.4%
1.6%
1.34
1.35
1.35
1.36
1.36
1.37
1.37
1.38
1.38
Q4 Q1 Q2 Q3
ST. LOUIS JOB GROWTH TRENDS EMPLOYMENT IN MILLIONS
2015-2016 2016-2017 YOY % Job Growth
ST. LOUIS
Q3 2015 Q3 2016 Q3 2017 FORECAST
NATIONAL UNEMPLOYMENT 5.1% 4.9% 4.4%
EMPLOYMENT (% Change) 2.1% 1.2% 0.8%
UNEMPLOYMENT RATE (%) 4.5% 4.7% 4.1%
a
Forecast is 12-month outlook
EMPLOYMENT IN MILLIONS & JOB GROWTH (%)
Source: Moody’s

Previous Page Home Next Page
CINCINNATI/DAYTON COLUMBUS INDIANAPOLIS KANSAS CITY MINNEAPOLIS OMAHA ST. LOUIS TOLEDO
3MARKET INSIGHTThird Quarter 2017 ST. LOUI S
Effective rents in the third quarter reached $959, a 7.0% increase over the last two years. The third quarter marks the 30th consecutive quarter of positive effective rent growth according to AXIOMetrics.
The St. Louis market experienced strong rent growth over the last three years with an average annual increase in rates of 2.6%. Over the next five years, rates are expected to grow around 2.7% annually on average. This is slightly higher than average annual growth over the previous five years of 2.6%.
More than 3,700 units are under construction in the St. Louis Area, led by the Central West End with over 1,300 units under construction. Other strong submarkets include Downtown Clayton and Chesterfield, with 349 and 345 units under construction, respectively. Close to 2,000 deliveries are expected by the end of the year, according to CoStar. While new construction, such as the development at 32 N. Euclid Ave, dominates the Central West End, the redevelopment of aging office buildings in Downtown St. Louis has increased considerably in the past few years. This redevelopment activity is heavily reliant on favorable tax incentives offered by the city.
The St. Louis Area continues to be an attractive market for residents as it ranks as the 37th most afforable single family market out of 211 markets.
The following are Cushman & Wakefield’s projections over the near term.
MULTIFAMILY TRENDS
HISTORICAL & FORECASTED METRO RENT GROWTH RATES
DEVELOPMENT / INVENTORY
DEMOGRAPHIC FUNDAMENTALSEffective rate growth from 3Q
2015 to 3Q 2017.
Vacancy decreased since the
beginning of 2016.
1.9% 1.9%
1.1% 1.1% 1.5%
2.6% 2.6% 2.7%
0.0%
1.0%
2.0%
3.0%
4.0%
5.0%
6.0%
7.0%
Q4 '16 Q1 '17 Q2 '17 Q3 '17 1 Year 3 Year(Avg Annual Change)
5 Year 5 YearForecast
(Avg Annual Change)
ST. LOUIS RENT GROWTH RATES HISTORICAL AND FORECAST
St. Louis United States
Quarterly vs. Annual H I S T O R I C A L
F O R E C A S T
ST. LOUIS RENT GROWTH RATES
+3.7 -50% Y O Y B P S
2000: 2,675,2962010: 2,787,7042016: 2,819,2492021: 2,893,983
2010: 29.4%2016: 30.1%2021: 29.9%
2000: $44,2562010: $52,4872016: $56,6762021: $67,192
POPULATION
MEDIANFAMILY
INCOME
RENTER OCCUPIED
PERCENTAGE
MULTIFAMILY FORECAST
VACANCYREN TS P IP EL INE % G ROWTH
Source: AXIOMetrics Forecast is 12-month outlook

Previous Page Home Next Page
CINCINNATI/DAYTON COLUMBUS INDIANAPOLIS KANSAS CITY MINNEAPOLIS OMAHA ST. LOUIS TOLEDO
4MARKET INSIGHTThird Quarter 2017 ST. LOUI S
RANK SELLER TOTAL VOLUME NO. TRANSACTIONS
1 Kayne Anderson Real Estate Advisors $67,000,000 1
2 Cullinan Properties $59,500,000 1
3 The Lipton Group $47,700,000 1
4 Covington Realty Partners $39,600,000 1
5 Urban Street/NA Properties $35,000,000 2
RANK BUYER TOTAL VOLUME NO. TRANSACTIONS
1 Strategic Properties of NA/BRT
Apartments
$74,600,000 3
2 Mapletree U.S. Management $67,000,000 1
3 FPA Multifamily $62,800,000 3
4 Trilogy Real Estate Group $59,500,000 1
5 Monarch $31,650,000 1
2017 cumulative sales volume in the St. Louis area through the third quarter was $490.9 million, according to Real Capital Analytics. Private investors made up 74% of investment purchases thus far in 2017, while Public Listed/REITs and Institutional investors made up 22% of investment activity. Public Listed/REITs were not active in the market in 2016 and only made up 7% of activity in 2015. International buyers make up 4% of this year’s activity so far, up from 3% in 2016. International buyers were not active in St. Louis from 2009 through 2015.
Class A – Whitney Capital Company purchased Pointe 400 (118 units), built in 1971 and renovated in 2006, for $258,000 per unit. Timberland Partners purchased Green Mount Lakes (240 units), built in 2004, for $128,000 per unit.
Class C – David Stern Management Corp. purchased Cypress Village (330 units), built in 1967, and Reserve at Winding Creek (272 units), built in 1970, for $45,000 per unit.
Thus far in 2017, the average cap rate for Class A is 5.8%, which is down from the average cap rate in 2016 of 6.0%. Class B and Class C average cap rates YTD 2017 are 6.6% and 7.5% respectively.
INVESTMENT ACTIVITY
NOTABLE SALES
PRICING & CAP RATES$0
$100
$200
$300
$400
$500
$600
$700
$800
$900
2005 2006 2007 2008 2009 2010 2011 2012 2013 2014 2015 2016 YTD2017
ANNUAL SALES VOLUME ANNUAL SALES VOLUME ($ MILLIONS)
Transaction Volume Historic Average
(in m
illio
ns)
$0
$50,000
$100,000
$150,000
$200,000
$250,000
2013 2014 2015 2016 YTD '17
Class A Class B Class C
ST. LOUIS PRICING TRENDS PRICE / UNIT & CAP RATE
Source: Real Capital Analytics
TOP FIVE ST. LOUIS AREA BUYERS - YTD 2017
TOP FIVE ST. LOUIS AREA SELLERS - YTD 2017
HISTORICAL SALES VOLUME
Source: Cushman & Wakefield Research
Source: Real Capital Analytics
MOST ACTIVE MARKET PLAYERS

Previous Page Home Next Page
CINCINNATI/DAYTON COLUMBUS INDIANAPOLIS KANSAS CITY MINNEAPOLIS OMAHA ST. LOUIS TOLEDO
5MARKET INSIGHTThird Quarter 2017 ST. LOUI S
SUBMARKET OVERVIEW SELECT SUBMARKET NEWS
Central West End
• The Koman Group is expected to complete its $31 million mixed-used project at 32 N. Euclid Ave. by the end of the year. The six-story building will include apartments, office space, and retail, anchored by the St. Louis area’s first Shake Shack.
• Mac Properties proposed $130 million, 36-story residential tower, One Hundred, is expected to begin construction this fall with completion in spring 2020.
• Construction is underway on the new Boyle Street Metro Station. The new station serving the Cortex district is expected to be completed in 2018, and is the first expansion for Metrolink in over a decade.
Clayton
• Indianapolis-based developer, Flaherty & Collins Properties, is planning a $70 milion luxury apartment high-rise at the corner of Forsyth and Brentwood Boulevard. The 24-story tower will include 264 units, a 373-space parking garage, as well as 7,800 square feet of retail. Construction is expected to begin late 2017 or early 2018.
Downtown
• Cordish and the St. Louis Cardinals plan to break ground by the end of the year on phase two of Ballpark Village. The $220 million project will include a 29-story residential tower and 100,000 square feet of Class A office space.
Midtown
• SSM Health will break ground this fall on the new SSM Health Saint Louis University Hospital. The $550 million project, expected to be completed by the fall of 2020, will include a nine-story patient tower and a three-story ambulatory care center.
$656
$914
$797
$1,046
$1,221
$732
$677
$776
$968
$814
$759
$2,170
$974
$1,029
$1,166
$994
University City
St. Charles County
South St. Louis City
Richmond Heights
Olivette
North St. Louis City
North County
Metro East
Maryland Heights /Creve Coeur
Kirkwood South
Jefferson County
Downtown Clayton
Downtown CBD
Chesterfield
Central West End
Ballwin
SUBMARKET TRENDS RENTS & VACANCY
6.2%
4.7%
5.5%
6.0%
9.8%
12.1%
9.0%
5.5%
6.8%
5.3%
5.5%
14.6%
7.3%
5.4%
8.5%
4.4%
University City
St. Charles County
South St. Louis City
Richmond Heights
Olivette
North St. Louis City
North County
Metro East
Maryland Heights /Creve Coeur
Kirkwood South
Jefferson County
Downtown Clayton
Downtown CBD
Chesterfield
Central West End
Ballwin
21.2%
RENTS & VACANCY BY SUBMARKET
1,365
345296
349 312
181 77232 244
312
60
0
200
400
600
800
1,000
1,200
1,400
1,600
SUBMARKET TRENDSUnder Construction
UNDER CONSTRUCTION BY SUBMARKET
Source: CoStar, Cushman & Wakefield ResearchNote: Submarkets are defined by Cushman & Wakefield Research

TOLEDO

Previous Page Home Next Page
CINCINNATI/DAYTON COLUMBUS INDIANAPOLIS KANSAS CITY MINNEAPOLIS OMAHA ST. LOUIS TOLEDO
1TOL EDOMARKET INSIGHTThird Quarter 2017
The following are select announcements from the third quarter of 2017:
Average Q3 employment decreased by 2,200 jobs.
Average Q3 unemployment increased to 6.2%.
ECONOMIC EXPANSION
JOB GROWTH & UNEMPLOYMENT RATE
Construction has begun on a 700,000-square-foot distribution center in Findlay for Campbell’s Soup / DHL Supply Chain, which will employ 220 people. As part of an expansion of its food production plant in Bowling Green, Apio is planning to create 150 full-time jobs.
Steel industry supplier IronUnits LLC will build a new plant in a vacant former industrial site in East Toledo and create 130 full-time jobs.
At its growing manufacturing facility in Leipsic, Pro-Tec Coating is planning to add 80 new full time jobs.
Alpont LLC will create 40 full-time jobs at its chemical manufacturing plant in Oregon.
a
a
a
Like many Midwest markets, effective rent per unit has been steadily growing in the Toledo market for years. Effective rent is now $665 per unit, which is a historical peak. Vacancy in the Toledo market has been increasing in recent quarters, but has ranged between 5.0% and 6.0% over the past three years.
MULTIFAMILY TRENDS
Average effective rentincreased to $665.
Vacancy increased to an
average of 6.1%.
+4.2 +90% Y O Y B P S Y O Y
The Toledo region experienced a net decline of 2,200 jobs year-over-year per the Bureau of Labor Statistics’ (BLS) total employment average for the third quarter of 2017. This is the second consecutive quarter of declining net jobs, which was preceded by two consecutive quarters of net job increases. Even with an overall net job decline, Leisure & Hospitality (+3,300 net jobs) and Education/Health Services (+1,400 net jobs) industries saw net job growth increases in the third quarter.
EMPLOYMENT & UNEMPLOYMENT TRENDS
TOLEDO JOB GROWTH TRENDS
-1.0%
-0.5%
0.0%
0.5%
1.0%
1.5%
2.0%
2.5%
3.0%
0.30
0.30
0.31
0.31
0.31
0.31
0.31
0.32
0.32
Q4 Q1 Q2 Q3
TOLEDO JOB GROWTH TRENDSEMPLOYMENT IN MILLIONS
2015-2016 2016-2017 YOY % Job Growth
TOLEDO, OH
-0.2 +122% Y O Y B P S Y O Y
Source: Moody’s Analytics
a
a
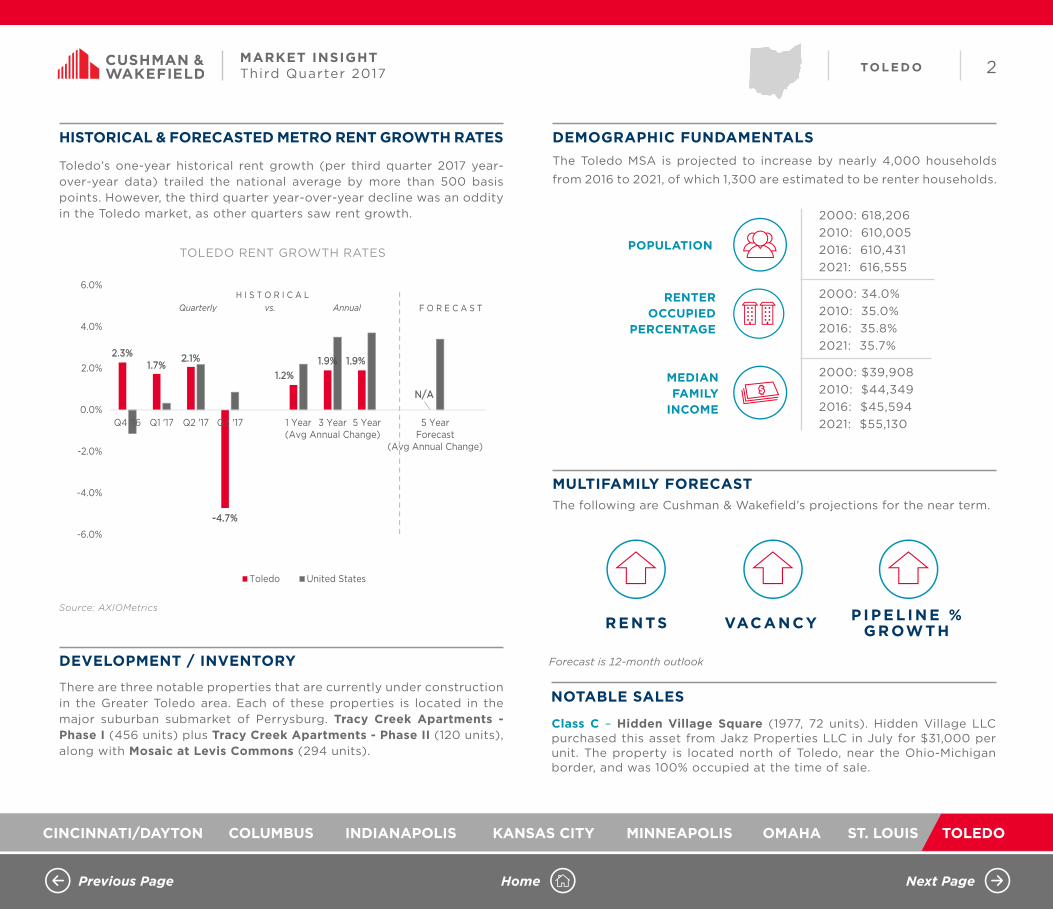
Previous Page Home Next Page
CINCINNATI/DAYTON COLUMBUS INDIANAPOLIS KANSAS CITY MINNEAPOLIS OMAHA ST. LOUIS TOLEDO
2TOL EDOMARKET INSIGHTThird Quarter 2017
Toledo’s one-year historical rent growth (per third quarter 2017 year-over-year data) trailed the national average by more than 500 basis points. However, the third quarter year-over-year decline was an oddity in the Toledo market, as other quarters saw rent growth.
There are three notable properties that are currently under construction in the Greater Toledo area. Each of these properties is located in the major suburban submarket of Perrysburg. Tracy Creek Apartments - Phase I (456 units) plus Tracy Creek Apartments - Phase II (120 units), along with Mosaic at Levis Commons (294 units).
Class C – Hidden Village Square (1977, 72 units). Hidden Village LLC purchased this asset from Jakz Properties LLC in July for $31,000 per unit. The property is located north of Toledo, near the Ohio-Michigan border, and was 100% occupied at the time of sale.
HISTORICAL & FORECASTED METRO RENT GROWTH RATES
DEVELOPMENT / INVENTORY
NOTABLE SALES
2.3%1.7%
2.1%
-4.7%
1.2%1.9% 1.9%
N/A
-6.0%
-4.0%
-2.0%
0.0%
2.0%
4.0%
6.0%
Q4 '16 Q1 '17 Q2 '17 Q3 '17 1 Year 3 Year(Avg Annual Change)
5 Year 5 YearForecast
(Avg Annual Change)
TOLEDO RENT GROWTH RATESHISTORICAL AND FORECAST
Toledo United States
Quarterly vs. AnnualH I S T O R I C A L
F O R E C A S T
TOLEDO RENT GROWTH RATES
The Toledo MSA is projected to increase by nearly 4,000 households
from 2016 to 2021, of which 1,300 are estimated to be renter households.
The following are Cushman & Wakefield’s projections for the near term.
DEMOGRAPHIC FUNDAMENTALS
2000: 618,2062010: 610,0052016: 610,4312021: 616,555 2000: 34.0%2010: 35.0%2016: 35.8%2021: 35.7%
2000: $39,9082010: $44,3492016: $45,5942021: $55,130
MULTIFAMILY FORECAST
VACANCYREN TS P IP EL INE % G ROWTH
Source: AXIOMetrics
Forecast is 12-month outlook
POPULATION
MEDIANFAMILY
INCOME
RENTER OCCUPIED
PERCENTAGE