Embed Size (px)
Citation preview

! 1!
!
!
Cereal!price!transmission!from!international!to!domestic!markets!in!Africa1!
!
!
(PAPER!ID!2012,336)!
!
Draft,!October!2012!
!
!Friederike!Greb,!Nelissa!Jamora,!Carolin!Mengel,!!
Stephan!von!Cramon,Taubadel,!Nadine!Würriehausen!
!
!
!
!
! "
!!!!!!!!!!!!!!!!!!!!!!!!!!!!!!!!!!!!!!!!!!!!!!!!!!!!!!!!!!!!!1!Paper!prepared!for!the!African!Economic!Conference!2012!in!Kigali,!Rwanda!(30!October!–!2!November!2012).!Corresponding!authors:!!Stephan!von!Cramon,Taubadel!([email protected]),!Carolin!Mengel!([email protected]),!Department!of!Agricultural!Economics!and!Rural!Development,!University!of!Göttingen!This!paper!is!based!on!a!report!prepared!for!the!Rural!Policies!Thematic!Group,!the!Agriculture!and!Rural!Development!Department,!and!the!Poverty!Reduction!and!Equity!Unit!of!the!World!Bank,!under!the!supervision!of!the!World!Bank!Senior!Economist!Sergiy!Zorya.!The!opinions!and!conclusions!expressed!in!the!report!and!this!study!do!not!necessarily!represent!those!of!the!World!Bank.!

! 2!
Abstract"This% study% aims% to% improve% our% understanding% of% the% extent% and% speed% of% the% transmission% of%international%cereal%prices%to%local%markets%in%developing%countries%with%a%focus%on%African%countries.%We%analyse%a%sample%of%cereal%price%transmission%(PT)%estimates%using%the%FAO’s%GIEWS%dataset%and%international% reference% prices% for% rice,% maize% and% wheat.% In% the% results,% the% share% of% cointegrated%commodity%markets% is%higher% in%African%countries% compared%with% the%other% countries% in%our% sample%(49%%compared% to%35%).% The%VECM%estimates% imply% that%on%average%73%%of%an% international%price%movement%is%transmitted%to%local%markets%and%half%of%it%within%2.2%months,%more%than%1%month%faster%than%in%other%regions.%African%rice%markets%show%the%highest%share%of%cointegrated%price%pairs%(68%),%the%largest%longUrun%PT%coefficient%and%the%fastest%price%reaction%compared%with%other%cereal%products.%In% most% cases% domestic% prices% adjust% to% deviations% from% the% longUrun% price% relationship,% but%international%prices%do%not.%The%only%notable%exception%to%this%rule% is%rice,%especially%after%July%2007,%which% suggests% that% the% determination% of% international% rice% prices% differs% fundamentally% from% the%determination%of%international%wheat%and%maize%prices.%In%a%subsequent%metaUregression%analysis%we%measure%how%much%of%the%variation% in%the%samples%of%PT%estimates%can%be%explained%by%countryU%or%productUspecific%factors.%The%choice%of%covariates%is%motivated%by%recent%price%transmission%literature.%!
!
Keywords:! price! transmission,! cointegration,! developing! countries,! agricultural! trade,! maize,! rice,!wheat,!commodity!prices!
JEL!Classification:!C32,!F15,!Q11,!Q17,!Q18!
"
! "

! 3!
Table!of!contents!Cereal!price!transmission!from!international!to!domestic!markets!in!Africa!...........................!1!
Abstract!...........................................................................................................................................!2!
Table!of!contents!.............................................................................................................................!3!
List!of!tables!and!figures!.................................................................................................................!4!
1.!Introduction!..........................................................................................................................!5!
2.!Method:!the!vector!error!correction!model!.........................................................................!5!
2.1!The!structure!of!the!vector!error!correction!model!......................................................................!5!
2.2!Limitations!of!the!vector!error!correction!model,!and!alternatives!..............................................!7!
3.!Estimates!of!international,domestic!cereals!price!transmission!..........................................!9!
3.1!Cointegration!...............................................................................................................................!10!
3.2!Estimates!of!the!long,run!price!transmission!coefficient!and!the!adjustment!parameters!........!12!
3.3!Price!reaction!on!domestic!level!and!world!market!side!............................................................!12!
3.4!Price!transmission!before!and!after!July!2007!............................................................................!13!
4.!Analysis!of!the!determinants!of!the!strength!of!price!transmission!...................................!14!
4.1!Method!........................................................................................................................................!14!
4.2!Results!.........................................................................................................................................!14!
5.!Discussion!...........................................................................................................................!19!
6.!References!..........................................................................................................................!21!
7.!Appendix!.............................................................................................................................!23!
!
! "

! 4!
List!of!tables!and!figures!Figure!1:!Conceptual!framework!for!assessing!price!transmission!.........................................................!7!
!
Table!1:!The!distribution!of!break!dates!chosen!by!the!Gregory!and!Hansen!(1996)!test!......................!9!
Table!2:!The!optimal!number!of!lags!to!include!in!VECM!estimation!as!indicated!by!the!AIC!..............!10!
Table!3:!The!prevalence!of!cointegration!in!the!PT!estimates!..............................................................!11!
Table!4:!The!prevalence!of!cointegration!by!product!...........................................................................!11!
Table!5:!Average!estimates!of!the!long,run!PT!coefficient!and!the!adjustment!parameters!...............!12!
Table!6:!Share!of!cases!in!which!the!adjustment!parameter!is!significant!...........................................!13!
Table!7:!Average!price!transmission!parameters!estimated!before!and!after!July!2007!......................!14!
Table!8:!Covariates!used!in!the!meta,analysis!of!the!determinants!of!price!transmission!...................!15!
Table!9:!Logit!regression!of!cointegration!status!on!factors!that!might!influence!price!transmission!.!16!
Table!10:!Estimated!coefficients!for!the!meta,regressions!!(all)!...........................................................!16!
Table!11:!Estimated!coefficients!for!the!meta,regressions!(cointegrated)!...........................................!17!
Table!12:!Estimated!coefficients!for!the!meta,regressions!(not!cointegrated)!....................................!18!
Table!13:!List!of!studies!analysing!world!to!domestic!price!transmission!for!African!countries!...........!23!
Table!14:!Countries!with!state!trading!enterprises!(STEs)!for!maize,!rice!or!wheat!.............................!23!
Table!15:!Cointegration!between!international!and!domestic!prices!by!product!and!country!............!24!
Table!16:!Cointegration!between!international!and!domestic!prices!in!African!countries!(maize)!......!28!
Table!17:!Cointegration!between!international!and!domestic!prices!in!African!countries!(maize)!......!29!
Table!18:!Cointegration!between!international!and!domestic!prices!in!African!countries!(wheat)!.....!30!
!
! "

! 5!
1."Introduction"
Motivated!by! the! recent! peaks! in! international! food!prices,!we! conducted! a! study! to! improve!our!understanding!of! the!extent!and!speed!of!transmission!of! international!cereal!price!changes!to!the!domestic!retail!and!wholesale! level! in!developing!and!emerging!countries! (Greb!et!al.!2012).!Other!than!most!recent!studies!on!world,to,domestic!PT!we!attempted!to!extract!general!lessons!about!the!drivers!of!PT!by!estimating!PT!processes!with!a!consistent!set!of!price!data!(FAO,GIEWS)!for!a!large!number!of!countries!using!a!uniform!methodology.!Based!on!this!report,!we!use!this!study!to!set!the!focus! specifically! on! PT! results! for! African! countries! which! differ! significantly! from! those! in! other!regions!or!continents.!In!the!sample,!35!of!the!71!countries!are!in!Africa!and!also!roughly!half!of!the!499!domestic!price!series.!!
The! study! has! the! following! structure.! In! section! 2,! we! give! a! brief! overview! of! the! vector! error!correction!model!that!we!used!for!estimating!our!sample!of!measures!of!cereal!PT.!In!section!3,!we!describe! how! we! used! the! GIEWS! dataset! and! present! the! results! of! African! price! pairs! for! each!cereal!product!and!before!and!after!a!structural!break!in!July!2007.!In!a!subsequent!meta,regression!analysis! we!measure! how!much! of! the! variation! in! the! resulting! samples! of! PT! estimates! can! be!attributed! to! factors! that! might! be! expected! to! influence! the! strength! of! PT! (section! 4).! This! is!followed!by!a!discussion!of!the!results!and!the!conclusion!in!section!5.!
2."Method:"the"vector"error"correction"model"
2.1"The"structure"of"the"vector"error"correction"model"The!study!of!PT!for!homogeneous!commodities!in!space,!or!for!a!product!as!it!is!transformed!along!the! stages! of! the! marketing! chain! (e.g.! wheat! –! flour! –! bread),! has! attracted! the! interest! of!agricultural!economists!for!many!decades!(Meyer!2004).!Early!empirical!studies!of!PT!were!based!on!simple! correlation! and! regression! analyses! that! did! not! account! for! dynamics! and! lead,lag!relationships!in!price!data!(for!a!survey,!see!Fackler!and!Goodwin,!2001).!In!the!course!of!the!1980s,!these!methods!were! increasingly!replaced!by!dynamic!regression!models!that! include!lagged!prices!(e.g.! Ravallion,! 1986)! and! studies! based! on! the! concept! of! Granger! causality! (Gupta! and!Mueller,!1982).! The! emerging! cointegration! literature! highlighted! several! pitfalls! associated! with! the!regression!analysis!of!price!data.! In!particular,!since!price!data!are!often!non,stationary,!regression!can!lead!to!spurious!results!(Hassouneh!et!al,!2012).!The!basic!insight!of!the!cointegration!approach!is!that!to!avoid!the!pitfall!of!spurious!regression!one!must!test!whether!non,stationary!prices!series!(also!referred!to!as!‘integrated’!price!series)!are!not!only!correlated!with!one!another!but!are!rather!‘co,integrated’.! Cointegrated! means! that! there! exists! a! linear! combination! of! the! non,stationary!series!that!is!itself!stationary,!in!other!words!that!the!series!share!a!common!form!of!non,stationarity!and!cannot!drift!apart!indefinitely.!!
Ardeni! (1989)! published! the! first! study! of! PT! on! agricultural! markets! based! on! cointegration!methods.! It! is! fair! to! say! that!with! the! exception! of! a! comparatively! small! literature! based! on! so,called!parity!bounds!models!(Barrett!and!Li,!2002)!today!essentially!the!entire!empirical!PT!literature!draws! on! cointegration! methods! and,! in! particular,! the! so,called! vector! error! correction! model!(VECM).!The!VECM!is!a!re,parametrization!of!the!standard!vector!autoregressive!(VAR)!model!which!relates!the!current!levels!of!a!set!of!time!series!to!lagged!values!of!those!series.!A!simple!VECM!that!captures! the! interactions! between! international! or! world! prices! and! domestic! price! takes! the!following!form:!

! 6!
(1) !!!! = !! + !! !!!!! − !!!!!!!
!""#"!!"##$!%&"'!!"#$+ !!!!!!!! + !!!!!!!! + !!!!(a)%
!!!! = !! + !! !!!!! − !!!!!!!
!""#"!!"##$!%&"'!!"#$+ !!!!!!!! + !!!!!!!! + !!!!(b).%
where!!!! !is!the!domestic!price;!!!!!is!the!world!price;!and!!,!!,!!,!!,!and!!!are!parameters!to!be!estimated.!!
In!matrix!notation,!and!allowing!for!more!than!one!lag!of!the!price!difference!terms,!this!VECM!can!be!written!compactly!as:!
(2) !!!!!!!!
= !!!! + !!
!! 1 !! !!!!!
!!!!! + !!! !!!!!! !!!
!!!!!!
!!!!!!!!!! + !!!
!!! .% %
From!the!perspective!of!empirical!PT!analysis,!the!main!advantage!of!the!VECM!over!the!VAR!is!that!it!separates!the!long,run!equilibrium!(or!‘cointegrating’)!relationship!between!!!!and!!! !!–!which!is!captured!by! the!error!correction! term! !!!!! − !!!!!!! !–! from!the!short,run!dynamics! that!ensure!that!any!deviations!from!this!long,run!equilibrium!are!‘corrected’!and!thus!only!temporary.!The!key!parameters!in!the!VECM!are!!!,!which!describes!how!one!price!reacts!to!changes!in!the!other!in!the!long!run2,!and!the!so,called!‘adjustment’!parameters!!!!and!!!.!If!!!!and!!! !are!cointegrated,!then!!!!and!!!!must!have!negative!and!positive!signs,!respectively.!If!this!is!the!case,!then!if!for!example!!! ! becomes! too! large! relative! to! !!!! and! the! error! correction! term! is! correspondingly! positive,! a!decrease!in!!!! !in!the!first!equation!of!the!VECM,!and!an!increase!in!!!!in!the!second!equation,!will!drive!the!prices!back!towards!their! long,run!equilibrium.!One,to,one!price!transmission! in!the! long!run!requires!that!!! = 1,!while!0 < !! ≤ 1,!with! large!(small)!values!of!!!!and!!!! indicating!that!errors!are!corrected!rapidly!(slowly).3!
Figure!1!outlines!the!basic!empirical!strategy!for!estimating!PT.!The!first!step!is!to!determine!whether!the! individual! price! series!!!! and! !! ! are! both! non,stationary! (also! referred! to! as! ‘integrated’! or!‘I(1)’).!This!is!usually!carried!out!using!the!ADF!(Dickey!and!Fuller,!1979)!and!KPSS!tests!(Kwiatkowski!et!al.,!1992).!If!the!prices!are!not!both!I(1),!they!cannot!be!cointegrated.!If!they!are!both!stationary!or!‘I(0)’!they!can!be!studied!using!Auto,Regressive!Distributed!Lag!(ARDL)!models.!If!the!series!are!both!I(1),!the!!null!hypothesis!that!they!are!not!cointegrated!can!be!tested!using!a!two,step!OLS!procedure!proposed!by!Engle!and!Granger!(1987)!or!a!maximum!likelihood!procedure!developed!by!Johansen!(1988).!If!the!null!of!no!cointegration!is!rejected,!the!VECM!in!equation!(2)!can!be!estimated,!again!using!methods!proposed!by!Engel!and!Granger!or!Johansen.!Finally,!the!resulting!estimates!of!!!and!!!are!interpreted.!
!!!!!!!!!!!!!!!!!!!!!!!!!!!!!!!!!!!!!!!!!!!!!!!!!!!!!!!!!!!!!2! If! estimation! is! based!on!prices! in! logarithms! then!β1! can!be! interpreted!as! the! long,run!elasticity!of! price!transmission.!3!The!speed!of!error!correction!captured!by!the!magnitude!of!an!adjustment!parameter!must!be! interpreted!relative!to!the!frequency!of!the!data!that!is!used!to!estimate!it.!An!!!of!0.4!estimated!with!annual!data!implies!that!40%!of!any!deviation! from! long,run!equilibrium! is! corrected!within! the!space!of!one!year.!An!!!of!0.25!estimated!with!monthly!data! is! smaller! in!magnitude!but!would!nevertheless! lead! to!over!95%!correction!of!any!deviation!from!long,run!equilibrium!in!the!course!of!one!year.!Some!authors!transform!!’s! into!so,called!half,lives!that!indicate!how!many!units!of!time!are!required!for!the!correction!of!one,half!of!a!deviation!from!the!long,run!equilibrium.!An!!!of!0.25!estimated!with!monthly!data!corresponds!to!a!half,life!of!2.41!months.!!

! 7!
Figure"1:"Conceptual"framework"for"assessing"price"transmission"
!
!!
2.2"Limitations"of"the"vector"error"correction"model,"and"alternatives""While! the! VECM! underlies!most! empirical! work! in! PT! analysis,! it! is! restrictive! is! some! settings.! In!particular,!the!VECM!in!equation!(2)!is!linear!in!two!senses!(Hassouneh!et!al,!2012).!First,!it!is!linear!in!the! sense! that! all! of! the! parameters! in! the! model! are! assumed! to! be! constant! over! the! entire!sampling! period.! Second,! it! is! linear! in! the! sense! that! the! dependent! variables! react! linearly! to!changes!in!the!independent!variables.!Numerous!studies!have!shown!that!in!many!applications!one!or! both! of! these! types! of! linearity! cannot! be! expected! to! hold! (Hassouneh! et! al.,! 2010;! Serra! and!Goodwin,! 2003;! Serra! et! al.! 2006;! von! Cramon,Taubadel,! 1998;! von! Cramon,Taubadel! and!Amikuzuno,!2012).!!
For!our!purposes,!the!first!type!of! linearity!is!especially!restrictive.!The!PT!relationship!that!links!an!international!price!to!a!country’s!domestic!market!price!need!not!be!constant!over!time.!Changes!in!the!country’s!trade!policy!(for!example!an!increase!or!reduction!of!import!tariffs)!can!alter!the!nature!of! the! PT! relationship,! as! can! a! switch! from! a! net! export! to! a! net! import! position.! Furthermore,!spatial!equilibrium!theory!(Takayama!and!Judge,!1971)!predicts!that!short,run!price!adjustments!due!to!arbitrage!will!take!place!only!if!the!difference!between!international!and!domestic!prices!exceeds!a! threshold! that! is! determined! by! transport! and! transaction! costs! (Barrett! and! Li,! 2002).! If! the!difference!between!prices! is! less! than! this! threshold,! there! is!no! incentive! for! traders! to!engage! in!arbitrage,!and!prices!can!move!independently!of!one!another.!
In! such! cases! PT! will! be! characterized! by! different! so,called! ‘regimes’! (for! example,! one! regime!before!and!one!regime!after!an!import!tariff!change;!or!one!regime!for!the!net!export!situation,!and!one!for!the!net!import!situation).!In!recent!years!several!models!of!regime,dependent!PT!have!been!developed!and!applied!in!the!literature.!Most!of!these!can!be!described!as!piecewise!linear!models!in!which!each!regime!is!characterized!by!a!standard!VECM!as!in!equation!(2)!above,!and!some!trigger!or!transition!mechanism!determines!when! the!model! jumps! from!one! regime!to!another.!This! trigger!can!be!exogenous!(e.g.!coinciding!with!the!date!of!a!policy!change)!or!endogenous!(e.g.!determined!by! whether! the! distance! between! the! international! and! the! domestic! prices! exceeds! a! certain!threshold).!Hassouneh!et!al.! (2012)! review!a!number!of! the! regime,dependent!PT!models! that!are!
Test!for!order!of!integramon!
Test!H0:!no!cointegramon!
Specify!and!esmmate!VECM;!assess!dynamics,!speed!of!adjustment!
Assess!overall!PT!
Esmmate!ARDL!
No!cointegramon!
if!not!the!same!
reject!
if!both!stationary!if!both!I(1)!
accept!
Source:%Own%depiction%based%on%Rapsomanikis%et%al.%(2003).%%

! 8!
common! in! current! research,! including! the! threshold! VECM! (Goodwin! and! Piggott,! 2001),! the!asymmetric!VECM!(von!Cramon,Taubadel,!1998),!and!the!smooth!transition!VECM!(Teräsvirta,!1994).!
Estimating! regime,dependent! PT! models! is! considerably! more! complicated! than! estimating! a!standard! VECM.! Some! of! these! models! require! additional! exogenous! variables! in! addition! to! the!endogenous! prices,! for! example! information! on! the! timing! of! policy! changes! or! other! exogenous!shocks!that! lead!to!regime!changes.!Others!regime,dependent!models!such!as!the!threshold!VECM!can!be!estimated!using!prices!alone,!but!require!additional!information!and!testing!to!determine!the!appropriate! number! of! thresholds.4! Finally,! there! is! no! unified! testing! framework! for! comparing!these!regime,dependent!models!with!one!another.!!
Authors!who!are!interested!in!analyzing!PT!in!a!specific!product/country!setting,!or!who!use!such!a!specific!setting!to!illustrate!a!new!regime,dependent!PT!model!that!they!have!developed!or!refined,!can!afford! to!engage! in! the!additional!data!collection,! specification,! testing!and! interpretation! that!this! entails.! As! outlined! in! section! 3.2! below,! however,! the! FAO! GIEWS! data! provides! us! with!domestic! price! series! for! three!main! cereal! products! (maize,! rice! and!wheat)! in! 71! countries.! It! is!beyond!the!scope!of!this!study!to!carry!out!detailed!regime,dependent!PT!analysis!for!each!of!these!individual! settings.! Instead,! we! are! obliged! to! use! a! comparatively! simple! PT! model,! such! as! the!VECM,! the! estimation! of! which! can! be! automated! to! permit! the! analysis! of! a! large! number! of!domestic,international!price!pairs.!We!recognize!that!the!simple!VECM!specification!in!(2)!will!not!be!appropriate!for!all!of!the!domestic,international!price!pairs!in!the!GIEWS!data.!The!additional!insights!that! can! be! generated! by! estimating! PT! for! a! large! number! of! price! pairs! and! then! analyzing! the!resulting!cross,section!sample!of!results!come!at!the!cost!of!a!necessarily!simple!method!of!analysis!that!is!not!appropriate!for!each!of!these!pairs!individually.!
In!an!attempt!to!deal!with!the!shortcomings!of!the!simple!VECM,!we!propose!an!alternative!method!of!analysis.!To!allow! for!at! least!one!possible! source!of!non,linearity!we!modify! the!basic!VECM! in!equation!(2)!to!include!a!structural!break!which!we!postulate!to!have!taken!place!in!July!2007.!This!roughly! corresponds! to! the! beginning! of! the! first! agricultural! price! peak! and! the! beginning! of! the!recent! phase! of! increased! volatility! on! international! commodity!markets.! Hence,! we! estimate! the!following!model!which!allows!the!nature!of!price!transmission!between!international!and!domestic!cereal!prices!to!change!with!the!onset!of!higher!and!more!volatile!price!in!recent!years.!The!resulting!specification! is!as!follows,!where!the!superscript!*!distinguishes!between!pre,break!and!post,break!parameters:!
(3) !!!!!!!!
=
!!!! 1!!!!! !!!!!
!!!!! + !!! !!!!!! !!!
!!!!!!
!!!!!!!!!! + !!
!! + !!!!!! , ! < July%2007
!!∗!!∗
1!!!!!∗!!!!!
!!!!! + !!!∗ !!!∗!!!∗ !!!∗
!!!!!!
!!!!!!!!!! + !!∗
!!∗+ !!!∗
!!!∗, ! ≥ !"#$!2007.
%
Equation! (3)! is! thus!a! regime,dependent!VECM!that! links! two!standard!VECMs,!one! for! the!period!prior!to!July!2007,!and!one!for!the!period!thereafter.!To!check!whether!July!2007!is!a!plausible!cut,off,! we! applied! the! Gregory! and! Hansen! (1996)! test! of! the! null! of! no! cointegration! against! the!alternative!of!cointegration!with!a!possible!regime!shift!to!each!domestic/international!price!pair!in!the! GIEWS! data.! Figure! 2! shows! the! distribution! of! the! break! dates! selected! by! the! Gregory! and!Hansen! test.! While! there! is! evidence! of! regime! shifts! in! some! domestic/international! price!relationships! in! 2003/04! for! rice! and! 2004/05! for! maize,! for! all! three! products! (rice,! maize! and!wheat)!by!far!the!most!regime!shifts!are! indicated! in!2007/08.!July!2007!therefore!appears!to!be!a!reasonable!choice!for!the!cut,off!date!in!the!regime,dependent!VECM!in!equation!(3).!
!!!!!!!!!!!!!!!!!!!!!!!!!!!!!!!!!!!!!!!!!!!!!!!!!!!!!!!!!!!!!4! Furthermore,! Greb! et! al.! (2011)! demonstrate! that! the! maximum! likelihood! method! used! to! estimate!threshold!VECMs!in!the!literature!to!date!is!biased.!

! 9!
Table"1:"The"distribution"of"break"dates"chosen"by"the"Gregory"and"Hansen"(1996)"test"
!Source:%Own%calculations%with%GIEWS%price%data.%
3."Estimates"of"internationalLdomestic"cereals"price"transmission"Following!the!discussion!of!methods!in!the!previous!section,!we!follow!a!comprehensive!approach!to!generate!insights!into!the!nature!of!international!to!domestic!PT!for!major!cereal!products.!Using!the!extensive! FAO! GIEWS! price! data! set,! we! test! whether! the! price! series! are! cointegrated! with! a!corresponding! international! reference! price.! For!market! pairs! where! this! is! the! case! we! generate!estimates!of!!!and!!!using!the!VECM!in!equation!(2)!and!the!regime,dependent!VECM!in!equation!(3).!This!work!is!outlined!in!section!3.2!below.!In!this!analysis%we!consider!maize,!rice!and!wheat.!!
This!approach!has!its!advantages!and!disadvantages.!As!discussed!above,!the!FAO!GIEWS!price!data!includes!hundreds!of!price!series.!Hence,!we!are!obliged!to!automate!the!estimation!and!work!with!simple!uniform!specifications!that!may!not!be!appropriate!in!all!cases.!On!this!count!estimates!in!the!PT! literature!might!be!more!reliable.!Most!studies! in! the! literature!only!report!a! few!PT!estimates,!typically!for!a!single!product!and!one!or!relatively!few!counties!(Table!13).!As!a!result,!the!estimates!in! other! studies! can! be! expected! to! reflect! detailed! work! by! authors! who! have! a! comprehensive!understanding! of! the! markets! that! they! study,! and! who! have! undertaken! careful! specification!searches,!for!example!to!determine!appropriate!lag,lengths!for!the!VECMs!that!they!estimate,!etc.!!
0!
10!
20!
30!
40!
50!
60!
70!
80!01.07.1998!
01.01.1999!
01.07.1999!
01.01.2000!
01.07.2000!
01.01.2001!
01.07.2001!
01.01.2002!
01.07.2002!
01.01.2003!
01.07.2003!
01.01.2004!
01.07.2004!
01.01.2005!
01.07.2005!
01.01.2006!
01.07.2006!
01.01.2007!
01.07.2007!
01.01.2008!
01.07.2008!
01.01.2009!
01.07.2009!
01.01.2010!
01.07.2010!
01.01.2011!
01.07.2011!
Later!
Freq
uency!
Break!date!
Rice! Wheat! Maize!

! 10!
The!FAO!Global!Information!and!Early!Warning!System!(GIEWS)!food!price!data!set!was!established!in!2009!as!part!of!the!FAO!Initiative!on!Soaring!Food!Prices!(ISFP).5!The!prices!reported!in!GIEWS!are!collected! from! national! official! sources! and! non,official! institutions.! The! GIEWS! price! series! are!monthly! and!most! run! through! to! the! end!of! 2011;! some! start! as! early! as! 1995,! others! as! late! as!2008.!We! impose! a!minimum! length! of! 10! observations! for! a! time! series! to! be! considered! in! our!analysis!and!analyze!PT!between!domestic!and!the!following!international!prices:!
• wheat!–!US!No.!2!HRW,!FOB!Gulf!of!Mexico!• rice!–!Thai!5%,!FOB!Bangkok!• yellow!maize!–!US!No.!2!yellow,!FOB!Gulf!of!Mexico!• white!maize!–white!maize,!FOB!Randfontein!(South!Africa).!
The!GIEWS!data!includes!a!total!of!57!domestic!prices!for!wheat,!262!domestic!prices!for!rice!and!180!domestic! prices! for! maize.! GIEWS!mainly! provides! results! for! countries! in! Africa,! Asia/Pacific! and!Latin! America,! but! only! 7! for! Europe! and! none! for! North! America! (499! in! total).! To! estimate! the!VECMs!in!equation!(2)!and!(3)!above!with!the!GIEWS!data!a!decision!about!the!number!of!lags!(k)!to!include!must!be!reached.!As!shown!in!Table!2,!the!Akaike!Information!Criterion!(AIC!–!Akaike,!1974)!indicates!that!k=1!in!the!great!majority!of!cases,!so!for!simplicity!we!employ!one!lag!throughout.!
Table"2:"The"optimal"number"of"lags"to"include"in"VECM"estimation"as"indicated"by"the"AIC"
Commodity"Number"of"lags"
1" 2" 3" 4" 5" 6"
Maize" 167! 92.8%! 7! 3.9%! 3! 1.7%! 1! 0,6%! 2! 1.1%! 0! 0%!
Rice" 185! 70.6%! 44! 16.8%! 13! 5.0%! 10! 3,8%! 5! 1.9%! 5! 1.9%!
Wheat" 45! 78.9%! 9! 15.8%! 2! 3.5%! 1! 1,8%! 0! 0%! 0! 0%!
Source:%Own%calculations%with%GIEWS%price%data.%
3.1"Cointegration"
Tables!3!and!4!present!information!on!the!numbers!and!shares!of!international/domestic!price!pairs!which!are!found!to!be!cointegrated!according!to!the!GIEWS!estimates.!Overall,!the!sample!suggests!that! international!and!domestic!prices!are!cointegrated!more!often! for!African!markets! (49%)!than!for!markets!located!in!Asia,!Pacific!region,!Latin!America,!Europe!and!Asia!(35%).!This!tendency!holds!also!the!case!for!the!estimates!generated!with!allowing!for!a!structual!break!at!July!2007.!Before!the!break!26%!of!all!African!market!pairs!are!cointegrated!and!21%!of!market!pairs! in!other!regions.! In!the!period!thereafter!cointegration!is!found!in!41%!of!African!price!pairs!and!28%!of!price!pairs!in!the!rest!of!world.!
!!!!!!!!!!!!!!!!!!!!!!!!!!!!!!!!!!!!!!!!!!!!!!!!!!!!!!!!!!!!!5!We!are!grateful!to!David!Hallam!for!providing!us!with!this!data!in!electronic!form.!
! 11!
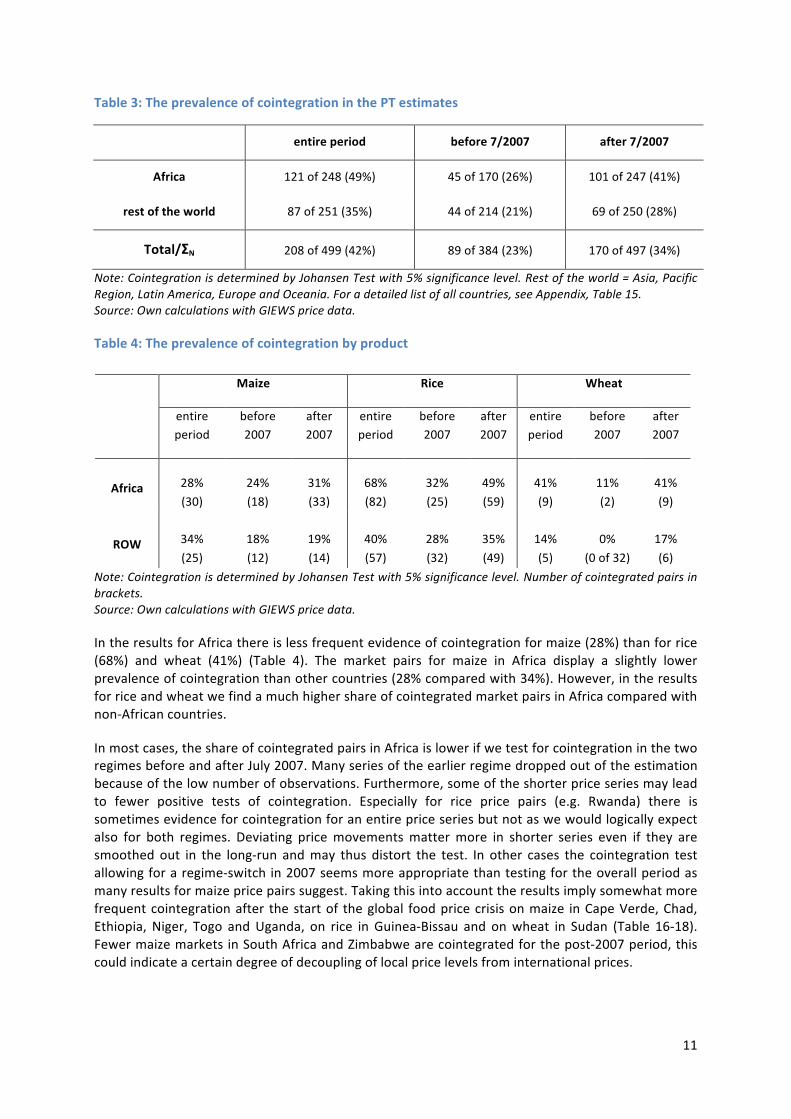
Table"3:"The"prevalence"of"cointegration"in"the"PT"estimates"
! entire"period" before"7/2007" after"7/2007"
Africa" 121!of!248!(49%)! 45!of!170!(26%)! 101!of!247!(41%)!
rest"of"the"world" 87!of!251!(35%)! 44!of!214!(21%)! 69!of!250!(28%)!
Total/ΣN" 208!of!499!(42%)! 89!of!384!(23%)! 170!of!497!(34%)!
Note:%Cointegration%is%determined%by%Johansen%Test%with%5%%significance%level.%Rest%of%the%world%=%Asia,%Pacific%Region,%Latin%America,%Europe%and%Oceania.%For%a%detailed%list%of%all%countries,%see%Appendix,%Table%15.%Source:%Own%calculations%with%GIEWS%price%data.%
Table"4:"The"prevalence"of"cointegration"by"product"
Note:%Cointegration%is%determined%by%Johansen%Test%with%5%%significance%level.%Number%of%cointegrated%pairs%in%brackets.%Source:%Own%calculations%with%GIEWS%price%data.%
In!the!results!for!Africa!there!is!less!frequent!evidence!of!cointegration!for!maize!(28%)!than!for!rice!(68%)! and! wheat! (41%)! (Table! 4).! The! market! pairs! for! maize! in! Africa! display! a! slightly! lower!prevalence!of!cointegration!than!other!countries!(28%!compared!with!34%).!However,!in!the!results!for!rice!and!wheat!we!find!a!much!higher!share!of!cointegrated!market!pairs!in!Africa!compared!with!non,African!countries.!!
In!most!cases,!the!share!of!cointegrated!pairs!in!Africa!is!lower!if!we!test!for!cointegration!in!the!two!regimes!before!and!after!July!2007.!Many!series!of!the!earlier!regime!dropped!out!of!the!estimation!because!of!the!low!number!of!observations.!Furthermore,!some!of!the!shorter!price!series!may!lead!to! fewer! positive! tests! of! cointegration.! Especially! for! rice! price! pairs! (e.g.! Rwanda)! there! is!sometimes!evidence!for!cointegration!for!an!entire!price!series!but!not!as!we!would!logically!expect!also! for! both! regimes.! Deviating! price!movements!matter!more! in! shorter! series! even! if! they! are!smoothed! out! in! the! long,run! and!may! thus! distort! the! test.! In! other! cases! the! cointegration! test!allowing!for!a!regime,switch!in!2007!seems!more!appropriate!than!testing!for!the!overall!period!as!many!results!for!maize!price!pairs!suggest.!Taking!this!into!account!the!results!imply!somewhat!more!frequent!cointegration!after! the!start!of! the!global! food!price!crisis!on!maize! in!Cape!Verde,!Chad,!Ethiopia,! Niger,! Togo! and!Uganda,! on! rice! in! Guinea,Bissau! and! on!wheat! in! Sudan! (Table! 16,18).!Fewer!maize!markets!in!South!Africa!and!Zimbabwe!are!cointegrated!for!the!post,2007!period,!this!could!indicate!a!certain!degree!of!decoupling!of!local!price!levels!from!international!prices.!!
!
Maize" Rice" Wheat!
entire!period!
before!2007!
after!2007!
entire!period!
before!2007!
after!2007!
entire!period!
before!2007!
after!2007!
Africa" 28%!!(30)!!
24%!!(18)!!
31%!(33)!!
68%!(82)!!
32%!(25)!!
49%!(59)!!
41%!(9)!!
11%!(2)!!
41%!(9)!!
ROW" 34%!(25)!!
18%!(12)!!
19%!(14)!!
40%!(57)!!
28%!(32)!!
35%!(49)!!
14%!(5)!
0%!(0!of!32)!!
17%!(6)!!

! 12!
3.2"Estimates"of"the"longLrun"price"transmission"coefficient"and"the"adjustment"parameters"
The! results! point! to! relatively! slow!PT! for! all! cereal! products! and! regions.! Table!5! summarizes! the!average!estimates!of!the!long,run!PT!coefficient!β!and!of!the!adjustment!parameters!α1!and!α2!and!by!cereal!product.!On!average!the!estimated!β! is!0.73!for! international,domestic!price!pairs! in!African!countries.!This! indicates! that!on!average!changes! in! international!prices!are! transmitted!by!73%!to!domestic!prices.!As!discussed!above,!the!adjustment!parameter!from!the!first!equation!in!(2)!above!is!expected!to!be!negative.!The!average!speed!of!adjustment!of!local!prices!(α1)!is!,0.27.!This!implies!that! it!will! take! roughly! 2.2!months! to! correct! one,half! of! any!disequilibrium! that! emerges!due! to!unexpected!price!movements!on!international!or!domestic!markets.!A!somewhat!slower!response!is!indicated!by! the!average!across!all! cereals! for! countries! in!other! regions! (average!α1=! ,0.19,!which!corresponds! to! a! half,life! of! 3.3! months).! In! addition,! the! average! β! is! slightly! smaller! (0.64).! In!addition!to!the!strong!and!above,average!prevalence!of!cointegration!with!the!world!market!price,!also! the! largest! long,run! PT! coefficients! and! the! fastest! price! reaction! was! found! for! African! rice!markets.! 75%! of! a! price! shock! is! transmitted! in! the! long,run,!with! half! of! the! adjustment! of! local!prices!taking!place!within!2!months.!The!average!long,run!transmission!of!maize!prices!is!equivalent!but!with!a!half,life!of!2.5!months.!However!there!is!evidence!that!for!a!number!of!rice!market!pairs,!the!world!market!contributes!to!the!adjustment!in!prices.!
Table"5:"Average"estimates"of"the"longLrun"PT"coefficient"and"the"adjustment"parameters"
" ∅ "β" ∅ "α1" ∅ "α2"
"
maize" rice" wheat" all" maize" rice" wheat" all" maize" rice" all"
Africa" 0.75! 0.75! 0.58! 0.73! ,0.24! ,0.29! ,0.21! ,0.27! ,0.20! 0.20! 0.18!
ROW" 0.69! 0.57! 1.23! 0.64! ,0.25! ,0.17! ,0.13! ,0.19! 0.08! 0.22! 0.21!
Total! 0.72% 0.67% 0.81% 0.69% U0.24% U0.24% U0.18% U0.24% U0.13% 0.21% 0.19%
Note:% Only% significant% coefficients% for% cointegrated% market% pairs% are% considered.% The% expected% sign% of% α1% is%negative.%None%of%the%wheat%estimates%of%α2!were%significant.%ROW=rest%of%the%world%Source:%Own%calculations%with%GIEWS%price%data.%
3.3"Price"reaction"on"domestic"level"and"world"market"side"
In!most!cases,!we!focus!on!the!adjustment!parameter! from!the! first!equation! in! (2)!above,! i.e.! the!equation!that!explains!changes!in!domestic!prices,!because!in!the!majority!of!all!cases,!only!this!α!is!statistically! significant.! In! other!words,! the! dynamics! of! international/domestic! cereal! PT! are! such!that! domestic! prices! adjust! to! deviations! from! the! long,run! price! relationship,! but! international!prices!do!not.!The!only!notable!exception!to!this!rule!is!rice,!to!which!we!return!below.!

! 13!
Table"6:"Share"of"cases"in"which"the"adjustment"parameter"is"significant"
%Note:%Only%coefficients%for%cointegrated%market%pairs%in%African%countries%are%considered.%Significance%level%was%chosen%at%5%.%"Source:%Own%calculations%with%GIEWS%price%data."
If! the! adjustment! parameters! from! the! second! equation! in! (2)! above! are! considered,!we! see! that!these! are! in!most! cases! insignificant,! except! for! rice! (Table! 6).! Specifically,! there! is! evidence! of! a!statistically! significant! reaction! by! international! prices! to! disequilibrium! between! domestic! and!international! prices! in! 121! African! market! pairs! (45%),! of! which! 82! involve! rice.6! As! pointed! out!above,!the!simple!linear!VECM!is!restrictive!and!probably!not!appropriate!for!many!of!the!individual!price! pairs! in! the! GIEWS! data.! Hence,! a! certain! number! of! spuriously! significant! adjustment!parameters! for! international! prices! can! be! expected.! Nevertheless,! the! fact! that! significant!adjustment!parameters!for!international!prices!occur,! if!at!all,!almost!exclusively!for!rice!price!pairs!suggests! that! the! determination! of! international! rice! prices! differs! fundamentally! from! the!determination!of! international!wheat!and!maize!prices.!These!results!confirm!a!very!similar! finding!by! Gilbert! (2011).! We! can! conclude! that! most! countries! are! price! takers! on! wheat! and! maize!markets,!but!the!evidence!for!rice!is!mixed.!
3.4"Price"transmission"before"and"after"July"2007"
Table!7!contrasts!average!estimates!of!the!coefficient!of!PT!on!cereal!markets!before!and!after!the!onset!of!the!recent!phase!of!price!peaks!and!increased!price!volatility!in!mid,2007.!If!we!compare!the!average! estimates! from! the! period! prior! to! July! 2007!with! the! average! estimates! from! the! period!thereafter,! price! transmission!has!become! stronger!and! faster! for!African,international!price!pairs,!whereas! the!opposite! is! the!case! for! the!country!group!consisting!of!Asia,! the!Pacific!Region,!Latin!America,!Europe!and!Oceania.!
On!African!maize! and!wheat!markets! the! long,run! PT! coefficients! (β)! have! increased! considerably!since!mid,2007,!from!0.08!to!0.59!and!from!1.9!to!25.28,!respectively.7!On!rice!markets!the!average!PT!coefficient!does!not!change!after!July!2007.!The!short,run!adjustment!coefficients!(α1)!for!maize!
!!!!!!!!!!!!!!!!!!!!!!!!!!!!!!!!!!!!!!!!!!!!!!!!!!!!!!!!!!!!!6!Similar!results!were!found!for!the!other!countries!in!our!sample.!7!The!implausibly!large!average!PT!elasticity!result!is!caused!by!an!outlier!for!an!Ethiopian!wheat!market!with!an!estimated!β!of!166.8!after!July!2007.!!
0%! 0%!0%!10%!20%!30%!40%!50%!60%!70%!80%!90%!100%!
enmre!period! before!2007! aser!2007! enmre!period! before!2007! aser!2007!
significant!α1! significant!α2!
maize!rice!wheat!
! 14!
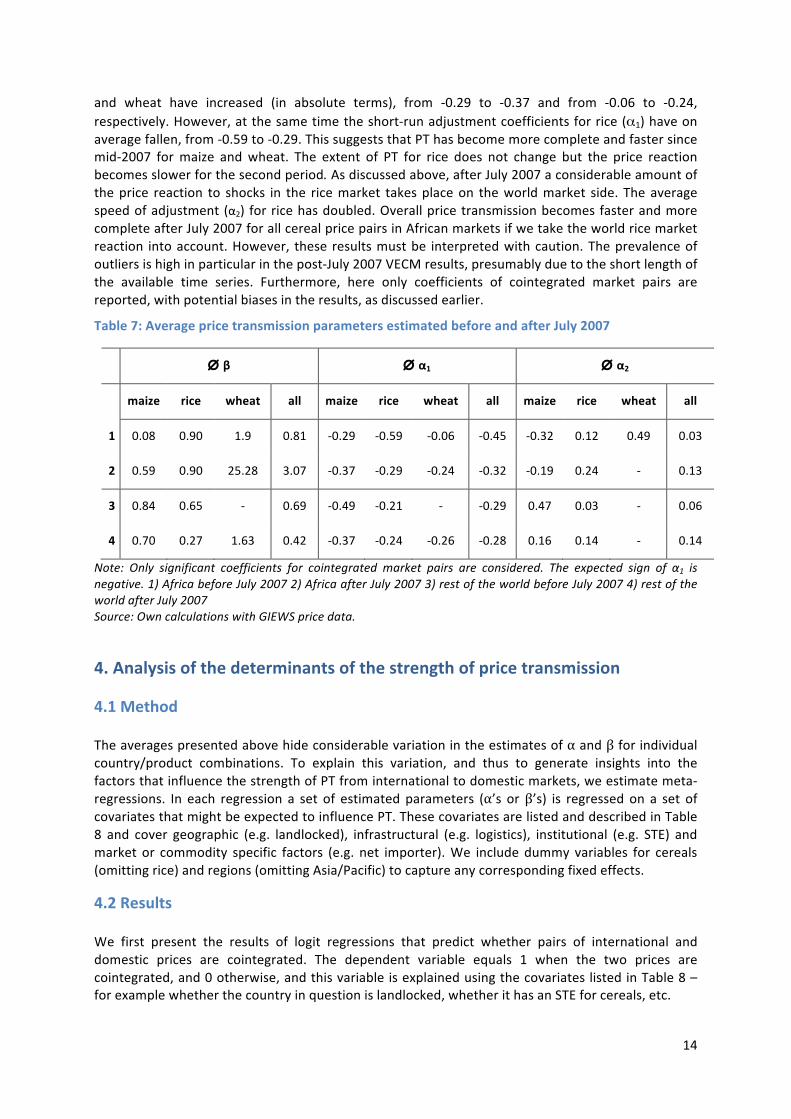
and! wheat! have! increased! (in! absolute! terms),! from! ,0.29! to! ,0.37! and! from! ,0.06! to! ,0.24,!respectively.!However,!at!the!same!time!the!short,run!adjustment!coefficients!for!rice!(α1)!have!on!average!fallen,!from!,0.59!to!,0.29.!This!suggests!that!PT!has!become!more!complete!and!faster!since!mid,2007! for!maize! and!wheat.! The! extent! of! PT! for! rice! does! not! change! but! the! price! reaction!becomes!slower!for!the!second!period.!As!discussed!above,!after!July!2007!a!considerable!amount!of!the!price! reaction! to! shocks! in! the! rice!market! takes!place!on! the!world!market! side.! The!average!speed!of!adjustment!(α2)! for!rice!has!doubled.!Overall!price!transmission!becomes!faster!and!more!complete!after!July!2007!for!all!cereal!price!pairs!in!African!markets!if!we!take!the!world!rice!market!reaction! into!account.!However,! these! results!must!be! interpreted!with!caution.!The!prevalence!of!outliers!is!high!in!particular!in!the!post,July!2007!VECM!results,!presumably!due!to!the!short!length!of!the! available! time! series.! Furthermore,! here! only! coefficients! of! cointegrated! market! pairs! are!reported,!with!potential!biases!in!the!results,!as!discussed!earlier.!
Table"7:"Average"price"transmission"parameters"estimated"before"and"after"July"2007"
" ∅ "β" ∅ "α1" ∅ "α2"
"
maize" rice" wheat" all" maize" rice" wheat" all" maize" rice" wheat" all"
1" 0.08! 0.90! 1.9! 0.81! ,0.29! ,0.59! ,0.06! ,0.45! ,0.32! 0.12! 0.49! 0.03!
2" 0.59! 0.90! 25.28! 3.07! ,0.37! ,0.29! ,0.24! ,0.32! ,0.19! 0.24! ,! 0.13!
3" 0.84! 0.65! ,! 0.69! ,0.49! ,0.21! ,! ,0.29! 0.47! 0.03! ,! 0.06!
4" 0.70! 0.27! 1.63! 0.42! ,0.37! ,0.24! ,0.26! ,0.28! 0.16! 0.14! ,! 0.14!
Note:% Only% significant% coefficients% for% cointegrated% market% pairs% are% considered.% The% expected% sign% of% α1% is%negative.%1)%Africa%before%July%2007%2)%Africa%after%July%2007%3)%rest%of%the%world%before%July%2007%4)%rest%of%the%world%after%July%2007%Source:%Own%calculations%with%GIEWS%price%data.%
4."Analysis"of"the"determinants"of"the"strength"of"price"transmission"
4.1"Method"
The!averages!presented!above!hide!considerable!variation!in!the!estimates!of!α!and!β!for!individual!country/product! combinations.! To! explain! this! variation,! and! thus! to! generate! insights! into! the!factors!that!influence!the!strength!of!PT!from!international!to!domestic!markets,!we!estimate!meta,regressions.! In! each! regression! a! set! of! estimated! parameters! (α’s! or!β’s)! is! regressed! on! a! set! of!covariates!that!might!be!expected!to!influence!PT.!These!covariates!are!listed!and!described!in!Table!8! and! cover! geographic! (e.g.! landlocked),! infrastructural! (e.g.! logistics),! institutional! (e.g.! STE)! and!market! or! commodity! specific! factors! (e.g.! net! importer).!We! include! dummy! variables! for! cereals!(omitting!rice)!and!regions!(omitting!Asia/Pacific)!to!capture!any!corresponding!fixed!effects.!
4.2"Results""
We! first! present! the! results! of! logit! regressions! that! predict! whether! pairs! of! international! and!domestic! prices! are! cointegrated.! The! dependent! variable! equals! 1! when! the! two! prices! are!cointegrated,!and!0!otherwise,!and!this!variable!is!explained!using!the!covariates!listed!in!Table!8!–!for!example!whether!the!country!in!question!is!landlocked,!whether!it!has!an!STE!for!cereals,!etc.!

! 15!
Table"8:"Covariates"used"in"the"metaLanalysis"of"the"determinants"of"price"transmission"
Name" Description" Source"/"link" Expectation"/"theory"Commodity!fixed!effects! Wheat,!maize,!rice! ! Unobserved!commodity,
specific!heterogeneity!
Region!fixed!effects!
Europe;!East!and!South!Africa;!West!and!Central!Africa;!MENA!and!Asia;!Oceania;!Latin!America!
http://unstats.un.org/unsd/methods/m49/m49regin.htm!
Unobserved!region,specific!heterogeneity!
Landlocked! 1!if!country!has!no!access!to!sea! Google!maps!For!landlocked!countries,!international!trade!must!cross!more!borders!
Trade!openness!
Total!trade!as!a!share!of!income,!average!2006,2010!(Import!+!Export!/GDP)!
World!Bank!Development!Indicators!
Open!economies!are!better!integrated!into!world!markets!and!thus!PT!should!be!stronger!
STE! 1!for!countries!that!have!state!trading!enterprises!(STEs)! Literature*!
STEs!interfere!with!trade!and!insulate!the!domestic!prices!from!international!fluctuations!
Ease!of!trade!
Ease!of!trading!across!borders,!!between!0!(worst)!to!1!(best)!
World!Bank,!Doing!Business,!Ease!of!Trading!across!borders.!
Transaction!costs!reduce!PT!
Logistics!
Logistics!performance!index!of!quality!of!trade!and!transport,related!infrastructure!between!1!(worst)!to!5!(best)!
World!Bank!2007! Better!logistics!mean!lower!costs!of!trade!and!higher!PT!
Net!importer!
Net!cereal!import!ratio!(export!–!import,!3!year!average!2009,2011)!to!domestic!consumption!
USDA!,!PSD!Online!
If!the!share!of!staple!imports!in!domestic!consumption!is!high,!more!is!undertaken!to!insulate!domestic!markets!
Retail!1!if!domestic!price!is!measured!at!the!retail!rather!than!a!more!upstream!level!
Literature!/!GIEWS!The!farther!‘inland’!a!domestic!price!is!measured,!the!weaker!its!link!to!international!prices!!
Note:%*%See%Appendix%Table%14%for%a%list%of%the%countries%with%STEs.%
Maize!and!wheat!are!less!likely!to!be!cointegrated!with!the!corresponding!international!prices!than!rice!prices!are! (by!roughly!30!and!20%,!respectively),!and!domestic!prices! in!East!and!South!Africa,!West! and! Central! Africa! and! Latin! America! are! more! likely! to! be! cointegrated! with! international!prices!(by!25,!32!and!19%,!respectively).!As!we!would!expect,!if!an!STE!is!responsible!for!trading!the!product!in!question,!the!probability!of!cointegration!falls!by!almost!22%.!If!the!domestic!price!being!considered! is! a! retail! price,! the! probability! that! it! is! cointegrated!with! international! prices! falls! by!almost! 13%.! This! result! is! plausible,! as! retail! prices! are! further! removed! from! international! prices!than!wholesale!or!border!prices.!Improvements!in!logistics!have!a!surprising!negative!impact!on!the!probability! of! cointegration! between! domestic! and! international! prices.! Ease! of! trade! has! the!expected!positive! impact,!and!being! landlocked!the!expected!negative! impact!on!the!probability!of!cointegration,!but!neither!of! these!effects! is! significant.! A!high!net! import! ratio!may! lead! to!more!policy! intervention!to!insulate!domestic!markets!from!international!price!movements,!however!this!is!not!reflected!in!the!results.!Most!of!these!results!also!hold!if!only!the!time!period!after!July!2007!is!considered.!However,! if!the!period!prior!to!July!2007!is!considered!the!logit!regression!is!much!less!informative.!This!is!probably!due!to!the!fact!that!many!GIEWS!price!series!are!very!short!prior!to!July!2007,!leaving!too!few!observations!for!dependable!cointegration!testing.!Hence,!the!logit!regression!for!the!pre,July!2007!period!is!based!on!fewer!and!less!trustworthy!test!results."!
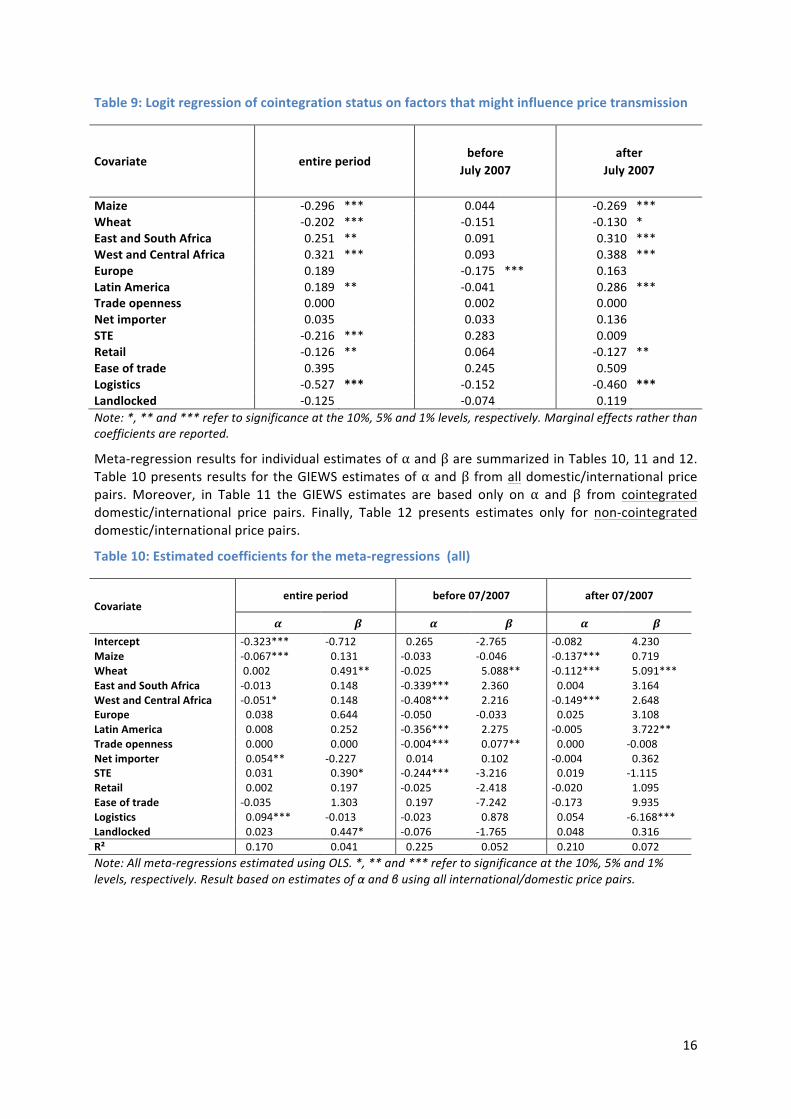
! 16!
Table"9:"Logit"regression"of"cointegration"status"on"factors"that"might"influence"price"transmission"
Covariate" entire"period"before""
July"2007"
"after""
July"2007""
Maize" ,0.296! ***! 0.044! ! ,0.269! ***!Wheat" ,0.202! ***! ,0.151! ! ,0.130! *!East"and"South"Africa" 0.251! **! 0.091! ! 0.310! ***!West"and"Central"Africa" 0.321! ***! 0.093! ! 0.388! ***!Europe" 0.189! ! ,0.175! ***! 0.163! !Latin"America" 0.189! **! ,0.041! ! 0.286! ***!Trade"openness" 0.000! ! 0.002! ! 0.000! !Net"importer" 0.035! ! 0.033! ! 0.136! !STE" ,0.216! ***! 0.283! ! 0.009! !Retail" ,0.126! **! 0.064! ! ,0.127! **!Ease"of"trade" 0.395! ! 0.245! ! 0.509! !Logistics" ,0.527! ***" ,0.152! " ,0.460! ***"Landlocked" ,0.125! " ,0.074! " 0.119! "Note:%*,%**%and%***%refer%to%significance%at%the%10%,%5%%and%1%%levels,%respectively.%Marginal%effects%rather%than%coefficients%are%reported.%
Meta,regression!results!for!individual!estimates!of!α!and!β!are!summarized!in!Tables!10,!11!and!12.!Table!10!presents!results! for! the!GIEWS!estimates!of!α!and!β! from!all!domestic/international!price!pairs.! Moreover,! in! Table! 11! the! GIEWS! estimates! are! based! only! on! α! and! β! from! cointegrated!domestic/international! price! pairs.! Finally,! Table! 12! presents! estimates! only! for! non,cointegrated!domestic/international!price!pairs.!!
Table"10:"Estimated"coefficients"for"the"metaLregressions""(all)"
Covariate"entire"period" before"07/2007" after"07/2007"
!" !" !" !" !" !"Intercept" ,0.323***! ,0.712! !!0.265! ,2.765! ,0.082! !!4.230!Maize" ,0.067***! !!0.131! ,0.033! ,0.046! ,0.137***! !!0.719!Wheat" !0.002! !!0.491**! ,0.025! !!5.088**! ,0.112***! !!5.091***!East"and"South"Africa" ,0.013! !!0.148! ,0.339***! !!2.360! !!0.004! !!3.164!West"and"Central"Africa" ,0.051*! !!0.148! ,0.408***! !!2.216! ,0.149***! !!2.648!Europe" !!0.038! !!0.644! ,0.050! ,0.033! !!0.025! !!3.108!Latin"America" !!0.008! !!0.252! ,0.356***! !!2.275! ,0.005! !!3.722**!Trade"openness" !!0.000! !!0.000! ,0.004***! !!0.077**! !!0.000! ,0.008!Net"importer" !!0.054**! ,0.227! !!0.014! !!0.102! ,0.004! !!0.362!STE" !!0.031! !!0.390*! ,0.244***! ,3.216! !!0.019! ,1.115!Retail" !!0.002! !!0.197! ,0.025! ,2.418! ,0.020! !!1.095!Ease"of"trade" ,0.035! !!1.303! !!0.197! ,7.242! ,0.173! !!9.935! !Logistics" !!0.094***! ,0.013! ,0.023! !!0.878! !!0.054! ,6.168***! "Landlocked" !!0.023! !!0.447*! ,0.076! ,1.765! !!0.048! !!0.316!R²" !!0.170! !!0.041! !!0.225! !!0.052! !!0.210! !!0.072!Note:%All%metaUregressions%estimated%using%OLS.%*,%**%and%***%refer%to%significance%at%the%10%,%5%%and%1%%levels,%respectively.%Result%based%on%estimates%of%α%and%β%using%all%international/domestic%price%pairs.%

! 17!
Table"11:"Estimated"coefficients"for"the"metaLregressions"(cointegrated)"
Covariate"entire"period" before"07/2007" after"07/2007"
!" !" !" !" !" !"Intercept" ,0.262*! !!0.725! !!0.718! ,0.504! !!0.045! ,5.871!Maize" ,0.069**! !!0.057! ,0.068! !!0.009! ,0.167***! ,1.441!Wheat" !!0.034! !!0.146! ,0.591! !!0.279! ,0.170**! !!8.762**!East"and"South"Africa" ,0.033! ,0.017! ,0.778***! ,0.178! ,0.041! !!5.596!West"and"Central"Africa" ,0.031! ,0.008! ,0.977***! !!0.024! ,0.184**! !!3.069!Europe" !!0.078! !!0.393! !!!!!!,! !!!!!!,! !!0.130! !!5.941!Latin"America" ,0.015! !!0.142! ,1.043***! !!0.300! ,0.023! !!4.023!Trade"openness" !!0.000! !!0.001! ,0.008***! !!0.004! !!0.000! !!0.000!Net"importer" !!0.053! ,0.160! !!0.278! ,0.900*! ,0.005! !!0.720!STE" ,0.023! !!0.141! ,0.826***! ,0.038! !!0.043! ,2.963!Retail" ,0.020! !!0.004! !!0.008! ,0.094! ,0.054! !!1.546!Ease"of"trade" !!0.118! !!0.433! !!0.882! ,0.826! !!0.148! !!3.976! !Logistics" !!0.038! ,0.282! ,0.006! !!0.504! ,0.113! ,0.152! "Landlocked" !!0.008! !!0.156! ,0.089! !!0.211! !!0.143**! !!1.633!R²" !!0.101! !!0.032! !!0.489! !!0.212! !!0.265! !!0.119!Note:%The%sample%before%July%2007%includes%too%few%observations%for%Europe%to%permit%estimation.%*,%**%and%***%refer%to%significance%at%the%10%,%5%%and%1%%levels,%respectively.%Results%based%on%estimates%of%α%and%β%only%from%cointegrated%international/domestic%price%pairs.%
The!meta,regressions! in!Table!10,!which!are!based!on!all!estimates!of!α!and!β,!are!generally!quite!similar! to! the!corresponding!meta,regressions! in!Table!11,!which!are!based!only!on!estimates!of!α!and!β!from!cointegrated!domestic/international!price!pairs.!For!example,!in!both!tables!we!see!in!the!second!column!that!α!is!roughly!7!percentage!points!more!negative!for!maize!prices!than!for!rice!and!wheat!prices,!suggesting!that!PT!on!maize!markets!is!somewhat!more!rapid.!This!supports!the!finding!in!Table!5!that!α’s!for!maize!tend!to!be!somewhat!larger!(in!magnitude).8! Indeed,!this!result! is!also!corroborated!by!the!results! in!Table!12!which!are!based!only!on!non,cointegrated!price!pairs.!Here!the!estimated!coefficient!for!maize!indicates!that!α!is!roughly!8!percentage!points!more!negative!for!maize!prices.!
Similar!parallels!can!be!found!across!all!three!tables!for!example!for!the!West!and!Central!Africa!fixed!effect! (,5.1! percentage! points! in! Table! 9,! ,3.1! percentage! points! in! Table! 10,! and! ,7.7! percentage!points! in! Table! 11)! and! for! the! ratio! of! net! imports! to! consumption! (5.4,! 5.3! and! 5.8! percentage!points! less! error! correction! according! to! the! results! in! Tables! 9,! 10! and! 11,! respectively).! Some!parallel! findings!are! counter,intuitive,!however.! In!particular,! in!both!Table!9!and!Table!10!we! see!that! improvements! in! logistics! are! associated!with! large! (less! negative)! values! of!α,! and! therefore!with!slower!PT.!
!!!!!!!!!!!!!!!!!!!!!!!!!!!!!!!!!!!!!!!!!!!!!!!!!!!!!!!!!!!!!8!In!Table!5!we!consider!only!significant!coefficients.!

! 18!
Table"12:"Estimated"coefficients"for"the"metaLregressions"(not"cointegrated)""
Covariate"entire"period" before"07/2007" after"07/2007"
!" !" !" !" !" !"Intercept" ,0.315***! ,1.893! !!0.285! !!!,5.128! ,0.021! !!!6.038!Maize" ,0.083***! !!0.200! ,0.036! !!!!0.406! ,0.150***! !!!1.342!Wheat" ,0.007! !!0.639*! !!0.009! !!!!7.028**! ,0.115***! !!!4.451*!East"and"South"Africa" !!0.001! !!0.250! ,0.253***! !!!!4.144! !!0.038! !!!2.742!West"and"Central"Africa" ,0.077**! !!0.161! ,0.348***! !!!!3.155! ,0.105***! !!!2.651!Europe" !!0.016! !!0.807! !!0.016! !!!!0.122! ,0.001! !!!3.242!Latin"America" !!0.029! !!0.263! ,0.211***! !!!!3.624! !!0.013! !!!4.422*!Trade"openness" !!0.001**! ,0.002! ,0.002***! !!!!0.093**! !!0.000! !!,0.006!Net"importer" !!0.058*! ,0.187! ,0.012! !!!!0.311! ,0.015! !!!0.592!STE" !!0.043*! !!0.431! ,0.130***! !!!,5.846*! !!0.020! !!,0.318!Retail" !!0.007! !!0.362! ,0.039! !!!,3.046! ,0.012! !!!0.636!Ease"of"trade" ,0.194! !!2.220! ,0.149! ,12.210! ,0.347**! 12.656! !Logistics" !!0.120***! !!0.191! ,0.032! !!!!2.257! !!0.073! !,7.854***! "Landlocked" !!0.010! !!0.629! ,0.082! !!!,2.150! !!0.008! !,1.625!R²" !!0.239! !!0.059! !!0.222! !!!!0.080! !!0.293! !!!0.075!Note:%The%sample%before%July%2007%includes%too%few%observations%for%Europe%to%permit%estimation.%*,%**%and%***%refer%to%significance%at%the%10%,%5%%and%1%%levels,%respectively.%Results%based%on%estimates%of%α%and%β%only%from%nonUcointegrated%international/domestic%price%pairs.%
Moving!to!the!results!for!the!pre,July!2007!period,!we!again!see!many!parallels!between!Tables!10,!11! and! 12.! In! particular,! all! three! tables! display! evidence! of! significantly! more! negative!α‘s! (and!therefore!more!rapid!PT)!for!East!and!South!Africa!and!West!and!Central!Africa,!for!Latin!America,!for!more!trade!open!countries!and,!surprisingly,!for!countries!with!STEs.!In!the!post,July!2007!period,!the!results!in!all!three!tables!point!to!significantly!more!negative!α‘s!for!maize!and!wheat,!and!for!West!and!Central!Africa.!!
These! parallels! are! less! apparent! for! the!meta,regressions! in! Tables! 9,! 10! and! 11! that! explain! the!variation! in! the!β’s.!Overall,! the!meta,regressions! indicate! that! the! selected! covariates! are!able! to!explain! a! larger! proportion! of! the! variance! in! the! adjustment! parameters! (the! α‘s)! than! of! the!variance! in! the! long,run! price! transmission! coefficients! (the! β’s).! The! meta,regressions! for! the!estimates! of! β! generally! produce! fewer! significant! coefficients,! and! they! also! produce! many!coefficients!that!are!implausibly!large,!especially!in!the!pre,!and!post,July!2007!subsamples.!Since!β!is!expected! to! be! close! to! 1,! it! is! difficult! for! example! to! interpret! coefficients! that! suggest! that! β!increases!by!over!7!for!price!pairs!involving!wheat,!or!falls!by!almost!6!in!the!presence!of!an!STE!(see!the!second!column!of!Table!11).!
In!summary,!the!meta,regressions!for!the!α‘s!do!generate!a!few!signals.!In!particular,!there!is!strong!evidence! of!more! rapid! PT! for!maize! across! all! of! the! GIEWS! results! regardless! of! what! period! is!considered! and! whether! cointegrated! and/or! non,cointegrated! results! are! considered.! Similarly,!evidence! of! more! rapid! PT! in! Latin! America! appears! repeatedly! in! Tables! 9! through! 11.! There! is!weaker! evidence! for! a! positive! relationship! between! trade! openness! and! the! speed! of! PT,! and! a!negative! relationship! between! net! import! ratios! and! PT.! Before! July! 2007! it! appears! that! PT! was!stronger!in!the!presence!of!STEs,!and!when!estimation!is!carried!out!without!allowance!for!a!break!in!July!2007,! it!appears! that!better! logistics!are!associated!with! slower!PT.!These! last! two! results! run!counter!to!our!a%priori!expectations.!The!meta,regressions!for!the!β’s!have!lower!explanatory!power!than!those!for!the!α‘s,!and!they!fail!to!produce!many!robust!and!plausible!results.9!!
!!!!!!!!!!!!!!!!!!!!!!!!!!!!!!!!!!!!!!!!!!!!!!!!!!!!!!!!!!!!!9!We! also! experimented!with!weighted!meta,regressions! that! account! for! the! fact! that! some! countries! are!more! prevalent! in! the! GIEWS! data! than! others.! These! meta,regressions! did! not! generate! any! additional!insights.!
! 19!
5."Discussion"The!results!provide!evidence!that!international!cereal!price!changes!are!transmitted!more!frequently,!stronger!and!faster!to!domestic!markets! in!African!countries!compared!with!other!countries!of! the!sample.! Roughly! every! second! cereal! price! is! cointegrated! with! the! international! reference! price!whereas!this!is!only!the!case!for!35%!of!the!price!pairs!in!Asia,!Pacific!region,!Latin!America,!Europe!and!Oceania.!Furthermore,!the!results!point!to!relatively!slow!PT!for!all!cereal!products!and!regions,!but!with!the!main!part!of!a!price!change!being!transmitted!in!the!long!run.!Overall,!the!estimates!for!markets! in!Africa!point!to!average! long,run!PT!coefficients!of!roughly!0.73!and!average!adjustment!parameters!of!roughly!0.27.!This!suggests!that!on!average!73%!of!a!change!in!international!prices!will!be! transmitted! to! domestic!markets,! and! that! it! takes! approximately! 2.2!months! for! one,half! of! a!given! price! shock! on! international! cereal!markets! to! be! transmitted! to! domestic!markets.! In! non,African!countries,!64%!of!an!international!price!change!is!transmitted!in!the!long!run!with!half!of!the!price!response!within!3.3!months.!
African!rice!markets!show!the!highest!share!of!cointegrated!price!pairs!(68%),!the!largest!long,run!PT!coefficient!and!the!fastest!price!reaction.!For!wheat!and!maize!it! is!mostly!the!domestic!prices!that!react!to!disequilibrium!between!themselves!and!the!corresponding!world!reference!prices.!But!in!the!case!of!rice,!more!than!60%!of!all!price!pairs!display!international!price!reactions!to!disequilibrium!as!well.! This! becomes! even! more! apparent! when! comparing! the! period! before! and! after! July! 2007!where!we!find!evidence!for!a!shift!from!predominantly!domestic!price!reactions!to!mainly!reactions!of!the!world!market!price.!Hence,!the!determination!of!international!prices!for!rice!appears!to!differ!fundamentally! from! that! for! wheat! and! maize.! The! reasons! for! this! difference! would! be! an!interesting!topic!for!future!research.!On!maize!markets!there!is!evidence!for!a!change!in!PT!dynamics!indicated!by!cointegration!variations!in!combination!with!a!stronger!and!faster!price!transmission!to!the! domestic! level! after! July! 2007.! This! could! be! interpreted! as! evidence! of! a! certain! degree! of!decoupling! of! local!markets! from! international! prices! in! some! countries,! with! other! countries! left!stronger! affected! by! international! price! changes.! With! a! number! of! caveats! we! find! that! price!transmission!has!become!stronger!for!local!markets!in!Africa!after!the!onset!of!the!recent!phase!of!price!peaks! and! increased!price! volatility! in!mid,2007.! The! results! suggest! that! the!opposite! is! the!case!for!the!country!group!consisting!of!Asia,!the!Pacific!Region,!Latin!America,!Europe!and!Oceania.!!
The! differences! between! African! countries! and! countries! in! other! regions! persist! also! after!controlling!for!a!number!of!economic,!political,!geographical!covariates,!as!well!as!infrastructure!and!trade!variables.10!However,! the!analysis!generates!a!number!of! insights! into! the!drivers!of!PT! from!interntational! to!domestic!cereal!markets.!Employing!meta,regression!analysis! to!explain!variations!in!long,run!PT!coefficients!(β)!between!domestic!and!international!prices!fails!to!generate!compelling!results.!The!meta,regressions!for!the!adjustment!parameters!(α)!do!produce!some!more!suggestive!results.! All! other! things! being! equal,! there! is! some! evidence! of!more! rapid! PT! for!maize! than! for!wheat!and!rice,!and!more!rapid!PT!in!West!and!Central!Africa!and!East!and!South!Africa!than!in!other!regions.! An! increasing! ratio! of! net! imports! to! domestic! consumption! is! associated!with! slower! PT,!which!may!be!an!indication!of!increased!intervention!on!politically!more!sensitive!markets.!There!is!evidence! that! trade! openness! is! positively! associated!with! the! speed! of! PT,! but! this! effect! is! only!significant!in!the!pre,July!2007!period.!In!this!period!there!is!also!robust!evidence!that!the!presence!of!an!STE! is!associated!with!more!rapid!PT.!Finally,!there! is!some!puzzling! indication!that! improved!logistics!is!correlated!with!slower!PT.!
The!results!presented!here!must!be!interpreted!with!caution.!First,!a! lack!of!cointegration!between!two!prices!does!not!necessarily!mean!that!there!is!no!PT!between!(McNew!and!Fackler,!1997).!The!underlying!PT! relationship!may!be!characterized!by! regime,dependence,! for!example!as!a! result!of!policy! intervention! or! shifts! between! net! import! and! net! export! positions.! Hence,! failure! to! find!
!!!!!!!!!!!!!!!!!!!!!!!!!!!!!!!!!!!!!!!!!!!!!!!!!!!!!!!!!!!!!10!Regressions!on!an!income!variable!did!not!produce!any!significant!results.!

! 20!
evidence!of! cointegration!might!be!due! to!a! failure! to! test! for! the! right! type!of! cointegration.!The!strength!of!the!GIEWS!price!data!is!that!it!provides!broad!and!consistent!coverage!of!a!large!number!of! country/product! combinations.! However,! the! sheer! number! of! price! series! available! in! GIEWS!means!it!is!not!possible!to!implement!a!detailed!modeling!strategy!for!each!individual!series.!Instead,!we! must! resort! to! a! uniform!modeling! strategy! that! can! be! automated.!We! have! estimated! one!slightly!more! flexible!VECM!that!allows! for!a! regime!shift! in! July!2007,!but! this! is!no!substitute! for!careful,!case,by,case!specification!and!estimation!of!an!appropriate!model!for!each! individual!price!pair.! Second,! the! GIEWS! price! series! are! quite! short.! Few! series! have! more! than! 150! monthly!observations,!and!many!have!considerably! less.! It! is! reasonable!to!expect! that! the!nature!of!cereal!price!transmission!from!international!to!domestic!markets!has!changed!in!recent!years!at!prices!have!increased!and!become!more!volatile,!and!some!of!the!results!that!we!produce!with!the!GIEWS!data!appear! to! confirm! this! expectation.! There! are,! however,! only! roughly! 55! monthly! observations!available!for!the!period!since!2007.!!
Additional! work!might! lead! to! additional! or! more! robust! insights! into! PT.! First,! the! simple! VECM!employed! to! estimate! the! GIEWS! price! data!might! be!made! somewhat!more! flexible.! It! could! be!modified! to!allow! for!asymmetric!price! transmission,! i.e.! to! test!whether! increases! in! international!prices!are!transmitted!to!domestic!prices! in!the!same!manner!as!decreases!(von!Cramon,Taubadel,!1998).! The! results! of! the! simple! non,parametric! analysis! of! agreement! in! the! direction! of!international! and! domestic! price! changes! suggests! that! increasing! international! prices! are! being!transmitted! more! often! to! domestic! prices! than! decreasing! international! prices.! Alternatively,! it!might! be! possible! to! estimate! threshold! VECMs! (TVECMs)! with! the! GIEWS! data! (Goodwin! and!Piggott,! 2001;! Greb! et! al.,! 2011).! The! TVECM! can! account! for! phases!with! and!without! trade! and!trade!reversals!and!by!distinguishing!between!these!phases!or!regimes!provide!better!estimates!of!PT!parameters.!!
! !

! 21!
6."References"
Akaike,!H.!(1974).!A!new!look!at!the!statistical!model!identification.!IEEE!Transactions!on!Automatic!Control!19:!716–723.!
Ackerman,!K.!(1997).!State!trading!enterprises:!their!role!as!importers.!Agricultural!Outlook.!Economic!Research!Service/USDA.!November!1997:!31,37.!
Ackerman,!K.!(1998).!State!trading!enterprises!in!world!agricultural!trade.!Agriculture!in!the!WTO.!Economic!Research!Service/USDA.!December!1998:!43,47.!!
Ackermann,!K.!&!Dixit,!P.!(1999):!Introduction!to!State!Trading!in!Agriculture.!Economic!Research!Service/USDA,!Agricultural!Economics!Report!No.!AER!783,!November!1999.!
Ardeni,!P.!G.!(1989).!Does!the!Law!of!One!price!Really!Hold!for!Commodity!Prices?!American!Journal!of!Agricultural!Economics!71:!661,669.!
Barrett,!C.!and!Li,!J.!(2002).!Distinguishing!between!equilibrium!and!integration!in!spatial!price!analysis.!American!Journal!of!Agricultural!Economics!84:!292–307.!
Chang,!H.,H.,!&!de!Gorter,!H.!(2004).!Tariff!rate!import!quotas,!domestic!market!structure!and!agricultural!support!programs!,!The!Case!of!Taiwanese!Rice!Imports.!Selected!paper!prepared!for!presentation!at!the!Western!Agricultural!Economics!Association!Annual!Meeting,!Honolulu,!Hawaii,!June!30,July!2,!2004.!
Dickey,!D.A.!and!Fuller,!W.A.!(1979).!Distribution!of!the!estimators!for!autoregressive!time!series!with!a!unit!root.!Journal!of!the!American!Statistical!Association!74:!427–431.!
Engle,!R.F.!and!Granger,!C.W.J.!(1987).!Cointegration!and!Error,correction:!Representation,!Estimation!and!Testing.!Econometrica!55:!251,276.!
Fackler,!P.!L.!and!Goodwin!B.!K.!(2001).!Spatial!Price!Analysis.!In:!Gardner!B.!and!Rausser,!G.!(eds.),!Handbook!of!Agriculture!Economics,!Vol.!1:!971,1024.!Amsterdam:!Elsevier!Science!B.V.!
Gilbert,!C.L.!(2011).!Grain!Price!Pass,Through,!2005,2009.!In:!Prakash,!A.!(ed.),!Safeguarding!Food!Security!in!Volatile!Global!Markets.!Rome,!FAO.!http://www.fao.org/docrep/013/i2107e/i2107e07.pdf.!
Gregory,!A.W.!and!Hansen,!B.E.!(1996).!Residual,based!tests!for!cointegration!in!models!with!regime!shifts.!Journal!of!Econometrics,!70:!99,126.!
Goodwin,!B.K.!and!Piggott,!N.E.!(2001).!Spatial!Market!Integration!in!the!Presence!of!Threshold!Effects.!American!Journal!of!Agricultural!Economics!83(2):!302,317.!
Greb,!F.,!Jamora,!N.,!Mengel,!C.,!von!Cramon,Taubadel,!S.!and!Würriehausen,!N.!(2012):!Price!transmission!from!international!to!domestic!markets.!.!Discussion!paper!of!the!Courant!Research!Centre!"Poverty,!Equity!and!Growth!in!Developing!Countries:!Statistical!Methods!and!Empirical!Analyses"!No.!125.!Georg,August!University!Göttingen.!
Greb,!F.,!von!Cramon,Taubadel,!S.,!Krivobokova,!T.!and!Munk,!A.!(2011).!Threshold!estimation!in!price!transmission!analysis.!Discussion!paper!of!the!Courant!Research!Centre!"Poverty,!Equity!and!Growth!in!Developing!Countries:!Statistical!Methods!and!Empirical!Analyses"!No.!103.!Georg,August!University!Göttingen.!
Gupta,!S.!and!Mueller,!R.!(1982).!Analyzing!the!Pricing!Efficiency!in!Spatial!Markets;!Concept!and!Applications.!European!Review!Agricultural!Economics!9:!301,312.!
Hassouneh,!I.,!Serra,!T.!and!Gil,!J.M.!(2010).!Price!transmission!in!the!Spanish!bovine!sector:!the!BSE!effect.!Agricultural!Economics!41:33,42.!

! 22!
Hassouneh,!I.,!von!Cramon,Taubadel,!S.,!Serra,!T.!and!Gil,!J.M.!(2012).!Recent!Developments!in!the!Econometric!Analysis!of!Price!Transmission.!TRANSFOP!(Transparency!of!Food!Pricing)!Working!Paper!No.!2,!www.transfop.eu.!
Johansen,!S.!(1988).!Statistical!analysis!of!cointegrating!vectors.!Journal!of!Economic!Dynamics!and!Control!12:!231,254.!
Kwiatkowski,!D.,!Phillips,!P.,!Schmidt,!P.!and!Shin,!Y.!(1992).!Testing!the!null!hypothesis!of!stationarity!against!the!alternative!of!a!unit!root.!Journal!of!Econometrics!54:!159,178.!
Meyer,!J.!(2004).!Methoden!zur!Analyse!von!Preistransmissionsprozessen.!Dissertation,!Georg,August,Universität!Göttingen.!
Meyer,!J.,!and!von!Cramon,Taubadel,!S.!(2004).!Asymmetric!Price!Transmission:!A!Survey.!Journal!of!Agricultural!Economics!55(3):!581,611.!
McNew,!K.,!and!Fackler,!P.L.!(1997).!Testing!Market!Equilibrium:!Is!Cointegation!Informative?!Journal!of!Agricultural!and!Resource!Economics!22(2):!191,207.!
OECD!(2007).!Agricultural!Policies!in!Non,OECD!Countries!,!Monitoring!and!Evaluation.!OECD,!Paris.!
Rapsomanikis,!G.,!Hallam,!D.!and!Conforti,!P.!(2003).!Market!Integration!and!Price!Transmission!in!Selected!Food!and!Cash!Crop!Markets!of!Developing!Countries:!Review!and!Applications.!Commodity!Market!Review,!FAO!Commodities!and!Trade!Division,!Rome.!
Ravallion,!M.!(1986).!Testing!Market!Integration.!American!Journal!of!Agriculture!Economics!68:!102,109.!
Serra,!T.,!Gil,!J.M.!and!Goodwin,!B.!K.!(2006).!Local!polynomial!fitting!and!spatial!price!relationship:!price!transmission!in!EU!pork!markets.!European!Review!of!Agricultural!Economics!33:!415,436.!
Serra,! T.! and!Goodwin,!B.! K.! (2003).! Price! transmission! and!asymmetric! adjustment! in! the! Spanish!dairy!sector.!!Applied!Economics!35:!1889,1899.!
Takayama,! T.! and! Judge! G.G.! (1971).! Spatial! and! Temporal! Price! Allocation! Models.! Amsterdam:!North,Holland.!
Teräsvirta,! T.,! 1994.! Specification,! estimation,! and! evaluation! of! smooth! transition! autoregressive!models.!Journal!of!the!American!Statistical!Association!89:!208,218.!
von!Cramon,Taubadel,!S.!(1998).!Estimating!asymmetric!Price!Transmission!with!the!Error!Correction!Representation:!An!Application!to!the!German!Pork!Market.!European!Review!of!Agricultural!Economics!25:!1,18.!
von!Cramon,Taubadel,!S.!and!Amikuzuno,!J.!(2012).!Seasonal!Variation!in!Price!Transmission!between!Tomato!Markets!in!Ghana.!Journal!of!African!Economies,!doi:10.1093/jae/ejs008.!
Young,!L.!M.!(1999).!Prevalence!and!Reform!of!State!Trading!Importers!in!World!Grain!Markets.!Canadian!Journal!of!Agricultural!Economics!47(4):!351,362.!!
Young,!L.!M.,!and!Abbott,!P.!C.!(1998).!Wheat,Importing!State!Trading!Enterprises :!Impacts!on!the!World!Wheat!Market.!Paper!presented!at!the!meetings!of!the!American!Agricultural!Economics!Association,!Salt!Lake!City,!August!2,5,!1998.!! !

! 23!
7."Appendix"!
Table"13:"List"of"studies"analysing"world"to"domestic"price"transmission"for"African"countries"
Authors,""Year"
Published"Title" Institution"/"
Publication"Type"of"
publication"
Number"of"
market"pairs"
Country"
Baquedano,!Liefert,!&!Shapouri,!2011!
World!market!integration!for!export!and!food!crops!in!developing!countries:!a!case!study!for!Mali!and!Nicaragua!
Agricultural!Economics! Journal! 4!
Mali!
Gilbert,!2011! Grains!Price!Pass,Through,!2005,09! FAO! Report! 10! Benin,!Kenya,!Malawi!
Minot,!2011! Transmission!of!World!Food!Price!Changes!to!Markets!in!Sub,Saharan!Africa! IFPRI! Report! 58!
Ethiopia,!Kenya,!Malawi,!Mozambique,!South!
Africa,!Tanzania,!Uganda,!Zambia,!Ghana,!!
Myers!&!Jayne,!2011!
Multiple,regime!spatial!price!transmission!with!an!application!to!maize!markets!in!southern!Africa!
American!Journal!of!Agricultural!Economics!
Journal! 3!Zambia!
Bamuturaki,!2009!
World!market!integration!and!price!transmission!in!selected!markets!in!Tanzania! U!of!Hohenheim! Thesis! 2! Tanzania!
Rapsomanikis!et!al.,!2009!
The!2007,2008!Food!Price!Swing:!Impact!and!policies!in!Eastern!and!Southern!Africa! FAO! Report! 42! Kenya,!Malawi,!South!
Africa,!Uganda,!Zambia!World!Bank,!2009!
Eastern!Africa:!A!study!of!the!regional!maize!market!and!marketing!costs!
U!of!Göttingen,!World!Bank! Report! 12! Kenya,!Tanzania,!Uganda!
Cudjoe,!Breisinger,!&!Diao,!2008!
Local!impacts!of!a!global!crisis:!food!price!transmission!and!poverty!impacts!in!Ghana! IFPRI! Report! 2!
Ghana!
Thomas!&!Morrison,!2006!
Trade!reforms!and!food!security:!Country!Case!Studies!and!Synthesis! FAO! Report! 18! Tanzania!
Conforti,!2004! Price!transmission!in!selected!agricultural!markets! FAO! Report! 134! Egypt,!Ethiopia,!Ghana,!Senegal,!Uganda!
Baffes!&!Gardner,!2003!
The!transmission!of!world!commodity!prices!to!domestic!markets!under!policy!reforms!in!developing!countries!
Journal!of!Policy!Reform! Journal! 44!
Egypt,!Ghana,!Madagascar!
Rapsomanikis!et!al.,!2003!
Market!integration!and!price!transmission!in!selected!food!and!cash!crop!markets!of!developing!countries:!review!and!applications!
FAO! Report! 3!Ethiopia,!Rwanda,!
Uganda!(coffee),!Egypt!(wheat)!
!
Table"14:"Countries"with"state"trading"enterprises"(STEs)"for"maize,"rice"or"wheat"
Product" Countries"with"STEs"Maize! China,!Kenya,!Malawi,!Zambia,!Zimbabwe!Rice! Australia,!China,!Dominican!Republic,!India,!Iraq,!Japan,!Kenya,!Korea,!Malaysia,!
Pakistan,!Philippines,!Thailand,!Vietnam!Wheat! Australia,!Canada,!China,!Cyprus,!Egypt,!Arab!Rep.,!India,!Iran,!Japan,!Korea,!
Pakistan,!Sri!Lanka,!Sudan,!Syria,!Tajikistan,!Tunisia!Source:%Compiled%using%Ackerman%(1997;%1998),%Ackerman%and%Dixit%(1999),%Chang%and%de%Gorter%(2004),%OECD%(2007),%Young%(1999)%and%Young%and%Abbott%(1998).%

!
24!!
Table&15:&Cointegration&between&international&and&domestic&prices&by&product&and&country&
Country&
Maize& Rice& Wheat&entire!period! pre,!break! post,!break! entire!period! pre,!break! post,!break! entire!period! pre,!break! post,!break!#!of!cointegrated!pairs!
#!of!pairs!
#!of!cointegrated!pairs!
#!of!pairs!
#!of!cointegrated!pairs!
#!of!pairs!
#!of!cointegrated!pairs!
#!of!pairs!
#!of!cointegrated!pairs!
#!of!pairs!
#!of!!cointegrated!pairs!
#!of!pairs!
#!of!cointegrated!pairs!
#!of!pairs!
#!of!cointegrated!pairs!
#!of!pairs!
#!of!cointegrated!pairs!
#!of!pairs!
Afghanistan! ! ! ! ! ! ! ! ! ! ! ! ! 3! 4! 0! 4! 2! 4!Argentina! 1! 1! 0! 1! 1! 1! ! ! ! ! ! ! 0! 3! 0! 3! 0! 3!Bangladesh! ! ! ! ! ! ! ! ! ! ! ! ! 0! 4! 0! 3! 0! 4!Benin! 7! 7! 5! 7! 2! 7! 4! 4! 3! 4! 1! 4! ! ! ! ! ! !Bhutan! ! ! ! ! ! ! 1! 2! ! ! 1! 2! 0! 1! ! ! 0! 1!Bolivia! 1! 3! 1! 3! 1! 3! 4! 6! 0! 6! 4! 6! 0! 3! 0! 3! 0! 3!Brazil! 1! 2! 0! 2! 0! 2! 3! 5! 0! 5! 0! 5! 1! 2! 0! 2! 0! 2!Burkina!Faso! ! ! ! ! ! ! 8! 9! 0! 3! 8! 9! ! ! ! ! ! !Burundi! 0! 1! 0! 1! 0! 1! 0! 1! 0! 1! 0! 1! 0! 1! 0! 1! 0! 1!Cambodia! ! ! ! ! ! ! 0! 4! 0! 3! 1! 4! ! ! ! ! ! !Cameroon! 0! 5! 0! 5! 0! 5! 5! 5! 2! 5! 4! 5! ! ! ! ! ! !Cape!Verde! 1! 9! 0! 3! 2! 9! 2! 6! 2! 6! 0! 6! ! ! ! ! ! !Chad! 1! 3! 0! 3! 3! 3! 3! 3! 2! 3! 2! 3! ! ! ! ! ! !China! ! ! ! ! ! ! 0! 2! 1! 2! 0! 2! ! ! ! ! ! !Colombia! 3! 3! 0! 3! 1! 3! 4! 5! 0! 5! 5! 5! ! ! ! ! ! !Costa!Rica! 0! 2! 0! 1! 0! 2! 0! 2! 0! 2! 0! 2! ! ! ! ! ! !D.R.!Congo! 0! 3! ! ! 0! 3! 2! 4! ! ! 2! 4! ! ! ! ! ! !Djibouti! ! ! ! ! ! ! 2! 2! 1! 2! 1! 2! ! ! ! ! ! !Dominican!Republic! 0! 2! 0! 2! 1! 2! 3! 4! 2! 4! 4! 4! ! ! ! ! ! !Ecuador! 2! 8! 2! 8! 0! 8! 4! 9! 0! 9! 3! 9! ! ! ! ! ! !Egypt! 0! 4! ! ! 0! 4! 2! 4! ! ! 2! 4! 0! 2! ! ! 0! 2!El!Salvador! 0! 2! 1! 2! 0! 2! 2! 2! 0! 2! 2! 2! ! ! ! ! ! !

!
25!!
Note:&Empty&cells&indicate&that&there&were&no&or&insufficient&(<10)&observations&for&the&country/product/period&combination&in&question.&Cointegration&tested&by&Johansen&at&5%.!
!Table&15:&Cointegration&between&international&and&domestic&prices&by&product&and&country&(continued)&
Country&
Maize& Rice& Wheat&entire!period! pre,!break! post,!break! entire!period! pre,!break! post,!break! entire!period! pre,!break! post,!break!#!of!cointegrated!pairs!
#!of!pairs!
#!of!cointegrated!pairs!
#!of!pairs!
#!of!cointegrated!pairs!
#!of!pairs!
#!of!cointegrated!pairs!
#!of!pairs!
#!of!cointegrated!pairs!
#!of!pairs!
#!of!!cointegrated!pairs!
#!of!pairs!
#!of!cointegrated!pairs!
#!of!pairs!
#!of!cointegrated!pairs!
#!of!pairs!
#!of!cointegrated!pairs!
#!of!pairs!
Eritrea! ! ! ! ! ! ! ! ! ! ! ! ! 1! 1! ! ! 0! 1!Ethiopia! 1! 8! 0! 4! 4! 8! ! ! ! ! ! ! 7! 11! 2! 11! 7! 11!Gabon! ! ! ! ! ! ! 0! 1! ! ! 0! 1! ! ! ! ! ! !Ghana! 0! 3! 0! 3! 0! 3! 0! 2! 0! 2! 0! 2! ! ! ! ! ! !Guatemala! 3! 3! 1! 3! 3! 3! 2! 3! 0! 2! 1! 3! ! ! ! ! ! !Guinea! ! ! ! ! ! ! 0! 2! ! ! 1! 2! ! ! ! ! ! !Haiti! 1! 14! 2! 14! 1! 14! 3! 14! 2! 13! 1! 14! ! ! ! ! ! !Honduras! 3! 3! 0! 1! 1! 3! 2! 2! ! ! 2! 2! ! ! ! ! ! !India! ! ! ! ! ! ! 2! 8! 2! 8! 2! 8! 0! 8! 0! 8! 0! 8!Indonesia! ! ! ! ! ! ! 1! 1! ! ! 1! 1! ! ! ! ! ! !Israel! 0! 1! 0! 1! 0! 1! ! ! ! ! ! ! 0! 1! 0! 1! 0! 1!Kenya! 0! 6! 1! 5! 1! 6! ! ! ! ! ! ! ! ! ! ! ! !Lao!People's!Dem.!Rep.! ! ! ! ! ! ! 1! 3! 1! 3! 0! 3! ! ! ! ! ! !Lesotho! ! ! ! ! ! ! 0! 1! ! ! 0! 1! ! ! ! ! ! !Madagascar! ! ! ! ! ! ! 0! 2! 0! 2! 0! 2! ! ! ! ! ! !Malawi! 0! 6! ! ! 2! 6! 0! 2! ! ! 0! 2! ! ! ! ! ! !Mali! ! ! ! ! ! ! 11! 14! 0! 4! 11! 14! ! ! ! ! ! !Mauritania! ! ! ! ! ! ! 0! 1! 0! 1! 0! 1! 0! 1! ! ! 0! 1!Mexico! 4! 5! 2! 5! 2! 5! 1! 4! 0! 4! 3! 4! ! ! ! ! ! !Mongolia! ! ! ! ! ! ! 0! 1! ! ! 0! 1! ! ! ! ! ! !
!
26!!
Mozambique! 11! 14! 9! 14! 5! 13! 8! 10! 2! 10! 4! 10! ! ! ! ! ! !
Note:&Empty&cells&indicate&that&there&were&no&or&insufficient&(<10)&observations&for&the&country/product/period&combination&in&question.&Cointegration&tested&by&Johansen&at&5%.!
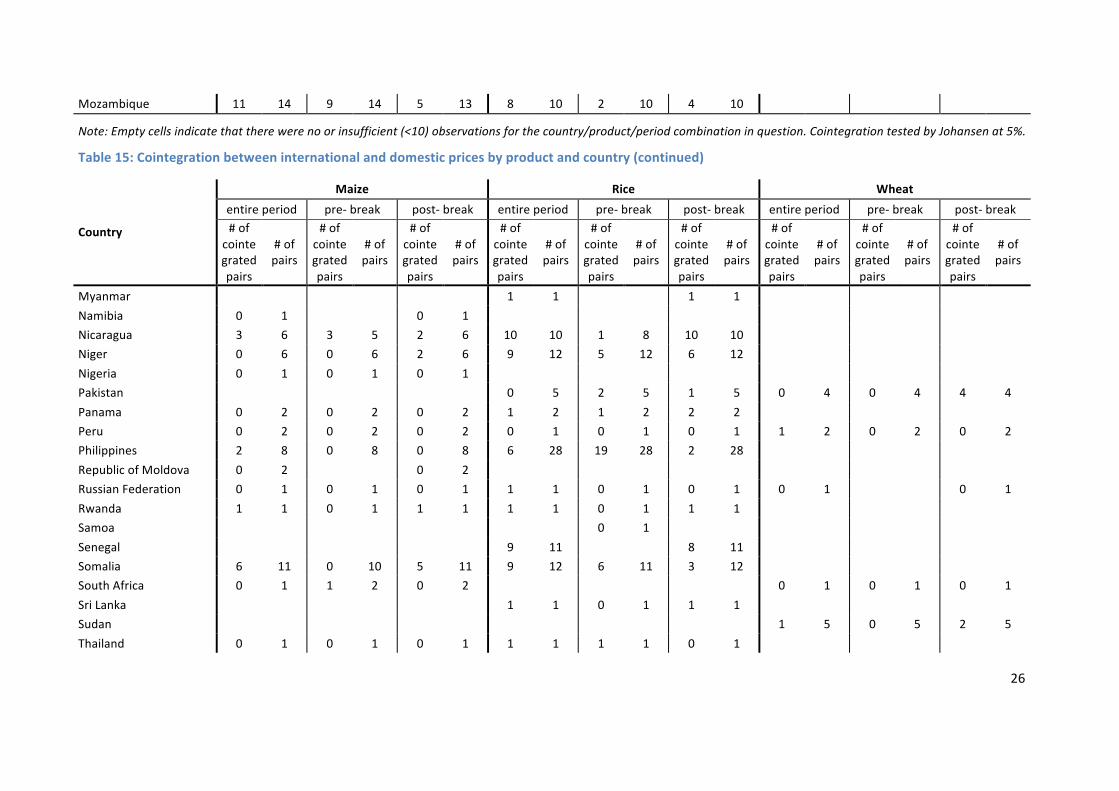
Table&15:&Cointegration&between&international&and&domestic&prices&by&product&and&country&(continued)&
Country&
Maize& Rice& Wheat&entire!period! pre,!break! post,!break! entire!period! pre,!break! post,!break! entire!period! pre,!break! post,!break!#!of!cointegrated!pairs!
#!of!pairs!
#!of!cointegrated!pairs!
#!of!pairs!
#!of!cointegrated!pairs!
#!of!pairs!
#!of!cointegrated!pairs!
#!of!pairs!
#!of!cointegrated!pairs!
#!of!pairs!
#!of!!cointegrated!pairs!
#!of!pairs!
#!of!cointegrated!pairs!
#!of!pairs!
#!of!cointegrated!pairs!
#!of!pairs!
#!of!cointegrated!pairs!
#!of!pairs!
Myanmar! ! ! ! ! ! ! 1! 1! ! ! 1! 1! ! ! ! ! ! !Namibia! 0! 1! ! ! 0! 1! ! ! ! ! ! ! ! ! ! ! ! !Nicaragua! 3! 6! 3! 5! 2! 6! 10! 10! 1! 8! 10! 10! ! ! ! ! ! !Niger! 0! 6! 0! 6! 2! 6! 9! 12! 5! 12! 6! 12! ! ! ! ! ! !Nigeria! 0! 1! 0! 1! 0! 1! ! ! ! ! ! ! ! ! ! ! ! !Pakistan! ! ! ! ! ! ! 0! 5! 2! 5! 1! 5! 0! 4! 0! 4! 4! 4!Panama! 0! 2! 0! 2! 0! 2! 1! 2! 1! 2! 2! 2! ! ! ! ! ! !Peru! 0! 2! 0! 2! 0! 2! 0! 1! 0! 1! 0! 1! 1! 2! 0! 2! 0! 2!Philippines! 2! 8! 0! 8! 0! 8! 6! 28! 19! 28! 2! 28! ! ! ! ! ! !Republic!of!Moldova! 0! 2! ! ! 0! 2! ! ! ! ! ! ! ! ! ! ! ! !Russian!Federation! 0! 1! 0! 1! 0! 1! 1! 1! 0! 1! 0! 1! 0! 1! ! ! 0! 1!Rwanda! 1! 1! 0! 1! 1! 1! 1! 1! 0! 1! 1! 1! ! ! ! ! ! !Samoa! ! ! ! ! ! ! ! ! 0! 1! ! ! ! ! ! ! ! !Senegal! ! ! ! ! ! ! 9! 11! ! ! 8! 11! ! ! ! ! ! !Somalia! 6! 11! 0! 10! 5! 11! 9! 12! 6! 11! 3! 12! ! ! ! ! ! !South!Africa! 0! 1! 1! 2! 0! 2! ! ! ! ! ! ! 0! 1! 0! 1! 0! 1!Sri!Lanka! ! ! ! ! ! ! 1! 1! 0! 1! 1! 1! ! ! ! ! ! !Sudan! ! ! ! ! ! ! ! ! ! ! ! ! 1! 5! 0! 5! 2! 5!Thailand! 0! 1! 0! 1! 0! 1! 1! 1! 1! 1! 0! 1! ! ! ! ! ! !

!
27!!
Timor,Leste! 0! 1! ! ! 0! 1! 1! 1! ! ! 1! 1! ! ! ! ! ! !Togo! 0! 6! 0! 6! 2! 6! 4! 6! 1! 6! 2! 6! ! ! ! ! ! !Tunisia! ! ! ! ! ! ! 1! 1! 1! 1! 1! 1! ! ! ! ! ! !
Note:&Empty&cells&indicate&that&there&were&no&or&insufficient&(<10)&observations&for&the&country/product/period&combination&in&question.&Cointegration&tested&by&Johansen&at&5%.!
Table&15:&Cointegration&between&international&and&domestic&prices&by&product&and&country&(continued)&
Country&
Maize& Rice& Wheat&entire!period! pre,!break! post,!break! entire!period! pre,!break! post,!break! entire!period! pre,!break! post,!break!#!of!cointegrated!pairs!
#!of!pairs!
#!of!cointegrated!pairs!
#!of!pairs!
#!of!cointegrated!pairs!
#!of!pairs!
#!of!cointegrated!pairs!
#!of!pairs!
#!of!cointegrated!pairs!
#!of!pairs!
#!of!!cointegrated!pairs!
#!of!pairs!
#!of!cointegrated!pairs!
#!of!pairs!
#!of!cointegrated!pairs!
#!of!pairs!
#!of!cointegrated!pairs!
#!of!pairs!
Uganda! 0! 3! 0! 1! 1! 2! 2! 3! 0! 3! 2! 3! ! ! ! ! ! !Ukraine! 1! 1! 0! 1! 1! 1! ! ! ! ! ! ! 0! 1! 0! 1! 0! 1!United!Rep.!of!Tanzania! 2! 5! 1! 1! 3! 5! ! ! ! ! ! ! ! ! ! ! ! !Uruguay! ! ! ! ! ! ! 0! 1! ! ! 0! 1! 0! 1! 0! 1! 0! 1!Vietnam! ! ! ! ! ! ! 1! 1! ! ! 0! 1! ! ! ! ! ! !Zambia! 0! 1! 0! 1! 0! 1! 0! 1! ! ! 0! 1! ! ! ! ! ! !Zimbabwe! 0! 1! 1! 1! 0! 1! ! ! ! ! ! ! ! ! ! ! ! !
Sum! 55! 179! 30! 141! 47! 178! 139! 251! 57! 193! 108! 251! 14! 57! 2! 50! 15! 57!Share!of!cointegrated!pairs! 30.7%! 21.3%! 26.4%! 55.4%! 29.5%! 43.0%! 24.6%! 4.0%! 26.3%!
Note:&Empty&cells&indicate&that&there&were&no&or&insufficient&(<10)&observations&for&the&country/product/period&combination&in&question.&Cointegration&tested&by&Johansen&at&5%.

!
! 28!
Table&16:&Cointegration&between&international&and&domestic&prices&in&African&countries&(maize)&
& Maize& & && Entire!period! Before!2007! After!2007!& ! ! !& coint! obs! %!coint.! coint! obs! %!coint.! coint! obs! %!coint.!Benin&& 7! 7! 100%! 5" 7" 71%" 2" 7" 29%"Burkina&Faso& ! ! ! ! ! ! ! ! !Burundi&& 0! 1! 0%! 0! 1! 0%! 0! 1! 0%!Cameroon& 0! 5! 0%! 0! 5! 0%! 0! 5! 0%!Cape&Verde&& 1! 9! 11%! 0! 3! 0%! 2! 9! 22%!Chad&&&&&&&&&&&&&&&& 1! 3! 33%! 0! 3! 0%! 3! 3! 100%!Congo,&D.R.& 0! 3! 0%! ! ! ! 0! 3! 0%!Djibouti&&&&&&&&&&&& ! ! ! ! ! ! ! ! !Egypt&&&&&&&&&&&&&&& 0! 4! 0%! ! ! ! 0! 4! 0%!Eritrea&&&&&&&&&&&&& ! ! ! ! ! ! ! ! !Ethiopia&&&&&&&&&&&& 1! 8! 13%! 0! 4! 0%! 4! 8! 50%!Gabon&&&&&&&&&&&&&&& ! ! ! ! ! ! ! ! !Ghana&&&&&&&&&&&&&&& 0! 3! 0%! 0! 3! 0%! 0! 3! 0%!GuineaKBissau& ! ! ! ! ! ! ! ! !Kenya&&&&&& 0! 6! 0%! 1! 5! 20%! 1! 6! 17%!Lesotho&&&&&&&& ! ! ! ! ! ! ! ! !Madagascar& ! ! ! ! ! ! ! ! !Malawi&&&&&&&& 0! 6! 0%! ! ! ! 2! 6! 33%!Mali&&&&&&&&&& ! ! ! ! ! ! ! ! !Mauritania&&&& ! ! ! ! ! ! ! ! !Mozambique& 11! 14! 79%! 9" 14" 64%" 5" 13" 38%"Namibia&&&& 0! 1! 0%! ! ! ! 0! 1! 0%!Niger&&&&&&&&& 0! 6! 0%! 0! 6! 0%! 2! 6! 33%!Nigeria&&&&&&&& 0! 1! 0%! 0! 1! 0%! 0! 1! 0%!Rwanda& 1! 1! 100%! 0" 1" 0%" 1! 1! 100%!Senegal&&& ! ! ! ! ! ! ! ! !Somalia&& 6! 11! 55%! 0" 10" 0%" 5" 11" 45%"South&Africa& 0! 1! 0%! 1! 2! 50%! 0! 2! 0%!Sudan&&&&& ! ! ! ! ! ! ! ! !Tanzania&&&&& 2! 5! 40%! 1! 1! 100%! 3! 5! 60%!Togo&&& 0! 6! 0%! 0! 6! 0%! 2! 6! 33%!Tunisia&&&&& ! ! ! ! ! ! ! ! !Uganda&&& 0! 3! 0%! 0! 1! 0%! 1! 2! 50%!Zambia&&&&& 0! 1! 0%! 0! 1! 0%! 0! 1! 0%!Zimbabwe&& 0! 1! 0%! 1! 1! 100%! 0! 1! 0%!Africa& 30! 106! 28%! 18! 75! 24%! 33! 105! 31%!ROW& 25! 73! 34%! 12" 66" 18%" 14" 73" 19%"World&Total& 55! 179! 31%! 30" 141" 21%" 47" 178" 26%"Note:"Empty"cells"indicate"that"there"were"no"or"insufficient"(<10)"observations"for"the"country/product/period"combination"in"question."Cointegration"tested"by"Johansen"at"5%."

!
! 29!
Table&17:&Cointegration&between&international&and&domestic&prices&in&African&countries&(maize)&
& Rice& & && Entire!period! Before!2007! After!2007!& ! ! !& coint! obs! %!coint.! coint! obs! %!coint.! coint! obs! %!coint.!Benin&& 4! 4! 100%! 3" 4" 75%" 1" 4" 25%"Burkina&Faso& 8! 9! 89%! 0" 3" 0%" 8! 9! 89%!Burundi&& 0! 1! 0%! 0! 1! 0%! 0! 1! 0%!Cameroon& 5! 5! 100%! 2" 5" 40%" 4" 5" 80%"Cape&Verde&& 2! 6! 33%! 2! 6! 33%! 0" 6" 0%"Chad&&&&&&&&&&&&&&&& 3! 3! 100%! 2" 3" 67%" 2" 3" 67%"Congo,&D.R.& 2! 4! 50%! ! ! ! 2! 4! 50%!Djibouti&&&&&&&&&&&& 2! 2! 100%! 1" 2" 50%" 1" 2" 50%"Egypt&&&&&&&&&&&&&&& 2! 4! 50%! ! ! ! 2! 4! 50%!Eritrea&&&&&&&&&&&&& ! ! ! ! ! ! ! ! !Ethiopia&&&&&&&&&&&& ! ! ! ! ! ! ! ! !Gabon&&&&&&&&&&&&&&& 0! 1! 0%! ! ! ! 0! 1! 0%!Ghana&&&&&&&&&&&&&&& 0! 2! 0%! 0! 2! 0%! 0! 2! 0%!GuineaKBissau& 0! 2! 0%! ! ! ! 1! 2! 50%!Kenya&&&&&& ! ! ! ! ! ! ! ! !Lesotho&&&&&&&& 0! 1! 0%! ! ! ! 0! 1! 0%!Madagascar& 0! 2! 0%! 0! 2! 0%! 0! 2! 0%!Malawi&&&&&&&& 0! 2! 0%! ! ! ! 0! 2! 0%!Mali&&&&&&&&&& 11! 14! 79%! 0" 4" 0%" 11! 14! 79%!Mauritania&&&& 0! 1! 0%! 0! 1! 0%! 0! 1! 0%!Mozambique& 8! 10! 80%! 2" 10" 20%" 4" 10" 40%"Namibia&&&& ! ! ! ! ! ! ! ! !Niger&&&&&&&&& 9! 12! 75%! 5" 12" 42%" 6" 12" 50%"Nigeria&&&&&&&& ! ! ! ! ! ! ! ! !Rwanda& 1! 1! 100%! 0" 1" 0%" 1! 1! 100%!Senegal&&& 9! 11! 82%! ! ! ! 8" 11" 73%"Somalia&& 9! 12! 75%! 6" 11" 55%" 3" 12" 25%"South&Africa& ! ! ! ! ! ! ! ! !Sudan&&&&& ! ! ! ! ! ! ! ! !Tanzania&&&&& ! ! ! ! ! ! ! ! !Togo&&& 4! 6! 67%! 1" 6" 17%" 2" 6" 33%"Tunisia&&&&& 1! 1! 100%! 1! 1! 100%! 1! 1! 100%!Uganda&&& 2! 3! 67%! 0" 3" 0%" 2! 3! 67%!Zambia&&&&& 0! 1! 0%! ! ! ! 0! 1! 0%!Zimbabwe&& ! ! ! ! ! ! ! ! !Africa& 82! 120! 68%! 25" 77" 32%" 59" 120" 49%"ROW& 57! 142! 40%! 32" 116" 28%" 49" 142" 35%"World&Total& 139! 262! 53%! 57" 193" 30%" 108" 262" 41%"Note:"Empty"cells"indicate"that"there"were"no"or"insufficient"(<10)"observations"for"the"country/product/period"combination"in"question."Cointegration"tested"by"Johansen"at"5%."
!
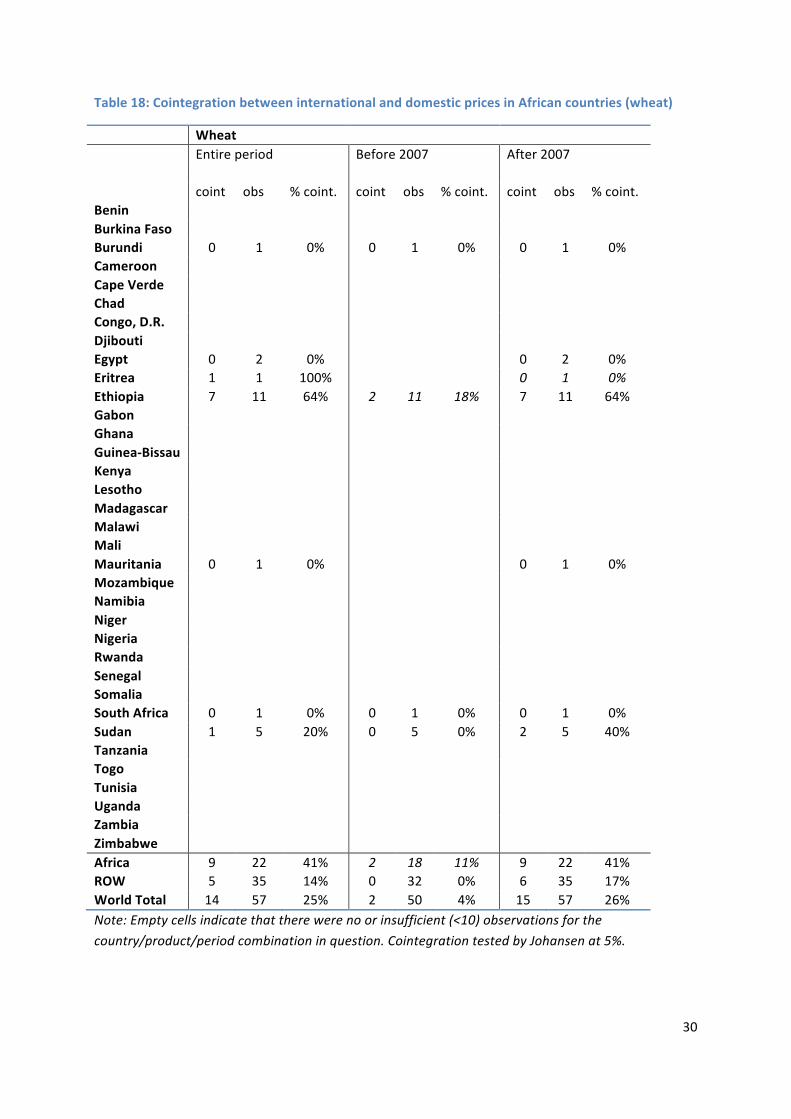
!
! 30!
Table&18:&Cointegration&between&international&and&domestic&prices&in&African&countries&(wheat)&
& Wheat& & && Entire!period! Before!2007! After!2007!& ! ! !& coint! obs! %!coint.! coint! obs! %!coint.! coint! obs! %!coint.!Benin&& ! ! ! ! ! ! ! ! !Burkina&Faso& ! ! ! ! ! ! ! ! !Burundi&& 0! 1! 0%! 0! 1! 0%! 0! 1! 0%!Cameroon& ! ! ! ! ! ! ! ! !Cape&Verde&& ! ! ! ! ! ! ! ! !Chad&&&&&&&&&&&&&&&& ! ! ! ! ! ! ! ! !Congo,&D.R.& ! ! ! ! ! ! ! ! !Djibouti&&&&&&&&&&&& ! ! ! ! ! ! ! ! !Egypt&&&&&&&&&&&&&&& 0! 2! 0%! ! ! ! 0! 2! 0%!Eritrea&&&&&&&&&&&&& 1! 1! 100%! ! ! ! 0" 1" 0%"Ethiopia&&&&&&&&&&&& 7! 11! 64%! 2" 11" 18%" 7! 11! 64%!Gabon&&&&&&&&&&&&&&& ! ! ! ! ! ! ! ! !Ghana&&&&&&&&&&&&&&& ! ! ! ! ! ! ! ! !GuineaKBissau& ! ! ! ! ! ! ! ! !Kenya&&&&&& ! ! ! ! ! ! ! ! !Lesotho&&&&&&&& ! ! ! ! ! ! ! ! !Madagascar& ! ! ! ! ! ! ! ! !Malawi&&&&&&&& ! ! ! ! ! ! ! ! !Mali&&&&&&&&&& ! ! ! ! ! ! ! ! !Mauritania&&&& 0! 1! 0%! ! ! ! 0! 1! 0%!Mozambique& ! ! ! ! ! ! ! ! !Namibia&&&& ! ! ! ! ! ! ! ! !Niger&&&&&&&&& ! ! ! ! ! ! ! ! !Nigeria&&&&&&&& ! ! ! ! ! ! ! ! !Rwanda& ! ! ! ! ! ! ! ! !Senegal&&& ! ! ! ! ! ! ! ! !Somalia&& ! ! ! ! ! ! ! ! !South&Africa& 0! 1! 0%! 0! 1! 0%! 0! 1! 0%!Sudan&&&&& 1! 5! 20%! 0! 5! 0%! 2! 5! 40%!Tanzania&&&&& ! ! ! ! ! ! ! ! !Togo&&& ! ! ! ! ! ! ! ! !Tunisia&&&&& ! ! ! ! ! ! ! ! !Uganda&&& ! ! ! ! ! ! ! ! !Zambia&&&&& ! ! ! ! ! ! ! ! !Zimbabwe&& ! ! ! ! ! ! ! ! !Africa& 9! 22! 41%! 2" 18" 11%" 9! 22! 41%!ROW& 5! 35! 14%! 0! 32! 0%! 6! 35! 17%!World&Total& 14! 57! 25%! 2! 50! 4%! 15! 57! 26%!Note:"Empty"cells"indicate"that"there"were"no"or"insufficient"(<10)"observations"for"the"country/product/period"combination"in"question."Cointegration"tested"by"Johansen"at"5%."
&