Embed Size (px)
Citation preview
Market Integration & SoSInitial proposals for SJWS #5
ENTSOG offices – BrusselsStakeholder Joint Working Session – 20 March 2012

SJWS process on SoS & Market Integration
2
February session – Come-back to TYNDP 2011-2020> Establishment of a shared understanding of current report and associated feedback
March session – ENTSOG initial proposals> Proposals focus on selection of relevant cases for SoS & Mkt Int. assessment> Feedback on proposals and first considerations on indicators to be used
April session – ENTSOG updated proposals> Fine-tuned scenarios and first set of indicators
May session – Fine-tuning of assessment methodology> Presentation of an integrated method (cases & indicators) fitting with other SJWSs
June TYNDP
2013-2022 Public WS
Feb. 15th
Mar.20th
April?
May?
Security of Supply
3
What should be considered when selecting Cases> Main driver is the identification of potential investment gaps under realistic cases> Modelling tool is no more a limitation but result analysis remains the key step> Comparability with previous TYNDP in order to measure improvement /decline in
the European gas system resilience
List of parameters defining as Case> Demand scenario: ENTSOG (TSOs), NREAs, Primes…> Infrastructure scenario: FID, non-FID> Demand case: combination of period (1, 7 & 30 days) and methodology (Design, 1-
in-20 & 1-in-2)> Supply case: consistent with Demand case> Potential events: none (Reference Case), technical disruption (NO, AL & LY), transit
disruption (UA & BY) and supply disruption (Qatari LNG), low UGS deliverability
Security of Supply – Demand Cases
4
Maximum transported energy> This is a natural case to test the resilience of the European transmission system> In this case demand is at the highest daily level and supply is assumed to be at its highest
availability> Level of demand can be defined in 2 ways:
• Design Case: in every country demand is set at the level defined as the reference for national design according national legislation (highest stress)
» Ensure consistence between national and European plans• 1-in-20 Case(Diversified or not): demand is set in every country according a given
occurrence» Ensure consistent risk across borders
Rationales of X-day cases> Duration of an event impact in a different way demand level and each supply source> These dissimilarities induce different transmission needs depending on the duration > Stress on gas infrastructure is measured on one day (the last one is assumed to be the most
stressful)
Security of Supply – X-day cases
5
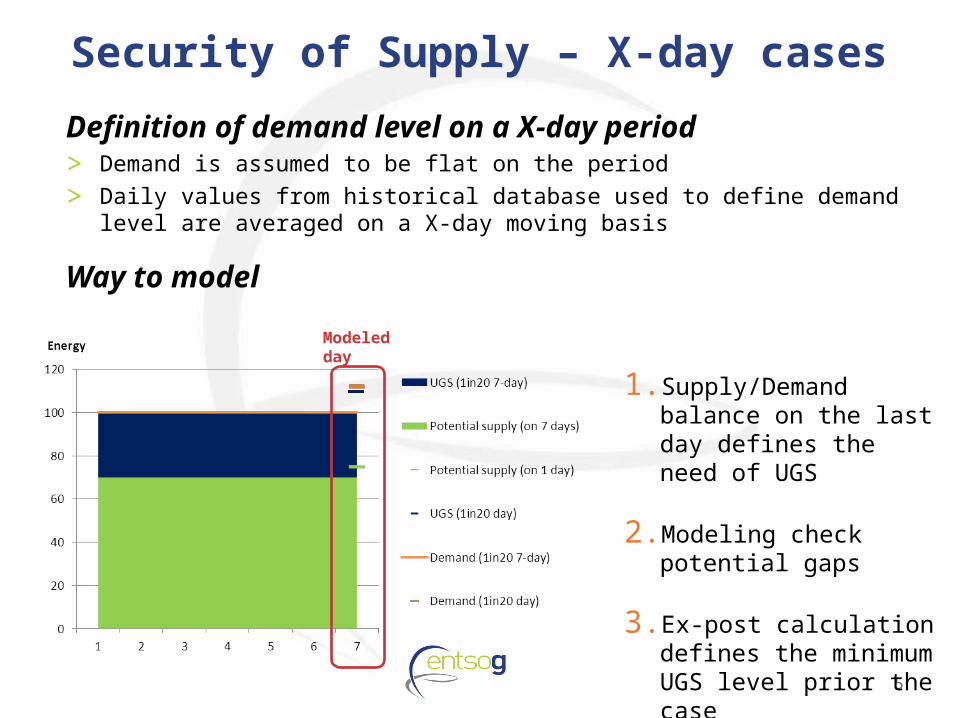
Definition of demand level on a X-day period> Demand is assumed to be flat on the period> Daily values from historical database used to define demand level are averaged on a X-
day moving basis
Way to model
Modeled day
1. Supply/Demand balance on the last day defines the need of UGS
2. Modeling check potential gaps
3. Ex-post calculation defines the minimum UGS level prior the case
Security of Supply – potential events
6
Disruption events in current TYNDP, are they up to date?> Ukraine and Belarus: total disruption of either transit> Libya: total disruption of import pipe> Algeria: 50% disruption of import pipes > Norway: total disruption of Langeled pipeline > LNG: Qatari disruption
Value of a low UGS deliverability Case> If the understanding of disruptions is quite straight forward, stakeholders’
expectations in term of impact of a low UGS deliverability is less clear
Expected outputs> Potential investment gaps> Flexibility of the gas system at Entry/Exit zone level
Security of Supply – Low UGS
7
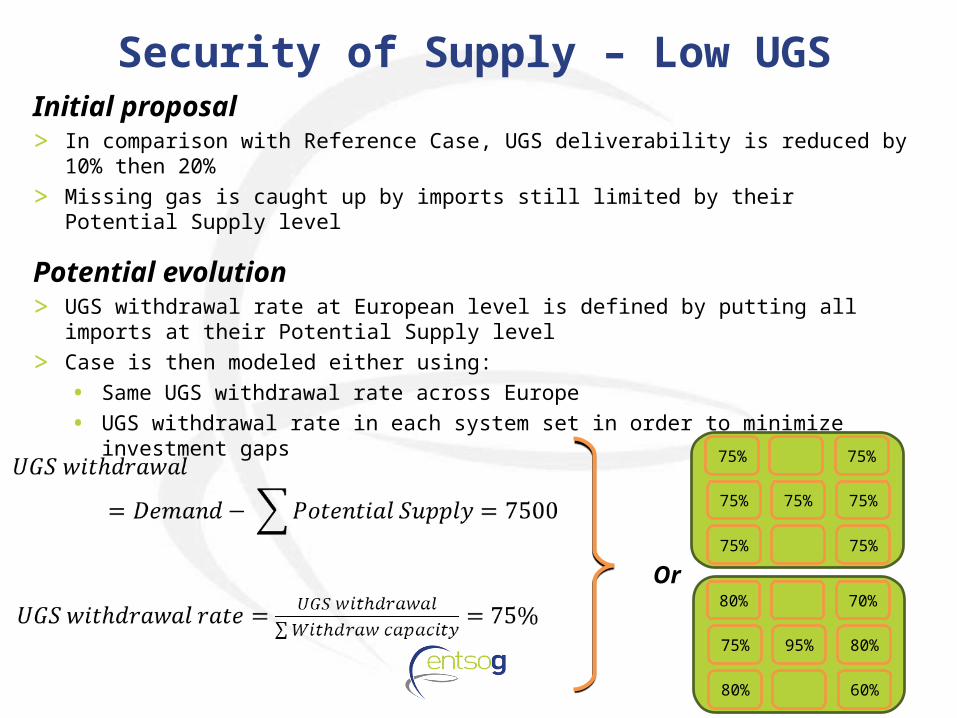
Initial proposal> In comparison with Reference Case, UGS deliverability is reduced by 10% then 20%> Missing gas is caught up by imports still limited by their Potential Supply level
Potential evolution> UGS withdrawal rate at European level is defined by putting all imports at their
Potential Supply level> Case is then modeled either using:
• Same UGS withdrawal rate across Europe• UGS withdrawal rate in each system set in order to minimize investment gaps
75% 75%
75% 75% 75%
75% 75%
80% 70%
75% 95% 80%
80% 60%
Or
Security of Supply – Event management
8
Management of disruption or low UGS deliverability cases> Supply priority is:
1. Disrupted supply through alternative routes2. Alternative imports (including LNG until maximum potential supply)3. LNG (using remaining capacity up to 80% send-out load factor) and UGS4. Disruption
> Order does not influence the identification of gaps but provide transparency on the method and influence the resulting supply mix
Load factor of import routes> Model will be able to use different load factor for routes between a given supply
source and Europe> Nevertheless a minimum load factor (derived from historical data) will be defined for
every route
Security of Supply
9
What should be considered when selecting Cases> Main driver is the identification of potential limitation in the supply spread (not gap as
potential benefit should be assessed against cost by the market )> In which way infrastructures can support market integration (but not ensure it as it
primarily depend on their use)> Modelling tool is no more a limitation but result analysis remains the key step> Comparability with previous TYNDP in order to measure improvement /decline in the
European gas system resilience
List of parameters defining as Case> Demand scenario: ENTSOG (TSOs), NREAs, Primes…> Infrastructure scenario: FID, non-FID> Demand case: average yearly day or seasonal values> Supply case: consistent with Demand case> Potential events: maximization/minimization of a set of supply sources
Market Integration – Mini/Maximization
10
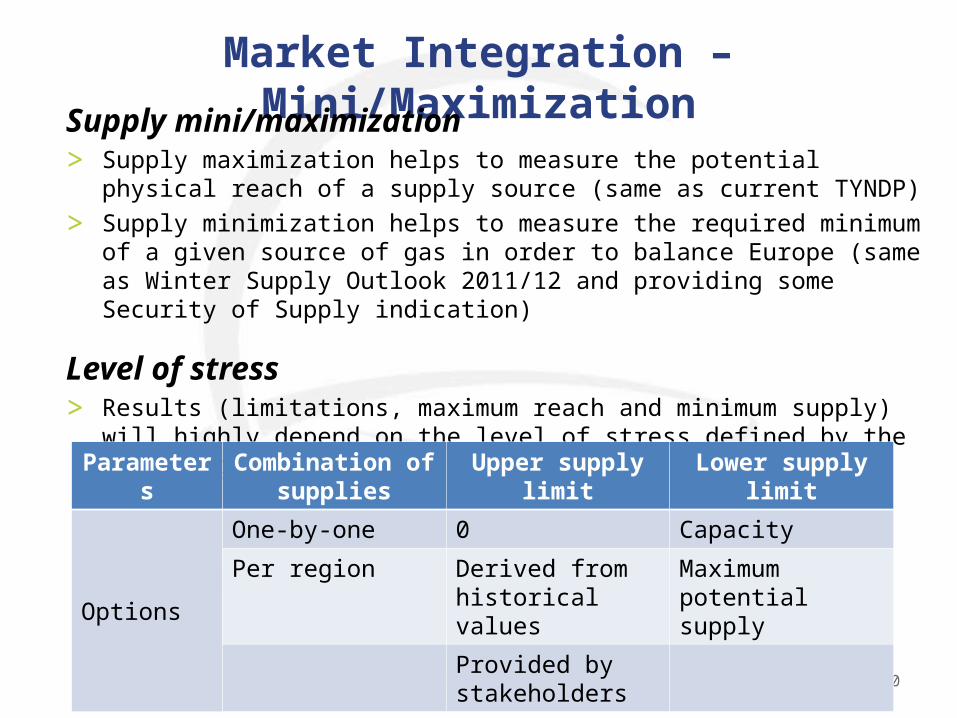
Supply mini/maximization> Supply maximization helps to measure the potential physical reach of a supply
source (same as current TYNDP)> Supply minimization helps to measure the required minimum of a given source of gas
in order to balance Europe (same as Winter Supply Outlook 2011/12 and providing some Security of Supply indication)
Level of stress> Results (limitations, maximum reach and minimum supply) will highly depend on the
level of stress defined by the following parameters:
Parameters Combination of supplies
Upper supply limit Lower supply limit
Options
One-by-one 0 Capacity
Per region Derived from historical values
Maximum potential supply
Provided by stakeholders
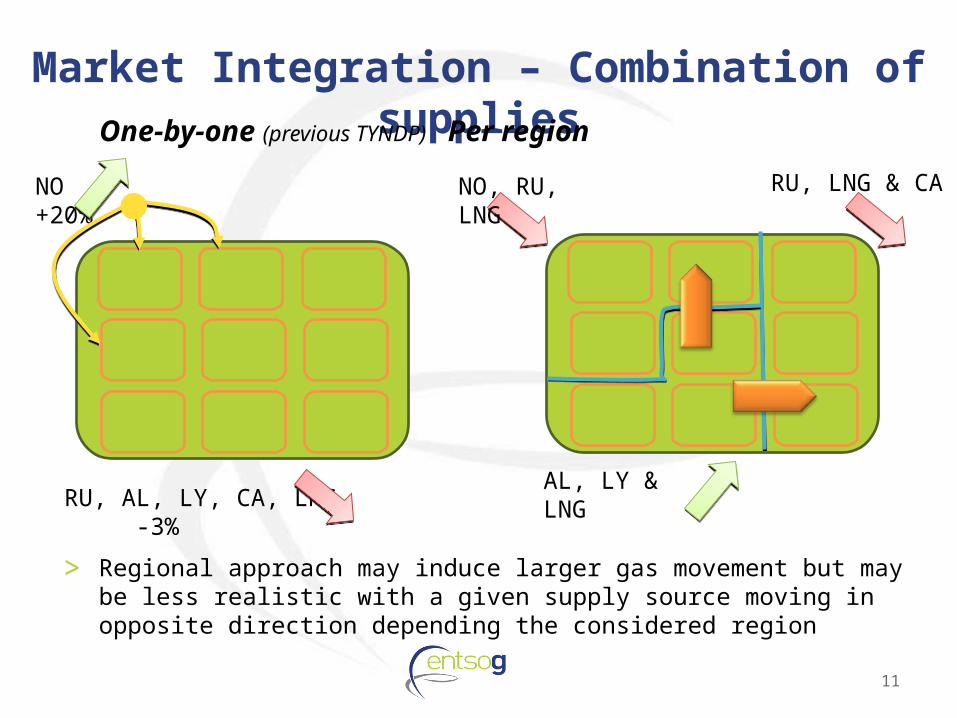
Market Integration – Combination of supplies
11
One-by-one (previous TYNDP) Per region
AL, LY & LNG RU, AL, LY, CA, LNG -3%
RU, LNG & CANO +20% NO, RU, LNG
> Regional approach may induce larger gas movement but may be less realistic with a given supply source moving in opposite direction depending the considered region
Market Integration – Demand Cases
12
Demand cases> Demand levels have a direct influence on the assessment results:
• They define the considered period (a year or a season)• Higher demand is more stressful in case of supply minimization (Winter)• Lower demand is more stressful in case of supply maximization (Lower)
Role of the UGS> In current TYNDP, the UGS has been kept neutral (no withdrawal or injection) which:
• Avoids to make assumption on their use• Disregards their impact on the maxi/minimization
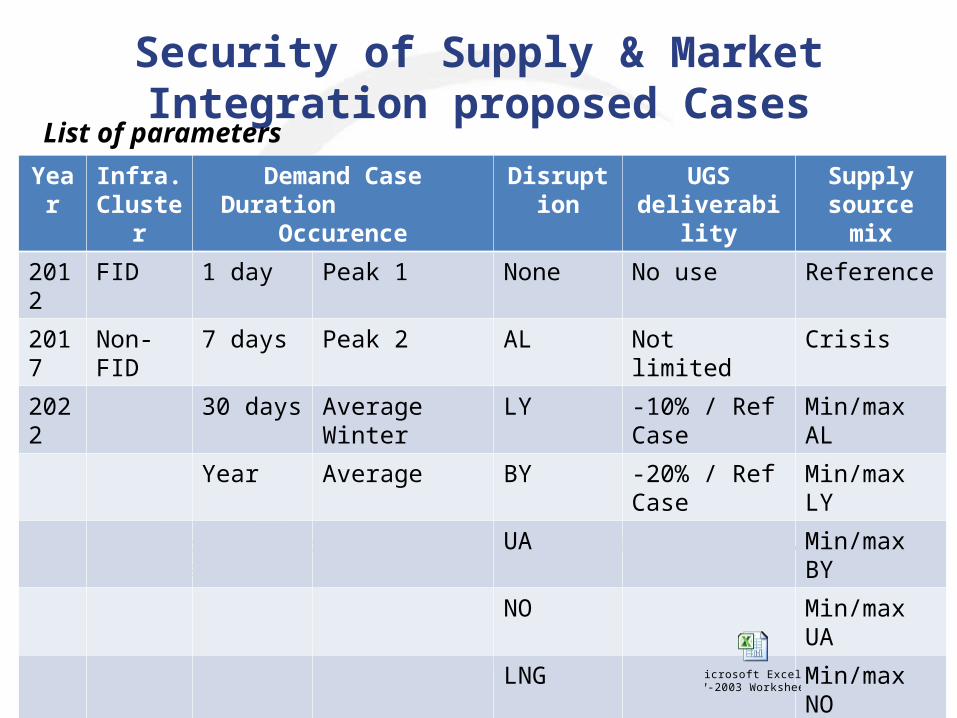
Security of Supply & Market Integration proposed Cases
13
List of parameters
> Initial proposal accounts for 200 cases (against 67 for TYNDP 2011-2020), list will be updated considering your feedback
Year Infra. Cluster
Demand CaseDuration Occurence
Disruption UGS deliverability
Supply source mix
2012 FID 1 day Peak 1 None No use Reference
2017 Non-FID 7 days Peak 2 AL Not limited Crisis
2022 30 days Average Winter LY -10% / Ref Case Min/max AL
Year Average BY -20% / Ref Case Min/max LY
UA Min/max BY
NO Min/max UA
LNG Min/max NO
Min/max LNG
Microsoft Excel 97-2003 Worksheet
14
Thank You for Your AttentionOlivier Lebois, Adviser, System DevelopmentENTSOG -- European Network of Transmission System Operators for GasAvenue de Cortenbergh 100, B-1000 Brussels
EML: [email protected]: + 32 2 894 5105WWW: www.entsog.eu