Embed Size (px)
Citation preview

$
£
€₩
฿
₪
2
Global Trends in Finance 2018
Finance Brands and the Current Discovery Landscape 3
MARKET OPPORTUNITY
Supply Versus Demand 4
Notable Market Trends 5
CAMPAIGN INSIGHTS
Device Performance 6
Device CTR 7
Finance Image Performance Worldwide 8
Top Finance Image Trend by Countryh 9
Top Finance Keyword Performance Worldwide 10
Finance Keyword Performance in the Americas 11
Finance Keyword Performance in EMEA 12
Finance Keyword Performance in APAC 13
USER INSIGHTS
Top Hour of Day for Finance Impressions Worldwide 14
Impressions Per Hour of Day by Country 15
Top Hours of the Day for Clicks on Finance Content Worldwide 16
Clicks Per Hours of the Day by Country 17
Top Days of the Week for Clicks for Finance Content Worldwide 18
CTR Per Day of the Week by Country 19
Top Hours of the Day for CTR for Finance Content Worldwide 20
CTR Per Hours of the Day by Country 21
Table of Contents
3
Global Trends in Finance 2018
Finance Brands and the Current Digital Advertising Landscape
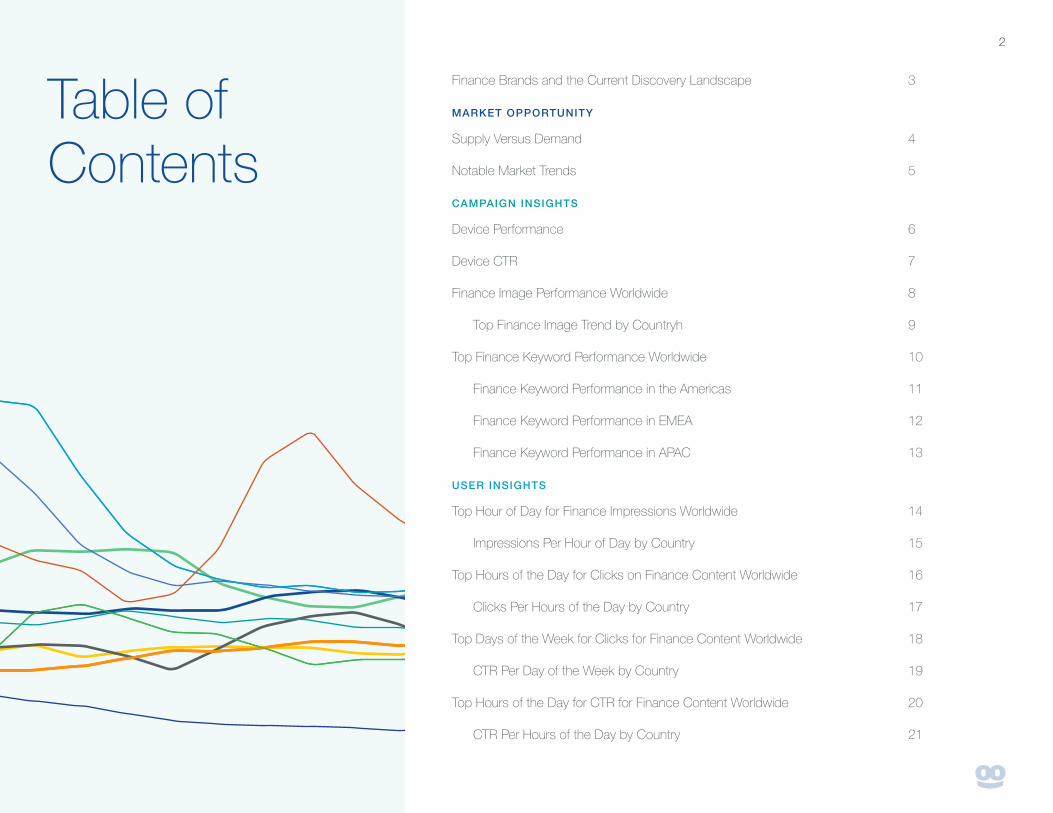
In the United States alone, finance marketers are top spenders on digital advertisements, right after the automotive and retail industries, as recently reported by eMarketer. More finance advertisers use the Taboola platform than most other verticals, including advertisers such as LendingTree, Coverfox and more. For Taboola, the finance vertical is defined by advertisers in various fields—from mortgage lending, to fintech, to banking. For each of the 12 countries analyzed in this report, finance is a top ten vertical.
This report explores trends in discovery and native advertising for the finance vertical, arming advertisers with information to better identify opportunities to compete effectively in their space.
We explore market opportunity by looking at the supply vs. demand of finance content, campaign insights with device, image and keyword trends, and internet user insights which include the best times of day for finance advertisers to see the highest number of impressions and the most engagement—all of which is important for evaluating and optimizing for your goals.
Data includes an assessment of market opportunity by country, industry benchmarks on platform type, clicks, impressions, and creative keyword recommendations in 12 countries—and opportunities that can be capitalized on through the use of tools like Taboola Backstage, Data Marketplace, Retargeting, Campaign Scheduler, Geotargeting tactics and more.
Digital Ad Spending by IndustryUS, 2018, Billions, Source: eMarketer
Automotive$10.66
Computing products & consumer electronics$6.28
CPG & consumer products$7.27
Financial services$10.11
Healthcare & pharma$2.32
Media$4.79
Retail$18.18
Telecom$9.01
Travel$6.78
Other$3.54
Entertainment$4.05
eMarketer

4
Global Trends in Finance 2018
Supply of Finance Content and Consumer Demand by CountryVarious countries have different market opportunity for discovery and native advertising. In this report, market opportunity is defined by the relationship between content supply and consumer demand for finance content in each country.
The trend in content supply is compared with consumer demand, indicated by click-through-rate (CTR). Countries with low amounts of finance content and a high CTR have a large market opportunity, whereas the alternative scenario means finance marketers may face more competition in the market.
MARKET OPPORTUNITY: Supply Versus Demand
Discovery Market Opportunity for the Finance Vertical by Country, 2017Supply of Finance Content* versus Consumer Demand, 2017
Market Opportunity
Average Worldwide CTR Range
*Supply of finance content is indicated by trends in campaign spend on the Taboola platform.
.10% 12%
.11% 10%
.13% 10%
CTR % MARKET OPPORTUNITY SPEND %
.11% 25%
.10% 16%
.08% 12%
.08% 9%
.10% 20%
.07% 34%
.10% 4%
.10% 10%
.04% 8%
5
Global Trends in Finance 2018
MARKET OPPORTUNITY:
Notable Market Trends
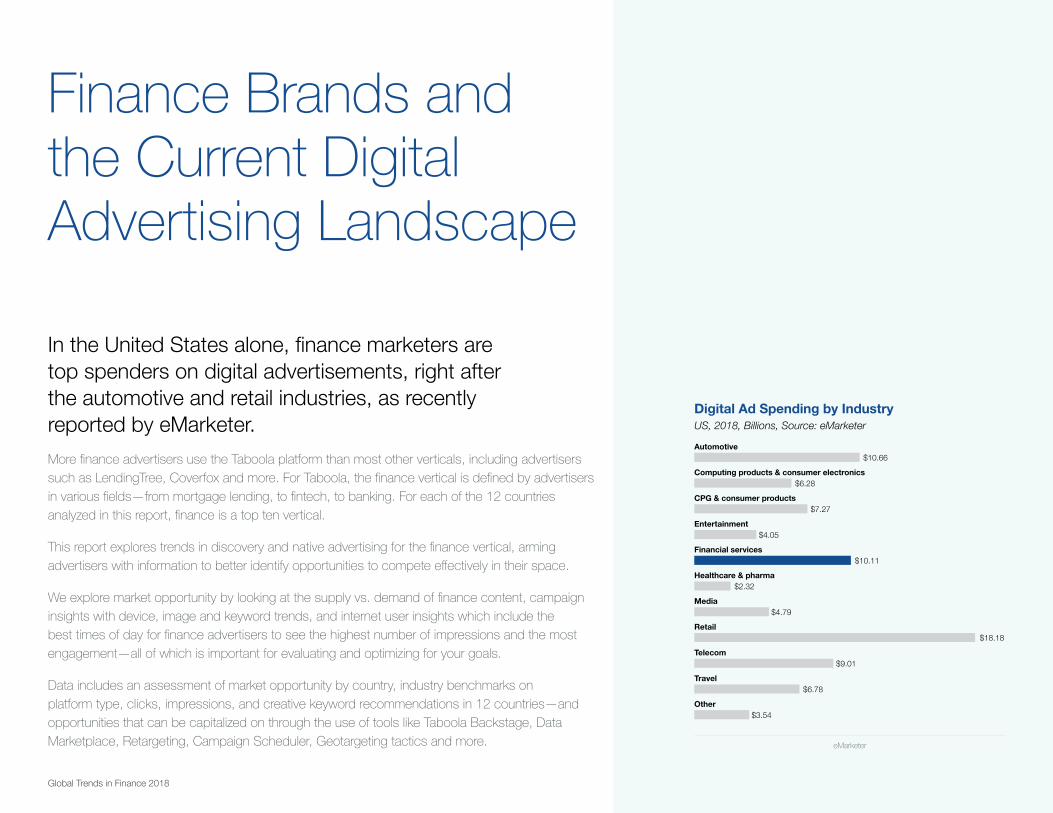
Notable Trends in Market Opportunity by CountryWhen analyzing demand, average CTRs for finance content worldwide were between 0.04% and 0.13%. Germany and Israel stood out with the highest average CTR.
Taboola predicts great potential in finance content growth in India and Thailand. Currently, less than 9% of discovery content in these countries is in the finance vertical, though both boast CTRs similar to, or higher than, the worldwide average.
Three countries stood out with the largest supply of finance content in 2017. In the United States, 21% of campaigns were in the finance vertical, along with 25% of campaigns in Israel and 35% in the United Kingdom, the country that has taken the biggest opportunity for finance content to date. While competition in these markets is hot, savvy advertisers can meet the demand in this market easily with the right targeting tactics.
.11%
.10%
.11%
SP
EN
D %
0
5
10
15
20
25
30
35
.07%
.09%
.10%
.04%
CTR Rate
Bar indicates Spend
Notable Trends in Opportunity for the Finance Vertical by Country, 2017

6
Global Trends in Finance 2018
BrazilMOBILE .28%
CanadaTABLET .16%
FranceTABLET .14%
ItalyMOBILE .16%
United KingdomTABLET .09%
AustraliaTABLET .10%
IndiaTABLET .11%Israel
MOBILE
.25%
GermanyTABLET .14%
United StatesMOBILE .13%
MOBILEDESKTOP TABLET
South KoreaMOBILE .043%
ThailandMOBILE .127%
CAMPAIGN INSIGHTS: Device Performance
Mobile, Tablet and Desktop Device Performance by CountryDevice performance for discovery advertisers is defined by the click-through-rate (CTR).* Worldwide, mobile and tablet devices drive more clicks for finance campaigns than desktop devices, although various countries respond differently.
Here, the size of the colored circle correlates to trends in CTR. For example, the US sees the highest CTR on mobile devices, then tablet and desktop devices respectively.
*CTR by country is standardized.

7
Global Trends in Finance 2018
CAMPAIGN INSIGHTS:
Device CTR
Mobile, Tablet and Desktop Device CTR by CountryThese country-specific trends provide a benchmark for advertisers looking to allocate spend by device in specific countries.
For example, a finance advertiser in the US running a desktop campaign should test mobile campaigns, as the CTR for mobile is over 40% higher than desktop.
Alternatively, a finance advertiser in Germany running desktop and mobile campaigns should test tablet campaigns, as the CTR is over 16% higher for both.
Finally, Brazil and Israel are also worth mentioning here, with mobile CTR that are up to three times higher than desktop.
United States
DESK
TOP
TABLET
MOBILE
0.09% 0.13%
0.12%
Canada
DESK
TOP
TABLET
MOBILE
0.086% 0.13%
0.16%
0.08580254963 0.1296599428 0.1565398952
Italy
DESK
TOP
TABLET
MOBILE
0.086% 0.16%
0.15%
United Kingdom
0.07% 0.067%
0.09%
DESK
TOP
TABLET
MOBILE
Australia
0.076% 0.097%
0.10%
DESK
TOP
TABLET
MOBILE
Brazil
DESK
TOP
TABLET
MOBILE
0.08% 0.28%
0.12%
France
DESK
TOP
TABLET
MOBILE
0.08% 0.12%
0.14%
Israel
DESK
TOP
TABLET
MOBILE
0.06% 0.25%
0.17%
South Korea
DESK
TOP
TABLET
MOBILE
0.042% 0.043%
0.03%
Germany
DESK
TOP
TABLET
MOBILE
0.11% 0.12%
0.14%
India
0.07% 0.09%
0.11%
DESK
TOP
TABLET
MOBILE
ThailandDE
SKTO
P
TABLET
MOBILE
0.056% 0.127%
0.087%
8
Global Trends in Finance 2018
CAMPAIGN INSIGHTS: Finance Image Performance Worldwide
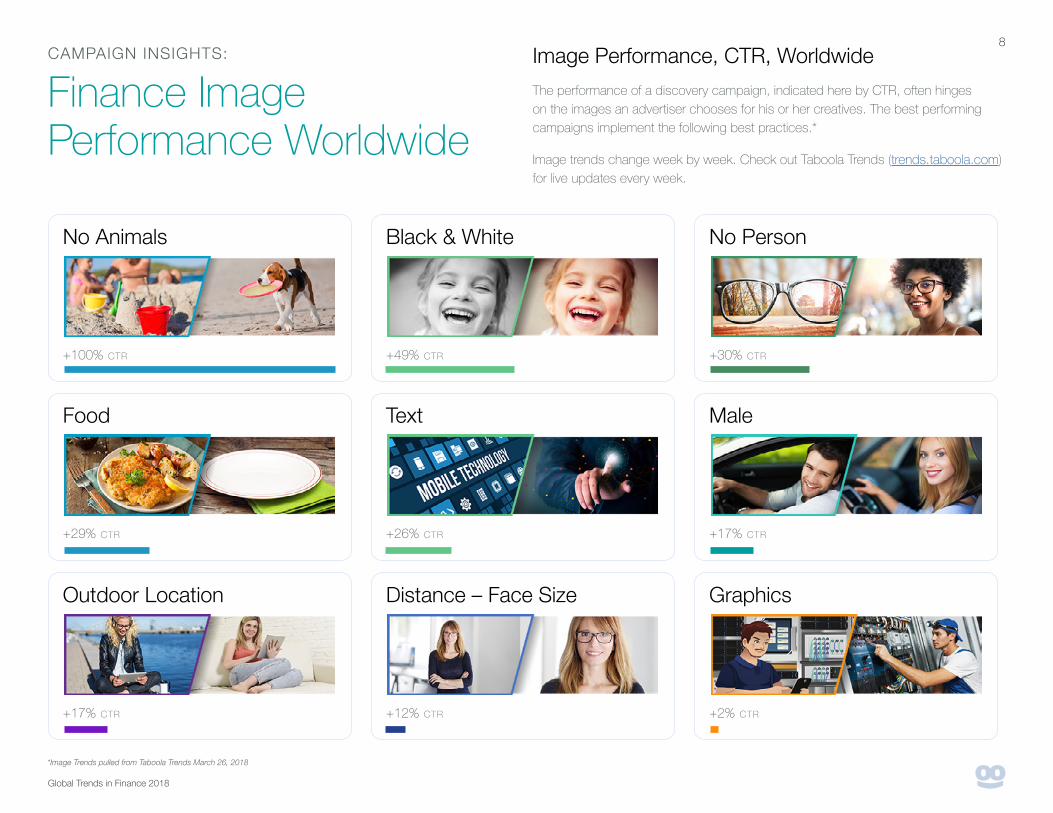
Image Performance, CTR, WorldwideThe performance of a discovery campaign, indicated here by CTR, often hinges on the images an advertiser chooses for his or her creatives. The best performing campaigns implement the following best practices.*
Image trends change week by week. Check out Taboola Trends (trends.taboola.com) for live updates every week.
No Animals
Food
Outdoor Location
Black & White
Text
Distance – Face Size
No Person
Male
Graphics
+100% ctr
+29% ctr
+17% ctr
+49% ctr
+26% ctr
+12% ctr
+30% ctr
+17% ctr
+2% ctr
*Image Trends pulled from Taboola Trends March 26, 2018

9
Global Trends in Finance 2018
Canada
France
United Kingdom
Australia
India
Germany
United States
+100% CTR
No Animals
+100% CTR
No Food
+100% CTR
Color
+289% CTR
Text
+100% CTR
Image Color
+100% CTR
Image Color
+122% CTR
Person Subject
CAMPAIGN INSIGHTS: Top Finance Image Trend by Country
Image Performance by CountryImage performance by country often deviates from worldwide trends. For finance advertisers targeting specific geographies, the best performing campaigns implement the following best practices.*
*Image Trends pulled from Taboola Trends March 26, 2018

10
Global Trends in Finance 2018
Earning
60% Israelincome /”הכנסה“
30% Israelworking /”עבודה“22% Italy“guadagnare” / earn12% Italy“guadagno” / “I earn”“guadagno” / “working”
Stocks 102% Canada “stocks”
12% India “gold”
22% India “investing”15% India “platinum”
50% Italy “investire” / invest40% Germany “rohstoffpreise” / commodity prices
CAMPAIGN INSIGHTS: Top Finance Keyword Performance Worldwide
Performance for the World’s Top Finance KeywordsHeadlines are another extremely important aspect of campaign performance for all discovery advertisers. The chart indicates performance for the most popular keywords worldwide.
Keywords are mapped from left to right by supply, and top to bottom by demand. Market opportunity for these keywords is highest in the top left quadrant, and then the top right, bottom left and bottom right respectively.
*Supply is indicated by the popularity of each keyword in headlines on the Taboola Network.Most Popular Keywords WorldwideSupply of Keyword* versus Demand for Keyword (Indicated by CTR)
HIGHEST OPPORTUNITY
LOWOPPORTUNITY Less
Demand (Low CTR)
More Supply
(Popular Worldwide)
Insurance
59% United Kingdom“policy”
202% Canada“insurance”
9% Israel /”ביטוח““insurance”
3.8% Australia “claim”
More Demand (High CTR)
LOWESTOPPORTUNITY
Spending
42% Australia“spent”
51% France“acheté” / buy
19% United Kingdom “paid”15% United States“pay”3% Italy“comprare”/ buy
56% United States“pays”
HIGHOPPORTUNITY
Home
12% Italy “casa”
24% United States“home”, “homeowners”
73% Australia“housing”
46% France“appartements” / apartments
17% France“ménages” / household
25% Australia“residents”
127% Canada“home”
231% Canada“residents”
26% Germany “autoversicherung”/car insurance
376% Australia “claim”
Auto
55% United States“drivers”
376% Australia “drivers”
20% Germany “fahrer”/driver
26% Germany “autoversicherung”/car insurance
Less Supply
(Only Popular in Specific Countries)
11
Global Trends in Finance 2018
CAMPAIGN INSIGHTS:
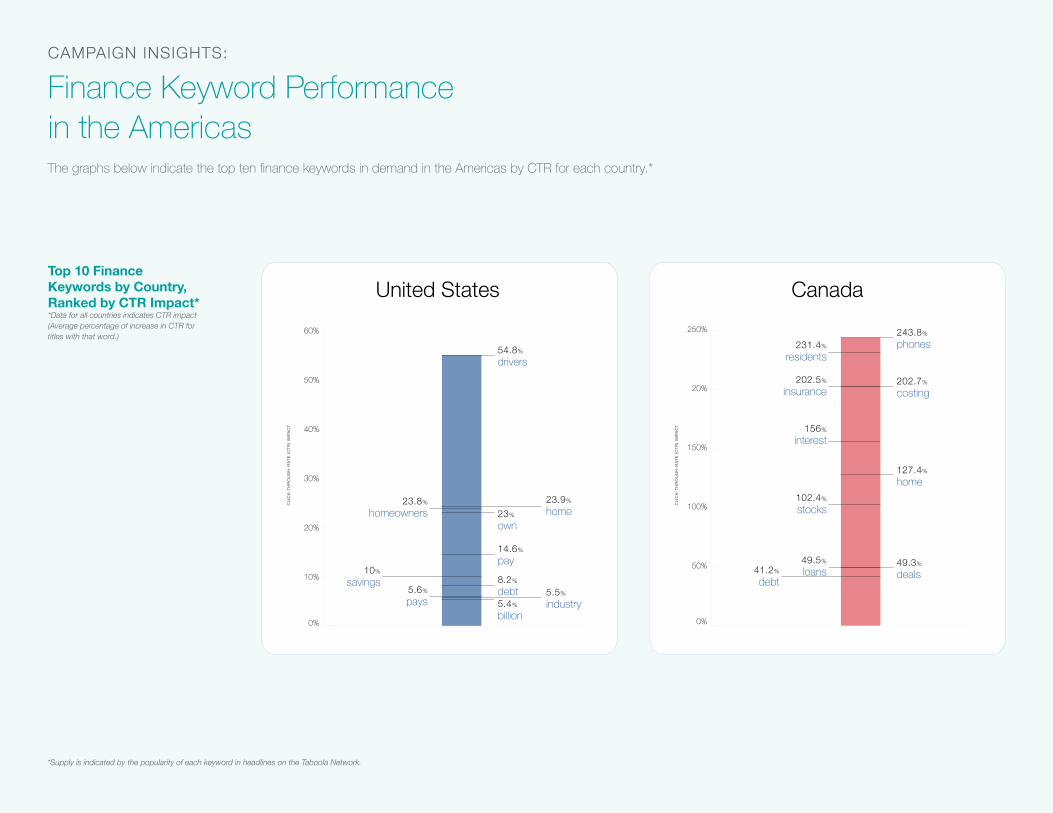
Finance Keyword Performance in the AmericasThe graphs below indicate the top ten finance keywords in demand in the Americas by CTR for each country.*
United States Canada
0%
10%
20%
30%
40%
50%
60%
54.8%
drivers
23.9%
home
5.5%
industry
23%
own
14.6%
pay8.2%
debt5.4%
billion
23.8%
homeowners
5.6%
pays
10%
savings
CLI
CK
-TH
RO
UG
H-R
ATE
(CTR
) IM
PAC
T
0%
50%
100%
150%
20%
250% 243.8%
phones
202.7%
costing
127.4%
home
49.3%
deals
231.4%
residents
202.5%
insurance
102.4%
stocks
49.5%
loans
156%
interest
41.2%
debt
CLI
CK
-TH
RO
UG
H-R
ATE
(CTR
) IM
PAC
T
*Supply is indicated by the popularity of each keyword in headlines on the Taboola Network.
Top 10 Finance Keywords by Country, Ranked by CTR Impact**Data for all countries indicates CTR impact (Average percentage of increase in CTR for titles with that word.)

12
Global Trends in Finance 2018
United Kingdom France
ItalyIsrael
CAMPAIGN INSIGHTS: Finance Keyword Performance in EMEA
0%
30%
60%
90%
120%
150%
140%
Brexit
84%
directors
58.9%
policy
33.3%
owned19.2%
paid
54.8%
pension
25.5%
refund22.6%
customers
23.4%
accountC
LIC
K-T
HR
OU
GH
-RAT
E (C
TR) I
MPA
CT
24.6%
thousands
0%
10%
20%
30%
40%
50%
60%59.8%
הכנסהincome
29.2%
עבודהworking
17.1%
תחסכוsave
5.7%
כסףof money
34.1%
המדינהthe state
19.2%
מסtax
8.6%
ביטוחinsurance
13.3%
מחירprice
4.5%
הבנקthe bank
8%
שקליםNIS
CLI
CK
-TH
RO
UG
H-R
ATE
(CTR
) IM
PAC
T
0%
25%
50%
500%
600%
530.5%
liraLira currency
1.3%
gratuitafree
22.1%
guadagnareearn
2.93%
comprarebuy
49.8%
investireinvest
20.6%
cessionecession
11.8%
segretariasecretary10.9%
11.7%
casahouse
CLI
CK
-TH
RO
UG
H-R
ATE
(CTR
) IM
PAC
Tguadagno
I earn
lavorandoworking
10%
20%
30%
40%
50%
60%
51.4%
achetébought
19.8%
réductionreduction
17.9%
loilaw
46.3%
appartementsapartments
19.5%
prévueexpected
hausserise
13.8%
banquesbanks
19.2%
mécanismesmechanisms
16.7%
bénéficierbenefit
17.1%
ménageshousehold
CLI
CK
-TH
RO
UG
H-R
ATE
(CTR
) IM
PAC
T
Germany
0%
20%
40%
60%
80%
100%
81.3%
machtpower
54%
DeutscheGerman
39.8%
rohstoffpreisecommodity prices
20%
fahrerdriver
59.5%
bankenbanks
12.5%
mittelstandmiddle class
41.1%
anziehenattract
26%
autoversicherungcar insurance
34.7%
kostencosts
16.6%
zahlennumbers
CLI
CK
-TH
RO
UG
H-R
ATE
(CTR
) IM
PAC
T
Top 10 Finance Keywords by Country, Ranked by CTR Impact**Data for all countries indicates CTR impact (Average percentage of increase in CTR for titles with that word.)

13
Global Trends in Finance 2018
Australia India
CAMPAIGN INSIGHTS: Finance Keyword Performance in APAC
0%
50%
100%
150%
200%
250%
300%
350%
400%376.3%
claimdrivers
277.4%
reward
72.8%
bubblehousing
80.5%
lotto41.6%
spent24.6%
residents23.2%
potential
CLI
CK
-TH
RO
UG
H-R
ATE
(CTR
) IM
PAC
T
0%
5%
10%
15%
20%
25%
30%
35%
40%38.4%
money
14.7%
platinum
7.8%
bank
31.5%
balance
22.4%
investing
11.6%
gold
4.2%
savings
10.8%
free10.6%
check
CLI
CK
-TH
RO
UG
H-R
ATE
(CTR
) IM
PAC
T
Top 10 Finance Keywords by Country, Ranked by CTR Impact**Data for all countries indicates CTR impact (Average percentage of increase in CTR for titles with that word.)
14
Global Trends in Finance 2018
USER INSIGHTS:
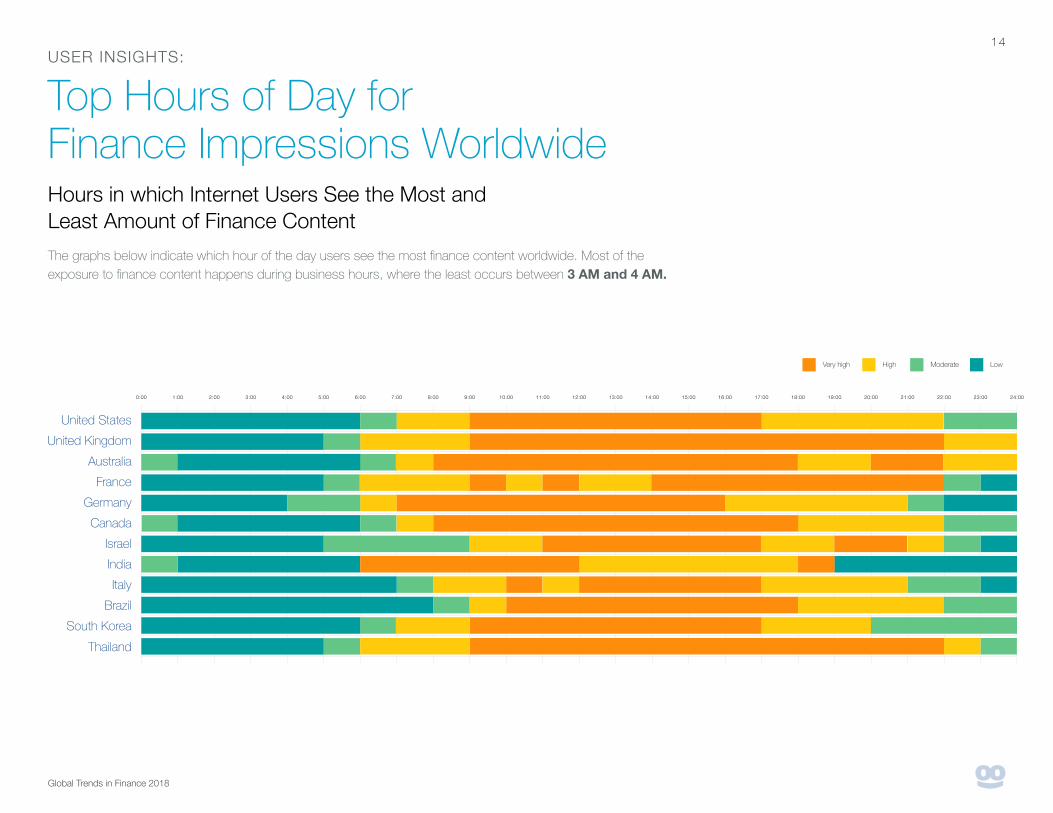
Top Hours of Day for Finance Impressions WorldwideHours in which Internet Users See the Most and Least Amount of Finance ContentThe graphs below indicate which hour of the day users see the most finance content worldwide. Most of the exposure to finance content happens during business hours, where the least occurs between 3 AM and 4 AM.
0:00 1:00 2:00 3:00 5:00 6:00 7:00 9:00 10:00 11:00 13:00 14:00 15:00 17:00 18:00 19:00 21:00 22:00 23:004:00 8:00 12:00 16:00 20:00 24:00
United StatesUnited Kingdom
AustraliaFrance
GermanyCanada
IsraelIndiaItaly
BrazilSouth Korea
Thailand
Very high High Moderate Low
15
Global Trends in Finance 2018
USER INSIGHTS:
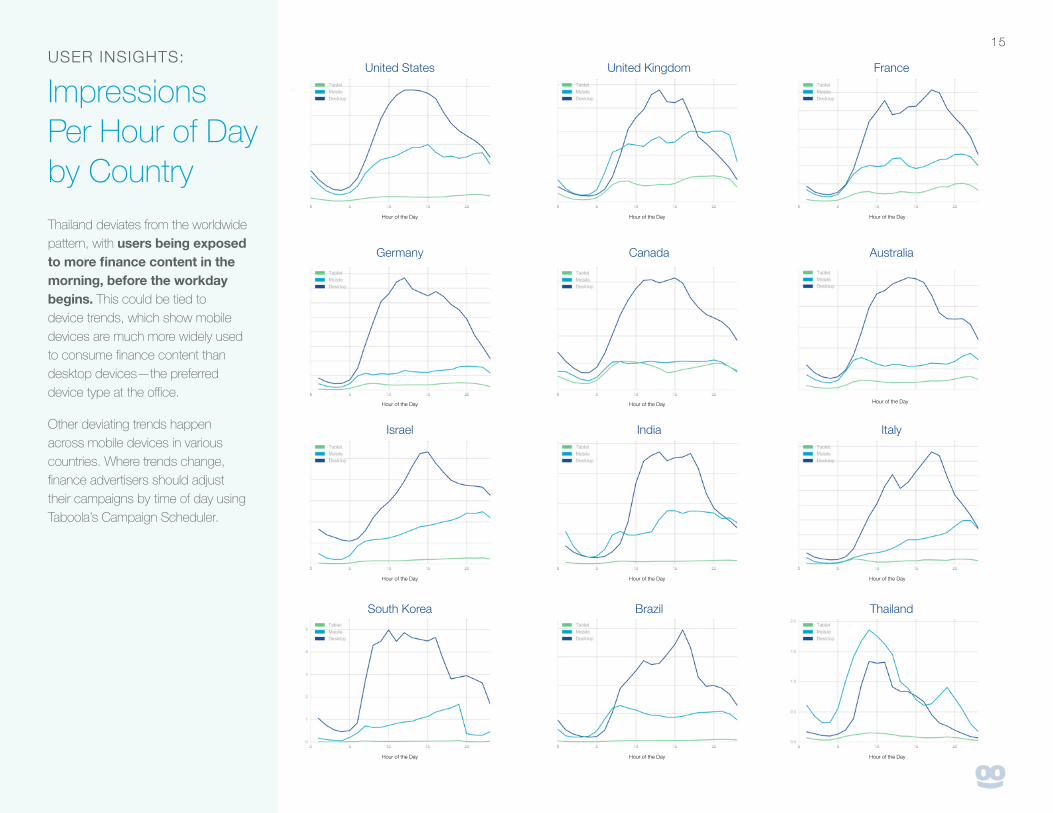
Impressions Per Hour of Day by CountryThailand deviates from the worldwide pattern, with users being exposed to more finance content in the morning, before the workday begins. This could be tied to device trends, which show mobile devices are much more widely used to consume finance content than desktop devices—the preferred device type at the office.
Other deviating trends happen across mobile devices in various countries. Where trends change, finance advertisers should adjust their campaigns by time of day using Taboola’s Campaign Scheduler.
United States
Hour of the Day
Hour of the Day
Hour of the Day
Hour of the Day
Hour of the Day
Hour of the Day
Hour of the Day
Hour of the Day
Hour of the Day
Hour of the Day
Hour of the Day
Hour of the Day
Germany
Israel
South Korea
United Kingdom
Canada
India
Brazil
France
Australia
Italy
Thailand
16
Global Trends in Finance 2018
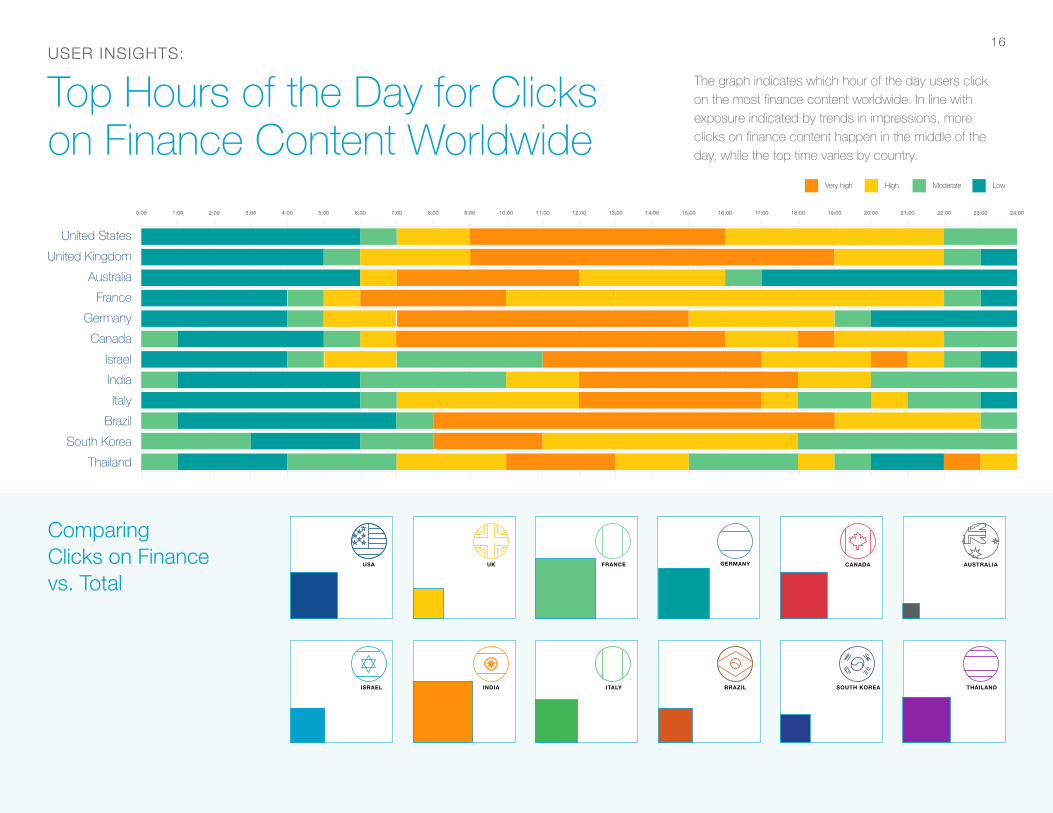
USER INSIGHTS:
Top Hours of the Day for Clicks on Finance Content Worldwide
The graph indicates which hour of the day users click on the most finance content worldwide. In line with exposure indicated by trends in impressions, more clicks on finance content happen in the middle of the day, while the top time varies by country.
0:00 1:00 2:00 3:00 5:00 6:00 7:00 9:00 10:00 11:00 13:00 14:00 15:00 17:00 18:00 19:00 21:00 22:00 23:004:00 8:00 12:00 16:00 20:00 24:00
United StatesUnited Kingdom
AustraliaFrance
GermanyCanada
IsraelIndiaItaly
BrazilSouth Korea
Thailand
Very high High Moderate Low
Comparing Clicks on Finance vs. Total

17
Global Trends in Finance 2018
Korea deviates from the worldwide pattern, with a 300% increase in clicks on finance content in the morning, around 9 AM. This engagement happens on desktop devices and then slowly declines until 4 AM.
In Israel, where the majority of clicks on finance content happen on mobile devices, the most clicks occur before and after work—perhaps during commuting hours.
USER INSIGHTS: Clicks Per Hour of Day by Country
United States
Germany
Israel
Brazil
United Kingdom
Canada
India
Thailand
France
Australia
Italy
Hour of the Day
Hour of the Day
Hour of the Day
Hour of the Day
Hour of the Day
Hour of the Day
Hour of the Day
Hour of the Day
Hour of the Day
Hour of the Day
Hour of the Day
18
Global Trends in Finance 2018
0
60,000
30,000
120,000
90,000
150,000
SaturdayFridayThursdayWednesdayTuesdayMondaySunday
Click
s
Americas
EMEA
APAC
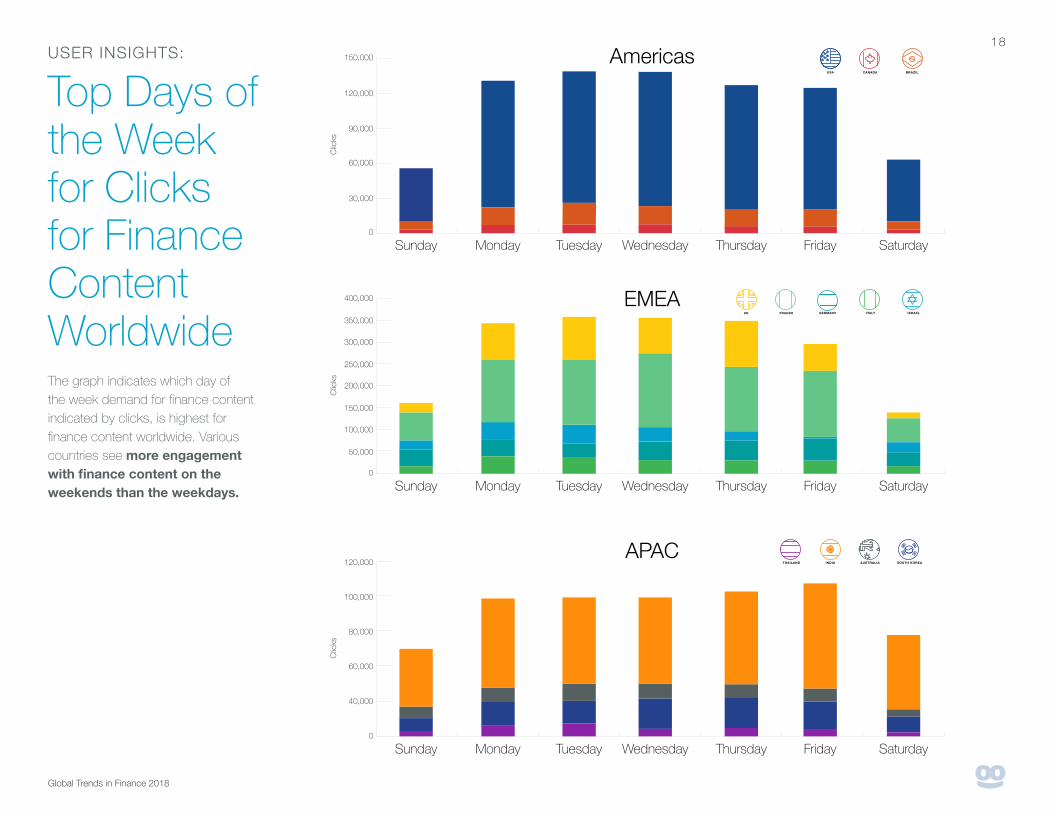
USER INSIGHTS: Top Days of the Week for Clicks for Finance Content WorldwideThe graph indicates which day of the week demand for finance content indicated by clicks, is highest for finance content worldwide. Various countries see more engagement with finance content on the weekends than the weekdays.
0
350,000
400,000
250,000
300,000
150,000
200,000
50,000
100,000
SaturdayFridayThursdayWednesdayTuesdayMondaySunday
Click
s
0
40,000
60,000
80,000
100,000
120,000
SaturdayFridayThursdayWednesdayTuesdayMondaySunday
Click
s

19
Global Trends in Finance 2018
In Canada, the CTR for mobile and tablet devices are fairly similar on the weekends and weekdays, but for desktop devices, CTRs drop dramatically over the weekend.
In Israel, the work week happens between Sunday and Thursday, and the weekend from Friday to Saturday. Although the CTR for desktop devices remains the same, the CTR for mobile and tablet devices increases over the weekend.
USER INSIGHTS:
CTR Per Day of the Week by Country
United States
Click
Thr
ough
Rat
e (C
TR)
Click
Thr
ough
Rat
e (C
TR)
Click
Thr
ough
Rat
e (C
TR)
Click
Thr
ough
Rat
e (C
TR)
Day of the Week
Day of the Week
Click
Thr
ough
Rat
e (C
TR)
Day of the Week
Click
Thr
ough
Rat
e (C
TR)
Day of the Week
Click
Thr
ough
Rat
e (C
TR)
Day of the Week
Click
Thr
ough
Rat
e (C
TR)
Day of the Week
Day of the Week
Day of the Week
Day of the Week
Day of the Week
Day of the Week
Day of the Week
Germany
Israel
South Korea
United Kingdom
Canada
India
Brazil
France
Australia
Italy
Thailand
Click
Thr
ough
Rat
e (C
TR)
Click
Thr
ough
Rat
e (C
TR)
Click
Thr
ough
Rat
e (C
TR)
Click
Thr
ough
Rat
e (C
TR)

20
Global Trends in Finance 2018
USER INSIGHTS:
Top Hours of the Day for CTR for Finance Content WorldwideThe graph indicates which hour of the day CTR is highest for finance content worldwide. Various countries see more engagement with finance content during work hours, and the least engagement between the hours of 3 AM and 4 AM.
0:00 1:00 2:00 3:00 5:00 6:00 7:00 9:00 10:00 11:00 13:00 14:00 15:00 17:00 18:00 19:00 21:00 22:00 23:004:00 8:00 12:00 16:00 20:00 24:00
United StatesUnited Kingdom
AustraliaFrance
GermanyCanada
IsraelIndiaItaly
BrazilSouth Korea
Thailand
Very high High Moderate Low
21
Global Trends in Finance 2018
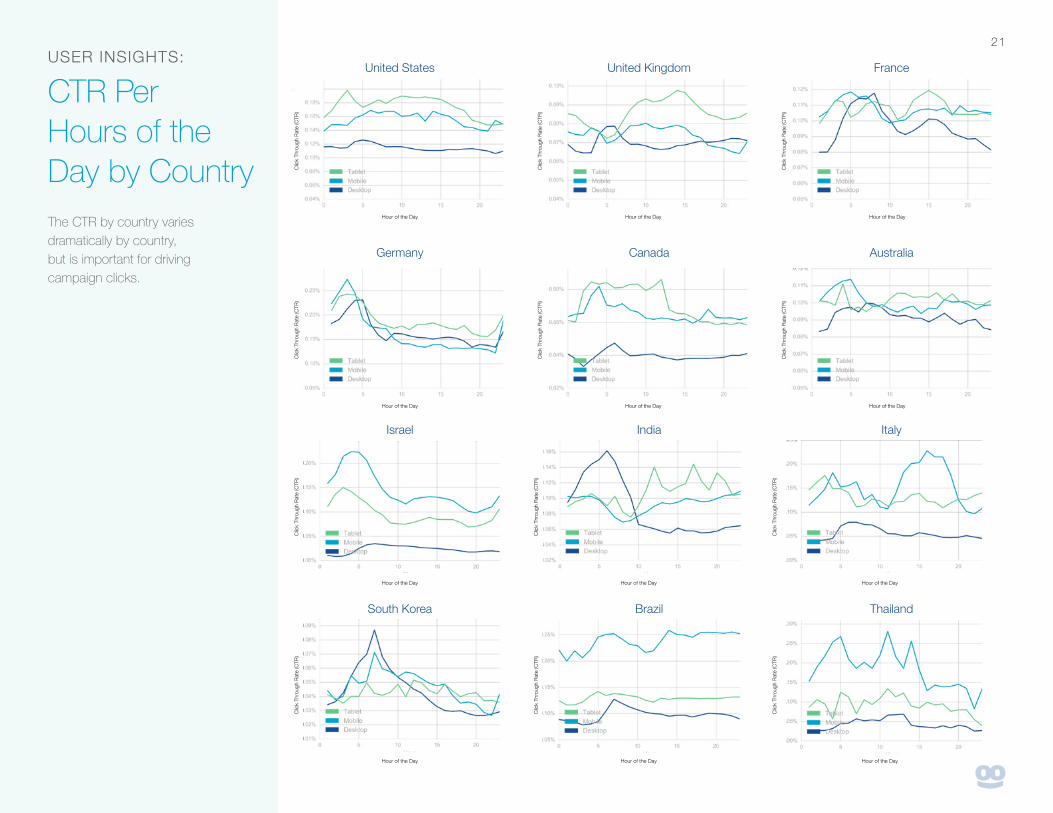
The CTR by country varies dramatically by country, but is important for driving campaign clicks.
USER INSIGHTS:
CTR Per Hours of the Day by Country
United States
Click
Thr
ough
Rat
e (C
TR)
Click
Thr
ough
Rat
e (C
TR)
Click
Thr
ough
Rat
e (C
TR)
Click
Thr
ough
Rat
e (C
TR)
Click
Thr
ough
Rat
e (C
TR)
Click
Thr
ough
Rat
e (C
TR)
Click
Thr
ough
Rat
e (C
TR)
Click
Thr
ough
Rat
e (C
TR)
Click
Thr
ough
Rat
e (C
TR)
Click
Thr
ough
Rat
e (C
TR)
Click
Thr
ough
Rat
e (C
TR)
Click
Thr
ough
Rat
e (C
TR)
Hour of the Day
Hour of the Day
Hour of the Day
Hour of the Day
Hour of the Day
Hour of the Day
Hour of the Day
Hour of the Day
Hour of the Day
Hour of the Day
Hour of the Day
Hour of the Day
Germany
Israel
South Korea
United Kingdom
Canada
India
Brazil
France
Australia
Italy
Thailand
Taboola is the leading discovery platform, serving over 450 billion recommendations of articles, blogs, videos, products and apps to over one billion unique users every month on thousands of premium sites and mobile carriers. Publishers, brand marketers, and performance advertisers leverage Taboola to retain users on their sites, monetize their traffic, and distribute organic and sponsored content as well as video to engage high-quality audiences.
Partners include: USA TODAY, Huffington Post, MSN, Business Insider, The Independent, Welt, L’Express and The Weather Channel. A global company with local service touchpoints, Taboola is headquartered in New York City with offices in Los Angeles, London, Tel Aviv, Mexico, New Delhi, Bangkok, São Paulo, Beijing, Shanghai, Istanbul, Seoul, Sydney and Tokyo.
Learn more at www.taboola.com and follow @taboola on Twitter.