Embed Size (px)
Citation preview
MARKET ORIENTATION, ALLIANCE ORIENTATION, AND BUSINESS
PERFORMANCE IN THE CANADIAN BIOTECHNOLOGY INDUSTRY
A Thesis Submitted to the College of
Graduate Studies and Research
In Partial Fulfillment of the Requirements
For the Degree of Master of Science
In the College of Pharmacy and Nutrition
Division of Pharmacy
University of Saskatchewan
Saskatoon
By
Grant Alexander Wilson
© Copyright Grant Alexander Wilson, April 2013. All rights reserved.

i
Permission
I hereby grant to University of Saskatchewan and/or its agents the non-exclusive license
to archive and make accessible, under the conditions specified below, my thesis, dissertation, or
project report in whole or in part in all forms of media, now or for the duration of my copyright
ownership. I retain all other ownership rights to the copyright of the thesis, dissertation or
project report. I also reserve the right to use in future works (such as articles or books) all or part
of this thesis, dissertation, or project report.
I hereby certify that, if appropriate, I have obtained and attached hereto a written
permission statement from the owner(s) of each third party copyrighted matter that is included in
my thesis, dissertation, or project report, allowing distribution as specified below. I certify that
the version I submitted is the same as that approved by my advisory committee.
ii
Abstract
There is a large body of research supporting the importance of market orientation in
determining performance. A growing body of research supports the notion that strategic alliance
management competencies positively influence performance. Few empirical investigations have
examined the importance of market orientation in the biotechnology industry, much less the
effect of alliance orientation on performance, or the combined effect of market and alliance
orientation on performance. This study explores these relationships among Canadian
biotechnology companies with medical/healthcare focuses. Of the 394 Canadian
medical/healthcare biotechnology companies identified, 81 usable responses were received,
yielding a response rate of 20.6 percent.
It was found that market orientation positively and significantly influenced business
performance, supporting the first hypothesis. Additionally, alliance orientation positively and
significantly influenced business performance, supporting the second hypothesis. However,
when market and alliance orientation were examined together, alliance orientation’s effect on
business performance remained positive and significant, but market orientation’s effect on
business performance became negative and non-significant. This prompted a further analysis
that investigated the presence of a mediation relationship. Market orientation was fully mediated
by alliance orientation in its relationship with business performance.
This study contributes academically by adding to market and alliance orientation research
and by the successful development of a biotechnology-specific performance instrument. This
study contributes to marketing and management strategy, as it outlines performance indicators
that enable high performance.

iii
Dedication
This Thesis is dedicated to my parents. To my father, a leader, entrepreneur, visionary,
mentor, and friend. To my mother, a nurturer, supporter, questioner, and friend. Your love,
encouragement, support, and positivity will forever be cherished and emulated.

iv
Acknowledgements
Many individuals have contributed to the research presented in this Thesis. I wish to
thank the following people:
My supervisor, Dr. Jason Perepelkin, for his advice, encouragement, guidance, support,
and teaching throughout my undergraduate and graduate studies. You continuously challenged
and encouraged me, allowing me to build an invaluable skill set. This Thesis should serve as a
testament of your outstanding academic and advisory abilities. Dr. Roy Dobson, for his support
and commitment throughout the academic process. Your experience, knowledge, and wisdom
are reflected in this Thesis. Dr. David Di Zhang, for his devotion, encouragement, and tireless
effort. You believed in me and never passed up an opportunity to compliment. I admire your
attention to detail and vast technical knowledge. Dr. Julian Vasilescu, for his support and ability
to share industry-specific knowledge that would have otherwise been unobtainable. My external
examiner, Dr. Eric Micheels for his interest and commitment. Mr. Marc-Antoine Vachon for
translating the English correspondence to French.
Canadian medical/healthcare biotechnology executives who made this Thesis possible by
completing the questionnaire. The College of Pharmacy and Nutrition, the administrative
personnel, my colleagues, and friends.
My mother and father for their love and support throughout my undergraduate studies,
graduate studies, and beyond.

v
Table of Contents
Permission............................................................................................................................................... i
Abstract .................................................................................................................................................. ii
Dedication ............................................................................................................................................. iii
Acknowledgements............................................................................................................................... iv
Table of Contents....................................................................................................................................v
List of Tables ........................................................................................................................................ xi
List of Figures ..................................................................................................................................... xiii
Chapter 1: Introduction ...........................................................................................................................1
1.1 Biotechnology Market ...............................................................................................................1
1.2 Biotechnology Managerial Skills...............................................................................................2
1.2.1 Market Orientation...........................................................................................................3
1.2.2 Alliance Orientation.........................................................................................................4
1.3 Marketing, Strategic Alliances, and Performance .....................................................................5
Chapter 2: Literature Review..................................................................................................................6
2.1 Market Orientation and Performance ........................................................................................6
Hypothesis 1 ...........................................................................................................................10
2.2 Strategic Alliances and Performance.......................................................................................10
Hypothesis 2 ...........................................................................................................................13
2.3 Market Orientation, Alliance Orientation, and Business Performance ...................................14
Hypothesis 3 ...........................................................................................................................14
2.4 Purpose of the Study ................................................................................................................14
2.5 Implications of Study...............................................................................................................15
vi
Chapter 3: Methodology .......................................................................................................................16
3.1 Study Design............................................................................................................................16
3.2 Sample .....................................................................................................................................16
3.3 Questionnaire Development ....................................................................................................18
3.3.1 Qualifying Question.......................................................................................................19
3.3.2 Market Orientation Instrument ......................................................................................19
3.3.3 Alliance Orientation Instrument ....................................................................................20
3.3.4 Business Performance Instrument .................................................................................22
3.3.5 Descriptive Items ...........................................................................................................23
3.3.5.1 Descriptive items one, two, and three ...............................................................23
3.3.5.2 Descriptive item four.........................................................................................24
3.3.5.3 Descriptive item five .........................................................................................25
3.3.5.4 Descriptive items six and seven ........................................................................26
3.4 Questionnaire Distribution and Data Collection......................................................................26
3.5 Data Analyses ..........................................................................................................................27
3.6 Ethical Considerations .............................................................................................................30
Chapter 4: Results .................................................................................................................................32
4.1 Response Rate..........................................................................................................................32
4.2 Demographic Results...............................................................................................................32
4.2.1 Response Language .......................................................................................................33
4.2.2 Method of Completion...................................................................................................33
4.2.3 Company Location.........................................................................................................33
4.2.4 Association Memberships..............................................................................................34
vii
4.2.5 Ownership Structure ......................................................................................................35
4.2.6 CEO’s Education ...........................................................................................................35
4.2.7 Company Age ................................................................................................................36
4.2.8 Company Size................................................................................................................37
4.3 Instrument Results ...................................................................................................................38
4.3.1 Market Orientation.........................................................................................................38
4.3.2 Alliance Orientation.......................................................................................................39
4.3.3 Business Performance....................................................................................................40
4.4 Analysis of Instruments ...........................................................................................................41
4.4.1 Market Orientation.........................................................................................................41
4.4.1.1 MO reliability....................................................................................................42
4.4.1.2 MO factor analysis ............................................................................................44
4.4.1.3 MO instrument conclusion ................................................................................45
4.4.2 Alliance Orientation.......................................................................................................45
4.4.2.1 AO reliability.....................................................................................................46
4.4.2.2 AO factor analysis .............................................................................................47
4.5.2.4 AO instrument conclusion.................................................................................48
4.4.3 Business Performance....................................................................................................48
4.4.3.1 PERF reliability.................................................................................................48
4.4.3.2 PERF factor analysis .........................................................................................49
4.4.3.3 PERF instrument conclusion.............................................................................51
4.5 Non-response Bias ...................................................................................................................51
4.6 Discriminant Validity ..............................................................................................................51
viii
4.7 Descriptive Analyses ...............................................................................................................52
4.7.1 Response Language .......................................................................................................52
4.7.2 Method of Completion...................................................................................................52
4.7.3 Science Park Location ...................................................................................................53
4.7.4 Association Memberships..............................................................................................53
4.7.5 Ownership Structure ......................................................................................................53
4.7.6 Educational Background................................................................................................54
4.7.7 Company Age ................................................................................................................54
4.7.8 Company Size................................................................................................................54
4.7.9 Descriptive Analyses Conclusion ..................................................................................55
4.8 Regression Analyses ................................................................................................................55
4.8.1 Market Orientation and Business Performance .............................................................55
4.8.2 Alliance Orientation and Business Performance ...........................................................56
4.8.3 Market Orientation, Alliance Orientation, and Business Performance .........................58
4.8.4 Market Orientation and Alliance Orientation ................................................................59
4.9 Post-Hoc Analyses...................................................................................................................61
4.9.1 Market Orientation and Business Performance .............................................................61
4.9.2 Alliance Orientation and Business Performance ...........................................................62
4.9.3 Market Orientation, Alliance Orientation, and Business Performance .........................64
4.9.4 Market Orientation and Alliance Orientation ................................................................65
Chapter 5: Discussion ...........................................................................................................................67
5.1 Responses.................................................................................................................................67
5.2 Demographics ..........................................................................................................................67
ix
5.3 Reliability.................................................................................................................................68
5.4 Non-response Bias ...................................................................................................................70
5.5 Descriptive Analyses ...............................................................................................................70
5.5.1 Response Language .......................................................................................................70
5.5.2 Method of Completion...................................................................................................71
5.5.3 Science Park Location ...................................................................................................71
5.5.4 Association Memberships..............................................................................................72
5.5.5 Ownership Structure ......................................................................................................73
5.5.6 Educational Background................................................................................................74
5.5.7 Company Age ................................................................................................................75
5.5.8 Company Size................................................................................................................75
5.6 Hypotheses...............................................................................................................................76
5.6.1 Hypothesis 1 ..................................................................................................................76
5.6.2 Hypothesis 2 ..................................................................................................................78
5.6.3 Hypothesis 3 ..................................................................................................................80
5.6.4 Post-Hoc Analyses.........................................................................................................83
Chapter 6: Limitations ..........................................................................................................................85
Chapter 7: Conclusion & Future Directions .........................................................................................88
References.............................................................................................................................................91
Appendix A – English Questionnaire .................................................................................................102
Appendix B – French Questionnaire...................................................................................................108
Appendix C – Market Orientation (Adapted) – Narver and Slater (1990) .........................................114
Appendix D – Alliance Orientation – Kandemir, Yaprak, Cavusgil (2006) ......................................115
x
Appendix E – R&D Effectiveness – De Luca, Verona, and Vicari (2010) ........................................116
Appendix F – Business Performance – R&D Effectiveness (Adapted and Broadened) – De Luca, Verona, and Vicari (2010) ..................................................................................................................117
Appendix G – English Initial Letter....................................................................................................118
Appendix H – French Initial Letter.....................................................................................................119
Appendix I – English Reminder Postcard...........................................................................................120
Appendix J – French Reminder Postcard............................................................................................121
Appendix K – English Second Letter .................................................................................................122
Appendix L – French Second Letter...................................................................................................123
Appendix M – Hypothesis Map..........................................................................................................124
Appendix N – Response Map .............................................................................................................125
xi
List of Tables
Table 3.1 Data Collection Timeline......................................................................................................27
Table 4.1 Responses by Province .........................................................................................................34
Table 4.2 Association Memberships.....................................................................................................35
Table 4.3 Ownership Structure .............................................................................................................35
Table 4.4 CEO or President’s Education ..............................................................................................36
Table 4.5 Founding Year ......................................................................................................................37
Table 4.6 Company Size .......................................................................................................................37
Table 4.7 Market Orientation................................................................................................................39
Table 4.8 Alliance Orientation..............................................................................................................40
Table 4.9 Business Performance...........................................................................................................41
Table 4.10 MO Total Statistics .............................................................................................................43
Table 4.11 Market Orientation Component Matrix ..............................................................................45
Table 4.12 AO Total Statistics..............................................................................................................46
Table 4.13 Alliance Orientation Component Matrix ...........................................................................48
Table 4.14 PERF Total Statistics ..........................................................................................................49
Table 4.15 Business Performance Component Matrix .........................................................................50
Table 4.16 Correlations.........................................................................................................................51
Table 4.17 H1 Model Summary............................................................................................................55
Table 4.18 H1 ANOVA ........................................................................................................................56
Table 4.19 H1 Coefficients ...................................................................................................................56
Table 4.20 H2 Model Summary............................................................................................................57
Table 4.21 H2 ANOVA ........................................................................................................................57
xii
Table 4.22 H2 Coefficients ...................................................................................................................57
Table 4.23 H3 Model Summary............................................................................................................58
Table 4.24 H3 ANOVA ........................................................................................................................58
Table 4.25 H3 Coefficients ...................................................................................................................59
Table 4.26 Mediation Model Summary ................................................................................................60
Table 4.27 Mediation ANOVA.............................................................................................................60
Table 4.28 Mediation Coefficients .......................................................................................................60
Table 4.29 Post-Hoc H1 Model Summary............................................................................................61
Table 4.30 Post-Hoc H1 ANOVA ........................................................................................................62
Table 4.31 Post-Hoc H1 Coefficients ...................................................................................................62
Table 4.32 Post-Hoc H2 Model Summary............................................................................................63
Table 4.33 Post-Hoc H2 ANOVA ........................................................................................................63
Table 4.34 Post-Hoc H2 Coefficients ...................................................................................................63
Table 4.35 Post-Hoc H3 Model Summary............................................................................................64
Table 4.36 Post-Hoc H3 ANOVA ........................................................................................................64
Table 4.37 Post-Hoc H3 Coefficients ...................................................................................................65
Table 4.38 Post-Hoc Mediation Model Summary ................................................................................65
Table 4.39 Post-Hoc Mediation ANOVA.............................................................................................66
Table 4.40 Post-Hoc Mediation Coefficients........................................................................................66
xiii
List of Figures
Figure 4.1 Market Orientation Scree Plot .............................................................................................44
Figure 4.2 Alliance Orientation Scree Plot ...........................................................................................47
Figure 4.3 Business Performance Scree Plot ........................................................................................50
Figure 5.1 Model 1................................................................................................................................77
Figure 5.2 Model 2................................................................................................................................79
Figure 5.3 Model 3................................................................................................................................81
Figure 5.4 Model 4................................................................................................................................82
1
CHAPTER 1 INTRODUCTION
Biotechnology is “the application of science and technology to living organisms, as well
as parts, products, and models thereof, to alter living or nonliving materials for the production of
knowledge, goods, and services” (Organisation for Economic Co-operation and Development
2011). The North American Industry Classification System (2007) provides a similar definition
of the biotechnology industry, emphasizing the industry’s use of research and development
(R&D) in the areas of microorganisms and genetic alteration to discover new processes,
prototypes, and products for various sectors (North American Industry Classification System
2007). In its entirety, the biotechnology industry “consists of the development, manufacturing,
and marketing of products based on advanced biotechnology research” (Datamonitor 2011d).
Due to the increase of cross-border financing, technology, alliances, and mergers and
acquisitions, biotechnology is a rapidly expanding worldwide industry (Datamonitor 2011d;
Simon and Kotler 2003).
1.1 Biotechnology Market
In 2010 the global biotechnology market value was estimated to be 250 billion USD and
projected to grow to 300 billion USD by 2015 (Datamonitor 2011d). The largest subsector of the
global biotechnology market is medical/healthcare, accounting for more than 67 percent of total
market value (Datamonitor 2011d). The biotechnology industry in the Americas (North and
South America) accounts for over 46 percent of the global market (Datamonitor 2011d).
Specifically, the United States (US) is the world-leader in biotechnology (Datamonitor 2011a).
Similar to the US, Canada is a leader in biotechnology, ranking in the top five countries globally
(Conference Board of Canada 2005; Government of Canada 2011; Industry Canada 2011b). In
2010 and in the midst of global economic turmoil, the Canadian biotechnology industry
2
experienced an increase in the signing of licensing agreements, attainment of capital raised
privately and through equity markets, and engagement in mega-mergers and acquisitions,
demonstrating the industry’s resilience (Ernst & Young 2011). Today, it is estimated that
Canada has over 500 private biotechnology companies with at least one product in development
(Conference Board of Canada 2005; Industry Canada 2011b; BIOTECanada 2011a). There are
many subsectors in the biotechnology industry including medical/healthcare, agriculture/food,
environmental/industrial, and information technology services (Industry Canada 2011b;
Datamonitor 2011b). As with the global biotechnology market, the medical/healthcare subsector
dominates the Canadian industry (Industry Canada 2011b; Datamonitor 2011b). Estimates
suggest anywhere from 60 to 66 percent of all Canadian biotechnology companies are
medical/healthcare firms (Datamonitor 2011d; Conference Board of Canada 2005; Industry
Canada 2011b). Additionally, the majority of these companies are small- to medium-sized
enterprises (SMEs) (Conference Board of Canada 2005; Datamonitor 2011b; Rajamaki 2008).
1.2 Biotechnology Managerial Skills
Renko, Carsrud, Brannback, and Jalkanen (2005) state that some managers of
technology-focused SMEs tend to overemphasize the importance of science and technology and
neglect managerial issues including marketing and product positioning in the marketplace
(Renko et al. 2005). In the biotechnology market, effectiveness is predicated on having a strong
and complete management team with competencies in all functional areas including marketing
(Woiceshyn 1993). Costa, Fontes, and Heitor (2004) state that marketing is an imperative
managerial competency for successful biotechnology commercialization. Additionally,
biotechnology ventures with high market knowledge are more likely to be acquisition candidates,
obtain licensing deals, and accumulate capital infusions (Renko, Carsrud, and Brannback 2008).
Contrarily, managerial deficiencies such as the lack of marketing expertise can lead to obstacles
3
in the biotechnology development process (Rajamaki 2008; Costa, Fontes, and Heitor 2004;
Eriksson and Rajamaki 2010). Chief Executive Officers (CEOs) and managers of biotechnology
companies identified having a focus in marketing strategy and the establishment of strategic
alliances as critical industry success factors (Hourd and Williams 2008). Yim and Weston
(2007) found that there is a strong demand for biotechnology managers and entrepreneurs with
marketing and alliance-building competencies, as these traits enable organizational success. Due
to the industry’s competitive intensity with regard to the attainment of capital and survival,
biotechnology managers need to be successful in identifying target markets and sharing
knowledge with strategic alliance partners as these competencies have been proven to perpetuate
organizational success (Terziovski and Morgan 2006).
1.2.1 Market Orientation
Marketing is defined as “the activity, set of institutions, and processes for creating,
communicating, delivering, and exchanging offerings that have value for customers, clients,
partners, and society at large” (American Marketing Association 2007). In marketing and
management academic research, market orientation (MO) is fundamental to the marketing
concept (Appiah-Adu 1998; Appiah-Adu and Ranchhod 1998; Drucker 1954; Farrell and
Oczkowski 1997; Greenley 1995; Han, Kim, and Srivastava 1998; Harris 2001; Kohli and
Jaworski 1990; McCarty 1960; Narver and Slater 1990; Subramanian and Gopalakrishna 2001).
Conceptualizations provided by Narver and Slater (1990) and Kohli and Jaworski (1990) are the
two most widely employed measures for investigating MO. Narver and Slater (1990) theorize
that MO is a construct comprised of behavioural components including customer orientation,
competitor orientation, and interfunctional coordination (Narver and Slater 1990; Farrell 2002).
Kohli and Jaworski (1990) postulate that MO is an organizational activity aimed at generating
market knowledge, disseminating knowledge throughout the organization, and incorporating
4
knowledge in order to better serve customers. Regardless of the measure used to assess MO,
scoring high on either scale signifies organizational commitment to marketing strategy. For the
purpose of this study, the Narver and Slater (1990) definition of MO will be adopted.
Utilizing the Hourd and Williams (2008) and Yim and Weston (2007) findings as a basis
for further investigation, a MO instrument could be used to measure the employment of
marketing strategy in biotechnology companies. Although strategic marketing capabilities are
said to be an imperative in the commercialization process, the body of research surrounding
marketing and biotechnology is limited, especially regarding MO in the biotechnology industry.
1.2.2 Alliance Orientation
Strategic alliances are inter-organizational agreements aimed at collectively achieving
individual organizational goals and gaining competitive advantages (Elmuti, Abebe, and Nicolosi
2005; Parkhe 1993; Varadarajan and Cunningham 1995). In the pharmaceutical and
biotechnology industries, strategic alliances are highly prevalent as these cooperative efforts
enable global expansion and minimize risk for alliance partners (Simon and Kotler 2003;
McCutchen and Swamidass 2004). Alliance orientation (AO) is an instrument used to measure
the employment of alliance strategies in organizations (Kandermir, Yaprak, and Cavusgil 2006).
However, unlike previous strategic alliance measurements, AO aims to comprehensively
measure strategic alliance practices. Kandermir, Yaprak, and Cavusgil (2006) developed the AO
instrument to measure a company’s ability to scan for new alliance partners, coordinate alliance
strategies, and learn from alliance experiences. Similar to MO, scoring high on the AO scale
indicates organizational commitment to activities pertaining to alliance strategy. Despite the
importance of strategic alliances and the AO instrument’s ability to measure strategic alliance
management comprehensively, no known study has employed the AO instrument in the
biotechnology industry.
5
1.3 Marketing, Strategic Alliances, and Performance
As discussed, marketing and strategic alliances in the field of biotechnology are critical
industry success factors (Hourd and Williams 2008; Yim and Weston 2007). With the use of
MO instruments, Appiah-Adu and Ranchhod (1998), De Luca, Verona, and Vicari (2010), and
Renko, Carsrud, and Brannback (2009), investigated the relationship between biotechnology
companies’ commitment to marketing and its influence on performance. Additional studies have
examined the relationship between strategic alliance metrics (e.g. size, efficiency, horizontal,
vertical, proactiveness) (Baum, Calabrese, and Silverman 2000; Baum and Silverman 2004;
Forest and Martin 1992; George et al. 2001; George, Zahra, and Wood 2002; Levitte and Bagchi-
Sen 2010; Silverman and Baum 2002; Stuart, Ozdemir, and Ding 2007). However, none have
employed the AO instrument to holistically measure the relationship between strategic alliances
and performance.
To date, no known study explores MO, AO, and performance in the Canadian
biotechnology industry. Exploring the relationship between MO, AO, and performance in the
Canadian biotechnology industry is valuable for many reasons. Namely, Canada is a global
leader in biotechnology, investigating antecedents to performance has theoretical and managerial
implications, MO, AO, and performance in the Canadian biotechnology context is an unstudied
area, and MO and AO are measures that assess two key critical industry success factors (e.g.
marketing and strategic alliances).
6
CHAPTER 2 LITERATURE REVIEW
Business performance is a recurrent theme for management researchers and practitioners
(Venkatraman and Ramanujam 1986). Investigating possible antecedents (e.g. MO and AO) to
business performance bridges the gap between management theory and practice, as results often
prove to have practical implications for managers to improve performance.
2.1 Market Orientation and Performance
The MO and performance relationship has been studied across various industries
(biotechnology, construction/surveyor, exporters, forestry, hotel, internet advertisers,
manufacturing, mass-merchandisers, multi-industry, and services), in many countries (Australia,
Canada, China, Ghana, India, Israel, Saudi Arabia, United Kingdom, and United States), with
differing MO instruments, and using contrasting performance measurements (Appiah-Adu 1998;
Appiah-Adu and Ranchhod 1998; Greenley 1995; Harris 2001; Narver and Slater 1990;
Subramanian and Gopalakrishna 2001; Cadogan, Cui, and Li 2003; Cadogan, Diamantopoulos,
and Siguaw 2002; Dawes 2000; Deng and Dart 1994; Diamantopoulos and Hart 1993; Jaworski
and Kohli 1993; Kara, Spillan, and DeShields 2005; Matsuno and Mentzer 2000; Noble, Sinha,
and Kumar 2002; Perry and Shao 2002; Pulendran, Speed, and Widing 2000; Rose and Shoham
2002; Sargeant and Mohamad 1999; Slater and Narver 1994; Tay and Morgan 2002; Bhuian
1998). Despite the diverse settings, MO has been repeatedly shown to have a positive, and direct
or moderating role in its relationship with performance (Appiah-Adu 1998; Appiah-Adu and
Ranchhod 1998; Greenley 1995; Harris 2001; Narver and Slater 1990; Subramanian and
Gopalakrishna 2001; Cadogan, Cui, and Li 2003; Cadogan, Diamantopoulos, and Siguaw 2002;
Dawes 2000; Deng and Dart 1994; Jaworski and Kohli 1993; Kara, Spillan, and DeShields 2005;
Matsuno and Mentzer 2000; Noble, Sinha, and Kumar 2002; Perry and Shao 2002; Pulendran,
7
Speed, and Widing 2000; Rose and Shoham 2002; Slater and Narver 1994; Tay and Morgan
2002; Bhuian 1998). Few studies, including a United Kingdom (UK) multi-industry and a UK
hotel study, showed that MO had no effect, or a very weak effect, on performance
(Diamantopoulos and Hart 1993; Sargeant and Mohamad 1999). The majority of studies used
data from the manufacturing industry or a multitude of sectors (De Luca, Verona, and Vicari
2010; Heslop and Qu 2007), while only a small number of studies have explored MO and
performance in the biotechnology industry (Appiah-Adu and Ranchhod 1998; De Luca, Verona,
and Vicari 2010; Renko, Carsrud, and Brannback 2009).
Appiah-Adu and Ranchhod (1998) employed the Narver and Slater (1990) instrument to
measure MO and performance among UK biotechnology companies. Biotechnology executives
from various subsectors self-administered mailed questionnaires (Appiah-Adu and Ranchhod
1998). Appiah-Adu and Ranchhod (1998) hypothesized that MO would be positively related to
new product success, growth in market share, profit margins, and overall performance. Their
findings supported three of four hypotheses, specifically MO’s positive relationship with growth
in market share, profit margins, and overall performance (Appiah-Adu and Ranchhod 1998). No
statistically significant relationship was found between MO and new product success (Appiah-
Adu and Ranchhod 1998). Appiah-Adu and Ranchhod (1998) concluded that the unsupported
hypothesis was a result of the peculiarities of the biotechnology industry. Specifically, Appiah-
Adu and Ranchhod (1998) stated that variables other than MO may be more influential in new
product success (e.g. successful clinical trials).
Similarly, De Luca, Verona, and Vicari (2010) adapted the Narver and Slater (1990)
instrument to measure MO in the biotechnology industry. The authors designed new
performance measures, developed from in-depth interviews with Italian biotechnology
8
executives. De Luca, Verona, and Vicari (2010) hypothesized that customer orientation,
competitor orientation, and interfunctional coordination would be positively related to their
newly developed performance construct. As with Appiah-Adu and Ranchhod (1998), De Luca,
Verona, and Vicari (2010) mailed questionnaires to executives in varying subsectors of the
biotechnology industry. Results supported their third hypothesis, indicating interfunctional
coordination was positively and directly related to performance (De Luca, Verona, and Vicari
2010). It was found that customer orientation and competitor orientation were not positively and
directly related to performance, leading to the rejection of the first and second hypotheses. When
knowledge integration as a moderating variable was introduced, customer orientation showed a
positive and significant contribution to performance but the competitor orientation and
performance relationship was unchanged (De Luca, Verona, and Vicari 2010).
Renko, Carsrud, and Brannback (2009) adapted the Kohli and Jaworski (1990) scale to
explore the relationship between MO and performance. Capital invested in the company was the
main measure of performance and was adjusted based on firm size (Renko, Carsrud, and
Brannback 2009). Renko, Carsrud, and Brannback (2009) hypothesized that biotechnology
ventures’ MO is positively associated with capital infusions. A structured questionnaire was
administered in-person to CEOs or Managing Directors of human health biotechnology
companies in the US, Finland, and Sweden. Human health biotechnology companies were
defined as those that operated in the areas of human therapeutics, diagnostics, medical devices,
and technologies. Overall, MO was found to be an antecedent to capital invested in
biotechnology companies, ultimately supporting their hypothesis. However, when examined
separately, the significance of the MO and performance relationship was only present among
Finnish and Swedish companies. This suggests that differences, related to the strength of the
9
relationship between MO and performance, may exist across various national borders. Renko,
Carsrud, and Brannback’s (2009) findings suggest that it may be fruitful to examine the MO and
performance relationship in different countries (e.g. Canada).
To date, no known study of biotechnology companies has examined the MO and
performance relationship in the Canadian context. The Canadian biotechnology market is
similar to Finland, Sweden, and the US, as these countries’ industries are medical/healthcare-
focused and dominated by SMEs (Datamonitor 2011a; Datamonitor 2011b; Datamonitor 2011c).
The Canadian biotechnology industry more closely resembles the Scandinavian as opposed to the
American market with respect to the market size, number of companies, and supporting
industries (Datamonitor 2011a; Conference Board of Canada 2005; Industry Canada 2011b;
Ernst & Young 2011; BIOTECanada 2011a; Datamonitor 2011b; Datamonitor 2011c;
Biotechnology Europe 2012b; Biotechnology Europe 2012a; Canada’s Venture Capital & Private
Equity Association 2012; Battelle Technology Partnership Practice 2010; Datamonitor 2012a;
Datamonitor 2012b; Datamonitor 2011e). In the US, the biotechnology market is valued at 84.8
billion USD, it headquarters over 1,700 biotechnology companies and more than 4,000 venture
capital (VC) firms, and is the global leader in pharmaceuticals with a market value of 265 billion
USD (Datamonitor 2011a; Ernst & Young 2011; Battelle Technology Partnership Practice 2010;
Datamonitor 2011e). Contrarily, the Canadian, Finnish, and Swedish biotechnology markets are
substantially smaller in value than their American counterpart (Datamonitor 2011b; Datamonitor
2011c). Similar to Canada’s estimated 500-plus biotechnology companies, together, Sweden and
Finland have just over 550 firms (Conference Board of Canada 2005; Industry Canada 2011b;
BIOTECanada 2011a; Biotechnology Europe 2012b; Biotechnology Europe 2012a).
Additionally, compared to the VC industry in the US, the Canadian, Finnish, and Swedish VC
10
markets are less established in terms of the number of companies and overall experience
(Biotechnology Europe 2012b; Biotechnology Europe 2012a; Canada’s Venture Capital &
Private Equity Association 2012). Finally, compared to Canada and Sweden the US
pharmaceutical industry is over 10 and 40 times larger respectively (Datamonitor 2011a;
Datamonitor 2012a; Datamonitor 2012b). Based on the market similarities involving Canada,
Finland, and Sweden, it is theorized that the MO and performance relationship in Canada will
resemble the Finnish and Swedish results as opposed to the American results from the Renko,
Carsrud, and Brannback (2009) study. Therefore, the foregoing discussion regarding MO and
performance and the comparison of biotechnology markets led to the formulation of the first
hypothesis.
Hypothesis 1: Market orientation has a positive and significant effect on business
performance
2.2 Strategic Alliances and Performance
Strategic alliances in the North American biotechnology industry have been extensively
studied in academic research (Baum, Calabrese, and Silverman 2000; Baum and Silverman 2004;
Forest and Martin 1992; George et al. 2001; George, Zahra, and Wood 2002; Silverman and
Baum 2002; Sarkar, Echambadi, and Harrison 2001; Standing, Standing, and Lin 2008).
Furthermore, Baum, Calabrese, and Silverman (2000), Baum and Silverman (2004), and
Silverman and Baum (2002) examined elements of strategic alliances in all subsectors of the
Canadian biotechnology industry. In various settings involving biotechnology companies,
individual strategic alliance elements have been empirically shown to have positive and direct
relationships with performance (Baum, Calabrese, and Silverman 2000; Baum and Silverman
2004; Forest and Martin 1992; George et al. 2001; Sarkar, Echambadi, and Harrison 2001).
11
From 1991 through 1996, Baum, Calabrese, and Silverman (2000) studied strategic
alliances and performances of new Canadian biotechnology companies. They found that new
biotechnology companies’ performance increased with the size and efficiency of the alliance
networks (Baum, Calabrese, and Silverman 2000). Particularly, biotechnology companies that
obtained early alliances with pharmaceutical companies experienced more patenting, a
proliferation of revenue, an increase in the number of R&D and non-R&D employees, and
growth in R&D spending (Baum, Calabrese, and Silverman 2000).
Baum and Silverman (2004) investigated differing types of strategic alliances and their
relationship with financing and overall performance in the Canadian biotechnology industry.
Strategic alliances were categorized as either horizontal or vertical. Horizontal alliances were
defined as partnerships or agreements with rival biotechnology companies (Baum and Silverman
2004). Vertical alliances were further classified as either upstream or downstream agreements
(Baum and Silverman 2004). Upstream alliances were agreements between biotechnology
companies and “universities, research institutes, government labs, hospitals, or industry
associations” (Baum and Silverman 2004, 422). Downstream alliances were defined as
partnerships with firms closer to the market, including pharmaceutical, chemical, or marketing
companies (Baum and Silverman 2004). Baum and Silverman (2004) found that new
biotechnology ventures financially benefited most from downstream and horizontal alliances.
Baum and Silverman (2004) suggest that biotechnology companies with alliances closer to the
market (downstream or horizontal) raise more capital and perform well because it demonstrates
legitimacy and commercial viability to VCs.
George, Zahra, Wheatley, and Khan (2001) also studied alliance types versus
performance among biotechnology companies. Alliance types included horizontal, vertical,
12
knowledge generative, and knowledge attractive. Knowledge generative alliances pertained to
partnerships or agreements involving joint R&D, and knowledge attractive alliances involved
licensing or purchasing agreements (George et al. 2001). These results coincide with Baum and
Silverman (2004), promoting the idea that alliances vertically downstream and closer to the
market (licensing and purchasing agreements) increase the performances of biotechnology
companies.
Sarkar, Echambadi, and Harrison (2001) explored the relationship between alliance
proactiveness and market performance. Sarkar, Echambadi, and Harrison (2001) define alliance
proactiveness as scanning the business environment for alliance opportunities and engaging in
proactive activities to obtain alliances. Responses from executives in the US biotechnology
industry enabled Sarkar, Echambadi, and Harrison (2001) to conclude that alliance proactiveness
affects performance, and that the relationship is stronger with smaller biotechnology companies.
Contrarily, Forrest and Martin (1992) found that both small and large biotechnology
companies in Canada experienced a wide array of, and arguably equally positive, outcomes from
strategic alliances. Forrest and Martin (1992) caution that although small and large
biotechnology companies benefited from strategic alliances, positive results did not come
without considerable time and energy.
There is collective evidence showcasing how effective strategic alliance management is
an antecedent to performance (Baum, Calabrese, and Silverman 2000; Baum and Silverman
2004; Forest and Martin 1992; George et al. 2001; Sarkar, Echambadi, and Harrison 2001).
Based on the above findings, strategic alliance management requires the establishment of the
right partnerships and agreements and the distinction between upstream, downstream, knowledge
generative, and knowledge attractive alliances (Baum, Calabrese, and Silverman 2000; Baum
13
and Silverman 2004; George et al. 2001). Managers of biotechnology companies must also
practice proactive alliance activities and devote time and energy to existing alliances in order to
increase the likelihood of commercial success (Forest and Martin 1992; Sarkar, Echambadi, and
Harrison 2001).
The Kandermir, Yaprak, and Cavusgil (2006) AO instrument incorporates many alliance
metrics found in the works of Baum, Calabrese, and Silverman (2000), Baum and Silverman
(2004), George, Zahra, Wheatley, and Khan (2001), Forrest and Martin (1992), and Sarkar,
Echambadi, and Harrison (2001), as it measures environmental scanning (similar to
proactiveness), alliance coordination (effective management of partnerships at differing levels of
development), and alliance learning (commitment to alliances). Moreover, Simon and
Francoise’s (2003) four key elements of structuring alliance management include items that
resemble alliance scanning (need assessments and opportunity analyses), alliance coordination
(alliance objectives and alliance structuring), and alliance learning (priorities and knowledge
integration), further supporting Kandermir, Yaprak, and Cavusgil’s (2006) AO constructs.
To date, few empirical investigations have employed the Kandermir, Yaprak, and
Cavusgil (2006) instrument to explore AO, emphasizing this project’s ability to generate
knowledge in an unexplored area of study. Also, no known research explores the AO and
performance relationship in the biotechnology industry. Additionally, no known study has
looked at the AO and performance relationship exclusively in one country (e.g. Canada) or in
one biotechnology subsector (e.g. medical/healthcare). The prior review of literature regarding
strategic alliances and performance led to the formulation of the second hypothesis.
Hypothesis 2: Alliance orientation has a positive and significant effect on business
performance
14
2.3 Market Orientation, Alliance Orientation, and Business Performance
Marketing and strategic alliance management competencies have been cited as
biotechnology industry success factors (Hourd and Williams 2008; Yim and Weston 2007), MO
has been shown to increase the likelihood of commercial success in the biotechnology industry
(Appiah-Adu and Ranchhod 1998; De Luca, Verona, and Vicari 2010; Renko, Carsrud, and
Brannback 2009), and effective strategic alliance management has been proven to increase
biotechnology companies’ performance (Baum, Calabrese, and Silverman 2000; Baum and
Silverman 2004; Forest and Martin 1992; George et al. 2001; Sarkar, Echambadi, and Harrison
2001). Therefore, if biotechnology companies’ marketing (measured by MO) and strategic
alliance management competencies (measured by AO) are strong and positive, performance is
also likely to be favourable. Empirically, MO and other constructs (e.g. organizational
entrepreneurship, corporate entrepreneurship, organizational flexibility, export market
knowledge, quality and service, cultural affinity, and channel support) have been identified as
unique and additive predictors of performance (Bhuian and Habib 2004; Barrett and Weinstein
1998; Thirkell and Dau 1998). Combining MO and AO to examine their additive effect on
business performance is novel, as it is presumably an unstudied research area. The third
hypothesis was developed based on evidence highlighting the importance of MO and strategic
alliance management in the biotechnology industry, as well as findings from studies that
examined MO and other constructs’ additive effect on performance.
Hypothesis 3: Market and alliance orientation has a positive and significant additive
effect on business performance
2.4 Purpose of Study
The purpose of this study is to test the unexplored relationship between MO, AO, and
performance in the medical/healthcare subsector of the Canadian biotechnology industry. The
15
value of the study comes from determining if MO and AO individually and collectively are
antecedents to business performance. Understanding the antecedents to commercial success has
implications for many stakeholders.
2.5 Implications of Study
This study has implications for managers of biotechnology companies, angel investors
financing biotechnology start-ups, venture capitalists funding biotechnology companies,
pharmaceutical companies looking to partner with or acquire biotechnology ventures,
universities supporting the biotechnology industry, the Federal Government of Canada,
Provincial Governments of Canada, Canadian economy, biotechnology industry associations,
hospitals, medical professionals, and most importantly, patients. Ultimately, a better
comprehension of the antecedents to success, whether or not it is MO or AO, will have the
potential to guide effective resource allocation and investment decisions, increase biotechnology
commercialization success rates, stimulate the Canadian economy, and improve healthcare. In
addition to the societal and economic benefits, this study contributes academically by
undertaking an industry and subsector specific exploration of MO, AO, and business
performance. Thereby, the study expands the scope of biotechnology marketing and strategic
alliance management research and knowledge.
16
CHAPTER 3 METHODOLOGY
3.1 Study Design
The study design was a mail and web-based survey. Dillman’s (1978) Total Design
Method, a set of procedures and selectively timed mailings, was adapted and employed as it has
been shown to increase postal responses (SAGE Research Methods 2011). Dillman’s (1978)
procedures include printing questionnaires on standard letterhead and enclosing them in standard
envelopes, personalizing letters and content, and timing separate mailings (Dillman 1978). Due
to cultural changes toward self-administration (Dillman 2000) and the increased use and
acceptance of the Internet (Dillman 2000), a web-based option was included. This study utilized
a multi-modal approach to survey executives to better understand the current business practices
of medical/healthcare biotechnology companies in Canada.
Biotechnology executives (CEOs, Presidents, Vice Presidents, or Managing Directors)
were identified using the Canadian Life Sciences Database and Industry Canada’s Company
Database. Senior executives of Canadian biotechnology companies were selected as key
informants due to their comprehensive knowledge of company activities (e.g. marketing, alliance
strategy, and business performance). A multi-modal design was chosen as it allows for
respondent choice, autonomy, and flexibility (Dillman 2000). Interviews were considered, but
due to the objectives and financial constraints of the project, a mail and web-based survey was
deemed more appropriate.
3.2 Sample
The Canadian Life Sciences Database and Industry Canada’s Company Directory were
used to generate a mailing list of Canadian medical/healthcare biotechnology companies. The
Canadian Life Sciences Database was chosen because it is available at no cost and is relatively
17
comprehensive (Canadian Life Sciences Database 2012). The Canadian Life Sciences Database
and Industry Canada’s Company Directory generated company profiles that included a business’
name, brief description, subsector, senior executive contact (CEO, President, Vice President, or
Managing Director), address, founding year, products in clinical phases, and stock information
(if a publicly traded company) (Canadian Life Sciences Database 2012; Industry Canada 2012).
However, despite their similarities, Industry Canada’s Company Database produced fewer results
and did not include information on companies’ products in development stages (Industry Canada
2012).
Medical/healthcare firms were defined as biotechnology or biopharmaceutical companies
with focuses in therapeutics/diagnostics, human R&D services, cosmetic, nutraceutical, or
veterinary areas. Over the past few decades the activities of cosmetic, nutraceutical,
biotechnology, and pharmaceutical companies have converged (Simon and Kotler 2003),
emphasizing the necessity for this study’s inclusion of all companies currently operating, or with
the potential to operate, in human health areas. Using the Canadian Life Sciences Database, the
aforementioned criteria was employed by filtering biotechnology companies to include only
those in the categories of therapeutics/diagnostics, R&D services, cosmetic, nutraceutical, and
veterinary. Secondly, companies’ brief descriptions were read to confirm a medical, human
health, biopharmaceutical, or pharmaceutical focus. Using Industry Canada’s Company
Database, the study’s criteria were fulfilled by filtering results to include
“medical/biotechnology/chemical” companies, followed by reading companies’ of brief
descriptions to confirm focuses in the medical, human health, biopharmaceutical, and
pharmaceutical fields.
18
The Canadian Life Sciences Database assisted in the identification of 427
medical/healthcare biotechnology companies. Industry Canada’s Company Database was
consulted in order to cross-reference findings from the Canadian Life Sciences Database.
Industry Canada’s Company Database generated a total of 137 medical/healthcare biotechnology
companies, demonstrating that the Canadian Life Sciences Database’s was more comprehensive.
Despite generating fewer results, Industry Canada’s Company Database was used to identify 26
medical/healthcare biotechnology companies that were not included in the Canadian Life
Sciences Database. These additional 26 medical/healthcare biotechnology companies were
added to the existing list of 427 companies. The final list totaled 453 medical/healthcare
biotechnology companies.
3.3 Questionnaire Development
The questionnaire was five pages in length and it was estimated that the completion time
would be ten to fifteen minutes for each respondent. The questionnaire was comprised of five
sections including a qualifying question, the adapted Narver and Slater (1990) MO instrument,
Kandermir, Yaprak, and Cavusgil (2006) AO instrument, adapted and broadened De Luca,
Verona, and Vicari (2010) R&D effectiveness instrument, and general descriptive questions. In
order to ensure the inclusion of biotechnology companies located in the Province of Quebec,
with the cooperation of the Université du Québec à Montréal (UQAM), the original
questionnaire was translated from English (Appendix A) to French (Appendix B). As a result,
the questionnaire cover pages included both the University of Saskatchewan and the UQAM
logos.
19
3.3.1 Qualifying Question
The qualifying question was used to confirm that companies had a medical/healthcare
focus. This item was designed to safeguard against including responses from non-
medical/healthcare companies.
3.3.2 Market Orientation Instrument
The Narver and Slater (1990) MO instrument has been found to be superior to the
instrument developed by Kohli and Jaworski (1990) (Farrell and Oczkowski 1997; Matsuno and
Mentzer 2000; Cano, Carrillat, and Jaramillo 2004; Gauzente 1999; Pelham 1993). Statistically,
Narver and Slater’s (1990) achieved greater reliability (α = 0.88) than Kohli and Jaworski’s
(1990) (α = 0.71) MO instrument (Farrell and Oczkowski 1997; Narver and Slater 1990).
Furthermore, it has been concluded that the validity of Kohli and Jaworski’s (1990) MO
construct is only moderately supported (Kohli, Jaworski, and Kumar 1993). Conceptually, the
Narver and Slater (1990) scale better equates MO to a business’ performance, as it captures the
element of serving the needs of its customers (Cano, Carrillat, and Jaramillo 2004; Gauzente
1999). Furthermore, the Kohli and Jaworski (1990) MO instrument neglects to deal with
external factors (e.g. competitor orientation), only focusing on information generation (Cano,
Carrillat, and Jaramillo 2004). Gauzente (1999) asserts that the Narver and Slater (1990)
instrument better measures current commitment to MO and the vocabulary used is much richer.
Therefore, based on its conceptual and statistical superiority, only the Narver and Slater (1990)
scale was used to measure MO and the instrument was modified specifically for the
biotechnology industry.
Appiah-Adu and Ranchhod (1998) modified the Narver and Slater (1990) MO instrument
for use in the biotechnology industry. In order to better suit the biotechnology industry, a total of
three questions were eliminated and two questions were reworded. Subsequent to Appiah-Adu
20
and Ranchhod’s (1998) modifications, coefficient alpha scores were obtained and demonstrated
acceptable reliabilities (α > 0.70). Due to its proven and successful application in the
biotechnology industry, the Appiah-Adu and Ranchhod (1998) adapted version of Narver and
Slater’s (1990) MO instrument was utilized (Appendix C). For scale-size congruency with other
instruments, the MO instrument was collapsed from a seven- to a five-point Likert scale, as the
AO instrument cannot be expanded from a five- to a seven-point scale.
3.3.3 Alliance Orientation Instrument
As discussed, the Kandemir, Yaprak, and Cavusgil (2006) AO instrument measures
alliance scanning, coordination, and learning. Alliance scanning is the first component of AO
and it measures a firm’s ability to identify new partners, gather new information about existing
alliances, and engage in newly emerging alliance opportunities (Kandermir, Yaprak, and
Cavusgil 2006). Sarkar, Echambadi, and Harrison (2001) emphasized the importance of alliance
scanning as they found alliance proactiveness perpetuated performance. Alliance coordination
involves managing various activities across differing alliances, employing appropriate strategies
with partners, and transferring knowledge to alliance members. Baum, Calabrese, and Silverman
(2000), Baum and Silverman (2004), and George, Zahra, Wheatley, and Khan (2001) discuss the
complexities and importance of alliance management, legitimizing Kandemir, Yaprak, and
Cavusgil’s (2006) second component of alliance coordination. Alliance learning is the final
component of Kandemir, Yaprak, and Cavusgil’s (2006) AO instrument. Alliance learning
measures the experiences and learning processes of alliance members. Forrest and Martin (1992)
indirectly support Kandemir, Yaprak, and Cavusgil’s (2006) alliance learning component by
stressing the importance of effort and commitment in alliance relationships. Conceptually, the
Kandemir, Yaprak, and Cavusgil (2006) AO instrument is appropriate for the biotechnology
21
industry because its components are supported by previous industry-related research regarding
strategic alliances and performance.
Empirical work utilizing the Kandemir, Yaprak, and Cavusgil (2006) AO instrument is
fairly limited. Kandemir, Yaprak, and Cavusgil (2006) used the instrument to explore AO and
performance among technology companies. Technology companies from the chemical,
manufacturing, electronic, and computer industries were selected for their study. A total of 182
usable responses were obtained in order to test their hypotheses. Kandemir, Yaprak, and
Cavusgil’s (2006) findings showed that AO is positively and directly related to alliance
performance and indirectly related, through alliance performance as a moderator, to market
performance.
Sarkar, Aulakh, and Madhok (2004) leveraged two of the developed components, namely
alliance scanning and alliance coordination, when they explored their relationship with alliance
capital. Unlike Kandemir, Yaprak, and Cavusgil (2006), the research was conducted with multi-
industry respondents and the components were used individually to test hypotheses. Findings
showed a positive direct relationship between alliance scanning and alliance capital, and alliance
coordination and alliance capital.
Kandemir, Yaprak, and Cavusgil (2006) and Sarkar, Aulakh, and Madhok (2004)
obtained acceptable reliability, demonstrating construct rigor collectively and independently.
Furthermore, the measures prove to be successful measuring different performance constructs.
Therefore, the original five-point Kandemir, Yaprak, and Cavusgil (2006) AO instrument
(Appendix D) was employed to explore the relationship with business performance in Canada’s
medical/healthcare biotechnology industry.
22
3.3.4 Business Performance Instrument
In MO and strategic alliance research, performance has been measured objectively,
subjectively, and with differing instruments. Frequently, performance measurements have
included return-on-investment, return-on-assets, new product success, profitability, and sales
revenue (Appiah-Adu 1998; Greenley 1995; Han, Kim, and Srivastava 1998; Harris 2001; Zhang
2009). Commonly, performance elements have been measured subjectively, by asking
respondents to rate company performance relative to its competitors (Appiah-Adu 1998;
Greenley 1995; Harris 2001; Zhang 2009; Lukas and Ferrell 2000). The works of Dess and
Robinson (1984), Robinson and Pearce (1988), and Venkatraman and Ramanujam (1986) have
been cited as justification for the use of subjective measures. Specifically, they found strong
correlations between subjective responses and objective measures of firm performance
(Venkatraman and Ramanujam 1986; Dess and Robinson 1984; Robinson and Pearce 1988).
The use of a subjective performance measure is also supported when access to objective
performance data is limited. As many Canadian biotechnology companies are SMEs or not
publicly traded, it is necessary to employ subjective performance measures (Conference Board of
Canada 2005; Datamonitor 2011b; Rajamaki 2008; Canadian Life Sciences Database 2012).
Appiah-Adu and Ranchhod (1998) expressed their concerns related to the difficulty of
obtaining objective performance data in the biotechnology industry. In the Appiah-Adu and
Ranchhod (1998) study of UK biotechnology companies, respondents rated company
performance relative to competitors’ new product success, growth in market share, profit
margins, and overall performance. De Luca, Verona, and Vicari (2010), support Appiah-Adu
and Ranchhod’s (1998) justification for their use of subjective performance measurements in the
biotechnology industry. However, De Luca, Verona, and Vicari (2010) stress the need for
23
redefining and using industry specific measures of performance when studying biotechnology
companies.
Performance measurements related to patents, products, capital raised, milestones met,
networks and alliances, mergers and acquisitions, and licensing agreements have been used and
suggested as more appropriate measures of biotechnology performance (Baum, Calabrese, and
Silverman 2000; George et al. 2001; George, Zahra, and Wood 2002; De Luca, Verona, and
Vicari 2010; Renko, Carsrud, and Brannback 2009; Sarkar, Echambadi, and Harrison 2001;
Cumby and Conrod 2001; Folta, Cooper, and Baik 2006; Lazzarotti, Manzini, and Mari 2011;
Stuart and Sorenson 2003). De Luca, Verona, and Vicari’s (2010) R&D effectiveness scale
captures many of the mentioned elements desired for a biotechnology performance construct
(Appendix E). For this study, the De Luca, Verona, and Vicari (2010) instrument was adapted to
include items related to capital, alliances and partnerships, and milestones, broadening the
construct to capture overall biotechnology performance (PERF) (Appendix F). For consistency
with the other instruments (MO and AO), the newly constructed PERF instrument was a five-
point Likert scale.
3.3.5 Descriptive Items
Descriptive items allowed for a comparison of the companies’ locations, science park
affiliations or non-affiliations, association memberships (e.g. BIOTECanada), ownership
structures (e.g. publicly traded), executives’ educational backgrounds (e.g. MBA), founding
years, and number of employees.
3.3.5.1 Descriptive items one, two, and three
The first three descriptive items identify companies’ locations, science park affiliations,
and biotechnology association memberships. These items were included because in certain
settings, positive externalities and economic benefits originate from geographically clustering
24
around, and knowledge sharing with, other technology-intensive companies (Efendioglu 2005).
In a study of the US biotechnology industry, companies that geographically clustered
experienced economies of agglomeration, enhanced their ability to attract alliance partners,
obtained private equity, and innovated through partnering (Folta, Cooper, and Baik 2006).
However, Folta, Cooper, and Baik (2006) found that economies of agglomeration provided
economic benefits for companies only up to a certain cluster size. Specifically, when clusters of
biotechnology companies became too large, diseconomies of agglomeration occurred (Folta,
Cooper, and Baik 2006).
Descriptive items two and three were used as independent variables when analyzing their
importance, or lack of importance, in determining MO, AO, and PERF (dependent variables) in
the Canadian medical/healthcare biotechnology industry. The three descriptive items were used
with the other items to generate a profile of Canadian biotechnology companies.
3.3.5.2 Descriptive item four
The fourth descriptive item was included to determine companies’ ownership types.
Differences in ownership structures have been shown to influence biotechnology companies’
corporate strategies and performance (Baum, Calabrese, and Silverman 2000; Stuart, Hoang, and
Hybels 1999; Zahra 1996). In a study of American biotechnology companies, it was found that
R&D, patenting, and technology management strategies differed based on ownership types
(Zahra 1996). Zahra (1996) found that independently owned biotechnology ventures
outperformed corporate-sponsored biotechnology ventures on a variety of metrics. Stuart (1999)
showed that biotechnology companies that had established partners, issued stock more quickly
and had higher valuations than companies without such partners. An analysis of young Canadian
biotechnology companies demonstrated how differing ownership types and alliances led to
dissimilar focuses, specializations, and performance (Baum, Calabrese, and Silverman 2000).
25
Descriptive item four was used as an independent variable to analyze its importance, or
lack of importance, in determining MO, AO, and PERF (dependent variables) in the Canadian
medical/healthcare biotechnology industry. The fourth descriptive item was also used with the
other items to generate a profile of Canadian biotechnology companies
3.3.5.3 Descriptive item five
The fifth descriptive item was included to determine CEOs’ educational backgrounds.
There is much debate over the importance of the educational backgrounds of biotechnology
CEOs. Kermani and Gittins (2004) discuss how joint natural science and business educational
programs can increase the managerial talents of biotechnology executives. They concluded by
recommending that biotechnology executives with educational backgrounds in natural science or
engineering should be exposed to formal business training (Kermani and Gittins 2004).
McMillan (2005) highlights that many biotechnology companies’ executives are PhD natural
scientists and may lack experience in bringing products to the market and reaching profitability.
In McMillan’s (2005) study of US publicly traded biotechnology companies, firms headed by
CEOs with natural science PhDs had lower market valuations than firms headed by CEOs with
other educational backgrounds. Yet, companies led by CEOs with natural science PhDs tended
to produce “higher-impact” patents than companies led by CEOs with other educational
backgrounds (McMillan and Thomas 2005). McMillan (2005) concluded that stock markets
favour companies that are led by professional managers and the market does not base market
valuations solely on science or technology. Contrary to McMillan’s (2005) findings, in a study
of American and European biotechnology companies, educations of CEOs played no role in the
financial performance of their companies (Patzelt 2010).
The fifth descriptive item was used with the other items to generate a profile of Canadian
biotechnology companies. More importantly, descriptive item five was used as an independent
26
variable to analyze its importance, or lack of importance, in determining MO, AO, and PERF
(dependent variables) in the Canadian medical/healthcare biotechnology industry.
3.3.5.4 Descriptive items six and seven
Descriptive item six was designed to collect information on companies’ founding years.
McMillan (2005) found that US stock markets favoured older and more established
biotechnology enterprises. Descriptive item seven was designed to collect information on
companies’ number of employees. In Canada, most biotechnology companies are SMEs
(Conference Board of Canada 2005; Datamonitor 2011b; Rajamaki 2008; Government of
Canada 2012; BIOTECanada 2011b). Woiceshyn and Hartel (1996) compared small, medium,
and large Canadian biotechnology companies’ performance using subjective sales measures. It
was found sales performance increased with company size (Woiceshyn and Hartel 1996).
Although these findings suggest that companies that are older and have more employees
outperform companies that are smaller and have fewer employees, both studies only measured
performance financially.
Descriptive items six and seven were used as independent variables to analyze their
importance, or lack of importance, in determining overall biotechnology performance (PERF),
MO, and AO. Descriptive items six and seven were also used with the other items to generate a
profile of Canadian biotechnology companies.
3.4 Questionnaire Distribution and Data Collection
On May 28, 2012, the first mailing of the questionnaire was sent to the 453 identified
medical/healthcare biotechnology companies in Canada. Each package included a cover letter
(Appendices G & H), the questionnaire (Appendices A & B), and a paid-postage return
envelope. The cover letters were personally addressed to a senior executive, written on
University of Saskatchewan letterhead, and included the link to the online questionnaire
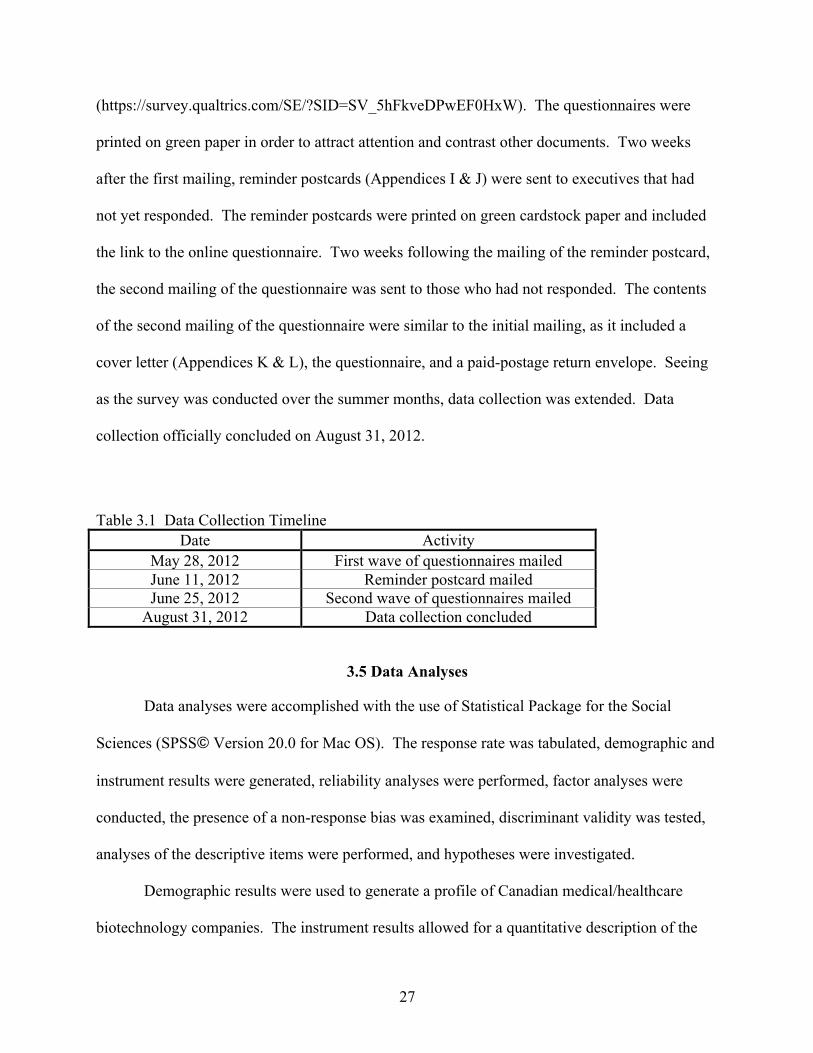
27
(https://survey.qualtrics.com/SE/?SID=SV_5hFkveDPwEF0HxW). The questionnaires were
printed on green paper in order to attract attention and contrast other documents. Two weeks
after the first mailing, reminder postcards (Appendices I & J) were sent to executives that had
not yet responded. The reminder postcards were printed on green cardstock paper and included
the link to the online questionnaire. Two weeks following the mailing of the reminder postcard,
the second mailing of the questionnaire was sent to those who had not responded. The contents
of the second mailing of the questionnaire were similar to the initial mailing, as it included a
cover letter (Appendices K & L), the questionnaire, and a paid-postage return envelope. Seeing
as the survey was conducted over the summer months, data collection was extended. Data
collection officially concluded on August 31, 2012.
Table 3.1 Data Collection Timeline Date Activity
May 28, 2012 First wave of questionnaires mailed June 11, 2012 Reminder postcard mailed June 25, 2012 Second wave of questionnaires mailed
August 31, 2012 Data collection concluded
3.5 Data Analyses
Data analyses were accomplished with the use of Statistical Package for the Social
Sciences (SPSS© Version 20.0 for Mac OS). The response rate was tabulated, demographic and
instrument results were generated, reliability analyses were performed, factor analyses were
conducted, the presence of a non-response bias was examined, discriminant validity was tested,
analyses of the descriptive items were performed, and hypotheses were investigated.
Demographic results were used to generate a profile of Canadian medical/healthcare
biotechnology companies. The instrument results allowed for a quantitative description of the
28
data, particularly the way respondents answered questions related to their companies’ MO, AO,
and PERF.
The internal reliability of the MO, AO, and PERF instruments were conducted using
reliability analyses. Alpha coefficients greater than 0.70 but less than 0.80 were acceptable,
greater than 0.80 but less than 0.90 were good, and scores higher than 0.90 were excellent
(George and Mallery 2009). Due to the extensive use of Narver and Slater’s (1990) MO
instrument and the advanced practices of MO research, higher Cronbach’s alpha coefficients
could be expected. However, for exploratory work in new areas of research (e.g. Canadian
medical/healthcare biotechnology industry) a coefficient of 0.70 is cited as an acceptable
measure of a construct’s internal reliability (Nunnally 1978). Therefore, despite the extensive
use of Narver and Slater’s (1990) MO instrument, this study’s goal was to obtain internal
reliabilities that met or exceeded coefficients of 0.70. Using the MO instrument in the Canadian
medical/healthcare biotechnology industry is an unexplored research area, demonstrating the
appropriateness for the stipulated Cronbach’s alpha coefficient (α = 0.70). Due to limited
research using the Kandemir, Yaprak, and Cavusgil (2006) and the De Luca, Verona, and Vicari
(2010) instruments, obtaining a Cronbach’s alpha coefficient of 0.70 or better was also
appropriate and justified (Nunnally 1978).
“Factor analysis is conducted to discover what latent variables (factors) are behind a set
of variables or measures” (SAGE Research Methods 2012a). Factor analyses were conducted on
MO, AO, and PERF in order to test the dimensionality of the constructs.
Kwak and Radler (2002) found that response rates and the respondents themselves (e.g.
Internet users and non-users) differed based on data collection formats (e.g. mail and web-based)
(Kwak and Radler 2002). Therefore, mail and online responses were analyzed and compared to
29
determine if any statistically significant differences existed among respondent groups. Due to
the financial constraints of the research project, the mailing of a non-responder questionnaire was
not undertaken. According to Armstrong and Overton (1977), subjects that respond later, as
opposed to earlier, more closely resemble non-responders. Therefore, in the absence of non-
responder questionnaires, key constructs can be compared among early and late responses to
determine the existence of a non-response bias (Armstrong and Overton 1977). In lieu of a non-
responder questionnaire, key constructs (MO, AO, and PERF) were compared among early and
late responders to determine the potential existence of a non-response bias.
Discriminant validity tests if a measure or construct is unrelated to other measures or
constructs (Carless 2012). “Correlation coefficients between measures of a construct and
measures of conceptually different constructs are usually given as evidence of discriminant
validity” (Carless 2012). If correlation coefficients are high it demonstrates a lack of
discriminant validity and if correlation coefficients are low or moderate it demonstrates
discriminant validity (Carless 2012). According to Kline (2005), if a construct’s 90 percent
confidence interval does not contain the number one, discriminant validity has been achieved
(Kline 2005). The discriminant validity of MO and AO was tested in order to determine if the
constructs measured different phenomena.
Descriptive analyses were conducted using the descriptive data as independent variables
and the three major constructs as dependent variables (MO, AO, and PERF). The additional
analyses were designed to confirm or refute previous findings related to the importance of
clustering, ownership structures, educational backgrounds of CEOs, and company ages and sizes
in the biotechnology industry.
30
The set of hypotheses explored the relationship between biotechnology companies’ MO
and PERF (H1), AO and PERF (H2), and MO, AO, and PERF (H3) (Appendix M). Using linear
regression, hypothesis testing was accomplished using the unweighted means of constructs,
employing listwise deletion as the method to treat missing data. Listwise deletion was used
because the sample had limited missing data and it has been cited as preferable to many other
methods (Allison 2002). Independent variables were MO and AO, and the dependent variable
was PERF. According to G*Power’s (1996) a priori multiple linear regression, employing
Cohen’s (1988) minimum power requirement (1-β = 0.80) and standard error probability (α =
0.05), a sample size of 68 was required in order to detect a medium-sized effect (ƒ2 = 0.15) of
two predictor independent variables (MO and AO) on a dependent variable (PERF) (Erdfelder,
Faul, and Buchner 1996; Cohen 1988). Although it is hypothesized that MO and AO would be
significant predictors of PERF, a medium-sized effect (ƒ2 = 0.15) was theorized because it is
likely that there are other possible variables influencing business performance.
If MO had a statistically significant influence on PERF (H1) and AO had a statistically
significant influence on PERF (H2), but either MO or AO became non-significant when
examined together (H3), a mediation relationship may have existed (Baron and Kenny 1986). In
order to confirm or refute the existence of a mediation relationship, a final mediation regression
analysis was performed. This regression analysis used the third hypothesis’ non-significant
predictor as independent variable and its statistically significant predictor as the dependent
variable (Baron and Kenny 1986). If the relationship was positive and statistically significant, a
mediation relationship existed (Baron and Kenny 1986).
3.6 Ethical Considerations
On April 4, 2012 a research ethics application was submitted to the University of
Saskatchewan Behavioural Research Ethics Board. The research project was deemed exempt

31
(BEH 12-104) from the ethics review process on April 9, 2012. The exemption was granted due
to the project’s focus on business practices as opposed to human behaviour.
32
CHAPTER 4 RESULTS
4.1 Response Rate
Two weeks after the initial mailing, 13 responses and seven return-to-sender packages
were received. Therefore, 433 reminder postcards were sent to companies that had not yet
responded. Between the mailing of the reminder postcards and the second wave of
questionnaires, 39 responses and 27 return-to-sender packages were received. Four weeks after
the initial packages were posted, the second mailing of the questionnaires were sent to the 367
companies that had not yet responded. From the second mailing of the questionnaires to the end
of data collection, 35 responses and 19 return-to-sender packages were received.
At the end of data collection a total of 87 responses and 53 return-to-sender packages
were received. Six of the 87 responses explicitly stated that the focus of the biotechnology
company was not, nor did it have the potential to become, medical/healthcare focused. These six
were then removed, reducing the number of usable responses and sample size to 81 and 447
respectively. Upon receiving the return-to-sender packages, online searches were conducted in
order to determine the status of the companies. From the searches it was found that the
companies had merged, been acquired, filed for bankruptcy, suspended trading, moved, or
dissolved. These 53 companies were subsequently removed from the sample, further reducing
its size to 394. Therefore, the response rate of the project was 20.6% (81/394).
4.2 Demographic Results
The following sections explore the demographic results including the response language,
method of completion, company location, number of association memberships, company
ownership structure, executive educational background, company founding year, and company
size.
33
4.2.1 Response Language
Companies located in Quebec received cover letters, questionnaires, and reminder
postcards written in French. Companies located in all other provinces received cover letters,
questionnaires, and reminder postcards written in English. One company, located in Quebec,
requested that an English-version of the questionnaire be electronically mailed for its
completion. Out of the 81 responses, 67 (82.7%) were completed in English and 14 (17.3%)
were completed in French. The percentage of responses from Quebec companies (14/81, 17.3%)
was slightly less than the percentage of French questionnaires mailed to companies in Quebec
(101/394, 25.6%).
4.2.2 Method of Completion
Executives were provided mail and web-based completion options. The number of mail
and online responses were 61 (75.3%) and 20 (24.7%) respectively.
4.2.3 Company Location
The first question related to companies’ locations asked respondents if their company was
headquartered in Canada. Seventy-four companies (91.4%) were, and six (7.4%) were not,
headquartered in Canada. Of the six companies not headquartered in Canada, three were
Canadian subsidiaries (e.g. Biotechnology Enterprise Canada). Although these six companies
were not headquartered in Canada, they had Canadian addresses and operated within the country.
Due to the fact that all companies operated within Canada, all 81 responses were included.
In order to determine approximate locations (e.g. city and province) of companies,
respondents were asked to give the first three characters of their postal codes. Four major
response-based clusters were identified, including Lower Mainland, Edmonton, Toronto, and
Montreal/Laval (Appendix N). Table 4.1 displays the companies in each province as compared
to the responses from province. The majority of responses were received from Ontario (32.1%),
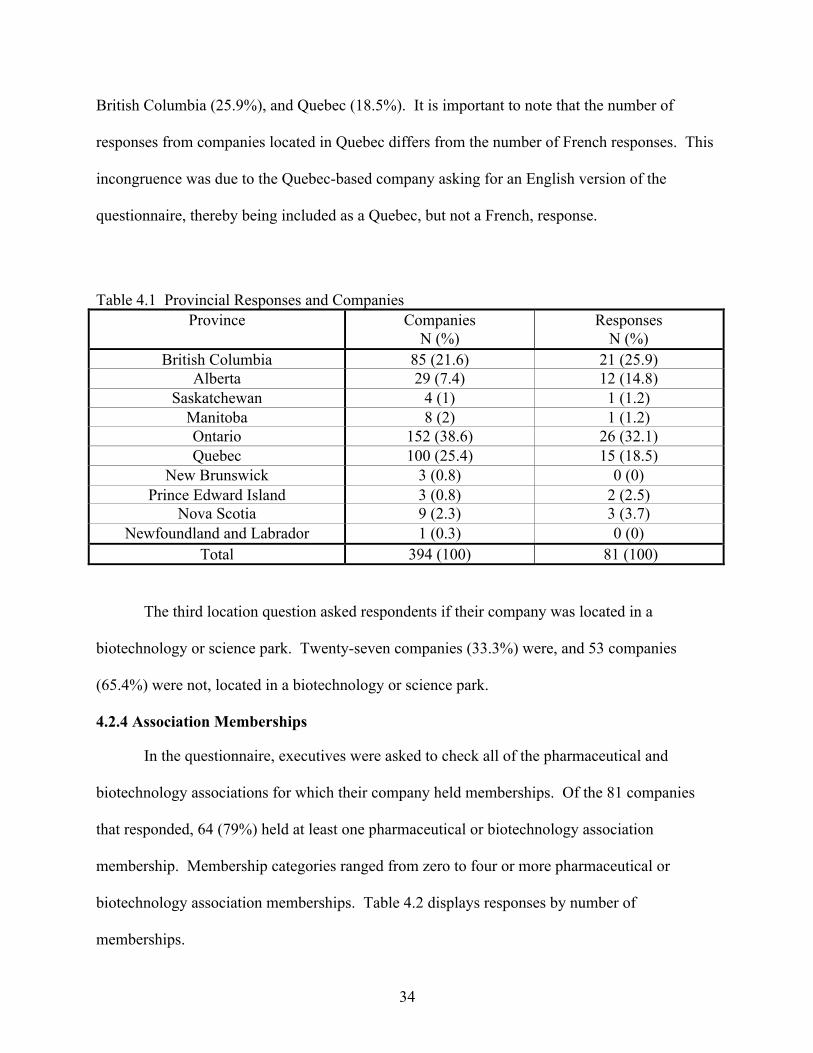
34
British Columbia (25.9%), and Quebec (18.5%). It is important to note that the number of
responses from companies located in Quebec differs from the number of French responses. This
incongruence was due to the Quebec-based company asking for an English version of the
questionnaire, thereby being included as a Quebec, but not a French, response.
Table 4.1 Provincial Responses and Companies Province Companies
N (%) Responses
N (%) British Columbia 85 (21.6) 21 (25.9)
Alberta 29 (7.4) 12 (14.8) Saskatchewan 4 (1) 1 (1.2)
Manitoba 8 (2) 1 (1.2) Ontario 152 (38.6) 26 (32.1) Quebec 100 (25.4) 15 (18.5)
New Brunswick 3 (0.8) 0 (0) Prince Edward Island 3 (0.8) 2 (2.5)
Nova Scotia 9 (2.3) 3 (3.7) Newfoundland and Labrador 1 (0.3) 0 (0)
Total 394 (100) 81 (100)
The third location question asked respondents if their company was located in a
biotechnology or science park. Twenty-seven companies (33.3%) were, and 53 companies
(65.4%) were not, located in a biotechnology or science park.
4.2.4 Association Memberships
In the questionnaire, executives were asked to check all of the pharmaceutical and
biotechnology associations for which their company held memberships. Of the 81 companies
that responded, 64 (79%) held at least one pharmaceutical or biotechnology association
membership. Membership categories ranged from zero to four or more pharmaceutical or
biotechnology association memberships. Table 4.2 displays responses by number of
memberships.
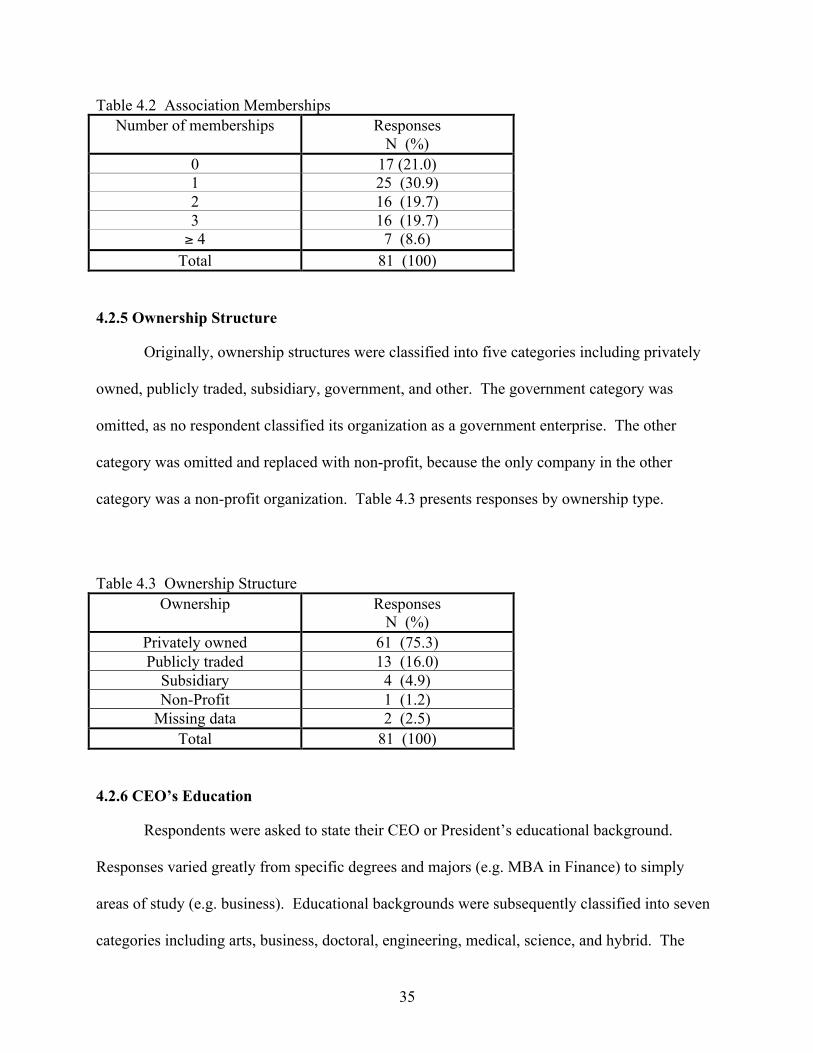
35
Table 4.2 Association Memberships Number of memberships Responses
N (%) 0 17 (21.0) 1 25 (30.9) 2 16 (19.7) 3 16 (19.7) ≥ 4 7 (8.6)
Total 81 (100)
4.2.5 Ownership Structure
Originally, ownership structures were classified into five categories including privately
owned, publicly traded, subsidiary, government, and other. The government category was
omitted, as no respondent classified its organization as a government enterprise. The other
category was omitted and replaced with non-profit, because the only company in the other
category was a non-profit organization. Table 4.3 presents responses by ownership type.
Table 4.3 Ownership Structure Ownership Responses
N (%) Privately owned 61 (75.3) Publicly traded 13 (16.0)
Subsidiary 4 (4.9) Non-Profit 1 (1.2)
Missing data 2 (2.5) Total 81 (100)
4.2.6 CEO’s Education
Respondents were asked to state their CEO or President’s educational background.
Responses varied greatly from specific degrees and majors (e.g. MBA in Finance) to simply
areas of study (e.g. business). Educational backgrounds were subsequently classified into seven
categories including arts, business, doctoral, engineering, medical, science, and hybrid. The
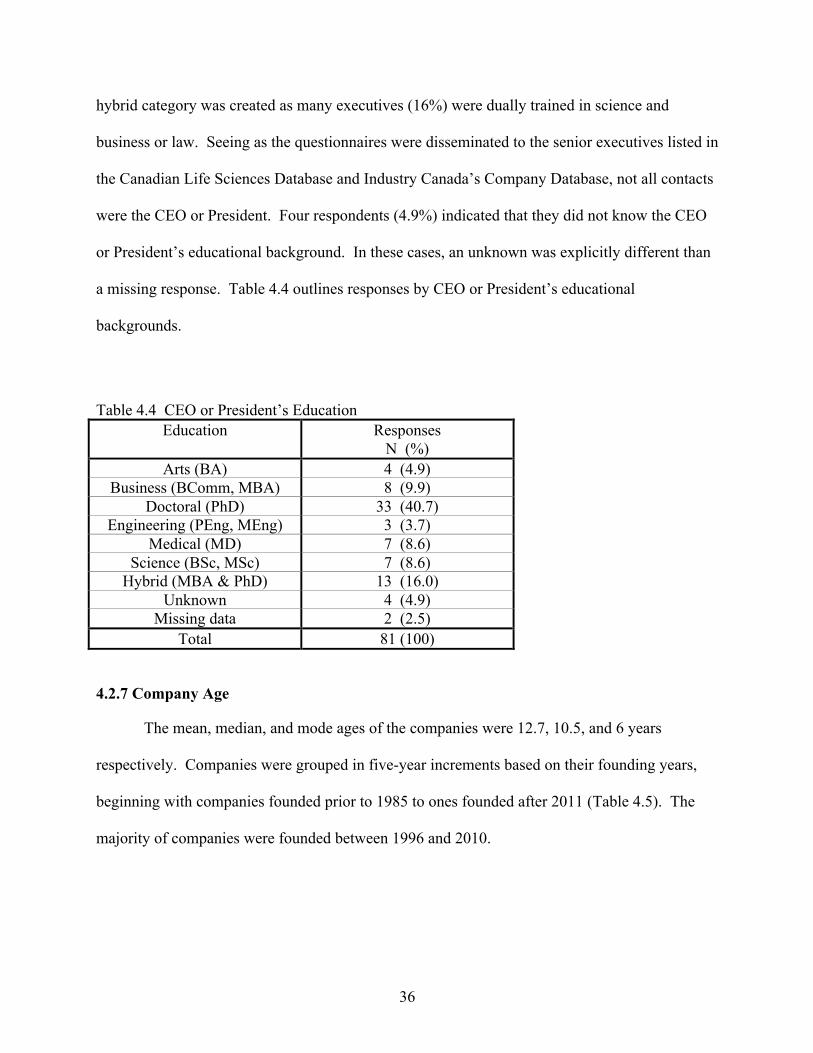
36
hybrid category was created as many executives (16%) were dually trained in science and
business or law. Seeing as the questionnaires were disseminated to the senior executives listed in
the Canadian Life Sciences Database and Industry Canada’s Company Database, not all contacts
were the CEO or President. Four respondents (4.9%) indicated that they did not know the CEO
or President’s educational background. In these cases, an unknown was explicitly different than
a missing response. Table 4.4 outlines responses by CEO or President’s educational
backgrounds.
Table 4.4 CEO or President’s Education Education Responses
N (%) Arts (BA) 4 (4.9)
Business (BComm, MBA) 8 (9.9) Doctoral (PhD) 33 (40.7)
Engineering (PEng, MEng) 3 (3.7) Medical (MD) 7 (8.6)
Science (BSc, MSc) 7 (8.6) Hybrid (MBA & PhD) 13 (16.0)
Unknown 4 (4.9) Missing data 2 (2.5)
Total 81 (100)
4.2.7 Company Age
The mean, median, and mode ages of the companies were 12.7, 10.5, and 6 years
respectively. Companies were grouped in five-year increments based on their founding years,
beginning with companies founded prior to 1985 to ones founded after 2011 (Table 4.5). The
majority of companies were founded between 1996 and 2010.
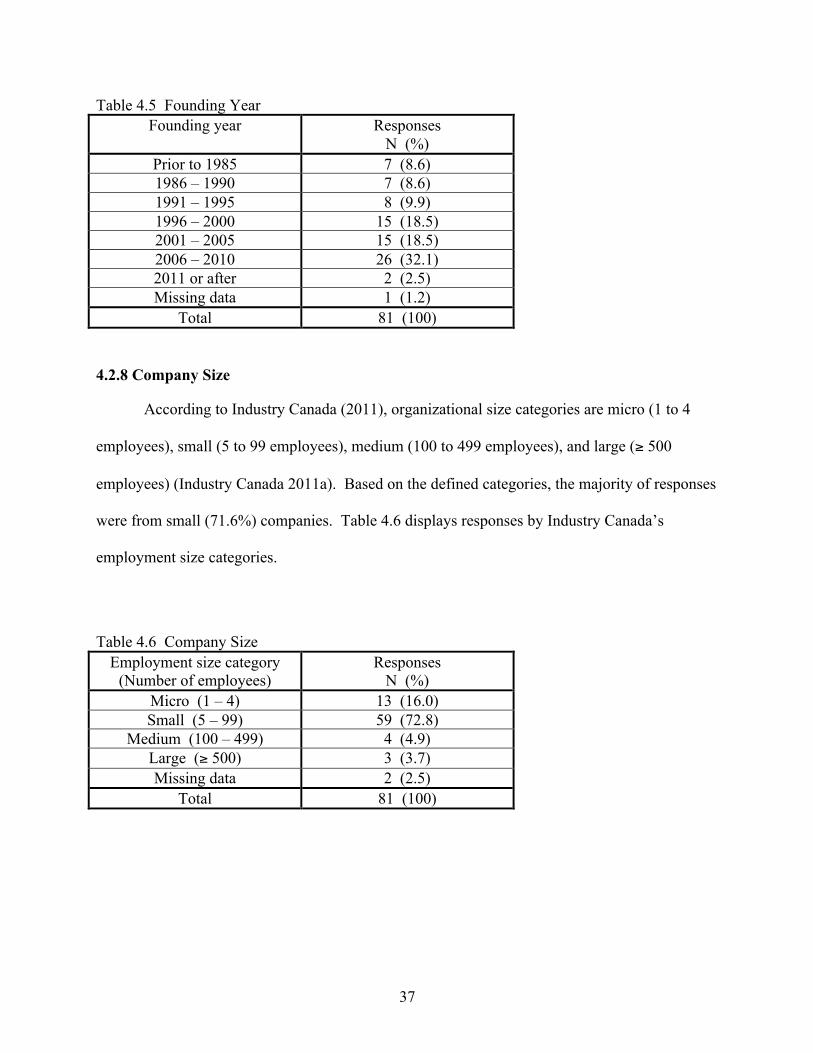
37
Table 4.5 Founding Year Founding year Responses
N (%) Prior to 1985 7 (8.6) 1986 – 1990 7 (8.6) 1991 – 1995 8 (9.9) 1996 – 2000 15 (18.5) 2001 – 2005 15 (18.5) 2006 – 2010 26 (32.1) 2011 or after 2 (2.5) Missing data 1 (1.2)
Total 81 (100)
4.2.8 Company Size
According to Industry Canada (2011), organizational size categories are micro (1 to 4
employees), small (5 to 99 employees), medium (100 to 499 employees), and large (≥ 500
employees) (Industry Canada 2011a). Based on the defined categories, the majority of responses
were from small (71.6%) companies. Table 4.6 displays responses by Industry Canada’s
employment size categories.
Table 4.6 Company Size Employment size category
(Number of employees) Responses
N (%) Micro (1 – 4) 13 (16.0) Small (5 – 99) 59 (72.8)
Medium (100 – 499) 4 (4.9) Large (≥ 500) 3 (3.7) Missing data 2 (2.5)
Total 81 (100)
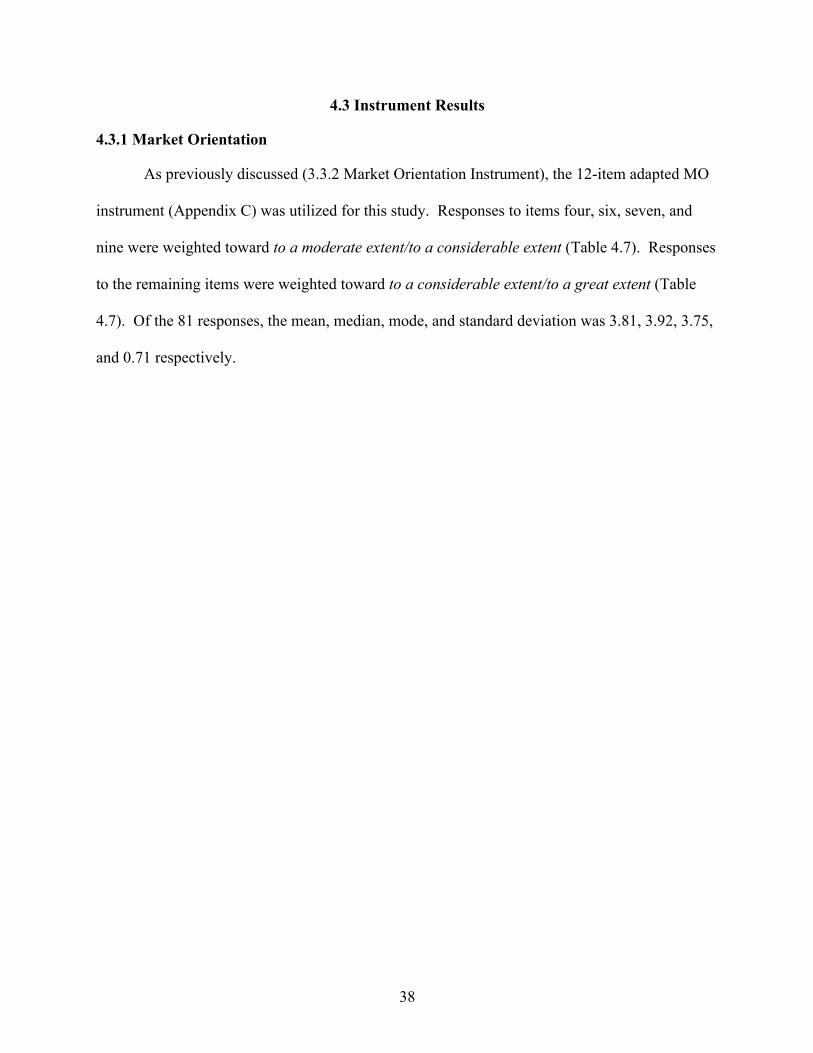
38
4.3 Instrument Results
4.3.1 Market Orientation
As previously discussed (3.3.2 Market Orientation Instrument), the 12-item adapted MO
instrument (Appendix C) was utilized for this study. Responses to items four, six, seven, and
nine were weighted toward to a moderate extent/to a considerable extent (Table 4.7). Responses
to the remaining items were weighted toward to a considerable extent/to a great extent (Table
4.7). Of the 81 responses, the mean, median, mode, and standard deviation was 3.81, 3.92, 3.75,
and 0.71 respectively.
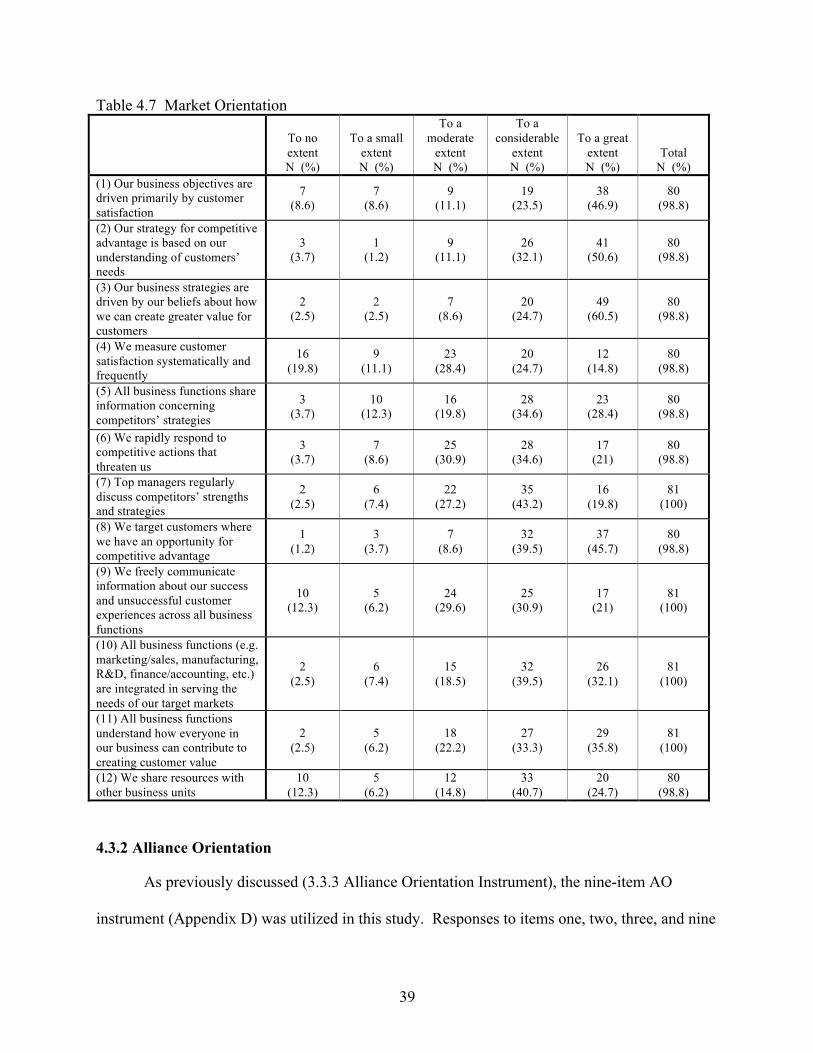
39
Table 4.7 Market Orientation
To no extent N (%)
To a small
extent N (%)
To a moderate
extent N (%)
To a considerable
extent N (%)
To a great
extent N (%)
Total N (%)
(1) Our business objectives are driven primarily by customer satisfaction
7 (8.6)
7 (8.6)
9 (11.1)
19 (23.5)
38 (46.9)
80 (98.8)
(2) Our strategy for competitive advantage is based on our understanding of customers’ needs
3 (3.7)
1 (1.2)
9 (11.1)
26 (32.1)
41 (50.6)
80 (98.8)
(3) Our business strategies are driven by our beliefs about how we can create greater value for customers
2 (2.5)
2 (2.5)
7 (8.6)
20 (24.7)
49 (60.5)
80 (98.8)
(4) We measure customer satisfaction systematically and frequently
16 (19.8)
9 (11.1)
23 (28.4)
20 (24.7)
12 (14.8)
80 (98.8)
(5) All business functions share information concerning competitors’ strategies
3 (3.7)
10 (12.3)
16 (19.8)
28 (34.6)
23 (28.4)
80 (98.8)
(6) We rapidly respond to competitive actions that threaten us
3 (3.7)
7 (8.6)
25 (30.9)
28 (34.6)
17 (21)
80 (98.8)
(7) Top managers regularly discuss competitors’ strengths and strategies
2 (2.5)
6 (7.4)
22 (27.2)
35 (43.2)
16 (19.8)
81 (100)
(8) We target customers where we have an opportunity for competitive advantage
1 (1.2)
3 (3.7)
7 (8.6)
32 (39.5)
37 (45.7)
80 (98.8)
(9) We freely communicate information about our success and unsuccessful customer experiences across all business functions
10 (12.3)
5 (6.2)
24 (29.6)
25 (30.9)
17 (21)
81 (100)
(10) All business functions (e.g. marketing/sales, manufacturing, R&D, finance/accounting, etc.) are integrated in serving the needs of our target markets
2 (2.5)
6 (7.4)
15 (18.5)
32 (39.5)
26 (32.1)
81 (100)
(11) All business functions understand how everyone in our business can contribute to creating customer value
2 (2.5)
5 (6.2)
18 (22.2)
27 (33.3)
29 (35.8)
81 (100)
(12) We share resources with other business units
10 (12.3)
5 (6.2)
12 (14.8)
33 (40.7)
20 (24.7)
80 (98.8)
4.3.2 Alliance Orientation
As previously discussed (3.3.3 Alliance Orientation Instrument), the nine-item AO
instrument (Appendix D) was utilized in this study. Responses to items one, two, three, and nine
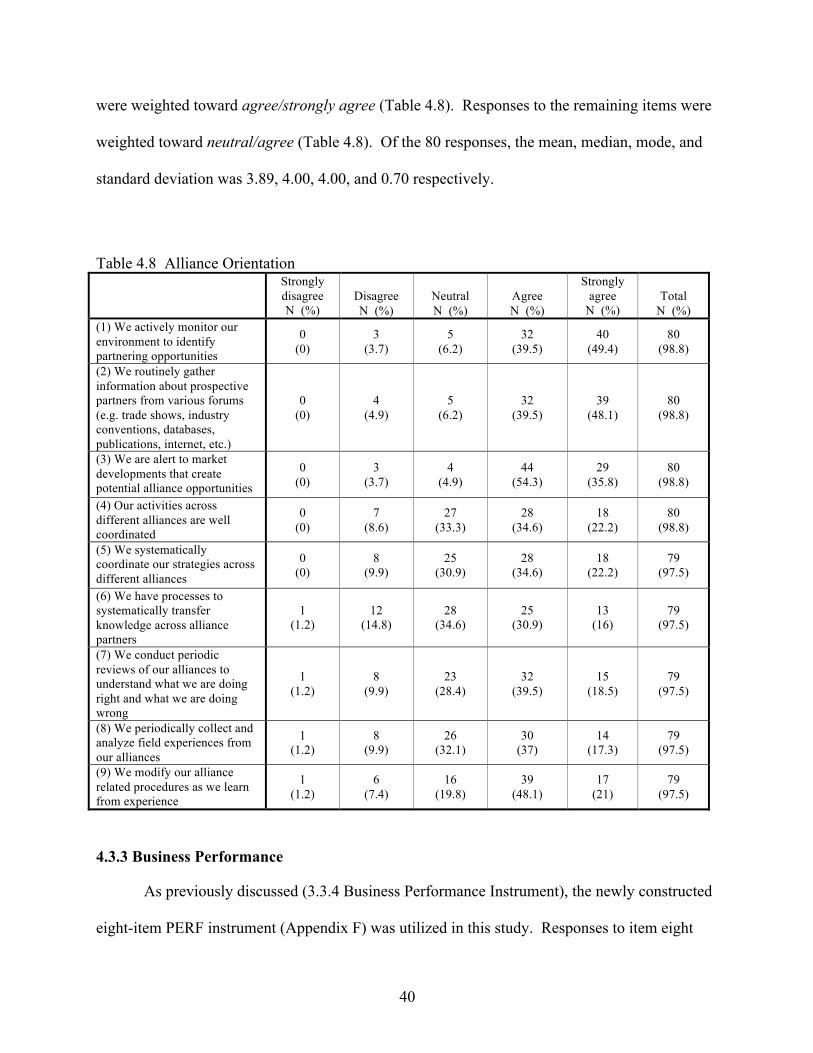
40
were weighted toward agree/strongly agree (Table 4.8). Responses to the remaining items were
weighted toward neutral/agree (Table 4.8). Of the 80 responses, the mean, median, mode, and
standard deviation was 3.89, 4.00, 4.00, and 0.70 respectively.
Table 4.8 Alliance Orientation Strongly
disagree N (%)
Disagree N (%)
Neutral N (%)
Agree N (%)
Strongly agree
N (%) Total
N (%) (1) We actively monitor our environment to identify partnering opportunities
0 (0)
3 (3.7)
5 (6.2)
32 (39.5)
40 (49.4)
80 (98.8)
(2) We routinely gather information about prospective partners from various forums (e.g. trade shows, industry conventions, databases, publications, internet, etc.)
0 (0)
4 (4.9)
5 (6.2)
32 (39.5)
39 (48.1)
80 (98.8)
(3) We are alert to market developments that create potential alliance opportunities
0 (0)
3 (3.7)
4 (4.9)
44 (54.3)
29 (35.8)
80 (98.8)
(4) Our activities across different alliances are well coordinated
0 (0)
7 (8.6)
27 (33.3)
28 (34.6)
18 (22.2)
80 (98.8)
(5) We systematically coordinate our strategies across different alliances
0 (0)
8 (9.9)
25 (30.9)
28 (34.6)
18 (22.2)
79 (97.5)
(6) We have processes to systematically transfer knowledge across alliance partners
1 (1.2)
12 (14.8)
28 (34.6)
25 (30.9)
13 (16)
79 (97.5)
(7) We conduct periodic reviews of our alliances to understand what we are doing right and what we are doing wrong
1 (1.2)
8 (9.9)
23 (28.4)
32 (39.5)
15 (18.5)
79 (97.5)
(8) We periodically collect and analyze field experiences from our alliances
1 (1.2)
8 (9.9)
26 (32.1)
30 (37)
14 (17.3)
79 (97.5)
(9) We modify our alliance related procedures as we learn from experience
1 (1.2)
6 (7.4)
16 (19.8)
39 (48.1)
17 (21)
79 (97.5)
4.3.3 Business Performance
As previously discussed (3.3.4 Business Performance Instrument), the newly constructed
eight-item PERF instrument (Appendix F) was utilized in this study. Responses to item eight
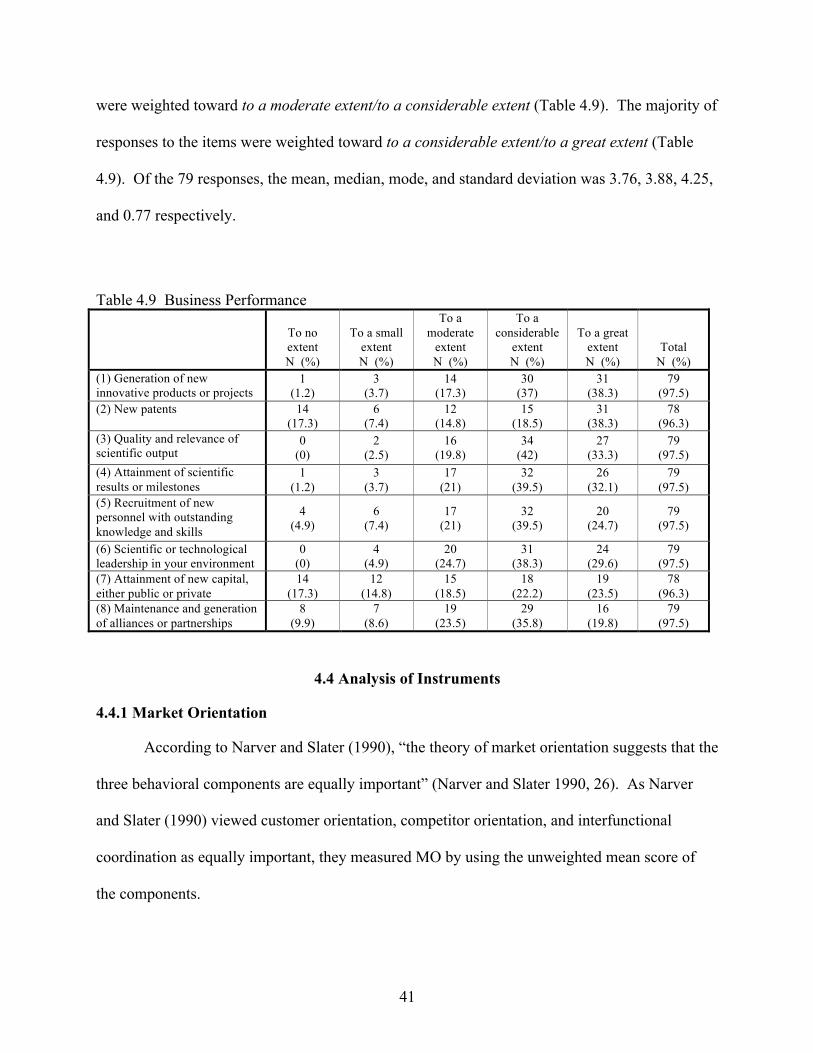
41
were weighted toward to a moderate extent/to a considerable extent (Table 4.9). The majority of
responses to the items were weighted toward to a considerable extent/to a great extent (Table
4.9). Of the 79 responses, the mean, median, mode, and standard deviation was 3.76, 3.88, 4.25,
and 0.77 respectively.
Table 4.9 Business Performance
To no extent N (%)
To a small
extent N (%)
To a moderate
extent N (%)
To a considerable
extent N (%)
To a great
extent N (%)
Total N (%)
(1) Generation of new innovative products or projects
1 (1.2)
3 (3.7)
14 (17.3)
30 (37)
31 (38.3)
79 (97.5)
(2) New patents 14 (17.3)
6 (7.4)
12 (14.8)
15 (18.5)
31 (38.3)
78 (96.3)
(3) Quality and relevance of scientific output
0 (0)
2 (2.5)
16 (19.8)
34 (42)
27 (33.3)
79 (97.5)
(4) Attainment of scientific results or milestones
1 (1.2)
3 (3.7)
17 (21)
32 (39.5)
26 (32.1)
79 (97.5)
(5) Recruitment of new personnel with outstanding knowledge and skills
4 (4.9)
6 (7.4)
17 (21)
32 (39.5)
20 (24.7)
79 (97.5)
(6) Scientific or technological leadership in your environment
0 (0)
4 (4.9)
20 (24.7)
31 (38.3)
24 (29.6)
79 (97.5)
(7) Attainment of new capital, either public or private
14 (17.3)
12 (14.8)
15 (18.5)
18 (22.2)
19 (23.5)
78 (96.3)
(8) Maintenance and generation of alliances or partnerships
8 (9.9)
7 (8.6)
19 (23.5)
29 (35.8)
16 (19.8)
79 (97.5)
4.4 Analysis of Instruments
4.4.1 Market Orientation
According to Narver and Slater (1990), “the theory of market orientation suggests that the
three behavioral components are equally important” (Narver and Slater 1990, 26). As Narver
and Slater (1990) viewed customer orientation, competitor orientation, and interfunctional
coordination as equally important, they measured MO by using the unweighted mean score of
the components.
42
4.4.1.1 MO reliability
In order to evaluate the internal reliability of the MO instrument, a reliability analysis
was undertaken. The 12-item MO instrument’s Cronbach’s alpha was 0.876, thereby exceeding
the previously defined requirement (α ≥ 0.70). Table 4.10 shows how Cronbach’s alpha would
change if any of the 12 items were deleted.

43
Table 4.10 MO Total Statistics
Scale mean if item deleted
Scale variance if
item deleted
Corrected item-total correlation
Squared multiple
correlation
Cronbach’s alpha
if item deleted Our business objectives are driven primarily by customer satisfaction
41.91 58.005 0.630 0.639 0.863
Our strategy for competitive advantage is based on our understanding of customers’ needs
41.61 62.004 0.589 0.702 0.865
Our business strategies are driven by our beliefs about how we can create greater value for customers
41.48 63.674 0.504 0.518 0.870
We measure customer satisfaction systematically and frequently
42.77 57.655 0.642 0.516 0.862
All business functions share information concerning competitors’ strategies
42.14 62.203 0.516 0.478 0.870
We rapidly respond to competitive actions that threaten us
42.31 62.770 0.519 0.401 0.869
Top managers regularly discuss competitors’ strengths and strategies
42.14 62.414 0.645 0.607 0.863
We target customers where we have an opportunity for competitive advantage
41.64 64.971 0.460 0.448 0.872
We freely communicate information about our success and unsuccessful customer experiences across all business functions
42.44 58.408 0.653 0.558 0.861
All business functions (e.g. marketing/sales, manufacturing, R&D, finance/accounting, etc.) are integrated in serving the needs of our target markets
41.95 62.155 0.566 0.460 0.867
All business functions understand how everyone in our business can contribute to creating customer value
41.94 60.272 0.689 0.587 0.860
We share resources with other business units 42.25 61.609 0.456 0.467 0.875
As outlined prior to undertaking the reliability analysis (3.5 Data Analyses), the criterion
of a Cronbach’s alpha coefficient of 0.70 or higher for the MO instrument was achieved (α =
0.876).
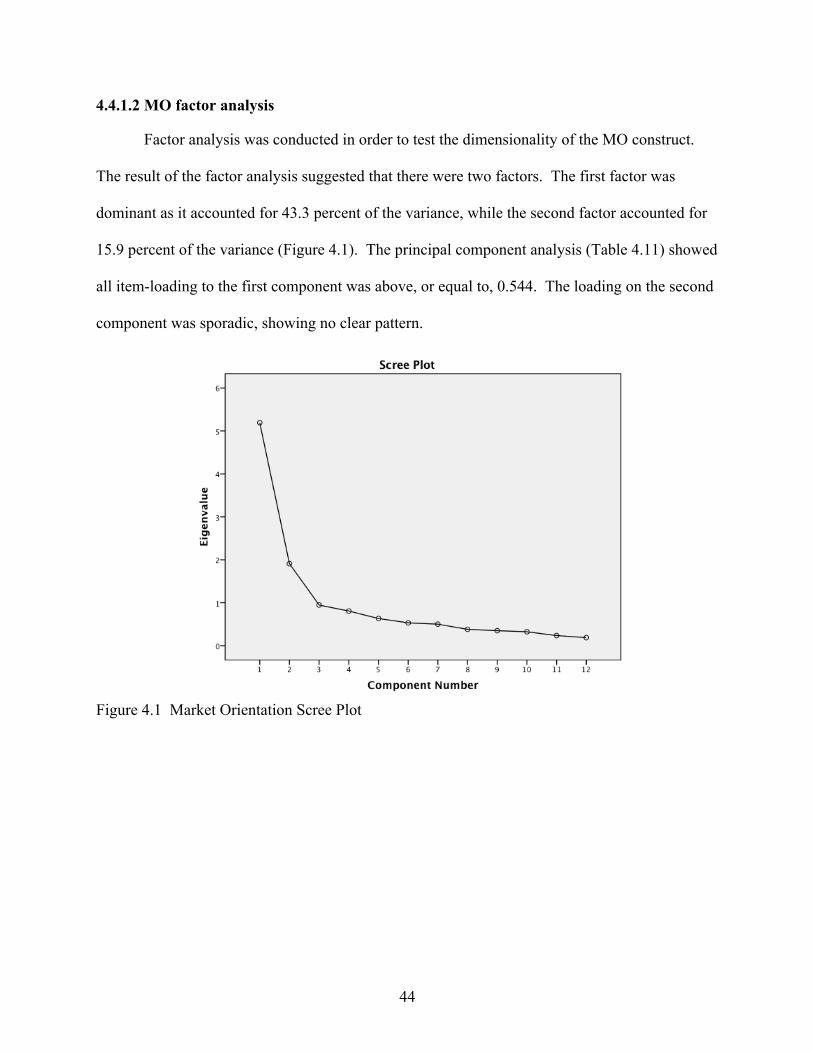
44
4.4.1.2 MO factor analysis
Factor analysis was conducted in order to test the dimensionality of the MO construct.
The result of the factor analysis suggested that there were two factors. The first factor was
dominant as it accounted for 43.3 percent of the variance, while the second factor accounted for
15.9 percent of the variance (Figure 4.1). The principal component analysis (Table 4.11) showed
all item-loading to the first component was above, or equal to, 0.544. The loading on the second
component was sporadic, showing no clear pattern.
Figure 4.1 Market Orientation Scree Plot
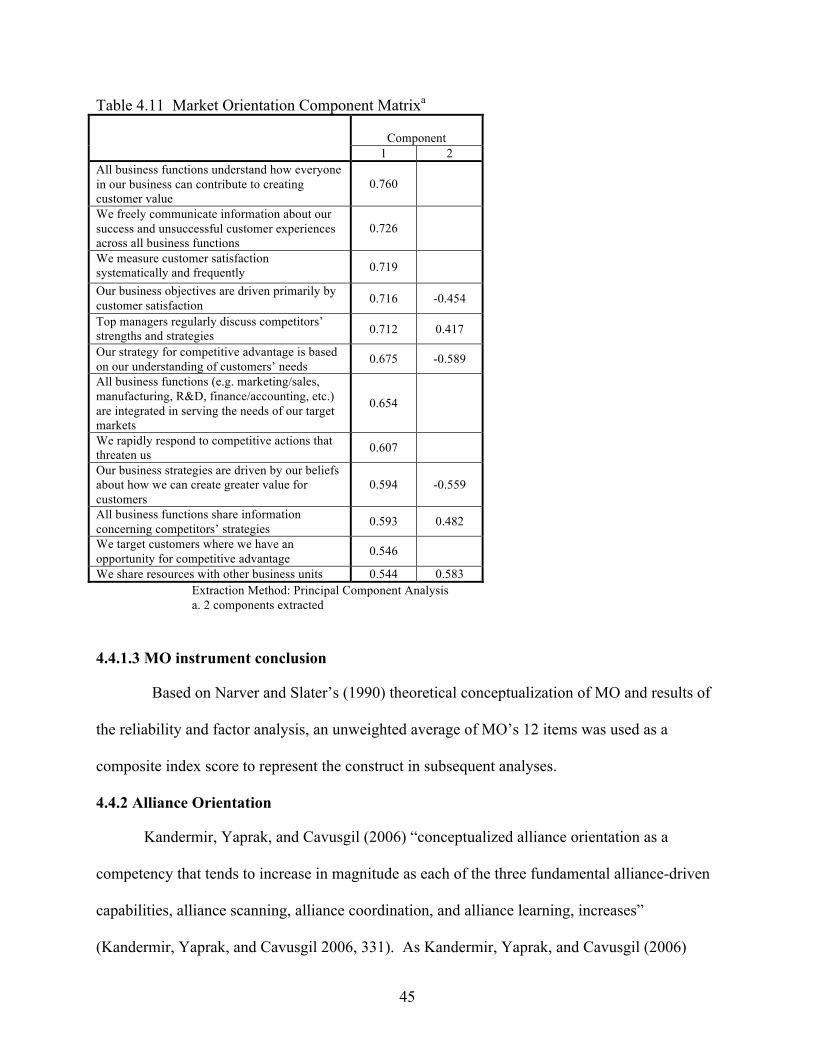
45
Table 4.11 Market Orientation Component Matrixa
Component
1 2 All business functions understand how everyone in our business can contribute to creating customer value
0.760
We freely communicate information about our success and unsuccessful customer experiences across all business functions
0.726
We measure customer satisfaction systematically and frequently 0.719
Our business objectives are driven primarily by customer satisfaction 0.716 -0.454
Top managers regularly discuss competitors’ strengths and strategies 0.712 0.417
Our strategy for competitive advantage is based on our understanding of customers’ needs 0.675 -0.589
All business functions (e.g. marketing/sales, manufacturing, R&D, finance/accounting, etc.) are integrated in serving the needs of our target markets
0.654
We rapidly respond to competitive actions that threaten us 0.607
Our business strategies are driven by our beliefs about how we can create greater value for customers
0.594 -0.559
All business functions share information concerning competitors’ strategies 0.593 0.482
We target customers where we have an opportunity for competitive advantage 0.546
We share resources with other business units 0.544 0.583 Extraction Method: Principal Component Analysis a. 2 components extracted
4.4.1.3 MO instrument conclusion
Based on Narver and Slater’s (1990) theoretical conceptualization of MO and results of
the reliability and factor analysis, an unweighted average of MO’s 12 items was used as a
composite index score to represent the construct in subsequent analyses.
4.4.2 Alliance Orientation
Kandermir, Yaprak, and Cavusgil (2006) “conceptualized alliance orientation as a
competency that tends to increase in magnitude as each of the three fundamental alliance-driven
capabilities, alliance scanning, alliance coordination, and alliance learning, increases”
(Kandermir, Yaprak, and Cavusgil 2006, 331). As Kandermir, Yaprak, and Cavusgil (2006)
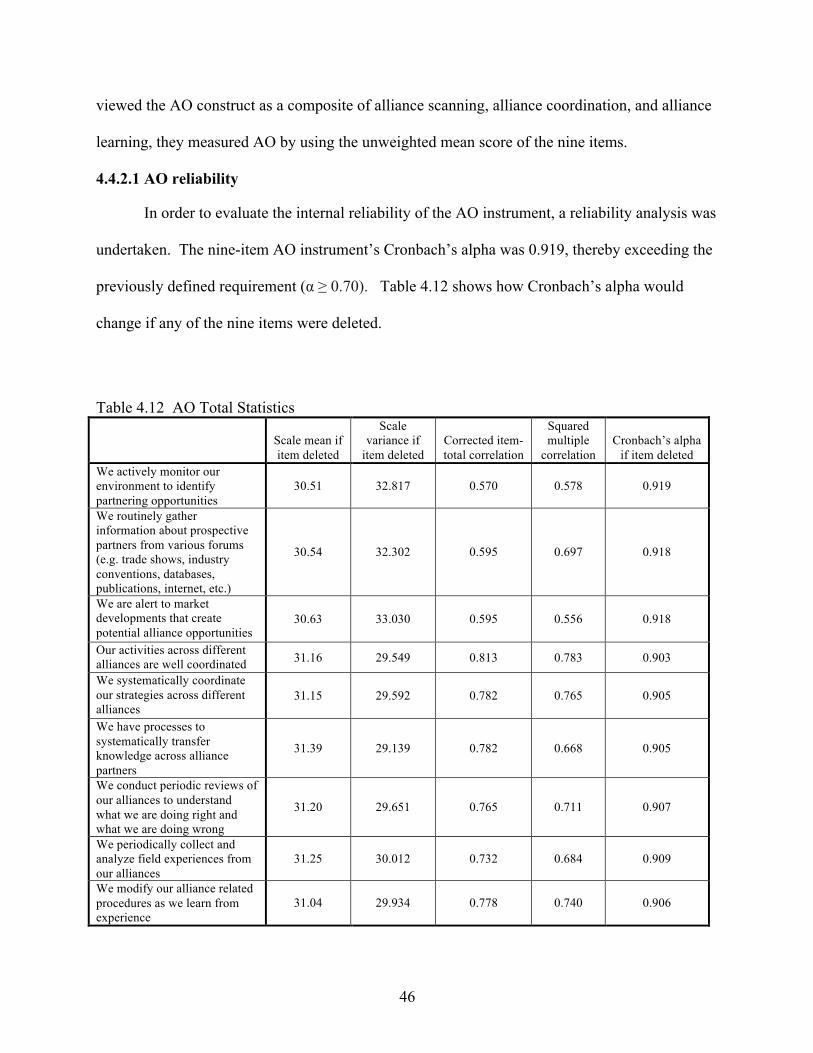
46
viewed the AO construct as a composite of alliance scanning, alliance coordination, and alliance
learning, they measured AO by using the unweighted mean score of the nine items.
4.4.2.1 AO reliability
In order to evaluate the internal reliability of the AO instrument, a reliability analysis was
undertaken. The nine-item AO instrument’s Cronbach’s alpha was 0.919, thereby exceeding the
previously defined requirement (α ≥ 0.70). Table 4.12 shows how Cronbach’s alpha would
change if any of the nine items were deleted.
Table 4.12 AO Total Statistics
Scale mean if item deleted
Scale variance if
item deleted
Corrected item-total correlation
Squared multiple
correlation
Cronbach’s alpha
if item deleted We actively monitor our environment to identify partnering opportunities
30.51 32.817 0.570 0.578 0.919
We routinely gather information about prospective partners from various forums (e.g. trade shows, industry conventions, databases, publications, internet, etc.)
30.54 32.302 0.595 0.697 0.918
We are alert to market developments that create potential alliance opportunities
30.63 33.030 0.595 0.556 0.918
Our activities across different alliances are well coordinated 31.16 29.549 0.813 0.783 0.903
We systematically coordinate our strategies across different alliances
31.15 29.592 0.782 0.765 0.905
We have processes to systematically transfer knowledge across alliance partners
31.39 29.139 0.782 0.668 0.905
We conduct periodic reviews of our alliances to understand what we are doing right and what we are doing wrong
31.20 29.651 0.765 0.711 0.907
We periodically collect and analyze field experiences from our alliances
31.25 30.012 0.732 0.684 0.909
We modify our alliance related procedures as we learn from experience
31.04 29.934 0.778 0.740 0.906
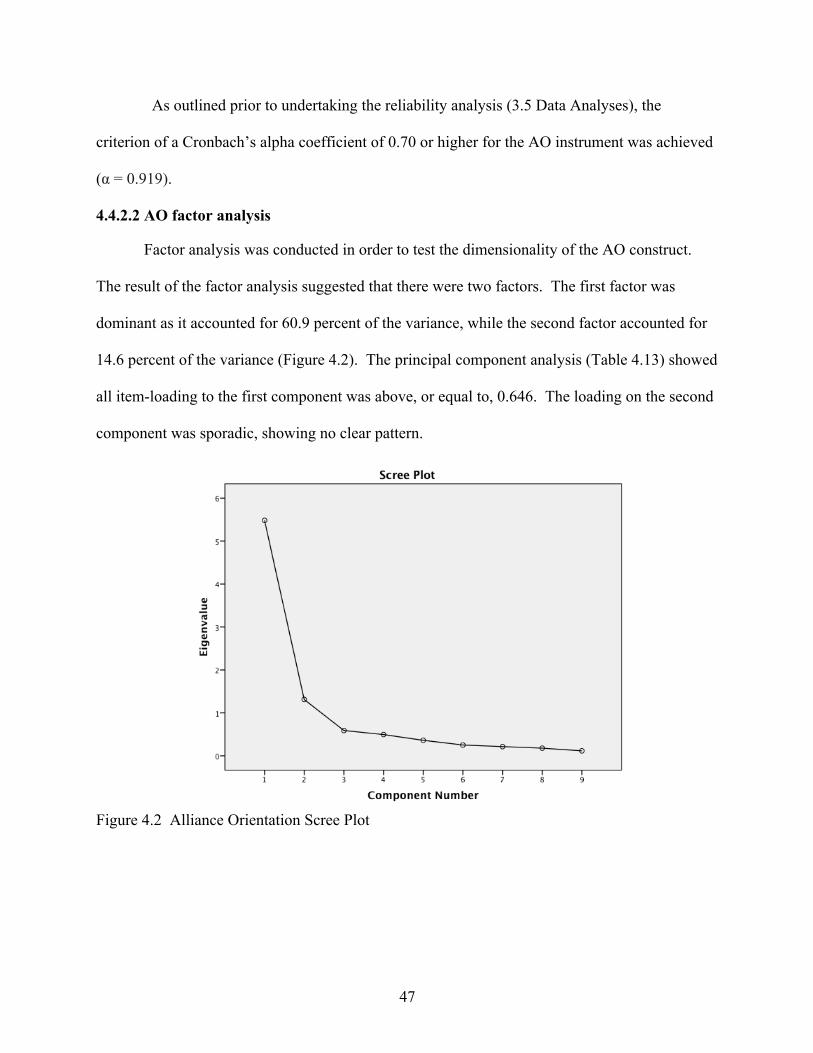
47
As outlined prior to undertaking the reliability analysis (3.5 Data Analyses), the
criterion of a Cronbach’s alpha coefficient of 0.70 or higher for the AO instrument was achieved
(α = 0.919).
4.4.2.2 AO factor analysis
Factor analysis was conducted in order to test the dimensionality of the AO construct.
The result of the factor analysis suggested that there were two factors. The first factor was
dominant as it accounted for 60.9 percent of the variance, while the second factor accounted for
14.6 percent of the variance (Figure 4.2). The principal component analysis (Table 4.13) showed
all item-loading to the first component was above, or equal to, 0.646. The loading on the second
component was sporadic, showing no clear pattern.
Figure 4.2 Alliance Orientation Scree Plot
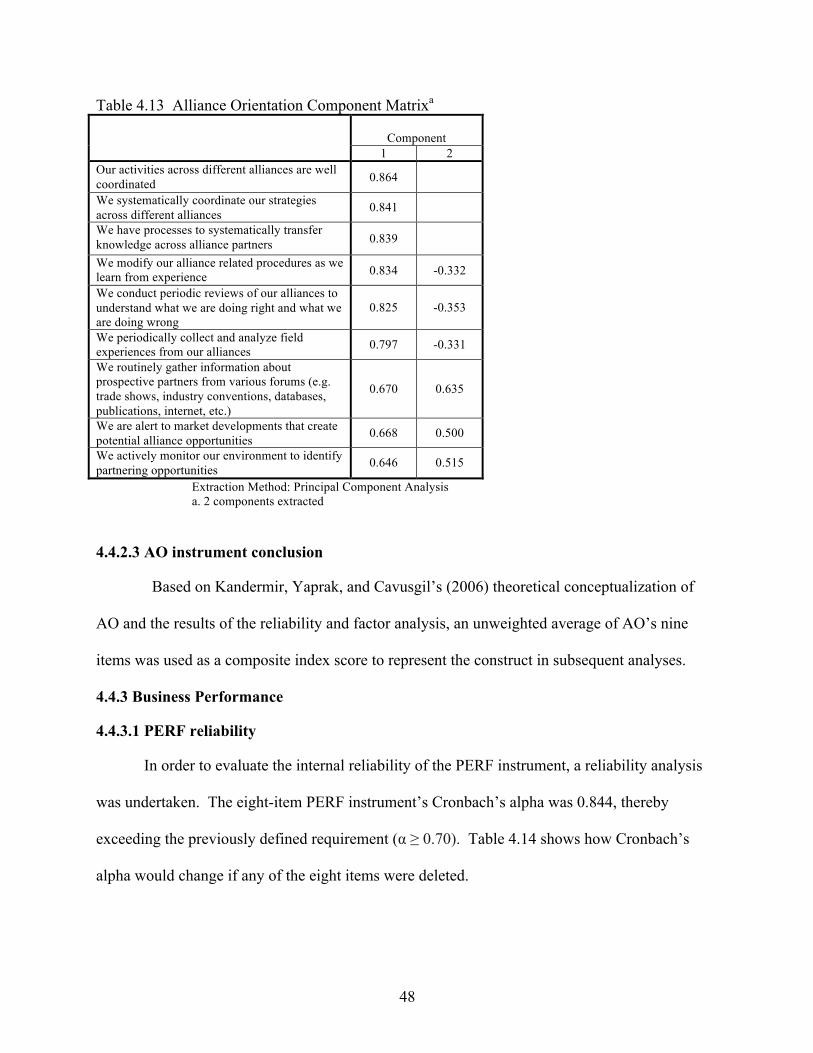
48
Table 4.13 Alliance Orientation Component Matrixa
Component
1 2 Our activities across different alliances are well coordinated 0.864
We systematically coordinate our strategies across different alliances 0.841
We have processes to systematically transfer knowledge across alliance partners 0.839
We modify our alliance related procedures as we learn from experience 0.834 -0.332
We conduct periodic reviews of our alliances to understand what we are doing right and what we are doing wrong
0.825 -0.353
We periodically collect and analyze field experiences from our alliances 0.797 -0.331
We routinely gather information about prospective partners from various forums (e.g. trade shows, industry conventions, databases, publications, internet, etc.)
0.670 0.635
We are alert to market developments that create potential alliance opportunities 0.668 0.500
We actively monitor our environment to identify partnering opportunities 0.646 0.515
Extraction Method: Principal Component Analysis a. 2 components extracted
4.4.2.3 AO instrument conclusion
Based on Kandermir, Yaprak, and Cavusgil’s (2006) theoretical conceptualization of
AO and the results of the reliability and factor analysis, an unweighted average of AO’s nine
items was used as a composite index score to represent the construct in subsequent analyses.
4.4.3 Business Performance
4.4.3.1 PERF reliability
In order to evaluate the internal reliability of the PERF instrument, a reliability analysis
was undertaken. The eight-item PERF instrument’s Cronbach’s alpha was 0.844, thereby
exceeding the previously defined requirement (α ≥ 0.70). Table 4.14 shows how Cronbach’s
alpha would change if any of the eight items were deleted.
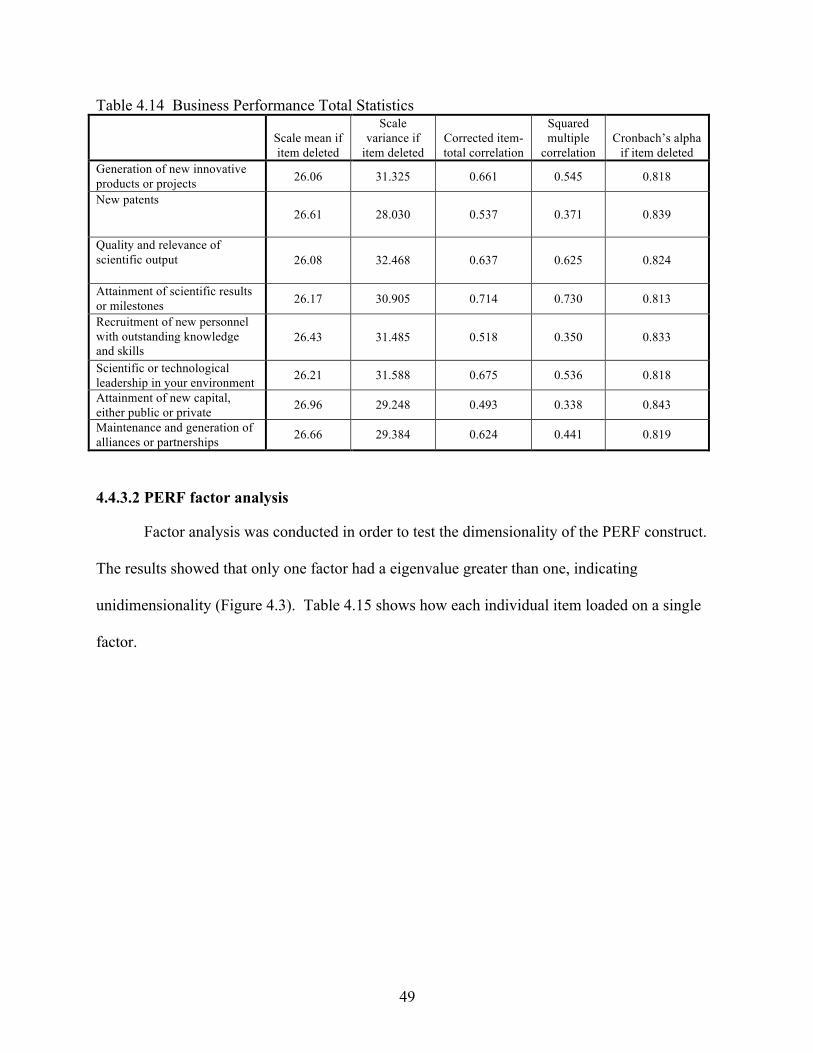
49
Table 4.14 Business Performance Total Statistics
Scale mean if item deleted
Scale variance if
item deleted
Corrected item-total correlation
Squared multiple
correlation
Cronbach’s alpha
if item deleted Generation of new innovative products or projects 26.06 31.325 0.661 0.545 0.818
New patents 26.61 28.030 0.537 0.371 0.839
Quality and relevance of scientific output 26.08 32.468 0.637 0.625 0.824
Attainment of scientific results or milestones 26.17 30.905 0.714 0.730 0.813
Recruitment of new personnel with outstanding knowledge and skills
26.43 31.485 0.518 0.350 0.833
Scientific or technological leadership in your environment 26.21 31.588 0.675 0.536 0.818
Attainment of new capital, either public or private 26.96 29.248 0.493 0.338 0.843
Maintenance and generation of alliances or partnerships 26.66 29.384 0.624 0.441 0.819
4.4.3.2 PERF factor analysis
Factor analysis was conducted in order to test the dimensionality of the PERF construct.
The results showed that only one factor had a eigenvalue greater than one, indicating
unidimensionality (Figure 4.3). Table 4.15 shows how each individual item loaded on a single
factor.
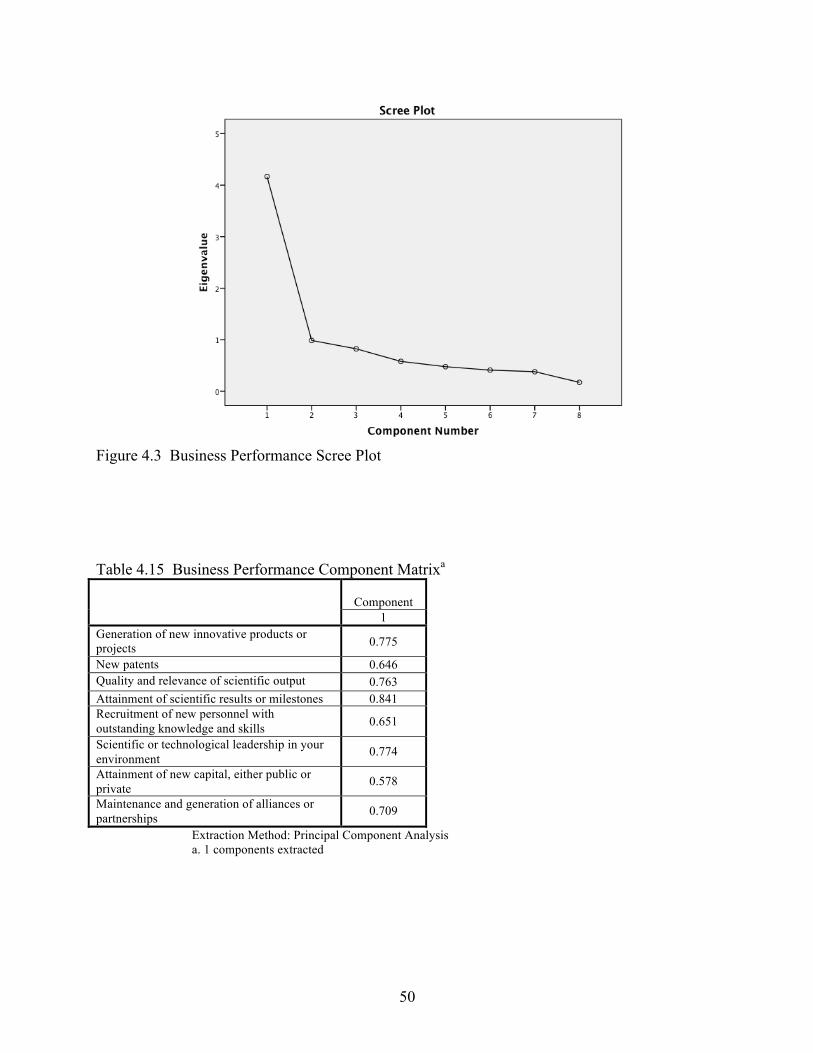
50
Figure 4.3 Business Performance Scree Plot
Table 4.15 Business Performance Component Matrixa
Component
1 Generation of new innovative products or projects 0.775
New patents 0.646 Quality and relevance of scientific output 0.763 Attainment of scientific results or milestones 0.841 Recruitment of new personnel with outstanding knowledge and skills 0.651
Scientific or technological leadership in your environment 0.774
Attainment of new capital, either public or private 0.578
Maintenance and generation of alliances or partnerships 0.709
Extraction Method: Principal Component Analysis a. 1 components extracted
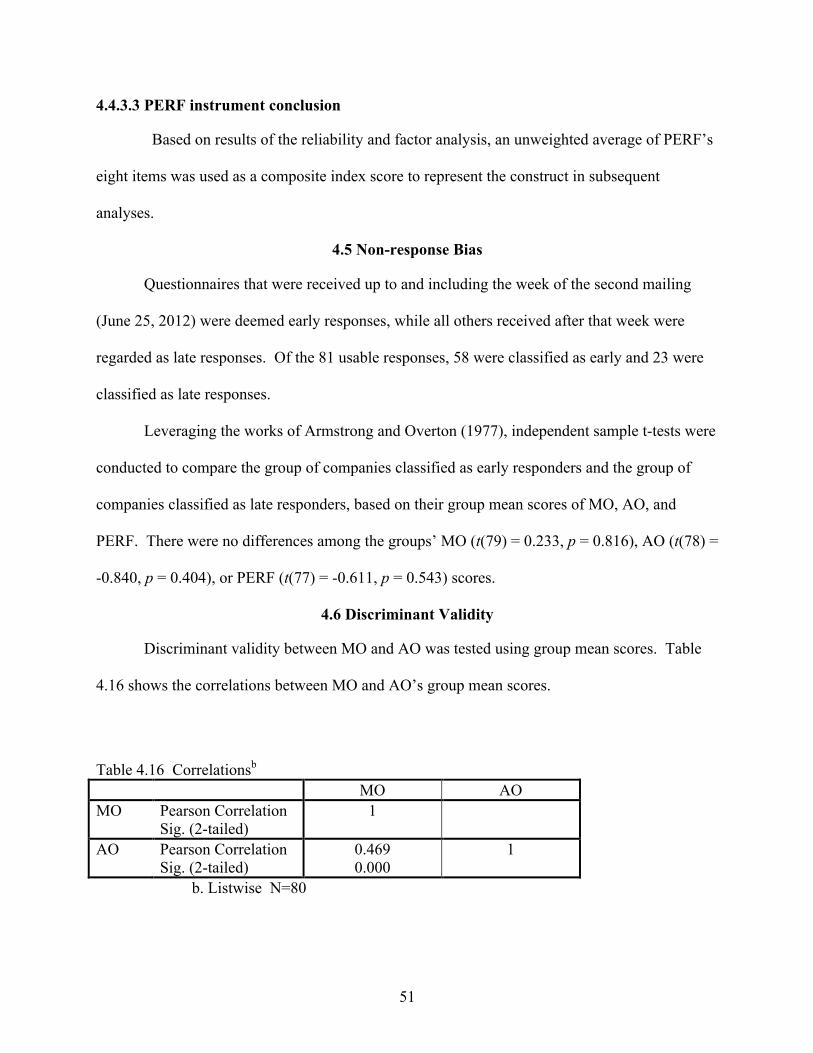
51
4.4.3.3 PERF instrument conclusion
Based on results of the reliability and factor analysis, an unweighted average of PERF’s
eight items was used as a composite index score to represent the construct in subsequent
analyses.
4.5 Non-response Bias
Questionnaires that were received up to and including the week of the second mailing
(June 25, 2012) were deemed early responses, while all others received after that week were
regarded as late responses. Of the 81 usable responses, 58 were classified as early and 23 were
classified as late responses.
Leveraging the works of Armstrong and Overton (1977), independent sample t-tests were
conducted to compare the group of companies classified as early responders and the group of
companies classified as late responders, based on their group mean scores of MO, AO, and
PERF. There were no differences among the groups’ MO (t(79) = 0.233, p = 0.816), AO (t(78) =
-0.840, p = 0.404), or PERF (t(77) = -0.611, p = 0.543) scores.
4.6 Discriminant Validity
Discriminant validity between MO and AO was tested using group mean scores. Table
4.16 shows the correlations between MO and AO’s group mean scores.
Table 4.16 Correlationsb MO AO MO Pearson Correlation
Sig. (2-tailed) 1
AO Pearson Correlation Sig. (2-tailed)
0.469 0.000
1
b. Listwise N=80
52
The correlation coefficient between MO and AO was 0.469, the standard error was 0.098,
and the 90 percent confidence interval was 0.296 ≤ r ≤ 0.622. This confidence interval did not
contain the number one, suggesting that acceptable discriminant validity between the group
means was achieved (Kline 2005).
4.7 Descriptive Analyses
The subsequent sections use the descriptive items (response language, method of
completion, science park location, association memberships, ownership structure, CEO’s
education, company age, and company size) as independent variables and the three main
constructs (MO, AO, and PERF) as dependent variables in additional analyses.
4.7.1 Response Language
Independent sample t-tests were conducted to compare the group of companies that
completed the questionnaires in English and the group of companies that completed
questionnaires in French, based on their group mean scores of MO, AO, and PERF. There was a
statistically significant difference (t(77) = -2.788, p = 0.010) between the English-speaking
group’s (3.684 ± 0.790) and the French-speaking group’s (4.173 ± 0.527) PERF scores.
However, there were no statistically significant differences among the groups’ MO (t(79) = -
0.353, p = 0.725) and AO (t(78) = -1.420, p = 0.160) scores.
4.7.2 Method of Completion
Independent sample t-tests were conducted to compare the group of companies that
responded by mail and the group of companies that responded online, based on their group mean
scores of MO, AO, and PERF. There were no statistically significant differences among the
groups’ MO (t(79) = 0.484, p = 0.630), AO (t(78) = 0.090, p = 0.929), and PERF (t(77) = 0.349,
p = 0.728) scores.
53
4.7.3 Science Park Location
Independent sample t-tests were conducted to compare the group of companies located in
science parks and the group of companies located outside of science parks, based on their group
mean scores of MO, AO, and PERF. There were no statistically significant differences among
the groups’ MO (t(78) = -0.779, p = 0.439), AO (t(78) = -1.083, p = 0.282), and PERF (t(77) =
0.001, p = 0.999) scores.
4.7.4 Association Memberships
Three linear regression analyses were performed using the number of association
memberships as the independent variable and MO, AO, and PERF alternating as the dependent
variable. The results of the regression models indicated that the number of association
memberships had no statistically significant effects on MO (R2 = 0.023, F(1, 79) = 1.896, p =
0.172), AO (R2 = 0.036, F(1, 78) = 2.901, p = 0.093), and PERF (R2 = 0.017, F(1, 77) = 1.314, p
= 0.255).
4.7.5 Ownership Structure
Originally, ownership structures were categorized into four groups (Table 4.3).
However, due to the small number of responses in two categories (subsidiary and non-profit),
they were omitted, leaving two ownership groups. The remaining ownership groups were
privately owned and publicly traded.
Independent sample t-tests were conducted to compare the group of companies that were
privately owned and the group of companies that were publicly traded, based on their group
mean scores of MO, AO, and PERF. There was a statistically significant difference (t(72) =
2.687, p = 0.009) between the privately owned group’s (3.928 ± 0.674) and the publicly traded
group’s (3.353 ± 0.824) MO scores. However, there were no statistically significant differences
among the groups’ AO (t(72) = -0.098, p = 0.922) and PERF (t(71) = 0.224, p = 0.823) scores.
54
4.7.6 Educational Background
Originally, educational backgrounds of CEOs were categorized into eight groups (Table
4.4). Due to the small number of responses in several categories (e.g. engineering and arts),
educational background categories were collapsed into five groups, namely doctoral, business,
medical/science, hybrid, and other.
ANOVAs were conducted to compare groups of companies with CEOs that had varying
educational background, based on their group mean scores of MO, AO, and PERF. There were
no statistically significant differences among the groups’ MO (F(4, 76) = 0.303, p = 0.516), AO
(F(4,75) = 0.505, p = 0.732), and PERF (F(4,74) = 0.212, p = 0.931) scores.
4.7.7 Company Age
Three linear regression analyses were performed using the age of companies as the
independent variable and MO, AO, and PERF alternating as the dependent variable. The results
of the first two regression models indicated that the age of companies had no statistically
significant effects on MO (R2 = 0.001, F(1, 78) = 0.099, p = 0.754) and AO (R2 = 0.069, F(1, 78)
= 0.378, p = 0.541). However, the third regression model indicated that the age of companies
had a negative and statistically significant effect on PERF (R2 = 0.321, F(1, 77) = 8.842, p =
0.004).
4.7.8 Company Size
Originally, companies were classified as micro, small, medium, and large (Table 4.6).
Due to the small number of responses in the medium and large categories, only companies in the
micro and small categories were compared.
Independent sample t-tests were conducted to compare the group of companies that were
categorized as micro and the group of companies that were categorized as small, based on their
group mean scores of MO, AO, and PERF. There were no statistically significant differences
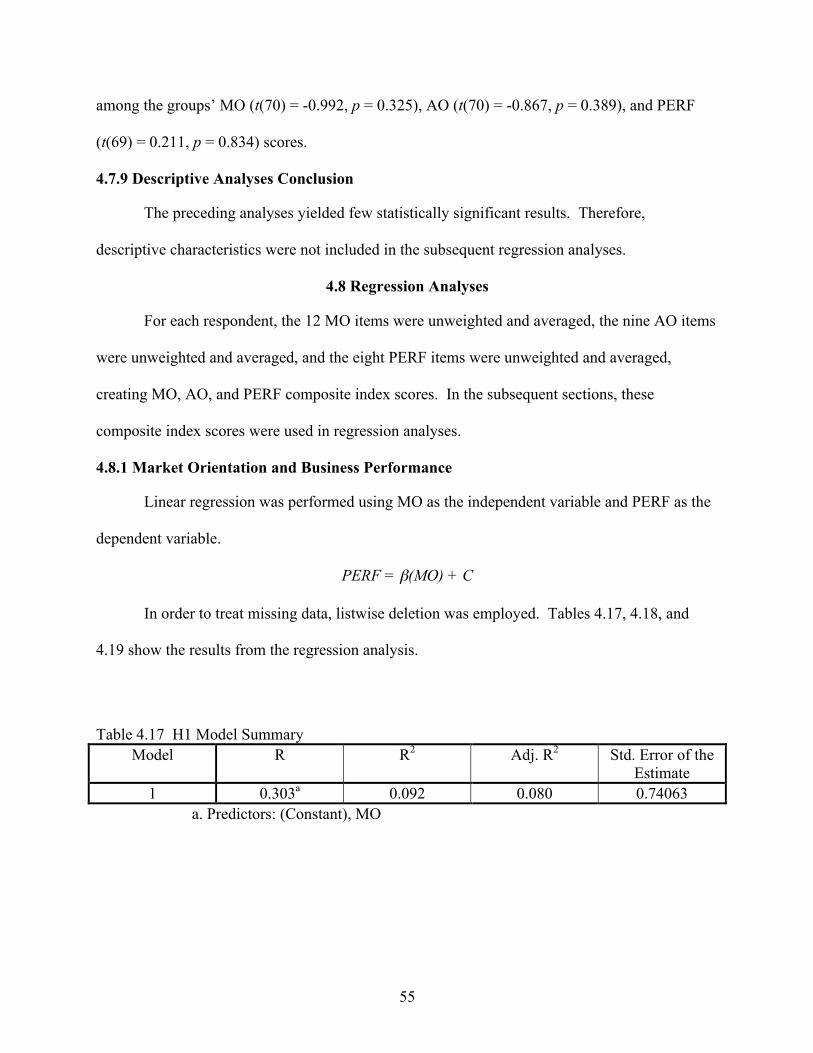
55
among the groups’ MO (t(70) = -0.992, p = 0.325), AO (t(70) = -0.867, p = 0.389), and PERF
(t(69) = 0.211, p = 0.834) scores.
4.7.9 Descriptive Analyses Conclusion
The preceding analyses yielded few statistically significant results. Therefore,
descriptive characteristics were not included in the subsequent regression analyses.
4.8 Regression Analyses
For each respondent, the 12 MO items were unweighted and averaged, the nine AO items
were unweighted and averaged, and the eight PERF items were unweighted and averaged,
creating MO, AO, and PERF composite index scores. In the subsequent sections, these
composite index scores were used in regression analyses.
4.8.1 Market Orientation and Business Performance
Linear regression was performed using MO as the independent variable and PERF as the
dependent variable.
PERF = β(MO) + C
In order to treat missing data, listwise deletion was employed. Tables 4.17, 4.18, and
4.19 show the results from the regression analysis.
Table 4.17 H1 Model Summary Model R R2 Adj. R2 Std. Error of the
Estimate 1 0.303a 0.092 0.080 0.74063
a. Predictors: (Constant), MO
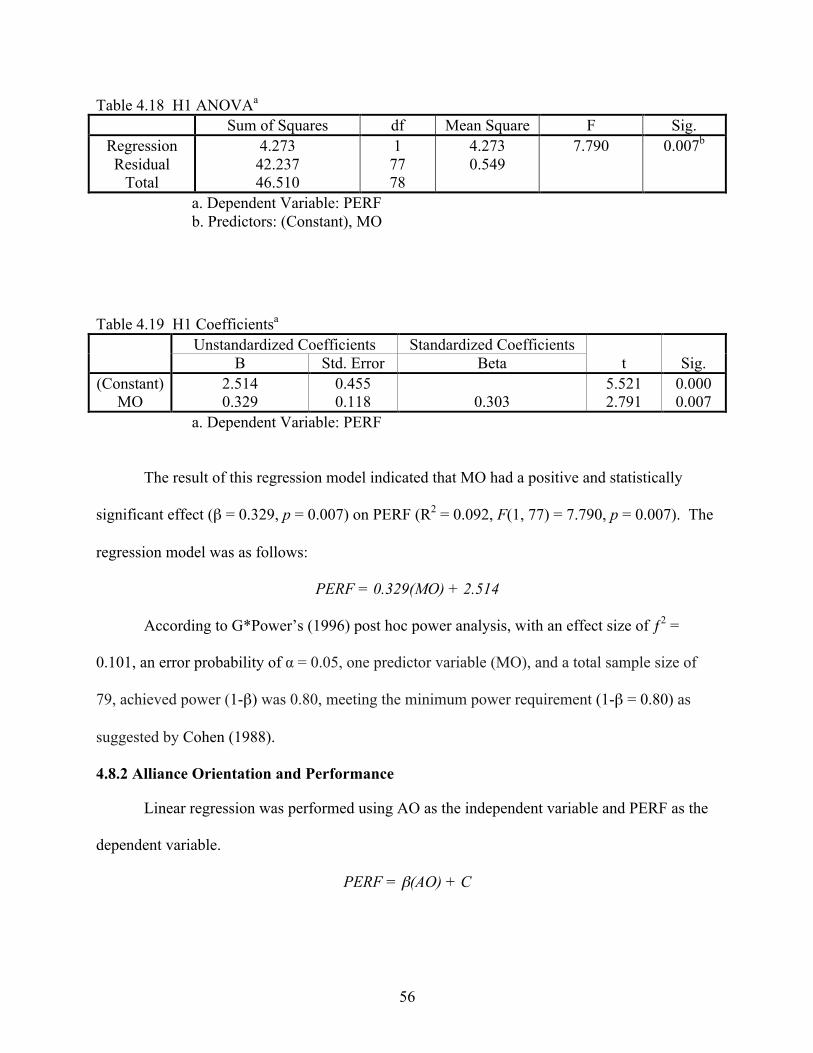
56
Table 4.18 H1 ANOVAa Sum of Squares df Mean Square F Sig.
Regression Residual
Total
4.273 42.237 46.510
1 77 78
4.273 0.549
7.790 0.007b
a. Dependent Variable: PERF b. Predictors: (Constant), MO
Table 4.19 H1 Coefficientsa
Unstandardized Coefficients Standardized Coefficients B Std. Error Beta t Sig. (Constant)
MO 2.514 0.329
0.455 0.118
0.303
5.521 2.791
0.000 0.007
a. Dependent Variable: PERF
The result of this regression model indicated that MO had a positive and statistically
significant effect (β = 0.329, p = 0.007) on PERF (R2 = 0.092, F(1, 77) = 7.790, p = 0.007). The
regression model was as follows:
PERF = 0.329(MO) + 2.514
According to G*Power’s (1996) post hoc power analysis, with an effect size of ƒ2 =
0.101, an error probability of α = 0.05, one predictor variable (MO), and a total sample size of
79, achieved power (1-β) was 0.80, meeting the minimum power requirement (1-β = 0.80) as
suggested by Cohen (1988).
4.8.2 Alliance Orientation and Performance
Linear regression was performed using AO as the independent variable and PERF as the
dependent variable.
PERF = β(AO) + C
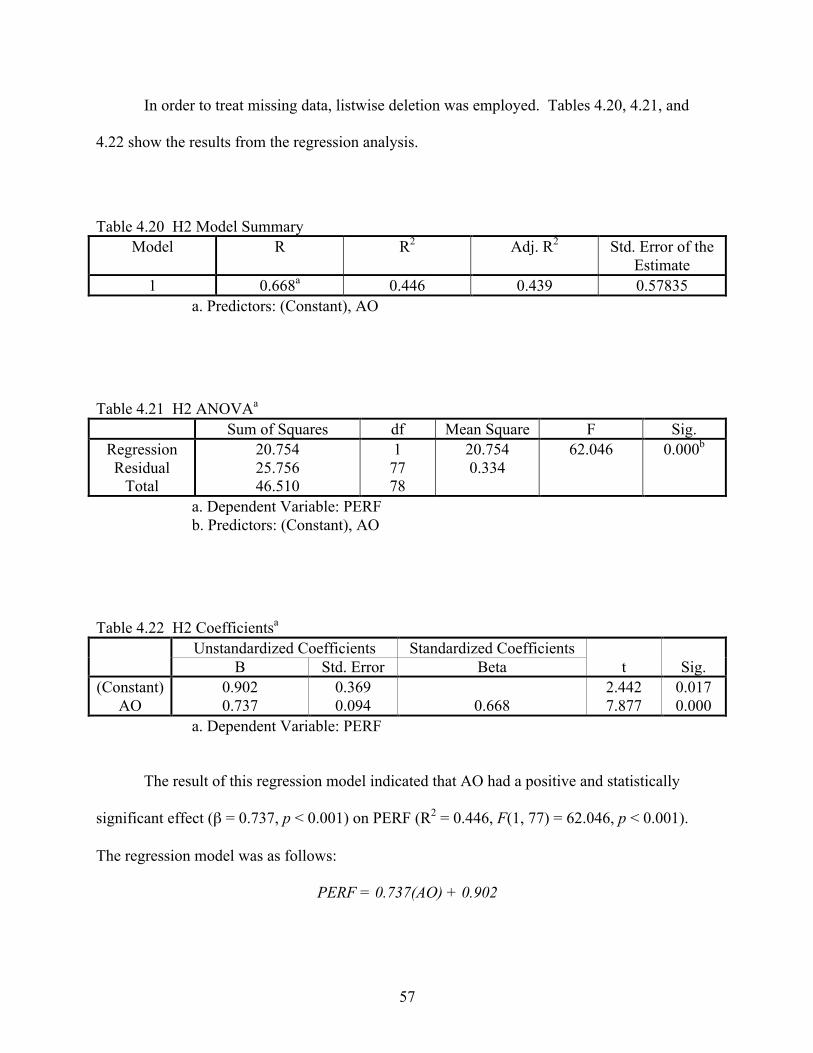
57
In order to treat missing data, listwise deletion was employed. Tables 4.20, 4.21, and
4.22 show the results from the regression analysis.
Table 4.20 H2 Model Summary Model R R2 Adj. R2 Std. Error of the
Estimate 1 0.668a 0.446 0.439 0.57835
a. Predictors: (Constant), AO
Table 4.21 H2 ANOVAa Sum of Squares df Mean Square F Sig.
Regression Residual
Total
20.754 25.756 46.510
1 77 78
20.754 0.334
62.046 0.000b
a. Dependent Variable: PERF b. Predictors: (Constant), AO
Table 4.22 H2 Coefficientsa Unstandardized Coefficients Standardized Coefficients B Std. Error Beta t Sig. (Constant)
AO 0.902 0.737
0.369 0.094
0.668
2.442 7.877
0.017 0.000
a. Dependent Variable: PERF
The result of this regression model indicated that AO had a positive and statistically
significant effect (β = 0.737, p < 0.001) on PERF (R2 = 0.446, F(1, 77) = 62.046, p < 0.001).
The regression model was as follows:
PERF = 0.737(AO) + 0.902
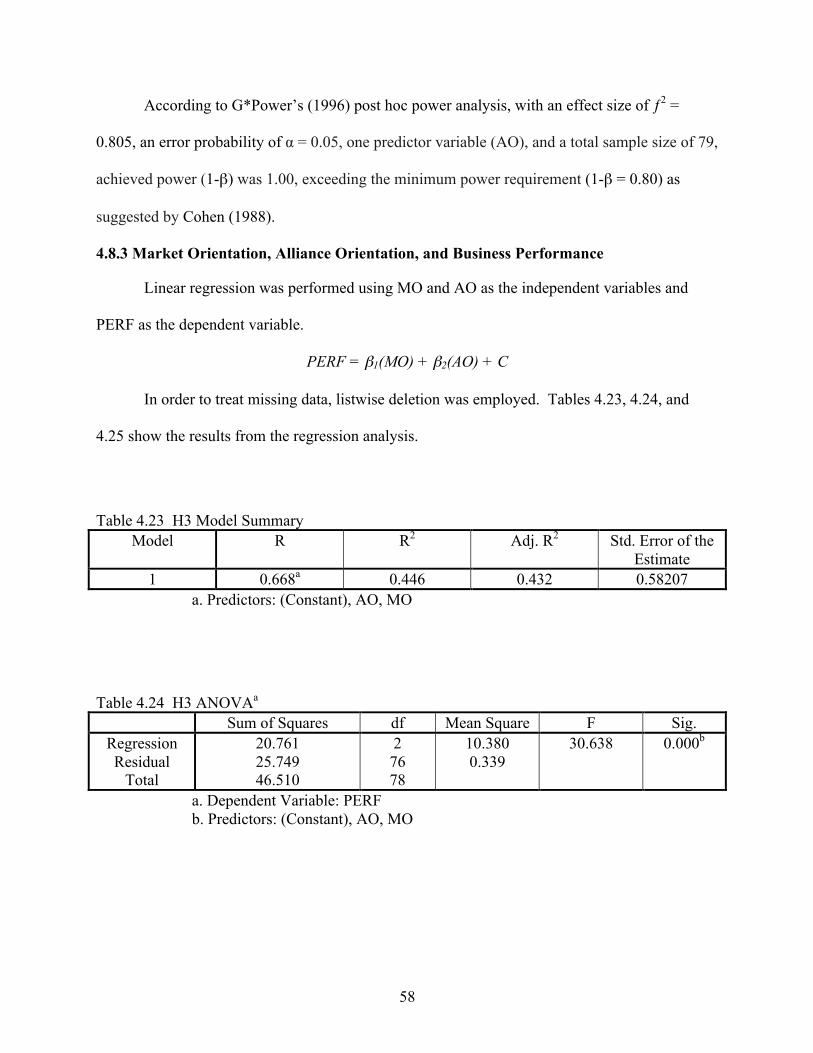
58
According to G*Power’s (1996) post hoc power analysis, with an effect size of ƒ2 =
0.805, an error probability of α = 0.05, one predictor variable (AO), and a total sample size of 79,
achieved power (1-β) was 1.00, exceeding the minimum power requirement (1-β = 0.80) as
suggested by Cohen (1988).
4.8.3 Market Orientation, Alliance Orientation, and Business Performance
Linear regression was performed using MO and AO as the independent variables and
PERF as the dependent variable.
PERF = β1(MO) + β2(AO) + C
In order to treat missing data, listwise deletion was employed. Tables 4.23, 4.24, and
4.25 show the results from the regression analysis.
Table 4.23 H3 Model Summary Model R R2 Adj. R2 Std. Error of the
Estimate 1 0.668a 0.446 0.432 0.58207
a. Predictors: (Constant), AO, MO
Table 4.24 H3 ANOVAa Sum of Squares df Mean Square F Sig.
Regression Residual
Total
20.761 25.749 46.510
2 76 78
10.380 0.339
30.638 0.000b
a. Dependent Variable: PERF b. Predictors: (Constant), AO, MO
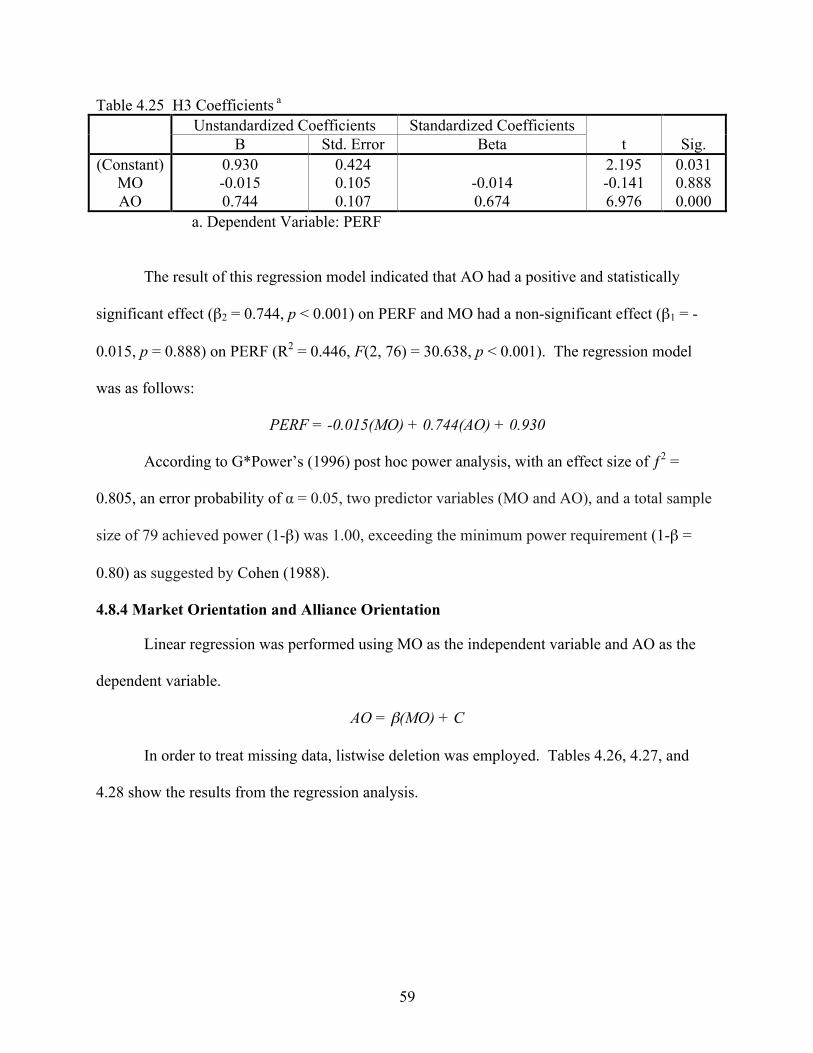
59
Table 4.25 H3 Coefficients a Unstandardized Coefficients Standardized Coefficients B Std. Error Beta t Sig. (Constant)
MO AO
0.930 -0.015 0.744
0.424 0.105 0.107
-0.014 0.674
2.195 -0.141 6.976
0.031 0.888 0.000
a. Dependent Variable: PERF
The result of this regression model indicated that AO had a positive and statistically
significant effect (β2 = 0.744, p < 0.001) on PERF and MO had a non-significant effect (β1 = -
0.015, p = 0.888) on PERF (R2 = 0.446, F(2, 76) = 30.638, p < 0.001). The regression model
was as follows:
PERF = -0.015(MO) + 0.744(AO) + 0.930
According to G*Power’s (1996) post hoc power analysis, with an effect size of ƒ2 =
0.805, an error probability of α = 0.05, two predictor variables (MO and AO), and a total sample
size of 79 achieved power (1-β) was 1.00, exceeding the minimum power requirement (1-β =
0.80) as suggested by Cohen (1988).
4.8.4 Market Orientation and Alliance Orientation
Linear regression was performed using MO as the independent variable and AO as the
dependent variable.
AO = β(MO) + C
In order to treat missing data, listwise deletion was employed. Tables 4.26, 4.27, and
4.28 show the results from the regression analysis.
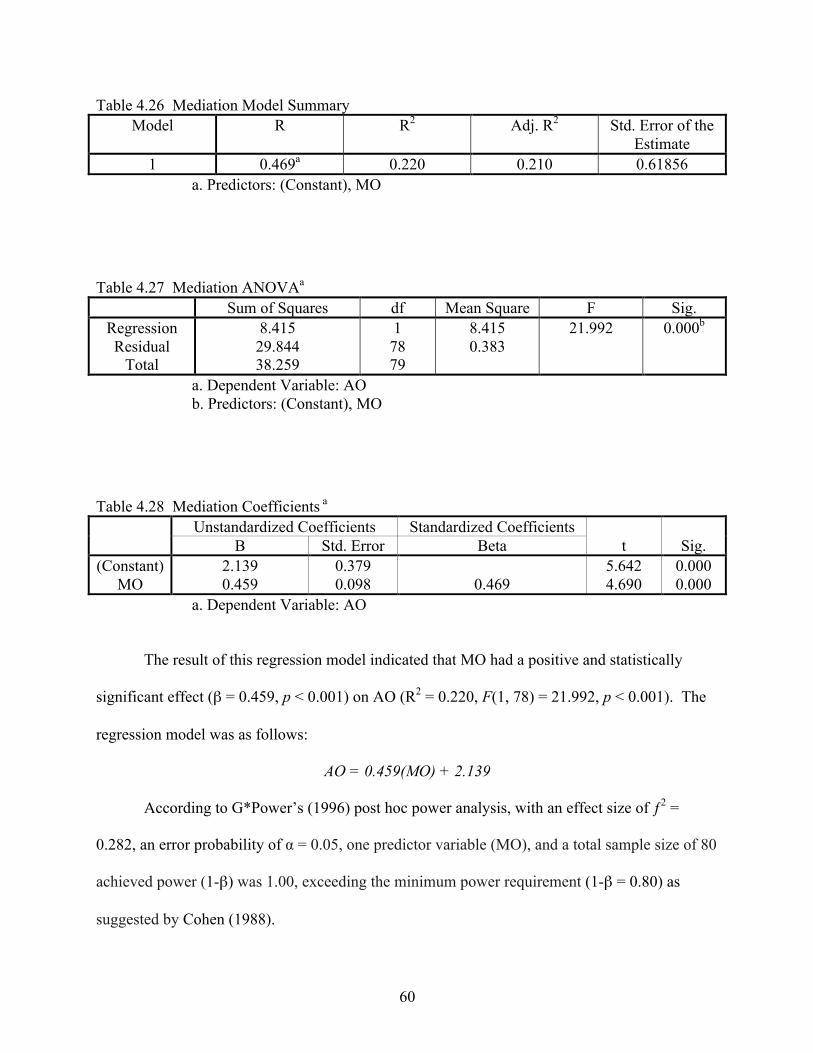
60
Table 4.26 Mediation Model Summary Model R R2 Adj. R2 Std. Error of the
Estimate 1 0.469a 0.220 0.210 0.61856
a. Predictors: (Constant), MO
Table 4.27 Mediation ANOVAa Sum of Squares df Mean Square F Sig.
Regression Residual
Total
8.415 29.844 38.259
1 78 79
8.415 0.383
21.992 0.000b
a. Dependent Variable: AO b. Predictors: (Constant), MO
Table 4.28 Mediation Coefficients a Unstandardized Coefficients Standardized Coefficients B Std. Error Beta t Sig. (Constant)
MO 2.139 0.459
0.379 0.098
0.469
5.642 4.690
0.000 0.000
a. Dependent Variable: AO
The result of this regression model indicated that MO had a positive and statistically
significant effect (β = 0.459, p < 0.001) on AO (R2 = 0.220, F(1, 78) = 21.992, p < 0.001). The
regression model was as follows:
AO = 0.459(MO) + 2.139
According to G*Power’s (1996) post hoc power analysis, with an effect size of ƒ2 =
0.282, an error probability of α = 0.05, one predictor variable (MO), and a total sample size of 80
achieved power (1-β) was 1.00, exceeding the minimum power requirement (1-β = 0.80) as
suggested by Cohen (1988).
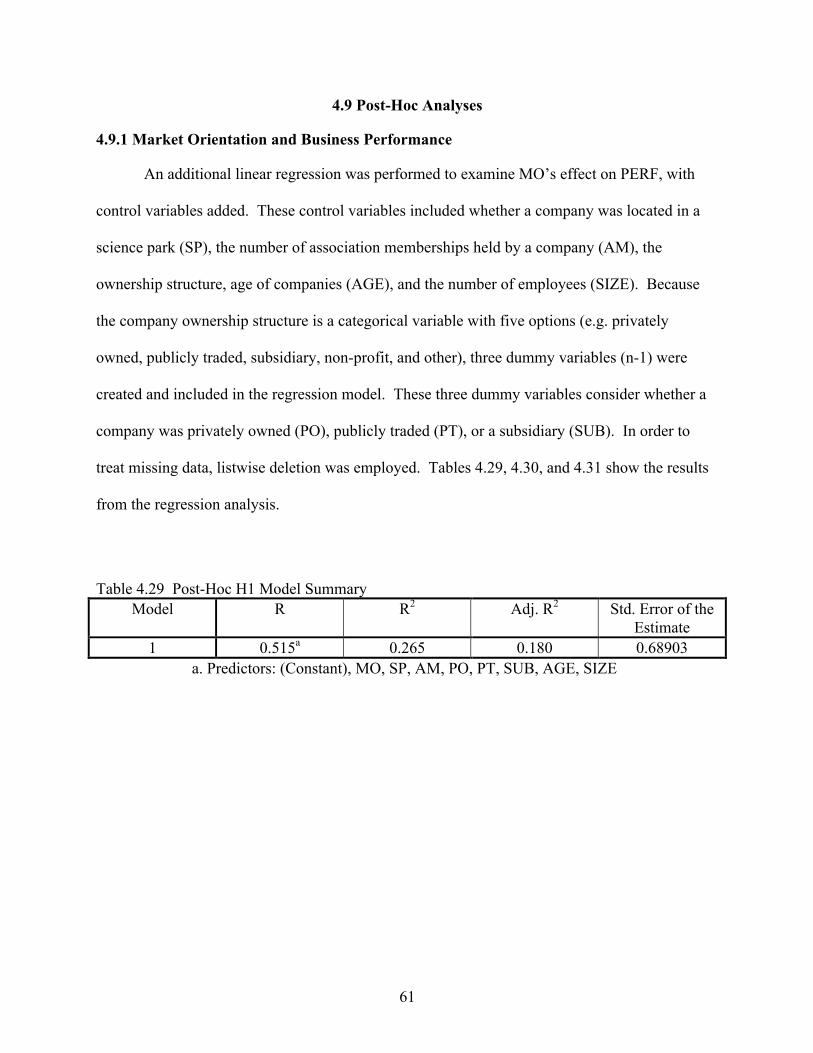
61
4.9 Post-Hoc Analyses
4.9.1 Market Orientation and Business Performance
An additional linear regression was performed to examine MO’s effect on PERF, with
control variables added. These control variables included whether a company was located in a
science park (SP), the number of association memberships held by a company (AM), the
ownership structure, age of companies (AGE), and the number of employees (SIZE). Because
the company ownership structure is a categorical variable with five options (e.g. privately
owned, publicly traded, subsidiary, non-profit, and other), three dummy variables (n-1) were
created and included in the regression model. These three dummy variables consider whether a
company was privately owned (PO), publicly traded (PT), or a subsidiary (SUB). In order to
treat missing data, listwise deletion was employed. Tables 4.29, 4.30, and 4.31 show the results
from the regression analysis.
Table 4.29 Post-Hoc H1 Model Summary Model R R2 Adj. R2 Std. Error of the
Estimate 1 0.515a 0.265 0.180 0.68903
a. Predictors: (Constant), MO, SP, AM, PO, PT, SUB, AGE, SIZE
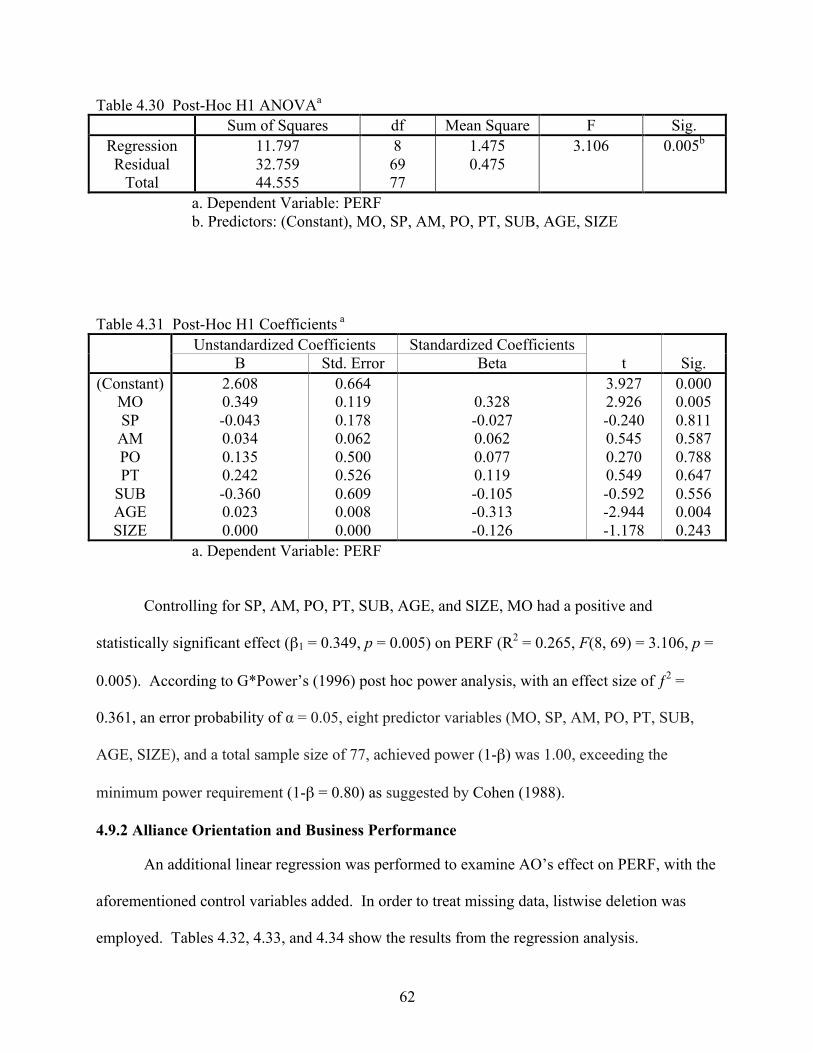
62
Table 4.30 Post-Hoc H1 ANOVAa Sum of Squares df Mean Square F Sig.
Regression Residual
Total
11.797 32.759 44.555
8 69 77
1.475 0.475
3.106 0.005b
a. Dependent Variable: PERF b. Predictors: (Constant), MO, SP, AM, PO, PT, SUB, AGE, SIZE
Table 4.31 Post-Hoc H1 Coefficients a Unstandardized Coefficients Standardized Coefficients B Std. Error Beta t Sig. (Constant)
MO SP AM PO PT
SUB AGE SIZE
2.608 0.349 -0.043 0.034 0.135 0.242 -0.360 0.023 0.000
0.664 0.119 0.178 0.062 0.500 0.526 0.609 0.008 0.000
0.328 -0.027 0.062 0.077 0.119 -0.105 -0.313 -0.126
3.927 2.926 -0.240 0.545 0.270 0.549 -0.592 -2.944 -1.178
0.000 0.005 0.811 0.587 0.788 0.647 0.556 0.004 0.243
a. Dependent Variable: PERF
Controlling for SP, AM, PO, PT, SUB, AGE, and SIZE, MO had a positive and
statistically significant effect (β1 = 0.349, p = 0.005) on PERF (R2 = 0.265, F(8, 69) = 3.106, p =
0.005). According to G*Power’s (1996) post hoc power analysis, with an effect size of ƒ2 =
0.361, an error probability of α = 0.05, eight predictor variables (MO, SP, AM, PO, PT, SUB,
AGE, SIZE), and a total sample size of 77, achieved power (1-β) was 1.00, exceeding the
minimum power requirement (1-β = 0.80) as suggested by Cohen (1988).
4.9.2 Alliance Orientation and Business Performance
An additional linear regression was performed to examine AO’s effect on PERF, with the
aforementioned control variables added. In order to treat missing data, listwise deletion was
employed. Tables 4.32, 4.33, and 4.34 show the results from the regression analysis.
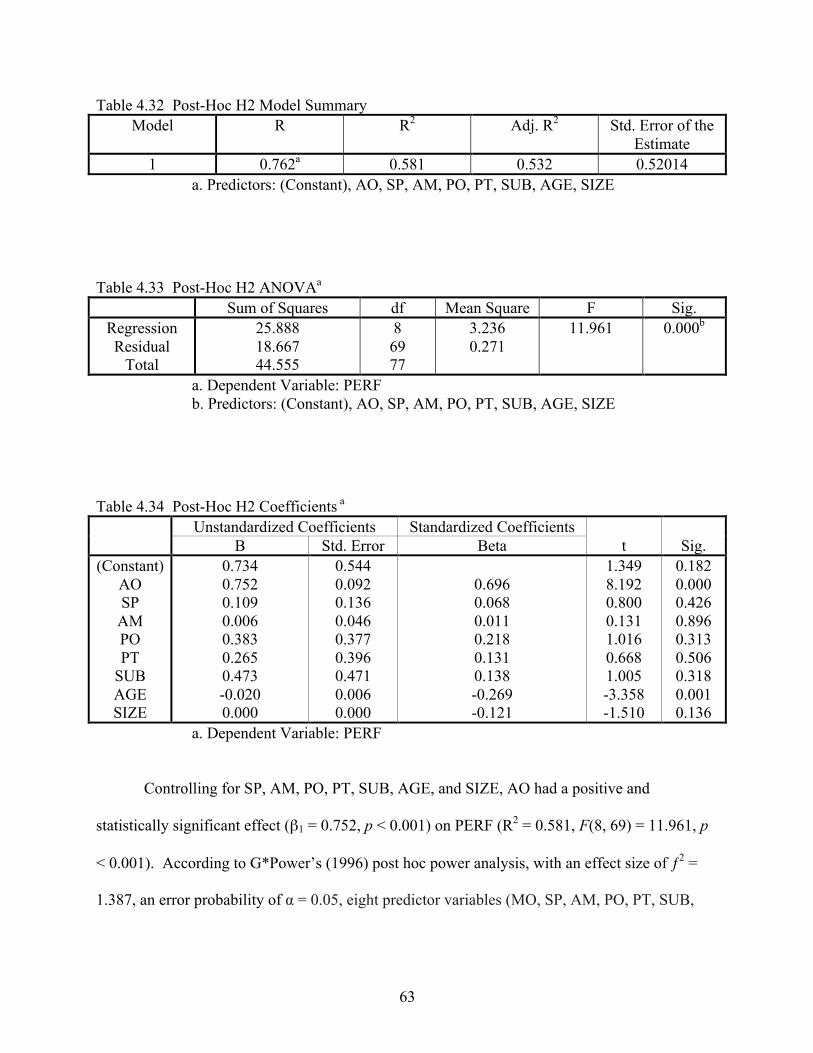
63
Table 4.32 Post-Hoc H2 Model Summary Model R R2 Adj. R2 Std. Error of the
Estimate 1 0.762a 0.581 0.532 0.52014
a. Predictors: (Constant), AO, SP, AM, PO, PT, SUB, AGE, SIZE
Table 4.33 Post-Hoc H2 ANOVAa Sum of Squares df Mean Square F Sig.
Regression Residual
Total
25.888 18.667 44.555
8 69 77
3.236 0.271
11.961 0.000b
a. Dependent Variable: PERF b. Predictors: (Constant), AO, SP, AM, PO, PT, SUB, AGE, SIZE
Table 4.34 Post-Hoc H2 Coefficients a Unstandardized Coefficients Standardized Coefficients B Std. Error Beta t Sig. (Constant)
AO SP AM PO PT
SUB AGE SIZE
0.734 0.752 0.109 0.006 0.383 0.265 0.473 -0.020 0.000
0.544 0.092 0.136 0.046 0.377 0.396 0.471 0.006 0.000
0.696 0.068 0.011 0.218 0.131 0.138 -0.269 -0.121
1.349 8.192 0.800 0.131 1.016 0.668 1.005 -3.358 -1.510
0.182 0.000 0.426 0.896 0.313 0.506 0.318 0.001 0.136
a. Dependent Variable: PERF
Controlling for SP, AM, PO, PT, SUB, AGE, and SIZE, AO had a positive and
statistically significant effect (β1 = 0.752, p < 0.001) on PERF (R2 = 0.581, F(8, 69) = 11.961, p
< 0.001). According to G*Power’s (1996) post hoc power analysis, with an effect size of ƒ2 =
1.387, an error probability of α = 0.05, eight predictor variables (MO, SP, AM, PO, PT, SUB,
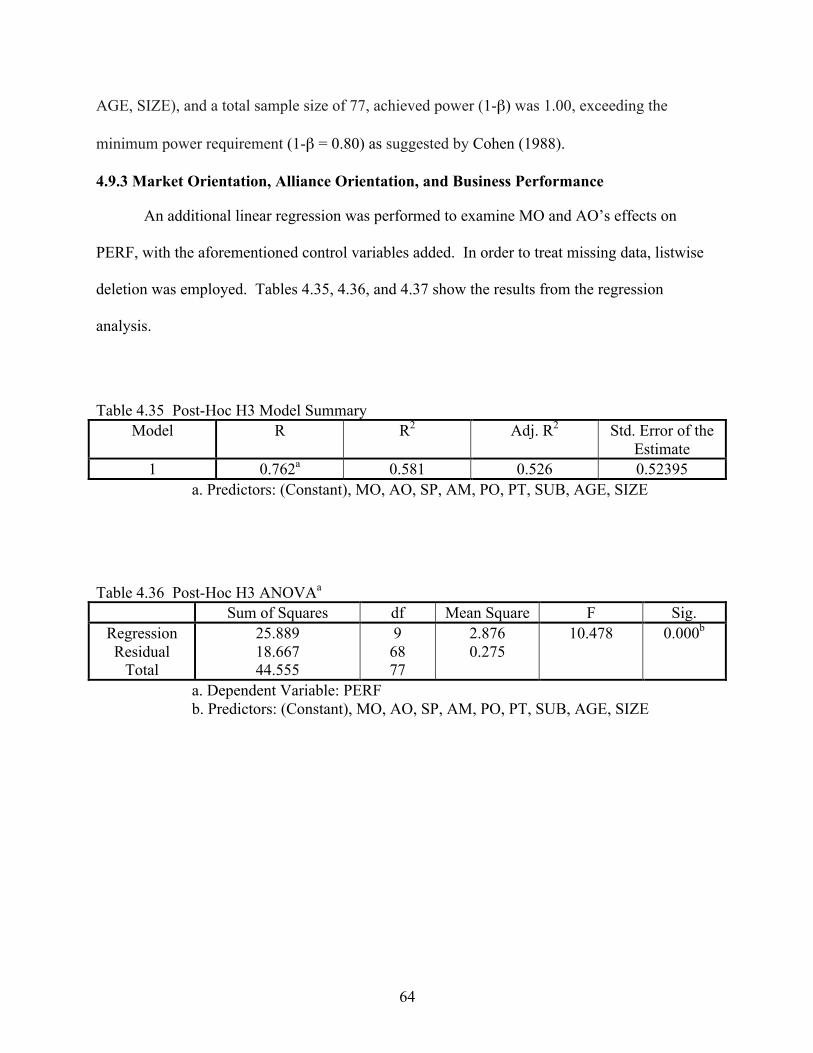
64
AGE, SIZE), and a total sample size of 77, achieved power (1-β) was 1.00, exceeding the
minimum power requirement (1-β = 0.80) as suggested by Cohen (1988).
4.9.3 Market Orientation, Alliance Orientation, and Business Performance
An additional linear regression was performed to examine MO and AO’s effects on
PERF, with the aforementioned control variables added. In order to treat missing data, listwise
deletion was employed. Tables 4.35, 4.36, and 4.37 show the results from the regression
analysis.
Table 4.35 Post-Hoc H3 Model Summary Model R R2 Adj. R2 Std. Error of the
Estimate 1 0.762a 0.581 0.526 0.52395
a. Predictors: (Constant), MO, AO, SP, AM, PO, PT, SUB, AGE, SIZE
Table 4.36 Post-Hoc H3 ANOVAa Sum of Squares df Mean Square F Sig.
Regression Residual
Total
25.889 18.667 44.555
9 68 77
2.876 0.275
10.478 0.000b
a. Dependent Variable: PERF b. Predictors: (Constant), MO, AO, SP, AM, PO, PT, SUB, AGE, SIZE
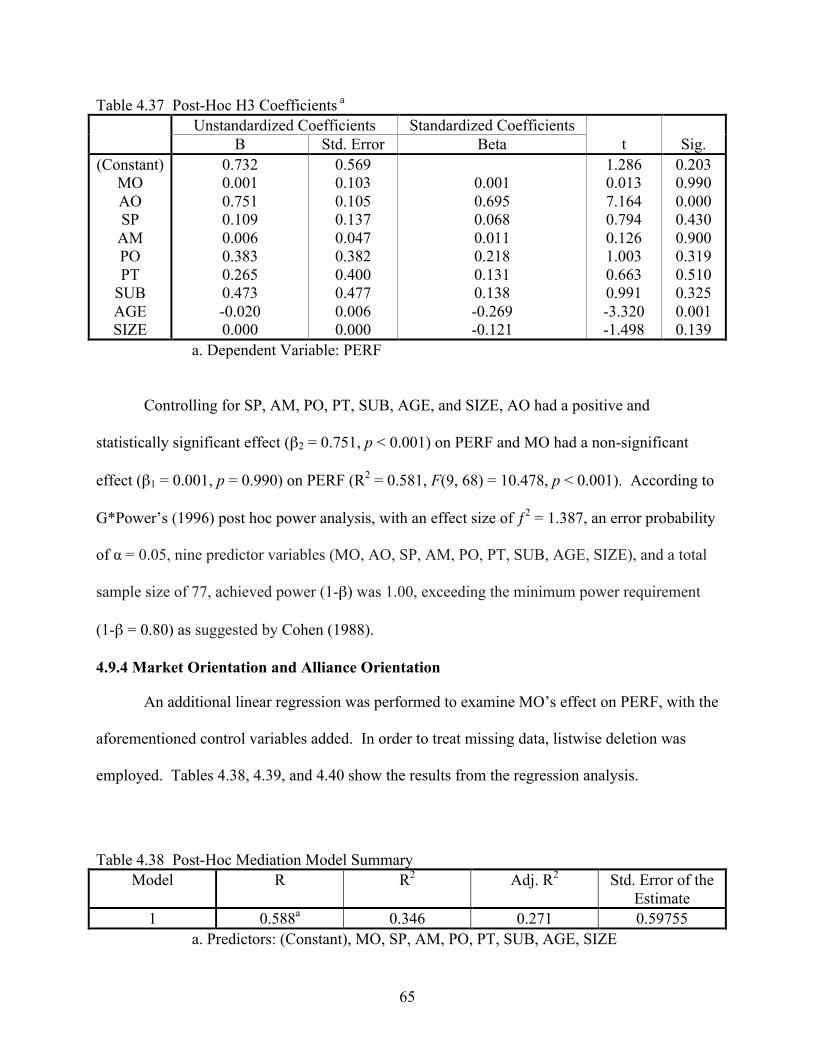
65
Table 4.37 Post-Hoc H3 Coefficients a Unstandardized Coefficients Standardized Coefficients B Std. Error Beta t Sig. (Constant)
MO AO SP AM PO PT
SUB AGE SIZE
0.732 0.001 0.751 0.109 0.006 0.383 0.265 0.473 -0.020 0.000
0.569 0.103 0.105 0.137 0.047 0.382 0.400 0.477 0.006 0.000
0.001 0.695 0.068 0.011 0.218 0.131 0.138 -0.269 -0.121
1.286 0.013 7.164 0.794 0.126 1.003 0.663 0.991 -3.320 -1.498
0.203 0.990 0.000 0.430 0.900 0.319 0.510 0.325 0.001 0.139
a. Dependent Variable: PERF
Controlling for SP, AM, PO, PT, SUB, AGE, and SIZE, AO had a positive and
statistically significant effect (β2 = 0.751, p < 0.001) on PERF and MO had a non-significant
effect (β1 = 0.001, p = 0.990) on PERF (R2 = 0.581, F(9, 68) = 10.478, p < 0.001). According to
G*Power’s (1996) post hoc power analysis, with an effect size of ƒ2 = 1.387, an error probability
of α = 0.05, nine predictor variables (MO, AO, SP, AM, PO, PT, SUB, AGE, SIZE), and a total
sample size of 77, achieved power (1-β) was 1.00, exceeding the minimum power requirement
(1-β = 0.80) as suggested by Cohen (1988).
4.9.4 Market Orientation and Alliance Orientation
An additional linear regression was performed to examine MO’s effect on PERF, with the
aforementioned control variables added. In order to treat missing data, listwise deletion was
employed. Tables 4.38, 4.39, and 4.40 show the results from the regression analysis.
Table 4.38 Post-Hoc Mediation Model Summary Model R R2 Adj. R2 Std. Error of the
Estimate 1 0.588a 0.346 0.271 0.59755
a. Predictors: (Constant), MO, SP, AM, PO, PT, SUB, AGE, SIZE
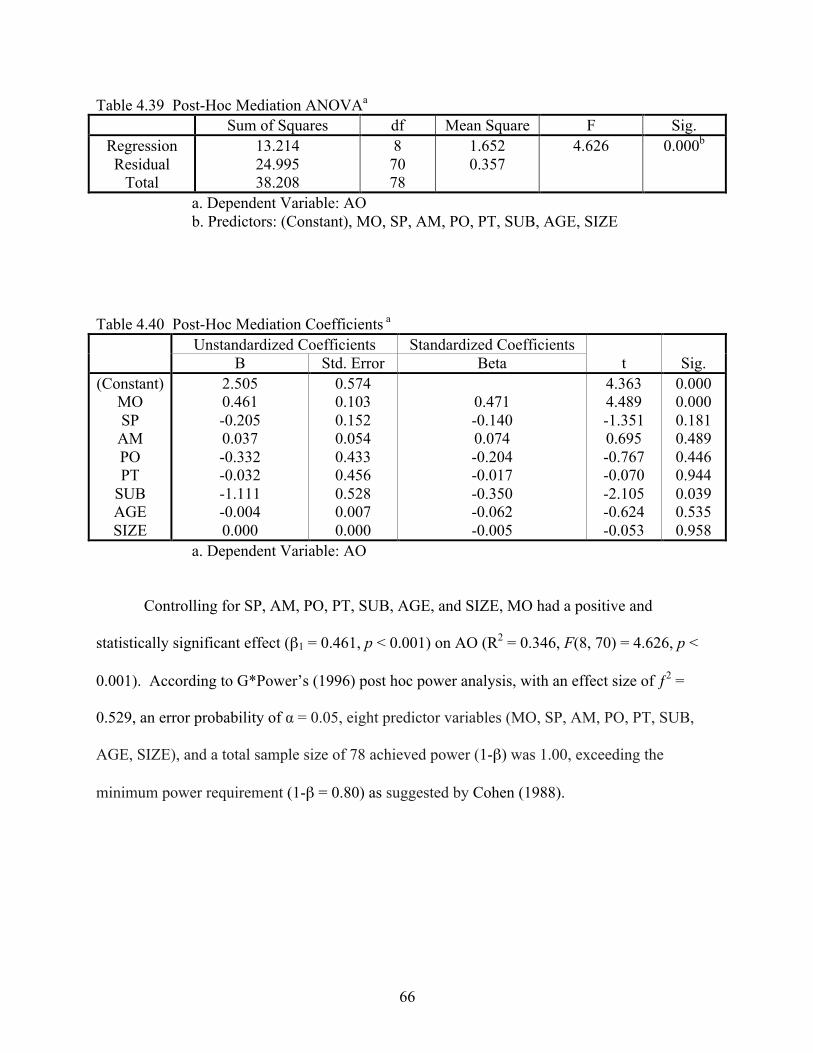
66
Table 4.39 Post-Hoc Mediation ANOVAa Sum of Squares df Mean Square F Sig.
Regression Residual
Total
13.214 24.995 38.208
8 70 78
1.652 0.357
4.626 0.000b
a. Dependent Variable: AO b. Predictors: (Constant), MO, SP, AM, PO, PT, SUB, AGE, SIZE
Table 4.40 Post-Hoc Mediation Coefficients a Unstandardized Coefficients Standardized Coefficients B Std. Error Beta t Sig. (Constant)
MO SP AM PO PT
SUB AGE SIZE
2.505 0.461 -0.205 0.037 -0.332 -0.032 -1.111 -0.004 0.000
0.574 0.103 0.152 0.054 0.433 0.456 0.528 0.007 0.000
0.471 -0.140 0.074 -0.204 -0.017 -0.350 -0.062 -0.005
4.363 4.489 -1.351 0.695 -0.767 -0.070 -2.105 -0.624 -0.053
0.000 0.000 0.181 0.489 0.446 0.944 0.039 0.535 0.958
a. Dependent Variable: AO
Controlling for SP, AM, PO, PT, SUB, AGE, and SIZE, MO had a positive and
statistically significant effect (β1 = 0.461, p < 0.001) on AO (R2 = 0.346, F(8, 70) = 4.626, p <
0.001). According to G*Power’s (1996) post hoc power analysis, with an effect size of ƒ2 =
0.529, an error probability of α = 0.05, eight predictor variables (MO, SP, AM, PO, PT, SUB,
AGE, SIZE), and a total sample size of 78 achieved power (1-β) was 1.00, exceeding the
minimum power requirement (1-β = 0.80) as suggested by Cohen (1988).
67
CHAPTER 5 DISCUSSION
5.1 Responses
The number of responses received was greater than, or similar to, other studies examining
MO in the biotechnology industry (Appiah-Adu and Ranchhod 1998; De Luca, Verona, and
Vicari 2010; Renko, Carsrud, and Brannback 2009). Appiah-Adu and Ranchhod (1998) received
62 usable responses in their study of UK biotechnology companies, De Luca, Verona, and Vicari
(2010) received 70 usable responses from Italian biotechnology companies, and Renko, Carsrud,
and Brannback (2009) received 85 responses when researching the biotechnology industry in the
US and Scandinavia. Comparatively, the number of responses received was favourable to
similar studies of MO in the biotechnology industry.
5.2 Demographics
Dillman (1978) suggests that obtaining a local endorsement can increase the number of
responses in a study (Dillman 1978). The collaboration with UQAM allowed for questionnaires
to be translated from English into French. Additionally, the endorsement from the university
may have helped legitimize the study among the French-speaking business community. Dillman
(2000) suggests that the number of responses can be increased by employing a multi-modal
approach (e.g. mail and online) (Dillman 2000). This study’s online completion option aided in
generating 20 additional responses, supporting Dillman’s (2000) recommendations.
Table 4.1 shows the number and percentage of companies located in each province and
the number and percentage of responses from each province. The percentages of responses from
British Columbia, Alberta, Saskatchewan, Prince Edward Island, and Nova Scotia were greater
than the percentages of companies located in the provinces. The percentages of responses from
Manitoba, Ontario, Quebec, and Newfoundland and Labrador were less than the percentages of
68
companies located in the provinces. However, only Alberta, Ontario, and Quebec’s differences
exceeded five percent. Overall, the percentage of responses from each province closely
resembled the percentage of companies located in each province.
The number of biotechnology industry associations is increasing as they are playing an
important role in advancing innovation (Bagchi-Sen, Smith, and Hall 2004). Furthermore,
biotechnology industry associations are said to be central to the biopartnering process, as they
encourage companies to form partnerships and collaborate to mutually benefit (Baum, Calabrese,
and Silverman 2000). In the US, most states have at least one biotechnology association
(Bagchi-Sen, Smith, and Hall 2004). Similarly, in Canada, there are national, regional, and
provincial biotechnology associations (BIOTECanada 2011c; Life Sciences Association of
Manitoba 2012). Seventy-nine percent of the respondents from this study held at least one
biotechnology association membership, reiterating their perceived importance.
Most biotechnology companies in Canada are SMEs (Conference Board of Canada
2005; Datamonitor 2011b; Rajamaki 2008; Government of Canada 2012; BIOTECanada 2011b).
Using Industry Canada’s (2011) employment size categories, the majority of responses from this
study were from micro (16%) or small (71.6%) companies. Therefore, the number of responses
from SMEs were consistent with industry statistics and reflective of the population.
5.3 Reliability
All of the instruments’ Cronbach’s alpha coefficients exceeded the previously defined
requirement (α ≥ 0.70). The MO instrument’s Cronbach’s alpha coefficient was 0.876, a good
internal reliability coefficient as described by George and Mallery (2009). It was expected that a
lower Cronbach’s alpha coefficient would be obtained because Narver and Slater’s (1990) MO
instrument had not been used in the Canadian medical/healthcare subsector of the biotechnology
industry. However, the internal reliability coefficient obtained from the MO instrument
69
exceeded expectations. The favourable Cronbach’s alpha coefficient signified that all of the
items were correlated with each other and measured the same phenomenon (e.g. MO) (SAGE
Research Methods 2012b). This could be the result of the instrument’s extensive use and the
advanced practices of MO research.
The Kandemir, Yaprak, and Cavusgil (2006) AO instrument was developed to measure
the acquisition, interpretation, and use of alliance management knowledge in the US technology
industry, where the presence of strategic alliances among technology companies are increasing
and of growing importance (Hagedoorn and Duysters 2002; Gulati 1998; Verspagen and
Duysters 2004). The AO instrument’s Cronbach’s alpha coefficient was 0.919, an excellent
internal reliability coefficient as described by George and Mallery (2009). It was expected that a
lower Cronbach’s alpha coefficient would be obtained because of the limited research utilizing
the AO instrument. However, the internal reliability coefficient obtained from the AO
instrument exceeded expectations, signifying that all of the items were correlated with each other
and measured the same phenomenon (e.g. AO). This may have been due to the similarities
between this empirical setting (e.g. biotechnology industry) and the empirical setting for which
the instrument was developed (e.g. technology industry). Specifically, the technology industry is
similar to the biotechnology industry as organizational success has been shown to rely on
effective strategic alliance management (Baum, Calabrese, and Silverman 2000; Baum and
Silverman 2004; Forest and Martin 1992; George et al. 2001; Sarkar, Echambadi, and Harrison
2001).
The PERF instrument’s Cronbach’s alpha coefficient was 0.844, a good reliability
coefficient as described by George and Mallery (2009). It was expected that a lower Cronbach’s
alpha coefficient would be obtained because the PERF instrument, created by adapting and
70
broadening the De Luca, Verona, and Vicari (2010) R&D effectiveness instrument, had never
been empirically tested prior to this study. Obtaining a Cronbach’s alpha coefficient of 0.70 is
generally accepted and justified when instruments are new and used in exploratory work
(Nunnally 1978). The internal reliability coefficient obtained from the PERF instrument
exceeded expectations, signifying that all of the items were correlated with each other and
measured the same phenomenon (e.g. PERF). Adapting and broadening the R&D effectiveness
instrument to include items related to capital, alliances and partnerships, and milestones may
have been the reason for its success in this study.
5.4 Non-response Bias
Analyses were performed (4.5 Non-response Bias) in order to determine the presence, or
absence, of a non-response bias. No statistically significant differences were found in the
analyses, suggesting that early and late responders did not differ. Statistically, as early and late
responders did not significantly differ, there was no evidence that supported the existence of a
non-response bias (Armstrong and Overton 1977).
5.5 Descriptive Analyses
5.5.1 Response Language
The results from the independent sample t-tests, that compared the group of companies
that completed the questionnaires in English and the group of companies that completed the
questionnaires in French, showed no statistically significant differences among the groups’ MO
or AO scores (4.7.1 Response Language). There was a statistically significant difference
between the English-speaking group’s and the French-speaking group’s PERF scores.
Statistically, the mean PERF score of French-speaking companies was significantly higher than
the English-speaking companies MO score, suggesting that French-speaking companies
outperformed English-speaking companies.
71
Practically, there are two possible explanations for the statistically significant finding.
The first explanation for the statistically significant finding is that French-speaking companies
slightly outperformed English-speaking companies. A second explanation for the statistically
significant finding is that French-speaking companies have a slightly higher perceived valuation
of performance than English-speaking companies.
5.5.2 Method of Completion
Kwak and Radler (2002) found that respondents differed based on data collection
formats. The results from the independent sample t-tests, that compared the group of companies
that responded by mail and the group of companies that responded online, showed no statistically
significant differences among the groups’ MO, AO, or PERF scores (4.7.2 Method of
Completion). This refutes Kwak and Radler’s (2002) findings, suggesting that respondents did
not differ based on data collection formats. An explanation for this may be that all respondents
in the biotechnology industry are technologically-oriented, and the method of completion is not a
measure of their organization’s performance record nor its orientation to the market and
alliances.
5.5.3 Science Park Location
It has been shown that positive externalities and other economic benefits can occur when
similar companies geographically cluster around, and knowledge share with, one another (Folta,
Cooper, and Baik 2006; Efendioglu 2005). However, Folta, Cooper, and Baik (2009) found that
large biotechnology clusters can actually inhibit positive economic benefits and even cause
negative externalities for companies.
The results from the independent sample t-tests, that compared the group of companies
located in science parks and the group of companies located outside of science parks, showed no
differences among the groups’ MO, AO, or PERF scores (4.7.3 Science Park Location). This
72
suggests that geographical clustering does not increase or decrease Canadian medical/healthcare
biotechnology companies’ MO, AO, or PERF.
One explanation for the non-significant differences is that companies with close
geographical proximity may not actually be participating in knowledge-sharing. Moreover, it is
possible that the importance of geographical clustering could be overstated, resulting in the
interpretation that clustering positively influences performance. Secondly, companies that are
geographically clustered may have dissimilar focuses, resulting in little or no knowledge-sharing.
Another explanation is that, due to the peculiarities of the Canadian medical/healthcare subsector
of the biotechnology industry, clustering is not as important as being market-oriented or alliance-
oriented.
5.5.4 Association Memberships
Association memberships have been shown to advance innovation in the biotechnology
industry (Bagchi-Sen, Smith, and Hall 2004). Yet, according to Baum, Calabrese, and Silverman
(2000), Canadian biotechnology companies that had numerous industry association memberships
performed poorly. Baum, Calabrese, and Silverman (2000) suggested that companies that hold
several association memberships do so to make up for founders’ lack, or size, of professional
networks.
The number of association memberships were used as the independent variable and MO,
AO, and PERF were used as the dependent variable in regression analyses. Results indicated
that the number of association memberships did not affect MO, AO, or PERF (4.7.4 Association
Memberships). The number of industry association memberships that medical/healthcare
biotechnology companies have does not appear to influence its MO, AO, or PREF scores. This
refutes Baum, Calabrese, and Silverman’s (2000) findings that suggest association memberships
dampen performance. One reason for this incongruence could be that industry association
73
memberships matter more in the medical/healthcare subsector as opposed to the entire Canadian
biotechnology industry, as they did not lower performance. Secondly, it could be related to the
timing of the two studies, as they were conducted over 10 years apart. Finally, it could be related
to the process of obtaining an association membership, as most associations only require its
members to pay an annual fee (Newfoundland and Labrador Association of Technology
Industries 2013; Life Sciences British Columbia 2012; BioNova 2013; BioAlberta 2013;
BIOTECanada 2013; Ag-West Bio 2013). Furthermore, many biotechnology associations allow
non-biotechnology companies (e.g. accounting firms) to hold memberships (Newfoundland and
Labrador Association of Technology Industries 2013; Life Sciences British Columbia 2012;
BioNova 2013; BioAlberta 2013; BIOTECanada 2013; Ag-West Bio 2013). Overall, no
evidence was found to suggest that industry association memberships increased or decreased
MO, AO, or PERF.
5.5.5 Ownership Structure
The differences in biotechnology ownership types have been shown to influence
companies’ corporate strategies and performance (Baum, Calabrese, and Silverman 2000; Stuart,
Hoang, and Hybels 1999; Zahra 1996). Zahra (1996) showed that independent biotechnology
companies outperformed corporate-sponsored biotechnology companies. Stuart (1999)
demonstrated how biotechnology companies with established partners issued stock and had
higher initial valuations than companies without such partners.
The results from the independent sample t-tests that compared the group of companies
that were privately owned and the group of companies that were publicly traded, showed no
statistically significant differences among the groups’ AO or PERF scores (4.7.5 Ownership
Structure). This contrasts previous findings that suggest differing ownership types influence
performance. Leveraging the results from this study’s hypotheses to rationalize the ownership
74
structure findings, it can be said that a business’ performance is influenced more by its
behavioural commitments, organizational culture, and activities than its legal structure.
There was a statistically significant difference between the privately owned group’s and
the publicly traded group’s MO scores. Statistically, the mean MO score of privately owned
companies was significantly higher than the publicly traded mean MO score, suggesting that
privately owned companies were more market-oriented. When a company becomes publicly
traded it is accountable to new people, namely the shareholders. Perhaps this new accountability
shifts some of the organizational focus from customers, competitors, and business units to
shareholders, resulting in a decrease in MO. Although a statistically significant difference was
found between the two MO scores, the MO score of publicly traded companies was not low.
Therefore, privately owned and publicly traded Canadian medical/healthcare biotechnology
companies are market-oriented, but by how much may be dependent on companies’ stakeholders.
5.5.6 Educational Background
The importance of the educational background of biotechnology CEOs has been widely
debated (Kermani and Gittins 2004; McMillan and Thomas 2005; Patzelt 2010). The education
of biotechnology CEOs has been shown to influence a company’s meaningfulness of patents,
valuation at the time of initial public offering, and stock price (McMillan and Thomas 2005).
Conversely, Patzelt (2010) found that in a cross-cultural study of European and US
biotechnology companies, education of CEOs did not influence financial performance (Patzelt
2010).
ANOVAs were conducted to compare groups of companies with CEOs that had varying
educational backgrounds, based on their group mean MO, AO, and PERF scores. No statistically
significant differences were found among the groups’ MO, AO, or PERF scores (4.7.6
Educational Background). The educational backgrounds of CEOs seemed to play no role in
75
determining companies’ performance or orientation to the market and alliances. It is possible
that Canadian medical/healthcare biotechnology CEOs who have specific skills, surround
themselves with other individuals who have complementary knowledge and experience. It may
be that this effective management of knowledge and experience enables all types of managers to
perform optimally.
5.5.7 Company Age
A study of US biotechnology companies showed that the stock market favoured older and
more established companies (McMillan and Thomas 2005). Conventional wisdom suggests that
companies that successfully move through the organizational lifecycle, reach profitability and
perform well, or at least well enough for continued existence.
The age of companies was used as the independent variable and MO, AO, and PERF
were used as the dependent variable in regression analyses. Results indicated that the age of
companies did not have statistically significant effects on MO or AO (4.7.7 Company Age).
However, the age of companies had a statistically significant effect on PERF (4.7.7 Company
Age). Specifically, the age of companies had a negative influence on PERF. Therefore, younger
companies performed more favourably than older companies, refuting McMillan’s (2005)
findings. These results suggest younger companies perform well financially, securing private
and public capital. Furthermore, younger companies are better able to secure patents, attain
milestones, recruit new personnel, and demonstrate technological leadership as opposed to their
older counterparts. This should be interpreted with caution, as this does not necessarily mean
that older companies perform poorly, but perhaps there are more deliverables in the early years.
5.5.8 Company Size
In Woiceshyn and Hartel’s (1996) study of Canadian biotechnology companies they
found that sales performance increased with company size. The results from the independent
76
sample t-tests that compared the group of companies that were categorized as micro and the
group of companies that were categorized as small, showed no statistically significant
differences among the groups’ MO, AO, or PERF scores (4.7.8 Company Size). This suggests
that micro and small companies do not differ in terms of overall performance or their orientation
to marketing and alliance management. It is important to note that due to insufficient data, this
analysis only compared micro and small companies. Therefore, it cannot be said with certainty
that company size does not influence performance, as performance may significantly differ if
micro and large companies were compared.
5.6 Hypotheses
5.6.1 Hypothesis 1
Businesses with commitments to marketing and marketing strategy tend to outperform
those without such commitments (Narver and Slater 1990). This notion has been discussed by
managers and studied by academics for decades (Narver and Slater 1990). Narver and Slater’s
(1990) MO instrument, designed to measure commitment to marketing and marketing strategy,
has been used in various industries and cultural contexts, repeatedly lending support for its
positive effect on performance (Appiah-Adu and Ranchhod 1998; Narver and Slater 1990;
Subramanian and Gopalakrishna 2001; Deng and Dart 1994). However, few empirical
investigations explore MO and performance in the biotechnology industry (Appiah-Adu and
Ranchhod 1998; De Luca, Verona, and Vicari 2010; Renko, Carsrud, and Brannback 2009).
Furthermore, studies that have examined MO’s effect on performance in the biotechnology
industry have produced contradictory findings, suggesting that MO may be somewhat contingent
on the cultural context (Appiah-Adu and Ranchhod 1998; De Luca, Verona, and Vicari 2010;
Renko, Carsrud, and Brannback 2009).
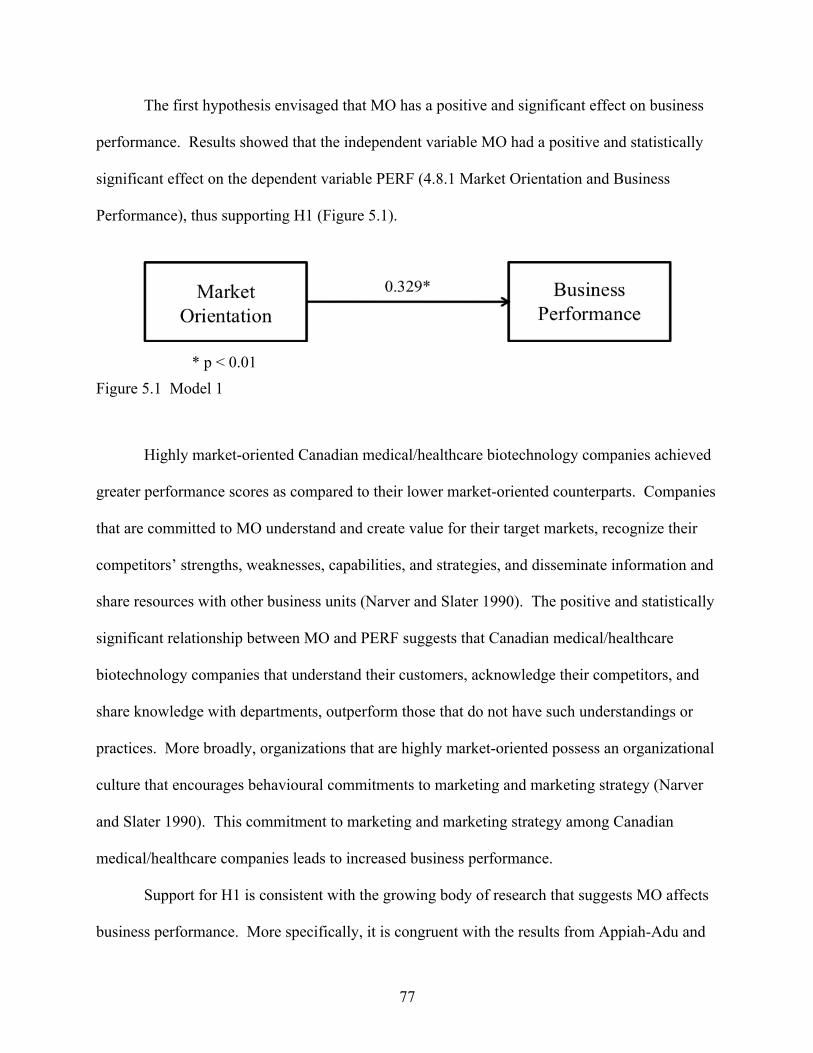
77
The first hypothesis envisaged that MO has a positive and significant effect on business
performance. Results showed that the independent variable MO had a positive and statistically
significant effect on the dependent variable PERF (4.8.1 Market Orientation and Business
Performance), thus supporting H1 (Figure 5.1).
* p < 0.01
Figure 5.1 Model 1
Highly market-oriented Canadian medical/healthcare biotechnology companies achieved
greater performance scores as compared to their lower market-oriented counterparts. Companies
that are committed to MO understand and create value for their target markets, recognize their
competitors’ strengths, weaknesses, capabilities, and strategies, and disseminate information and
share resources with other business units (Narver and Slater 1990). The positive and statistically
significant relationship between MO and PERF suggests that Canadian medical/healthcare
biotechnology companies that understand their customers, acknowledge their competitors, and
share knowledge with departments, outperform those that do not have such understandings or
practices. More broadly, organizations that are highly market-oriented possess an organizational
culture that encourages behavioural commitments to marketing and marketing strategy (Narver
and Slater 1990). This commitment to marketing and marketing strategy among Canadian
medical/healthcare companies leads to increased business performance.
Support for H1 is consistent with the growing body of research that suggests MO affects
business performance. More specifically, it is congruent with the results from Appiah-Adu and
78
Ranchhod’s (1998) study of UK biotechnology companies and Renko, Carsrud, and Brannback’s
(2009) findings related to Scandinavian human health biotechnology companies. Appiah-Adu
and Ranchhod (1998) confirmed that UK biotechnology companies committed to MO
outperformed their competitors in terms of market share, profit margins, and overall
performance. Renko, Carsrud, and Brannback (2009) discussed how the relationship between
MO and capital invested may be culturally dependent, as it was statistically significant among
Scandinavian but not US human health biotechnology companies. Moreover, De Luca, Verona,
and Vicari (2010) found that of the three MO components, only interfunctional coordination was
positively correlated with Italian biotechnology companies’ performance, providing further
evidence that the strength of the MO and performance relationship may be culturally dependent.
In summary, Canadian medical/healthcare biotechnology companies with high MO
scores outperformed those with lower MO scores, providing support for the first hypothesis.
However, a company’s commitment to MO does not solely necessitate strong business
performance, thus the result of H1 should be interpreted with deliberation. Echoing Appiah-Adu
and Ranchhod (1998), although a positive relationship exists between MO and PERF, it is
cautioned that other variables may influence PERF. Neglecting to examine other variables may
overstate or exaggerate MO’s importance (Appiah-Adu and Ranchhod 1998). Appiah-Adu and
Ranchhod (1998) suggest that future studies of MO in the biotechnology industry should
consider a networking or alliance variable. The following discussion of the second and third
hypothesis address this concern.
5.6.2 Hypothesis 2
For over two decades, researchers have studied elements of strategic alliances and their
effects on biotechnology business performance (Baum, Calabrese, and Silverman 2000; Baum
and Silverman 2004; Forest and Martin 1992; George et al. 2001; George, Zahra, and Wood
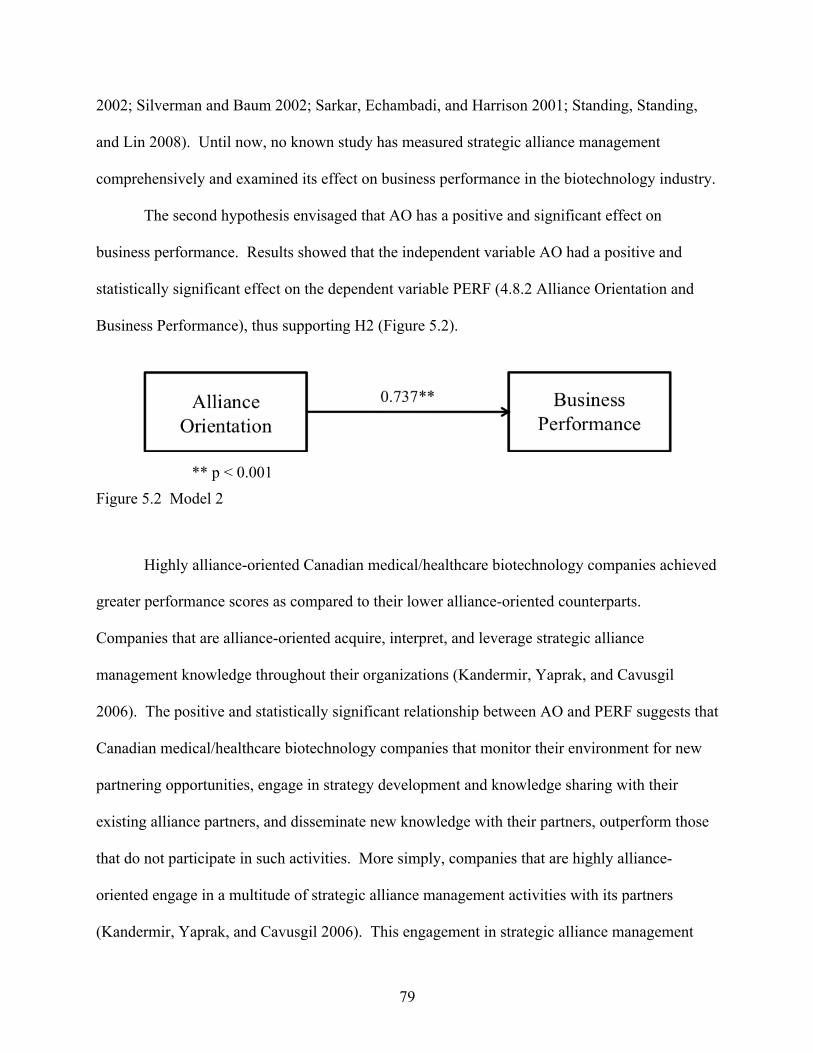
79
2002; Silverman and Baum 2002; Sarkar, Echambadi, and Harrison 2001; Standing, Standing,
and Lin 2008). Until now, no known study has measured strategic alliance management
comprehensively and examined its effect on business performance in the biotechnology industry.
The second hypothesis envisaged that AO has a positive and significant effect on
business performance. Results showed that the independent variable AO had a positive and
statistically significant effect on the dependent variable PERF (4.8.2 Alliance Orientation and
Business Performance), thus supporting H2 (Figure 5.2).
** p < 0.001
Figure 5.2 Model 2
Highly alliance-oriented Canadian medical/healthcare biotechnology companies achieved
greater performance scores as compared to their lower alliance-oriented counterparts.
Companies that are alliance-oriented acquire, interpret, and leverage strategic alliance
management knowledge throughout their organizations (Kandermir, Yaprak, and Cavusgil
2006). The positive and statistically significant relationship between AO and PERF suggests that
Canadian medical/healthcare biotechnology companies that monitor their environment for new
partnering opportunities, engage in strategy development and knowledge sharing with their
existing alliance partners, and disseminate new knowledge with their partners, outperform those
that do not participate in such activities. More simply, companies that are highly alliance-
oriented engage in a multitude of strategic alliance management activities with its partners
(Kandermir, Yaprak, and Cavusgil 2006). This engagement in strategic alliance management
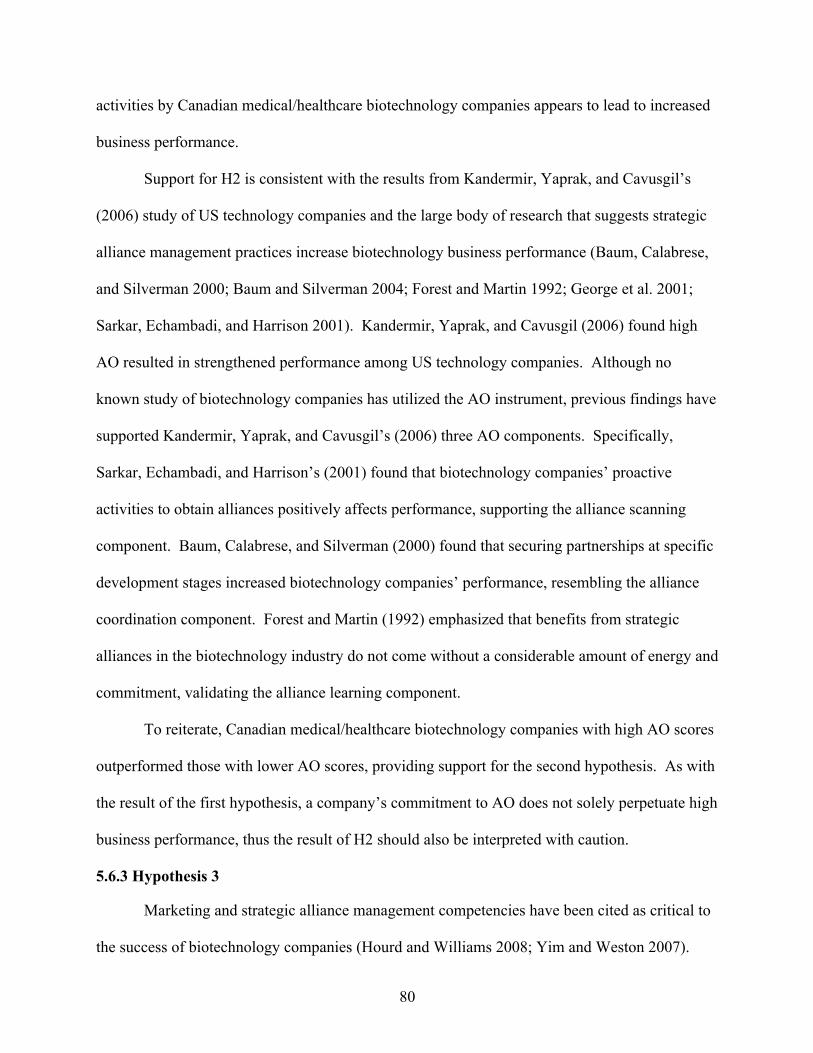
80
activities by Canadian medical/healthcare biotechnology companies appears to lead to increased
business performance.
Support for H2 is consistent with the results from Kandermir, Yaprak, and Cavusgil’s
(2006) study of US technology companies and the large body of research that suggests strategic
alliance management practices increase biotechnology business performance (Baum, Calabrese,
and Silverman 2000; Baum and Silverman 2004; Forest and Martin 1992; George et al. 2001;
Sarkar, Echambadi, and Harrison 2001). Kandermir, Yaprak, and Cavusgil (2006) found high
AO resulted in strengthened performance among US technology companies. Although no
known study of biotechnology companies has utilized the AO instrument, previous findings have
supported Kandermir, Yaprak, and Cavusgil’s (2006) three AO components. Specifically,
Sarkar, Echambadi, and Harrison’s (2001) found that biotechnology companies’ proactive
activities to obtain alliances positively affects performance, supporting the alliance scanning
component. Baum, Calabrese, and Silverman (2000) found that securing partnerships at specific
development stages increased biotechnology companies’ performance, resembling the alliance
coordination component. Forest and Martin (1992) emphasized that benefits from strategic
alliances in the biotechnology industry do not come without a considerable amount of energy and
commitment, validating the alliance learning component.
To reiterate, Canadian medical/healthcare biotechnology companies with high AO scores
outperformed those with lower AO scores, providing support for the second hypothesis. As with
the result of the first hypothesis, a company’s commitment to AO does not solely perpetuate high
business performance, thus the result of H2 should also be interpreted with caution.
5.6.3 Hypothesis 3
Marketing and strategic alliance management competencies have been cited as critical to
the success of biotechnology companies (Hourd and Williams 2008; Yim and Weston 2007).
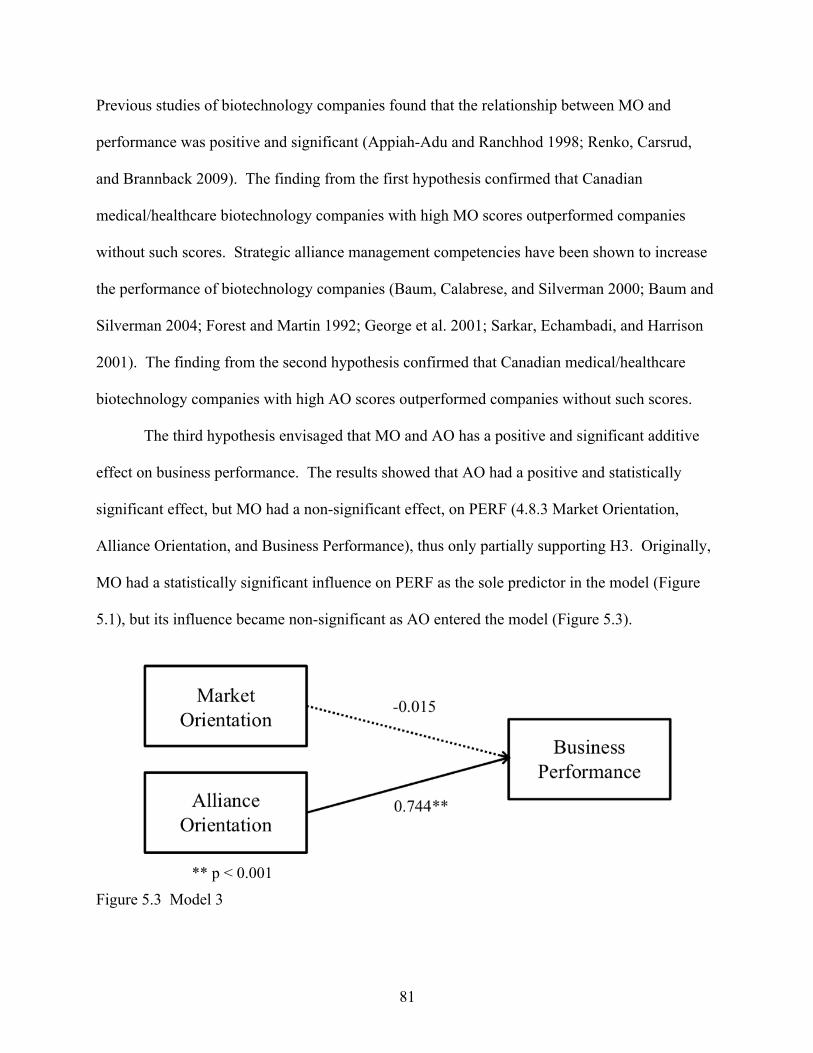
81
Previous studies of biotechnology companies found that the relationship between MO and
performance was positive and significant (Appiah-Adu and Ranchhod 1998; Renko, Carsrud,
and Brannback 2009). The finding from the first hypothesis confirmed that Canadian
medical/healthcare biotechnology companies with high MO scores outperformed companies
without such scores. Strategic alliance management competencies have been shown to increase
the performance of biotechnology companies (Baum, Calabrese, and Silverman 2000; Baum and
Silverman 2004; Forest and Martin 1992; George et al. 2001; Sarkar, Echambadi, and Harrison
2001). The finding from the second hypothesis confirmed that Canadian medical/healthcare
biotechnology companies with high AO scores outperformed companies without such scores.
The third hypothesis envisaged that MO and AO has a positive and significant additive
effect on business performance. The results showed that AO had a positive and statistically
significant effect, but MO had a non-significant effect, on PERF (4.8.3 Market Orientation,
Alliance Orientation, and Business Performance), thus only partially supporting H3. Originally,
MO had a statistically significant influence on PERF as the sole predictor in the model (Figure
5.1), but its influence became non-significant as AO entered the model (Figure 5.3).
** p < 0.001
Figure 5.3 Model 3
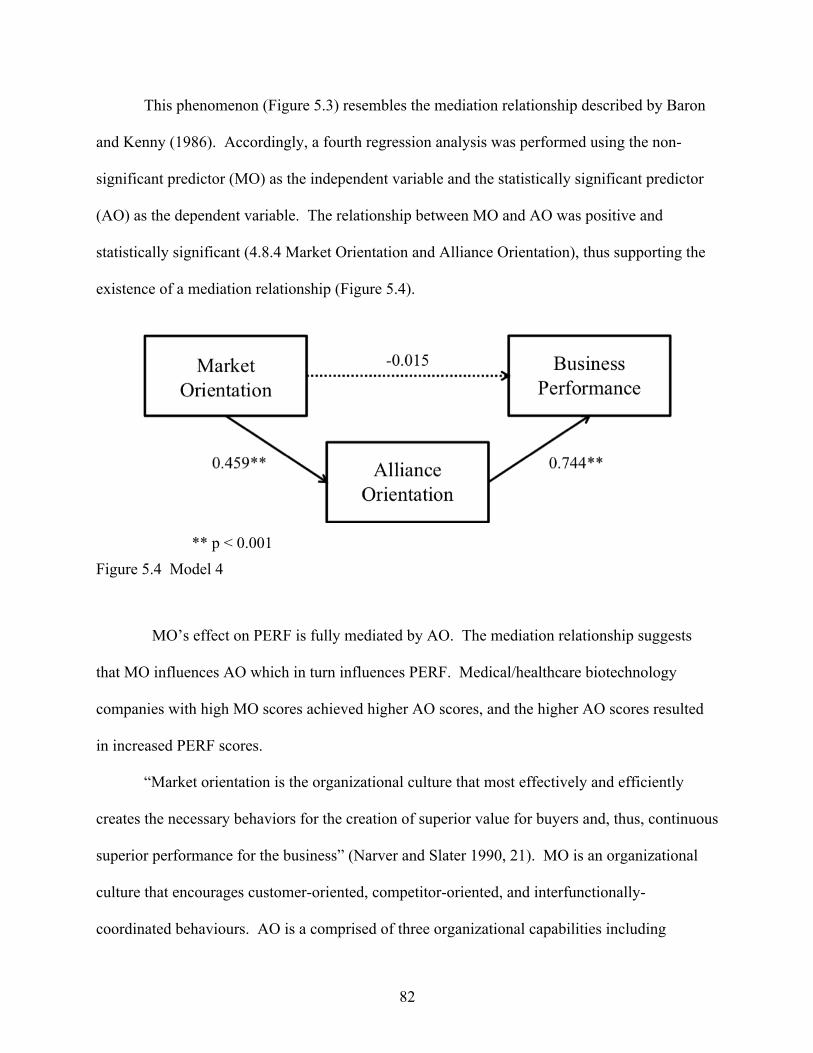
82
This phenomenon (Figure 5.3) resembles the mediation relationship described by Baron
and Kenny (1986). Accordingly, a fourth regression analysis was performed using the non-
significant predictor (MO) as the independent variable and the statistically significant predictor
(AO) as the dependent variable. The relationship between MO and AO was positive and
statistically significant (4.8.4 Market Orientation and Alliance Orientation), thus supporting the
existence of a mediation relationship (Figure 5.4).
** p < 0.001
Figure 5.4 Model 4
MO’s effect on PERF is fully mediated by AO. The mediation relationship suggests
that MO influences AO which in turn influences PERF. Medical/healthcare biotechnology
companies with high MO scores achieved higher AO scores, and the higher AO scores resulted
in increased PERF scores.
“Market orientation is the organizational culture that most effectively and efficiently
creates the necessary behaviors for the creation of superior value for buyers and, thus, continuous
superior performance for the business” (Narver and Slater 1990, 21). MO is an organizational
culture that encourages customer-oriented, competitor-oriented, and interfunctionally-
coordinated behaviours. AO is a comprised of three organizational capabilities including
83
alliance scanning, alliance coordination, and alliance learning (Kandermir, Yaprak, and Cavusgil
2006). “Alliance orientation will be strong when a firm possesses higher degrees of each of
these capabilities and is able to skillfully configure and deploy them” (Kandermir, Yaprak, and
Cavusgil 2006, 326). In the case of Canadian medical/healthcare biotechnology companies,
perhaps MO is the foundation and AO is the vehicle for increasing PERF. Consequently,
companies that encourage organizational behaviours including customer orientation, competitor
orientation, and interfuctional coordination may be better equipped to engage in alliance
scanning, alliance coordination, and alliance learning activities. Ultimately, it is the successful
execution of these alliance activities that appears to increase business performance.
The Canadian medical/healthcare biotechnology industry has embraced Narver and
Slater’s (1990) market-oriented organizational culture, as companies in the industry understand
their target markets and customers, recognize their competitors’ strengths and weaknesses, and
disseminate knowledge throughout their departments. Having this market-oriented
organizational culture is necessary for, but does not directly influence, performance. Canadian
medical/healthcare companies have adopted Kandermir, Yaprak, and Cavusgil’s (2006) alliance-
oriented organizational capabilities, as companies actively scan for new alliance partners,
effectively manage existing alliances, and learn from its partners. The alliance management
organizational capabilities act as catalyst that enable the realization of the full benefits of a
market-oriented organizational culture.
5.6.4 Post-Hoc Analyses
Overall, the findings from the post-hoc regression analyses that included control variables
were similar to the previous findings from the regression analyses that did not include control
variables. Therefore, the findings from the post-hoc regression analyses supported the notion
that MO is fully mediated by AO in its relationship with PERF. Ultimately, a sequential

84
relationship exists among MO, AO, and PERF, as a business’ philosophy needs to be established
prior to its undertaking of activities, and the execution of those practices, grounded in the
organizational philosophy, perpetuates business performance.
85
CHAPTER 6 LIMITATIONS
The first limitation of this study was the response rate. Although this study compared
favourably to similar studies in terms of the number of responses received (N = 81), the response
rate was comparatively lower (20.6%). Appiah-Adu and Ranchhod (1998) received a response
rate of 58.5 percent (62/106) and Renko, Carsrud, and Brannback received a response rate of
44.3 percent (85/192). Although De Luca, Veona, and Vicari (2010) reported a response rate of
53.4 percent, they actually received a response rate of 42.9 percent (70/163). Low response rates
can give rise to issues related to biases, power, and generalizability. In the absence of a non-
responder questionnaire, non-response bias was tested by comparing key constructs (MO, AO,
and PERF) among early and late responders. Results showed no differences in the mean MO,
AO, and PERF scores, thus not supporting the existence of a non-response bias. However, these
post-hoc tests only provide support to move forward with other analyses and do not remedy the
issue at large (Zhang 2008). Despite this study’s low response rate, all regression analyses
achieved acceptable power (1-β ≥ 0.80). However, the fact remains that a large number of
Canadian medical/healthcare companies did not respond to the questionnaire, limiting the
generalizability of the findings.
The timing of the study may have negatively impacted the response rate. Specifically,
data collection was conducted over the summer months, beginning in late May and ending in late
August. It is possible that some executives were on holiday during the time of data collection.
Accounting for this assumption, the first measure taken to increase the response rate was to
extend data collection beyond the conventional time frame. Contacting BIOTECanada, the
Canadian national biotechnology association, for an endorsement was the second measure taken
in an attempt to increase the response rate. Obtaining an endorsement from an organization or
86
individual that is apart of executives’ social networks has been shown to increase response rates
(Bednar and Westphal 2006; Bartholomew and Smith 2006; Cycyota and Harrison 2006;
Rochford and Venable 1995). The inability to secure an endorsement from BIOTECanada may
have negatively impacted the response rate. However, it became apparent that securing an
endorsement from BIOTECanada is beyond the control of any researcher. BIOTECanada’s
organizational policies prohibit it from officially supporting any study that itself does not
commission. Collaboration with UQAM was the third measure taken to increase the response
rate. As discussed, UQAM’s support was sought to help legitimize the study within the French-
speaking business community. The final measure taken to increase the response rate was the
employment of a multi-modal study, giving respondents two completion options. While only 20
online responses were received, neglecting to employ a multi-modal study could have resulted in
fewer responses. Despite the measures taken, the response rate is still of concern and a
fundamental limitation of the study.
The next limitation was a result of the multi-modal approach. Specifically, employing a
multi-modal survey can introduce additional biases. Formerly, it was cautioned that Internet
users and non-users were distinctly different and that data received online may be biased toward
technologically savvy respondents (Ilieva, Baron, and Healey 2002). In recent years due to the
growth in the number of Internet users, this problem has lessened (Ilieva, Baron, and Healey
2002). Additionally, seeing as this study was conducted in an industry that is at the forefront of
technological innovation, the issue is of even less concern. Nevertheless, key constructs (MO,
AO, and PERF) among mail and online responders were compared, resulting in no statistically
significant differences in mean scores. Although these post-hoc tests enable researchers to
87
perform further analyses, they do not resolve issues (Zhang 2008). Thus, the issue of biases
related to the multi-modal approach remains a limitation of the study.
Another limitation of this study is the single-respondent approach, as one respondent per
company answered questions related to marketing, alliance management, and performance. It
has been shown that senior-level managers have been more reliable than other employees when it
comes to providing organizational information (Phillips 1981). In an attempt to reduce the
single-respondent bias, CEOs were asked to complete the questionnaires. Notwithstanding, the
single-respondent bias still remains a limitation of this study.
The final limitation of the study is the scope and nature of the investigation. This study
investigated the importance of marketing and strategic alliances in determining business
performance, a topic that was salient to the researcher. The hypothesized antecedents were
generated from literature and guided by the researcher’s knowledge and interests. Although the
genesis of most inquiries is a result of a researcher’s interest, it is important to note the
researcher’s influence.
88
CHAPTER 7 CONCLUSION & FUTURE DIRECTIONS
Empirical data from this study lends support for the importance of market and alliance
orientation in determining Canadian medical/healthcare biotechnology companies’ performance.
The relationship between MO and PERF was positive and statistically significant, suggesting
MO was an antecedent to PERF. The relationship between AO and PERF was also positive and
statistically significant, suggesting that AO was an antecedent to PERF. When MO and AO
were examined together, MO became non-significant, while AO remained a statistically
significant predictor of PERF. This phenomenon prompted further analyses that examined the
relationship between MO and AO. The relationship between MO and AO was positive and
statistically significant, supporting the existence of a mediation relationship. Specifically, MO’s
influence on PERF was found to be fully mediated by AO. In post-hoc analyses, that included
the aforementioned control variables, these regression analyses were repeated. The post-hoc
regression results supported the notion that MO’s influence on PERF was fully mediated by AO.
Due to the slight increase in R2, as a result of the inclusion of the control variables, future
research could investigate these control variables with a more robust sample size.
The findings from the first set of additional analyses provided no evidence to suggest MO
or AO scores differed based on the response language. However, it was found that PERF scores
differed based on response language. The second set of additional analyses provided no
evidence to suggest MO, AO, or PERF differed based on completion method. The findings from
the third set of additional analyses provided no evidence to suggest MO, AO, or PERF scores
differed based on companies’ geographical locations. The results from the fourth set of
additional analyses indicated that the number of association memberships companies held did not
influence their MO, AO, or PERF scores. The results of the fifth set of additional analyses
89
suggested that privately owned companies were more market-oriented than publicly traded
companies. The results of the sixth set of additional analyses provided no evidence to suggest
that companies’ MO, AO, or PERF scores differed based on the educational backgrounds of their
CEOs. The results of the seventh set of additional analyses suggested that the age of companies
did not influence their MO or AO scores. However, it was found that the age of companies had a
negative statistically significant effect on PERF. The findings from the final set of additional
analyses provided no evidence to suggest MO, AO, or PERF scores differed based companies’
size.
The findings from this study have several implications for biotechnology entrepreneurs
and managers. First, the results provide evidence that behavioural orientations toward
customers, competitors, and business units are the foundation needed to increase business
performance. The findings also indicate that managers should pay particular attention to alliance
scanning, coordinating, and learning, as these activities enable business performance. Third,
managers should understand the sequential relationship between the market-oriented behavioural
commitments, alliance-oriented activities, and business performance outcomes, as it can aid in
business development. For instance, the sequential relationship between these behaviours,
activities, and outcomes can act as a theoretical pathway to increase performance. Companies
that were highly market-oriented were also highly alliance-oriented, and highly alliance-oriented
companies were top performing companies. The apparent sequential relationship is not the only
commercialization pathway, nor does it explain all of the behaviours and activities needed to be
commercially successful, but it is important for managers and entrepreneurs to be mindful of its
significance. Finally, results provided no evidence to suggest that companies’ MO, AO, or
PERF scores differed based on the educational backgrounds of their CEOs. It was deduced that
90
CEOs with specific skill sets likely surround themselves with individuals with complementary
competencies. This delineates the final managerial implication that managers and entrepreneurs
should surround themselves with individuals who have complementary experience, knowledge,
and skills.
These findings produced several contributions to marketing and management academic
research. First, Narver and Slater’s (1990) MO instrument proved to be successful with an
unstudied population. The instrument’s success in the Canadian medical/healthcare
biotechnology industry contributed to a large body of research that confirms MO positively
influences performance. Second, this was the first known study to comprehensively measure
strategic alliance management activities in the biotechnology industry. This study employed the
underutilized Kandermir, Yaprak, and Cavusgil (2006) AO instrument, thereby expanding AO
research and the use of the instrument. Moreover, the findings contribute to a large body of
research that suggests strategic alliance management positively influences biotechnology
performance. Third, this study goes beyond confirming MO and AO’s importance in the
relationship with PERF, as the existence of a mediation relationship was tested and confirmed.
Fourth, and perhaps the most significant contribution was the development and successful use of
the PERF instrument. The PERF instrument proved to be an effective instrument when
measuring biotechnology business performance. Finally, the findings expand the scope of
biotechnology marketing and strategic alliance management research. It may be fruitful to
explore MO in other biotechnology subsectors, expand the use of the AO instrument in other
industries and cultural contexts, utilize the newly developed and successful PERF instrument to
measure biotechnology performance in other subsectors and cultural contexts, and investigate the
influence of other possible antecedents to biotechnology business performance.
91
REFERENCES
Ag-West Bio (2013). “Ag-West Bio Membership,” available at http://www.event-wizard.com/agwestmembership/0/welcome/ (accessed March 26, 2013).
Allison, Paul D. (2002), Missing Data, Thousand Oaks, CA: Sage Publications, Inc.
American Marketing Association (2007), "AMA Definition of Marketing," available at http://www.marketingpower.com/Community/ARC/Pages/Additional/Definition/default.aspx (accessed February 25, 2012).
Appiah-Adu, Kwaku (1998), "Market Orientation and Performance: Empirical Tests in A Transition Economy," Journal of Strategic Marketing, 6 (1), 25-45.
Appiah-Adu, Kwaku and Ashok Ranchhod (1998), "Market Orientation and Performance in the Biotechnology Industry: An Exploratory Empirical Analysis," Technology Analysis & Strategic Management, 10 (2), 197-210.
Armstrong, J. Scott, Terry S. Overton (1977), "Estimating Nonresponse Bias in Mail Surveys," Journal of Marketing, 14 (3), 396-402.
Bagchi-Sen, Sharmistha, Helen Lawton Smith, and Linda Hall (2004), "The US Biotechnology Industry: Industry Dynamics and Policy," Environment and Planning: Part C - Government and Policy, 22 (2), 199-216.
Baron, Reuben M., David A. Kenny (1986), "The Moderator-Mediator Variable Distinction in Social Psychological Research: Conceptual, Strategic, and Statistical Considerations," Journal of Personality and Social Psychology, 51 (6), 1173-1182.
Barrett, Hilton, Art Weinstein (1998), "The Effect of Market Orientation and Organizational Flexibility on Corporate Entrepreneurship," Entrepreneurship: Theory and Practice, 23 (1), 57-70.
Bartholomew, Susan, Anne D. Smith (2006), "Improving Survey Response Rates from Chief Executive Officers in Small Firms: The Importance of Social Networks," Entrepreneurship Theory and Practice, (1), 83-96.
Battelle Technology Partnership Practice. (2010), Biotechnology Industry Organization: State Bioscience Initiatives, Columbus, OH: Battelle Memorial Institute.
Baum, Joel A. C., Tony Calabrese, and Brian S. Silverman (2000), "Don't Go It Alone: Alliance Network Composition and Startups' Performance in Canadian Biotechnology," Strategic Management Journal, 21 (3), 267-294.
92
Baum, Joel A. C., Brian S. Silverman (2004), "Picking Winners or Building Them? Alliance, Intellectual, and Human Capital as Selection Criteria in Venture Financing and Performance of Biotechnology Startups," Journal of Business Venturing, 19 (3), 411-436.
Bednar, Michael K., James D. Westphal (2006), "Surveying the Corporate Elite: Theoretical and Practical Guidance on Improving Response Rates and Response Quality in Top Management Survey Questionnaires," Research Methodology in Strategy and Management, 3 (1), 37-55.
Bhuian, Shahid N. (1998), "An Empirical Examination of Market Orientation in Saudi Arabian Manufacturing Companies," Journal of Business Research, 43 (1), 13-25.
Bhuian, Shahid N., Mohsin Habib (2004), "The Relationship Between Entrepreneurship, Market Orientation and Performance: A Test in Saudi Arabia," Journal of Transnational Management, 10 (1), 79-98.
BioAlberta (2013), “BioAlberta Membership Fee Structure,” available at http://www.bioalberta.com/members/members-fee-structure (accessed March 26, 2013).
BioNova (2013), “Join BioNova,” available at http://bionova.ca/join-bionova/ (accessed
March 26, 2013). BIOTECanada (2013), “Membership Form,” available at
http://www.biotech.ca/uploads/biotecanadamembership2013.pdf (accessed March 26, 2013).
BIOTECanada (2011a), "BIOTECanada: Facts and Figures," available at
http://www.biotech.ca/en/what-biotech-is/facts-figures.aspx (accessed August 10, 2011).
BIOTECanada (2011b), Biotechnology Innovation: A Submission to the House of Commons Standing Committee on Finance to Create Sustainable Long-Term Economic Growth in Canada, Ottawa, ON: BIOTECanada.
BIOTECanada (2011c), "National Biotech Accord," available at http://www.biotech.ca/en/who-we-are/national-biotech-accord.aspx (accessed November 26, 2012).
Biotechnology Europe (2012a), "Biotechnology Europe: Finland," available at http://www.biotechnology-europe.com/Finland.htm (accessed April 23, 2012).
Biotechnology Europe (2012b), "Biotechnology Europe: Sweden," available at http://www.biotechnology-europe.com/Sweden.htm (accessed April 23, 2012).
93
Cadogan, John W., Charles C. Cui, and Erik K. Y. Li (2003), "Export Market-Oriented Behavior and Export Performance: The Moderating Roles of Competitive Intensity and Technological Turbulence," International Marketing Review, 20 (5), 493-513.
Cadogan, John W., Adamantios Diamantopoulos, and Judy A. Siguaw (2002), "Export Market-Oriented Activities: Their Antecedents and Performance Consequences," Journal of International Business Studies, 33 (3), 615-626.
Canada’s Venture Capital & Private Equity Association. (2012), Venture Capital Investment Activity by Sector in 2011, Toronto, ON: Canada’s Venture Capital & Private Equity Association.
Canadian Life Sciences Database (2012), "Canadian Life Sciences Database," available at http://www.canadianlifesciences.com/ca/db/index.php (accessed December 29, 2011).
Cano, Cynthia Rodriguez, Francois A. Carrillat, and Fernando Jaramillo (2004), "A Meta-Analysis of the Relationship Between Market Orientation and Business Performance: Evidence from Five Continents," International Journal of Research in Marketing, 21 (2), 179-200.
Carless, Sally A. (2012), "Discriminant Validity: SAGE Research Methods," available at http://srmo.sagepub.com.cyber.usask.ca/view/the-sage-encyclopedia-of-social-science-research-methods/n248.xml?rskey=hJ86Ea&row=2 (accessed November 10, 2012).
Cohen, Jacob (1988), Statistical Power Analysis for the Behavioral Sciences, New York, NY: Academic Press.
Conference Board of Canada (2005), "Conference Board of Canada: Biotechnology in Canada - A Technology Platform for Growth" available at http://www.conferenceboard.ca/documents.aspx?did=1452 (accessed August 10, 2011).
Costa, Carla, Margarida Fontes, and Manuel V. Heitor (2004), "A Methodological Approach to the Marketing Process in the Biotechnology-Based Companies," Industrial Marketing Management, 33 (5), 403-418.
Cumby, Judy, Joan Conrod (2001), "Non-Financial Performance Measures in the Canadian Biotechnology Industry," Journal of Intellectual Capital, 2 (3), 261-272.
Cycyota, Cynthia S., David A. Harrison (2006), "What (Not) to Expect When Surveying Executives: A Meta-Analysis of Top Manager Response Rates and Techniques Over Time," Organizational Research Methods, 9 (2), 133-160.
Datamonitor (2012a), Industry Profile: Pharmaceuticals in Canada, New York, NY: Datamonitor USA.
94
Datamonitor (2012b), Industry Profile: Pharmaceuticals in Sweden, New York, NY: Datamonitor USA.
Datamonitor (2011a), Industry Profile: Biotechnology in the United States, New York, NY: Datamonitor USA.
Datamonitor (2011b), Industry Profile: Biotechnology in Canada, New York, NY: Datamonitor USA.
Datamonitor (2011c), Industry Profile: Biotechnology in Europe, New York, NY: Datamonitor USA.
Datamonitor. (2011d), Industry Profile: Global Biotechnology, Datamonitor USA.
Datamonitor. (2011e), Industry Profile: Pharmaceuticals in the United States, New York, NY: Datamonitor USA.
Dawes, John (2000), "Market Orientation and Company Profitability: Further Evidence Incorporating Longitudinal Data," Australian Journal of Management, 25 (2), 173-199.
De Luca, Luigi M., Gianmario Verona, and Salvio Vicari (2010), "Market Orientation and R&D Effectiveness in High-Technology Firms: An Empirical Investigation in the Biotechnology Industry," Journal of Product Innovation Management, 27 (3), 299-320.
Deng, Shengliang, Jack Dart (1994), "Measuring Marketing Orientation: A Multi-Factor, Multi-Item Approach," Journal of Marketing Management, 10 (8), 725-742.
Dess, Gregory G., Richard B. Robinson (1984), "Measuring Organizational Performance in the Absence of Objective Measures: The Case of the Privately Held Firm and Conglomerate Business Unit," Strategic Management Journal, 5 (3), 265-273.
Diamantopoulos, Adamantios, Susan Hart (1993), "Linking Market Orientation and Company Performance: Preliminary Evidence on Jaworski and Kohli’s Framework," Journal of Strategic Marketing, 1 (2), 93-121.
Dillman, Don A. (2000), Mail and Internet Surveys: The Tailored Design Method, New York, NY: John Wiley & Sons Inc.
Dillman, Don A. (1978), Mail and Telephone Surveys: The Total Design Method, New York, NY: John Wiley & Sons Inc.
Drucker, Peter F. (1954), The Practice of Management, New York, NY: Perennial Library.
95
Efendioglu, Alev M. (2005), "Bay Area (California, USA) and Hsinchu (Taiwan) Biotech Clusters: A Comparative Analysis," Journal of Asia-Pacific Business, 6 (4), 45-60.
Elmuti, Dean, Michael Abebe, and Marco Nicolosi (2005), "An Overview of Strategic Alliances Between Universities and Corporations," Journal of Workplace Learning, 17 (1/2), 115-129.
Erdfelder, Edgar, Franz Faul, and Axel Buchner (1996), "GPOWER: A General Power Analysis Program," Behavior Research Methods, Instruments, & Computers, 28 (1), 1-11.
Eriksson, Paivi, Heidi Rajamaki (2010), "Biotechnology Marketing: Insider and Outsider Views," Journal of Commercial Biotechnology, 16 (2), 98-108.
Ernst & Young (2011), Beyond Borders: Global Biotechnology Report 2011, London, UK: Ernst & Young.
Farrell, Mark A. (2002), "A Critique of the Development of Alternative Measures of Market Orientation," Marketing Bulletin, 13 (3), 1-14.
Farrell, Mark A., Edward Oczkowski (1997), "An Analysis of the MKTOR and MARKOR Measures of Market Orientation: An Australian Perspective," Marketing Bulletin, 8 (3), 30-40.
Folta, Timmothy B., Arnold C. Cooper, and Yoon-Suk Baik (2006), "Geographic Cluster Size and Firm Performance," Journal of Business Venturing, 21 (1), 217-242.
Forest, Janet E., M. J. C. Martin (1992), "Strategic Alliances Between Large and Small Research Intensive Organizations: Experiences in the Biotechnology Industry," R&D Management, 22 (1), 41-54.
Gauzente, Claire (1999), "Comparing Market Orientation Scales: A Content Analysis," Marketing Bulletin, 10 (4), 76-82.
George, Darren and Paul Mallery (2009), SPSS for Windows Step by Step: A Simple Guide and Reference, 17.0 Update, Boston, MA: Allyn & Bacon.
George, Gerard, Shaker A. Zahra, Kathleen K. Wheatley, and Raihan Khan (2001), "The Effects of Alliance Portfolio Characteristics and Absorptive Capacity on Performance A Study of Biotechnology Firms," Journal of High Technology Management Research, 12 (2), 205-226.
George, Gerard, Shaker A. Zahra, and D. Robley Wood (2002), "The Effects of Business-University Alliances on Innovative Output and Financial Performance: A Study of Publicly Traded Biotechnology Companies," Journal of Business Venturing, 17 (6), 577-609.
96
Government of Canada (2012), "Foreign Credentials Referral Office: Biotechnology," available at http://www.credentials.gc.ca/immigrants/factsheets/biotechnology.asp (accessed November 26, 2012).
Government of Canada (2011), "Government of Canada: Biotechnology," available at available at http://investincanada.gc.ca/eng/industry-sectors/biotechnology.aspx (accessed August 10, 2011).
Greenley, Gordon E. (1995), "Market Orientation and Company Performance: Empirical Evidence From UK Companies," British Journal of Management, 6 (1), 1-13.
Gulati, Ranjay (1998), "Alliances and Networks," Strategic Management Journal, 19 (4), 293-317.
Hagedoorn, John, Geert Duysters (2002), "External Sources of Innovative Capabilities: The Preferences for Strategic Alliances or Mergers and Acquisitions," Journal of Management Studies, 39 (2), 167-188.
Han, Jin K., Namwoon Kim, and Rajendra K. Srivastava (1998), "Market Orientation and Organizational Performance: Is Innovation A Missing Link?" Journal of Marketing, 62 (4), 30-45.
Harris, Lloyd C. (2001), "Market Orientation and Performance: Objective and Subjective Empirical Evidence From UK Companies," Journal of Management Studies, 38 (1), 17-43.
Heslop, Louise, Pamela Qu (2007), "Market Orientation: Its Measurement and Role in Canadian Manufacturing and Telecommunication Firms," ASAC 2007.
Hourd, Paul C., David J. Williams (2008), "Results from an Exploratory Study to Identify the Factors that Contribute to Success for UK Medical Device Small- and Medium-Sized Enterprises," Proceedings of the Institution of Mechanical Engineers, Part H: Journal of Engineering Medicine, 222 (5), 717-735.
Ilieva, Janet, Steve Baron, and Nigel M. Healey (2002), "Online Surveys in Marketing Research: Pros and Cons," The Journal of the Market Research Society, 44 (3), 361-376.
Industry Canada (2012), "Company Directories by Industrial Sector," available at http://www.ic.gc.ca/app/ccc/srch/cccSrch.do?lang=eng&profileId=1425&prtl=1&sbprtl=&naics=5417&x=71&y=26 (accessed February 28, 2012).
Industry Canada (2011a), "Establishments Goods-Producing Industries (NAICS 11-33)," available at http://www.ic.gc.ca/eic/site/cis-sic.nsf/eng/h_00015.html (accessed September 10, 2012).
97
Industry Canada (2011b), "Industry Canada: Life Sciences Gateway - Canada’s Biotechnology Industry," available at http://www.ic.gc.ca/eic/site/lsg-pdsv.nsf/eng/h_hn00079.html (accessed August 10, 2011).
Jaworski, Bernard J., Ajay K. Kohli (1993), "Market Orientation: Antecedents and Consequences," Journal of Marketing, 57 (3), 53-70.
Kandermir, Destan, Attila Yaprak, and S. Tamer Cavusgil (2006), "Alliance Orientation: Conceptualization, Measurement, and Impact on Market Performance," Journal of the Academy of Marketing Science, 34 (3), 324-340.
Kara, Ali, John E. Spillan, and Oscar DeShields (2005), "The Effect of a Market Orientation on Business Performance: A Study of Small-Sized Service Retailers Using MARKOR Scale," Journal of Small Business Management, 43 (2), 105-118.
Kermani, Faiz, Rebecca Gittins (2004), "Where Will Industry Go To For Its High-Caliber Staff?”," Journal of Commercial Biotechnology, 11 (1), 63-71.
Kline, Rex B. (2005), Principles and Practices of Structural Equation Modelling, New York, NY: Gulford Publications.
Kohli, Ajay K., Bernard J. Jaworski (1990), "Market Orientation: The Construct, Research Propositions, and Managerial Implications," Journal of Marketing, 54 (2), 1-18.
Kohli, Ajay K., Bernard J. Jaworski, and Ajith Kumar (1993), "MARKOR: A Measure of Market Orientation," Journal of Marketing Research, 30 (4), 467-477.
Kwak, Nojin, Barry Radler (2002), "A Comparison Between Mail and Web Surveys: Response Pattern, Respondent Profile, and Data Quality," Journal of Official Statistics, 18 (2), 257-273.
Lazzarotti, Valentina, Raffaella Manzini, and Luca Mari (2011), "A Model of R&D Performance Measurement," International Journal of Production Economics, 134 (1), 121-223.
Levitte, Yael M., Sharmistha Bagchi-Sen (2010), "Demographics, Innovative Outputs and Alliance Strategies of Canadian Biotech Firms," European Planning Studies, 18 (5), 669-690.
Life Sciences Association of Manitoba (2012), "Links & Supporters," available at http://www.lsam.ca/supporters (accessed November/26 2012).
Life Sciences British Columbia (2012), “Membership Fees,” available at http://www.lifesciencesbc.ca/members/membership-fees/ (accessed March 26, 2013).
98
Lukas, Bryan A., O. C. Ferrell (2000), "The Effect of Market Orientation on Product Innovation," Journal of the Academy of Marketing Science, 28 (2), 239-247.
Matsuno, Ken, John T. Mentzer (2000), "The Effects of Strategy Type on the Market Orientation-Performance Relationship," Journal of Marketing, 64 (4), 1-16.
McCarty, Edmond J. (1960), Basic Marketing: A Managerial Approach, Homewood, IL: Richard D. Irwin.
McCutchen, William W., Paul M. Swamidass (2004), "Motivations for Strategic Alliances in the Pharmaceutical/Biotech Industry: Some New Findings," Journal of High Technology Management Research, 15 (2), 197-214.
McMillan, G. Steven, Patrick Thomas (2005), "Financial Success in Biotechnology: Company Age Versus Company Science," Technovation, 25 (5), 463-468.
Narver, John C., Stanley F. Slater (1990), "The Effect of a Market Orientation on Business Profitability," Journal of Marketing, 54 (4), 20-35.
Newfoundland and Labrador Association of Technology Industries (2013), “Membership,” available from http://www.nati.net/membership/apply-to-be-a-member-of-nati.aspx (accessed March 26, 2013)
Noble, Charles H., Rajiv K. Sinha, and Ajith Kumar (2002), "Market Orientation and
Alternative Strategic Orientations: A Longitudinal Assessment of Performance Implications," Journal of Marketing, 66 (4), 25-39.
North American Industry Classification System (2007), "North American Industry Classification System: Research and Development in Biotechnology" available at http://www.naics.com/censusfiles/ND541711.HTM (accessed January 31, 2012).
Nunnally, Jum C. (1978), Psychometric Theory New York, NY: McGraw-Hill Publishing Company.
Organisation for Economic Co-operation and Development (2011), "Organisation for Economic Co-operation and Development: Biotechnology Statistics – United States," available at http://www.oecd.org/document/36/0,3746,fr_2649_34537_2674020_1_1_1_1,00.html (accessed August/19 2011).
Parkhe, Arvind (1993), "Strategic Alliance Structuring: A Game Theoretic and Transaction Cost Examination of Interftrm Cooperation," Academy of Management Journal, 36 (4), 794-829.
Patzelt, Holger (2010), "CEO Human Capital, Top Management Teams, and the Acquisition of Venture Capital in New Technology Ventures: An Empirical Analysis," Journal of Engineering and Technology Management, 27 (3-4), 131-147.
99
Pelham, A. M. (1993), "Mediating and Moderating Influences on the Relationship Between Market Orientation and Performance," Doctoral Dissertation, Pennsylvania State University .
Perry, Monica L., T. Shao (2002), "Market Orientation and Incumbent Performance in Dynamic Market," European Journal of Marketing, 36 (9/10), 1140-1153.
Phillips, Lynn W. (1981), "Assessing Measurement Error in Key Informant Reports: A Methodological Note on Organizational Analysis in Marketing," Journal of Marketing Research, 18 (4), 395-415.
Pulendran, Sue, Richard Speed, and Robert E. Widing (2000), "The Antecedents and Consequences of Market Orientation in Australia," Australian Journal of Management, 25 (2), 119-143.
Rajamaki, Heidi (2008), "Anticipating and Managing the Challenges of Biotechnology Marketing," Journal of Commercial Biotechnology, 14 (3), 225-231.
Renko, Maija, Alan L. Carsrud, and Malin Brannback (2009), "The Effect of Market Orientation, Entrepreneurial Orientation, and Technological Capability on Innovativeness: A Study of Young Biotechnology Ventures in the United States and Scandinavia," Journal of Small Business Management, 7 (3), 331-369.
Renko, Maija, Alan L. Carsrud, and Malin Brannback (2008), "The Living Dead – Why They Turned Out That Way?" Babson College Entrepreneurship Research Conference (BCERC) 2008: Frontiers Entrepreneurship Research, 1-15.
Renko, Maija, Alan L. Carsrud, Malin Brannback, and Juho Jalkanen (2005), "Building Market Orientation in Biotechnology SMEs: Balancing Scientific Advances and Market Demands," International Journal of Biotechnology, 7 (4), 250-268.
Robinson, Richard B., John A. Pearce (1988), "Planned Patterns of Strategic Behavior and their Relationship to Business-Unit Performance," Strategic Management Journal, 9 (1), 43-60.
Rochford, Linda, Carol F. Venable (1995), "Surveying a Targeted Population Segment: The Effects of Endorsement on Mail Questionnaire Response Rate," Journal of Marketing Theory and Practice, 3 (2), 86-97.
Rose, Gregory M., Aviv Shoham (2002), "Export Performance and Market Orientation: Establishing an Empirical Link," Journal of Business Research, 55 (3), 217-225.
SAGE Research Methods (2012a), "Dictionary of Statistics & Methodology: Exploratory Factor Analysis," available at http://srmo.sagepub.com/view/dictionary-of-statistics-methodology/n700.xml?rskey=Ca9mfN&row=1 (accessed January 24, 2013).
100
SAGE Research Methods (2012b), "Encyclopedia of Survey Research Methods: Cronbach's Alpha," available at http://srmo.sagepub.com.cyber.usask.ca/view/encyclopedia-of-survey-research-methods/n117.xml?rskey=7sGlVF&row=2 (accessed November/27 2012).
SAGE Research Methods (2011), "Encyclopedia of Survey Research Methods: Total Design Method (TDM)," available at http://srmo.sagepub.com.cyber.usask.ca/view/encyclopedia-of-survey-research-methods/n584.xml?rskey=4XX6iI&row=1 (accessed March/14 2012).
Sargeant, A., M. Mohamad (1999), "Business Performance in the UK Hotel Sector – Does it Pay to be Market Oriented," The Services Industries Journal, 19 (3), 42-59.
Sarkar, M. B., Raj Echambadi, and Jeffrey S. Harrison (2001), "Alliance Entrepreneurship and Firm Market Performance," Strategic Management Journal, 22 (6/7), 701-711.
Silverman, Brain S., Joel A. C. Baum (2002), "Alliance-Based Competitive Dynamics," Academy of Management Journal, 45 (4), 791-806.
Simon, Francoise and Simon Kotler (2003), Building Global Biobrands: Taking Biotechnology to Market.
Slater, Stanley F., John C. Narver (1994), "Does Competitive Environment Moderate the Market Orientation–Performance Relationship?" Journal of Marketing, 58 (1), 46-55.
Standing, Susan, Craig Standing, and Chad Lin (2008), "A Framework for Managing Knowledge in Strategic Alliances in the Biotechnology Sector," Systems Research in Behavioral Science, 25 (6), 783-796.
Stuart, Toby E., Ha Hoang, and Ralph C. Hybels (1999), "Interorganizational Endorsements and the Performance of Entrepreneurial Ventures," Administrative Science Quarterly, 44 (2), 315-349.
Stuart, Toby E., Salih Zeki Ozdemir, and Waverly W. Ding (2007), "Vertical Alliance Networks: The Case of University-Biotechnology-Pharmaceutical Alliance Chains," Research Policy, 36 (4), 477-498.
Stuart, Toby E., Olav Sorenson (2003), "The Geography of Opportunity: Spatial Heterogeneity in Founding Rates and the Performance of Biotechnology Firms," Research Policy, 32 (2), 229-253.
Subramanian, Ram, Pradeep Gopalakrishna (2001), "The Market Orientation-Performance Relationship in the Context of A Developing Economy An Empirical Analysis," Journal of Business Research, 53 (1), 1-13.
101
Tay, Linda, Neil A. Morgan (2002), "Antecedents and Consequences of Market Orientation in Chartered Surveying Firms," Construction Management and Economics, 20 (4), 331-341.
Terziovski, Mile, John P. Morgan (2006), "Management Practices and Strategies to Accelerate the Innovation Cycle in the Biotechnology Industry," Technovation, 26 (5/6), 545-552.
Thirkell, Peter C., Ramadhani Dau (1998), "Export Performance: Success Determinants for New Zealand Manufacturing Exporters," European Journal of Marketing, 32 (9), 813-829.
Varadarajan, P. Rajan, Margaret H. Cunningham (1995), "Strategic Alliances: A Synthesis of Conceptual Foundations," Journal of the Academy of Marketing Science, 23 (4), 282-296.
Venkatraman, N., Vasudevan Ramanujam (1986), "Measurement of Business Performance in Strategy Research: A Comparison of Approaches," Academy of Management Review, 11 (4), 801-814.
Verspagen, Bart, Geert Duysters (2004), "The Small Worlds of Strategic Technology Alliances," Technovation, 24 (7), 563-571.
Woiceshyn, Jaana (1993), "Management - Key to New Product Development in Biotechnology," Long Range Planning, 26 (3), 67-76.
Woiceshyn, Jaana, Diana Hartel (1996), "Strategies and Performance of Canadian Biotechnology Firms: An Empirical Investigation," Technovation, 16 (5), 231-243.
Yim, Julian W., Rae Weston (2007), "The Characteristics of Bioentrepreneurs in the Australian Biotechnology Industry: A Pilot Study," Journal of Management and Organization, 13 (4), 383-406.
Zahra, Shaker A. (1996), "Technology Strategy and New Venture Performance: A Study of Corporate-Sponsored and Independent Biotechnology Ventures," Journal of Business Venturing, 11 (4), 289-321.
Zhang, David Di (2009), "Absorptive Capability and its Mediating Effect on the Learning and Market Orientations’ Influences on Performance," International Journal of Technology Marketing, 4 (2/3), 275-288.
Zhang, David Di (2008), "Integration of Market and Entrepreneurial Orientations," ProQuest Dissertations and Theses, 1-190.

102
APPENDIX A
Market Orientation, Alliance Orientation, and Business Performance in the Canadian Biotechnology Industry
Grant A. Wilson, 2012 ©
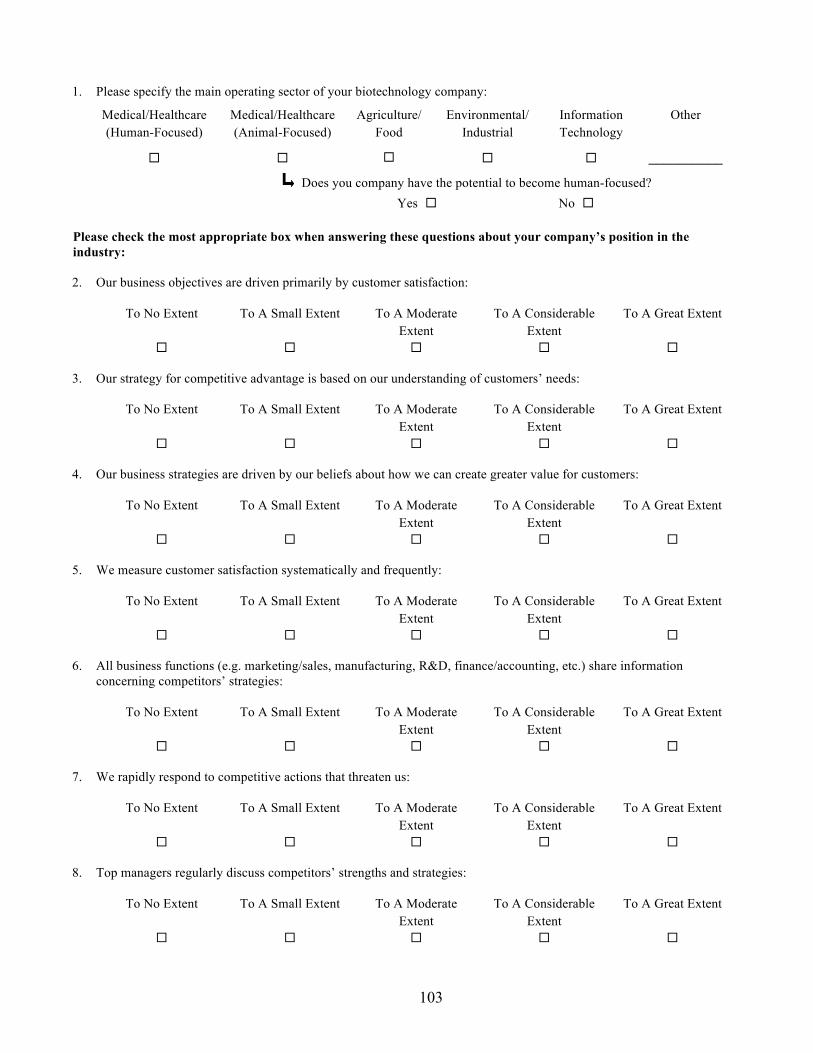
103
1. Please specify the main operating sector of your biotechnology company:
Medical/Healthcare (Human-Focused)
Medical/Healthcare (Animal-Focused)
Agriculture/ Food
Environmental/ Industrial
Information Technology
Other
__________
Does you company have the potential to become human-focused?
Please check the most appropriate box when answering these questions about your company’s position in the industry:
2. Our business objectives are driven primarily by customer satisfaction:
To No Extent To A Small Extent To A Moderate
Extent To A Considerable
Extent To A Great Extent
3. Our strategy for competitive advantage is based on our understanding of customers’ needs:
To No Extent To A Small Extent To A Moderate Extent
To A Considerable Extent
To A Great Extent
4. Our business strategies are driven by our beliefs about how we can create greater value for customers:
To No Extent To A Small Extent To A Moderate Extent
To A Considerable Extent
To A Great Extent
5. We measure customer satisfaction systematically and frequently:
To No Extent To A Small Extent To A Moderate Extent
To A Considerable Extent
To A Great Extent
6. All business functions (e.g. marketing/sales, manufacturing, R&D, finance/accounting, etc.) share information concerning competitors’ strategies:
To No Extent To A Small Extent To A Moderate Extent
To A Considerable Extent
To A Great Extent
7. We rapidly respond to competitive actions that threaten us:
To No Extent To A Small Extent To A Moderate Extent
To A Considerable Extent
To A Great Extent
8. Top managers regularly discuss competitors’ strengths and strategies:
To No Extent To A Small Extent To A Moderate Extent
To A Considerable Extent
To A Great Extent
Yes No
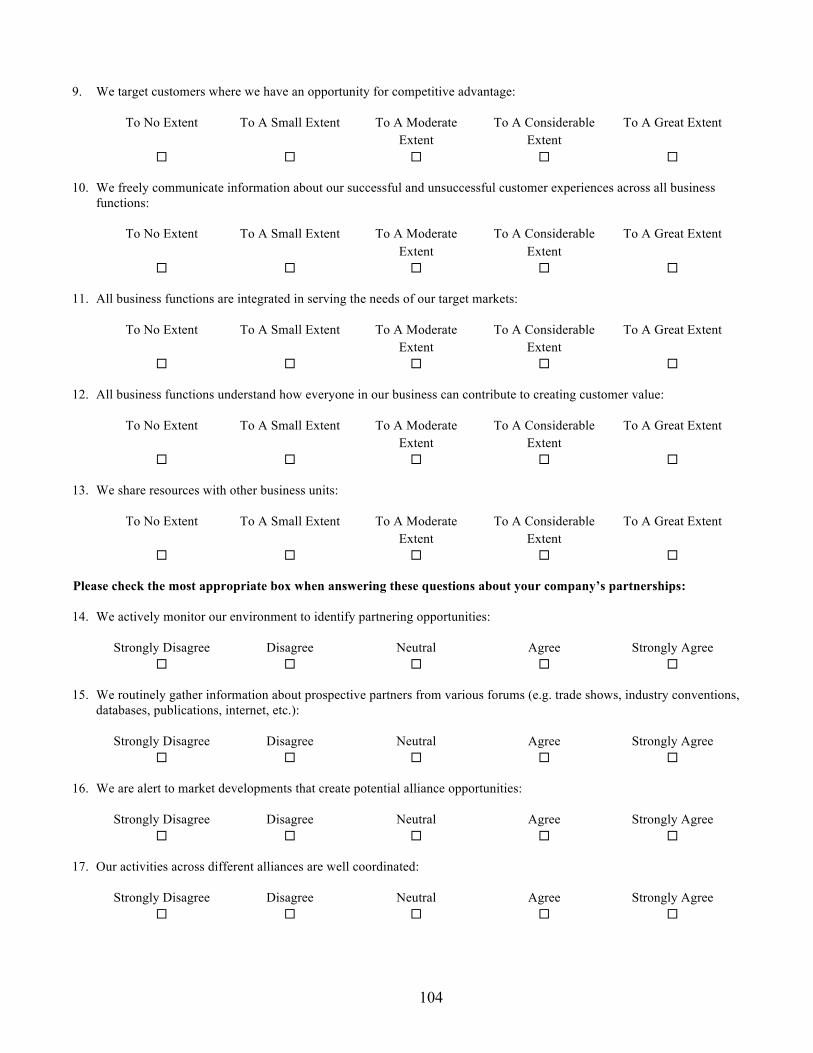
104
9. We target customers where we have an opportunity for competitive advantage:
To No Extent To A Small Extent To A Moderate Extent
To A Considerable Extent
To A Great Extent
10. We freely communicate information about our successful and unsuccessful customer experiences across all business functions:
To No Extent To A Small Extent To A Moderate Extent
To A Considerable Extent
To A Great Extent
11. All business functions are integrated in serving the needs of our target markets:
To No Extent To A Small Extent To A Moderate Extent
To A Considerable Extent
To A Great Extent
12. All business functions understand how everyone in our business can contribute to creating customer value:
To No Extent To A Small Extent To A Moderate Extent
To A Considerable Extent
To A Great Extent
13. We share resources with other business units:
To No Extent To A Small Extent To A Moderate Extent
To A Considerable Extent
To A Great Extent
Please check the most appropriate box when answering these questions about your company’s partnerships:
14. We actively monitor our environment to identify partnering opportunities:
Strongly Disagree Disagree Neutral Agree Strongly Agree
15. We routinely gather information about prospective partners from various forums (e.g. trade shows, industry conventions,
databases, publications, internet, etc.):
Strongly Disagree Disagree Neutral Agree Strongly Agree
16. We are alert to market developments that create potential alliance opportunities:
Strongly Disagree Disagree Neutral Agree Strongly Agree
17. Our activities across different alliances are well coordinated:
Strongly Disagree Disagree Neutral Agree Strongly Agree
105
18. We systematically coordinate our strategies across different alliances:
Strongly Disagree Disagree Neutral Agree Strongly Agree
19. We have processes to systematically transfer knowledge across alliance partners:
Strongly Disagree Disagree Neutral Agree Strongly Agree
20. We conduct periodic reviews of our alliances to understand what we are doing right and where we are going wrong:
Strongly Disagree Disagree Neutral Agree Strongly Agree
21. We periodically collect and analyze field experiences from our alliances:
Strongly Disagree Disagree Neutral Agree Strongly Agree
22. We modify our alliance-related procedures as we learn from experience:
Strongly Disagree Disagree Neutral Agree Strongly Agree
Based on the last three years, please indicate the extent that your company has achieved its stated objectives in terms of:
23. Generation of new innovative products or projects:
To No Extent To A Small Extent To A Moderate
Extent To A Considerable
Extent To A Great Extent
24. New patents:
To No Extent To A Small Extent To A Moderate Extent
To A Considerable Extent
To A Great Extent
25. Quality and relevance of scientific output:
To No Extent To A Small Extent To A Moderate Extent
To A Considerable Extent
To A Great Extent
26. Attainment of scientific results or milestones:
To No Extent To A Small Extent To A Moderate Extent
To A Considerable Extent
To A Great Extent
27. Recruitment of new personnel with outstanding knowledge and skills:
To No Extent To A Small Extent To A Moderate Extent
To A Considerable Extent
To A Great Extent
106
28. Scientific or technological leadership in your environment:
To No Extent To A Small Extent To A Moderate Extent
To A Considerable Extent
To A Great Extent
29. Attainment of new capital, either public or private:
To No Extent To A Small Extent To A Moderate Extent
To A Considerable Extent
To A Great Extent
30. Maintenance and generation of alliances or partnerships:
To No Extent To A Small Extent To A Moderate Extent
To A Considerable Extent
To A Great Extent
Please answer the following general descriptive questions:
31. Is your company headquartered in Canada?
32. Is your company located in a biotechnology or science park?
33. If the answer to Question 32 was yes, please state the park’s name _________________________
34. Please indicate if your company is affiliated with any of the following associations:
BIOTECanada BioAtlantech BioNova Genome Canada
OCRI Life Sciences
Toronto Biotechnology Institute
MaRS Discovery District
Pharmabio Development
BioQuebec Parc Technologique du Quebec Metropolitain
Canadian Genetic Diseases Network
Alberta Research Council
BioAlberta LifeScience Association of Manitoba British Columbia Life Sciences
Prince Edward Island BioAlliance
Ag-West Bio Inc. Biotechnology Industry Association Newfoundland and Labrador Association of Technology Industries
BioTalent Canada Other _____________________
35. What is your company’s ownership structure?
Privately Owned Publicly Traded Subsidiary Government Other _______________
36. What is the CEO or President’s educational background? __________________
37. What year was your company founded? __________________
38. How many individuals does your company employ? __________________
39. What are the first three letters of your company’s postal code? __________________
Please provide any additional comments, suggestions, or concerns in the section below:
Yes No
Yes No
107
The portion below will be separated from the above questionnaire before any responses are put into a database so that your responses are not identifiable by any information provided below.
Once the responses from this survey have been compiled and analyzed, would you like to receive a summary of the findings?
Yes via e-mail (please provide e-mail address) Yes via postal mail (please provide postal address)
Thank you for participating in this study – your time and willingness to participate is greatly appreciated!

108
APPENDIX B
Orientation marché, orientation d’alliance et performance d’entreprise dans l’industrie canadienne de biotechnologie
Grant A. Wilson, 2012 ©
109
1. Veuillez s'il vous plaît spécifier le secteur d'exploitation principal de votre société de biotechnologie :
Médical/Santé (Concentrée sur
l’humain)
Médical/Santé (Concentrée sur les
animaux)
Agriculture/ Alimentation
Environment/ Industriel
Technologie de
l’information
Autre
__________
Votre compagnie a-t-elle le potentiel de développer la concentration humaine?
Veuillez s’il-vous-plaît cocher la case la plus appropriée en répondant aux prochaines questions concernant la position de votre compagnie dans l’industrie:
2. Nos objectifs d’entreprise sont principalement dirigés vers la satisfaction de nos clients :
Aucunement Dans une faible
mesure Moyennement Dans une forte
mesure Dans une très forte
mesure
3. Notre stratégie pour avoir un avantage concurrentiel est basée sur notre compréhension des besoins de nos clients:
Aucunement Dans une faible
mesure Moyennement Dans une forte
mesure Dans une très forte
mesure
4. Nos stratégies d’affaires sont conduites par nos convictions concernant la façon dont nous pouvons créer plus de valeur
pour nos clients:
Aucunement Dans une faible mesure
Moyennement Dans une forte mesure
Dans une très forte mesure
5. Nous mesurons systématiquement et fréquemment la satisfaction de nos clients:
Aucunement Dans une faible mesure
Moyennement Dans une forte mesure
Dans une très forte mesure
6. Toutes les fonctions de l’entreprise partagent de l’information concernant les stratégies des concurrents:
Aucunement Dans une faible mesure
Moyennement Dans une forte mesure
Dans une très forte mesure
7. Nous répondons rapidement aux actions concurrentielles qui nous menacent:
Aucunement Dans une faible mesure
Moyennement Dans une forte mesure
Dans une très forte mesure
8. La haute direction discute régulièrement des forces et des stratégies de concurrents :
Aucunement Dans une faible mesure
Moyennement Dans une forte mesure
Dans une très forte mesure
Oui Non
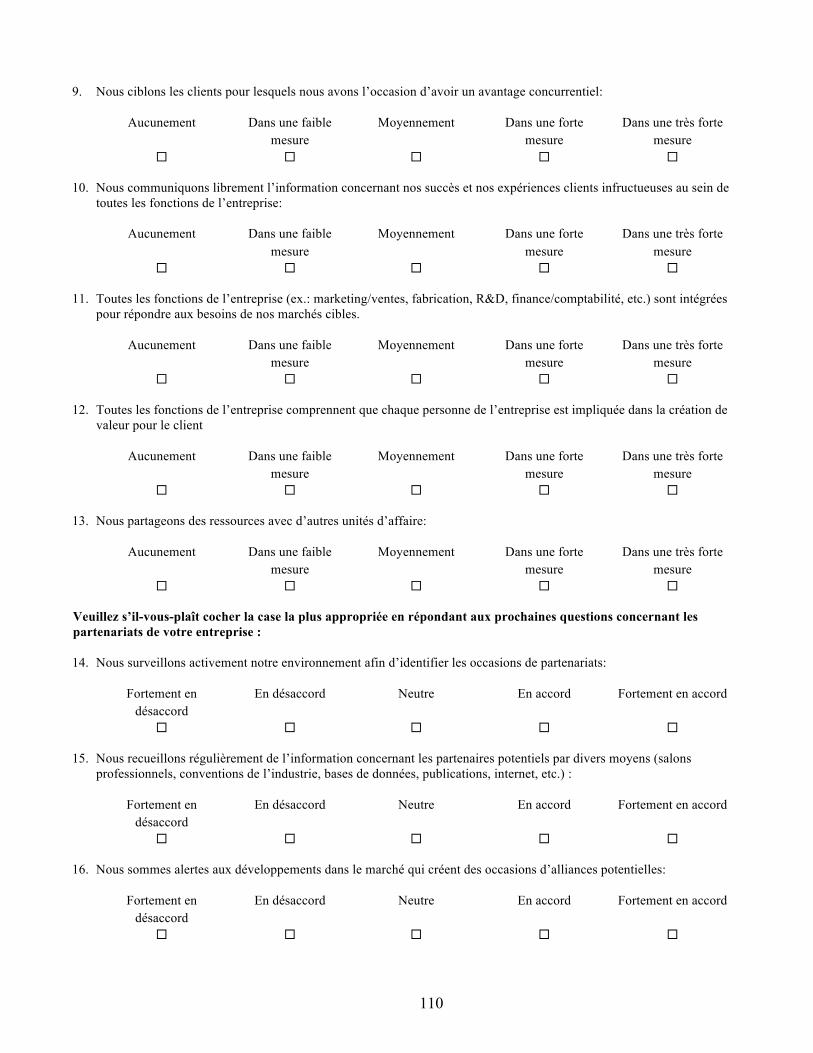
110
9. Nous ciblons les clients pour lesquels nous avons l’occasion d’avoir un avantage concurrentiel:
Aucunement Dans une faible mesure
Moyennement Dans une forte mesure
Dans une très forte mesure
10. Nous communiquons librement l’information concernant nos succès et nos expériences clients infructueuses au sein de toutes les fonctions de l’entreprise:
Aucunement Dans une faible mesure
Moyennement Dans une forte mesure
Dans une très forte mesure
11. Toutes les fonctions de l’entreprise (ex.: marketing/ventes, fabrication, R&D, finance/comptabilité, etc.) sont intégrées pour répondre aux besoins de nos marchés cibles.
Aucunement Dans une faible mesure
Moyennement Dans une forte mesure
Dans une très forte mesure
12. Toutes les fonctions de l’entreprise comprennent que chaque personne de l’entreprise est impliquée dans la création de valeur pour le client
Aucunement Dans une faible mesure
Moyennement Dans une forte mesure
Dans une très forte mesure
13. Nous partageons des ressources avec d’autres unités d’affaire:
Aucunement Dans une faible mesure
Moyennement Dans une forte mesure
Dans une très forte mesure
Veuillez s’il-vous-plaît cocher la case la plus appropriée en répondant aux prochaines questions concernant les partenariats de votre entreprise :
14. Nous surveillons activement notre environnement afin d’identifier les occasions de partenariats:
Fortement en
désaccord En désaccord Neutre En accord Fortement en accord
15. Nous recueillons régulièrement de l’information concernant les partenaires potentiels par divers moyens (salons professionnels, conventions de l’industrie, bases de données, publications, internet, etc.) :
Fortement en désaccord
En désaccord Neutre En accord Fortement en accord
16. Nous sommes alertes aux développements dans le marché qui créent des occasions d’alliances potentielles:
Fortement en désaccord
En désaccord Neutre En accord Fortement en accord
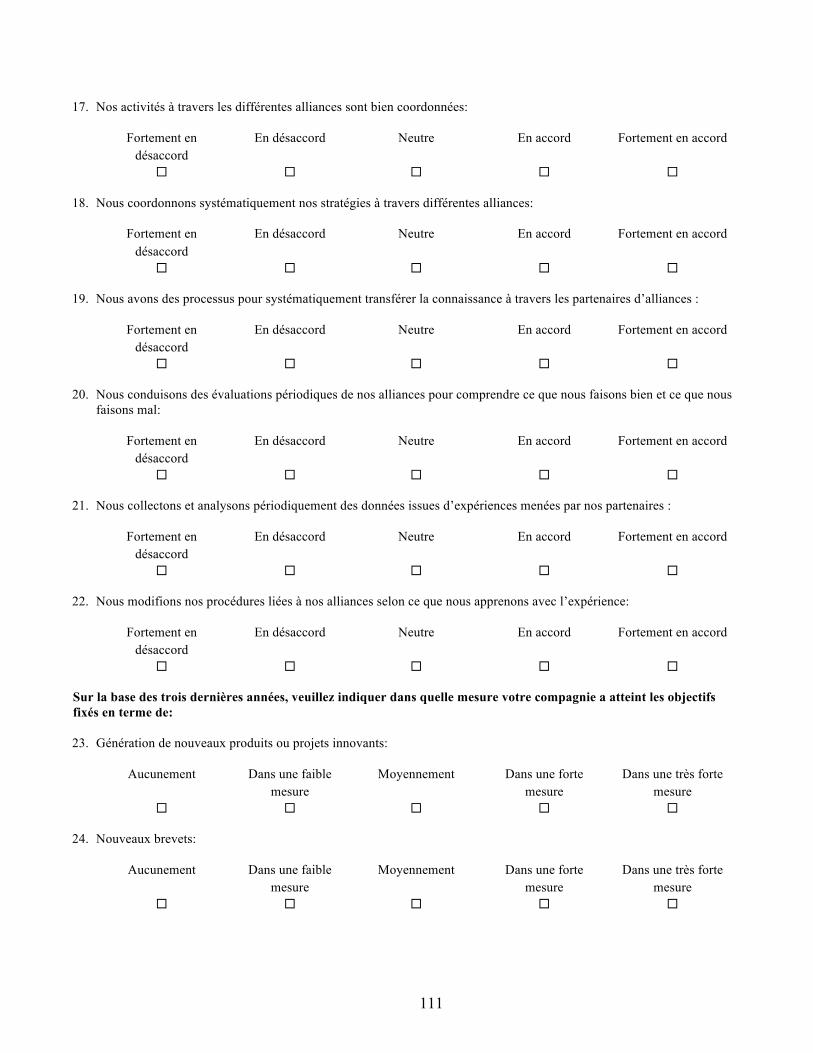
111
17. Nos activités à travers les différentes alliances sont bien coordonnées:
Fortement en
désaccord En désaccord Neutre En accord Fortement en accord
18. Nous coordonnons systématiquement nos stratégies à travers différentes alliances:
Fortement en désaccord
En désaccord Neutre En accord Fortement en accord
19. Nous avons des processus pour systématiquement transférer la connaissance à travers les partenaires d’alliances :
Fortement en désaccord
En désaccord Neutre En accord Fortement en accord
20. Nous conduisons des évaluations périodiques de nos alliances pour comprendre ce que nous faisons bien et ce que nous faisons mal:
Fortement en désaccord
En désaccord Neutre En accord Fortement en accord
21. Nous collectons et analysons périodiquement des données issues d’expériences menées par nos partenaires :
Fortement en désaccord
En désaccord Neutre En accord Fortement en accord
22. Nous modifions nos procédures liées à nos alliances selon ce que nous apprenons avec l’expérience:
Fortement en désaccord
En désaccord Neutre En accord Fortement en accord
Sur la base des trois dernières années, veuillez indiquer dans quelle mesure votre compagnie a atteint les objectifs fixés en terme de:
23. Génération de nouveaux produits ou projets innovants:
Aucunement Dans une faible
mesure Moyennement Dans une forte
mesure Dans une très forte
mesure
24. Nouveaux brevets:
Aucunement Dans une faible
mesure Moyennement Dans une forte
mesure Dans une très forte
mesure
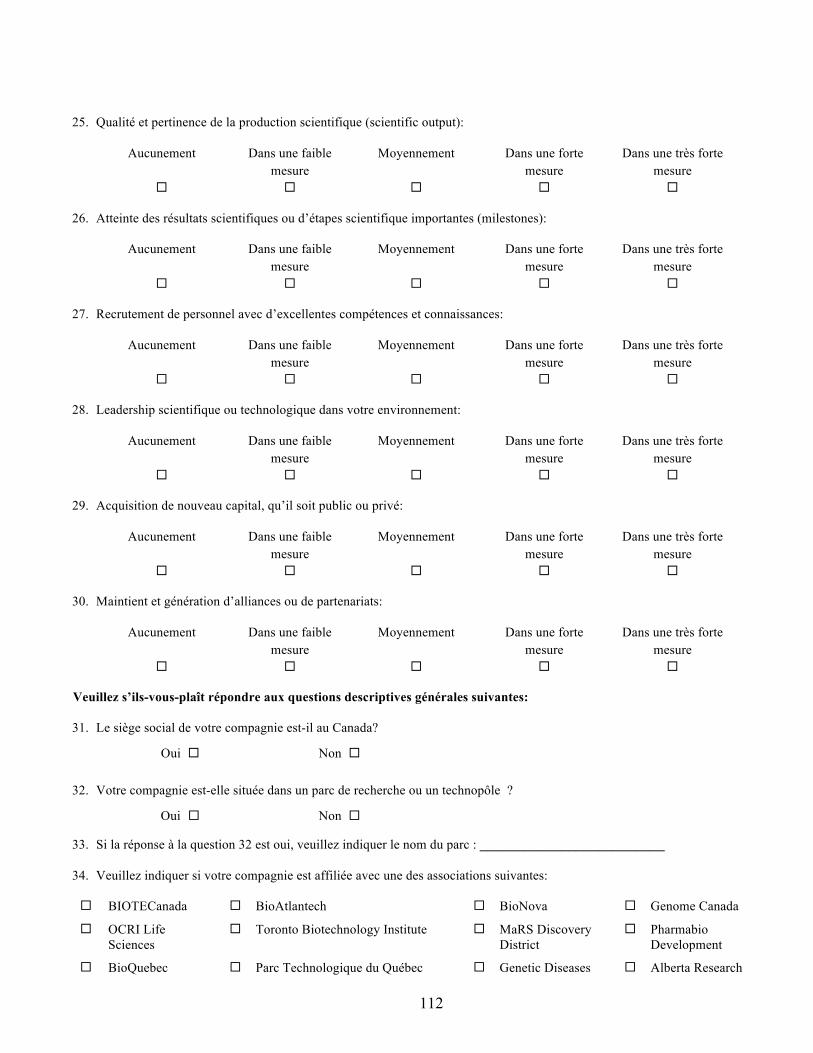
112
25. Qualité et pertinence de la production scientifique (scientific output):
Aucunement Dans une faible mesure
Moyennement Dans une forte mesure
Dans une très forte mesure
26. Atteinte des résultats scientifiques ou d’étapes scientifique importantes (milestones):
Aucunement Dans une faible mesure
Moyennement Dans une forte mesure
Dans une très forte mesure
27. Recrutement de personnel avec d’excellentes compétences et connaissances:
Aucunement Dans une faible mesure
Moyennement Dans une forte mesure
Dans une très forte mesure
28. Leadership scientifique ou technologique dans votre environnement:
Aucunement Dans une faible mesure
Moyennement Dans une forte mesure
Dans une très forte mesure
29. Acquisition de nouveau capital, qu’il soit public ou privé:
Aucunement Dans une faible mesure
Moyennement Dans une forte mesure
Dans une très forte mesure
30. Maintient et génération d’alliances ou de partenariats:
Aucunement Dans une faible mesure
Moyennement Dans une forte mesure
Dans une très forte mesure
Veuillez s’ils-vous-plaît répondre aux questions descriptives générales suivantes:
31. Le siège social de votre compagnie est-il au Canada?
32. Votre compagnie est-elle située dans un parc de recherche ou un technopôle ?
33. Si la réponse à la question 32 est oui, veuillez indiquer le nom du parc : _________________________
34. Veuillez indiquer si votre compagnie est affiliée avec une des associations suivantes:
BIOTECanada BioAtlantech BioNova Genome Canada
OCRI Life Sciences
Toronto Biotechnology Institute
MaRS Discovery District
Pharmabio Development
BioQuebec Parc Technologique du Québec Genetic Diseases Alberta Research
Oui Non
Oui Non
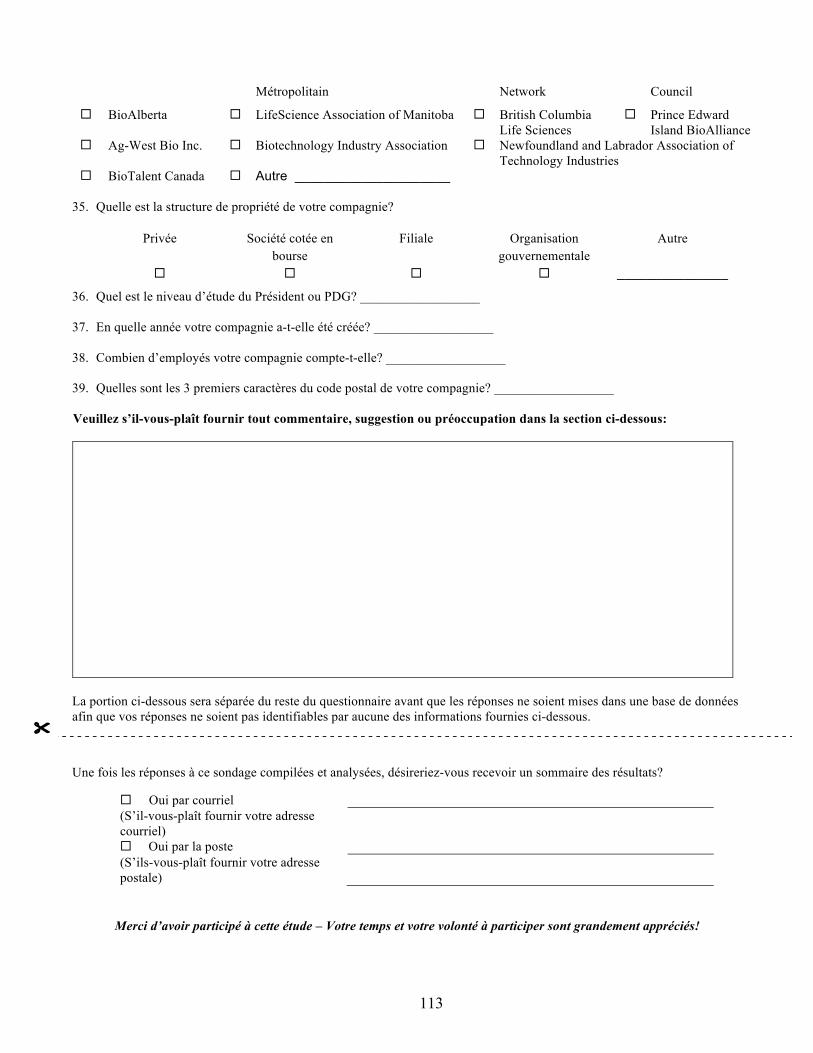
113
Métropolitain Network Council
BioAlberta LifeScience Association of Manitoba British Columbia Life Sciences
Prince Edward Island BioAlliance
Ag-West Bio Inc. Biotechnology Industry Association Newfoundland and Labrador Association of Technology Industries
BioTalent Canada Autre _____________________
35. Quelle est la structure de propriété de votre compagnie?
Privée Société cotée en bourse
Filiale Organisation gouvernementale
Autre
_______________
36. Quel est le niveau d’étude du Président ou PDG? __________________
37. En quelle année votre compagnie a-t-elle été créée? __________________
38. Combien d’employés votre compagnie compte-t-elle? __________________
39. Quelles sont les 3 premiers caractères du code postal de votre compagnie? __________________
Veuillez s’il-vous-plaît fournir tout commentaire, suggestion ou préoccupation dans la section ci-dessous:
La portion ci-dessous sera séparée du reste du questionnaire avant que les réponses ne soient mises dans une base de données afin que vos réponses ne soient pas identifiables par aucune des informations fournies ci-dessous.
Une fois les réponses à ce sondage compilées et analysées, désireriez-vous recevoir un sommaire des résultats?
Oui par courriel (S’il-vous-plaît fournir votre adresse courriel)
Oui par la poste (S’ils-vous-plaît fournir votre adresse postale)
Merci d’avoir participé à cette étude – Votre temps et votre volonté à participer sont grandement appréciés!
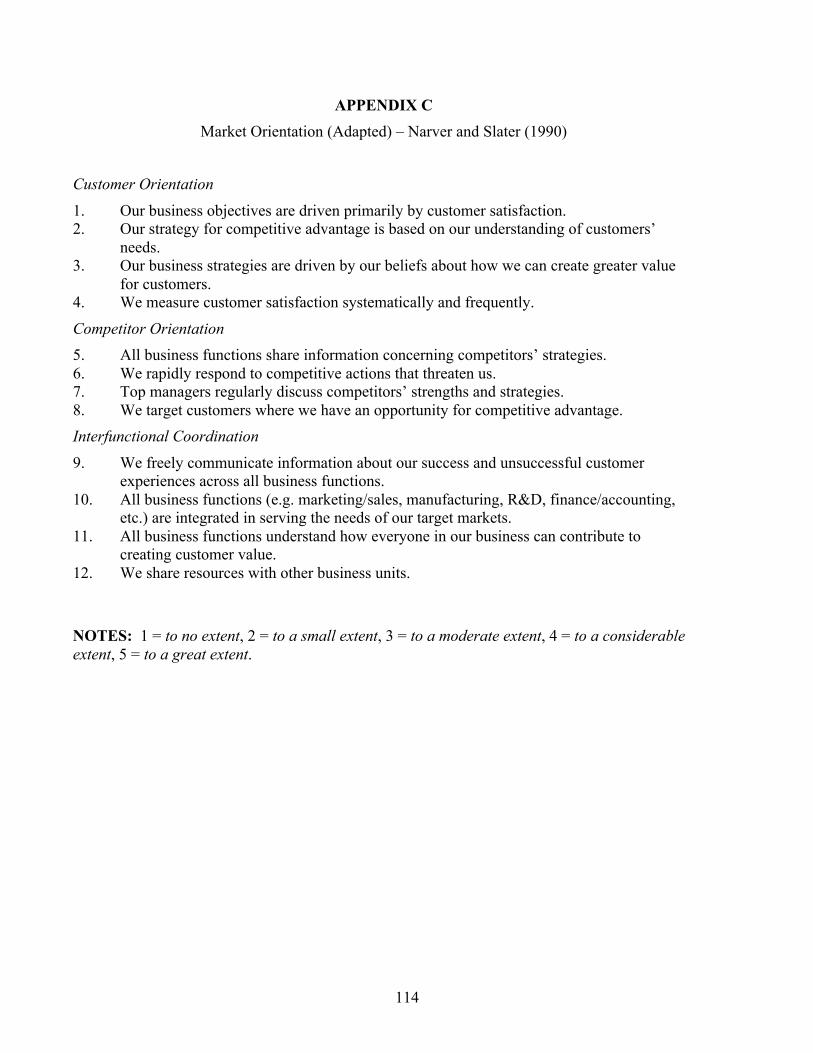
114
APPENDIX C Market Orientation (Adapted) – Narver and Slater (1990)
Customer Orientation
1. Our business objectives are driven primarily by customer satisfaction. 2. Our strategy for competitive advantage is based on our understanding of customers’
needs. 3. Our business strategies are driven by our beliefs about how we can create greater value
for customers. 4. We measure customer satisfaction systematically and frequently.
Competitor Orientation 5. All business functions share information concerning competitors’ strategies. 6. We rapidly respond to competitive actions that threaten us. 7. Top managers regularly discuss competitors’ strengths and strategies. 8. We target customers where we have an opportunity for competitive advantage. Interfunctional Coordination
9. We freely communicate information about our success and unsuccessful customer experiences across all business functions.
10. All business functions (e.g. marketing/sales, manufacturing, R&D, finance/accounting, etc.) are integrated in serving the needs of our target markets.
11. All business functions understand how everyone in our business can contribute to creating customer value.
12. We share resources with other business units. NOTES: 1 = to no extent, 2 = to a small extent, 3 = to a moderate extent, 4 = to a considerable extent, 5 = to a great extent.
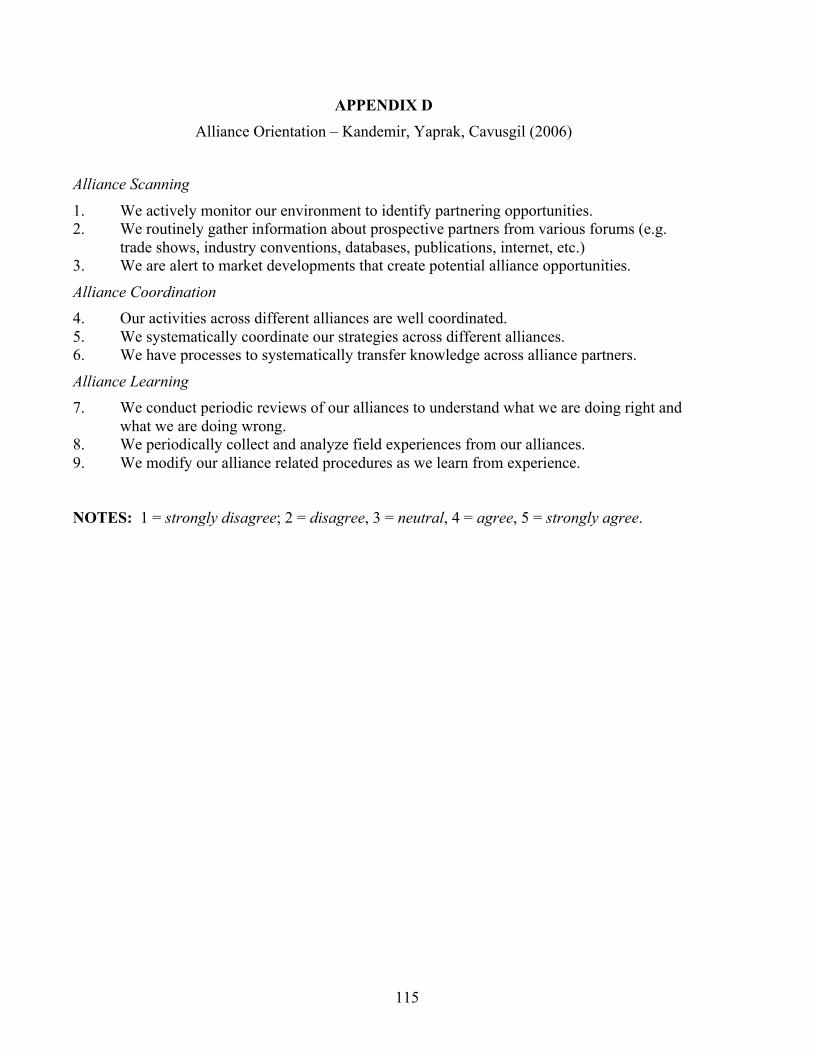
115
APPENDIX D Alliance Orientation – Kandemir, Yaprak, Cavusgil (2006)
Alliance Scanning
1. We actively monitor our environment to identify partnering opportunities. 2. We routinely gather information about prospective partners from various forums (e.g.
trade shows, industry conventions, databases, publications, internet, etc.) 3. We are alert to market developments that create potential alliance opportunities.
Alliance Coordination 4. Our activities across different alliances are well coordinated. 5. We systematically coordinate our strategies across different alliances. 6. We have processes to systematically transfer knowledge across alliance partners.
Alliance Learning 7. We conduct periodic reviews of our alliances to understand what we are doing right and
what we are doing wrong. 8. We periodically collect and analyze field experiences from our alliances. 9. We modify our alliance related procedures as we learn from experience. NOTES: 1 = strongly disagree; 2 = disagree, 3 = neutral, 4 = agree, 5 = strongly agree.
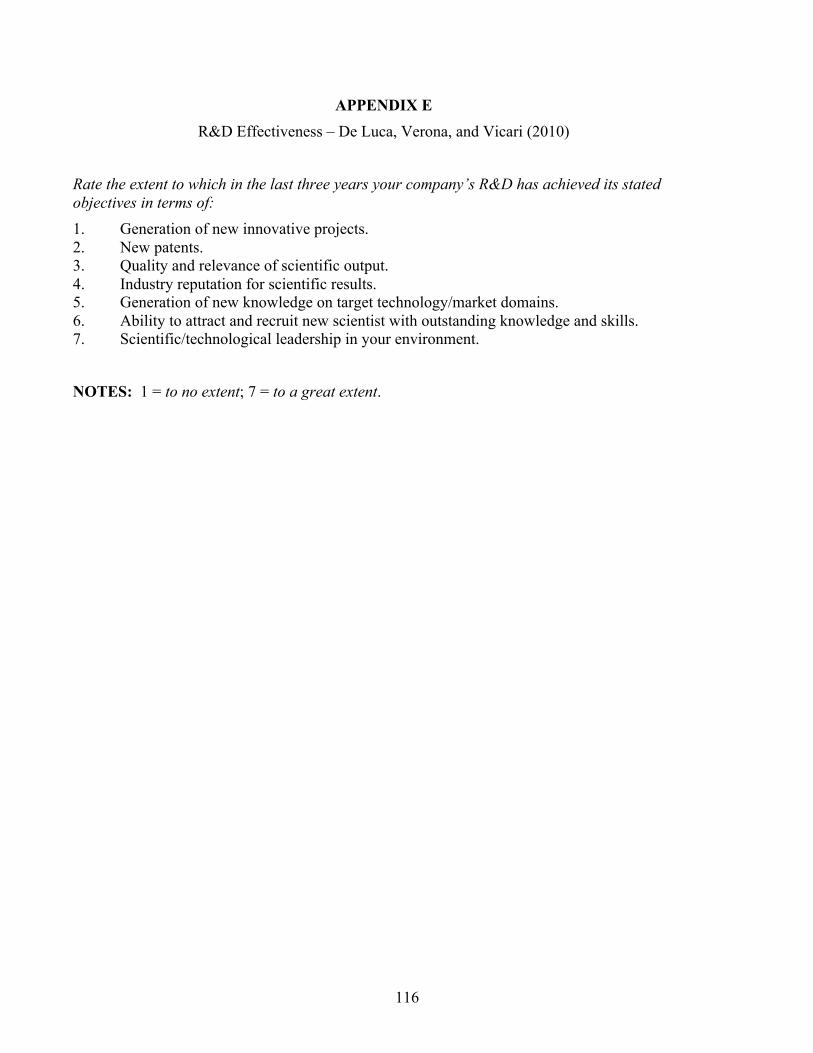
116
APPENDIX E R&D Effectiveness – De Luca, Verona, and Vicari (2010)
Rate the extent to which in the last three years your company’s R&D has achieved its stated objectives in terms of: 1. Generation of new innovative projects. 2. New patents. 3. Quality and relevance of scientific output. 4. Industry reputation for scientific results. 5. Generation of new knowledge on target technology/market domains. 6. Ability to attract and recruit new scientist with outstanding knowledge and skills. 7. Scientific/technological leadership in your environment.
NOTES: 1 = to no extent; 7 = to a great extent.
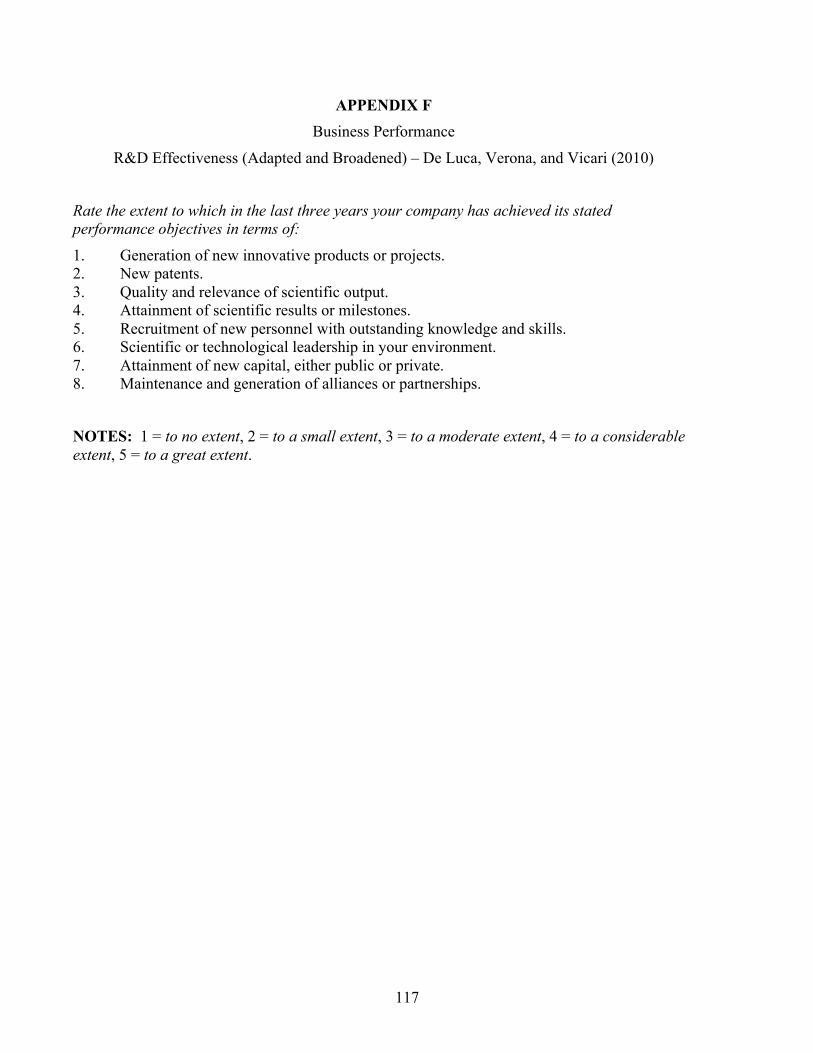
117
APPENDIX F Business Performance
R&D Effectiveness (Adapted and Broadened) – De Luca, Verona, and Vicari (2010)
Rate the extent to which in the last three years your company has achieved its stated performance objectives in terms of:
1. Generation of new innovative products or projects. 2. New patents. 3. Quality and relevance of scientific output. 4. Attainment of scientific results or milestones. 5. Recruitment of new personnel with outstanding knowledge and skills. 6. Scientific or technological leadership in your environment. 7. Attainment of new capital, either public or private. 8. Maintenance and generation of alliances or partnerships.
NOTES: 1 = to no extent, 2 = to a small extent, 3 = to a moderate extent, 4 = to a considerable extent, 5 = to a great extent.
118
APPENDIX G May 28, 2012 «Title»«First_Name»«Last_Name» «Company» «Address» «City», «Province» «Postal_Code» RE: Business Practices of Canadian Biotechnology Companies Dear «Title»«Last_Name», This study seeks to enhance our understanding of the current business practices of Canadian biotechnology companies. The questionnaire we are asking you to complete, should take roughly 10 minutes. The questionnaire can be completed by mail and returned in the pre-stamped envelope provided, or online by visiting https://survey.qualtrics.com/SE/?SID=SV_5hFkveDPwEF0HxW and entering your identification code («CODE»). Your participation is important and we look forward to receiving your completed questionnaire. As a token of our appreciation for your participation, if you would like, the information obtained from you and other participants in the study will be aggregated and sent to your organization. Your participation is important. However, it is completely voluntary and you do not have to complete the questionnaire. You may also refuse to answer individual questions and you may withdraw from the study at anytime. The code number on the questionnaire is designed to give the investigators the ability to track responses while keeping your identity strictly confidential. Once the data collection is complete, the list that links code numbers to names will be destroyed. Only the principal investigator (Jason Perepelkin) and co-investigator (Grant Wilson) will have access to the data arising from the study. All information will be stored in secure, locked facilities in the office of the principal investigator (Jason Perepelkin) at the University of Saskatchewan. Results will be aggregated to ensure that the identities of individual respondents are safeguarded. Results will be reported in the student-researcher’s Thesis, refereed periodicals, and at conferences and meetings associated with biotechnology, pharmaceutical, and business research. Should you have any concerns about this research project do not hesitate to contact the principal investigator (Jason Perepelkin) by e-mail ([email protected]), phone (306-966-6992), or facsimile (306-966-6377). You completing this questionnaire, either by mail or online, constitutes consent for the researchers to use the data for the purpose of conducting the study, as this study has received exempt status from the University of Saskatchewan Behavioural Research Ethics Board (BEH 120-104, April 9, 2012). Should you have any questions regarding your rights as a participant in this study you may call the Ethics Office at the University of Saskatchewan (306-966-2084). Out of town participants may call collect. Sincerely,
Grant Wilson, BComm MSc Candidate University of Saskatchewan
Jason Perepelkin, PhD Assistant Professor University of Saskatchewan
Marc-Antoine Vachon, PhD Candidate Professor, Department of Marketing ESG-UQAM
119
APPENDIX H 28 mai 2012 «Title»«First_Name»«Last_Name» «Company» «Address» «City», «Province» «Postal_Code» Objet: Les pratiques commerciales des entreprises canadiennes en biotechnologie Bonjour «Title»«Last_Name», Cette étude cherche à améliorer notre compréhension des pratiques commerciales actuelles des entreprises canadiennes en biotechnologie. Le questionnaire que nous vous demandons de compléter devrait prendre environ 10 minutes. Le questionnaire peut être envoyé par la poste et retourné avec l’enveloppe préaffranchie fournie, ou en ligne au https://survey.qualtrics.com/SE/?SID=SV_1YeyyTUzqDZ9FYw en entrant votre code d’identification («CODE»). Votre participation est importante et nous espérons fortement recevoir votre questionnaire rempli. En gage de notre appréciation, si vous le désirez, les informations obtenues durant l’étude auprès des autres participants et vous seront agrégées puis envoyées à votre organisation. Votre participation est importante. Toutefois, elle est complètement volontaire et vous n’êtes pas tenu de compléter le questionnaire. Vous pouvez également refuser de répondre aux questions individuelles et vous pouvez vous retirer de l’étude à tout moment. Le code numérique sur le questionnaire est conçu pour donner aux enquêteurs la possibilité de suivre les réponses tout en gardant votre identité strictement confidentielle. Une fois la collecte de donnée terminée, la liste liant les codes numériques aux noms sera détruite. Seul le chercheur principal (Jason Perepelkin) et le co-chercheur (Grant Wilson) auront accès aux données découlant de l’étude. Toutes les informations seront conservées dans des installations sécurisées sous verrou dans le bureau du chercheur principal (Jason Perepelkin) à l’Université de Saskatchewan. Les résultats seront regroupés pour assurer la protection de l’identité des répondants. Les résultats seront présentés dans la thèse de l'étudiant-chercheur, dans des revues scientifiques, et lors de conférences et réunions liées à la biotechnologie, à la pharmaceutique, et à la recherche commerciale. Si vous avez des préoccupations concernant ce projet de recherche, n’hésitez pas à contacter le chercheur principal (Jason Perepelkin) par courriel ([email protected]), par téléphone (306-966-6992), ou par télécopieur (306-966-6377). En remplissant ce questionnaire, par courrier ou en ligne, vous donnez votre consentement aux chercheurs pour qu’ils utilisent les données dans le but de conduire l’étude, tel qu’approuvé par le comité sur l’éthique en recherche comportementale de l’Université de Saskatchewan (BEH 120-104, 9 avril 2012). Si vous avez des questions quant à vos droits comme participant à cette étude, vous pouvez appeler le Bureau de l'éthique à l'Université de Saskatchewan (306-966-2084). Les participants hors région peuvent effectuer des appels à frais virés. Sincèrement,
Grant Wilson, BComm Candidat à la MSc Université de Saskatchewan
Jason Perepelkin, PhD Professeur adjoint Université de Saskatchewan
Marc-Antoine Vachon, candidat au PhD Professeur Département de marketing ESG-UQAM
120
APPENDIX I RE: Business Practices of Canadian Biotechnology Companies You recently received a request to complete a questionnaire on your company’s current business practices. If you have already completed the questionnaire online or have already returned it via mail, thank you. If you have not yet completed the questionnaire and intend to do so, we would ask that you complete it as soon as possible and return it in the pre-stamped envelope provided or visit https://survey.qualtrics.com/SE/?SID=SV_5hFkveDPwEF0HxW and enter your identification code. As you know, the purpose of this study is to understand the current business practices of Canadian biotechnology companies. As a token of our appreciation for your participation, the information obtained from you and other participants in the study will be aggregated and sent to your organization. Your participation is important. However, it is completely voluntary and you do not have to complete the questionnaire. You may also refuse to answer individual questions and you may withdraw from the study at anytime. Should you have any concerns about this research project do not hesitate to contact the principal investigator (Jason Perepelkin) by e-mail ([email protected]), phone (306-966-6992), or facsimile (306-966-6377). Sincerely,
Grant Wilson, BComm MSc Candidate University of Saskatchewan
Jason Perepelkin, PhD Assistant Professor University of Saskatchewan
Marc-Antoine Vachon, PhD Candidate Professor, Department of Marketing ESG-UQAM
121
APPENDIX J Objet: Les pratiques commerciales des entreprises canadiennes en biotechnologie Vous avez récemment reçu une demande pour répondre à un questionnaire concernant les pratiques commerciales actuelles de votre entreprise. Si vous avez déjà rempli le questionnaire en ligne ou l’avez déjà acheminé par la poste, merci. Si vous n’avez pas rempli le questionnaire mais vous avez l’intention de le faire, nous vous demanderions de le remplir le plus tôt possible et de le retourner avec l’enveloppe préaffranchie, ou d’accéder au https://survey.qualtrics.com/SE/?SID=SV_1YeyyTUzqDZ9FYw et d’entrer votre code d’identification. Comme vous le savez, l’objectif de cette étude est de comprendre quelles sont les pratiques commerciales actuelles des entreprises canadiennes en biotechnologie. En gage de notre appréciation, si vous le désirez, les informations obtenues durant l’étude auprès des autres participants et vous seront agrégées puis envoyées à votre organisation. Votre participation est importante. Toutefois, elle est complètement volontaire et vous n’êtes pas tenu de compléter le questionnaire. Vous pouvez également refuser de répondre aux questions individuelles et vous pouvez vous retirer de l’étude à tout moment. Si vous avez des préoccupations concernant ce projet de recherche n’hésitez pas à contacter le chercheur principal (Jason Perepelkin) par courriel ([email protected]), par téléphone (306-966-6992), ou par télécopieur (306-966-6377). Sincèrement,
Grant Wilson, BComm Candidat à la MSc Université de Saskatchewan
Jason Perepelkin, PhD Professeur adjoint Université de Saskatchewan
Marc-Antoine Vachon, candidat au PhD Professeur Département de marketing ESG-UQAM
122
APPENDIX K June 25, 2012 «Title»«First_Name»«Last_Name» «Company» «Address» «City», «Province» «Postal_Code» RE: Business Practices of Canadian Biotechnology Companies Dear «Title»«Last_Name», You recently received a request to complete a questionnaire regarding your company’s current business practices. If you have already completed the questionnaire online or have already returned it via mail, thank you. If you have not yet completed the questionnaire and intend to do so, we would ask that you complete it as soon as possible and return it in the pre-stamped envelope provided or visit https://survey.qualtrics.com/SE/?SID=SV_5hFkveDPwEF0HxW and enter your identification code («CODE»). Your participation is important and we look forward to receiving your completed questionnaire. As you know, the purpose of this study is to understand the current business practices of Canadian biotechnology companies. As a token of our appreciation for your participation, if you would like, the information obtained from you and other participants in the study will be aggregated and sent to your organization. Should you have any concerns about this research project do not hesitate to contact the principal investigator (Jason Perepelkin) by e-mail ([email protected]), phone (306-966-6992), or facsimile (306-966-6377). You completing this questionnaire, either by mail or online, constitutes consent for the researchers to use the data for the purpose of conducting the study, as this study has received exempt status from the University of Saskatchewan Behavioural Research Ethics Board (BEH 120-104, April 9, 2012). Should you have any questions regarding your rights as a participant in this study you may call the Ethics Office at the University of Saskatchewan (306-966-2084). Out of town participants may call collect. Sincerely,
Grant Wilson, BComm MSc Candidate University of Saskatchewan
Jason Perepelkin, PhD Assistant Professor University of Saskatchewan
Marc-Antoine Vachon, PhD Candidate Professor, Department of Marketing ESG-UQAM
123
APPENDIX L 25 juin 2012 «Title»«First_Name»«Last_Name» «Company» «Address» «City», «Province» «Postal_Code» Objet: Les pratiques commerciales des entreprises canadiennes en biotechnologie Bonjour «Title»«Last_Name», Vous avez récemment reçu une demande pour répondre à un questionnaire concernant les pratiques commerciales actuelles de votre entreprise. Si vous avez déjà rempli le questionnaire en ligne ou l’avez déjà acheminé par la poste, merci. Si vous n’avez pas rempli le questionnaire mais vous avez l’intention de le faire, nous vous demanderions de le remplir le plus tôt possible et de le retourner avec l’enveloppe préaffranchie, ou d’accéder au https://survey.qualtrics.com/SE/?SID=SV_1YeyyTUzqDZ9FYw et d’entrer votre code d’identification («CODE»). Votre participation est importante et nous espérons fortement recevoir votre questionnaire rempli. Comme vous le savez, l’objectif de cette étude est de comprendre quelles sont les pratiques commerciales actuelles des entreprises canadiennes en biotechnologie. En gage de notre appréciation, si vous le désirez, les informations obtenues durant l’étude auprès des autres participants et vous seront agrégées puis envoyées à votre organisation. Si vous avez des préoccupations concernant ce projet de recherche, n’hésitez pas à contacter le chercheur principal (Jason Perepelkin) par courriel ([email protected]), par téléphone (306-966-6992), ou par télécopieur (306-966-6377). En remplissant ce questionnaire, par courrier ou en ligne, vous donnez votre consentement aux chercheurs pour qu’ils utilisent les données dans le but de conduire l’étude, tel qu’approuvé par le comité sur l’éthique en recherche comportementale de l’Université de Saskatchewan (BEH 120-104, 9 avril 2012). Si vous avez des questions quant à vos droits comme participant à cette étude, vous pouvez appeler le Bureau de l'éthique à l'Université de Saskatchewan (306-966-2084). Les participants hors région peuvent effectuer des appels à frais virés. Sincèrement,
Grant Wilson, BComm Candidat à la MSc Université de Saskatchewan
Jason Perepelkin, PhD Professeur adjoint Université de Saskatchewan
Marc-Antoine Vachon, candidat au PhD Professeur Département de marketing ESG-UQAM
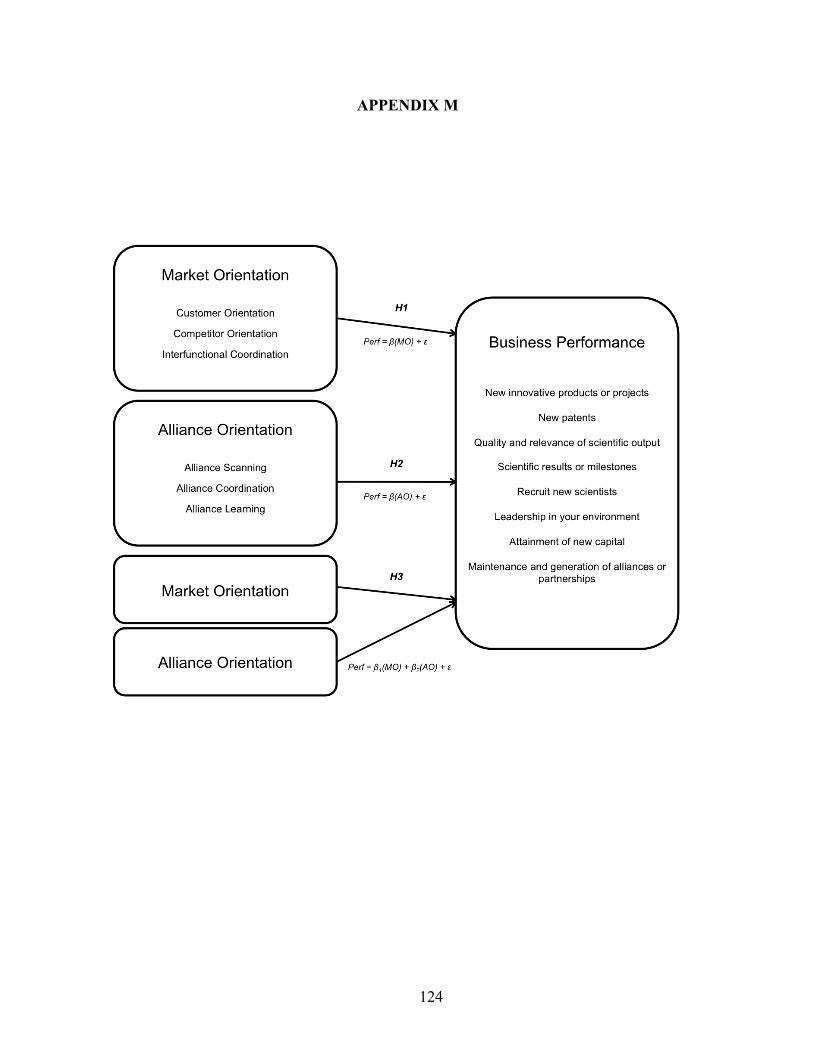
124
APPENDIX M
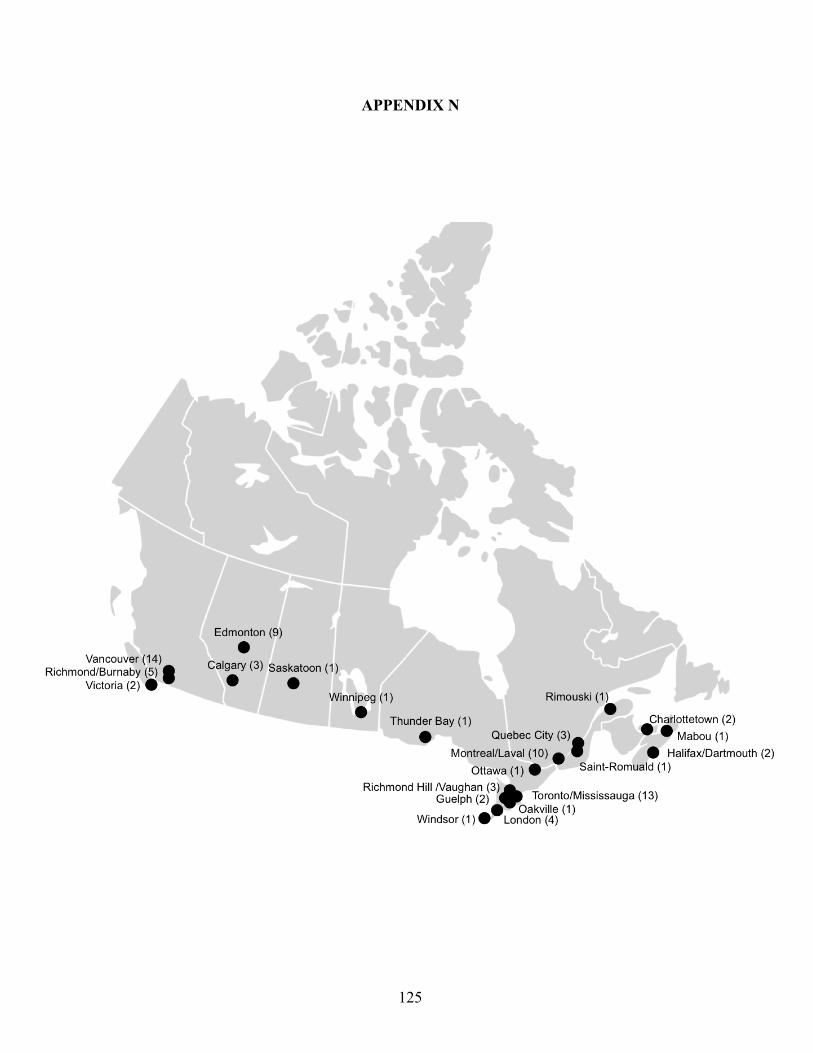
125
APPENDIX N