Embed Size (px)
Citation preview
1
Market Orientation and Marketing in Nonprofit Organizations.
Indications for Fundraising from Victoria
THIS IS THE PRE-PEER REVIEWED VERSION OF THE FOLLOWING ARTICLE:
Brace-Govan, J., Brady, E., Brennan, L., & Conduit, J. (2011). Market Orientation and marketing in
nonprofit organisations – Indications for fundraising from Victoria International Journal of
Nonprofit and Voluntary Sector Marketing, Vol. 16 No. 1, pp. 84-98.
.
WHICH HAS BEEN PUBLISHED IN FINAL FORM AT.
HTTP://ONLINELIBRARY.WILEY.COM/DOI/10.1002/NVSM.403/ABSTRACT
2
ABSTRACT
The effectiveness of a market orientation has been established in other parts of the world. Using
a modified replication study of 401 nonprofit organizations from Victoria, this research took
some initial steps to assess fundraising and marketing activities. Studies in Australia have
usually focused on only one part of the Third Sector. This study takes a different view and uses
a criteria sampling method to survey all eleven sections named by the Australian Bureau of
Statistics. The self-reported data of fundraising activities showed that there were several choices
available to all nonprofit organizations that can lead to an improvement in organizational
performance. Results suggest that should nonprofit organizations have knowledge generating
systems that evaluate their performance this will improve outcomes for them. Even though
organizational size is strongly linked to fundraising performance, there are key drivers that can
aid even small organizations in their efforts.
Keywords: Market orientation, fundraising, organizational performance
3
INTRODUCTION
There is a growing body of literature that asserts the importance of marketing and marketing
activities for nonprofit organizations (White and Simas, 2008), nevertheless there is a need for
information that describes the third sector in terms of marketing activities. Market orientation
has been extensively researched in the commercial sector and, although organizational
commitment is still under scrutiny, it has generally been found to be of value to organizational
performance overall (Sivaramakrishnan et al., 2008). However, the crucial underpinning
assumptions of profit motivation and thus the fundamental value of marketing to the organization
do not necessarily hold for the third sector (White and Simas, 2008). The relevance of the
concept market orientation to the nonprofit sector has been challenged and a societal orientation
suggested (Sargeant et al., 2002). Others have found market orientation to be wanting and
subsequently extended the model for arts organizations (Gainer and Padanyi 2005). Indeed,
most information about market orientation in the nonprofit environment focuses on single sectors
(Caruana et al., 1998a, 1998b; Ewing and Caruana, 2000; Harrison and Shaw, 2004; White and
Simas 2008). An aim of this paper is to map the current state of marketing orientation and its
link to performance across a broad range of nonprofit organizations in the Australian third sector.
A consideration of marketing orientation in this region further develops work on single sectors
(Ewing and Caruana, 2000; Harrison and Shaw, 2004; Zhou, Chao and Huang 2009) and is
warranted given the expansion of the sector since the 1980s (Dolnicar and Lazarevski 2009,
281). In comparison to the UK and the USA, Australia has a smaller population, although like
these two countries the median age is rising (Dolnicar and Lazarevski 2009, 279) thus increasing
the pressure on some sections of the nonprofit industry. In the UK the nonprofit system is
centralized through the Charitable Commission which has the effect of improving the equity of
distribution of government funding (Dolnicar and Lazaevski 2009, 280). At 700,000
organisations (Philanthropy Australia, 2010), Australia has fewer nonprofits than both the UK
and the USA, but in terms of its contribution to employment is of a similar size to both these
countries (National Roundtable of Nonprofit Organizations, 2007). Regulation is through three
layers of government (local, state and federal), and "deductible gift" status is determined through
the Australian Tax Office (National Roundtable of Nonprofit Organizations, 2007). The
Australian Bureau of Statistics provided a definition of nonprofit institutions (ABS 2009) to
4
facilitate joining the international research project managed by the Center for Civil Society
Studies at Johns Hopkins University. In 2006, 34% of Australians volunteered and nonprofit
organizations contributed 4.1% to the Australian economy (ABS 2009).
THE MARKETING CONCEPT IN THE NONPROFIT SECTOR
Although marketing is widely perceived to be essential to organizations that have to attract
revenue from external sources, the applicability of marketing in nonprofit settings has been
debated (Padanyi 2008) and some suggest research here remains limited (Gonzalez et al., 2002).
Marketing can be seen as a philosophy, a process, a culture, a set of tools or a management
process (Sargeant 2005). The erroneous and somewhat limited view of marketing as public
relations or, advertising and selling (Balabanis et al., 1997) leads some nonprofits to hold quite
negative attitudes towards marketing and continues today (Dolnicar and Lazarevski 2009).
Some researchers argue that many nonprofits struggle with some of the key business concepts
(Sargeant et al., 2002). Adaptations are suggested to tackle some of the differences around,
either the characteristics of the organizational mission (Sargeant et al., 2002), or the influence of
sector specific factors (Gainer and Padanyi 2005), or the characteristics of the staff (Sui and
Wilson 1998). Other important differences between nonprofits and the commercial sector
regularly repeated by leading researchers are: nonprofits have multiple constituencies; non-
financial objectives and; a focus on service (Andreasen and Kotler 2008). Nonprofits also need
to be responsive to non-market pressures, such as government policy (Sargeant 2005). Although
commercial organizations must also respond to policy, nonprofit organizations often deliver
services on behalf of governments, particularly in the health and community sectors. Nonprofits
are often open to intense public scrutiny and are usually accountable to more than one
stakeholder group (Andreasen and Kotler 2008). This is often further compounded by the role
that nonprofits take in social marketing and advocacy whereby they engage in encouraging
changes in behavior and the consideration of different value positions.
Notwithstanding these tensions, which have been debated in the literature for several years
(Padanyi 2008), recent work from the UK has established that most of the large nonprofit
organizations are more corporatized and make extensive use of the marketing concept in their
5
activities (Seymour et al., 2006). Bennett (1998a) identified a link between market orientation
and the fundraising performance of small and medium sized nonprofits in the UK. Other
research has also demonstrated a link between organizational performance and market
orientation (Kirca et al., 2005; Rodriguez et al., 2004) and found that market orientation was
especially successful in service orientation and nonprofit organizations. However, although the
effectiveness of a market orientation has been asserted in the nonprofit sector, work has focused
on the UK (Balabanis et al., 1997; Bennett 1998a, 1998b; Sargeant et al, 2002),Spain (Gonzalez
et al., 2002; Vazquez et al., 2002) and the US (Kara et al., 2004; 2005) there is quite limited
information regarding Australian nonprofits. Australian studies tended to focus on single sectors
such as education (Caruana et al., 1998a, 1998b; Ewing and Caruana, 2000;) or libraries
(Harrison and Shaw, 2004). There was a need to gather a broader picture of the nonprofits in
Australia, to describe the extent of marketing within Australian nonprofit sector, and whether or
not market orientation extended beyond larger nonprofits.
In addition, the plethora of models and ideas existing in the various domains presents a dilemma
for researchers and practitioners in the field. Adopting a marketing orientation could be a high-
risk strategy for a nonprofit. As a consequence there is a need for greater certainty with regard to
the link between performance and orientation. Such certainty can only be gained if sufficient
data is gathered that replicates the outcomes under a variety of conditions (cf. Easley Madden
and Dunn 2000). There are several replication studies in marketing orientation in the commercial
sector but, it would appear that there are very few in the nonprofit sector. However, it would be
useful to do this through the replication of another similar study in order that an implied comparison
can be made. A study by Bennett (1998b) was used because the Australian third sector has, in the
past, drawn from the UK for some of its legal definitions (Sargeant 2005).
MARKET ORIENTATION FOR THE THIRD SECTOR
Over the last three decades the nonprofit, or third sector, has undergone significant changes and
nonprofit organizations face increasing pressures from the external environment. This includes
government, international and domestic influences; changes in lifestyle affecting the availability
of volunteers, and the consideration of competition (Bennett and Sargeant, 2005; Lyons 2001).
6
While many nonprofits have adopted marketing to survive these changes, there is less evidence
to suggest that they have done so willingly (Bennett and Savani 2004; McDonald 2007).
The expectation of marketing in nonprofit organizations has been to raise awareness, or to
improve fundraising performance (Arbuthnot and Horne 1997). Many have noted a restricted
application of marketing in comparison to commercial, or for profit marketing and noted a lack
of attention to marketing as a guiding philosophy, or as a strategic or planning tool (Balabanis et
al., 1997; Bennett 1998a; Buchanan et al., 1987; Smith and Santandreu R 1997; Wrenn et al.,
1994). More recently however, terms such as ‘market(ing) orientation’, ‘customer focus’ and
‘marketing concept’ characterise the philosophy that a nonprofit organization is exhorted to
have, or direct the activities they should undertake. Several studies have evaluated the presence
and impact of this more strategic approach to marketing (Balabanis et al., 1997; Bennett 1998a;
Chan and Chau 1998; Sargeant et al., 2002; Wood and Bhuian 1993; Wrenn 1996).
Briefly, there are two schools of thought regarding market orientation (Padanyi 2008). One
school suggests that market orientation is behavioral, that is organizations, do certain marketing
activities (Jaworski and Kohli, 1993). The other school argues that market orientation is a culture
that the organization has that predisposes it to behave in a certain way (Narver and Slater 1990).
The key component of both schools is that the organizations have an orientation, or focus,
toward the customer (and competitors) and use the knowledge they gather about the needs and
wants of the customer in their decision making. The underlying premise is that a market
orientation leads to improved performance. The advantage of utilizing the behavioral approach
of Kohli et al (1993) is that should an organization implement market orientation as a business
strategy, no specific alterations to organizational culture are necessarily required (Padanyi 2008).
This is important because recent research has identified a lack of marketing knowledge in
nonprofit organizations across the USA, UK and Australia (Dolnicar and Lazarevski 2009; Zhou
et al., 2009) and Bennett (1998b) suggested that some third sector organizations had an anti-
marketing bias. Therefore being able to identify appropriate processes would be useful.
Business strategies are becoming more widespread in the third sector (Dolnicar et al., 2008;
Goerke 2003) and a comparative advantage is available to nonprofit organizations that adopt a
more customer orientated stance (Rodriguez et al., 2004, p. 191). Indeed a focus on the
7
customer in order to bring about the behavioral change required by social marketing, often the
domain of nonprofit organizations, is strongly reinforced by the UK health initiative the National
Social Marketing Centre (2010). Thus, in spite of the unique characteristics of nonprofit
organizations (Dolnicar and Lazarevski 2009), a valuable response from nonprofit organizations
to the increasing competition for scarce resources would be to engage in activities that allow a
better understanding of customers, competitors and to ensure that this information is quickly
disseminated through the organization.
Following Bennett (1998b), and others (Caruana et al., 1998a, 1998b; Evans et al., 1996; Zhou et
al., 2009) this study adopted Kohli and Jaworski’s measure of market orientation – MARKOR,
with some minor modifications in language appropriate to the Australian nonprofit sector. To
date the results of these studies suggest that there is a relationship between market orientation
and performance in the nonprofit context. However, as mentioned previously, these studies have
been conducted within a single organizational context or have focused on certain sectors of the
nonprofit context. Although the implicit assumption that market orientation is equally applicable
to all nonprofits irrespective of their raison d’etre has been challenged (Bennett 2005; Gainer
and Padanyi 2005; Kara et al., 2004), no work has been found that compares the presence of, or
impact on performance of, market orientation across different types of nonprofits. Additionally
given the increasing pressures faced by nonprofit organizations it is argued that the level of
market orientation exhibited is important to record.
METHOD
With such limited foundation work, it would be useful to have a benchmark of Australian data
that may be compared with other countries where such data is available and into the future.
However, it would be useful to do this through the replication of another similar study in order that
an implied comparison can be made. A study by Bennett (1998b) was used because the Australian
third sector has, in the past, drawn from the UK for some of its legal definitions (Sargeant 2005).
Also a recent study by Dolnicar and Lazarevski (2009) showed that, despite regulatory, demographic
and size of sector variations, there were surprisingly few differences across the USA, UK and
Australian nonprofits, making this survey instrument applicable. Replication studies are useful to
social science because they are a necessary ingredient for knowledge advancement (Easley et al,
8
2000). There are four types of replication study that range from precise duplication, which is not
possible in social science (Easley et al., 2000, p85), through to a modified replication where there is
“deliberate modification of a prior study” (Easley et al., 2000, p85). A modified replication is
especially useful once a theory has been tested to offer a further contribution to understanding
phenomena (Easley et al., 2000, 88), as is the case here.
This research explored market orientation in a comprehensive range of nonprofit sectors in
Victoria, Australia. Victoria is neither one of the largest nor one of the smallest states in terms of
geographic area, nor is it one of the fastest or slowest growing states with regard to population.
With a population of around 5 million, Victoria is a reasonably densely populated state, with a
substantial capital city, Melbourne, and a rural area that does not qualify as remote. As such
Victoria is a better comparator to the UK than for example Western Australia where remoteness
and low density of population plays a significant role (ABS 2009).
The MARKOR scale was incorporated into a survey instrument following Bennett's (1998b, p37)
survey. The purpose was to examine the broader nonprofit sector in Victoria, Australia therefore
the wording ‘charity’ was changed for 'nonprofit'. Charity was unnecessarily limiting and is not
the usual expression in Australia. A modification for this study was the inclusion of a broader
range of organizations. Although Bennett limited his study to exclude the largest charities, this
study used quota sampling to upweight the smaller organizations and ensure that their presence
in the sample. The quota sampling process also ensured that all named categories of nonprofit
were surveyed but that the more substantial sectors did not dominate. For example the health
and social services are sectors with a high number of organizations and also a high number of
large organizations. In contrast the culture and recreation sector organizations are quite
numerous but are often smaller. The sample was larger than Bennett’s to accommodate these
modifications. In order to be able to sort for organizational size the survey included questions
about organizational size, and was restricted to organizations with more than five staff. Size was
established by asking about the numbers of employees, both volunteer and paid; and the annual
turnover of the organization. A second modification that extended the survey was to inquire
about the extent of support for the marketing function. For this the survey asked how many
marketing staff there were; the allocated marketing budget; and the main sources of revenue for
9
the organization. Donor orientation and fundraising were the focus of the survey questions.
The survey was conducted by telephone (Computer Aided Telephone Interviewing, CATI) with
all sectors of the third sector represented. A quota sampling method was used to ensure that a
cross section of all named sectors in Victoria was achieved (Bordens and Abbott 2005) and at
least 30 responses per sector were attained; resulting in a total of 401 participants. The CATI
enabled the data to be collected from a variety of different organizations in a relatively short
space of time (over two weeks). It also enabled the interviewer the opportunity to find the right
person within the organization regardless of the nominal title, as many ‘marketing’ activities are
not carried out by ‘marketers’ (Seymour et al., 2006). The 11 sectors as defined by the
International Classification of Non-Profit Organizations (ICNPO) are replicated in the Australian
and New Zealand Standardized Industrial Classification (ANZSIC) (ABS 2002) and all these
were successfully surveyed. The 12th category was omitted because “miscellaneous” is a
nomenclature applied by the ABS data gathering process and organizations rarely label
themselves as such. Organizations allocated to miscellaneous are not that numerous to be a
limitation. Organizational contact details were ascertained via telephone books and industry
lists. Using these criteria, it was anticipated that no sector would dominate the responses and a
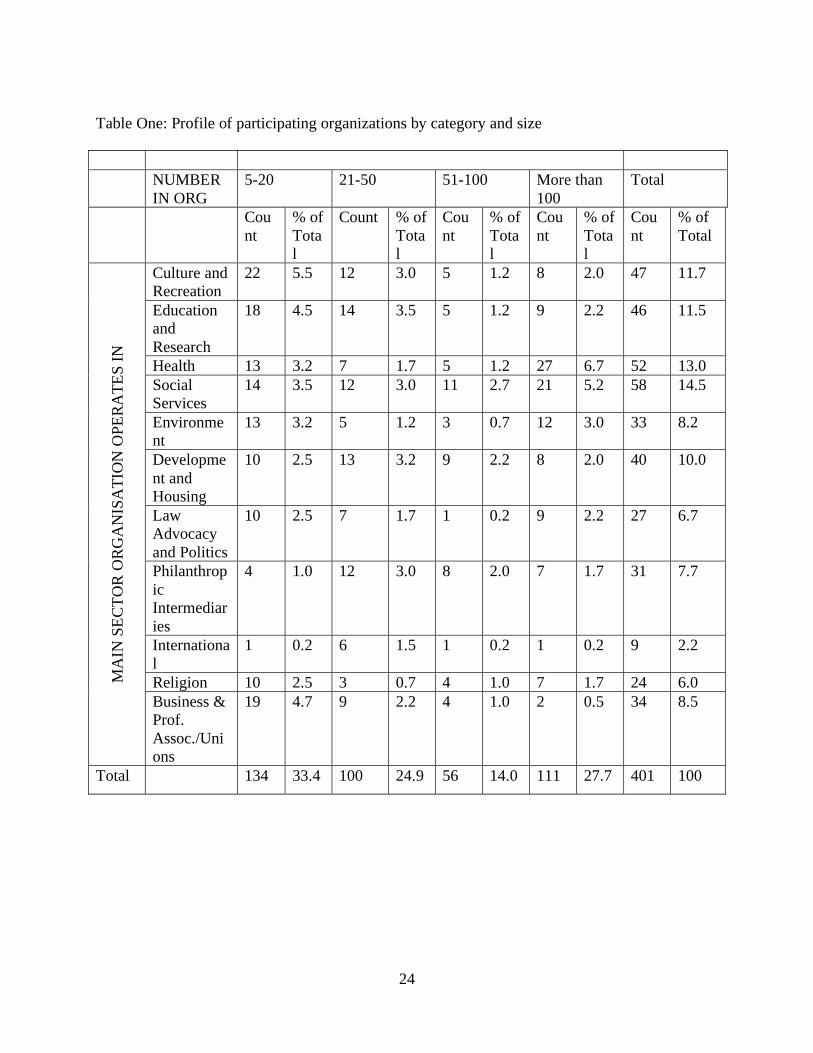
range of organizational sizes would be represented. The profile of respondents is contained in
Table One.
INSERT TABLE ONE ABOUT HERE
RESULTS
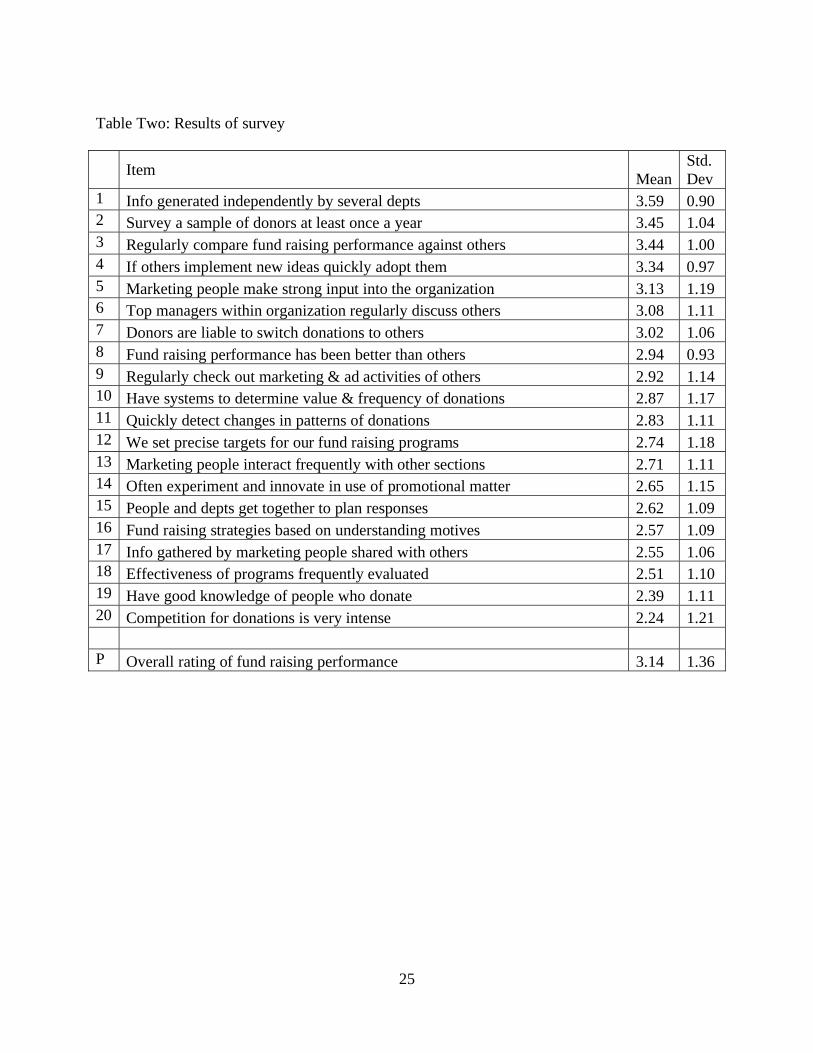
The results of the replication of Bennett’s (1998b) survey are presented in Table Two. As can be
seen, the mean values presented in Table Two suggest that the nonprofit organizations sampled
in this research are strongest at generating information on their donors and maintaining an
understanding of competitor activities and acting on this information. Overall they are weakest
on aspects such as understanding their donor base and evaluating the effectiveness of their
overall programs.
INSERT TABLE TWO ABOUT HERE
10
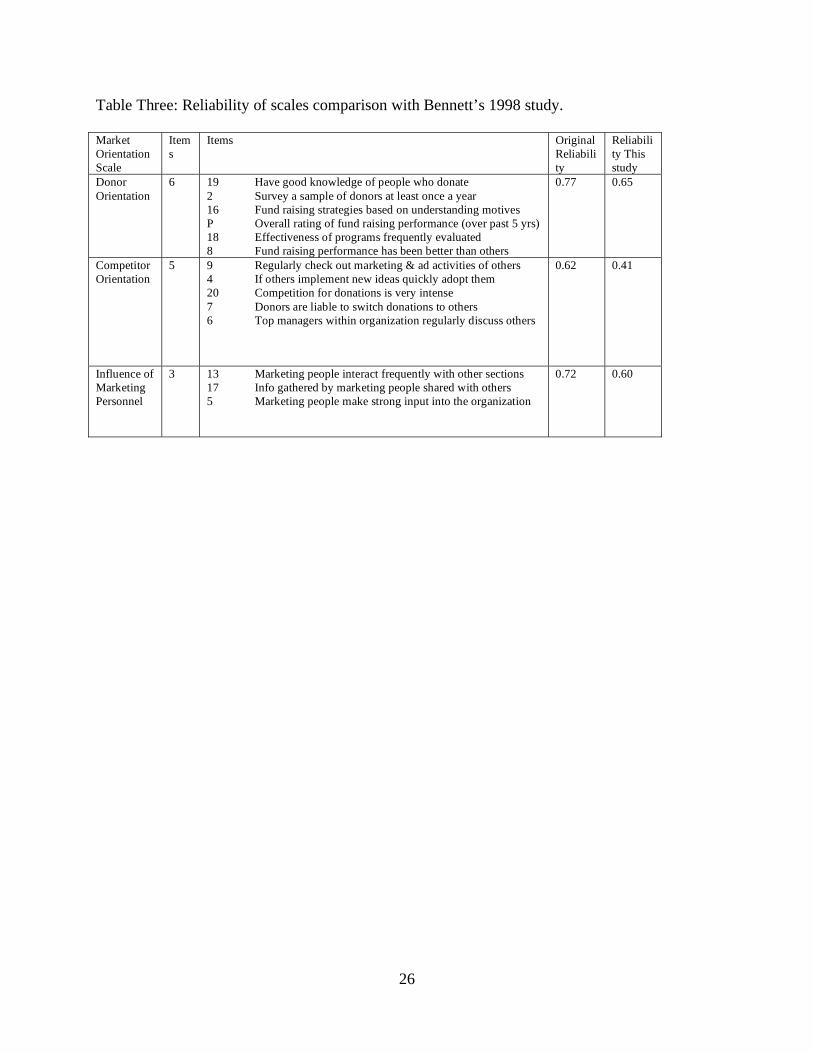
In comparison to the research undertaken by Bennett the current data has lower levels of
reliability as assessed by Cronbach’s alpha (1951) and shown in Table Three. This could suggest
that the structure of the market orientation model in this context could be re-examined so that
scale items could be adapted to better reflect the Australian context. Alternatively, as recent
literature has suggested (Coltman et al 2008) it may be more appropriate to consider market
orientation as formative model. However this study, remaining consistent with Bennett (1998b)
and the majority of work in the area continues to treat the construct reflectively.
INSERT TABLE THREE ABOUT HERE
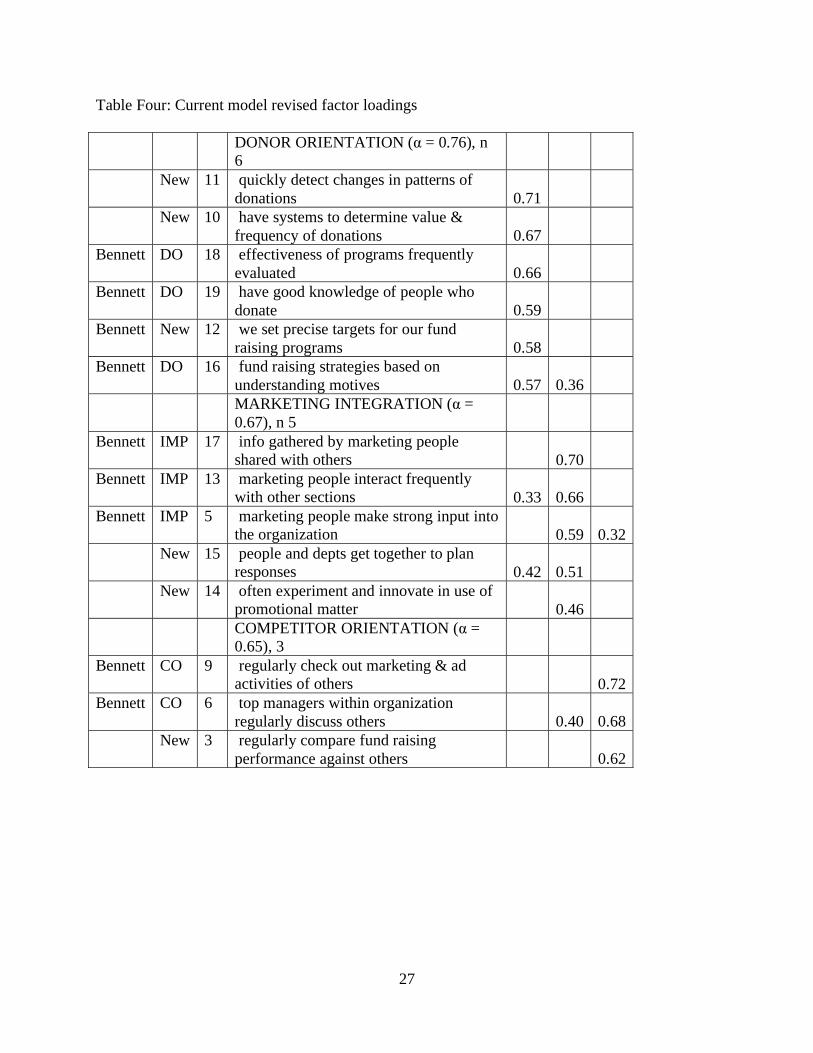
To further examine the differences identified, a factor analysis using principal components,
varimax rotation was undertaken. This process mirrors that used by Bennett and others in
examining the dimensions of the MARKOR scale. While this produces very similar dimensions
of market orientation to that of Bennett, the underlying items within each dimension are quite
different. Table Four illustrates the factor and item loadings.
INSERT TABLE FOUR ABOUT HERE
These results suggest that the behaviors which constitute donor orientation, competitor
orientation, and marketing integration are different in the Australian context. In addition, there
are a number of cross product loadings which would indicate that the dimensions are not as clear
cut as they ought to be in such an evolved theoretical concept. As a consequence, further
research might be in order to more clearly articulate the concepts as applied to the nonprofit
context.
The revised model shown in Table Four differs in a number of ways to the dimensions in
Bennett’s work. Based on our research three additional items can be considered to be part of
donor orientation:
(1) quickly detect changes in patterns of donations,
(2) have systems to determine the value and frequency of donations and
11
(3) set precise targets for fund raising programs.
Additionally, Bennett included items reflecting fund raising performance as part of a donor
orientation. This model found that the items related to fund raising performance loaded
separately to these “activity based” items and possibly represent a performance outcome of being
market oriented (not shown above). To be competitor oriented, organizations in the current
research also regularly compare their fund raising performance against others. Factors that were
present in the Bennett model that loaded independently in this research reflected the competitive
intensity of the industry (which could drive market orientation) rather than a market orientation
itself.
The Marketing Integration dimension also included two new items in addition to the three in
Bennett’s original study. These items are:
(1) people and departments getting together to plan responses and experimenting and
(2) experimenting and innovating with promotional matter.
Our model (3 dimensions) explains 36% of the variance in the data. It is worth noting that one of
Bennett’s original items “survey a sample of donors at least once a year” loaded equally on a
donor orientation and a competitor orientation and was therefore not included in either
dimension.
Market orientation and fundraising performance
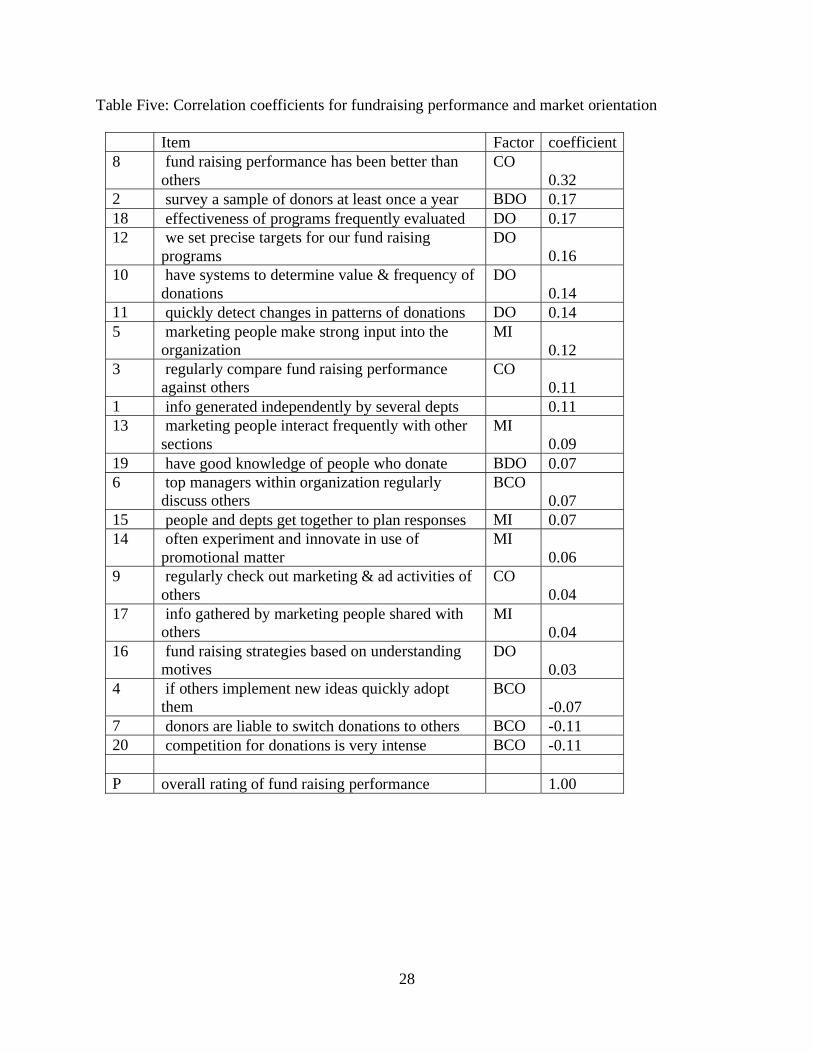
In the current research the indicator of interest is fundraising performance. The drivers of
fundraising performance are shown in Table Five.
INSERT TABLE FIVE ABOUT HERE
Bi-variate correlation analysis was conducted and Table Five shows the Pearson Correlation
coefficient of each of the items and the factors on which they loaded. Although the correlation
figures are low suggesting that these items of market orientation are only a small part of what
drives people’s perception of their fund raising performance, there is a key theme. The drivers of
performance are not uniform across the dimensions of market orientation, nor are they explained
by one of the factors in particular. What the data does indicate is that the activities more strongly
related to fundraising performance are related to processes and procedures that create knowledge
12
about donors rather than the knowledge about donors per se. That is, a nonprofit which surveys
their donors, sets targets, has knowledge generating systems and evaluates their performance will
have more fundraising performance success. Interestingly, there is a negative relationship
between competitive intensity and fund raising performance, suggesting it is easier to generate
funds in a less competitive environment. Where there are many fundraisers in the field,
attempting to gather a larger ‘share of wallet’ is more difficult for an individual organization.
This rationale underpins the experience of fundraising after the Victorian Bushfires of 2009
where the nonprofit organizations combined to allow a single organization to manage the
collection of funds rather than competing with each other for smaller shares. In this way the
media attention and fundraising efforts could be efficiently channeled. This collaboration
resulted in a much greater donation amount overall than was predicted had all the relevant
charities been independently fundraising at the same time. In this way co-opetition rather than
competition resulted in more money being donated overall. People were not being asked to
choose a charity. They were being asked to donate to an immediate and terrible emergency.
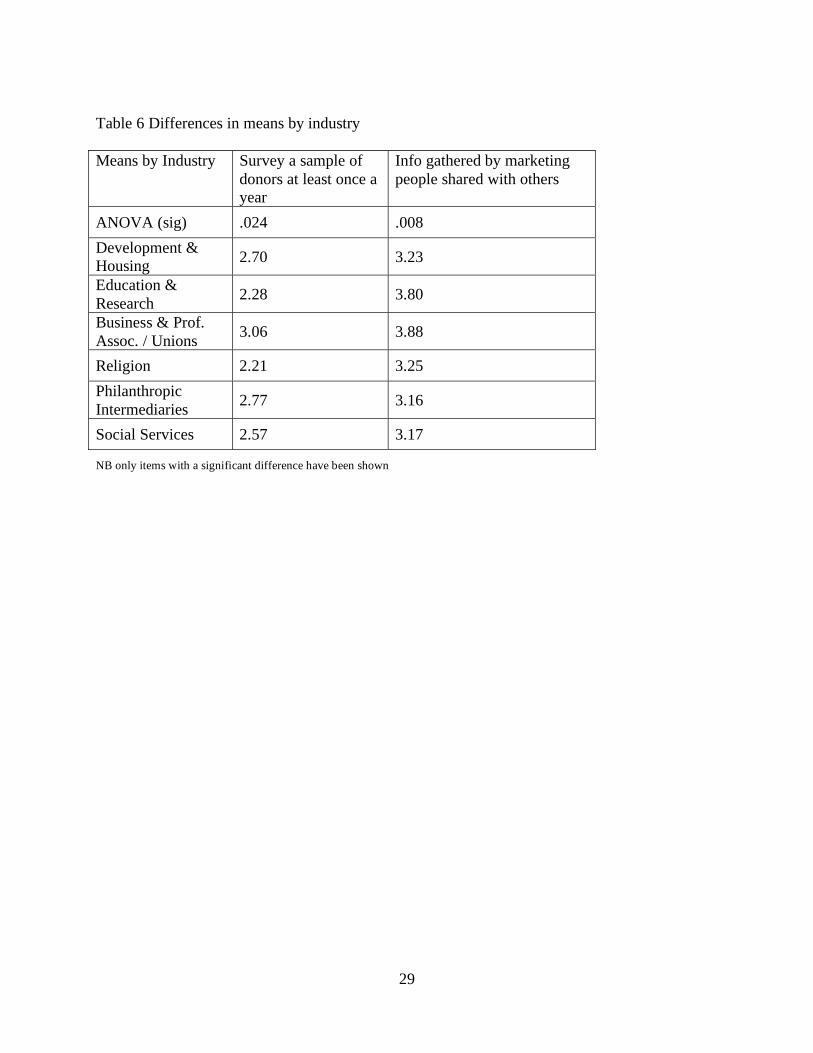
Key differences across sectors
Given the nature of market orientation and the broad scope of the nonprofit sector it is reasonable
to expect that there may be differences in the responses from the different sectors. However, the
results of a one-way ANOVA do not support this proposition. The means of scores across the
various segments are not significantly different on the market orientation scale with two
exceptions. The two items that exhibited differences were “survey a sample of donors at least
once a year” and “information gathered by marketing people is shared with others”. As can be
seen in Table Six religious organizations had significantly lower means on the item “survey a
sample of donors” than the other categories, in particular business and professional associations
and philanthropic intermediaries. Further, philanthropic organizations would appear to have less
sharing of marketing information than the other types of organization. One reason for this is that
philanthropic organizations would have less need to share information of this type. A
philanthropic organization is mostly likely to be dealing with organizations seeking donations
rather than individuals as donors or clients. In marketing terms, this would be considered as a
business-to-business rather than a business-to-consumer context, with commensurate changes in
13
strategy required.
INSERT TABLE SIX ABOUT HERE
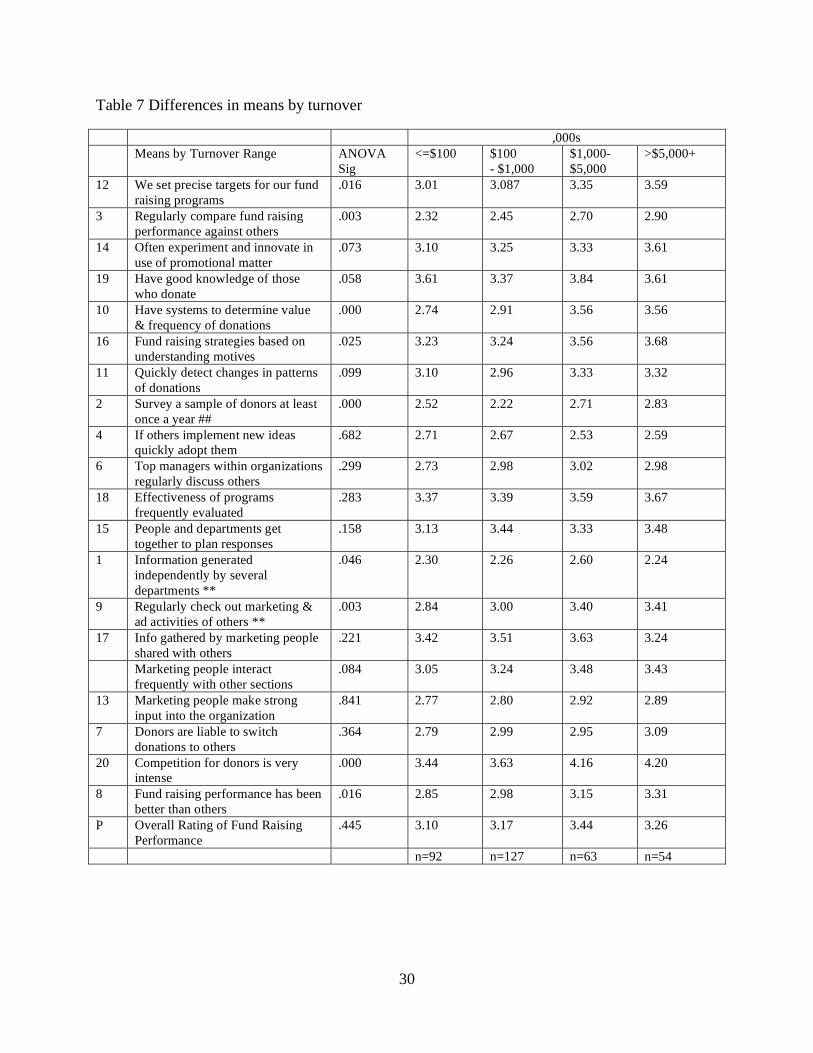
Whilst there is little difference between the groups based on the nature of the organization there
are differences based on the turnover of the organization. Using turnover as an indicator of size,
this finding is consistent with the suggestion that many of the differences in firms (including
marketing activities) is a function of size rather than the nature of the organization (cf Seymour
et al., 2006). That is, large organizations, irrespective of their nature or sector, behave like large
organizations and small organizations exhibit similar characteristics (Coviello et al., 2000). As
can been seen in Table Seven those organizations with a turnover of greater than AUD$1 million
(n = 117) exhibited higher levels of many of the indicators of market orientation than those
organizations with a lower turnover. Three of the items which had significant differences relate
to the donor orientation construct. In particular these items focus on systems or policies that the
organizations have. Further research could establish whether this difference is due to more
sophisticated business practices or, requirements for greater accountability by funding bodies and
government or alternatively if the issue is simply one of organizational size. In which case, the
concept of critical mass becomes important in designing nonprofit organizations.
INSERT TABLE SEVEN ABOUT HERE
Two items (indicated by ** in table) which had significantly different means between high and
low turnover organizations did not load on the market orientation scale. This may suggest that
organizations with greater resources are able to move “beyond the basics” of fundraising and
consider marketing from a more holistic perspective. The mean of responses to the item “survey
a sample of donors at least once a year” (indicated by ## in table) was also significantly higher in
higher turnover organizations. As noted earlier this item cannot be classified as belonging to
either a competitor or donor orientation but seems to consistently be an indicator of differences
between organizations. It could be argued that higher turnover organizations have the resources
to conduct surveys, or they have a larger donor base that requires sampling. This may be in
comparison to smaller organizations that could be closer to their donor base. A close knit donor
14
relationship might not need to use formal methods of research to understand.
DISCUSSION
This research utilized Bennett’s (1998b) development of the marketing orientation MARKOR
survey to gain a better description of the marketing function in nonprofit organizations in
Australia. It is evident that larger organizations appear to be more effective performers.
However, the research identified that smaller aspirational nonprofit organizations could readily
implement a (very) few activities to ensure that their own performance is improved. A key driver
in this instance was the annual survey of donors which clearly made a difference to performance
and is therefore worth considering in developing new models of operation. It must be noted that
the term ‘survey’ in the small nonprofit context might be a relatively simple affair and may not
require any formal process. In addition, to an annual survey, monitoring the market for
competitor activities and benchmarking performance against other organizations was also
important. These elements suggest that being sufficiently externally focused through
benchmarking and surveying opens up possibilities for organizations and increases the likelihood
of innovation and change. This might enable an organization to see and take advantage of
opportunities to serve their markets more readily than more internally focused organizations.
The use and application of information was also an important driver of performance. It was clear
that the processes by which an organization collected and used information were what provided
the support for fundraising performance. Significantly, it may not be what information is
collected; merely that it is collected, disseminated and applied. This suggests that the process
may be more important than the outcome and further research around this would be useful. As
has been noted in the past, one of the difficulties of marketing in nonprofit organizations was the
lack of marketing knowledge held by managers and administrators (Wrenn et al., 1994).
Potentially larger organizations have processes which enable or demand wider dissemination. In
addition, the effect of size of organization goes some way to explain the variations between
Bennett's study and the one reported here. The focus on diversity of organizations and gathering
information across the whole sector was a key a difference to the Bennett study, where only
small and medium sized organizations were included.
15
This study has illustrated that the quest for applying commercial (marketing) concepts to the
nonprofit sector is not completed. Much is still unanswered with regard to market orientation and
organizational performance. For example, the existence of processes that facilitate market
orientation without the apparent need to adopt a specific marketing culture deserves further
examination. This result begs the question of whether or not a philosophy needs to be
disseminated throughout the organization or whether ensuring processes exist makes certain that
market oriented activities take place. The conflict between marketing and other functions in the
nonprofit sector has been reported for the UK (Bennett and Savani 2004) so the need to find
other rationales could be anticipated. Research that uncovered the depth and presence of
marketing in nonprofit organizations would be valuable. In their international comparison,
Dolnicar and Lazarevski (2009) found only a minor role for market research and a lack of staff
trained in marketing impeded the adoption of a market orientation across nonprofit
organizations. Zhou, Chao and Huang (2009) examined market orientation in a state owned
enterprise that engaged with social marketing and they too noted a need for improved market
research, as well as the critical role of professional development for managers to "enhance the
adoption and implementation of market orientation" (2009, 268).
In addition, it is worthwhile considering whether each of the 11 sectors has specific intervening
conditions that could be accounted for and incorporated into nonprofit business strategy (cf
Gainer and Padanyi 2005). Another fruitful avenue would be to investigate specific approaches
such as relationship marketing, particularly when a sector's funding is derived primarily from
grants as opposed to soliciting donations (cf Bennett 2005). Recalling the close links between
nonprofit organizations and government noted earlier, establishing connections to the public
service could be especially pertinent to nonprofit sectors. Another significant facet is the pursuit
of social marketing strategies in order to communicate behavioral and societal change to the
general public that are widely utilized by nonprofit organizations. The key drivers identified
with this research could be examined in further depth including comparisons across sectors to
highlight any significant variations and, specific nonprofit situations could be investigated to
better understand the cultural role of the annual survey in enhancing performance. Finally, given
the reliance of market orientation on the concept on competition and the machinations of the
competitive marketplace, further consideration needs to be given to pursuing societal marketing
16
as an appropriate rationale for nonprofit organizations. The argument presented by Sargeant,
Foreman and Liao (2002) notes the broader social imperatives that underpin most nonprofit
missions and their potential lack of congruence with rational economic exchange.
CONCLUSION
Market orientation continues to be of interest to scholars. When market orientation is expressed
as a focus on fundraising there is a clear link to organizational performance. Further, there are
key activities which lead to improved organizational performance. Although the size of the
organization influences success, the results from this study demonstrate that there are very
specific activities which can lead to better outcomes for organizations of all sizes. Consequently,
smaller and medium nonprofits can hope for success regardless of their resource constraints.
Finally there continues to be a need for more research, for example around the effect of
processes regardless of culture and in comparison across different types of nonprofit
organizations.
17
REFERENCES
Andreasen A. Kotler P. 2008. Strategic Marketing for Nonprofit Organizations, 7th ed. Prentice
Hall: Upper Saddle River NJ.
Arbuthnot S, Horne S. 1997. The marketing activities of UK charities. Journal of Nonprofit and
Public Sector Marketing 5 (1): 63-79.
Australian Bureau of Statistics. 2002. 5256.0 - Australian National Accounts: Non-Profit
Institutions Satellite Account, 1999-2000 Canberra, Australia: Australian Bureau of Statistics.
Australian Bureau of Statistics. 2009. 5256.0 - Australian National Accounts: Non-Profit
Institutions Satellite Account, 2006-2007, Media Release Canberra, Australia: Australian Bureau
of Statistics.
Australian Government, Australian Taxation Office. 2007. Non-profit organizations, available at:
www.ato.gov.au/non-profit/ (accessed June 2010).
Balabanis G, Stables RE, Phillips HC. 1997. Market orientation in the top 200 British charity
organizations and its impact on their performance. European Journal of Marketing 31 (8): 583-
603.
Bennett R. 1998a. Charities, organizational learning and market orientation: A suggested
measure of the propensity to behave as a learning organization. Journal of Marketing Practice:
Applied Marketing Science 4 (1): 5-25.
Bennett R. 1998b. Market orientation among small to medium sized UK charitable organisations:
Implications for Fund-Raising Performance. Journal of Nonprofit & Public Sector Marketing 6
(1_3): 31-45.
18
Bennett R. 2003. Competitor analysis practices of British charities. Marketing Intelligence &
Planning 21 (6): 335-345
Bennett R. 2005. Competitive environment, market orientation, and the use of relational
approaches to the marketing of charity beneficiary services. The Journal of Services Marketing
19 (7): 453-469.
Bennett R, Gabriel H. 1998. Direct marketing managers in UK charitable organisations. Journal
of Nonprofit and Voluntary Sector Marketing 3 (2):160-172.
Bennett R, Sargeant A. 2005. The nonprofit marketing landscape: guest editors' introduction to a
special section. Journal of Business Research 58 (6): 797-805.
Bennett R, Savani S. 2004. Managing conflict between marketing and other functions within
charitable organisations. Leadership & Organization Development Journal 25 (2): 180-200.
Bordens KS, Abbott BB. 2005. Research design and methods: A process approach. 6th ed.
McGraw Hill: New York.
Buchanan WW, Self D, Ringram JJ. 1987. Non-profit services: adoption or adaption of
marketing. Journal of Professional Services Marketing 2 (4):83-93.
Caruana A, Ramaseshan B, Ewing MT. 1998a. Do universities that are more market orientated
perform better? The International Journal of Public Sector Management 11 (1): 55-70.
Caruana A, Ramaseshan B, Ewing MT. 1998b. The market orientation - performance link: Some
evidence from the public sector and universities. Journal of Nonprofit & Public Sector
Marketing 6 (1): 63-82.
Chan R, Chau A. 1998. Do marketing - oriented children and youth centres (CYCs) perform
19
better: An exploratory study in Hong Kong. Journal of Professional Services Marketing 16 (1):
15-28.
Coltman, T., Devinney, T. M., Midgley, D. F., Venaik, S. 2008. Formative versus reflective measurement models: Two applications of formative measurement. Journal of Business
Research, 61(12): 1250-1262.
Coviello NE, Brodie RJ, Munro HJ. 2000. An investigation of marketing practice by firm size.
Journal of Business Venturing 15:523-545.
Cronbach, LJ. 1951. Coefficient Alpha and the internal structure of tests. Psychometrika 16 (3):
297-333.
Dolnicar, S. Lazarevski, K. 2009. Marketing in non-profit organizations: An international
perspective, International Marketing Review, 26 (3): 275-291.
Dolnicar, S. Irvine, H. Lazarevski, K. 2008. Mission or money? Competitive challenges facing
public sector nonprofit organizations in an institutionalized environment, International Journal
Nonprofit Voluntary Sector Marketing, 13: 107-117.
Evans A, James T, Tomes A. 1996. Marketing in UK sport associations. Service Industries
Journal 16 (2): 207-222.
Ewing MT. Caruana A. 2000. Marketing within the public sector. Journal of Nonprofit & Public
Sector Marketing 8 (1): 3-15.
Gainer B, Padanyi P. 2005. The relationship between market-oriented activities and market-
oriented culture: implications for the development of market orientation in nonprofit service
organizations. Journal of Business Research 58 (6): 854-862.
20
Gonzalez L, Vijande M. Casielles R. (2002) The Market Orientation concept in the private
nonprofit organization domain, Int. Journal of Nonprofit and Voluntary Sector Marketing, 7, (1)
55-67.
Harrison PJ, Shaw RN. 2004. Intra-organisational marketing culture and market orientation: a
case study of the implementation of the marketing concept in a public library Library
Management 25 (8/9): 391-398.
Hayden V. 1992. How market-oriented is your service? Journal of Management in Medicine 6
(1):5-9.
Jaworski BJ, Kohli AJ. 1993. Market Orientation: Antecedents and consequences. Journal of
Marketing 57 (July): 53-70.
Kara A, Spillan JE, DeShields OW. 2004 An empirical investigation of the link between market
orientation and business performance in non-profit service providers. Journal of Marketing
Theory and Practice12 (2): 59 - 72
Kara A, Spillan JE, DeShields OW. 2005. The effect of a market orientation on business
performance: a study of small-sized service retailers using MARKOR scale. Journal of Small
Business Management 43 (2): 105-118.
Kirca AH, Jayachandran S, Bearden W. 2005. Market orientation: a meta-analytic review and
assessment of its antecedents and impact on performance. Journal of Marketing; 69 (2):24-.
Kohli AK, Jaworski BJ, Kumar A. 1993. MARKOR: A measure of market orientation. Journal
of Marketing Research XXX (3): 467-77.
Kohli AK, Jaworski BJ. 1990. Market Orientation: The construct, research propositions, and
managerial implications. Journal of Marketing 54 (April): 1-13.
21
Lamb CW, Crompton JL. 1986. Contrasting marketing and selling orientations in government
organisations. Journal of Professional Services Marketing 1 (1): 157-67.
Lyons M. 2001. Third Sector: the contribution of nonprofit and cooperative enterprises in
Australia. Allen & Unwin: Crows Nest, NSW.
McDonald RE. 2007. An investigation of innovation in nonprofit organizations: The role of
organizational mission. Nonprofit and Voluntary Sector Quarterly 36 (2): 256-281.
Narver JC, Slater SF. 1990. The effect of a market orientation on business profitability. Journal
of Marketing 54 (October): 20-35.
National Social Marketing Centre. 2010. Available at: www.nsmc.org.uk (accessed June 2010).
National Roundtable of Nonprofit Organizations. 2007. The nonprofit sector in Australia, "About
the NFP Sector", available at: www.nonprofitroundtable.org.au/ (accessed June 2010).
Padanyi P. 2008 Operationalizing the marketing concept: Achieving Market Orientation in the
nonprofit context, in A Sargeant and W Wymer, (eds) The Routledge Campanion to Nonprofit
Marketing, Routledge, Abingdon, Oxford, 11-27.
Philanthropy Australia. 2010. Philanthropy Sector Overview, available at:
www.philanthropy.org.au/sector/overview.html (accessed June 2010).
Rodriguez Cano C, Carrillat FA, Jaramillo F. 2004. A meta-analysis of the relationship between
market orientation and business performance: evidence from five continents. International
Journal of Research in Marketing 21 (2): 179-200.
Sargeant A. 2005. Marketing management for Nonprofit Organizations. 2nd ed. Oxford
University Press: Oxford.
22
Sargeant A, Foreman S, Liao M. 2002. Operationalizing the marketing concept in the nonprofit
sector. Journal of Nonprofit & Public Sector Marketing 10 (2): 41-65.
Seymour T, Gilbert D, Kolsaker A. 2006. Aspects of market orientation of English and Welsh
Charities. Journal of Nonprofit & Public Sector Marketing 16 (1/2): 151-169.
Sivaramakrishnan S, Zhang D, Delbaere M, Bruning E, 2008 The relationship between
organizational commitment and marketing orientation, Journal of Strategic Marketing, 16 (1):
55-73.
Slater SF, Narver JC. 1994. Does competitive environment moderate the market orientation-
performance relationship? Journal of Marketing 58 (January): 46-55.
Smith SC, Santandreu JR. 1997. Marketing in the nonprofit sector - The unique case of art
museums. Journal of Nonprofit and Public Sector Marketing 5 (2): 77 - 90.
Sui NYM, Wilson MS 1998 Modelling Market Orientation: An application in the education sector,
Journal of Marketing Management, 14, 293-323.
Vazquez R., Alvarez LA. Santos ML. 2002 Market Orientation and social services in private
non-profit organisations, European Journal of Marketing, 36, (9/10) 1022-1046.
White DW, Simas CF, 2008 An empirical investigation of the link between marketing
orientation and church performance, Int. J. Nonprofit Volunt. Sect. Mark. 13: 153-165.
Wood VR, Bhuian S. 1993. Market orientation and nonprofit organizations: performance
associations and research propositions. Journal of Nonprofit and Public Sector Marketing 1 (1):
7-32.
Wrenn B. 1996. What really counts when hospitals adopt a marketing orientation: The
contribution of the components of a marketing orientation to hospital performance. Journal of
23
Nonprofit & Public Sector Marketing 4 (1/2): 111-133.
Wrenn B, LaTour S, Calder, J. 1994. Differences in perceptions of hospital marketing orientation
between administrators and marketing officers. Hospital and Health Services Administration 39
(3): 341-358.
Zhou Y, Chao P, Huang G. 2009. Modeling market orientation and organizational antecedents in
a social marketing context, International Marketing Review, 26 (3): 256-274.
24
Table One: Profile of participating organizations by category and size
NUMBER IN ORG
5-20 21-50 51-100 More than 100
Total
Count
% of Total
Count % of Total
Count
% of Total
Count
% of Total
Count
% of Total
Culture and Recreation
22 5.5 12 3.0 5 1.2 8 2.0 47 11.7
Education and Research
18 4.5 14 3.5 5 1.2 9 2.2 46 11.5
Health 13 3.2 7 1.7 5 1.2 27 6.7 52 13.0
Social Services
14 3.5 12 3.0 11 2.7 21 5.2 58 14.5
Environment
13 3.2 5 1.2 3 0.7 12 3.0 33 8.2
Development and Housing
10 2.5 13 3.2 9 2.2 8 2.0 40 10.0
Law Advocacy and Politics
10 2.5 7 1.7 1 0.2 9 2.2 27 6.7
Philanthropic Intermediaries
4 1.0 12 3.0 8 2.0 7 1.7 31 7.7
International
1 0.2 6 1.5 1 0.2 1 0.2 9 2.2
Religion 10 2.5 3 0.7 4 1.0 7 1.7 24 6.0 MA
IN S
EC
TO
R O
RG
AN
ISA
TIO
N O
PE
RA
TE
S I
N
Business & Prof. Assoc./Unions
19 4.7 9 2.2 4 1.0 2 0.5 34 8.5
Total 134 33.4 100 24.9 56 14.0 111 27.7 401 100
25
Table Two: Results of survey
Item
Mean Std. Dev
1 Info generated independently by several depts 3.59 0.90
2 Survey a sample of donors at least once a year 3.45 1.04
3 Regularly compare fund raising performance against others 3.44 1.00
4 If others implement new ideas quickly adopt them 3.34 0.97
5 Marketing people make strong input into the organization 3.13 1.19
6 Top managers within organization regularly discuss others 3.08 1.11
7 Donors are liable to switch donations to others 3.02 1.06
8 Fund raising performance has been better than others 2.94 0.93
9 Regularly check out marketing & ad activities of others 2.92 1.14
10 Have systems to determine value & frequency of donations 2.87 1.17
11 Quickly detect changes in patterns of donations 2.83 1.11
12 We set precise targets for our fund raising programs 2.74 1.18
13 Marketing people interact frequently with other sections 2.71 1.11
14 Often experiment and innovate in use of promotional matter 2.65 1.15
15 People and depts get together to plan responses 2.62 1.09
16 Fund raising strategies based on understanding motives 2.57 1.09
17 Info gathered by marketing people shared with others 2.55 1.06
18 Effectiveness of programs frequently evaluated 2.51 1.10
19 Have good knowledge of people who donate 2.39 1.11
20 Competition for donations is very intense 2.24 1.21
P Overall rating of fund raising performance 3.14 1.36
26
Table Three: Reliability of scales comparison with Bennett’s 1998 study. Market Orientation Scale
Items
Items Original Reliability
Reliability This study
Donor
Orientation
6 19 Have good knowledge of people who donate
2 Survey a sample of donors at least once a year 16 Fund raising strategies based on understanding motives P Overall rating of fund raising performance (over past 5 yrs) 18 Effectiveness of programs frequently evaluated 8 Fund raising performance has been better than others
0.77 0.65
Competitor Orientation
5 9 Regularly check out marketing & ad activities of others 4 If others implement new ideas quickly adopt them 20 Competition for donations is very intense
7 Donors are liable to switch donations to others 6 Top managers within organization regularly discuss others
0.62 0.41
Influence of Marketing Personnel
3 13 Marketing people interact frequently with other sections 17 Info gathered by marketing people shared with others 5 Marketing people make strong input into the organization
0.72 0.60
27
Table Four: Current model revised factor loadings
DONOR ORIENTATION ( = 0.76), n 6
New 11 quickly detect changes in patterns of donations 0.71
New 10 have systems to determine value & frequency of donations 0.67
Bennett DO 18 effectiveness of programs frequently evaluated 0.66
Bennett DO 19 have good knowledge of people who donate 0.59
Bennett New 12 we set precise targets for our fund raising programs 0.58
Bennett DO 16 fund raising strategies based on understanding motives 0.57 0.36
MARKETING INTEGRATION ( = 0.67), n 5
Bennett IMP 17 info gathered by marketing people shared with others 0.70
Bennett IMP 13 marketing people interact frequently with other sections 0.33 0.66
Bennett IMP 5 marketing people make strong input into the organization 0.59 0.32
New 15 people and depts get together to plan responses 0.42 0.51
New 14 often experiment and innovate in use of promotional matter 0.46
COMPETITOR ORIENTATION ( = 0.65), 3
Bennett CO 9 regularly check out marketing & ad activities of others 0.72
Bennett CO 6 top managers within organization regularly discuss others 0.40 0.68
New 3 regularly compare fund raising performance against others 0.62
28
Table Five: Correlation coefficients for fundraising performance and market orientation
Item Factor coefficient
8 fund raising performance has been better than others
CO 0.32
2 survey a sample of donors at least once a year BDO 0.17
18 effectiveness of programs frequently evaluated DO 0.17
12 we set precise targets for our fund raising programs
DO 0.16
10 have systems to determine value & frequency of donations
DO 0.14
11 quickly detect changes in patterns of donations DO 0.14
5 marketing people make strong input into the organization
MI 0.12
3 regularly compare fund raising performance against others
CO 0.11
1 info generated independently by several depts 0.11
13 marketing people interact frequently with other sections
MI 0.09
19 have good knowledge of people who donate BDO 0.07
6 top managers within organization regularly discuss others
BCO 0.07
15 people and depts get together to plan responses MI 0.07
14 often experiment and innovate in use of promotional matter
MI 0.06
9 regularly check out marketing & ad activities of others
CO 0.04
17 info gathered by marketing people shared with others
MI 0.04
16 fund raising strategies based on understanding motives
DO 0.03
4 if others implement new ideas quickly adopt them
BCO -0.07
7 donors are liable to switch donations to others BCO -0.11
20 competition for donations is very intense BCO -0.11
P overall rating of fund raising performance 1.00
29
Table 6 Differences in means by industry
Means by Industry Survey a sample of donors at least once a year
Info gathered by marketing people shared with others
ANOVA (sig) .024 .008
Development & Housing
2.70 3.23
Education & Research
2.28 3.80
Business & Prof. Assoc. / Unions
3.06 3.88
Religion 2.21 3.25
Philanthropic Intermediaries
2.77 3.16
Social Services 2.57 3.17
NB only items with a significant difference have been shown
30
Table 7 Differences in means by turnover
,000s
Means by Turnover Range ANOVA
Sig
<=$100 $100
- $1,000
$1,000-
$5,000
>$5,000+
12 We set precise targets for our fund
raising programs
.016 3.01 3.087 3.35 3.59
3 Regularly compare fund raising
performance against others
.003 2.32 2.45 2.70 2.90
14 Often experiment and innovate in
use of promotional matter
.073 3.10 3.25 3.33 3.61
19 Have good knowledge of those
who donate
.058 3.61 3.37 3.84 3.61
10 Have systems to determine value
& frequency of donations
.000 2.74 2.91 3.56 3.56
16 Fund raising strategies based on
understanding motives
.025 3.23 3.24 3.56 3.68
11 Quickly detect changes in patterns
of donations
.099 3.10 2.96 3.33 3.32
2 Survey a sample of donors at least
once a year ##
.000 2.52 2.22 2.71 2.83
4 If others implement new ideas quickly adopt them
.682 2.71 2.67 2.53 2.59
6 Top managers within organizations
regularly discuss others
.299 2.73 2.98 3.02 2.98
18 Effectiveness of programs
frequently evaluated
.283 3.37 3.39 3.59 3.67
15 People and departments get
together to plan responses
.158 3.13 3.44 3.33 3.48
1 Information generated
independently by several
departments **
.046 2.30 2.26 2.60 2.24
9 Regularly check out marketing &
ad activities of others **
.003 2.84 3.00 3.40 3.41
17 Info gathered by marketing people
shared with others
.221 3.42 3.51 3.63 3.24
Marketing people interact
frequently with other sections
.084 3.05 3.24 3.48 3.43
13 Marketing people make strong
input into the organization
.841 2.77 2.80 2.92 2.89
7 Donors are liable to switch
donations to others
.364 2.79 2.99 2.95 3.09
20 Competition for donors is very intense
.000 3.44 3.63 4.16 4.20
8 Fund raising performance has been
better than others
.016 2.85 2.98 3.15 3.31
P Overall Rating of Fund Raising
Performance
.445 3.10 3.17 3.44 3.26
n=92 n=127 n=63 n=54