Embed Size (px)
Citation preview

8/3/2019 Market Outlook 11th November 2011
http://slidepdf.com/reader/full/market-outlook-11th-november-2011 1/13
Please refer to important disclosures at the end of this report Sebi Registration No: INB 010996539 1
Market OutlookIndia Research
November 11, 2011
Dealer’s Diary
Indian markets are expected to open sideways tracking mixed cues from the
markets worldwide. While the shift in epicenter of euro zone crisis from Greece toItaly have raised fresh concerns for investors and led to sharp fall in indices
worldwide on Wednesday, news of a successful bond auction in Italy pulling the
yield on Italy's ten-year bond back below 7% and election of former European
Central Bank Vice President Lucas Papademos as Greece's new prime minister
helped the markets relax and close mostly higher on Thursday.
The rebound in US stocks was also aided by better than expected economic data
from the US on Thursday. The jobless claims fell unexpectedly to 390,000 from
the previous week's revised figure of 400,000, while a separate report showed
that the U.S. trade deficit unexpectedly narrowed in September, as the value of
exports increased at a much faster rate than the value of imports.
Meanwhile, Indian investors will keenly watch out for the IIP and the weekly
inflation figures due today, which are expected to give more clarity to the
domestic markets in the coming days.
Markets Today The trend deciding level for the day is 17,451/5,250 levels. If NIFTY trades
above this level during the first half-an-hour of trade then we may witness a
further rally up to 17,570 – 17,778/5,288 – 5,356 levels. However, if NIFTY
trades below 17,451/ 5,250 levels for the first half-an-hour of trade then it may
correct up to 17,243– 17,123/5,183 – 5,144 levels.
Indices S2 S1 R1 R2
SENSEX 17,123 17,243 17,570 17,778
NIFTY 5,144 5,183 5,288 5,356
News Analysis
TCS bags US$2.2bn order
2QFY2012 Result Reviews – SBI, Tata Steel, DLF, Hindalco, Ranbaxy, Lupin, Mahindra Satyam, Bharat Forge, IRB, ITNL, CESC, Apollo Tyres, Godawari
Power, Ceat
2QFY2012 Result Previews – Coal India, NALCO, MOIL, Britannia, DISHRefer detailed news analysis on the following page
Net Inflows (November 08, 2011)
` cr Purch Sales Net MTD YTD
FII 2,269 2,053 216 521 1,037
MFs 589 439 151 (291) 4,844
FII Derivatives (November 09, 2011)
` cr Purch Sales Net Open Interest
Index Futures 2,085 1,550 535 14,497
Stock Futures 1,596 1,871 (275) 28,868
Gainers / Losers
Gainers Losers
Company Price (`) chg (%) Company Price (`) chg (%)
United Spirits 914 4.9 SBI 1,863 (6.8)
Ashok Leyland 28 3.5 Indiabulls Fin 143 (5.9)
Hindustan Unilever 391 2.9 BPCL 570 (5.5)
Manappuram Fin. 64 2.2 Voltas 102(5.2)
Wipro 377 2.1 HPCL 316 (4.9)
Domestic Indices Chg (%) (Pts) (Close)
BSE Sensex (1.2) (207.4) 17,362
Nifty (1.3) (68.3) 5,221MID CAP (1.3) (78.8) 6,233
SMALL CAP (1.1) (73.5) 6,873
BSE HC (1.7) (102.9) 6,036
BSE PSU (2.1) (157.1) 7,433
BANKEX (2.6) (297.0) 11,021
AUTO (1.7) (158.9) 9,082
METAL (2.5) (295.6) 11,539
OIL & GAS (2.3) (203.1) 8,841
BSE IT 0.4 24.0 5,793
Global Indices Chg (%) (Pts) (Close)
Dow Jones 1.0 112.9 11,894
NASDAQ 0.1 3.5 2,625
FTSE (0.3) (15.6) 5,445
Nikkei (2.9) (254.6) 8,501
Hang Seng (5.2) (1,051) 18,964
Straits Times (2.5) (71.8) 2,787
Shanghai Com (1.8) (45.4) 2,480
Indian ADRs Chg (%) (Pts) (Close)
Infosys (0.0) (0.0) $56.0
Wipro 0.7 0.1 $9.7
ICICI Bank 0.2 0.1 $33.3
HDFC Bank (1.3) (0.4) $29.1
Advances / Declines BSE NSE
Advances 991
Declines 1,879 1,124
Unchanged 104 48
Volumes (` cr)
BSE 2,576
NSE 11,024
8/3/2019 Market Outlook 11th November 2011
http://slidepdf.com/reader/full/market-outlook-11th-november-2011 2/13
Market Outlook | India Research
November 11, 2011 2
TCS bags US$2.2bn order
Diligenta, the business process outsourcing (BPO) provider in the UK and a
subsidiary of TCS, announced that it will assume administration responsibility for
3.2mn policies for Friends Life, a provider of pensions, investments and insurance.
The agreement, effective from March 1, 2012, is worth US$2.2bn (£1.37bn) over
15 years. This major business win will increase the total number of policies
administered by Diligenta to just under 8mn. Outsourcing much of its customer
service and IT functions for its UK heritage business will allow Friends Life to focus
on its new proposition developments, including its new corporate platform, in its
core markets of corporate benefits, protection and retirement income.
Diligenta will assume administration responsibility for much of Friends Life’s closed
book protection business and a significant part of its corporate benefits business.
Diligenta and TCS will deliver IT infrastructure and IT services with some policies
migrating to TCS BaNCS Insurance, a globally recognized industry-leading
insurance platform. As a result of this new arrangement, a total of approximately
1,900 Friends Life roles across a number of office locations in the UK will transfer
under their existing terms of employment to Diligenta. All those who will transfer
would continue to service Friends Life’s customers, ensuring both continuity of
service delivery and expertise. This is the second biggest order ever signed by TCS.
We continue to maintain our Accumulate recommendation on the stock with a
target price of `1,220.
Result Reviews
State Bank of India
For 2QFY2012, SBI’s standalone net profit increased by 12.4% yoy to ` 2,810cr,
in-line with our estimates. A strong sequential expansion in both domestic and
foreign NIM was the major positive from the result. However, fresh slippages of
` 8,000cr and lower recoveries and upgrades during the quarter led to gross NPAs
shooting up by 22.2% qoq. Gross NPA ratio as of 2QFY2012 stood at 4.2% and
net NPA ratio stood at 2.0%. Provisioning coverage ratio declined considerably by
375bp to 63.5%. The bank made counter-cyclical provisions of ` 550cr in2QFY2012 ( ` 1,100 for 1HFY2012) to meet the stipulated 70% provision coverage
to gross NPA ratio as of September 30, 2010. Non-interest income declined by
14.4% yoy on account of lower treasury gains and dividend income (no interim
dividend received from subsidiaries). Fee income also came in lower by 11.7% yoy
mainly on account of bulk upfront fees received from some large corporate deals
last year and lower cross-sell income.
The stock is trading at 1.2x FY2013E ABV (adjusting for value of subsidiaries).
We recommend a Buy rating on the stock with a target price of `2,194.

8/3/2019 Market Outlook 11th November 2011
http://slidepdf.com/reader/full/market-outlook-11th-november-2011 3/13
Market Outlook | India Research
November 11, 2011 3
Tata Steel
Tata Steel reported disappointing profitability for 2QFY2012. Consolidated net
sales increased by 14.5% yoy to ` 32,798cr (above our estimate of ` 30,936cr)
mainly on account of increased average realizations. Tata Steel India’s net sales
increased by 15.7% yoy to ` 81,42cr. Tata Steel India operations sales volumes
decreased by 0.7% yoy to 1.65mn tonnes, while Tata Steel Europe (TSE) operations
sales volumes decreased by 1.7% yoy to 3.48mn tonnes in 2QFY2012. Tata Steel
India’s average realization/tonne increased by 18.6% yoy to ` 46,402, while TSE’s
average realization/tonne decreased by 1.0% yoy to US$1,148 on account of
subdued demand in Europe. EBITDA/tonne decreased by 19.1% and 47.0% yoy to
US$365 and US$30 in Tata Steel India and TSE operations, respectively, as
increased realization (at India operations) was more than offset by higher raw-
material costs. Consolidated EBITDA decreased by 25.1% yoy to ` 2,750cr. Other
income decreased to ` 120cr compared to ` 814cr in 2QFY2011. The company reported exceptional forex loss of ` 150cr in 2QFY2012. Adjusting for exceptional
items, adjusted net profit decreased by 81.4% yoy to ` 362cr, significantly below
our estimate of ` 1,339cr. Consolidated reported net profit stood at ` 212cr
compared to ` 1,979cr in 2QFY2011. Standalone net profit decreased by 27.6%
yoy to ` 1,495cr. Consolidated net debt stood at US$8.4bn as on September 30,
2011. We maintain our Buy rating on the stock; our target price is under review.
DLF
DLF announced its 2QFY2012 numbers. The company’s net sales increased by 6.9% yoy to ` 2,532cr ( ` 2,369cr), below our estimate of ` 2,674cr. EBITDA came in
at ` 1,173cr, up 26.3% yoy, on the back of strong margin expansion. OPM
expanded by 711bp yoy to 46.3%, which was above our estimate of 43.0%. PAT
declined by 11.0% yoy to ` 372cr, which was slightly below our estimate of ` 399cr.
The decline in PAT was largely due to higher tax rate during the quarter, which
increased to 28.6% of PBT in 2QFY2012 vs. 14.9% of PBT in 2QFY2011. We
continue to maintain our Neutral recommendation on the stock. We may revise
our estimates and target price post management’s concall.
Hindalco
Hindalco and Novelis reported their 2QFY2012 results separately. Hindalco’s
standalone net sales increased by 7.2% yoy to ` 6,220cr, driven by increased
realization. However, EBITDA decreased by 4.2% yoy to ` 669cr on account of
rising costs of power, driven by increased coal prices. Power costs grew by 31.1%
yoy to ` 753cr. Thus, EBITDA margin slipped by 128bp yoy to 10.8% in
2QFY2012. Other income grew by 114.5% yoy to ` 176cr. Tax rate stood at 16.8%
compared to 22.0% in 2QFY2011. Consequently, net profit increased by 15.8%
yoy to ` 503cr. Hindalco has delayed its completion timeline of Mahan Aluminium
smelter to early CY2012 (CY2011-end earlier).

8/3/2019 Market Outlook 11th November 2011
http://slidepdf.com/reader/full/market-outlook-11th-november-2011 4/13
Market Outlook | India Research
November 11, 2011 4
Novelis' net sales grew by 14.1% yoy to US$2,880mn, driven by increased
realization. However, EBITDA decreased modestly by 0.9% yoy to US$228mn on
account of increased cost of goods sold, which grew by 16.5% yoy to
US$2,549mn. The company’s tax expense stood at US$(7)mn compared toUS$56mn in 2QFY2011. Consequently, net profit grew 140.0% yoy to US$120mn
in 2QFY2012.
We maintain our our Buy rating on Hindalco; our target is price under review.
Ranbaxy – 3QCY2011
For 3QCY2011, Ranbaxy reported net sales of ` 2,023cr, up 7.7% yoy. Gross
margin decreased by 65bp yoy for the quarter. OPM increased to 5.0% (4.7%)
during the quarter. The company reported loss of ` 465cr in earnings due to loss
on foreign exchange on foreign currency option derivatives (loss of ~ ` 400cr). Thestock is under review.
Lupin
For 2QFY2012, Lupin reported net sales of ` 1,742cr, up 23.6% yoy. Gross margin
increased by 465bp yoy for the quarter. OPM increased to 21.4% (19.4%) during
the quarter, despite higher manufacturing and other expenses (up 319bp yoy).
Adjusted net profit increased by 23.5% yoy to ` 267cr ( ` 216cr) despite higher
depreciation and tax rate. We maintain our Buy rating on the stock with a target
price of `593.
Mahindra Satyam
Mahindra Satyam (Satyam) announced its 2QFY2012 results, which were lower
than our expectations on the operating front. However, the company outperformed
on the PAT front. Dollar revenue came in at US$330mn, up 3.1% qoq, on the back
of 4.5% qoq volume growth. In rupee terms, the company’s revenue came in at
` 1,578cr, up by whopping 10.0% qoq. EBITDA margin expanded by 49bp qoq to
15.3%, lower than our expectation, due to higher operational expense because of
deployment of hardware and software licenses (25cr-30cr). PAT came in at
` 238cr, up 5.8% qoq. The stock is currently under review.
Bharat Forge
Bharat Forge (BFL) registered better-than-expected 26.6% yoy (6.1% qoq) jump in
its standalone revenue to ` 910cr, driven by robust 57.6% yoy (13.3% qoq) growth
in exports revenue. Strong growth in the CV segment and non auto segment in the
Europe and US benefitted the company’s exports performance. During 2QFY2012,
tonnage volume increased by 16.5% yoy (1.5% qoq) to 53,740MT on strongexport demand and increased average net realization increased (8.1% yoy, 4.7%
qoq). Domestic revenue growth was, however, sluggish as it grew modestly by
5.2% yoy (0.5% qoq) on account of slowdown in the automotive sector and

8/3/2019 Market Outlook 11th November 2011
http://slidepdf.com/reader/full/market-outlook-11th-november-2011 5/13
Market Outlook | India Research
November 11, 2011 5
industrial activity. On the operating front, the company's margin slipped by 56bp
yoy (63bp qoq) to 23.7%. While raw-material costs as a percentage of sales
remained stable, manufacturing expenses as a percentage of sales increased by
116bp yoy. Led by stable operating performance, a substantial increase in otherincome and lower tax rate, BFL's net profit jumped by 56.1% yoy (9.2% qoq)
to ` 106cr.
On a consolidated basis, BFL reported strong 25.3% yoy (flat qoq) growth in its top
line to ` 1,559cr. EBITDA margin came in slightly ahead of our estimates at 16.2%,
an increase of 50bp yoy (42bp qoq), resulting in a 55.2% yoy (1.2% qoq) increase
in PBT to ` 155cr. The stock rating is currently under review.
IRB
For 2QFY2012, IRB Infra reported a strong set of numbers, in-line with ourestimates. The company’s top line witnessed robust growth of 50.1% to ` 735.9cr
( ` 490.3cr), marginally ahead of our estimate of ` 687.0cr. On the EBITDAM front,
margin came at 43.7% (48.2%), slightly lower than our estimate of 45.2%. Interest
cost came in at ` 141.1cr ( ` 69.3cr), registering a jump of 103.7%/20.2% on a
yoy/qoq basis. At the earnings front as well, IRB Infra reported healthy growth of
22.1% to ` 147.6cr ( ` 120.9cr) and 11.1% to ` 110.1cr ( ` 99.1cr) on a yoy basis at
the PBT and PAT levels, respectively, against our estimate of ` 147.1cr and
` 107.3cr for PBT and PAT, respectively.
Our valuation of ` 193/share for the consolidated business uses NPV/EV/EBITDA-
based valuation for BOT assets and the C&EPC arm, respectively. We factor inCoE of 14% and a traffic growth rate of 5/6/7% for its BOT assets. We maintain
our view on the stock with a target price of `193.
ITNL
ITNL reported a good set of numbers for 2QFY2012. Revenue for the quarter
came in at ` 1,256cr ( ` 883cr), registering 42.1% yoy growth, primarily due to
higher revenue of the C&EPC segment. On a sequential basis as well, ITNL’s
revenue grew by 14.9%. EBITDA margin for the quarter stood at 28.4% vs. 29.6%
in 2QFY2011, down 120bp, mainly on account of increased contribution from the
relatively low-margin C&EPC segment, as expected. ITNL’s interest cost during the
quarter grew by 72.3%/18.8% yoy/qoq to ` 169.4cr ( ` 98.3cr). The bottom line
witnessed modest 8.2% yoy growth to ` 116.2cr ( ` 107.5cr), owing to lower
EBITDAM and higher interest cost during the quarter.
We have valued ITNL on an SOTP basis by assigning 6x EV/EBITDA to its
standalone business and have valued its investments on DCF/Mcap/BV basis
on FY2013E. We continue to maintain our Buy rating on the stock with a target
price of `260/share, implying an upside of 27.9% from current levels.

8/3/2019 Market Outlook 11th November 2011
http://slidepdf.com/reader/full/market-outlook-11th-november-2011 6/13
Market Outlook | India Research
November 11, 2011 6
CESC
During 2QFY2012, CESC reported 12.3% yoy growth in its standalone net sales to
` 1,241cr. Top-line growth was on account of better realization, as the volume of
power generated during the quarter was flat yoy at 2,355MU. Operating profit
during the quarter decreased by 18.2% yoy to ` 260cr. OPM for the quarter
declined by 783bp yoy to 21.0% on account of higher other expenses. Other
expenses during the quarter were higher on a yoy basis, at ` 195cr, on a low base
(CESC reported negative other expenses of ` 14cr in 2QFY2011). Other expenses
for the quarter included cost adjustments of ` 67cr as against negative ` 217cr in
2QFY2011. On the bottom-line front, net profit decreased by 26.5% yoy to
` 114cr. We maintain our Buy view on the stock; our target price is under review.
Apollo Tyres Apollo Tyres (APTY) reported a mixed set of results for 2QFY2012. While
standalone operating performance was subdued due to adverse product mix and
continued raw-material cost pressures, European operations posted strong results
led by robust demand for winter tyres ahead of the peak season.
For 2QFY2012, APTY registered 47.3% yoy (1.7% qoq) growth in its consolidated
net revenue to ` 2,871cr. Top-line growth was aided by 31.9% yoy (down 4% qoq)
growth in volumes to 120,000MT and 11.7% yoy (6% qoq) growth in average net
realization. On a low base of 2QFY2011 (lock-out at Cochin plant), standalone
volumes reported a 37% yoy jump, leading to 56.9% growth in revenue; however,
on a sequential basis, standalone volumes declined by ~10%. Europe and South
Africa operations registered strong revenue growth of 42.8% and 14.8% yoy,
respectively, during the quarter.
The company's operating margin declined by 148bp yoy (49bp qoq) to 8%, mainly
due to weak operating performance at the standalone level. While average rubber
cost declined by 4.1% sequentially, cost of other raw materials such as NTC and
carbon black moved up slightly due to depreciation of the INR. As a result,
consolidated raw material to net sales ratio stood at 67.5%, witnessing an increase
of 860bp yoy and 180bp qoq. EBIT margin at the European subsidiary expanded
by 240bp yoy (85bp qoq) to 10.6%, aided by price hike undertaken in June 2011.
Net profit grew by 46% yoy to ` 78cr. However, on a sequential basis, net profit
stood flat. A significant increase in other income and lower tax-rate benefited the
company's bottom-line performance during the quarter. We retain our Buy rating
on the stock with a target price of `74.
Godawari Power & Ispat
Godawari Power and Ispat reported its 2QFY2012 results. Consolidated net sales
increased by 190.0% yoy to ` 429cr, driven by increased volumes and realization.
However, EBITDA grew only by 73.2% yoy to ` 53cr on account of rising prices of
key inputs. Raw-material costs as a percentage of net sales stood at 65.8% in
2QFY2012, compared to 49.1% in 2QFY2011. Thus, EBITDA margin slipped by
828bp yoy to 12.3% in 2QFY2012. Interest costs and depreciation grew by
145.0% and 51.7% yoy to ` 25cr and ` 17cr, respectively. Consequently, net profit

8/3/2019 Market Outlook 11th November 2011
http://slidepdf.com/reader/full/market-outlook-11th-november-2011 7/13
Market Outlook | India Research
November 11, 2011 7
increased by 50.0% yoy to ` 11cr. We maintain our Buy rating on the stock; our
target price is under review.
Ceat
Ceat reported strong operating performance for 2QFY2012; however the bottom
line was severely impacted on account of high interest and depreciation expense
due to commissioning of the new facility at Halol. Ceat returned back to
profitability in 2QFY2012 after reporting losses at the operating as well as bottom-
line front in 1QFY2012.
Net sales grew strongly by 32.7% yoy (3.7% qoq) to ` 1,118cr on account of
availability of additional capacity at Halol plant and average price hike of ~10%
in 1QFY2012. Top-line growth also benefited from a 21.4% yoy increase in other
operating income. Operating margin improved by 27bp yoy to 5.5%, largely due
to ramp-up at Halol facility and price increases carried out in 1QFY2012. While
raw-material cost as a percentage of sales increased by 223bp yoy, the decline in
staff cost and other expenditure as a percentage of sales by 129bp and 132bp
yoy, respectively, helped Ceat maintain its margins. Net profit, however, fell
sharply by 63.3% yoy to ` 6cr due to a significant increase in depreciation (114%
yoy) and interest expense (170% yoy).
We expect the company to report continuous improvement in its operating
performance, led by improving utilization at Halol plant and a gradual decline in
raw-material prices. We maintain our Buy rating on the stock; however our target
price is under review.
Result Previews
Coal India
Coal India is slated to report its 2QFY2012 results tomorrow. We expect net sales
to increase by 18.2% yoy to ` 13,774cr mainly on account of increase in coal
prices. EBITDA margin is expected to expand 1,207bp yoy to 28.0% in 2QFY2012.
Net profit is expected to increase by 111.7% yoy to ` 3,164cr. We recommend
Accumulate on the stock.
Nalco
Nalco is slated to report its 2QFY2012 results. We expect net sales to decreaseby 1.0% yoy to ` 1,440cr despite higher realization on account of productioncuts during the quarter. EBITDA margin is expected to contract by 122bp yoy to 21.0% due to lower volumes and rise in prices of key inputs (primarily coal).Net profit is expected to increase by 6.2% yoy to ` 238cr. We maintain ourNeutral view on the stock.

8/3/2019 Market Outlook 11th November 2011
http://slidepdf.com/reader/full/market-outlook-11th-november-2011 8/13
Market Outlook | India Research
November 11, 2011 8
MOIL
MOIL is slated to report its 2QFY2012. We expect net sales to decline by 36.8%
yoy and 14.5% qoq to ` 180cr, mainly on account of a sharp decline in
manganese ore prices. Nevertheless, EBITDA margin is expected to improve by
1,967bp yoy, but decline by 430bp qoq, to 56.0% in 2QFY2012. Net profit is
expected to decrease by 70.2% yoy and 15.1% qoq to ` 93cr. We maintain our
Neutral view on the stock.
Britannia
Britannia is expected to announce its 2QFY2012 results. For the quarter, we expect
the company to report healthy revenue growth of 18% yoy to ` 1,291cr due to
improvement in sales mix. We expect the company to report a margin
improvement yoy for the quarter, despite high raw-material cost pressure. Earnings
for the quarter are expected to grow by 27% yoy to ` 42cr on the back of margin
expansion and healthy top-line growth. At the CMP, the stock is trading at 21.1x
F2013E EPS of `21.1. We recommend a Neutral rating on the stock.
Dishman Pharma
For 2QFY2012, Dishman Pharma (DISH) is expected to post net sales growth of
12.8% yoy. OPM for the quarter is likely to expand to 18.6%. However, the
company’s net profit is expected to come in at ` 16cr, reporting a dip of 43.1% yoy.
We maintain our Buy rating on the stock with a target price of `133.

8/3/2019 Market Outlook 11th November 2011
http://slidepdf.com/reader/full/market-outlook-11th-november-2011 9/13
Market Outlook | India Research
November 11, 2011 9
Quarterly Bloomberg Brokers’ Consensus Estimates
Mundra Port & SEZ Ltd. - (11/11/2011)
Particulars (` cr) Q2 FY12E Q2 FY11 y-o-y (%) Q1 FY12 q-o-q (%)
Net sales 554 408 36.0 516 7.4
EBITDA 380 274 38.8 363 4.7
EBITDA margin (%) 69 67 70
Net profit 271 212 27.8 254 6.4
Source: Bloomberg
Tata Chemicals Ltd. - Consolidated - (11/11/2011)
Particulars (` cr) Q2 FY12E Q2 FY11 y-o-y (%) Q1 FY12 q-o-q (%)
Net sales 2,950 2,935 0.5 2,924 0.9
EBITDA 556 418
33.1
527 5.6EBITDA margin (%) 19 14 18
Net profit 207 127 63.2 200 3.8
Source: Bloomberg
Adani Power Ltd. - (11/11/2011)
Particulars (` cr) Q2 FY12E Q2 FY11 y-o-y (%) Q1 FY12 q-o-q (%)
Net sales 964 395 144.0 819 17.8
EBITDA 524 209 150.3 410 27.8
EBITDA margin (%) 54 53 50
Net profit 224 126 78.3 177 26.9
Source: Bloomberg
HDIL Ltd. - (11/11/2011)
Particulars (` cr) Q2 FY12E Q2 FY11 y-o-y (%) Q1 FY12 q-o-q (%)
Net sales 491 373 31.7 502 (2.3)
EBITDA 251 367 (31.6) 266 (5.6)
EBITDA margin (%) 51 99 53
Net profit 192 214 (10.4) 209 (8.4)
Source: Bloomberg
Reliance Communication Ltd. - Consolidated (12/11/2011)
Particulars (` cr) Q2 FY12E Q2 FY11 y-o-y (%) Q1 FY12 q-o-q (%)
Net sales 5,041 4,973 1.4 4,712 7.0
EBITDA 1,630 1,564 4.2 1,511 7.9
EBITDA margin (%) 32 31 32
Net profit 169 446 (62.1) 157 7.7
Source: Bloomberg
8/3/2019 Market Outlook 11th November 2011
http://slidepdf.com/reader/full/market-outlook-11th-november-2011 10/13
Market Outlook | India Research
November 11, 2011 10
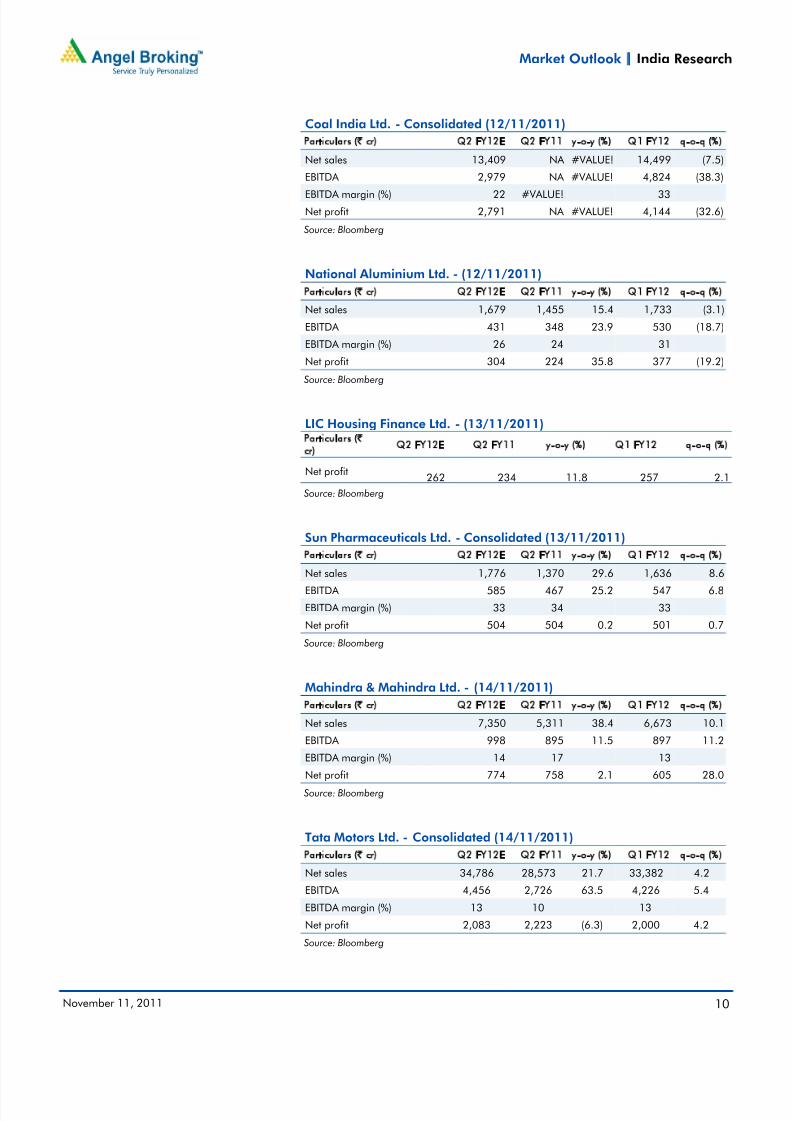
Coal India Ltd. - Consolidated (12/11/2011)
Particulars (` cr) Q2 FY12E Q2 FY11 y-o-y (%) Q1 FY12 q-o-q (%)
Net sales 13,409 NA #VALUE! 14,499 (7.5)
EBITDA 2,979 NA #VALUE! 4,824 (38.3)
EBITDA margin (%) 22 #VALUE! 33
Net profit 2,791 NA #VALUE! 4,144 (32.6)
Source: Bloomberg
National Aluminium Ltd. - (12/11/2011)
Particulars (` cr) Q2 FY12E Q2 FY11 y-o-y (%) Q1 FY12 q-o-q (%)
Net sales 1,679 1,455 15.4 1,733 (3.1)
EBITDA 431 348 23.9 530 (18.7)
EBITDA margin (%) 26 24 31
Net profit 304 224 35.8 377 (19.2) Source: Bloomberg
LIC Housing Finance Ltd. - (13/11/2011)Particulars (`cr)
Q2 FY12E Q2 FY11 y-o-y (%) Q1 FY12 q-o-q (%)
Net profit262 234 11.8 257 2.1
Source: Bloomberg
Sun Pharmaceuticals Ltd. - Consolidated (13/11/2011)
Particulars (` cr) Q2 FY12E Q2 FY11 y-o-y (%) Q1 FY12 q-o-q (%)
Net sales 1,776 1,370 29.6 1,636 8.6
EBITDA 585 467 25.2 547 6.8
EBITDA margin (%) 33 34 33
Net profit 504 504 0.2 501 0.7
Source: Bloomberg
Mahindra & Mahindra Ltd. - (14/11/2011)
Particulars (` cr) Q2 FY12E Q2 FY11 y-o-y (%) Q1 FY12 q-o-q (%)
Net sales 7,350 5,311 38.4 6,673 10.1
EBITDA 998 895 11.5 897 11.2
EBITDA margin (%) 14 17 13
Net profit 774 758 2.1 605 28.0
Source: Bloomberg
Tata Motors Ltd. - Consolidated (14/11/2011)
Particulars (` cr) Q2 FY12E Q2 FY11 y-o-y (%) Q1 FY12 q-o-q (%)
Net sales 34,786 28,573 21.7 33,382 4.2
EBITDA 4,456 2,726 63.5 4,226 5.4
EBITDA margin (%) 13 10 13
Net profit 2,083 2,223 (6.3) 2,000 4.2
Source: Bloomberg

8/3/2019 Market Outlook 11th November 2011
http://slidepdf.com/reader/full/market-outlook-11th-november-2011 11/13
Market Outlook | India Research
November 11, 2011 11
Adani Enterprise Ltd. - Consolidated (14/11/2011)
Particulars (` cr) Q2 FY12E Q2 FY11 y-o-y (%) Q1 FY12 q-o-q (%)
Net sales 8,120 5,750 41.2 9,596 (15.4)
EBITDA 1,349 726 85.9 1,168 15.5
EBITDA margin (%) 17 13 12
Net profit 515 509 1.1 570 (9.7)
Source: Bloomberg
Unitech Ltd. - Consolidated (14/11/2011)
Particulars (` cr) Q2 FY12E Q2 FY11 y-o-y (%) Q1 FY12 q-o-q (%)
Net sales 660 645 2.3 596 10.7
EBITDA 172 253 (32.0) 120 43.5
EBITDA margin (%) 26 39 20
Net profit 115 174 (33.9) 98 16.9 Source: Bloomberg
Tata Power Company Ltd. - Consolidated (14/11/2011)
Particulars (` cr) Q2 FY12E Q2 FY11 y-o-y (%) Q1 FY12 q-o-q (%)
Net sales 5,782 4,798 20.5 5,805 (0.4)
EBITDA 1,505 1,137 32.3 1,412 6.6
EBITDA margin (%) 26 24 24
Net profit 578 673 (14.0) 419 38.2
Source: Bloomberg
BHEL Ltd. - (14/11/2011)
Particulars (` cr) Q2 FY12E Q2 FY11 y-o-y (%) Q1 FY12 q-o-q (%)
Net sales 9,716 8,328 16.7 7,126 36.3
EBITDA 1,810 1,632 10.9 1,113 62.6
EBITDA margin (%) 19 20 16
Net profit 1,275 1,142 11.6 816 56.4
Source: Bloomberg
Cipla Ltd. - (14/11/2011)
Particulars (` cr) Q2 FY12E Q2 FY11 y-o-y (%) Q1 FY12 q-o-q (%)
Net sales 1,760 1,580 11.4 1,550 13.5
EBITDA 391 367 6.6 370 5.7
EBITDA margin (%) 22 23 24
Net profit 272 263 3.4 253 7.5
Source: Bloomberg
Jai Prakash Associates Ltd. - (14/11/2011)
Particulars (` cr) Q2 FY12E Q2 FY11 y-o-y (%) Q1 FY12 q-o-q (%)
Net sales 3,118 2,993 4.2 3,142 (0.8)
Net profit 117 116 1.1 107 9.2
Source: Bloomberg

8/3/2019 Market Outlook 11th November 2011
http://slidepdf.com/reader/full/market-outlook-11th-november-2011 12/13
Market Outlook | India Research
November 11, 2011 12
Economic and Political News
Domestic car sales dip by 24% yoy in October 2011
No automatic route for FDI into existing pharma firms
Agriculture sector growth of 4% will check inflation: Planning Commission
Corporate News
PFC gets nod to launch US$1bn private equity fund
EMC wins ` 776cr deal from PowerGrid Corp.
HCC’s arm Lavasa gets environment ministry's nod
Source: Economic Times, Business Standard, Business Line, Financial Express, Mint
Results Calendar
11/11/2011 Mundra Port, Adani Power, Tata Chemicals, Reliance Capital, Britannia, MOIL, HDIL, Anant Raj, SpiceJet, Dishman Pharma
12/11/2011 Coal India, Nalco, Rcom, IVRCL Infra
13/11/2011 Sun Pharma, LIC Housing Fin.
14/11/2011BHEL, Tata Motors, Adani Enterp., M&M, Cipla, Jaiprakash Asso., JSW Steel , Unitech, Bhushan Steel, GSPL, Aventis, Areva, BGR Energy , India Cements, Amara Raja Batteries, Graphite India, Simplex Infra, Patel Engg., Madhucon Proj, JK Tyre
15/11/2011 Tech Mahindra

8/3/2019 Market Outlook 11th November 2011
http://slidepdf.com/reader/full/market-outlook-11th-november-2011 13/13
Market Outlook | India Research
N b 11 2011 13
Research Team Tel: 022 - 39357800 E-mail: [email protected] Website: www.angelbroking.com
DISCLAIMER
This document is solely for the personal information of the recipient, and must not be singularly used as the basis of any investmentdecision. Nothing in this document should be construed as investment or financial advice. Each recipient of this document should make
such investigations as they deem necessary to arrive at an independent evaluation of an investment in the securities of the companies
referred to in this document (including the merits and risks involved), and should consult their own advisors to determine the merits and
risks of such an investment.
Angel Broking Limited, its affiliates, directors, its proprietary trading and investment businesses may, from time to time, make
investment decisions that are inconsistent with or contradictory to the recommendations expressed herein. The views contained in this
document are those of the analyst, and the company may or may not subscribe to all the views expressed within.
Reports based on technical and derivative analysis center on studying charts of a stock's price movement, outstanding positions and
trading volume, as opposed to focusing on a company's fundamentals and, as such, may not match with a report on a company's
fundamentals.
The information in this document has been printed on the basis of publicly available information, internal data and other reliablesources believed to be true, but we do not represent that it is accurate or complete and it should not be relied on as such, as thisdocument is for general guidance only. Angel Broking Limited or any of its affiliates/ group companies shall not be in any way responsible for any loss or damage that may arise to any person from any inadvertent error in the information contained in this report .
Angel Broking Limited has not independently verified all the information contained within this document. Accordingly, we cannot testify,nor make any representation or warranty, express or implied, to the accuracy, contents or data contained within this document. While Angel Broking Limited endeavours to update on a reasonable basis the information discussed in this material, there may be regulatory,compliance, or other reasons that prevent us from doing so.
This document is being supplied to you solely for your information, and its contents, information or data may not be reproduced,
redistributed or passed on, directly or indirectly.
Angel Broking Limited and its affiliates may seek to provide or have engaged in providing corporate finance, investment banking or
other advisory services in a merger or specific transaction to the companies referred to in this report, as on the date of this report or in
the past.
Neither Angel Broking Limited, nor its directors, employees or affiliates shall be liable for any loss or damage that may arise from or in
connection with the use of this information.
Note: Please refer to the important `Stock Holding Disclosure' report on the Angel website (Research Section). Also, please refer to thelatest update on respective stocks for the disclosure status in respect of those stocks. Angel Broking Limited and its affiliates may haveinvestment positions in the stocks recommended in this report.