Embed Size (px)
Citation preview

Market Outlook for Blackberry Production in the Southeast
Blackberry Conference 2009 SE Regional Fruit & Vegetable
Conference
Charles D. SafleyNorth Carolina State University

Projected Increases in Blackberry Acreage by 2015 for Selected Countries
Country Percentage Increase
2005 Area Planted(Acres)
Projected Increase(Acres)
Projected Area in 2015
(Acres)
USA 20 % 11,905 2,381 14,286
Mexico 117 % 5,683 6,649 12,332
Chile 76 % 1,111 844 1,955
Guatemala 33 % 222 73 295
Source: Bernadine Strik, Dept. of Horticulture, OSU

0
200
400
600
800
1000
1200
Sept
05
Nov
05
Jan
06
Mar
06
May
06
July
06
Sept
06
Nov
06
Jan
07
Mar
07
May
07
July
07
Sept
07
Nov
07
Jan
08
Mar
08
May
08
July
08
Sept
08
Nov
08
Total US Monthly Blackberry Imports from Mexico & Guatemala: 2005 - 2008 Marketing Season
(10,000 pound units)
Source: Agricultural Marketing Service, USDA Mexico Guatemala

0
50
100
150
200
250
300
350
Jan
05M
ar 0
5M
ay 05
July
05Se
pt 0
5N
ov 05
Jan
06M
ar 0
6M
ay 06
July
06Se
pt 0
6N
ov 06
Jan
07M
ar 0
7M
ay 07
July
07Se
pt 0
7N
ov 07
Jan
08M
ar 0
8M
ay 08
July
08Se
pt 0
8N
ov 08
Total US Monthly Blackberry Shipments from Central California & Oregon: 2005 - 2008 Marketing Seasons
(10,000 pound units)
Source: Agricultural Marketing Service, USDA Oregon Central Calf.

0
200
400
600
800
1000
1200
Sept
05
Nov
05
Jan
06M
ar 0
6
May
06
July
06
Sept
06
Nov
06
Jan
07
Mar
07
May
07
July
07
Sept
07
Nov
07
Jan
08
Mar
08
May
08
July
08
Sept
08
Nov
08
Total US Monthly Blackberry Movement, 2005 – 2008 Marketing Seasons (Imports & Domestic Shipments)
(10,000 pound units)
Source: Agricultural Marketing Service, USDA “Imports” “Domestic”

0
200
400
600
800
1000
1200
Jan Feb Mar Apr May Jun July Aug Sept Oct Nov Dec
2005200620072008
Total US Monthly Blackberry Shipments(Imports & Domestic Shipments)
(10,000 pound units)
Source: Agricultural Marketing Service, USDA

Blackberry Consumption “There’s room for growth!”
U.S. Data by Commodity
Expenditures(% of Consumer Dollar Spent on
Fruit, 2006)
Per Capita Consumption
(2005)
Strawberries 21.7% 1.84
Raspberries 3.8% 0.29
Blackberries <2.0% 0.11
Source: USDA and The Packer Consumer Surveys

Consumer Expenditures for Selected Berries as a Percentage of Total Berry Sales
1.5%
4.6%
10.5%
22.4%
60.9%
1.5%
5.4%
11.5%
21.6%
60.0%
0.0% 10.0% 20.0% 30.0% 40.0% 50.0% 60.0% 70.0%
Other
Blackberries
Raspberries
Blueberries
Strawberries
20072006
Source: Perishables Group, Inc.; published in Produce Merchandising, April 2008

Customers who Purchased within Last 12 Months
FruitPercentage Who
Purchased in 2008Percentage Change
over 2007
Grapes 76% 0%
Strawberries 71% + 2%
Cherries 48% + 7%
Blueberries 44% + 1%Raspberries 25% - 1%
Blackberries 21% + 3%
Cranberries 14% + 1%
Pomegranates 11% + 5%
Source: Fresh Trends – 2008, The Packer
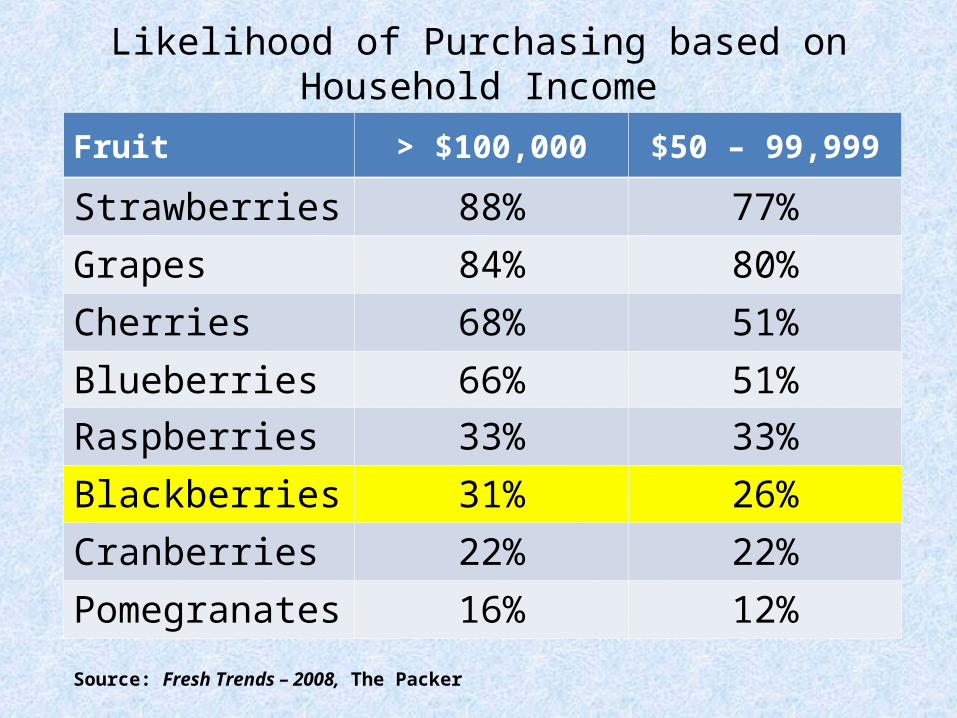
Likelihood of Purchasing based on Household Income
Fruit > $100,000 $50 – 99,999
Strawberries 88% 77%
Grapes 84% 80%
Cherries 68% 51%
Blueberries 66% 51%Raspberries 33% 33%
Blackberries 31% 26%
Cranberries 22% 22%
Pomegranates 16% 12%
Source: Fresh Trends – 2008, The Packer
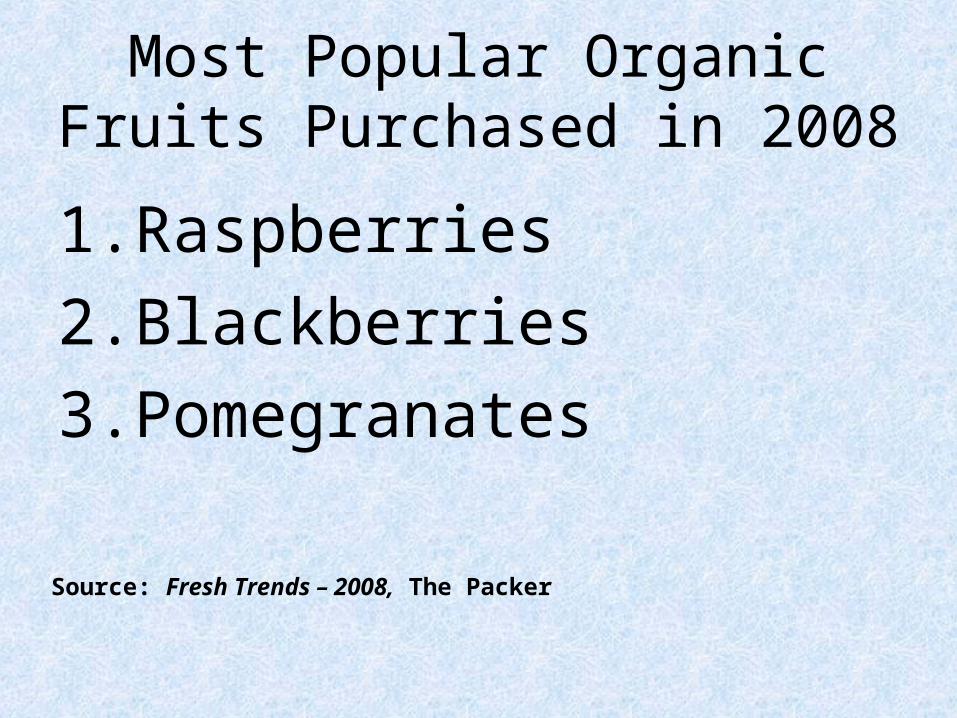
Most Popular Organic Fruits Purchased in 2008
1.Raspberries2.Blackberries3.Pomegranates
Source: Fresh Trends – 2008, The Packer

What is the potential demand for blackberries?

U. S. Demand for Blackberries“Blackberry demand has an immense
amount of potential to expand in the future.”“… consumption of blackberries (could) someday
equal that of blueberries or raspberries, given consumers’ growing taste for, and recognition of, the healthful benefits.” Janice Honigberg, President, Sun-Belle, Inc.
Demand for blackberries is strong and growing (Demand > Supply)
Consensus of produce buyers and managers interviewed for this report

Market Trends – Why has Demand Increased?
1. Health 2. Convenience: Year-round availability More supermarkets carrying berries
3. Globalization4. “Faster” and More Reliable Refrigerated
Transportation – maintaining the cold chain better from supply point to retail
Source: Various Articles and Interviews

Health 57% of the shoppers are making an
effort to eat healthierConsumers Concerns:
Weight 61 % Cholesterol 36 % Blood Sugar 22 % High Blood Pressure 18 %Diabetes 14 %
Source: Food Trends, International Dairy-Deli-Bakery Association, June 2008

Health Berry consumption has steadily
increased during the past two years as consumers have become more aware of the health benefits: Fighting cancer Reducing risk of heart disease Reducing signs of aging
Source: Produce Merchandizing, Chris Crawford, April 2008
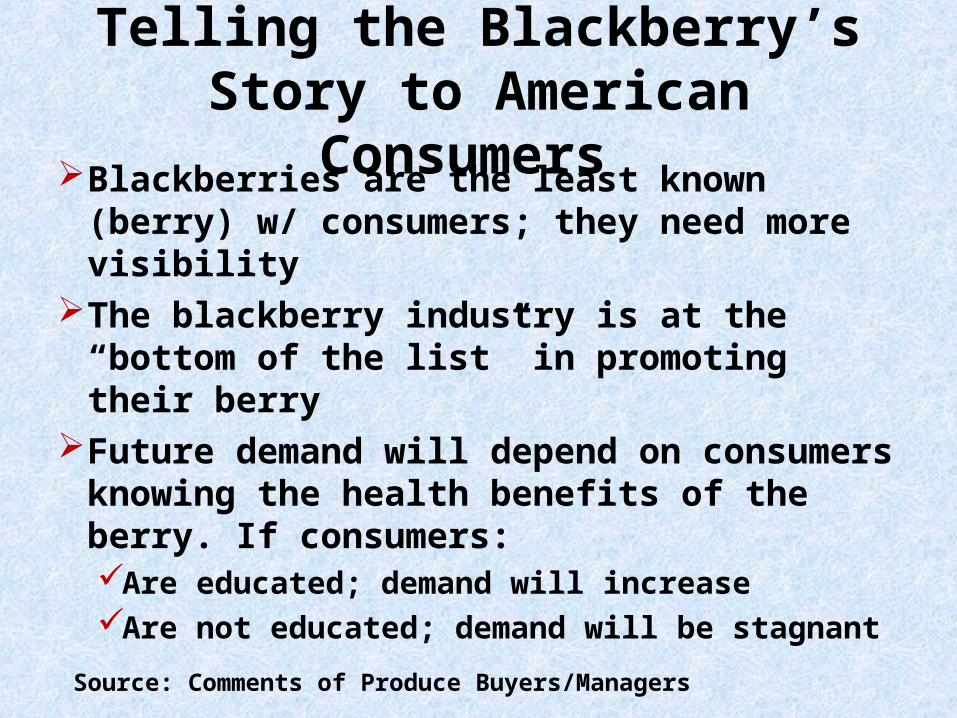
Telling the Blackberry’s Story to American Consumers
Blackberries are the least known (berry) w/ consumers; they need more visibility
The blackberry industry is at the “bottom of the list” in promoting their berry
Future demand will depend on consumers knowing the health benefits of the berry. If consumers:Are educated; demand will increaseAre not educated; demand will be stagnant
Source: Comments of Produce Buyers/Managers

Telling the Blackberry’s Story to American Consumers
Blackberries have less recognition relative to strawberries, blueberries, raspberries and pomegranates Few consumers talk about the blackberry’s
nutritional value and/or as a source of antioxidants
The Industry needs to do a better job in getting their (health) message out
Source: Comments of Produce Buyers/Managers
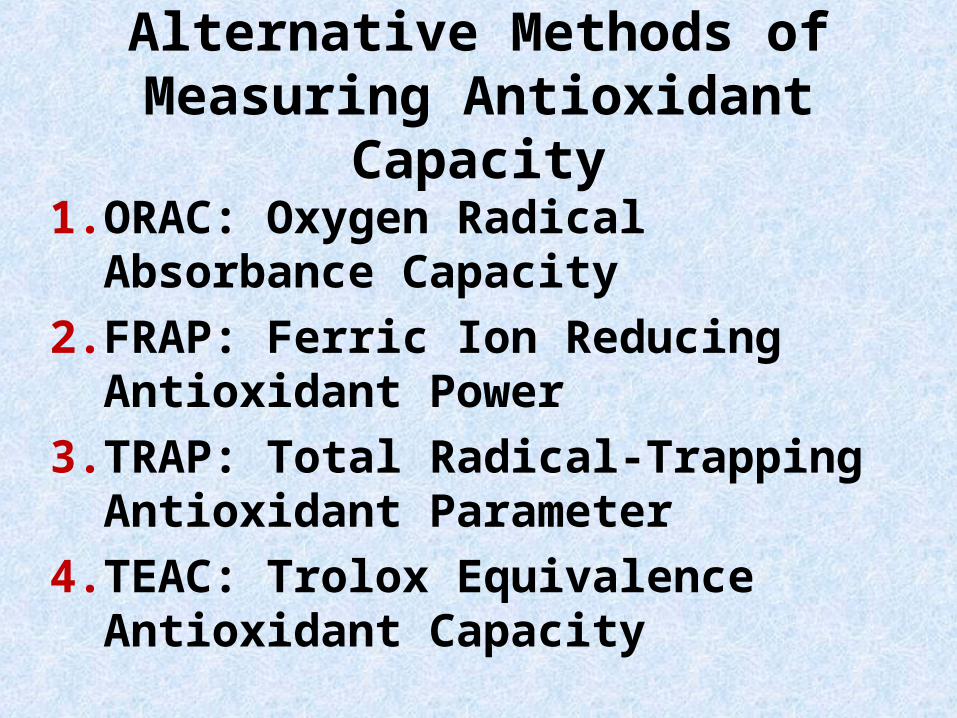
Alternative Methods of Measuring Antioxidant Capacity
1. ORAC: Oxygen Radical Absorbance Capacity2. FRAP: Ferric Ion Reducing Antioxidant
Power3. TRAP: Total Radical-Trapping Antioxidant
Parameter 4. TEAC: Trolox Equivalence Antioxidant
Capacity

List of Fruits High in Antioxidants Content ORAC Estimation Method
(µmol TE/100g)
Antioxidant Source Total ORAC
Cranberries, raw 9,584Currant, Black, raw 7,960Blueberries, raw 6,552Plums, raw 6,295Blackberries, raw 5,347Raspberries, raw 4,862Strawberries, cultivated, raw
3,577
Cherries, raw 3,365Grape, red, raw 1,260
Source: Oxygen Radical Absorbance Capacity of Selected Foods, Nutrient Data Laboratory, ARS, USDA, November 2007

List of Fruits High in Antioxidants Content FRAP Estimation Method
(mmol Fe²⁺/Kg Fresh Weight)
Antioxidant Source Antioxidant Activity
Blackberries 51.53Redcurrants 44.86Raspberries 43.03Strawberries, cultivated 22.74Blueberries 18.61Plums (red) 12.79Grapes (black) 11.09Cherries 8.10Grapes (white) 3.25
Source: Total Antioxidant Capacity of Plant Foods, Beverages & Oils Consumed in Italy, Nicoletta Pellegrini et. a., J. Nutr. 1333:2812-2819, 2003

List of Fruits High in Antioxidants Content TRAP Estimation Method
(mmol Trolox/Kg Fresh Weight)
Antioxidant Source Antioxidant Activity
Blackberries 21.01Redcurrants 12.14Raspberries 10.48Blueberries 9.30Strawberries, cultivated 8.56Plums (red) 8.09Grapes (black) 2.50Cherries 4.17Grapes (white) 1.59
Source: Total Antioxidant Capacity of Plant Foods, Beverages & Oils Consumed in Italy, Nicoletta Pellegrini et. a., J. Nutr. 1333:2812-2819, 2003

List of Fruits High in Antioxidants Content TEAC Estimation Method
(mmol Trolox/ Kg Fresh Weight)
Antioxidant Source Antioxidant Activity
Blackberries 20.24
Raspberries 16.79
Redcurrants 14.05
Strawberries cultivated 10.94
Blueberries 7.43
Plums (red) 5.11
Grapes (black) 3.85
Cherries 2.69
Grapes (white) 2.48Source: Total Antioxidant Capacity of Plant Foods, Beverages & Oils Consumed in Italy, Nicoletta Pellegrini et. a., J. Nutr. 1333:2812-2819, 2003

Are we already oversupplied with blackberries on the East
Coast?
Or, do we need more blackberry production on
the East Coast?

A:The East Coast is Not OversuppliedProduce buyers/managers would like to see
more production on the East Coast.Want to buy locally grown produce
Improved quality Relative to berries shipped across the country
Reduced shrink Blackberries are the most perishable berryBuying local is critical due to spoilage
Reduces Delivery Price More Affordable BerriesTransportation expenses
Buying locally will be more important in the futureSource: Comments of Produce Buyers/Managers

Consumer Perceptions of Locally Grown Food
Consumer appreciate local food for its: Improved Taste Freshness Improved Quality
Source: Food, Fuel and the Future: Consumer Perceptions of Local Safety and Climate Change in the Context of Rising Prices, Leopold Center’s Marketing and Food Systems Initiative, August 2008

Definition of Locally Grown FoodConsumer definitions of local:
100 miles or less: 67% Within the state or region: 33%
Produce Buyers/Managers definitions of local: 100 miles or lessWithin the stateWithin a 6-hour drive
Source: Food, Fuel and the Future: Consumer Perceptions of Local Safety and Climate Change in the Context of Rising Prices, Leopold Center’s Marketing and Food Systems Initiative, August 2008
Source: Comments of Produce Buyers/Managers

What is the optimum size container?
Is there an advantage to selling blackberries in larger container sizes, such as a quart container?
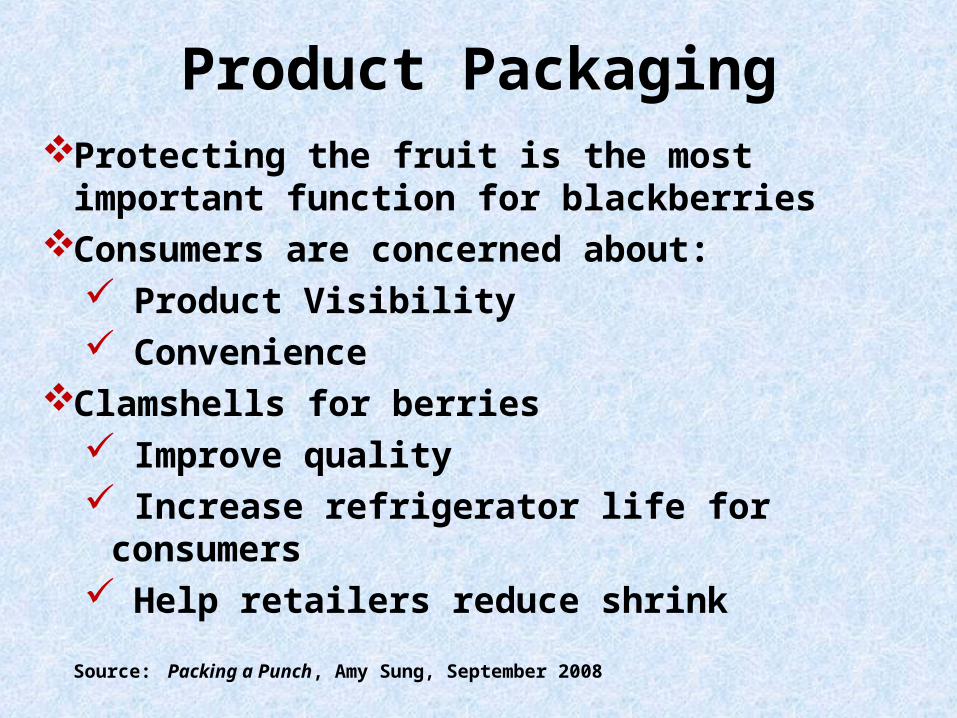
Product PackagingProtecting the fruit is the most important function
for blackberriesConsumers are concerned about:
Product Visibility Convenience
Clamshells for berries Improve quality Increase refrigerator life for consumers Help retailers reduce shrink
Source: Packing a Punch, Amy Sung, September 2008

Optimum Size Container?Chain store produce buyers/managers:
No consensus on the optimum container size
Generally the container should be shallow/flat & have a wide profile:Reduces bruising Provides “best” presentation of the berries
Blackberries are an impulse itemSource: Comments of Produce Buyers/Managers

Optimum Size Container?Two Major Considerations:
Price/Affordability Blackberries are an impulse item, not a staple Consumers buy blackberries with disposable incomeConcern that purchases will decrease given the current
economic situationSpoilage Factor – Blackberries are Highly Perishable
Berries
Produce Buyer/Manager comments:One opinion: “Six-oz clamshells are the best” because
of the spoilage factor.
Source: Comments of Produce Buyers/Managers

Optimum Size Container?Produce Buyer/Manager comments:Container size is dictated by price, i.e. “Whatever size
(5.6 oz – 1 pt) is most affordable (at the time).One opinion:“In today’s economy, ½- pint
clamshells are more affordable.”
Another opinion:“One-pint clamshells would be the best.”
If one-pint containers were priced so they were affordable (i.e. priced lower); growers would make up the (price) difference by selling greater volume.
Source: Comments of Produce Buyers/Managers

Quart Size Container?Larger size, i.e. quart, containers would not
be feasible – Almost Unanimous Opinion (One Abstained)
Reasons: Would not be affordable for consumersWould put increased pressure on the berries
and increase bruisingToo much risk given how perishable
blackberries are
Source: Comments of Produce Buyers/Managers

Larger size containers:a different view-point.
Vendor at Charlotte Farmers MarketBlackberry Sales ≈ $3,000 on a typical SaturdayPrimarily sells in 2-quart containers
$9.00 each or $2.75/lbCan not sell ½- pints and only a few 1-pints
Sells mostly 1- and 2-quarts containers
Costco & Sam’s ClubSell in 18-ounce containers
Source: Ervin Lineberger

What can growers do to improve their product and or
service?

Suggestions to Improve ProductBlackberry Varieties
Varieties that would extend the local season Larger size berries Improved sweetness/flavor
“Sometimes we receive blackberries that are too tart to eat.”
Previous opinion: “A lost in taste does not seem to matter as long as the fruit looks good.”
Some Industry experts: There is evidence that Raspberry consumption is decreasing due to poor flavor (i.e. low sugar content) relative to blueberries.
Source: Comments of Produce Buyers/Managers

Suggestions to Improve Product & Service
More or Better Standardization: More consistent container size More consistent pack
Post Harvest Handling:PHH is critical for blackberriesSome growers need additional training
e.g. – cooling containers prior to packing berries to increase shelf life
Source: Comments of Produce Buyers/Managers
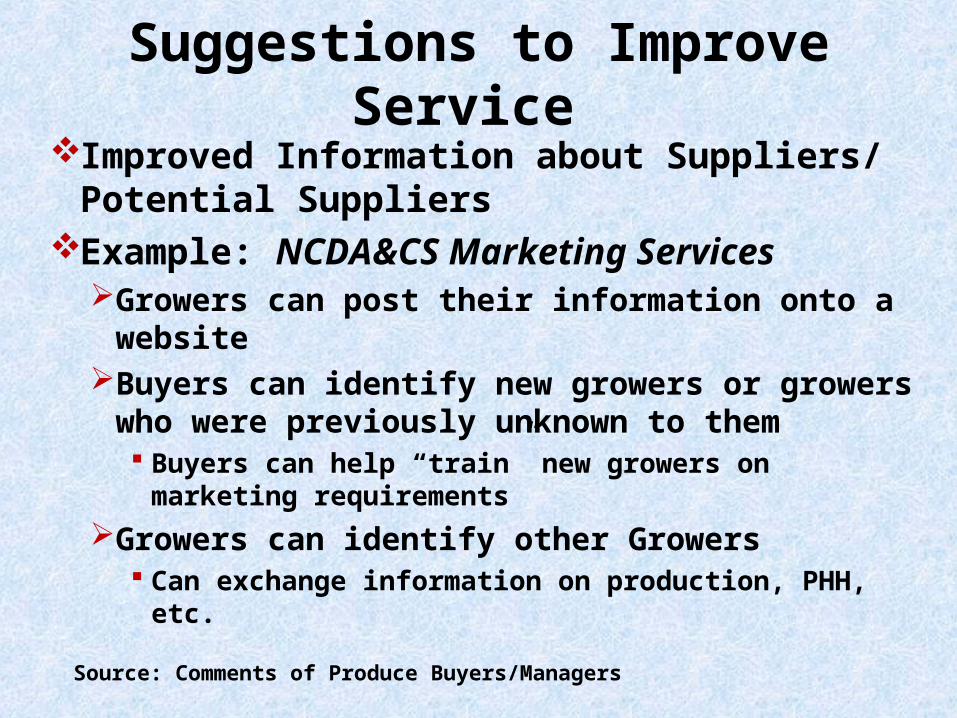
Suggestions to Improve Service Improved Information about Suppliers/
Potential SuppliersExample: NCDA&CS Marketing Services
Growers can post their information onto a website Buyers can identify new growers or growers who
were previously unknown to them Buyers can help “train” new growers on marketing
requirementsGrowers can identify other Growers
Can exchange information on production, PHH, etc.
Source: Comments of Produce Buyers/Managers
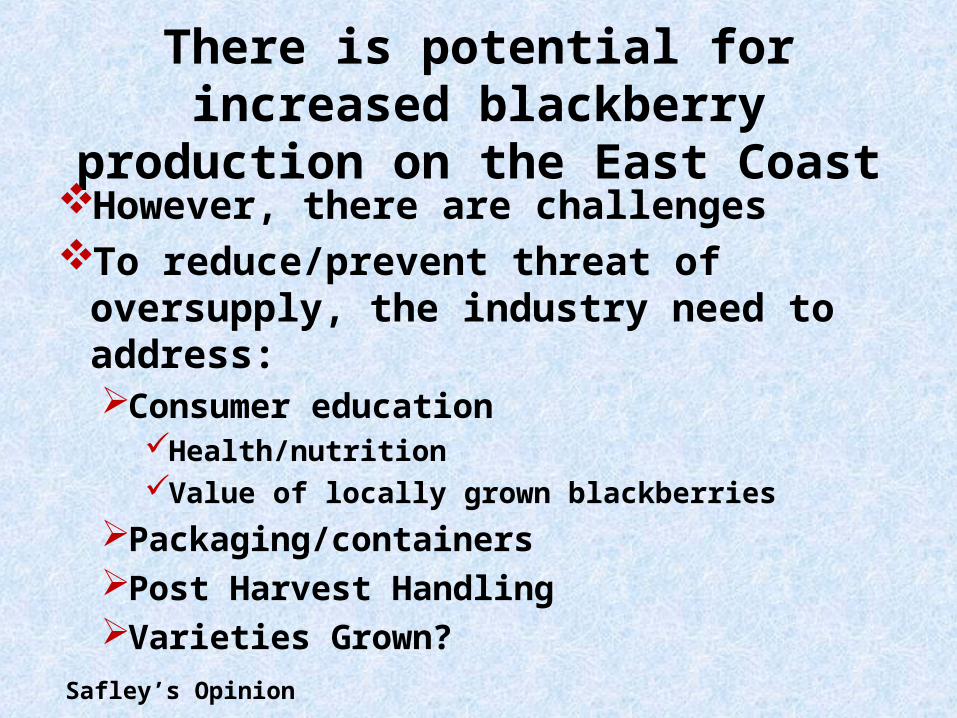
There is potential for increased blackberry production on the East Coast
However, there are challengesTo reduce/prevent threat of oversupply, the
industry need to address:Consumer education
Health/nutritionValue of locally grown blackberries
Packaging/containersPost Harvest Handling Varieties Grown?
Safley’s Opinion
$18.00$20.00$22.00$24.00$26.00$28.00$30.00$32.00$34.00
Day 1
Day 3
Day 5
Day 7
Day 9
Day 11
Day 13
Day 15
Day 17
Day 19
Day 21
Day 23
2005
2006
2007
2008
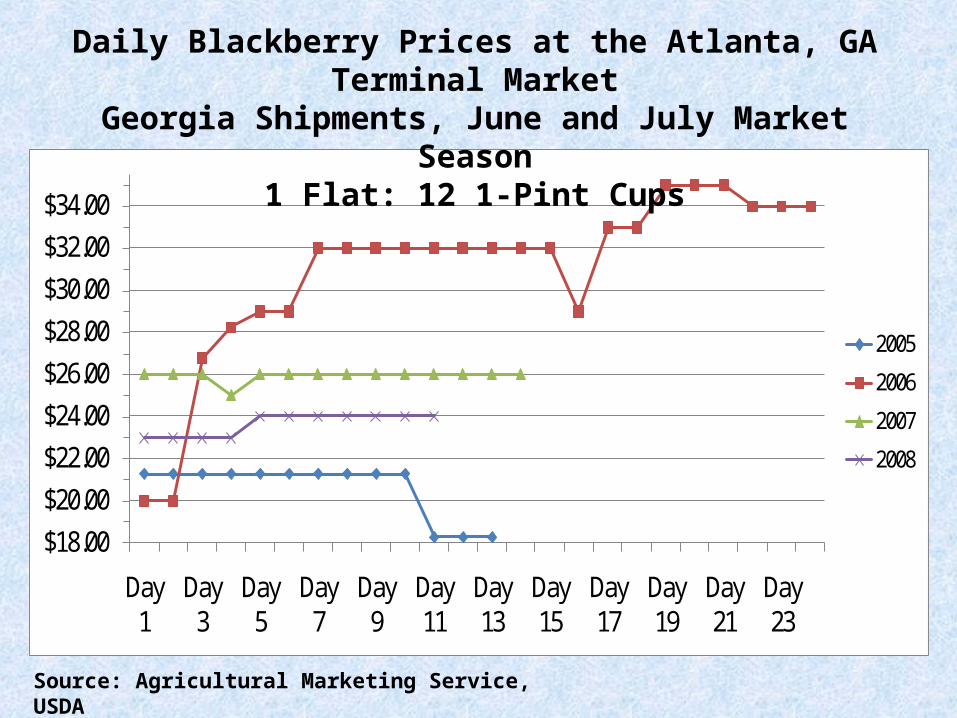
Daily Blackberry Prices at the Atlanta, GA Terminal MarketGeorgia Shipments, June and July Market Season
1 Flat: 12 1-Pint Cups
Source: Agricultural Marketing Service, USDA

$21.50
$22.50
$23.50
$24.50
$25.50
$26.50
$27.50
$28.50
$29.50
$30.50
Day 1
Day 3
Day 5
Day 7
Day 9
Day 11
Day 13
Day 15
Day 17
Day 19
Day 21
Day 23
Day 25
Day 27
Day 29
Day 31
Day 33
Day 35
Axis
Titl
e
2005
2006
2007
2008
Daily Blackberry Prices at the Columbia, SC Terminal MarketSouth Carolina Shipments, June and July Market Season
1 Flat: 12 1-Pint Cups
Source: Agricultural Marketing Service, USDA