Embed Size (px)
Citation preview

Market Outlook November 2017
1

Equity Markets
2
Key Events
3
• Game changing event unveiled by Finance Ministry – recapitalisation of PSU banks to tune of Rs 2.1 lakhcrores announced. The two components of the plan are – issuing recapitalization bonds worth Rs1.35trn(~0.8% of GDP) and Rs760bn through fiscal resources and capital raise.
• Govt has announced ambitious plans to develop 83,677km of roads with an investment of Rs6.92trnover the next five years with Bharat-Mala scheme. The funding will be mix of Govt funds, debt andprivate investment.
• Aug IIP surged to 4.3% vs 1.2% in Jul, the highest since demonetisation indicating normalization post GSTrollout. Manufacturing output rebounded to 3.1% in Aug as Capital Goods recorded 5.4% growth aftermonths of decline. Mining expanded to 9.4% vs 4.8% in Jul and electricity generation also picked up to8.3% vs 6.5% in previous month
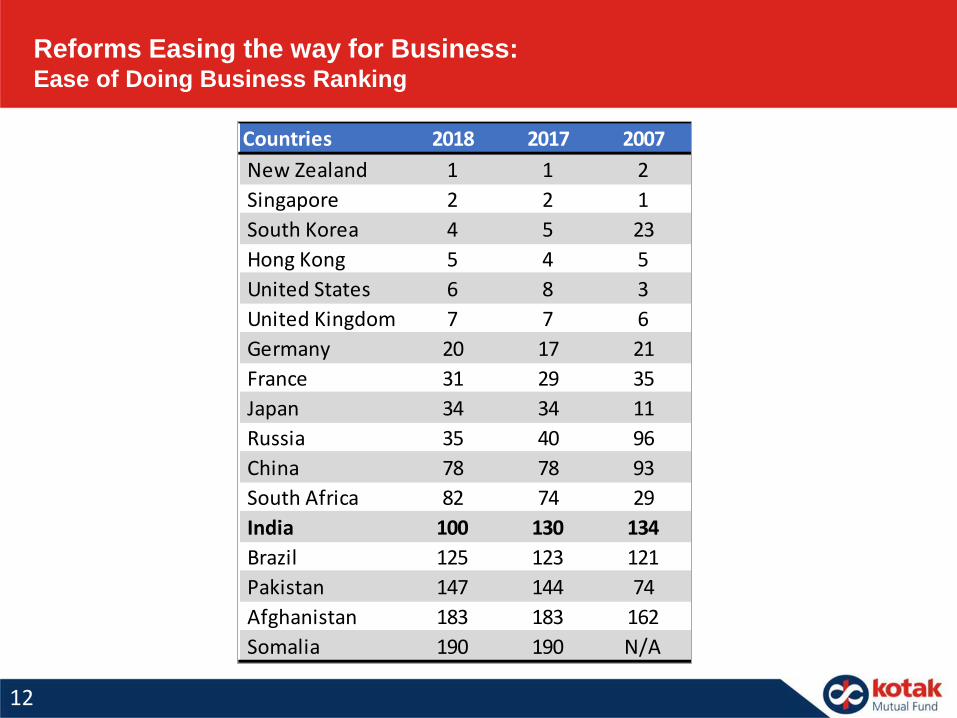
• India World Bank business ease ranking improves to 100, jumping 30 points from previous survey
• Deal activity stayed strong in Oct with total of 19 deals amounting to ~$3bn largely led by primarymarket.
• Indian equities (+5.6%) rallied in Oct led by Govt’s large scale recapitalization plan to boost public sectorbanks and continued domestic inflows.
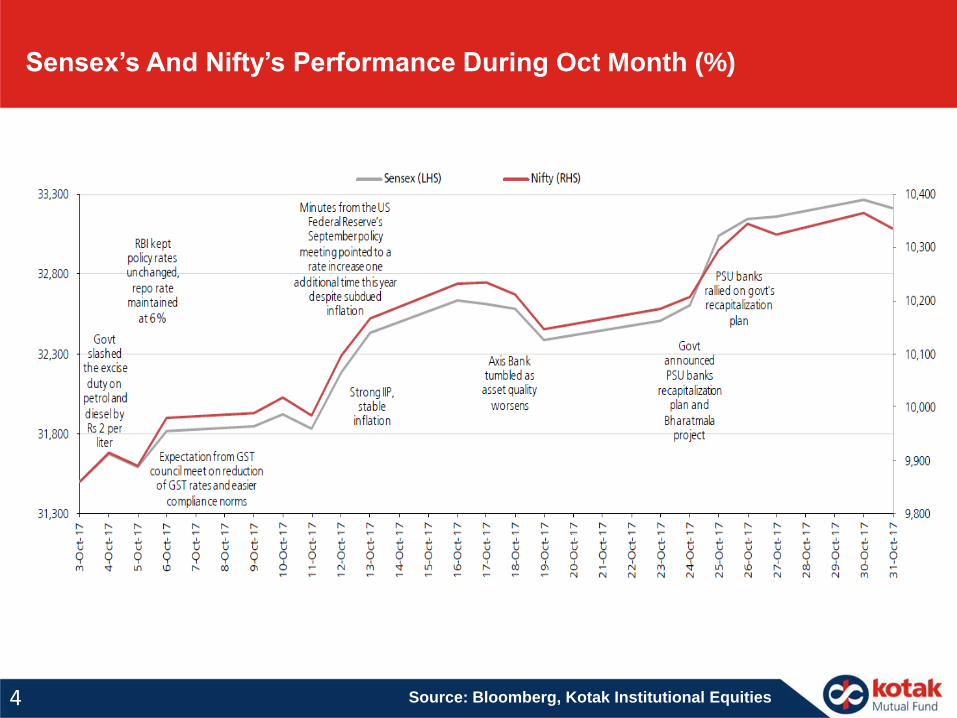
Sensex’s And Nifty’s Performance During Oct Month (%)
4 Source: Bloomberg, Kotak Institutional Equities
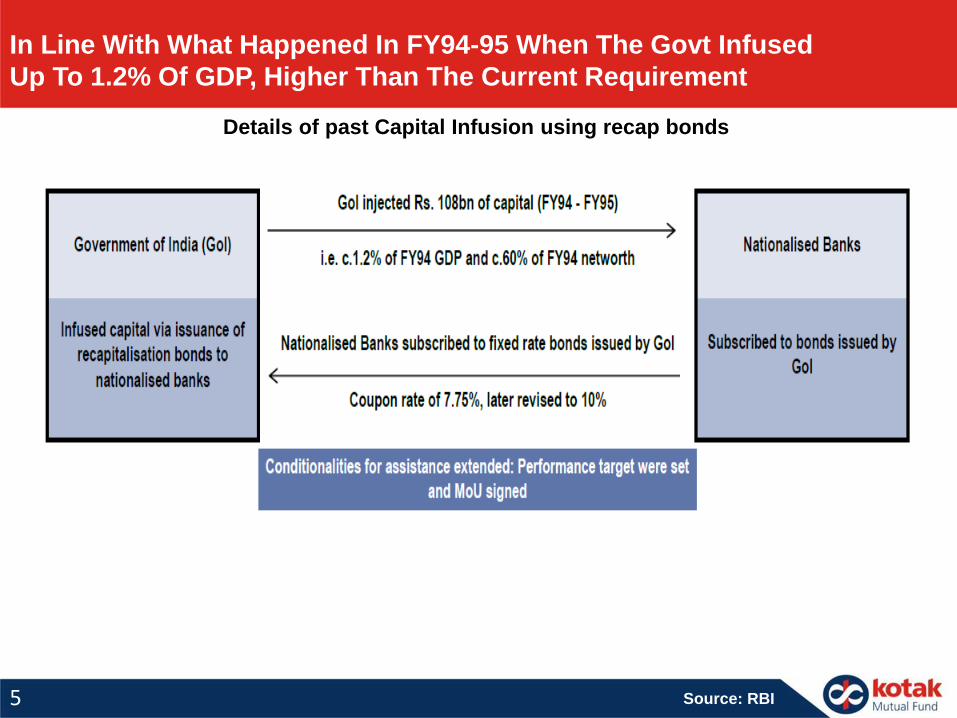
In Line With What Happened In FY94-95 When The Govt Infused
Up To 1.2% Of GDP, Higher Than The Current Requirement
5 Source: RBI
Details of past Capital Infusion using recap bonds
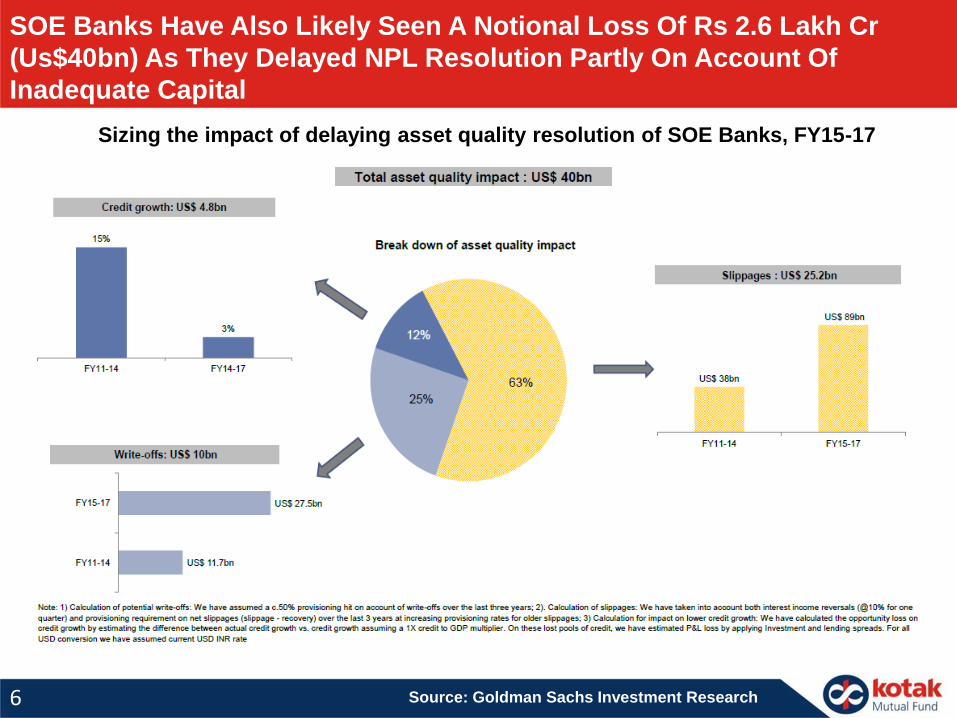
SOE Banks Have Also Likely Seen A Notional Loss Of Rs 2.6 Lakh Cr
(Us$40bn) As They Delayed NPL Resolution Partly On Account Of
Inadequate Capital
6 Source: Goldman Sachs Investment Research
Sizing the impact of delaying asset quality resolution of SOE Banks, FY15-17
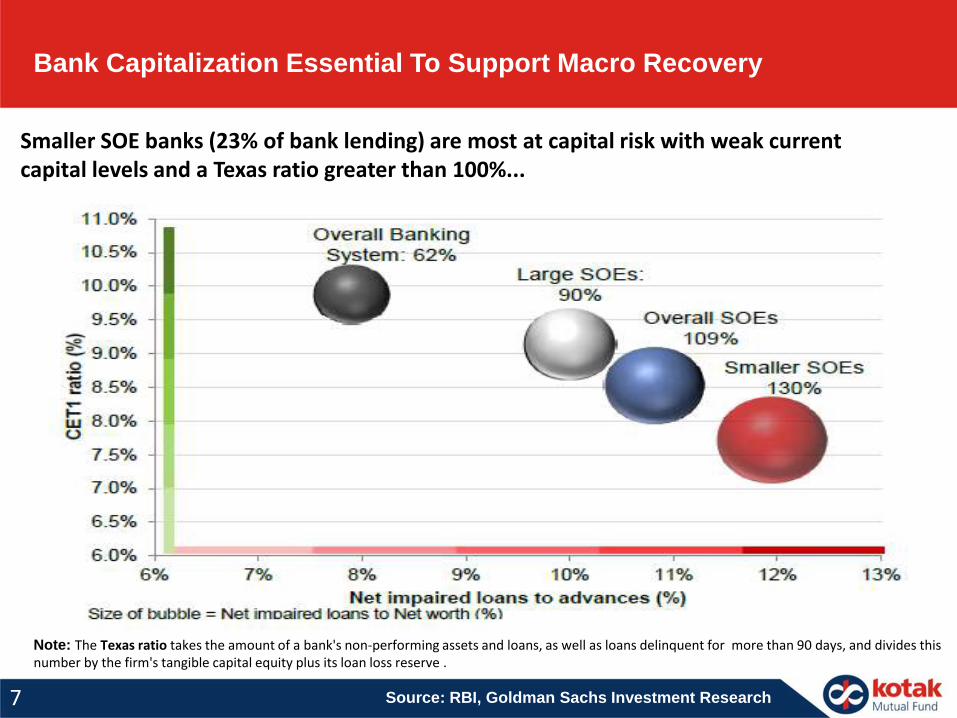
Bank Capitalization Essential To Support Macro Recovery
7
Smaller SOE banks (23% of bank lending) are most at capital risk with weak current capital levels and a Texas ratio greater than 100%...
Source: RBI, Goldman Sachs Investment Research
Note: The Texas ratio takes the amount of a bank's non-performing assets and loans, as well as loans delinquent for more than 90 days, and divides this number by the firm's tangible capital equity plus its loan loss reserve .
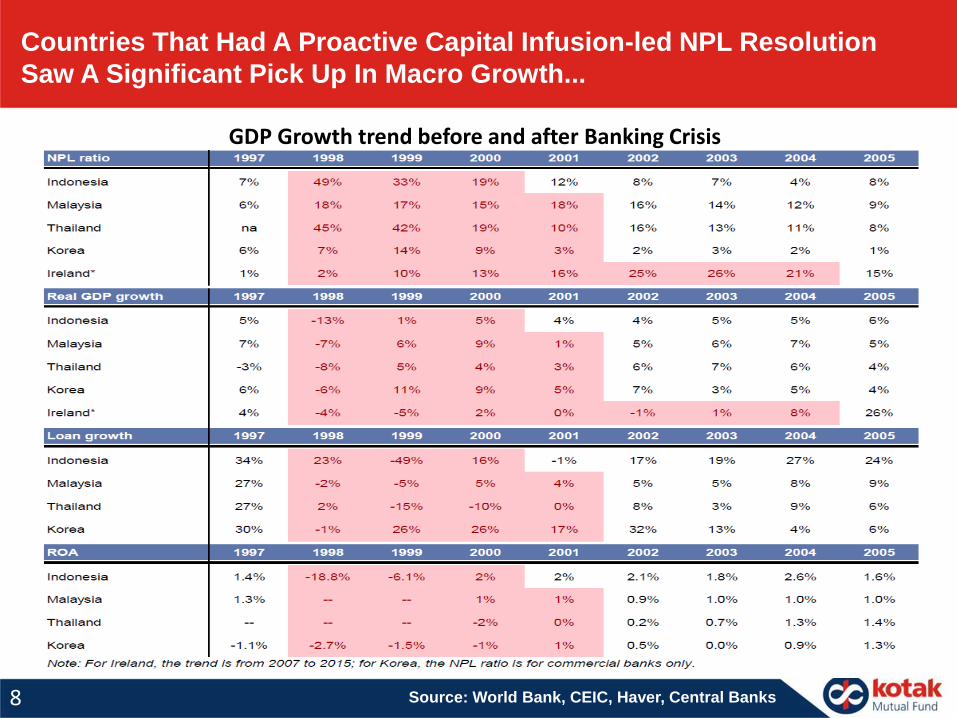
Countries That Had A Proactive Capital Infusion-led NPL Resolution
Saw A Significant Pick Up In Macro Growth...
8 Source: World Bank, CEIC, Haver, Central Banks
GDP Growth trend before and after Banking Crisis
9 Source: Data source: Bloomberg. Data as of each quarter
-4
-2
0
2
4
6
8
500
1000
1500
2000
2500
3000
De
c-0
2
Au
g-0
3
Ap
r-0
4
De
c-0
4
Au
g-0
5
Ap
r-0
6
De
c-0
6
Au
g-0
7
Ap
r-0
8
De
c-0
8
Au
g-0
9
Ap
r-1
0
De
c-1
0
Au
g-1
1
Ap
r-1
2
De
c-1
2
Au
g-1
3
Ap
r-1
4
De
c-1
4
Au
g-1
5
Ap
r-1
6
De
c-1
6
Au
g-1
7
S&P 500
US GDP
10 Year Tbill
Bond Buying Comes In (QE1)
-2
-1
0
1
2
3
4
2000
2200
2400
2600
2800
3000
3200
3400
3600
3800
Mar
-09
Au
g-0
9
Jan
-10
Jun
-10
No
v-1
0
Ap
r-1
1
Sep
-11
Feb
-12
Jul-
12
De
c-1
2
May
-…
Oct
-13
Mar
-14
Au
g-1
4
Jan
-15
Jun
-15
No
v-1
5
Ap
r-1
6
Sep
-16
Feb
-17
Jul-
17
EU Area Bounceback
Euro Stoxx 50 (LHS)
EU 10 yr (RHS)
EU GDP (RHS)
EU Bond Buying Begins. "Whatever it Takes": Mario Draghi
-2
-1
0
1
2
3
4
4000
5000
6000
7000
8000
9000
10000
Mar
-09
Au
g-0
9
Jan
-10
Jun
-10
No
v-1
0
Ap
r-1
1
Sep
-11
Feb
-12
Jul-
12
De
c-1
2
May
-13
Oct
-13
Mar
-14
Au
g-1
4
Jan
-15
Jun
-15
No
v-1
5
Ap
r-1
6
Sep
-16
Feb
-17
Swiss Story
Swiss Market (LHS) Swiss 10 Yr (RHS) GDP (RHS)
Swiss QE
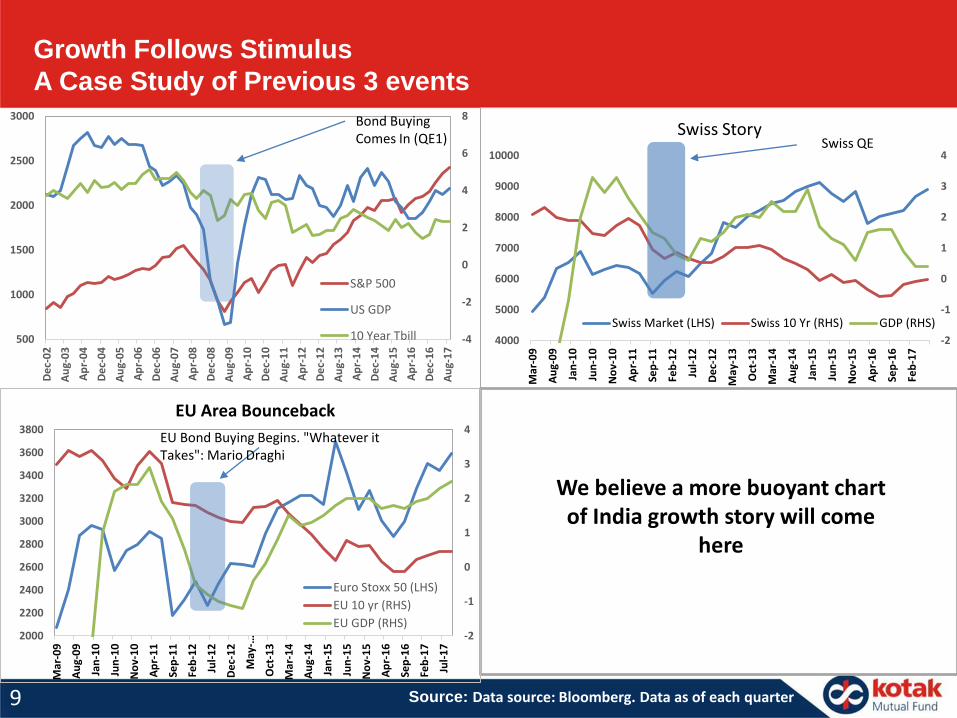
Growth Follows Stimulus
A Case Study of Previous 3 events
We believe a more buoyant chart of India growth story will come
here
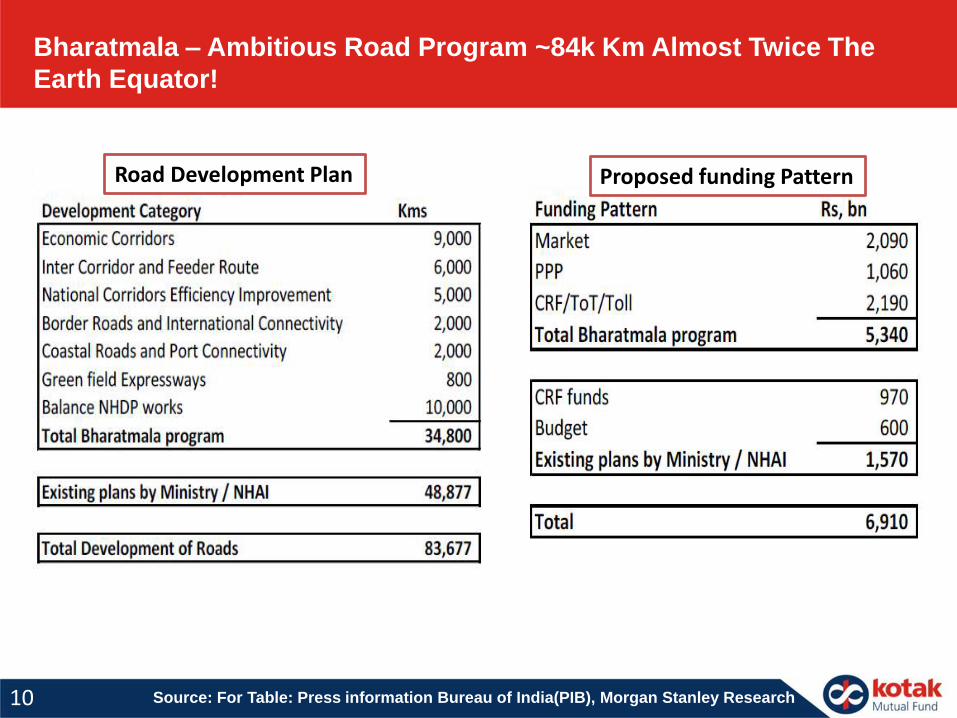
Bharatmala – Ambitious Road Program ~84k Km Almost Twice The
Earth Equator!
10 Source: For Table: Press information Bureau of India(PIB), Morgan Stanley Research
Proposed funding PatternRoad Development Plan
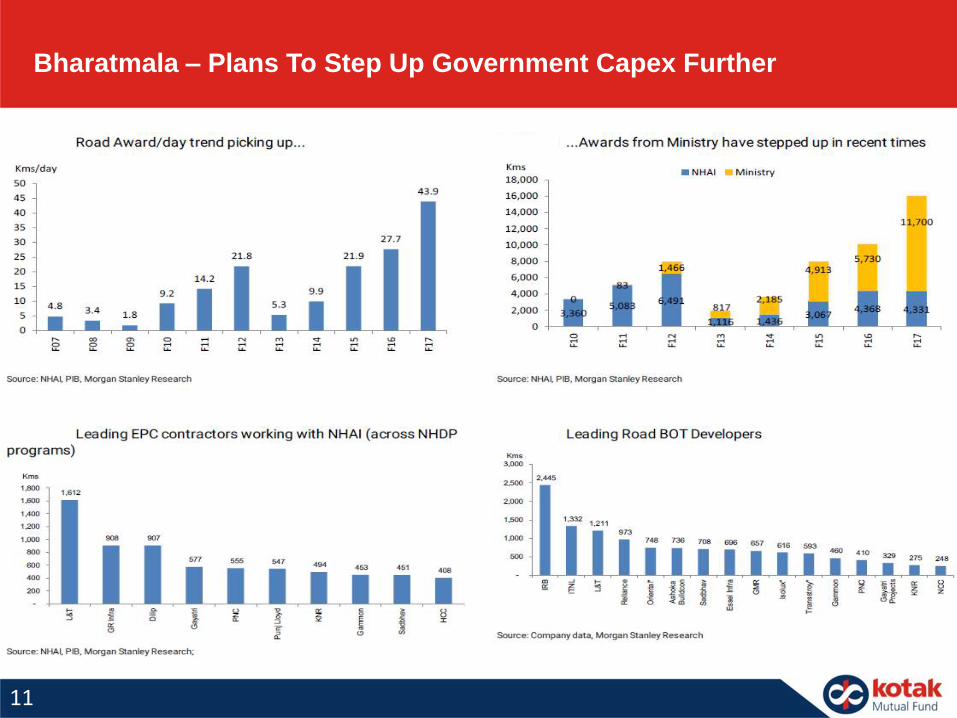
Bharatmala – Plans To Step Up Government Capex Further
11
12
Countries 2018 2017 2007
New Zealand 1 1 2
Singapore 2 2 1
South Korea 4 5 23
Hong Kong 5 4 5
United States 6 8 3
United Kingdom 7 7 6
Germany 20 17 21
France 31 29 35
Japan 34 34 11
Russia 35 40 96
China 78 78 93
South Africa 82 74 29
India 100 130 134
Brazil 125 123 121
Pakistan 147 144 74
Afghanistan 183 183 162
Somalia 190 190 N/A
Reforms Easing the way for Business:Ease of Doing Business Ranking
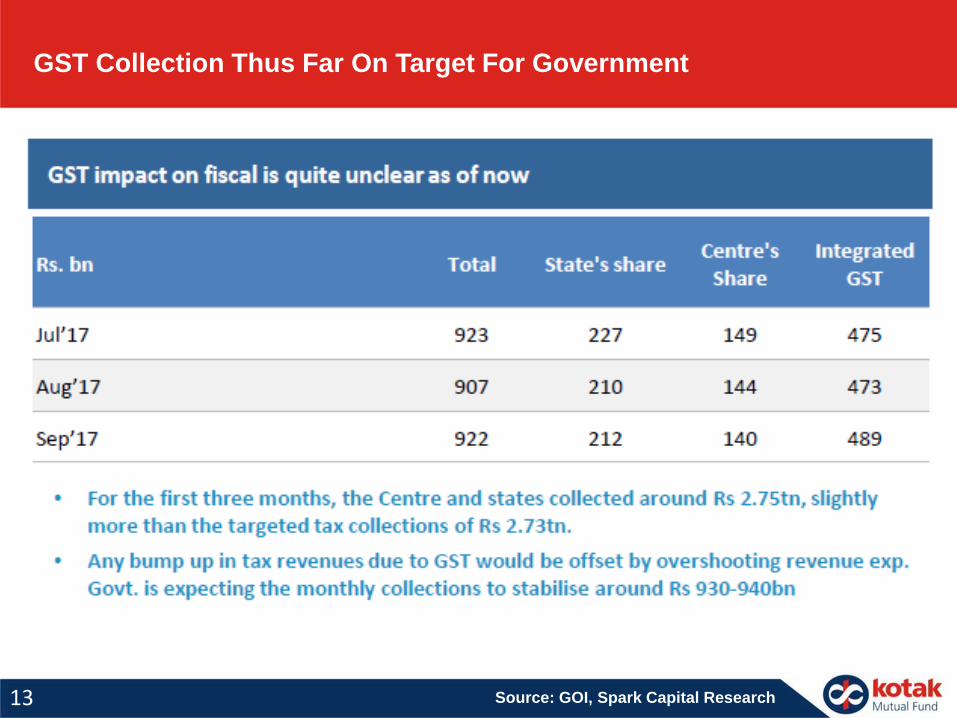
GST Collection Thus Far On Target For Government
13 Source: GOI, Spark Capital Research

GST Tweaks And Excise Cut In Fuel Price To Help Bring Cheers To
MSME And Consumers
14
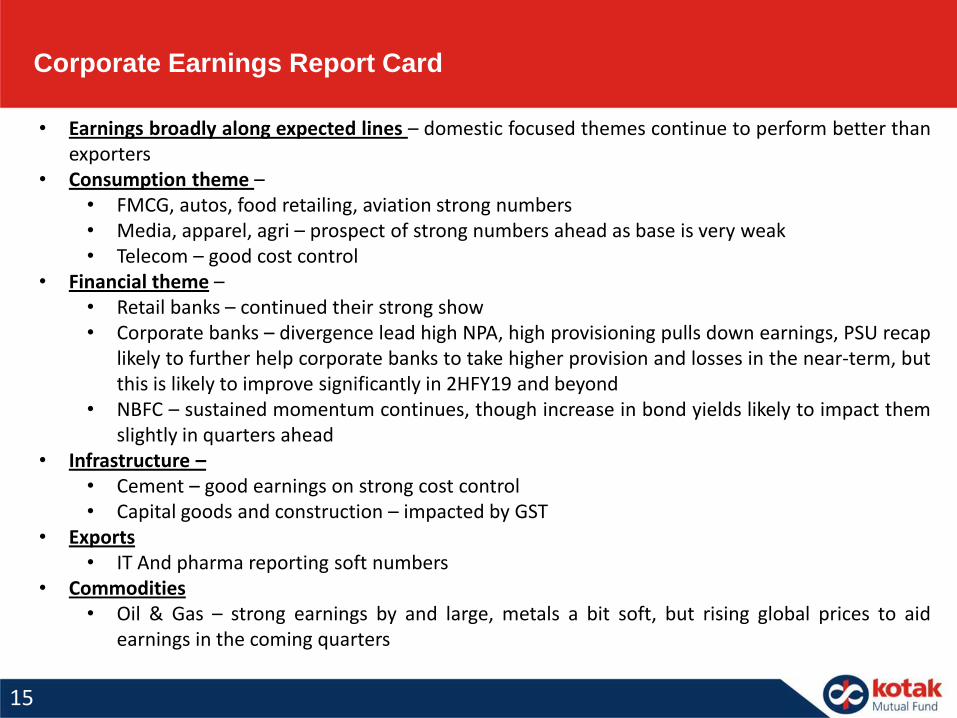
Corporate Earnings Report Card
15
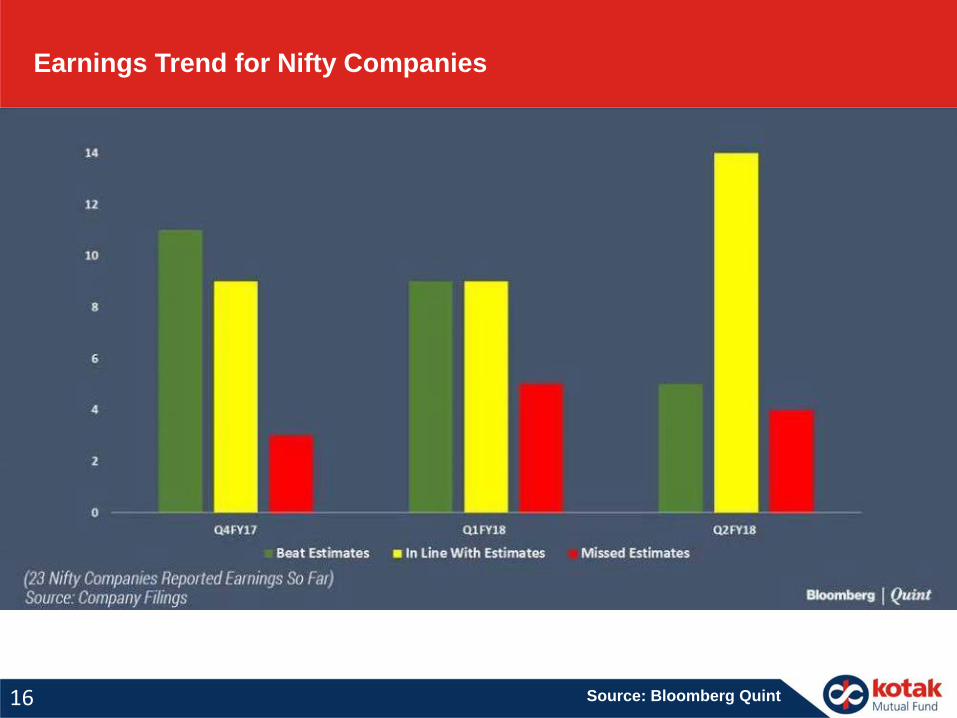
• Earnings broadly along expected lines – domestic focused themes continue to perform better thanexporters
• Consumption theme –• FMCG, autos, food retailing, aviation strong numbers• Media, apparel, agri – prospect of strong numbers ahead as base is very weak• Telecom – good cost control
• Financial theme –• Retail banks – continued their strong show• Corporate banks – divergence lead high NPA, high provisioning pulls down earnings, PSU recap
likely to further help corporate banks to take higher provision and losses in the near-term, butthis is likely to improve significantly in 2HFY19 and beyond
• NBFC – sustained momentum continues, though increase in bond yields likely to impact themslightly in quarters ahead
• Infrastructure –• Cement – good earnings on strong cost control• Capital goods and construction – impacted by GST
• Exports• IT And pharma reporting soft numbers
• Commodities• Oil & Gas – strong earnings by and large, metals a bit soft, but rising global prices to aid
earnings in the coming quarters
16
Earnings Trend for Nifty Companies
Source: Bloomberg Quint
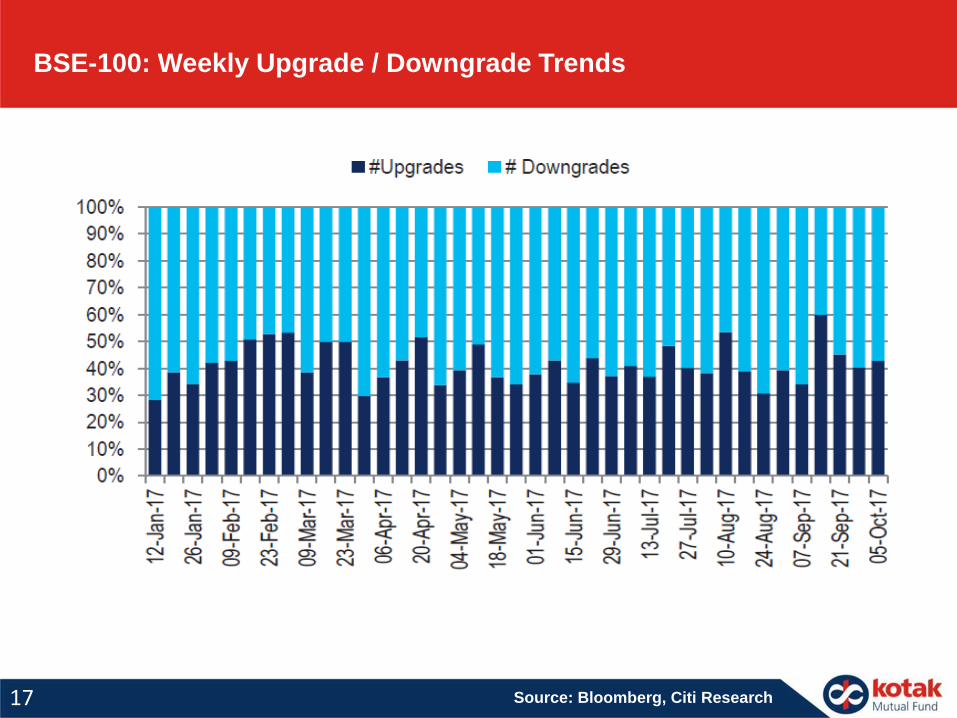
BSE-100: Weekly Upgrade / Downgrade Trends
17 Source: Bloomberg, Citi Research
18
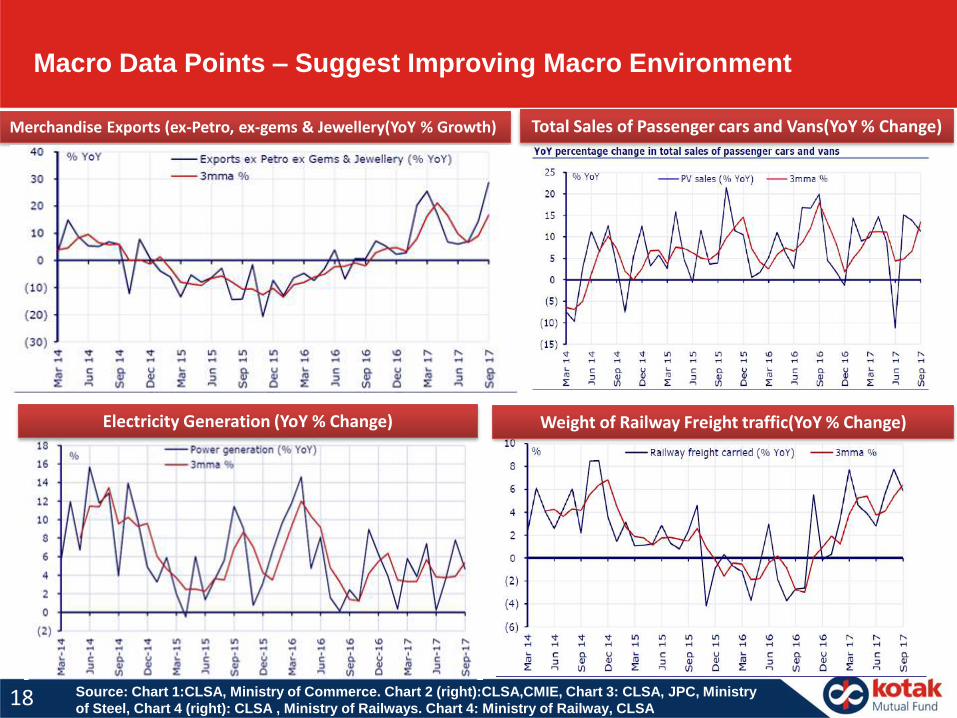
Macro Data Points – Suggest Improving Macro Environment
Source: Chart 1:CLSA, Ministry of Commerce. Chart 2 (right):CLSA,CMIE, Chart 3: CLSA, JPC, Ministry
of Steel, Chart 4 (right): CLSA , Ministry of Railways. Chart 4: Ministry of Railway, CLSA
Merchandise Exports (ex-Petro, ex-gems & Jewellery(YoY % Growth) Total Sales of Passenger cars and Vans(YoY % Change)
Electricity Generation (YoY % Change) Weight of Railway Freight traffic(YoY % Change)
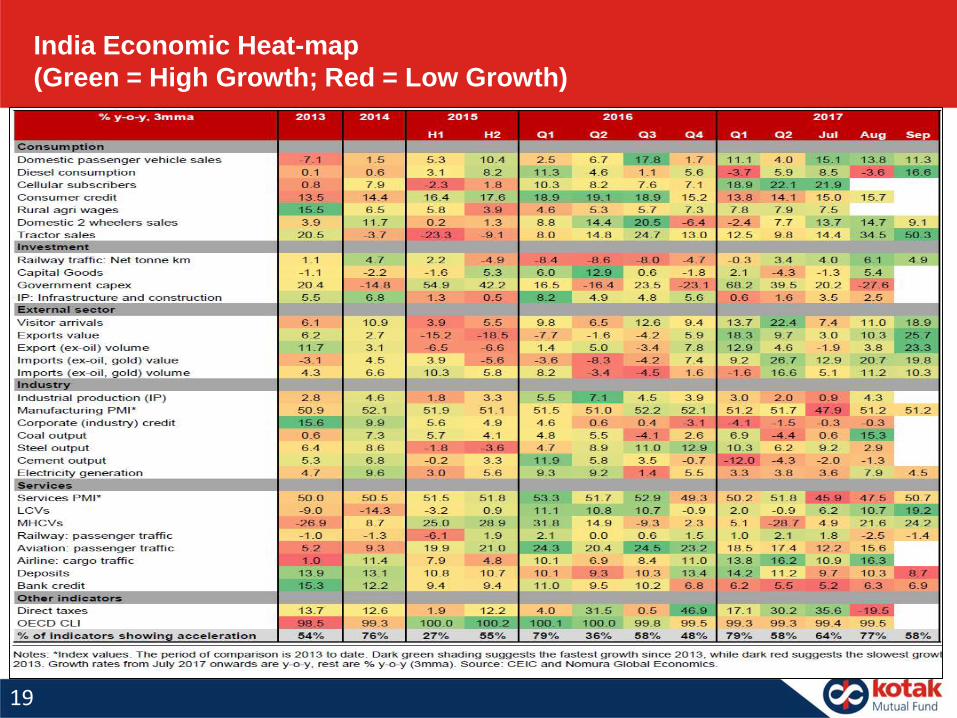
India Economic Heat-map
(Green = High Growth; Red = Low Growth)
19
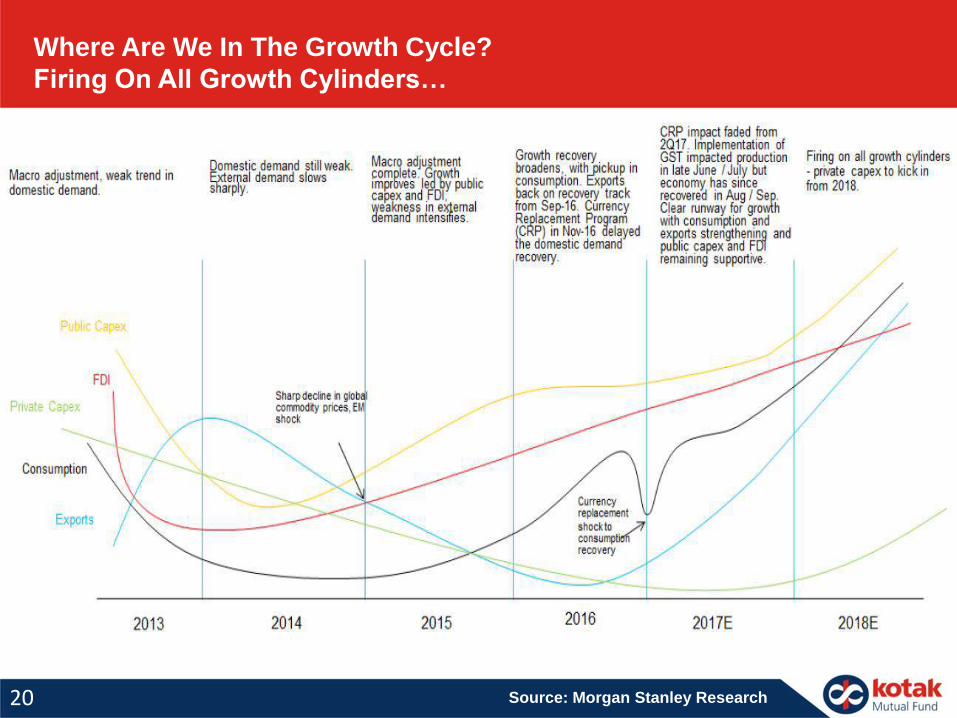
Where Are We In The Growth Cycle?
Firing On All Growth Cylinders…
20 Source: Morgan Stanley Research
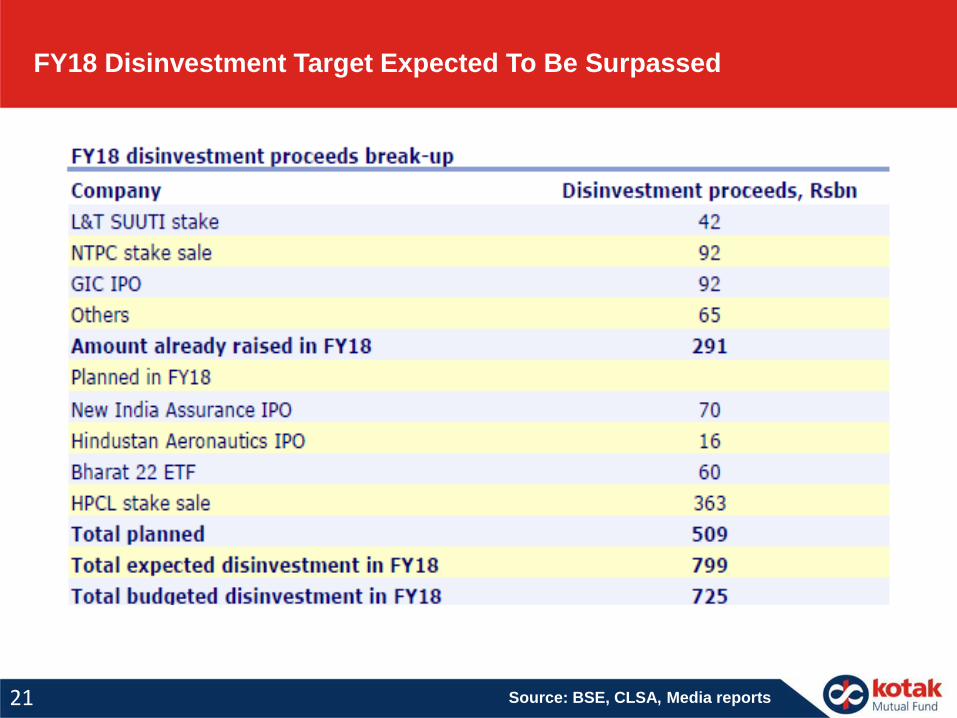
FY18 Disinvestment Target Expected To Be Surpassed
21 Source: BSE, CLSA, Media reports
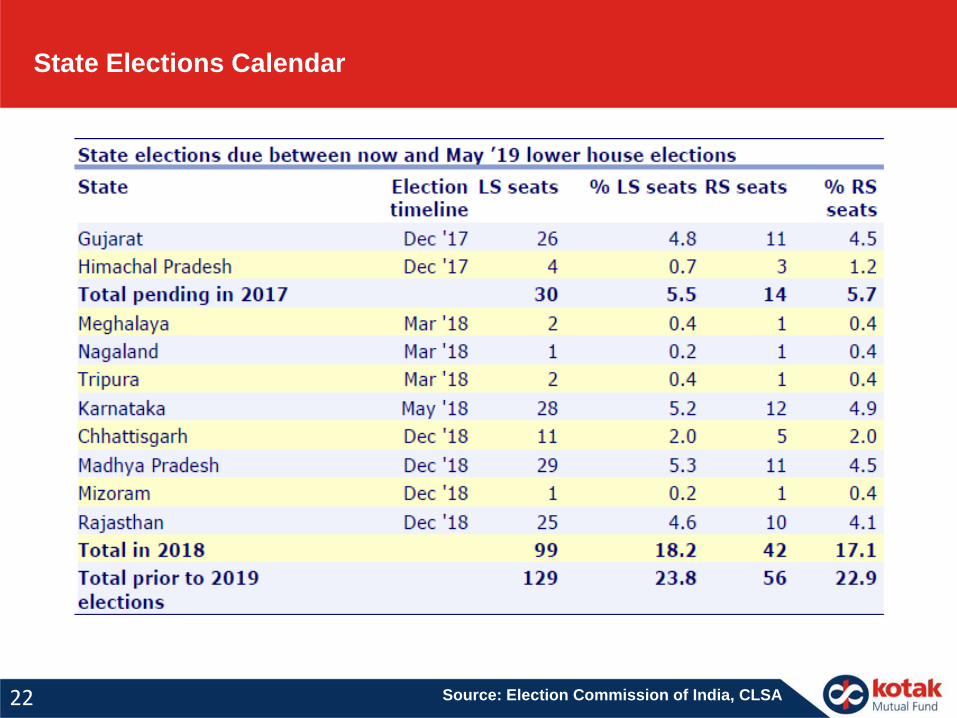
State Elections Calendar
22 Source: Election Commission of India, CLSA
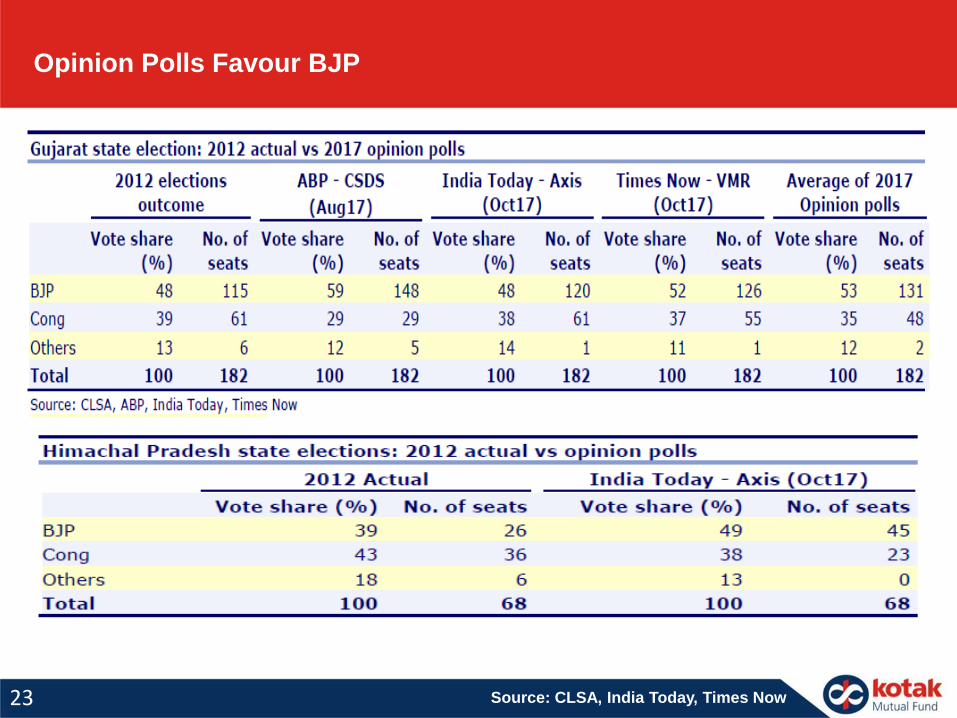
Opinion Polls Favour BJP
23 Source: CLSA, India Today, Times Now

Market Performance
24
*As on 31 Oct 2017, Source: Axis Capital, Bloomberg
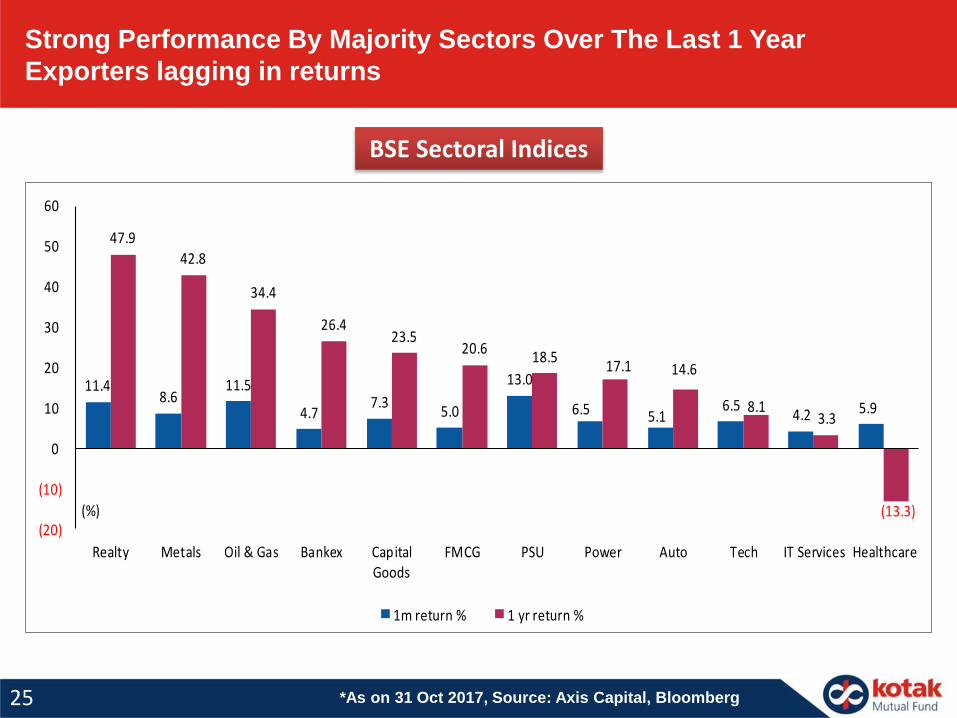
BSE Sectoral Indices
Strong Performance By Majority Sectors Over The Last 1 Year
Exporters lagging in returns
25
11.4 8.6
11.5
4.7 7.3
5.0
13.0
6.5 5.1 6.5
4.2 5.9
47.9
42.8
34.4
26.4 23.5
20.6 18.5
17.1 14.6
8.1 3.3
(13.3)(20)
(10)
0
10
20
30
40
50
60
Realty Metals Oil & Gas Bankex CapitalGoods
FMCG PSU Power Auto Tech IT Services Healthcare
(%)
1m return % 1 yr return %
*As on 31 Oct 2017, Source: Bloomberg
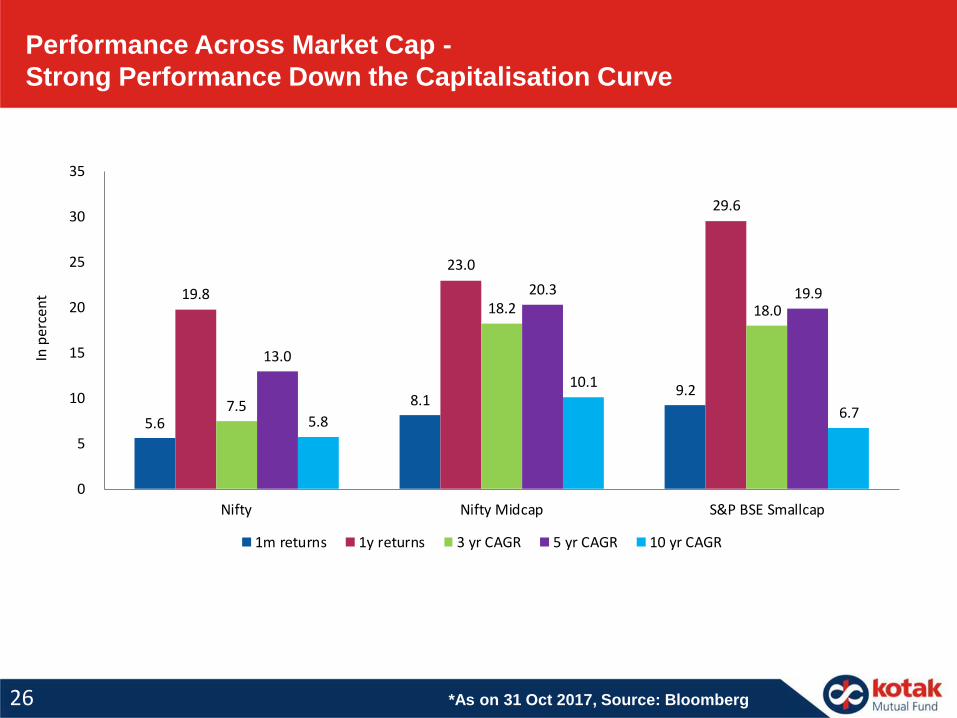
Performance Across Market Cap -
Strong Performance Down the Capitalisation Curve
26
5.6
8.1 9.2
19.8
23.0
29.6
7.5
18.2 18.0
13.0
20.3 19.9
5.8
10.1
6.7
0
5
10
15
20
25
30
35
Nifty Nifty Midcap S&P BSE Smallcap
1m returns 1y returns 3 yr CAGR 5 yr CAGR 10 yr CAGR
In p
erce
nt
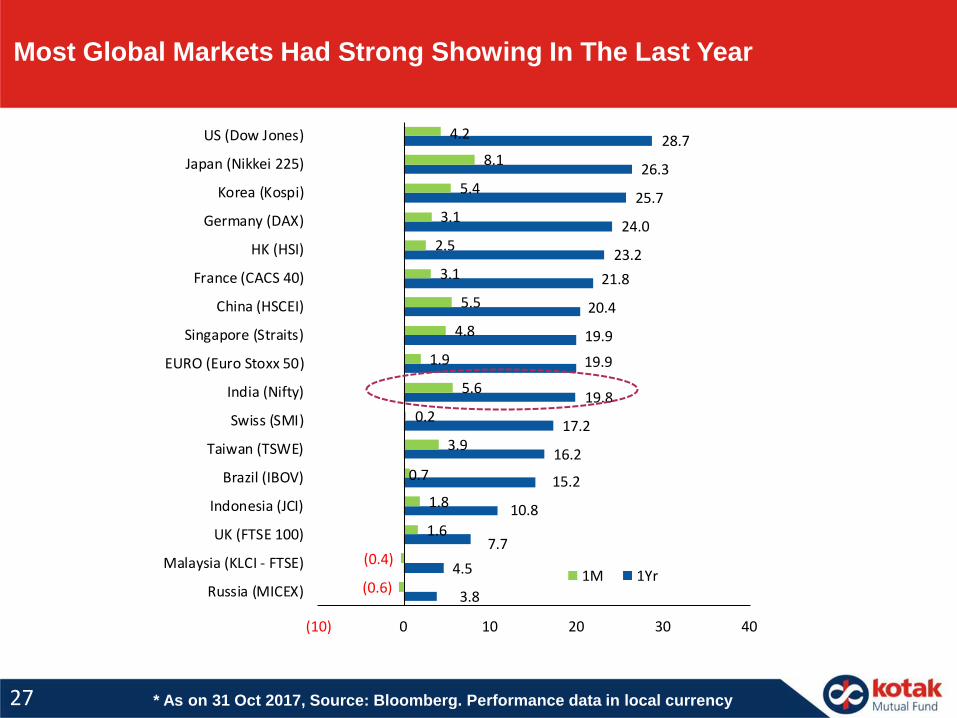
Most Global Markets Had Strong Showing In The Last Year
27 * As on 31 Oct 2017, Source: Bloomberg. Performance data in local currency
3.8
4.5
7.7
10.8
15.2
16.2
17.2
19.8
19.9
19.9
20.4
21.8
23.2
24.0
25.7
26.3
28.7
(0.6)
(0.4)
1.6
1.8
0.7
3.9
0.2
5.6
1.9
4.8
5.5
3.1
2.5
3.1
5.4
8.1
4.2
(10) 0 10 20 30 40
Russia (MICEX)
Malaysia (KLCI - FTSE)
UK (FTSE 100)
Indonesia (JCI)
Brazil (IBOV)
Taiwan (TSWE)
Swiss (SMI)
India (Nifty)
EURO (Euro Stoxx 50)
Singapore (Straits)
China (HSCEI)
France (CACS 40)
HK (HSI)
Germany (DAX)
Korea (Kospi)
Japan (Nikkei 225)
US (Dow Jones)
1M 1Yr

Valuations
28
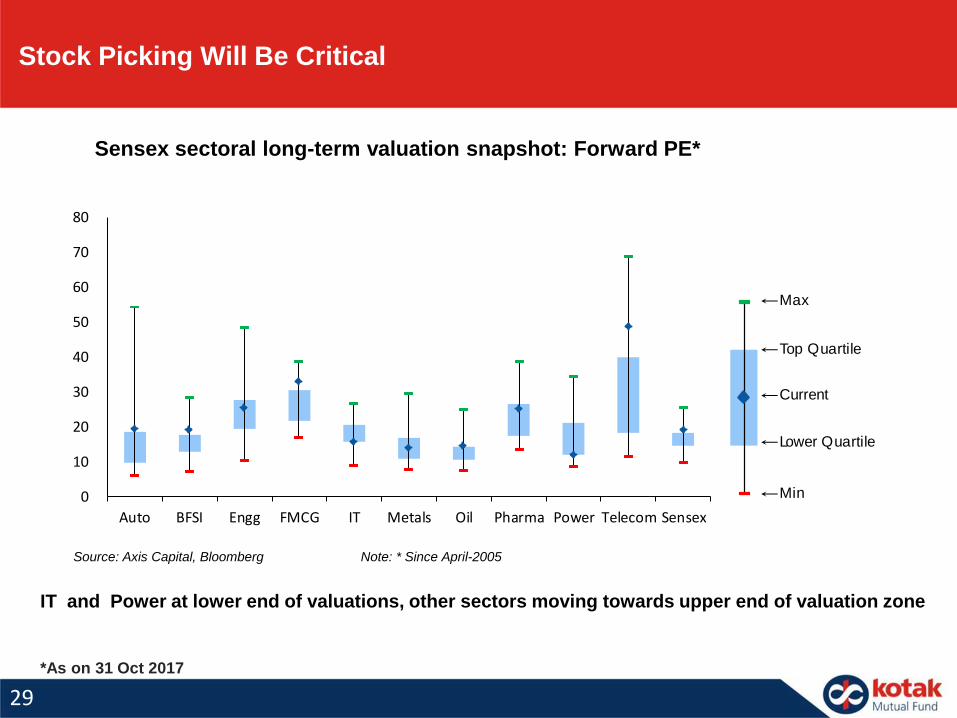
IT and Power at lower end of valuations, other sectors moving towards upper end of valuation zone
Source: Axis Capital, Bloomberg Note: * Since April-2005
Sensex sectoral long-term valuation snapshot: Forward PE*
Stock Picking Will Be Critical
*As on 31 Oct 2017
29
0
10
20
30
40
50
60
70
80
Auto BFSI Engg FMCG IT Metals Oil Pharma Power Telecom Sensex
0
10
20
30
40
50
60
Auto BFSI Engg FMCG IT Services Metals Oil & Gas Pharma Power Telecom Sensex
-1 SD +1 SD Current Max Min
Top Quartile
Current
Lower Quartile
Min
Max
30
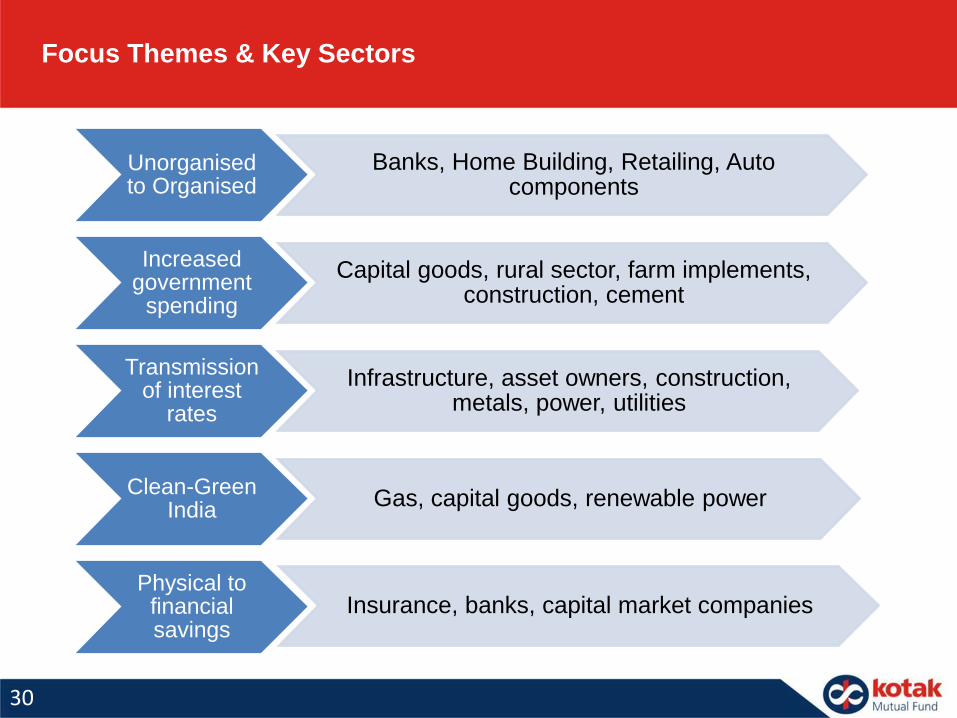
Focus Themes & Key Sectors
Unorganised to Organised
Banks, Home Building, Retailing, Auto components
Increased government
spending
Capital goods, rural sector, farm implements, construction, cement
Transmission of interest
rates
Infrastructure, asset owners, construction, metals, power, utilities
Clean-Green India
Gas, capital goods, renewable power
Physical to financial savings
Insurance, banks, capital market companies
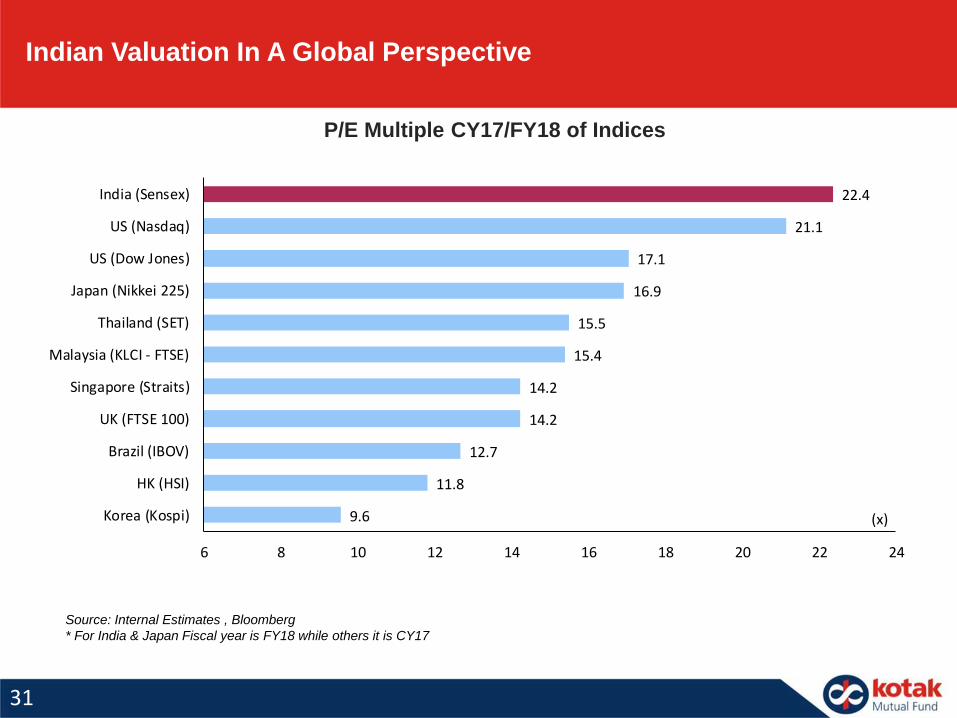
P/E Multiple CY17/FY18 of Indices
Source: Internal Estimates , Bloomberg
* For India & Japan Fiscal year is FY18 while others it is CY17
Indian Valuation In A Global Perspective
31
9.6
11.8
12.7
14.2
14.2
15.4
15.5
16.9
17.1
21.1
22.4
6 8 10 12 14 16 18 20 22 24
Korea (Kospi)
HK (HSI)
Brazil (IBOV)
UK (FTSE 100)
Singapore (Straits)
Malaysia (KLCI - FTSE)
Thailand (SET)
Japan (Nikkei 225)
US (Dow Jones)
US (Nasdaq)
India (Sensex)
(x)
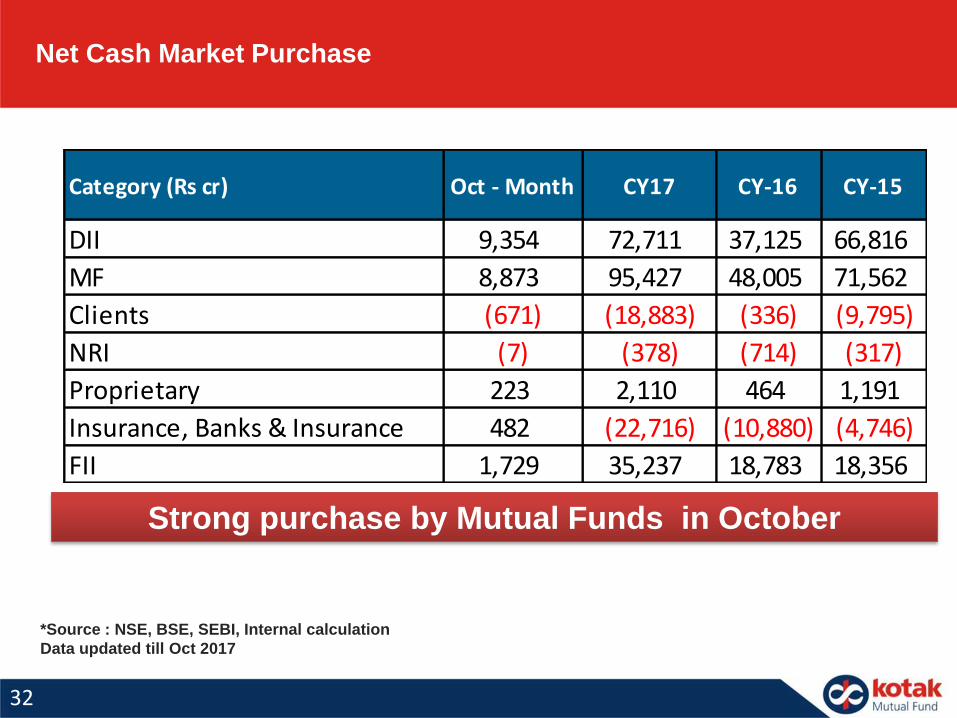
*Source : NSE, BSE, SEBI, Internal calculation
Data updated till Oct 2017
Strong purchase by Mutual Funds in October
Net Cash Market Purchase
32
Category (Rs cr) Oct - Month CY17 CY-16 CY-15
DII 9,354 72,711 37,125 66,816
MF 8,873 95,427 48,005 71,562
Clients (671) (18,883) (336) (9,795)
NRI (7) (378) (714) (317)
Proprietary 223 2,110 464 1,191
Insurance, Banks & Insurance 482 (22,716) (10,880) (4,746)
FII 1,729 35,237 18,783 18,356
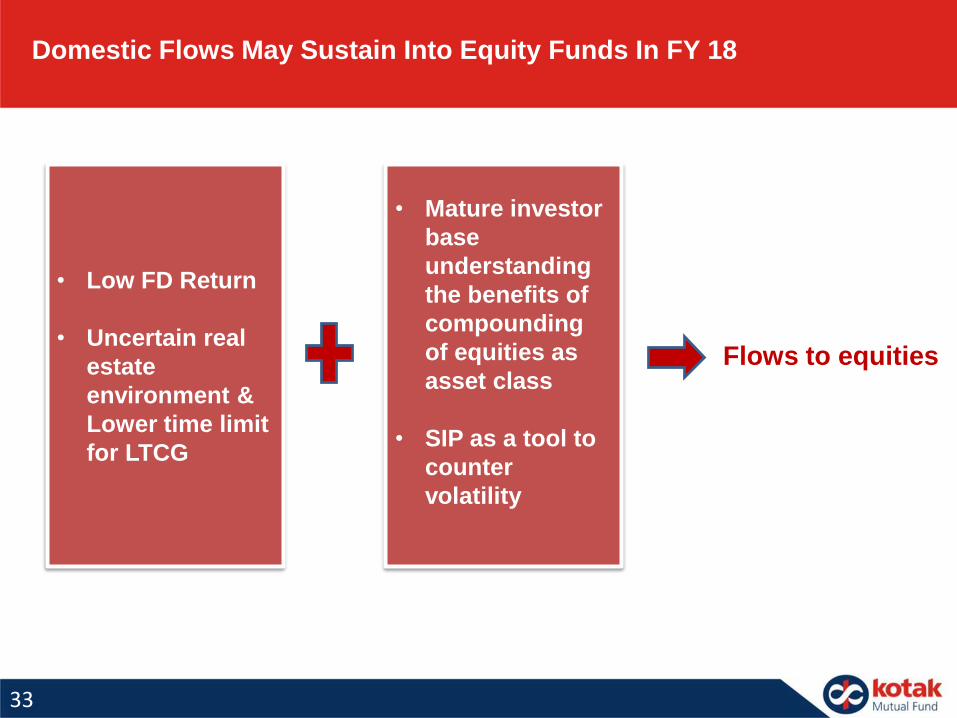
Flows to equities
Domestic Flows May Sustain Into Equity Funds In FY 18
• Low FD Return
• Uncertain real
estate
environment &
Lower time limit
for LTCG
33
• Mature investor
base
understanding
the benefits of
compounding
of equities as
asset class
• SIP as a tool to
counter
volatility
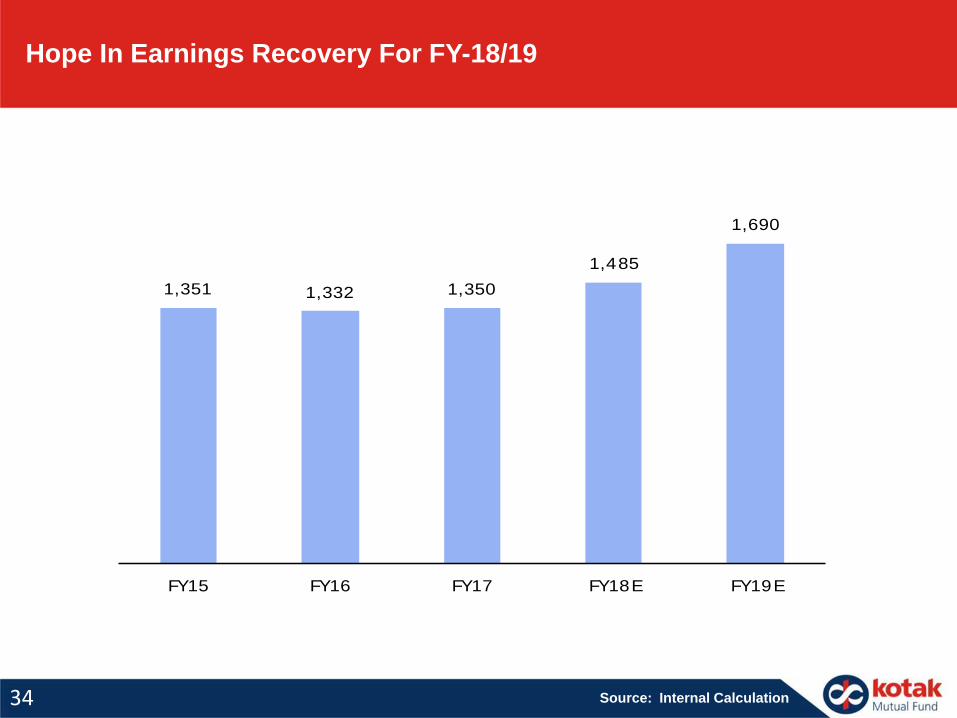
Hope In Earnings Recovery For FY-18/19
Source: Internal Calculation34
1,351 1,332 1,350
1,485
1,690
FY15 FY16 FY17 FY18E FY19E
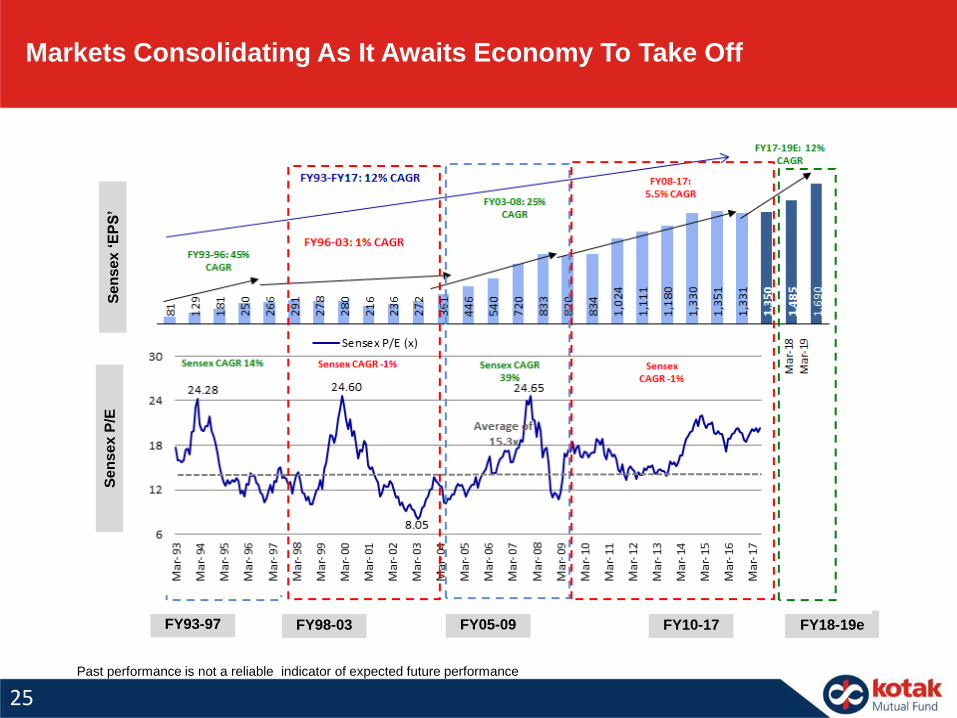
FY93-97 FY98-03 FY05-09 FY10-17 FY18-19e
Se
ns
ex
‘EP
S’
Se
ns
ex
P/E
Past performance is not a reliable indicator of expected future performance
Markets Consolidating As It Awaits Economy To Take Off
25
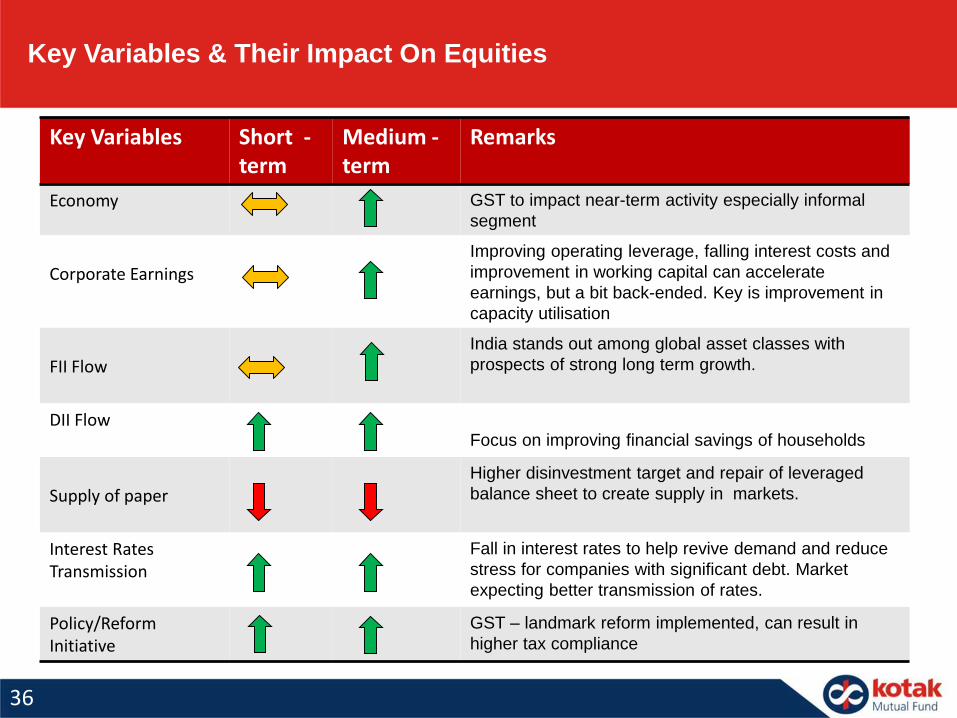
Key Variables & Their Impact On Equities
Key Variables Short -term
Medium -term
Remarks
Economy GST to impact near-term activity especially informal
segment
Corporate EarningsImproving operating leverage, falling interest costs and
improvement in working capital can accelerate
earnings, but a bit back-ended. Key is improvement in
capacity utilisation
FII FlowIndia stands out among global asset classes with
prospects of strong long term growth.
DII FlowFocus on improving financial savings of households
Supply of paperHigher disinvestment target and repair of leveraged
balance sheet to create supply in markets.
Interest Rates Transmission
Fall in interest rates to help revive demand and reduce
stress for companies with significant debt. Market
expecting better transmission of rates.
Policy/Reform Initiative
GST – landmark reform implemented, can result in
higher tax compliance
36
37
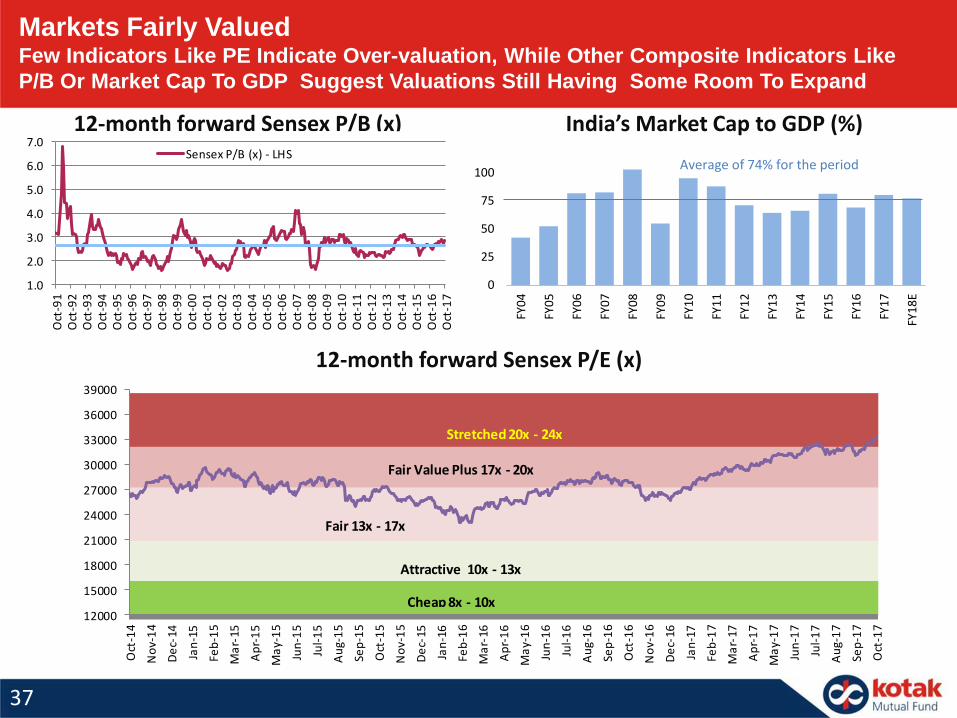
12-month forward Sensex P/B (x) India’s Market Cap to GDP (%)
12-month forward Sensex P/E (x)
Markets Fairly Valued Few Indicators Like PE Indicate Over-valuation, While Other Composite Indicators Like
P/B Or Market Cap To GDP Suggest Valuations Still Having Some Room To Expand
1.0
2.0
3.0
4.0
5.0
6.0
7.0
Oct
-91
Oct
-92
Oct
-93
Oct
-94
Oct
-95
Oct
-96
Oct
-97
Oct
-98
Oct
-99
Oct
-00
Oct
-01
Oct
-02
Oct
-03
Oct
-04
Oct
-05
Oct
-06
Oct
-07
Oct
-08
Oct
-09
Oct
-10
Oct
-11
Oct
-12
Oct
-13
Oct
-14
Oct
-15
Oct
-16
Oct
-17
Sensex P/B (x) - LHS
0
25
50
75
100
FY0
4
FY0
5
FY0
6
FY0
7
FY0
8
FY0
9
FY1
0
FY1
1
FY1
2
FY1
3
FY1
4
FY1
5
FY1
6
FY1
7
FY1
8E
Average of 74% for the period
12000
15000
18000
21000
24000
27000
30000
33000
36000
39000
Oct
-14
No
v-1
4
De
c-14
Jan
-15
Feb
-15
Ma
r-15
Ap
r-1
5
Ma
y-1
5
Jun
-15
Jul-
15
Au
g-1
5
Sep
-15
Oct
-15
No
v-1
5
De
c-15
Jan
-16
Feb
-16
Ma
r-16
Ap
r-1
6
Ma
y-1
6
Jun
-16
Jul-
16
Au
g-1
6
Sep
-16
Oct
-16
No
v-1
6
De
c-16
Jan
-17
Feb
-17
Ma
r-17
Ap
r-1
7
Ma
y-1
7
Jun
-17
Jul-
17
Au
g-1
7
Sep
-17
Oct
-17
Cheap 8x - 10x
Attractive 10x - 13x
Fair 13x - 17x
Fair Value Plus 17x - 20x
Stretched 20x - 24x
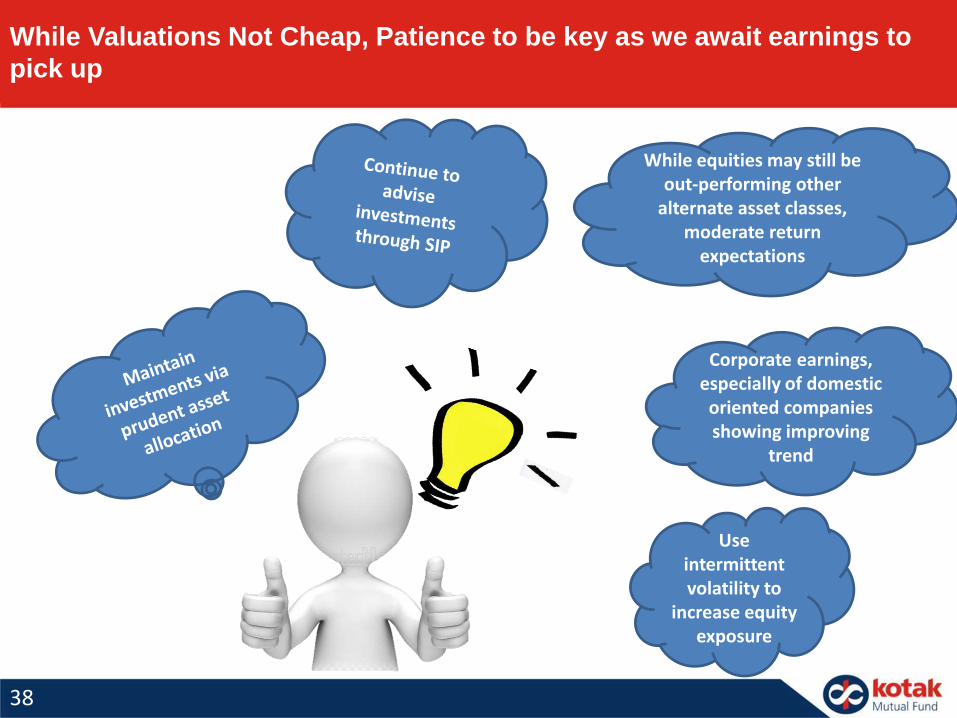
While Valuations Not Cheap, Patience to be key as we await earnings to
pick up
38
Corporate earnings, especially of domestic oriented companies showing improving
trend
While equities may still be out-performing other
alternate asset classes, moderate return
expectations
Use intermittent volatility to
increase equity exposure
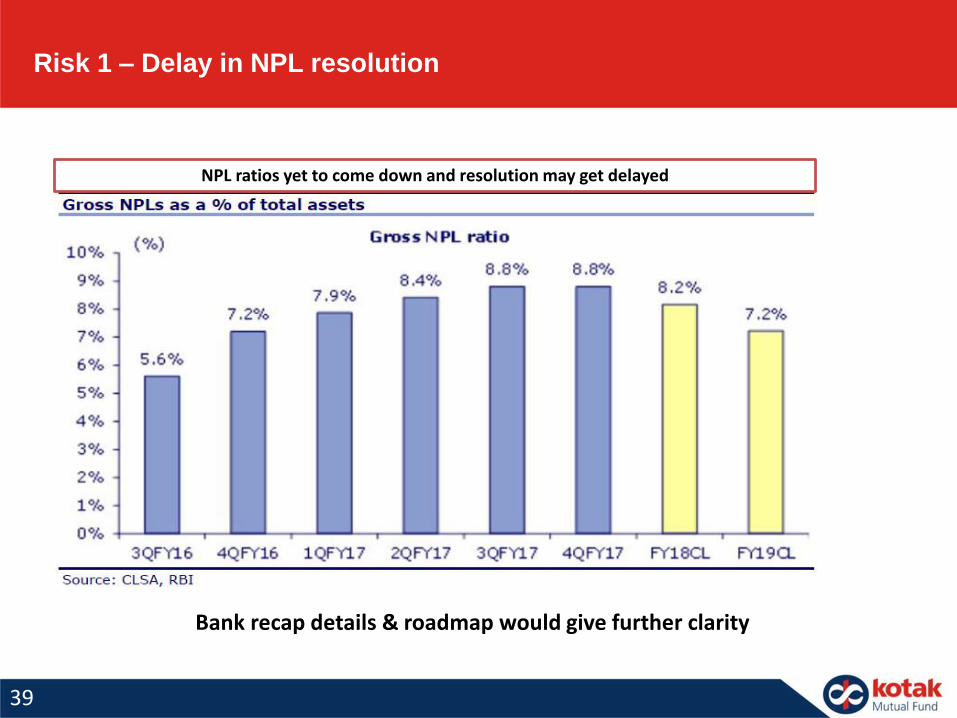
Risk 1 – Delay in NPL resolution
39
NPL ratios yet to come down and resolution may get delayed
Bank recap details & roadmap would give further clarity
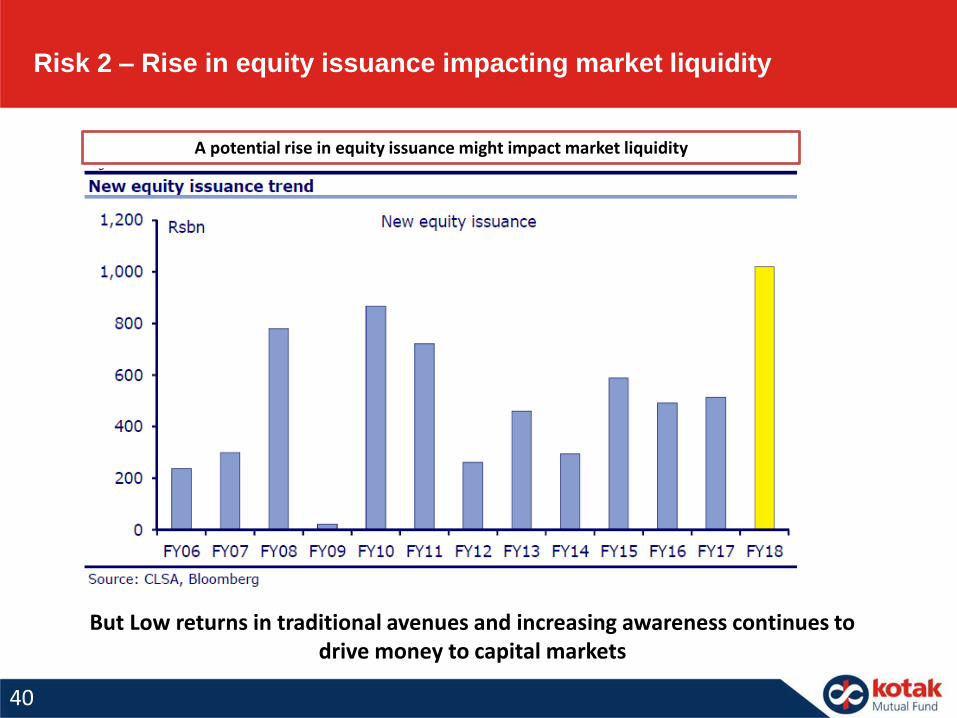
Risk 2 – Rise in equity issuance impacting market liquidity
40
A potential rise in equity issuance might impact market liquidity
But Low returns in traditional avenues and increasing awareness continues to drive money to capital markets
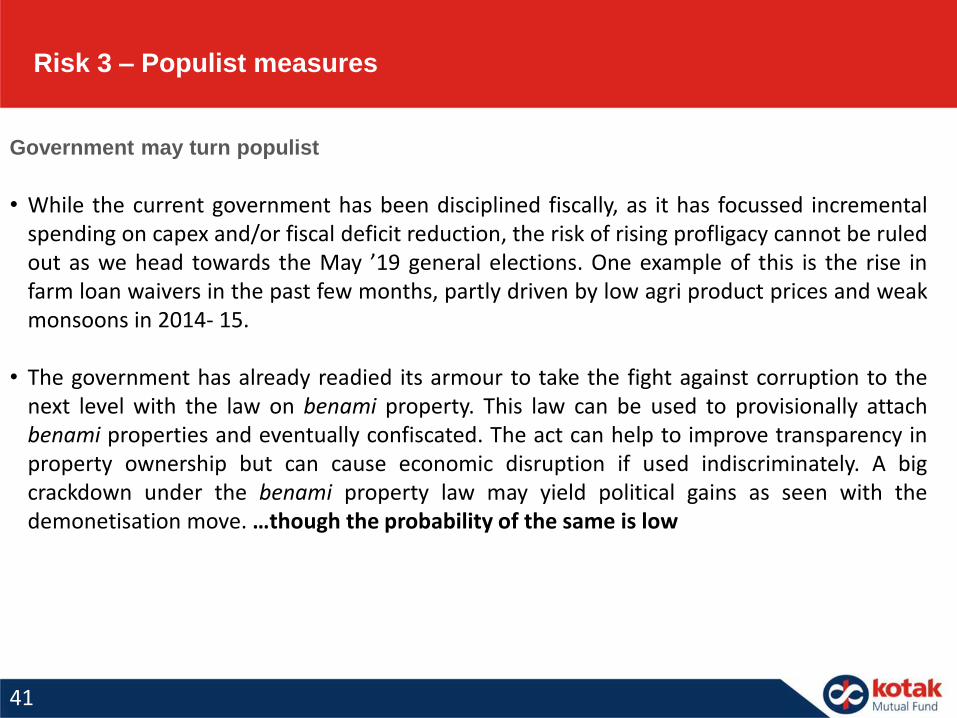
Risk 3 – Populist measures
41
Government may turn populist
• While the current government has been disciplined fiscally, as it has focussed incrementalspending on capex and/or fiscal deficit reduction, the risk of rising profligacy cannot be ruledout as we head towards the May ’19 general elections. One example of this is the rise infarm loan waivers in the past few months, partly driven by low agri product prices and weakmonsoons in 2014- 15.
• The government has already readied its armour to take the fight against corruption to thenext level with the law on benami property. This law can be used to provisionally attachbenami properties and eventually confiscated. The act can help to improve transparency inproperty ownership but can cause economic disruption if used indiscriminately. A bigcrackdown under the benami property law may yield political gains as seen with thedemonetisation move. …though the probability of the same is low
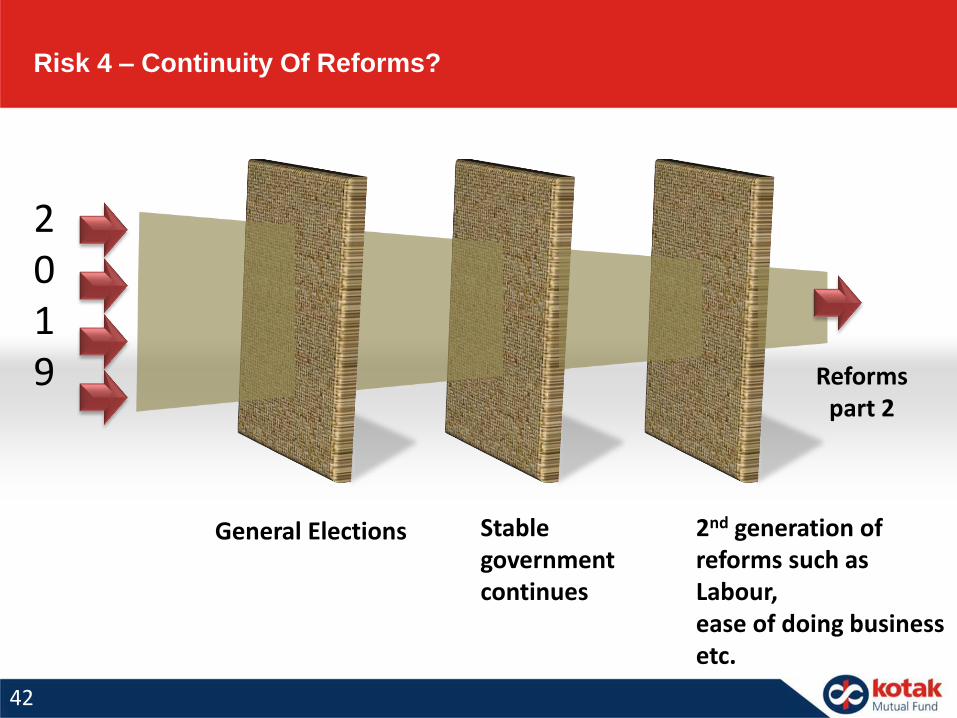
Risk 4 – Continuity Of Reforms?
42
Stable government continues
General Elections
2019
2nd generation of reforms such as Labour,ease of doing business etc.
Reforms part 2

43
Risk 5 – US Fed Rate Hike & Other Geo Political Risks
India has been relatively resilient to US rate hikes & geo political risks in the
past
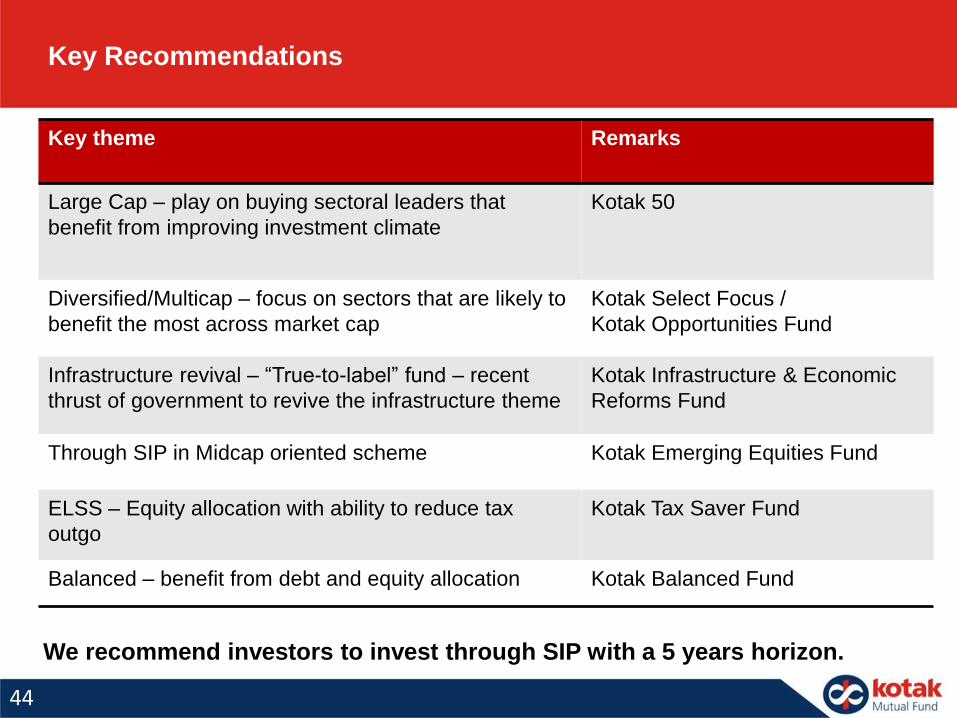
Key Recommendations
Key theme Remarks
Large Cap – play on buying sectoral leaders that
benefit from improving investment climate
Kotak 50
Diversified/Multicap – focus on sectors that are likely to
benefit the most across market cap
Kotak Select Focus /
Kotak Opportunities Fund
Infrastructure revival – “True-to-label” fund – recent
thrust of government to revive the infrastructure theme
Kotak Infrastructure & Economic
Reforms Fund
Through SIP in Midcap oriented scheme Kotak Emerging Equities Fund
ELSS – Equity allocation with ability to reduce tax
outgo
Kotak Tax Saver Fund
Balanced – benefit from debt and equity allocation Kotak Balanced Fund
We recommend investors to invest through SIP with a 5 years horizon.
44
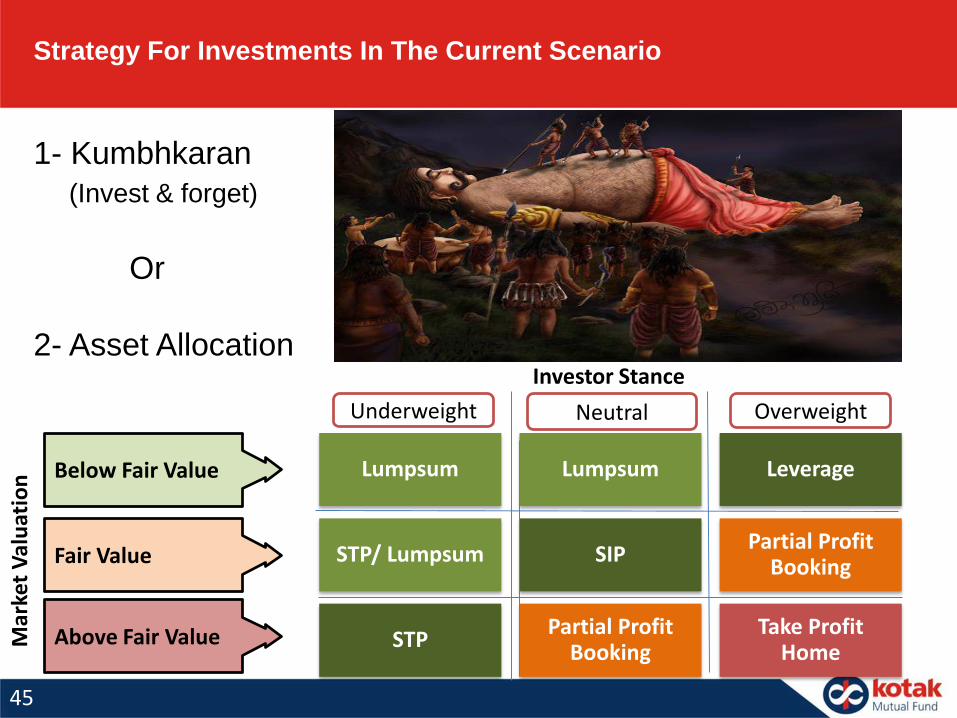
Strategy For Investments In The Current Scenario
45
1- Kumbhkaran
(Invest & forget)
Or
2- Asset Allocation
Lumpsum Lumpsum Leverage
STP/ Lumpsum SIPPartial Profit
Booking
STPPartial Profit
BookingTake Profit
Home
OverweightNeutralUnderweight
Below Fair Value
Fair Value
Above Fair ValueMar
ket
Val
uat
ion
Investor Stance

DEBT MARKETS
46
How Oct 2017 Unfolded
Macro Data:
• Inflation :
– Consumer prices in September rose 3.28 % over the same month last year. CPI inflation in August was
revised to 3.28 %
– Wholesale inflation fell to 2.60% in September as prices of food articles, led by vegetables, softened.
• India’s factory output rebounded strongly to a nine-month high of 4.3% in August as companies stepped up
production to restock warehouses ahead of the festival season, after they reduced output in June and July
owing to uncertainties regarding implementation of the goods and services tax (GST).
• Services sector activity expanded for the first time in three months in September -- but only slightly. The
Nikkei India Services PMI stood at 50.7 in September -- from 47.5 in August.
• India’s fiscal deficit at the end of the first half of the current fiscal touched 91.3% of the budget estimate,
mainly due to rise in expenditure. In absolute terms, the fiscal deficit was Rs4.99 trillion during the April-
September period of 2017-18.
• Trade Data :
– India’s merchandise exports grew (rose 25.7% to $28.6 billion) at the fastest pace in six months in
September, on the back of expansion in shipments of chemicals, petroleum and engineering products
– While imports too rose by 18.09 % to USD 37.6 billion in September from USD 31.83 billion in the year-
ago month.
– Trade balance stood almost flat at USD 8.98 billion in September 2017 against USD 9 billion in
September 2016
47

48
How Oct 2017 Unfolded
Economical Update:
• The finance ministry announced a Rs2.11 trillion bank recapitalisation plan for state-owned lenders
weighed down by bad loans, seeking to stimulate the flow of credit to spur private investment.
• Out of the total commitment, Rs1.35 trillion will come from the sale of so-called recapitalisation bonds.
The remaining Rs76,000 crore will be through budgetary allocation and fundraising from the markets
• India jumped 30 spots to secure a place among the top-100 countries on World Bank's ease of doing
business ranking list in 2018.
• Bharatmala highway road project launched: Finance Minister Arun Jaitley announced a number of
highway/road projects at an estimated cost of Rs 7 lakh crore
• The Railways is looking to invest over USD 150 billion over the next five years which would help create
one million additional jobs
• Narendra Modi’s ambitious National Investment and Infrastructure Fund has got a major boost with the Abu
Dhabi Investment Authority committing to put in up to $1 billion.
• The RBI left its key interest rates unchanged, while slashing the statutory liquidity ratio (SLR) by 50
basis points.
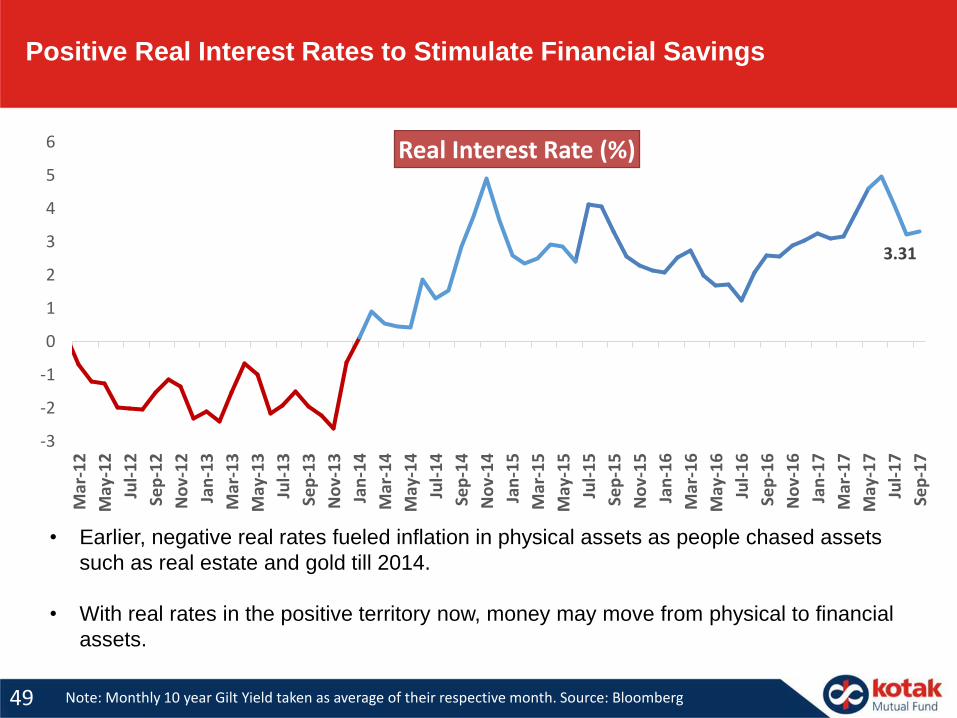
Positive Real Interest Rates to Stimulate Financial Savings
49
• Earlier, negative real rates fueled inflation in physical assets as people chased assets
such as real estate and gold till 2014.
• With real rates in the positive territory now, money may move from physical to financial
assets.
Note: Monthly 10 year Gilt Yield taken as average of their respective month. Source: Bloomberg
3.31
-3
-2
-1
0
1
2
3
4
5
6
Mar
-12
May
-12
Jul-
12
Sep
-12
No
v-1
2
Jan
-13
Mar
-13
May
-13
Jul-
13
Sep
-13
No
v-1
3
Jan
-14
Mar
-14
May
-14
Jul-
14
Sep
-14
No
v-1
4
Jan
-15
Mar
-15
May
-15
Jul-
15
Sep
-15
No
v-1
5
Jan
-16
Mar
-16
May
-16
Jul-
16
Sep
-16
No
v-1
6
Jan
-17
Mar
-17
May
-17
Jul-
17
Sep
-17
Real Interest Rate (%)
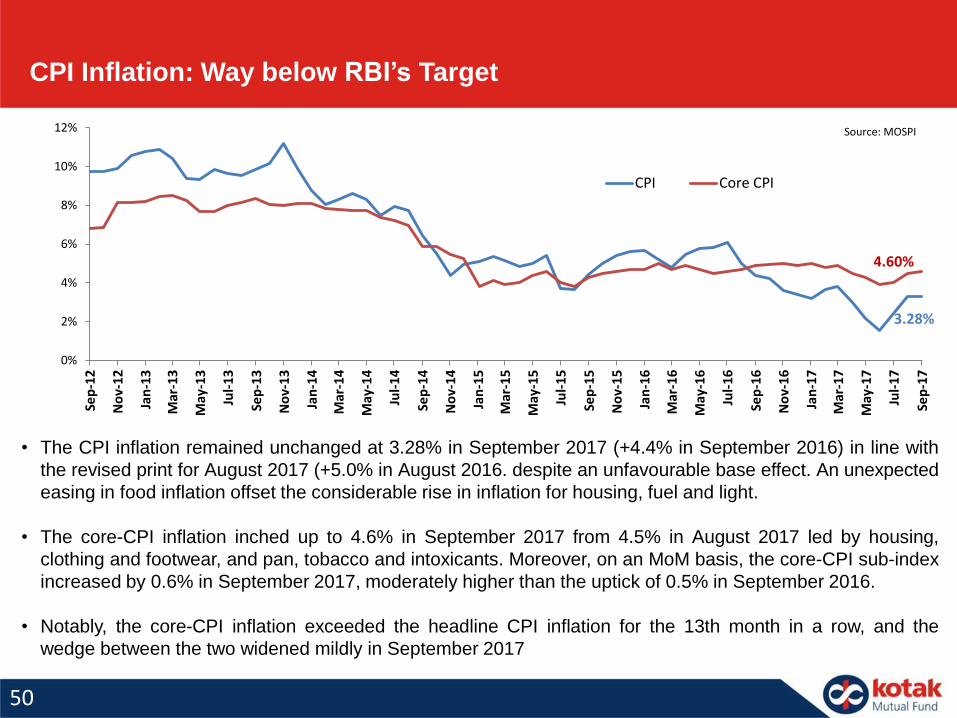
CPI Inflation: Way below RBI’s Target
Source: MOSPI
• The CPI inflation remained unchanged at 3.28% in September 2017 (+4.4% in September 2016) in line with
the revised print for August 2017 (+5.0% in August 2016. despite an unfavourable base effect. An unexpected
easing in food inflation offset the considerable rise in inflation for housing, fuel and light.
• The core-CPI inflation inched up to 4.6% in September 2017 from 4.5% in August 2017 led by housing,
clothing and footwear, and pan, tobacco and intoxicants. Moreover, on an MoM basis, the core-CPI sub-index
increased by 0.6% in September 2017, moderately higher than the uptick of 0.5% in September 2016.
• Notably, the core-CPI inflation exceeded the headline CPI inflation for the 13th month in a row, and the
wedge between the two widened mildly in September 2017
50
3.28%
4.60%
0%
2%
4%
6%
8%
10%
12%
Sep
-12
No
v-1
2
Jan
-13
Mar
-13
May
-13
Jul-
13
Sep
-13
No
v-1
3
Jan
-14
Mar
-14
May
-14
Jul-
14
Sep
-14
No
v-1
4
Jan
-15
Mar
-15
May
-15
Jul-
15
Sep
-15
No
v-1
5
Jan
-16
Mar
-16
May
-16
Jul-
16
Sep
-16
No
v-1
6
Jan
-17
Mar
-17
May
-17
Jul-
17
Sep
-17
CPI Core CPI
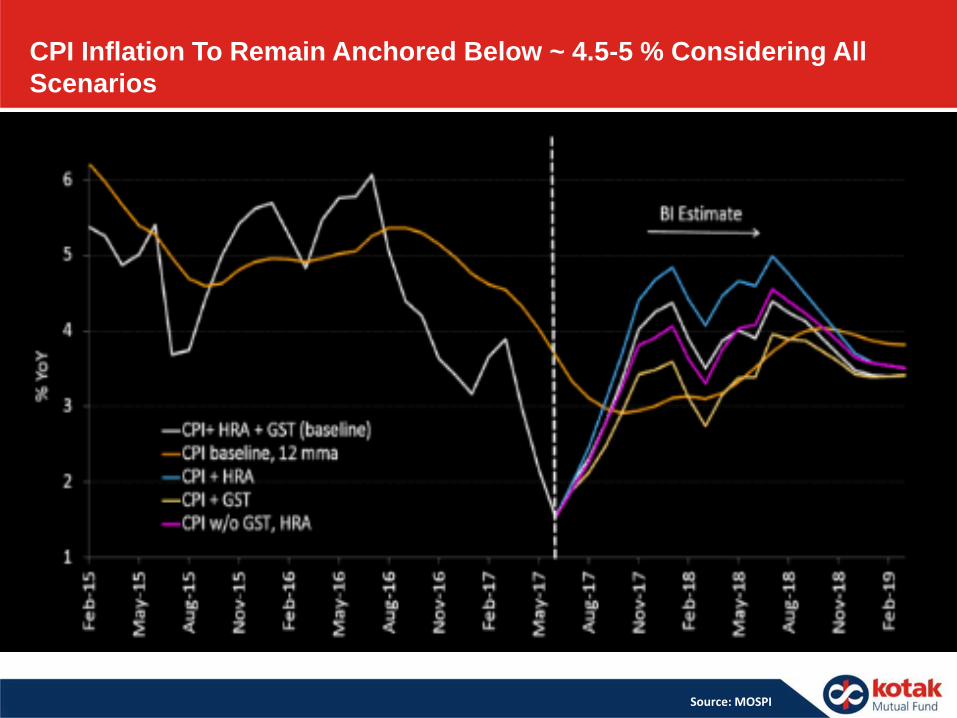
CPI Inflation To Remain Anchored Below ~ 4.5-5 % Considering All
Scenarios
Source: MOSPI
51
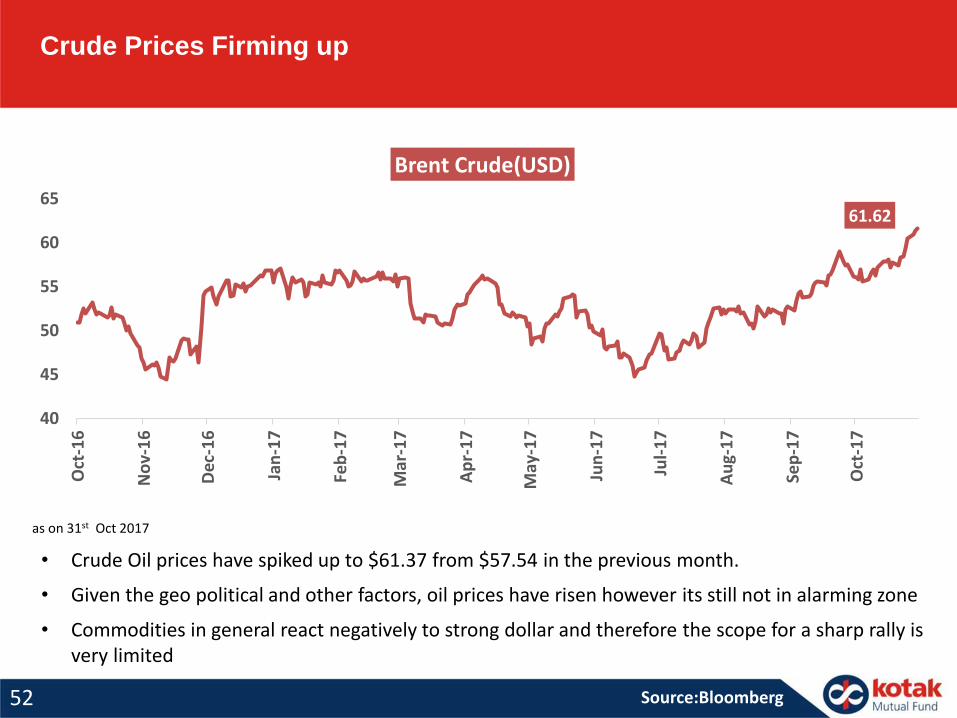
Crude Prices Firming up
Source:Bloomberg
as on 31st Oct 2017
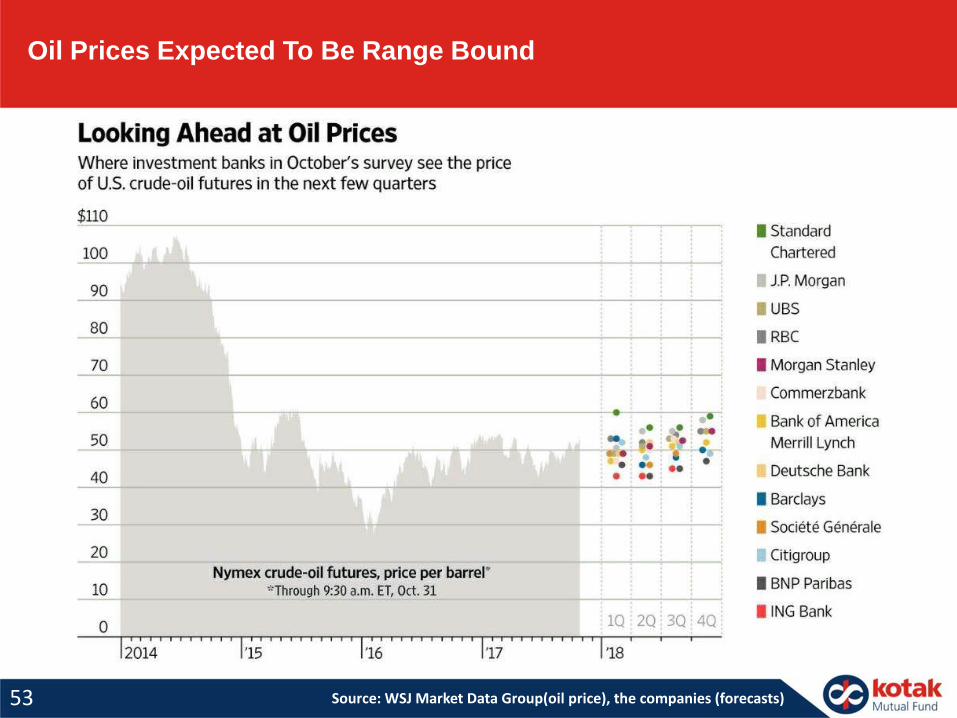
• Crude Oil prices have spiked up to $61.37 from $57.54 in the previous month.
• Given the geo political and other factors, oil prices have risen however its still not in alarming zone
• Commodities in general react negatively to strong dollar and therefore the scope for a sharp rally is very limited
52
61.62
40
45
50
55
60
65
Oct
-16
No
v-1
6
Dec
-16
Jan
-17
Feb
-17
Mar
-17
Ap
r-1
7
May
-17
Jun
-17
Jul-
17
Au
g-1
7
Sep
-17
Oct
-17
Brent Crude(USD)
53 Source: WSJ Market Data Group(oil price), the companies (forecasts)
Oil Prices Expected To Be Range Bound
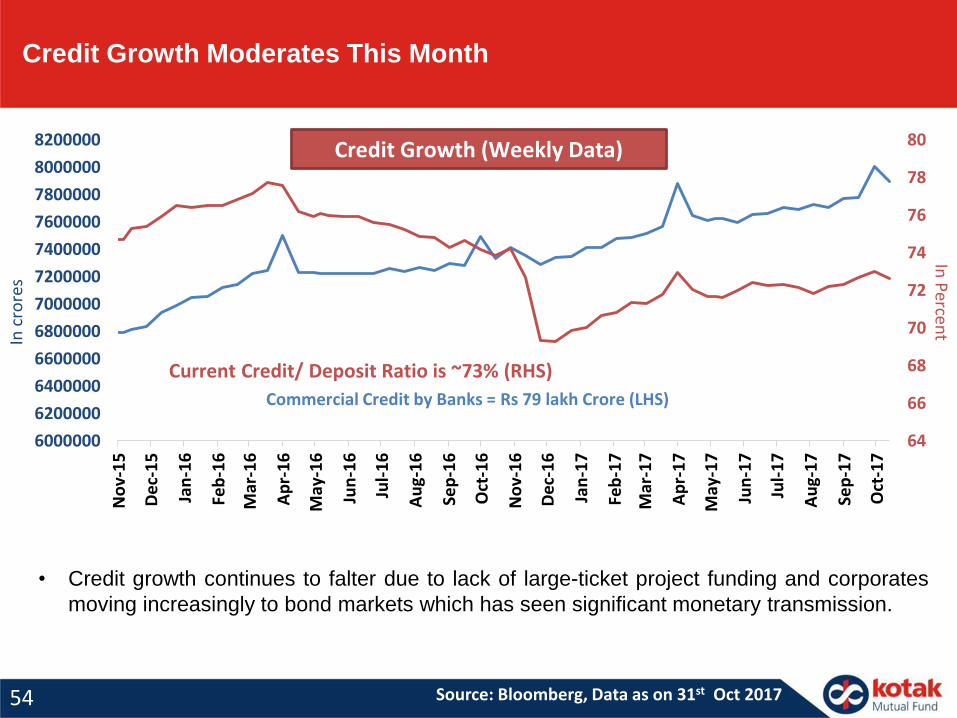
• Credit growth continues to falter due to lack of large-ticket project funding and corporates
moving increasingly to bond markets which has seen significant monetary transmission.
Credit Growth Moderates This Month
Source: Bloomberg, Data as on 31st Oct 201754
64
66
68
70
72
74
76
78
80
6000000
6200000
6400000
6600000
6800000
7000000
7200000
7400000
7600000
7800000
8000000
8200000N
ov-
15
Dec
-15
Jan
-16
Feb
-16
Mar
-16
Ap
r-1
6
May
-16
Jun
-16
Jul-
16
Au
g-1
6
Sep
-16
Oct
-16
No
v-1
6
Dec
-16
Jan
-17
Feb
-17
Mar
-17
Ap
r-1
7
May
-17
Jun
-17
Jul-
17
Au
g-1
7
Sep
-17
Oct
-17
Current Credit/ Deposit Ratio is ~73% (RHS)
Commercial Credit by Banks = Rs 79 lakh Crore (LHS)
Credit Growth (Weekly Data)
In c
rore
sIn
Percen
t
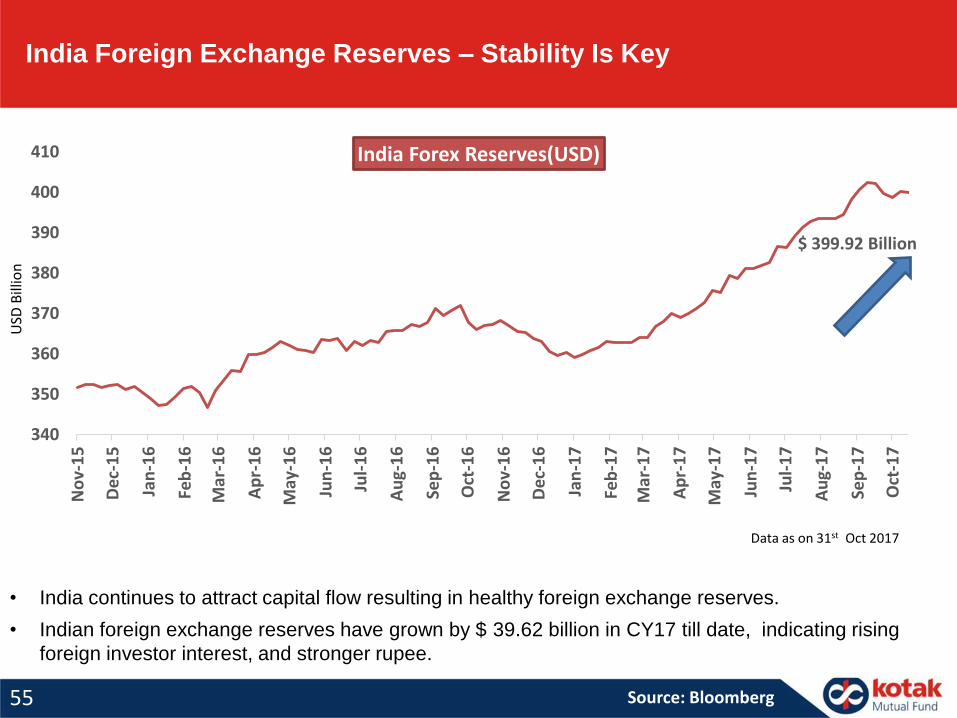
India Foreign Exchange Reserves – Stability Is Key
• India continues to attract capital flow resulting in healthy foreign exchange reserves.
• Indian foreign exchange reserves have grown by $ 39.62 billion in CY17 till date, indicating rising
foreign investor interest, and stronger rupee.
Source: Bloomberg55
Data as on 31st Oct 2017
$ 399.92 Billion
340
350
360
370
380
390
400
410
No
v-1
5
Dec
-15
Jan
-16
Feb
-16
Mar
-16
Ap
r-1
6
May
-16
Jun
-16
Jul-
16
Au
g-1
6
Sep
-16
Oct
-16
No
v-1
6
Dec
-16
Jan
-17
Feb
-17
Mar
-17
Ap
r-1
7
May
-17
Jun
-17
Jul-
17
Au
g-1
7
Sep
-17
Oct
-17
India Forex Reserves(USD)
USD
Bill
ion
The Game Changer
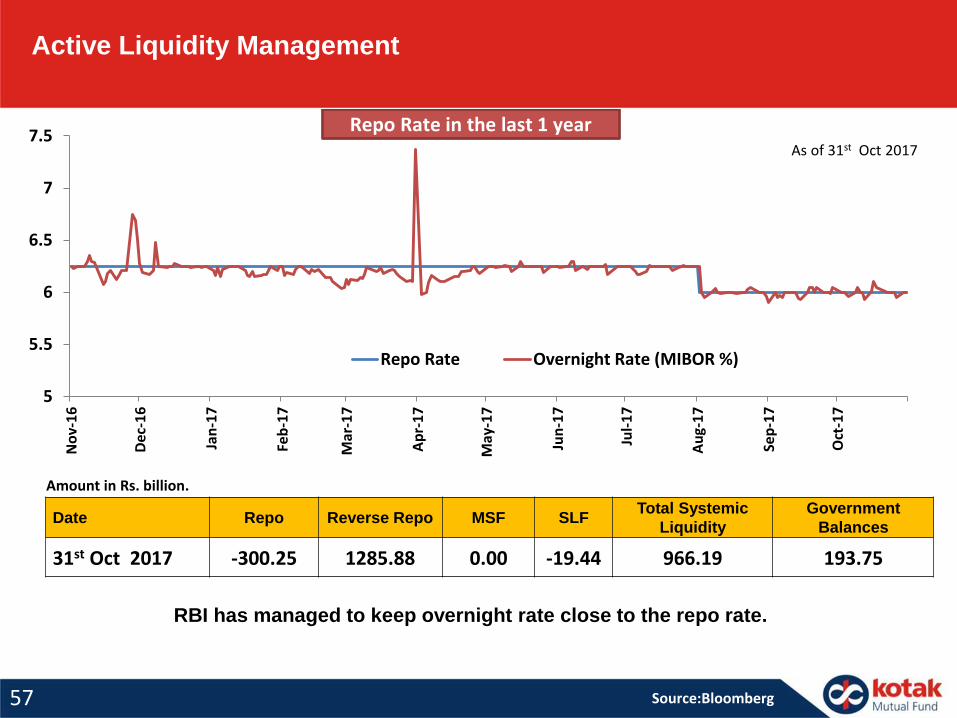
56
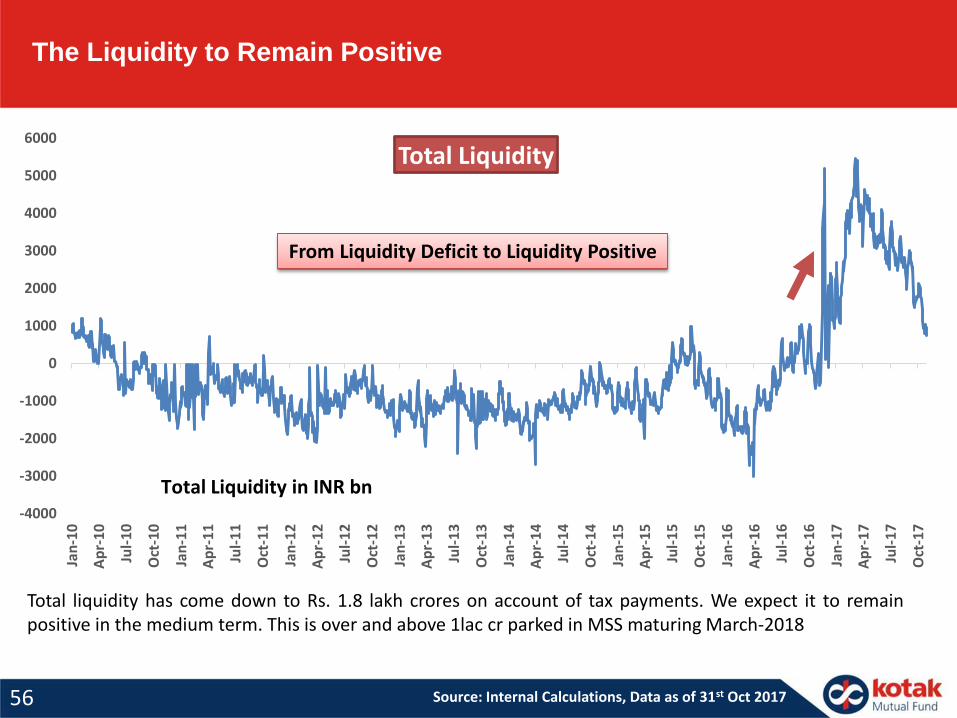
Total liquidity has come down to Rs. 1.8 lakh crores on account of tax payments. We expect it to remainpositive in the medium term. This is over and above 1lac cr parked in MSS maturing March-2018
From Liquidity Deficit to Liquidity Positive
The Liquidity to Remain Positive
Source: Internal Calculations, Data as of 31st Oct 2017
-4000
-3000
-2000
-1000
0
1000
2000
3000
4000
5000
6000
Jan
-10
Ap
r-1
0
Jul-
10
Oct
-10
Jan
-11
Ap
r-1
1
Jul-
11
Oct
-11
Jan
-12
Ap
r-1
2
Jul-
12
Oct
-12
Jan
-13
Ap
r-1
3
Jul-
13
Oct
-13
Jan
-14
Ap
r-1
4
Jul-
14
Oct
-14
Jan
-15
Ap
r-1
5
Jul-
15
Oct
-15
Jan
-16
Ap
r-1
6
Jul-
16
Oct
-16
Jan
-17
Ap
r-1
7
Jul-
17
Oct
-17
Total Liquidity
Total Liquidity in INR bn
5
5.5
6
6.5
7
7.5
No
v-1
6
Dec
-16
Jan
-17
Feb
-17
Mar
-17
Ap
r-1
7
May
-17
Jun
-17
Jul-
17
Au
g-1
7
Sep
-17
Oct
-17
Repo Rate Overnight Rate (MIBOR %)
Repo Rate in the last 1 year
RBI has managed to keep overnight rate close to the repo rate.
Source:Bloomberg
Date Repo Reverse Repo MSF SLFTotal Systemic
Liquidity
Government
Balances
31st Oct 2017 -300.25 1285.88 0.00 -19.44 966.19 193.75
Amount in Rs. billion.
Active Liquidity Management
As of 31st Oct 2017
57
6
6.5
7
7.5
3M 6M 1Y 2Y 4Y 5Y 6Y 7Y 8Y 9Y 10Y 11Y 12Y 13Y 14Y 17Y 18Y 22Y 27Y 28Y 30Y 35Y 40Y
INR India Sovereign Curve Last YTM INR India Sovereign Curve 01/10/2017 YTM
Front End
Belly and Long
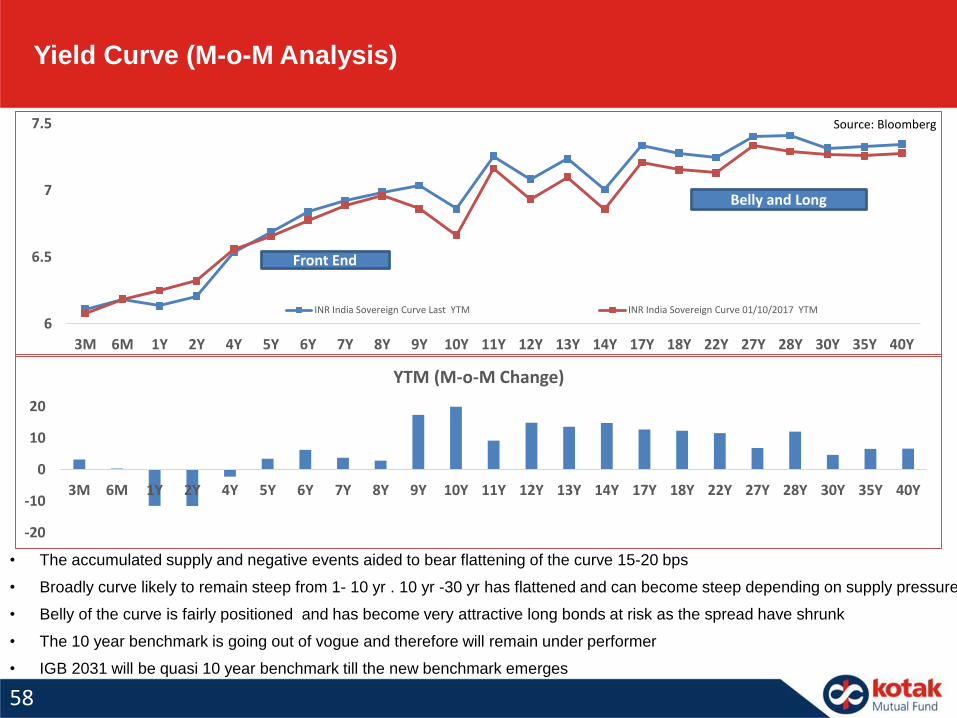
Yield Curve (M-o-M Analysis)
• The accumulated supply and negative events aided to bear flattening of the curve 15-20 bps
• Broadly curve likely to remain steep from 1- 10 yr . 10 yr -30 yr has flattened and can become steep depending on supply pressure
• Belly of the curve is fairly positioned and has become very attractive long bonds at risk as the spread have shrunk
• The 10 year benchmark is going out of vogue and therefore will remain under performer
• IGB 2031 will be quasi 10 year benchmark till the new benchmark emerges
Source: Bloomberg
58
-20
-10
0
10
20
3M 6M 1Y 2Y 4Y 5Y 6Y 7Y 8Y 9Y 10Y 11Y 12Y 13Y 14Y 17Y 18Y 22Y 27Y 28Y 30Y 35Y 40Y
YTM (M-o-M Change)
59
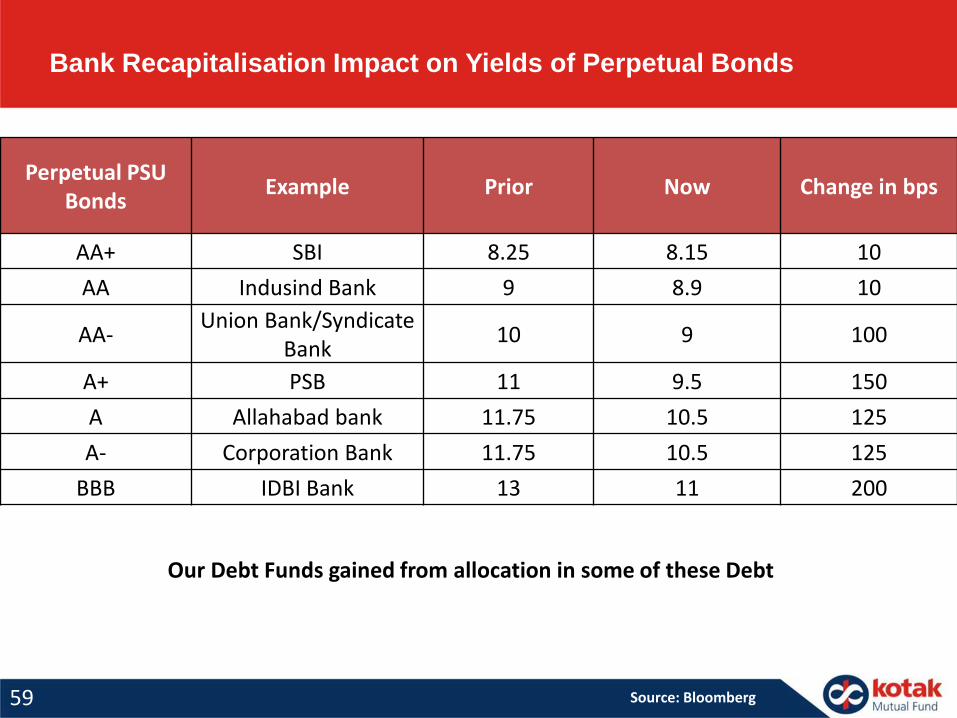
Perpetual PSU Bonds
Example Prior Now Change in bps
AA+ SBI 8.25 8.15 10
AA Indusind Bank 9 8.9 10
AA-Union Bank/Syndicate
Bank10 9 100
A+ PSB 11 9.5 150
A Allahabad bank 11.75 10.5 125
A- Corporation Bank 11.75 10.5 125
BBB IDBI Bank 13 11 200
Bank Recapitalisation Impact on Yields of Perpetual Bonds
Source: Bloomberg
Our Debt Funds gained from allocation in some of these Debt
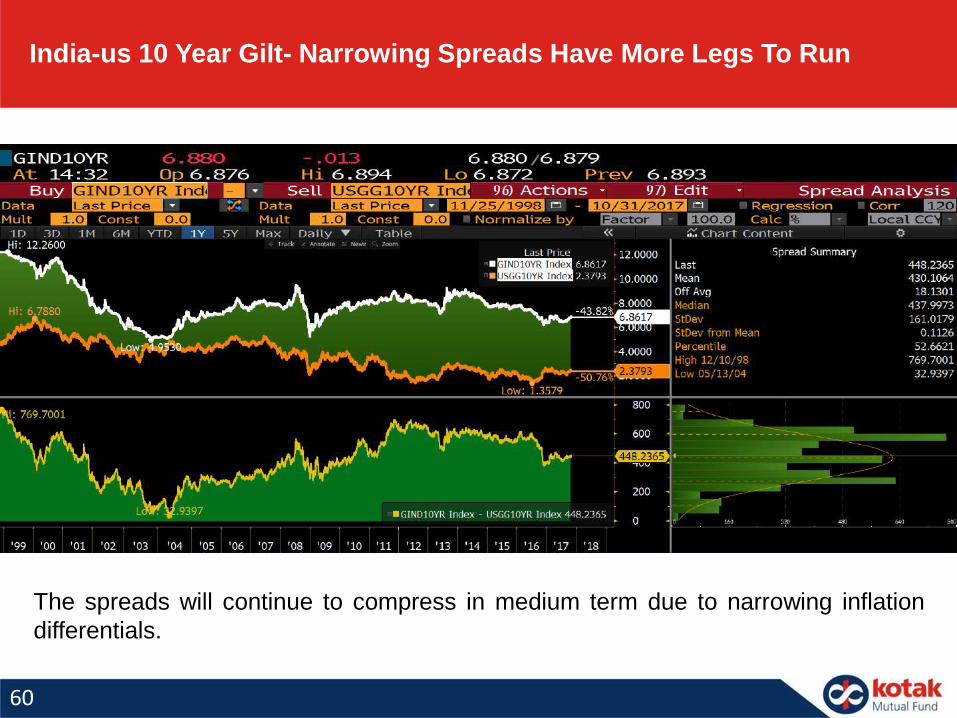
India-us 10 Year Gilt- Narrowing Spreads Have More Legs To Run
60
The spreads will continue to compress in medium term due to narrowing inflation
differentials.
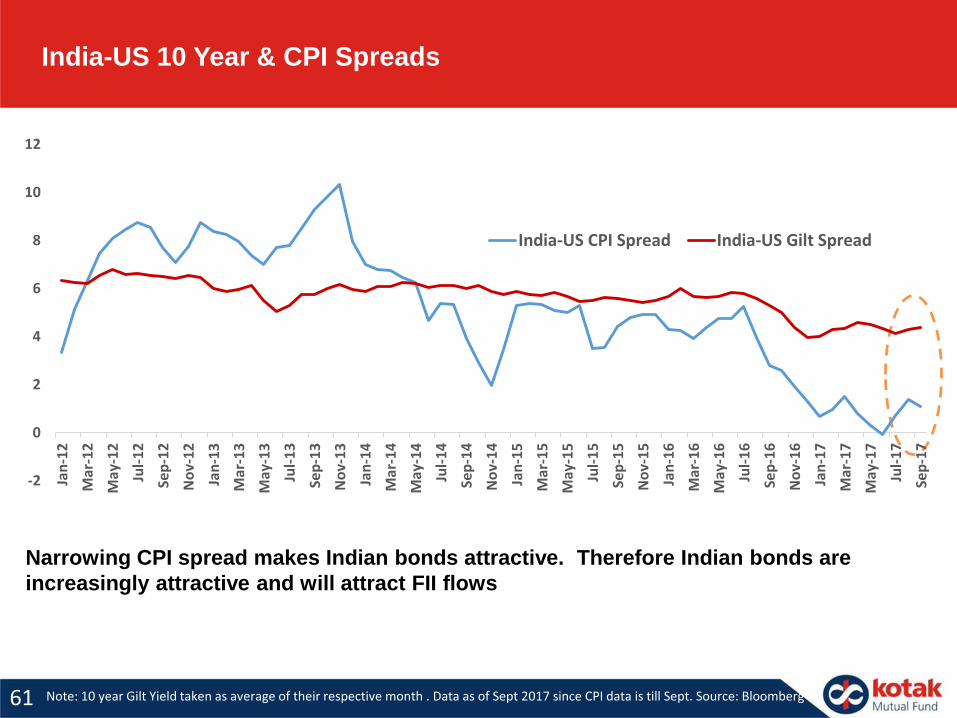
India-US 10 Year & CPI Spreads
Narrowing CPI spread makes Indian bonds attractive. Therefore Indian bonds are
increasingly attractive and will attract FII flows
61 Note: 10 year Gilt Yield taken as average of their respective month . Data as of Sept 2017 since CPI data is till Sept. Source: Bloomberg
-2
0
2
4
6
8
10
12
Jan
-12
Mar
-12
May
-12
Jul-
12
Sep
-12
No
v-1
2
Jan
-13
Mar
-13
May
-13
Jul-
13
Sep
-13
No
v-1
3
Jan
-14
Mar
-14
May
-14
Jul-
14
Sep
-14
No
v-1
4
Jan
-15
Mar
-15
May
-15
Jul-
15
Sep
-15
No
v-1
5
Jan
-16
Mar
-16
May
-16
Jul-
16
Sep
-16
No
v-1
6
Jan
-17
Mar
-17
May
-17
Jul-
17
Sep
-17
India-US CPI Spread India-US Gilt Spread
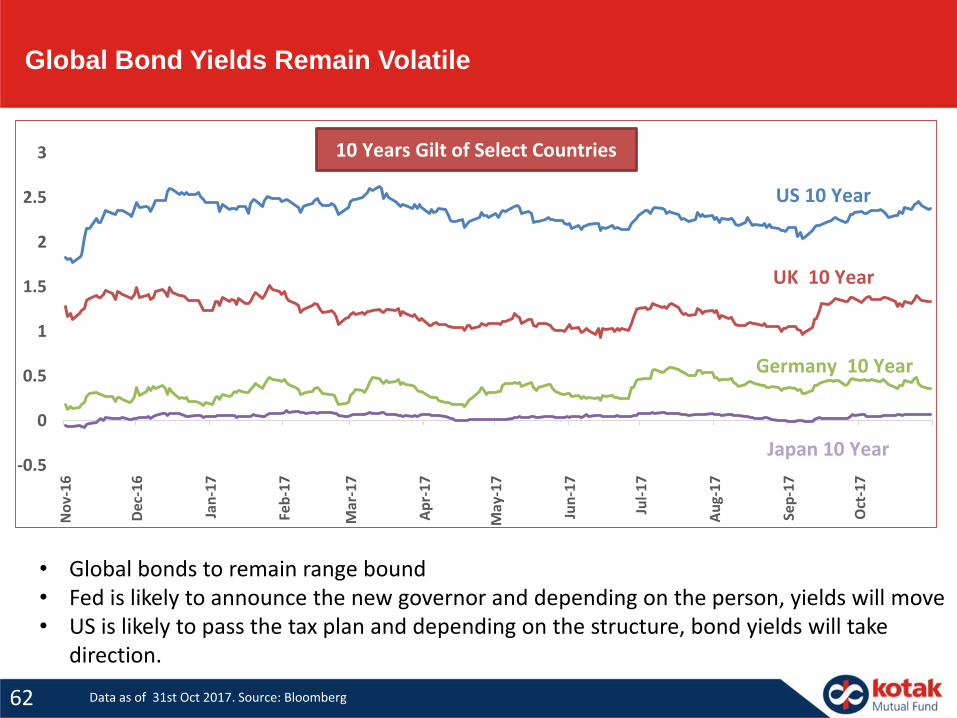
Global Bond Yields Remain Volatile
62
-0.5
0
0.5
1
1.5
2
2.5
3
No
v-1
6
Dec
-16
Jan
-17
Feb
-17
Mar
-17
Ap
r-1
7
May
-17
Jun
-17
Jul-
17
Au
g-1
7
Sep
-17
Oct
-17
10 Years Gilt of Select Countries
US 10 Year
UK 10 Year
Germany 10 Year
Japan 10 Year
Data as of 31st Oct 2017. Source: Bloomberg
• Global bonds to remain range bound • Fed is likely to announce the new governor and depending on the person, yields will move• US is likely to pass the tax plan and depending on the structure, bond yields will take
direction.
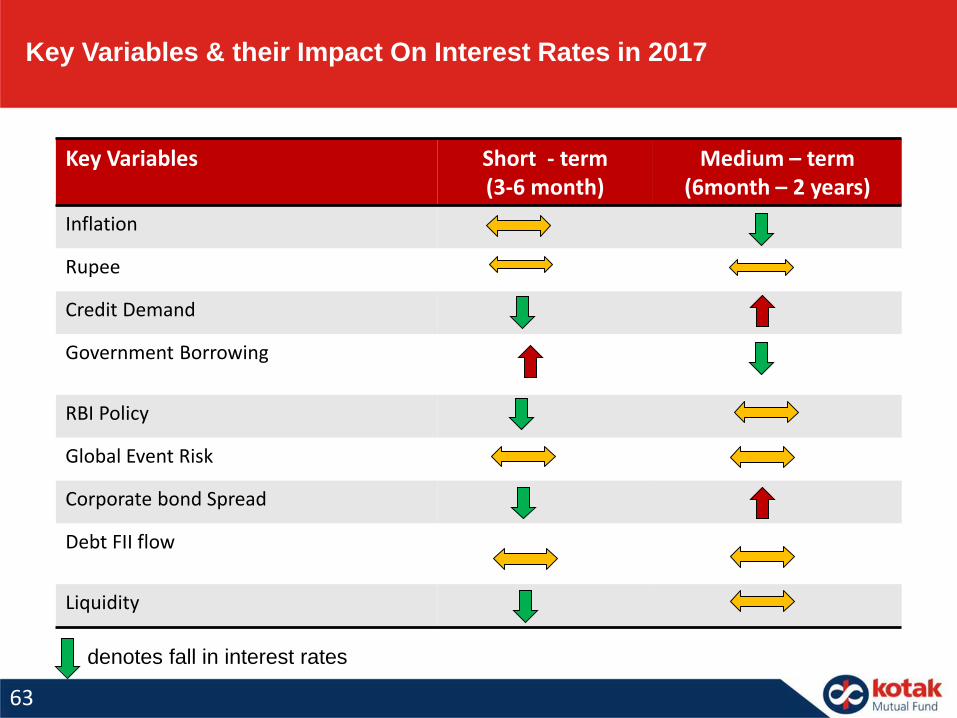
Key Variables & their Impact On Interest Rates in 2017
Key Variables Short - term (3-6 month)
Medium – term (6month – 2 years)
Inflation
Rupee
Credit Demand
Government Borrowing
RBI Policy
Global Event Risk
Corporate bond Spread
Debt FII flow
Liquidity
denotes fall in interest rates
63
Debt Outlook
• The RBI has made the future course of interest rates dependent on inflation trajectory and GDP growth
• The government is running fiscal, with no room for error. Therefore market will remain on the tenterhooks.
This will keep the bond yields range bound till the clarity emerges either way
• Last CPI data was lower than market expectation. If the trend continues and the November CPI print is
around 3% while Core is at 4.4%; then this will put pressure on the RBI to talk dovish, if not cut immediately
• We have Q2 GDP data release in the end of November. This is likely to be benign and may raise the
expectation of a cut
• The yield curve is likely to be steep. However the long end yields are at around 7.50% on annualized basis;
and therefore might see stability soon
• In the near term, we expect the 10 year gilt to trade in the 6.75%-6.90% band till any further trigger
• The corporate bond 18-36 month yields are expected to remain stable and the curve will remain steep.
64
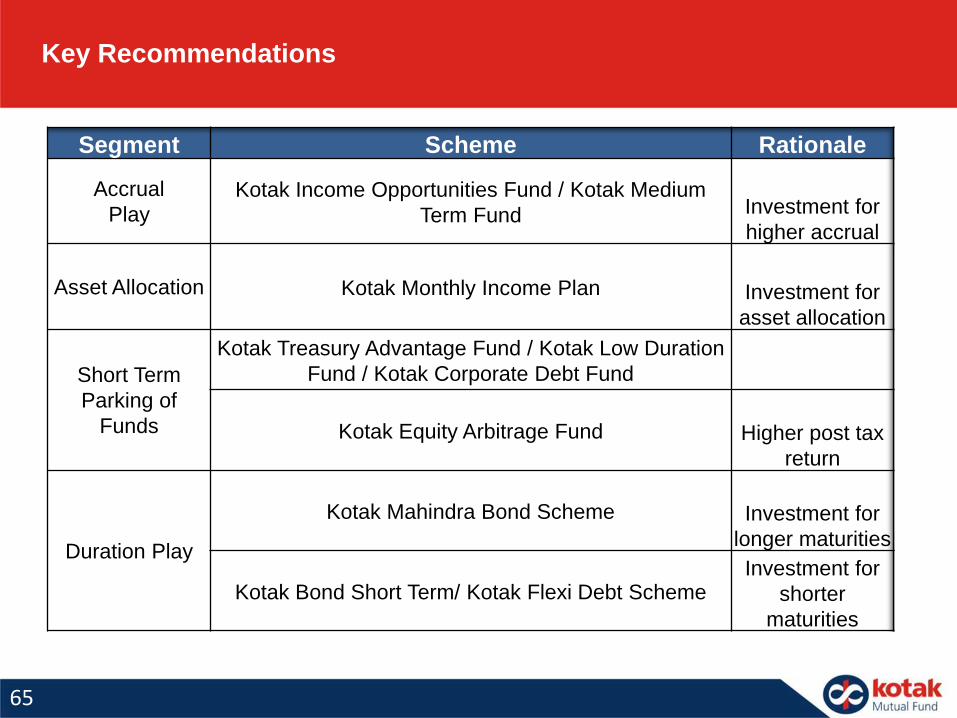
Key Recommendations
Segment Scheme Rationale
Accrual
PlayKotak Income Opportunities Fund / Kotak Medium
Term Fund Investment for
higher accrual
Asset Allocation Kotak Monthly Income Plan Investment for
asset allocation
Short Term
Parking of
Funds
Kotak Treasury Advantage Fund / Kotak Low Duration
Fund / Kotak Corporate Debt Fund
Kotak Equity Arbitrage Fund Higher post tax
return
Duration Play
Kotak Mahindra Bond Scheme Investment for
longer maturities
Kotak Bond Short Term/ Kotak Flexi Debt SchemeInvestment for
shorter
maturities
65
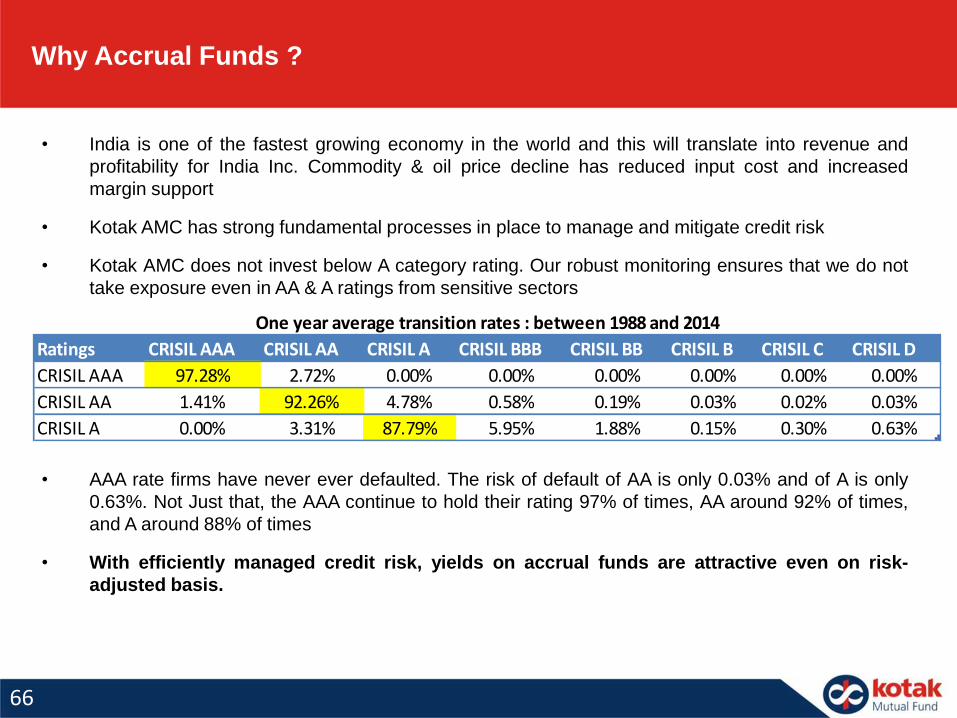
Why Accrual Funds ?
• India is one of the fastest growing economy in the world and this will translate into revenue and
profitability for India Inc. Commodity & oil price decline has reduced input cost and increased
margin support
• Kotak AMC has strong fundamental processes in place to manage and mitigate credit risk
• Kotak AMC does not invest below A category rating. Our robust monitoring ensures that we do not
take exposure even in AA & A ratings from sensitive sectors
• AAA rate firms have never ever defaulted. The risk of default of AA is only 0.03% and of A is only
0.63%. Not Just that, the AAA continue to hold their rating 97% of times, AA around 92% of times,
and A around 88% of times
• With efficiently managed credit risk, yields on accrual funds are attractive even on risk-
adjusted basis.
Ratings CRISIL AAA CRISIL AA CRISIL A CRISIL BBB CRISIL BB CRISIL B CRISIL C CRISIL D
CRISIL AAA 97.28% 2.72% 0.00% 0.00% 0.00% 0.00% 0.00% 0.00%
CRISIL AA 1.41% 92.26% 4.78% 0.58% 0.19% 0.03% 0.02% 0.03%
CRISIL A 0.00% 3.31% 87.79% 5.95% 1.88% 0.15% 0.30% 0.63%
One year average transition rates : between 1988 and 2014
66
Story in Accruals
• The Fund Manager focuses on generating income from credit allocation rather than duration calls.
• Accruals funds generate performance by purchasing high yielding assets with relatively short
duration.
• This provides investor with a relatively high yield with low NAV volatility
• Investors with 18-36 months horizon can look at investing in Accrual Funds
• Accrual funds like Kotak Income Opportunities / Kotak Medium term provide retail investors the
potential to obtain high yields in the present condition.
67

Need to Watch Out for Opportunities
in Hybrid Space
68
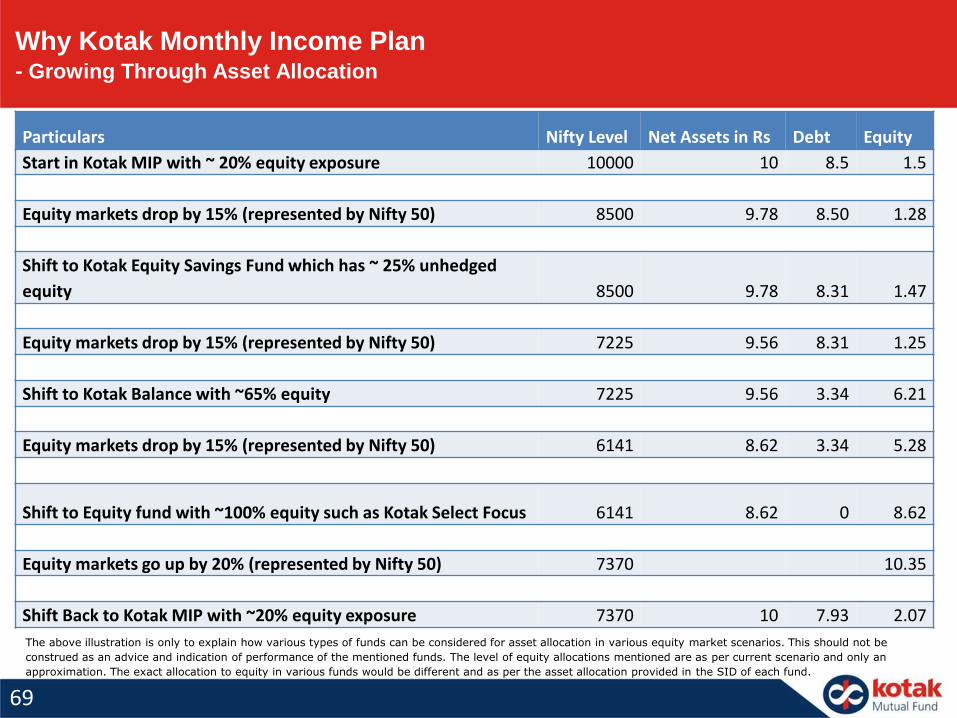
Particulars Nifty Level Net Assets in Rs Debt Equity
Start in Kotak MIP with ~ 20% equity exposure 10000 10 8.5 1.5
Equity markets drop by 15% (represented by Nifty 50) 8500 9.78 8.50 1.28
Shift to Kotak Equity Savings Fund which has ~ 25% unhedged
equity 8500 9.78 8.31 1.47
Equity markets drop by 15% (represented by Nifty 50) 7225 9.56 8.31 1.25
Shift to Kotak Balance with ~65% equity 7225 9.56 3.34 6.21
Equity markets drop by 15% (represented by Nifty 50) 6141 8.62 3.34 5.28
Shift to Equity fund with ~100% equity such as Kotak Select Focus 6141 8.62 0 8.62
Equity markets go up by 20% (represented by Nifty 50) 7370 10.35
Shift Back to Kotak MIP with ~20% equity exposure 7370 10 7.93 2.07
Why Kotak Monthly Income Plan- Growing Through Asset Allocation
The above illustration is only to explain how various types of funds can be considered for asset allocation in various equity market scenarios. This should not be
construed as an advice and indication of performance of the mentioned funds. The level of equity allocations mentioned are as per current scenario and only an
approximation. The exact allocation to equity in various funds would be different and as per the asset allocation provided in the SID of each fund.
69
Tactical Asset Allocation Through MIP
Kotak Monthly Income Plan can be used as a de-risking strategy
o The scheme invests upto 20% in equity & equity related instruments & rest in
debt instruments
o Thus, an investor could consider Kotak MIP as a starting point for a moderate
exposure to equity and use it as de-risking strategy by shifting into funds with
higher equity allocations as valuations become attractive
o The same has been explained below with an illustration
Whom is the Fund Ideal for?
Investors seeking regular income over short term
Investors seeking income through fixed income securities and marginal gains
from equities
Investors with 1-3 year investment horizon
Those who are unwilling to assume the full equity risk
Those who have low appetite for credit risk
70
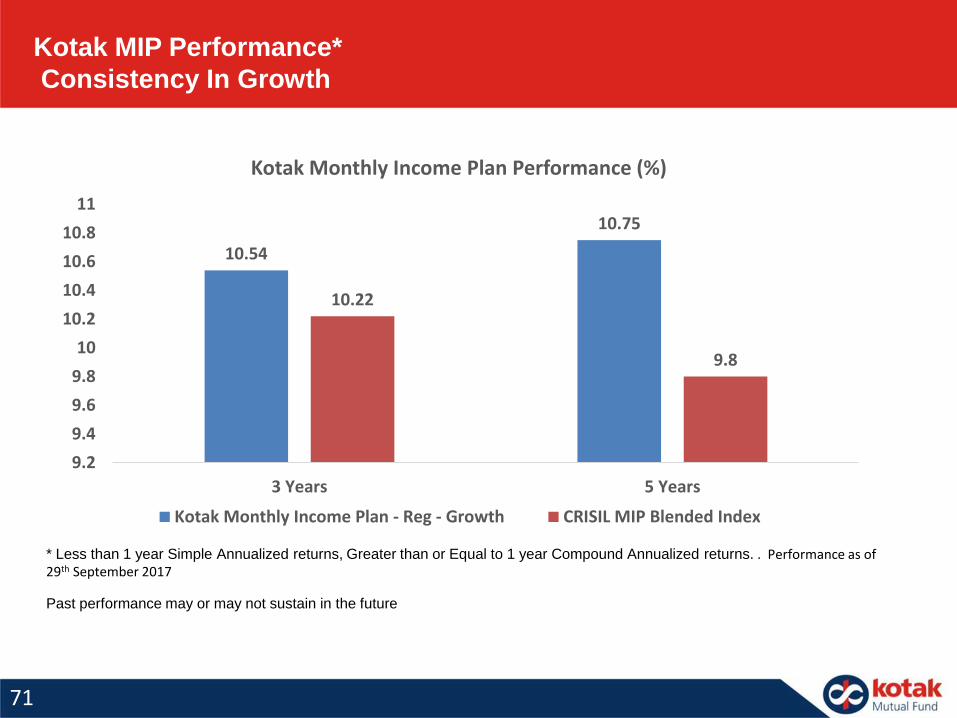
Kotak MIP Performance*
Consistency In Growth
71
Past performance may or may not sustain in the future
* Less than 1 year Simple Annualized returns, Greater than or Equal to 1 year Compound Annualized returns. . Performance as of 29th September 2017
10.54
10.75
10.22
9.8
9.2
9.4
9.6
9.8
10
10.2
10.4
10.6
10.8
11
3 Years 5 Years
Kotak Monthly Income Plan Performance (%)
Kotak Monthly Income Plan - Reg - Growth CRISIL MIP Blended Index
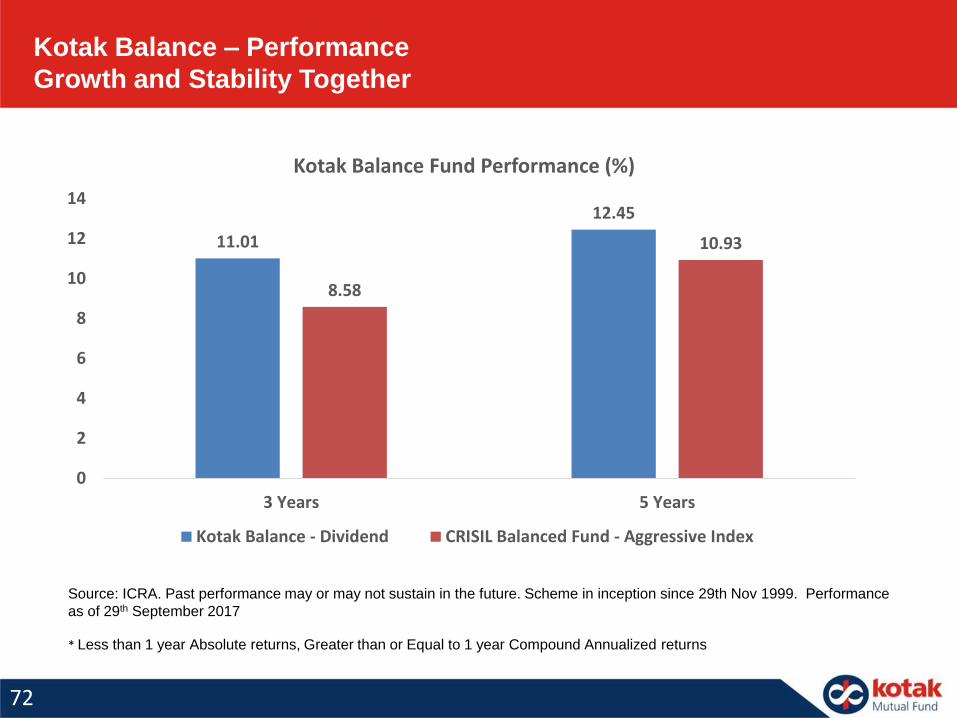
Kotak Balance – Performance
Growth and Stability Together
72
Source: ICRA. Past performance may or may not sustain in the future. Scheme in inception since 29th Nov 1999. Performance
as of 29th September 2017
* Less than 1 year Absolute returns, Greater than or Equal to 1 year Compound Annualized returns
11.01
12.45
8.58
10.93
0
2
4
6
8
10
12
14
3 Years 5 Years
Kotak Balance Fund Performance (%)
Kotak Balance - Dividend CRISIL Balanced Fund - Aggressive Index
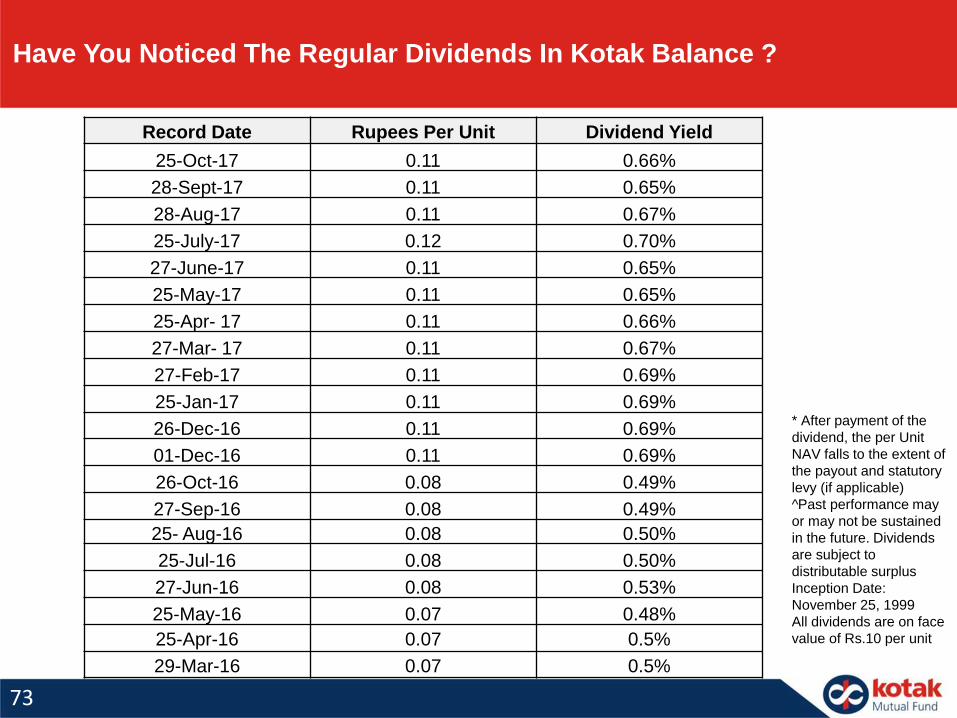
Have You Noticed The Regular Dividends In Kotak Balance ?
* After payment of the
dividend, the per Unit
NAV falls to the extent of
the payout and statutory
levy (if applicable)
^Past performance may
or may not be sustained
in the future. Dividends
are subject to
distributable surplus
Inception Date:
November 25, 1999
All dividends are on face
value of Rs.10 per unit
73
Record Date Rupees Per Unit Dividend Yield
25-Oct-17 0.11 0.66%
28-Sept-17 0.11 0.65%
28-Aug-17 0.11 0.67%
25-July-17 0.12 0.70%
27-June-17 0.11 0.65%
25-May-17 0.11 0.65%
25-Apr- 17 0.11 0.66%
27-Mar- 17 0.11 0.67%
27-Feb-17 0.11 0.69%
25-Jan-17 0.11 0.69%
26-Dec-16 0.11 0.69%
01-Dec-16 0.11 0.69%
26-Oct-16 0.08 0.49%
27-Sep-16 0.08 0.49%
25- Aug-16 0.08 0.50%
25-Jul-16 0.08 0.50%
27-Jun-16 0.08 0.53%
25-May-16 0.07 0.48%
25-Apr-16 0.07 0.5%
29-Mar-16 0.07 0.5%
74
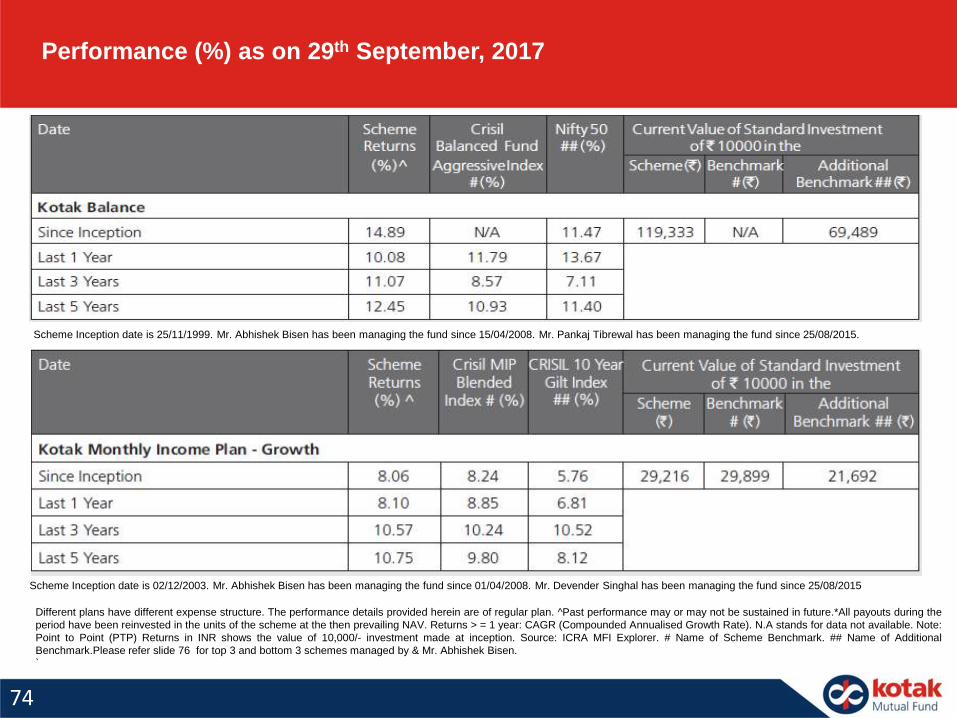
Performance (%) as on 29th September, 2017
Scheme Inception date is 25/11/1999. Mr. Abhishek Bisen has been managing the fund since 15/04/2008. Mr. Pankaj Tibrewal has been managing the fund since 25/08/2015.
Different plans have different expense structure. The performance details provided herein are of regular plan. ^Past performance may or may not be sustained in future.*All payouts during the
period have been reinvested in the units of the scheme at the then prevailing NAV. Returns > = 1 year: CAGR (Compounded Annualised Growth Rate). N.A stands for data not available. Note:
Point to Point (PTP) Returns in INR shows the value of 10,000/- investment made at inception. Source: ICRA MFI Explorer. # Name of Scheme Benchmark. ## Name of Additional
Benchmark.Please refer slide 76 for top 3 and bottom 3 schemes managed by & Mr. Abhishek Bisen.`
Scheme Inception date is 02/12/2003. Mr. Abhishek Bisen has been managing the fund since 01/04/2008. Mr. Devender Singhal has been managing the fund since 25/08/2015
75
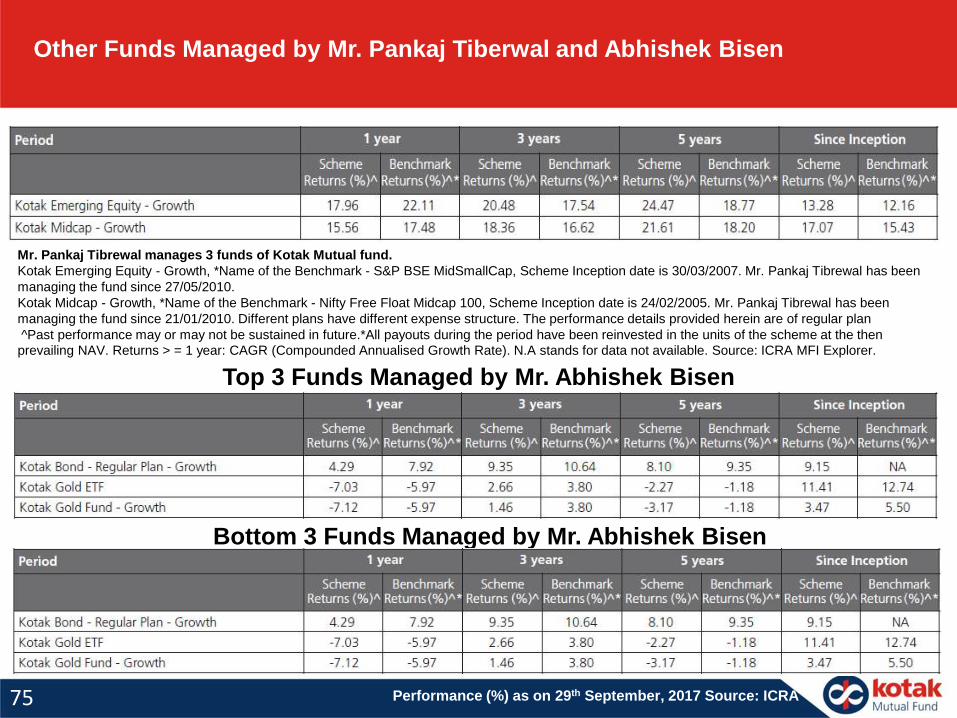
Other Funds Managed by Mr. Pankaj Tiberwal and Abhishek Bisen
Mr. Pankaj Tibrewal manages 3 funds of Kotak Mutual fund.
Kotak Emerging Equity - Growth, *Name of the Benchmark - S&P BSE MidSmallCap, Scheme Inception date is 30/03/2007. Mr. Pankaj Tibrewal has been
managing the fund since 27/05/2010.
Kotak Midcap - Growth, *Name of the Benchmark - Nifty Free Float Midcap 100, Scheme Inception date is 24/02/2005. Mr. Pankaj Tibrewal has been
managing the fund since 21/01/2010. Different plans have different expense structure. The performance details provided herein are of regular plan
^Past performance may or may not be sustained in future.*All payouts during the period have been reinvested in the units of the scheme at the then
prevailing NAV. Returns > = 1 year: CAGR (Compounded Annualised Growth Rate). N.A stands for data not available. Source: ICRA MFI Explorer.
Top 3 Funds Managed by Mr. Abhishek Bisen
Bottom 3 Funds Managed by Mr. Abhishek Bisen
Performance (%) as on 29th September, 2017 Source: ICRA

Why Kotak Mutual Fund Is Different From Others
76
We are Managing Your Trust First and Money second
We are your Partner
Disciplined Process
Risk adjusted Return
Believer in Warren Buffets Philosophy
Funds are like Kids. Don’t have more than what we
can manage
Readily accessible for Knowledge and Service
The information contained in this (document) is extracted from different public sources. Allreasonable care has been taken to ensure that the information contained herein is notmisleading or untrue at the time of publication. This is for the information of the person towhom it is provided without any liability whatsoever on the part of Kotak Mahindra AssetManagement Co Ltd or any associated companies or any employee thereof.We are notsoliciting any action based on this material and is for general information only. Mutual Fundinvestments are subject to market risks, read all scheme related documents carefully.
Disclaimers & Risk Factors
About the scheme:
77
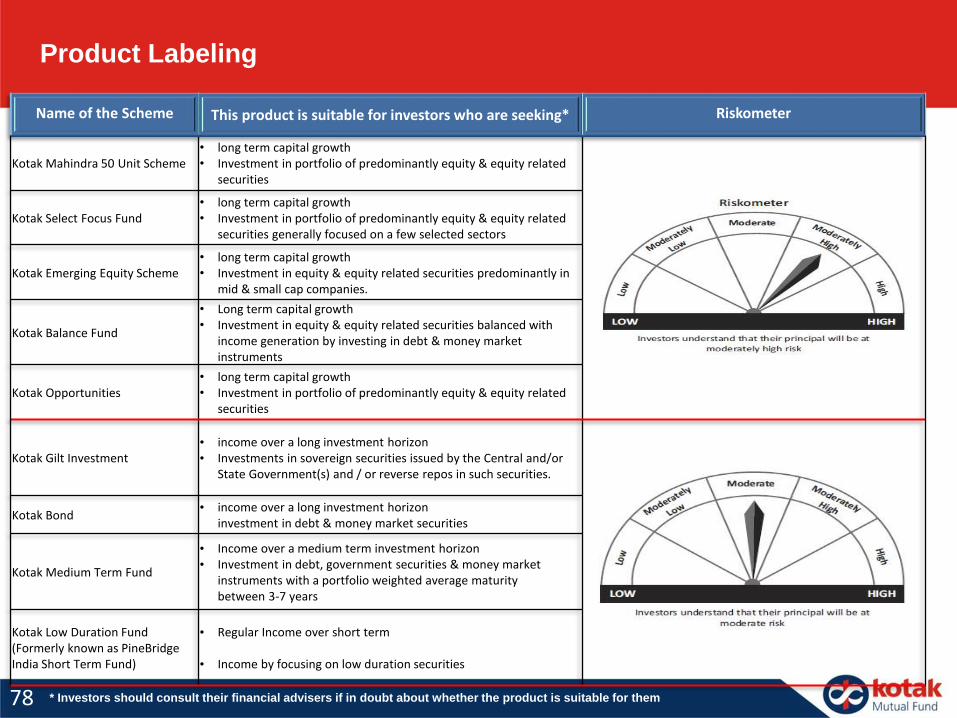
Name of the Scheme This product is suitable for investors who are seeking* Riskometer
Kotak Mahindra 50 Unit Scheme• long term capital growth• Investment in portfolio of predominantly equity & equity related
securities
Kotak Select Focus Fund • long term capital growth• Investment in portfolio of predominantly equity & equity related
securities generally focused on a few selected sectors
Kotak Emerging Equity Scheme• long term capital growth• Investment in equity & equity related securities predominantly in
mid & small cap companies.
Kotak Balance Fund
• Long term capital growth• Investment in equity & equity related securities balanced with
income generation by investing in debt & money market instruments
Kotak Opportunities• long term capital growth• Investment in portfolio of predominantly equity & equity related
securities
Kotak Gilt Investment• income over a long investment horizon• Investments in sovereign securities issued by the Central and/or
State Government(s) and / or reverse repos in such securities.
Kotak Bond• income over a long investment horizon
investment in debt & money market securities
Kotak Medium Term Fund
• Income over a medium term investment horizon• Investment in debt, government securities & money market
instruments with a portfolio weighted average maturitybetween 3-7 years
Kotak Low Duration Fund (Formerly known as PineBridgeIndia Short Term Fund)
• Regular Income over short term
• Income by focusing on low duration securities
* Investors should consult their financial advisers if in doubt about whether the product is suitable for them
Product Labeling
78
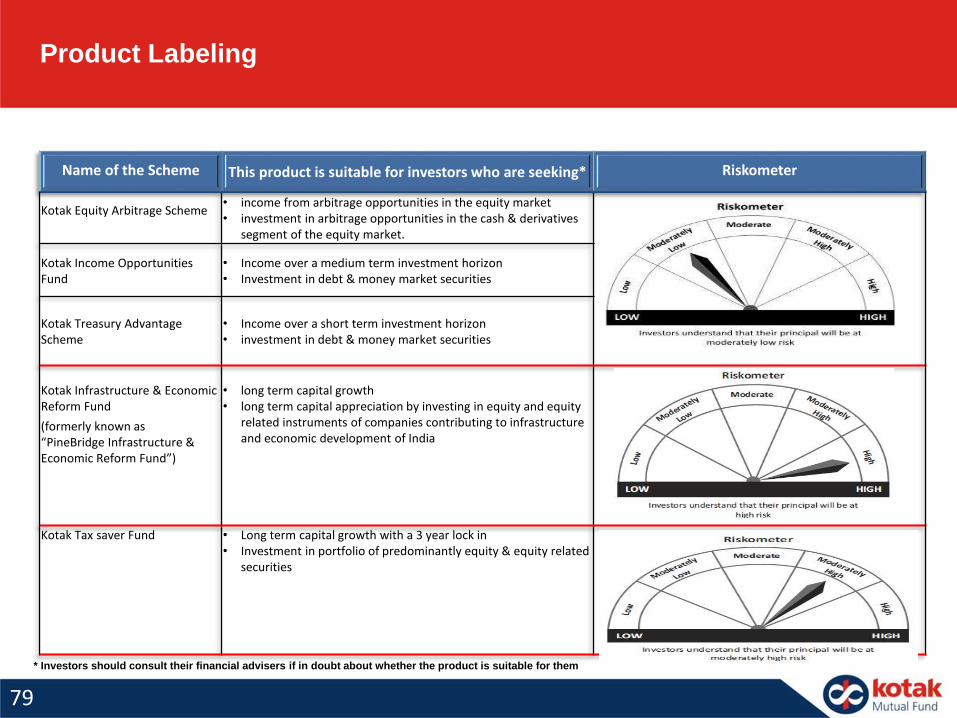
Name of the Scheme This product is suitable for investors who are seeking* Riskometer
Kotak Equity Arbitrage Scheme• income from arbitrage opportunities in the equity market• investment in arbitrage opportunities in the cash & derivatives
segment of the equity market.
Kotak Income Opportunities Fund
• Income over a medium term investment horizon• Investment in debt & money market securities
Kotak Treasury Advantage Scheme
• Income over a short term investment horizon• investment in debt & money market securities
Kotak Infrastructure & Economic Reform Fund
(formerly known as “PineBridge Infrastructure & Economic Reform Fund”)
• long term capital growth• long term capital appreciation by investing in equity and equity
related instruments of companies contributing to infrastructure and economic development of India
Kotak Tax saver Fund • Long term capital growth with a 3 year lock in• Investment in portfolio of predominantly equity & equity related
securities
* Investors should consult their financial advisers if in doubt about whether the product is suitable for them
Product Labeling
79
80
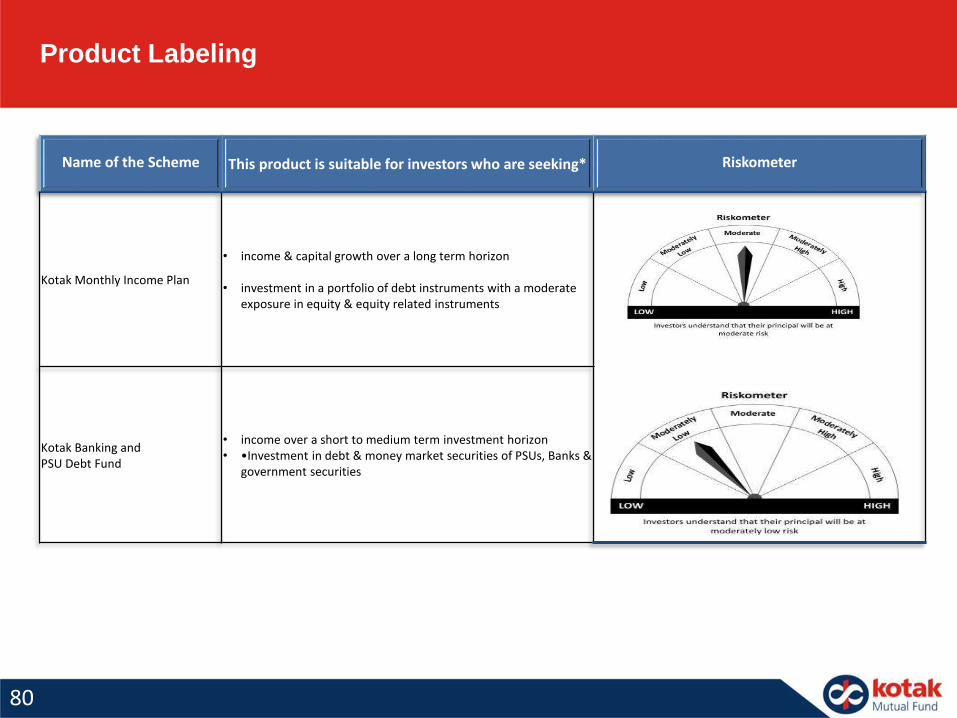
Name of the Scheme This product is suitable for investors who are seeking* Riskometer
Kotak Monthly Income Plan
• income & capital growth over a long term horizon
• investment in a portfolio of debt instruments with a moderate exposure in equity & equity related instruments
Kotak Banking andPSU Debt Fund
• income over a short to medium term investment horizon• •Investment in debt & money market securities of PSUs, Banks &
government securities
Product Labeling