Embed Size (px)
Citation preview
Market Outlook
Sao Paulo, Brazil
October, 2005
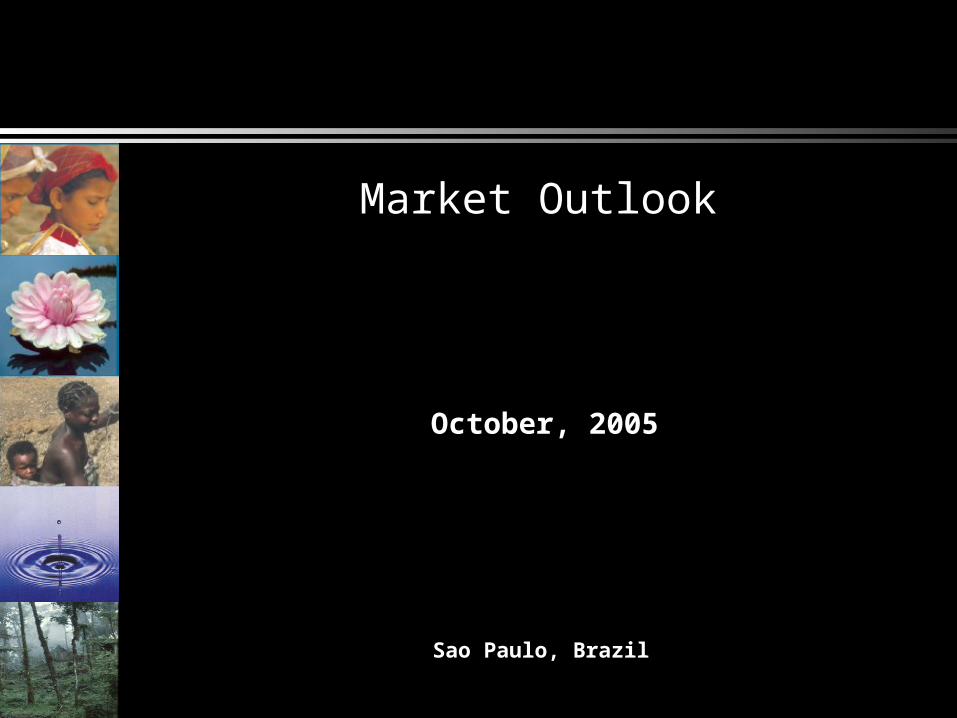
OECD Compliance Gap
Ratifying OECD cumulative target reductions will be 5-5.5 billion tons of carbon dioxide below 1990 levels by 2012 based on their Kyoto obligations
If half emissions reductions are achieved domestically the “compliance gap” to be met through trade with developing countries and transition economies through 2012 would be 2.5 – 3.0 billion tons
This compliance gap is over 10 times the current carbon purchase contract volumes reported in the 2005 market intelligence report
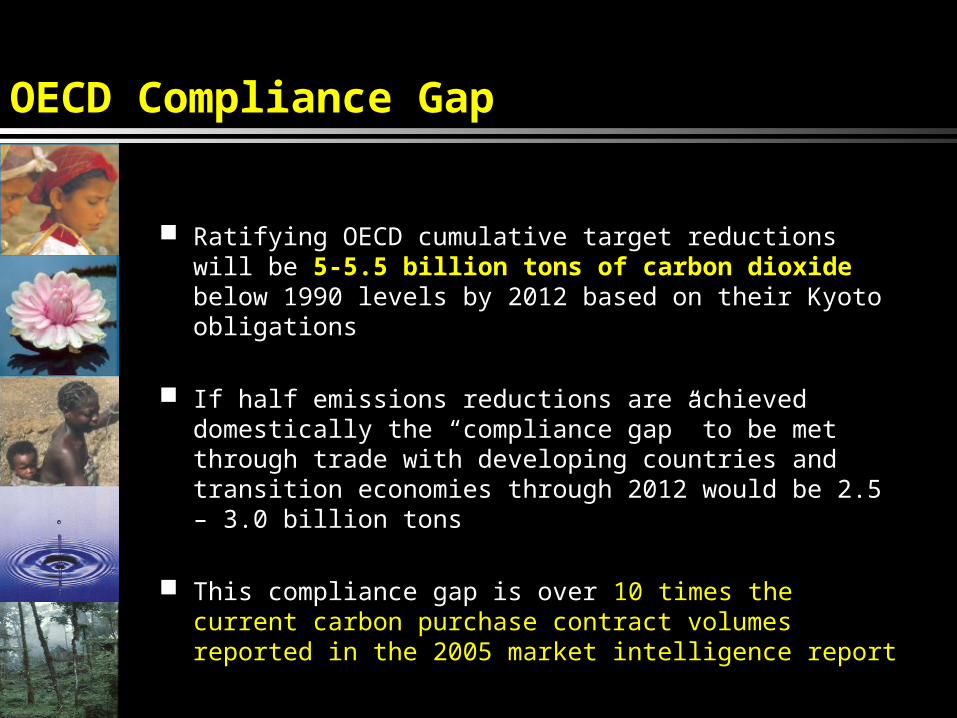
Current Kyoto gap of Annex II: 620 MtCO2e
-8%
-6% -6%
-2%-3%
+20%
+12%
+9%
EU15
(228 MtCO2e)
Canada
(159 MtCO2e)
Japan
(214 MtCO2e)
Other Western Europe+ New Zealand
(19 MtCO2e)
Pe
rce
nt
of
19
90
em
iss
ion
s l
ev
el
Kyoto Target
Current (2002) Emissions
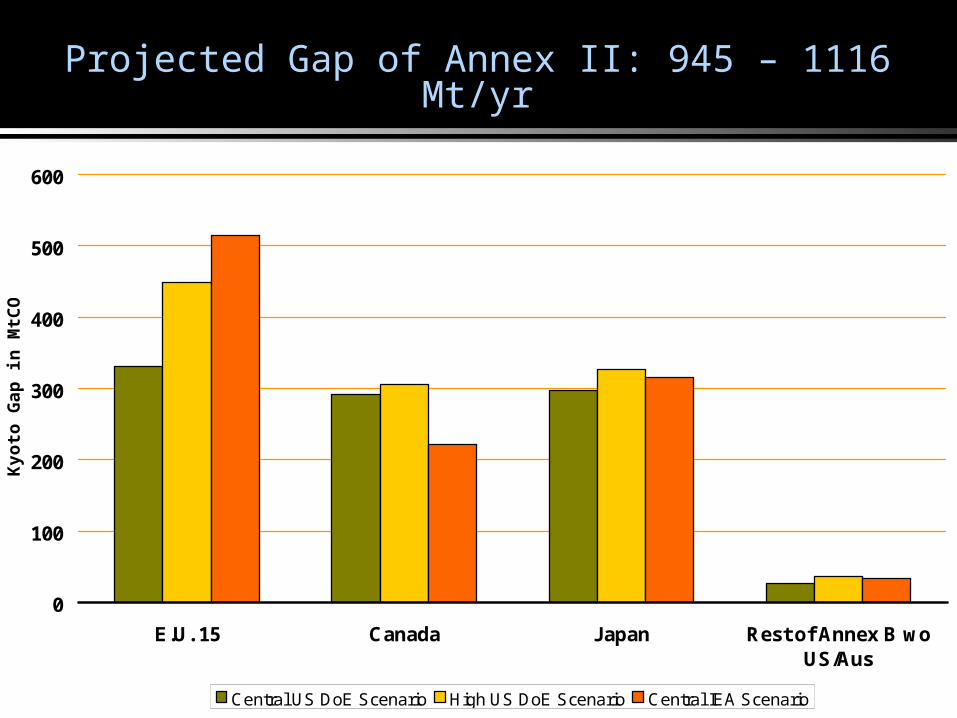
Projected Gap of Annex II: 945 – 1116 Mt/yr
0
100
200
300
400
500
600
E.U. 15 Canada Japan Rest of Annex B woUS/Aus
Ky
oto
Ga
p in
MtC
O2e
Central US DoE Scenario High US DoE Scenario Central IEA Scenario
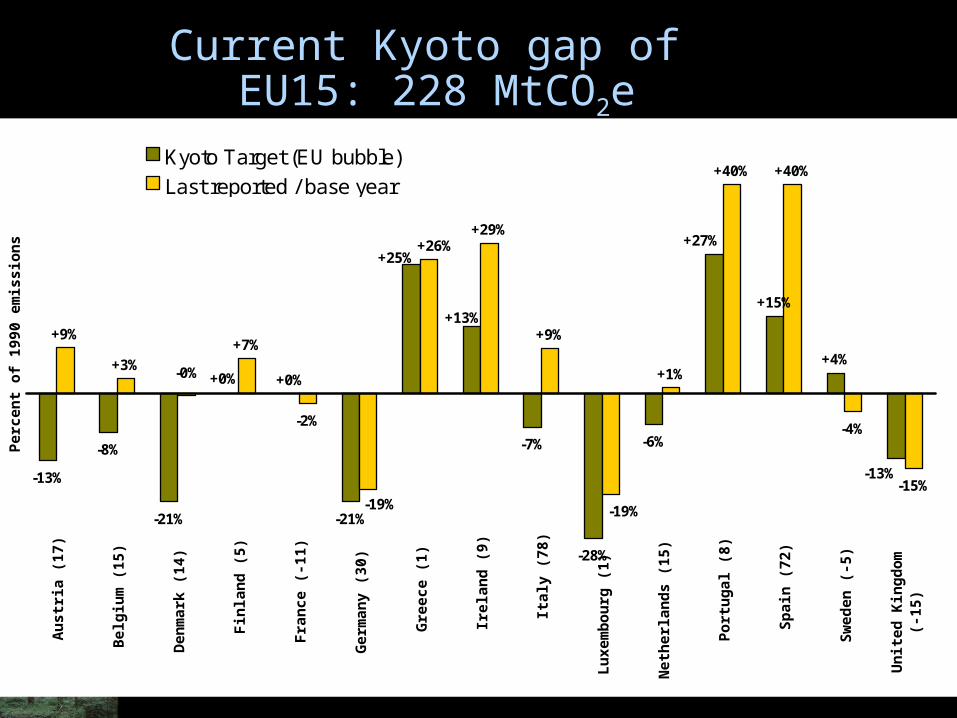
Current Kyoto gap of EU15: 228 MtCO2e
-13%
-8%
-21%
+0%
-21%
-7%
-28%
-6%
+15%
+4%
+9%
+3%+7%
-2%
+29%
+9%
+1%
+40% +40%
-4%
-15%-13%
+27%
+13%
+25%
+0%
-19%
-0%
+26%
-19%
Au
stri
a (1
7)
Bel
giu
m (
15)
Den
mar
k (1
4)
Fin
lan
d (
5)
Fra
nce
(-1
1)
Ger
man
y (3
0)
Gre
ece
(1)
Irel
and
(9)
Ital
y (7
8)
Lu
xem
bo
urg
(1)
Net
her
lan
ds
(15)
Po
rtu
gal
(8)
Sp
ain
(72
)
Sw
eden
(-5
)
Un
ited
Kin
gd
om
(-15
)
Per
cen
t o
f 19
90 e
mis
sio
ns
leve
l
Kyoto Target (EU bubble)
Last reported / base year
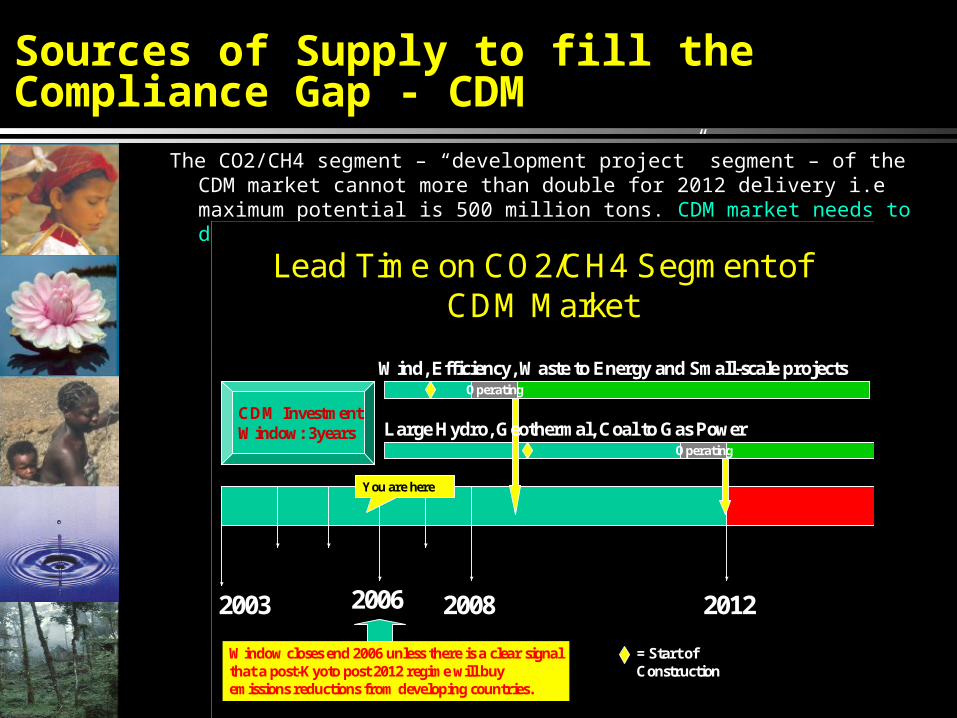
Sources of Supply to fill the Compliance Gap - CDM
The CO2/CH4 segment – “development project” segment – of the CDM market cannot more than double for 2012 delivery i.e maximum potential is 500 million tons. CDM market needs to deliver at least 1.5 billion tons
Lead Time on CO2/CH4 Segment of CDM Market
2006 20082003 2012
Operating
Wind, Efficiency, Waste to Energy and Small-scale projects
Large Hydro, Geothermal, Coal to Gas PowerCDM Investment Window: 3years
Window closes end 2006 unless there is a clear signal that a post-Kyoto post 2012 regime will buy emissions reductions from developing countries.
Operating
= Start of Construction
You are here
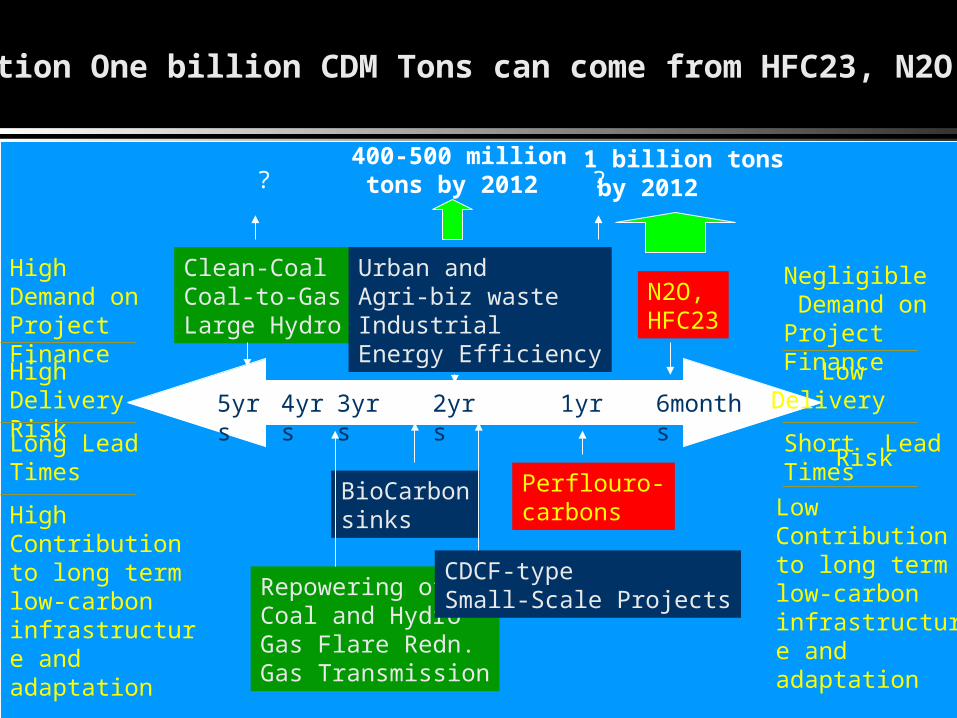
High Demand on Project Finance
Negligible Demand on Project Finance
High Delivery Risk
Low Delivery Risk
Long Lead Times
Short Lead Times
High Contribution to long term low-carbon infrastructure and adaptation
Low Contribution to long term low-carbon infrastructure and adaptation
Clean-CoalCoal-to-GasLarge Hydro
Repowering ofCoal and HydroGas Flare Redn.Gas Transmission
BioCarbonsinks
Urban and Agri-biz wasteIndustrialEnergy Efficiency
CDCF-typeSmall-Scale Projects
Perflouro-carbons
N2O, HFC23
5yrs 6months2yrs 1yr4yrs 3yrs
400-500 million tons by 2012
1 billion tons by 2012??
Addition One billion CDM Tons can come from HFC23, N2O, PF6
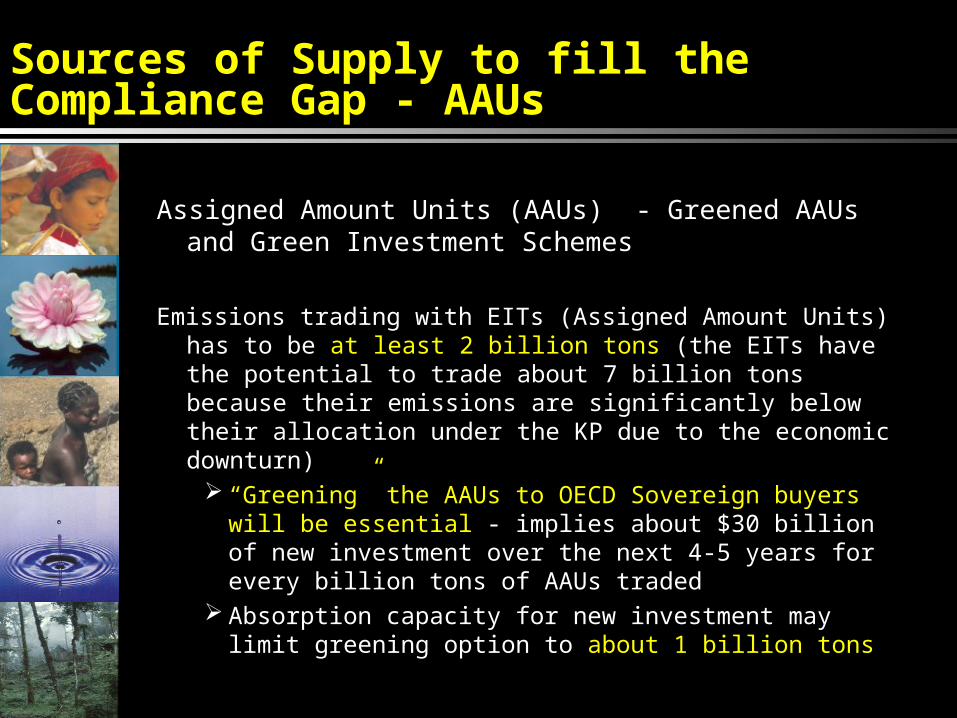
Sources of Supply to fill the Compliance Gap - AAUs
Assigned Amount Units (AAUs) - Greened AAUs and Green Investment Schemes
Emissions trading with EITs (Assigned Amount Units) has to be at least 2 billion tons (the EITs have the potential to trade about 7 billion tons because their emissions are significantly below their allocation under the KP due to the economic downturn)
“Greening” the AAUs to OECD Sovereign buyers will be essential - implies about $30 billion of new investment over the next 4-5 years for every billion tons of AAUs traded
Absorption capacity for new investment may limit greening option to about 1 billion tons
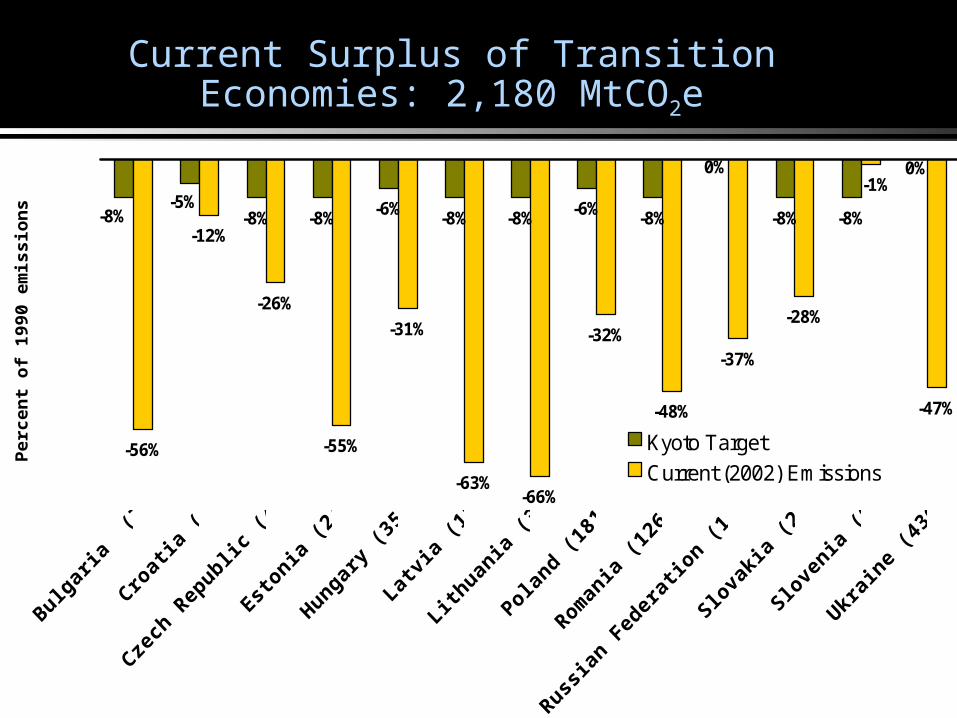
Current Surplus of Transition Economies: 2,180 MtCO2e
-8% -8% -6% -8% -8% -6% -8% -8% -8%
-56%
-12%
-26%
-55%
-31%
-63%-66%
-32%
-48%
-37%
-28%
-47%
0%0%
-5%-8%
-1%
Per
cen
t o
f 19
90 e
mis
sio
ns
leve
l
Kyoto Target
Current (2002) Emissions
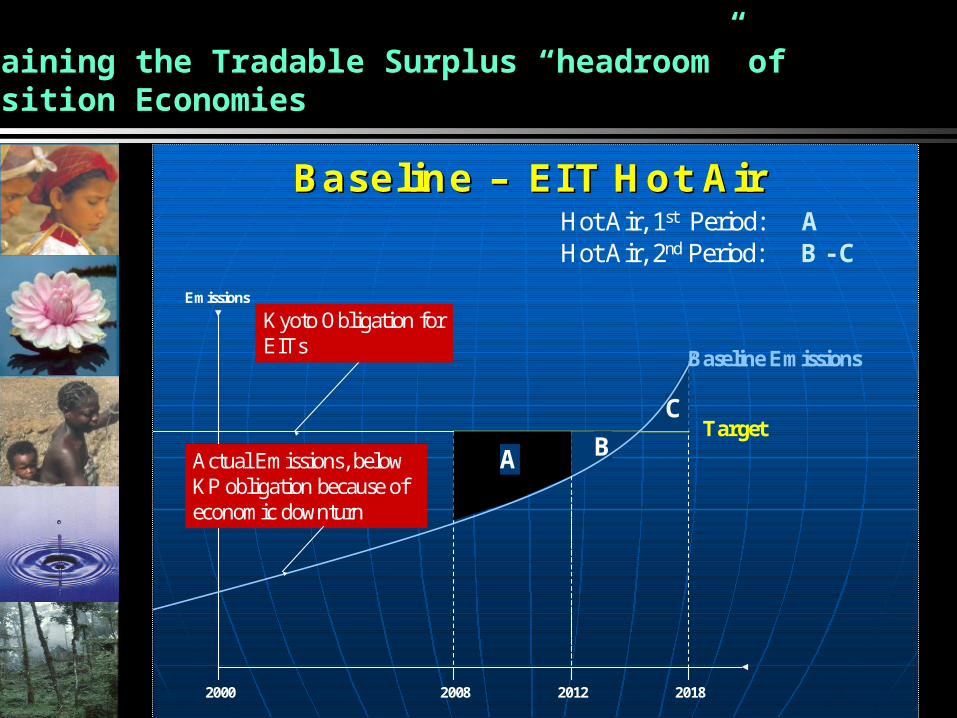
Baseline Baseline –– EIT Hot AirEIT Hot Air
2000 2008 2012 2018
Emissions
Target
Baseline Emissions
Hot Air, 1st Period: A
A
Hot Air, 2nd Period: B - C
B
C
Kyoto Obligation for EITs
Actual Emissions, below KP obligation because of economic downturn
Explaining the Tradable Surplus “headroom” of Transition Economies
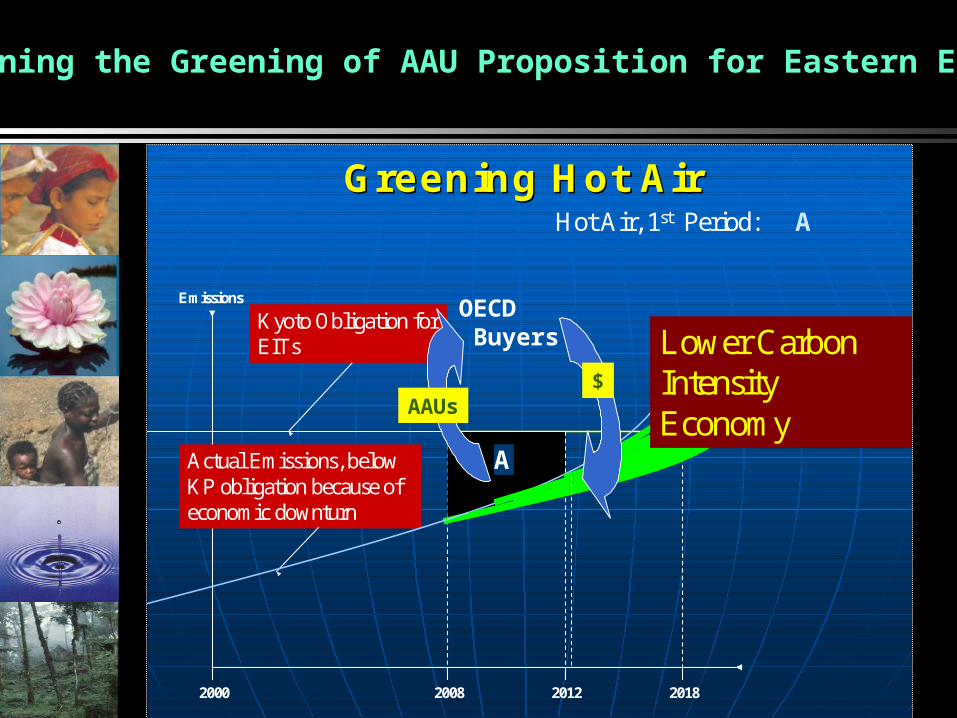
Greening Hot AirGreening Hot Air
2000 2008 2012 2018
Emissions
Target
Baseline Emissions
Hot Air, 1st Period: A
A
Kyoto Obligation for EITs
Actual Emissions, below KP obligation because of economic downturn
Lower Carbon Intensity Economy
Explaining the Greening of AAU Proposition for Eastern Europe
OECD Buyers
AAUs$
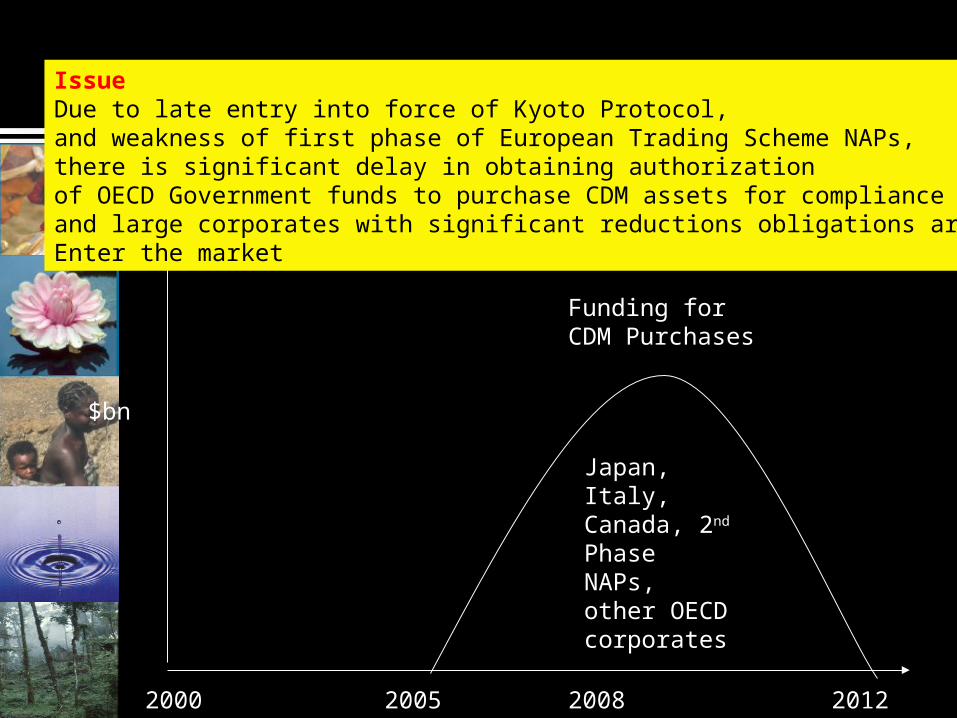
Funding for CDM Purchases
2000 2005 2008 2012
Japan, Italy, Canada, 2nd Phase NAPs, other OECD corporates
IssueDue to late entry into force of Kyoto Protocol, and weakness of first phase of European Trading Scheme NAPs,there is significant delay in obtaining authorization of OECD Government funds to purchase CDM assets for compliance and large corporates with significant reductions obligations are late to Enter the market
$bn
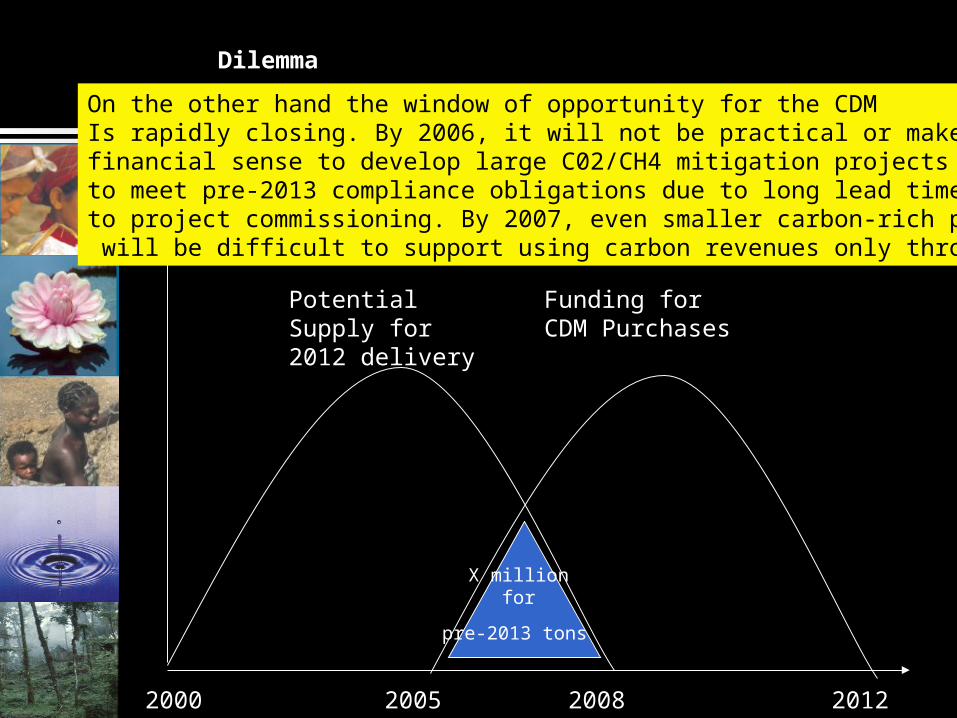
Potential Supply for 2012 delivery
Funding for CDM Purchases
2000 2005 2008 2012
On the other hand the window of opportunity for the CDM Is rapidly closing. By 2006, it will not be practical or make financial sense to develop large C02/CH4 mitigation projects to meet pre-2013 compliance obligations due to long lead times to project commissioning. By 2007, even smaller carbon-rich projects will be difficult to support using carbon revenues only through 2012
Dilemma
X million for
pre-2013 tons
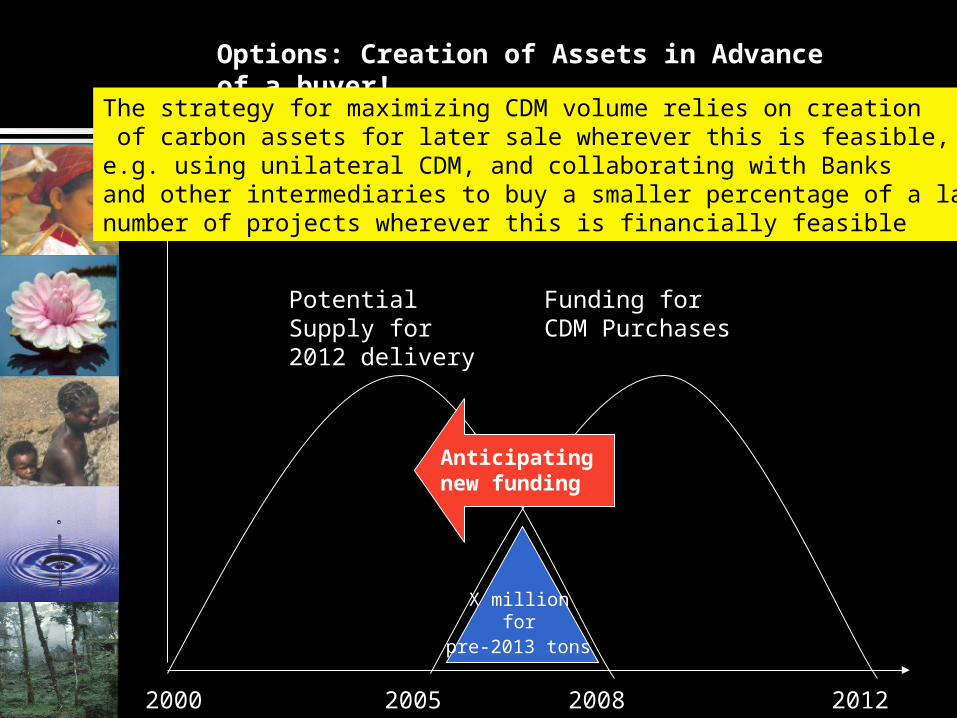
Potential Supply for 2012 delivery
Funding for CDM Purchases
2000 2005 2008 2012
Anticipating new funding
Options: Creation of Assets in Advance of a buyer!
The strategy for maximizing CDM volume relies on creation of carbon assets for later sale wherever this is feasible, e.g. using unilateral CDM, and collaborating with Banks and other intermediaries to buy a smaller percentage of a largernumber of projects wherever this is financially feasible
X million for
pre-2013 tons
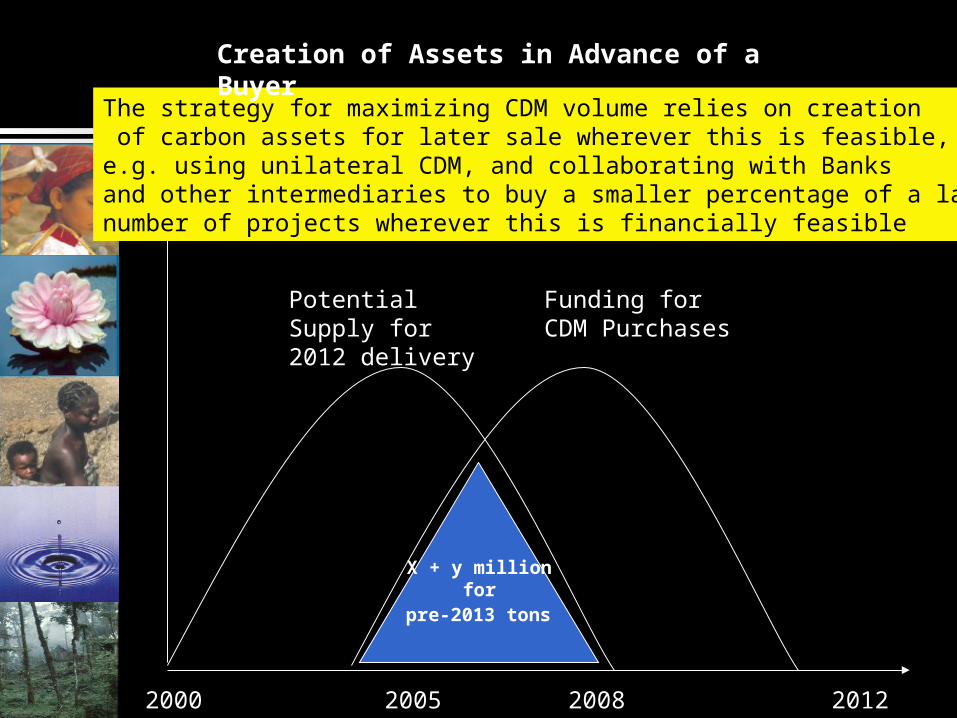
Potential Supply for 2012 delivery
Funding for CDM Purchases
2000 2005 2008 2012
The strategy for maximizing CDM volume relies on creation of carbon assets for later sale wherever this is feasible, e.g. using unilateral CDM, and collaborating with Banks and other intermediaries to buy a smaller percentage of a largernumber of projects wherever this is financially feasible
X + y million for
pre-2013 tons
Creation of Assets in Advance of a Buyer
A Cautionary Note
To avoid a collapse in the CO2/CH4 segment of the carbon market (and continued stagnation in investment in low carbon climate friendly energy and infrastructure) we need:• Immediately implemented CDM Reform embracing
capacity enhancement, process streamlining and “technology additionality” agreed in CoP/MoP
• A CDM Market Continuity Facility to buy post-2012 vintage CERs to guarantee 10-year contracts, combined with a
• OECD Commitment to grandfather CDM assets into the post-2012 era
“Technology Additionality” Proposal
48(c ) approach: “The average emissions of similar project activities undertaken in the previous five years, in similar social, economic, environmental and technological circumstances, and whose performance is among the top 20 per cent of their category.”
(so far no approved CDM methodology using 48c) Flexible interpretation of 48 (c) provides an opportunity for radical
reduction in CDM transaction costs and the needed regulatory certainty for developers and financiers
Parallel to pre-defined baselines for small-scale projects Parties could approve in December a positive list of “additional”
technologies up to an initial penetration rate.• e.g. up to an agreed market penetration rate, all renewables, all demand
side management efficiency activities, all landfill gas capture and composting et etc is additional…
CDM’s Contribution to Post-2012 Climate Management Regime
CDM’s track record demonstrates that project-by-project approaches are incompatible with future carbon market needs of large industrializing developing countries.
A future market-based mechanism for carbon trade should ensure:• Very low transactions costs• High transparency and simplicity in regulations defining a compliance grade
carbon asset• Low regulatory risk that carbon assets contracted will have compliance
value, allowing forward carbon contracts to be monetized and financiers to accept carbon revenues as a real contribution to project viability and bankabiity
These are pre-conditions to catalyze high volumes of transactions and investment resource flows and technology transfer
These conditions would allow carbon revenues to cover the incremental cost and incremental risk of much low carbon development
Project-based vs Sectoral Mechanisms in the post-2012 era
Both will be required• Sectoral approaches for larger energy using economies -
the only means of generating the resource and technology flows on the needed scale
• Project-based approaches - for smaller less industrialized countries, or for low volume sectors not amenable to sectoral approaches
Neither the sectoral nor project-based approaches of the future has yet been demonstrated!
This the opportunity for Technology Additionality and CDM Reform
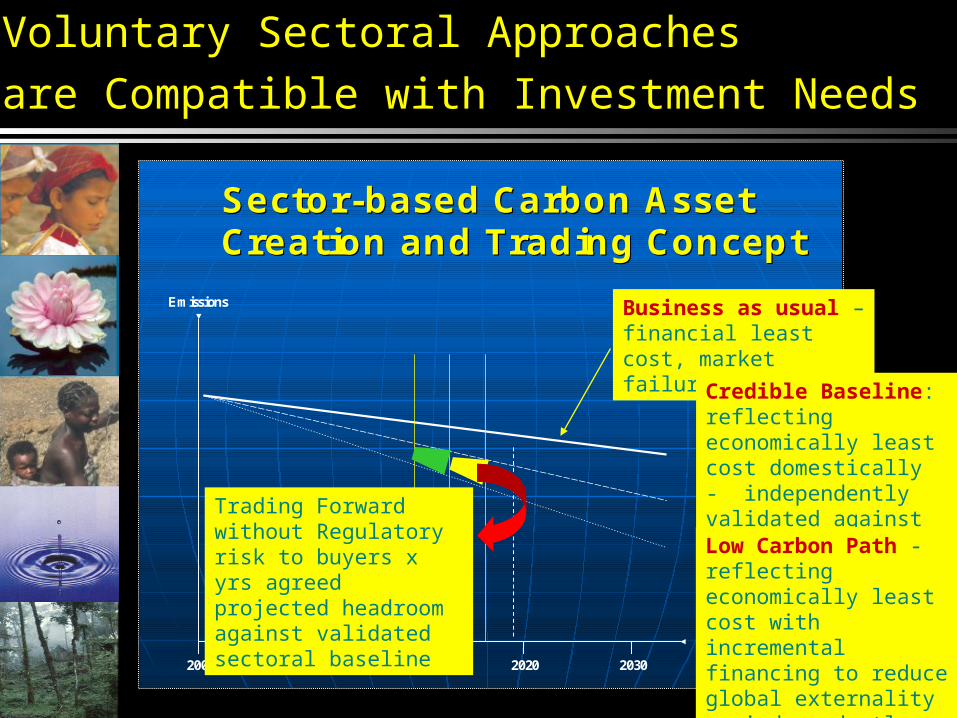
SectorSector--based Carbon Asset based Carbon Asset Creation and Trading ConceptCreation and Trading Concept
2000 2010 2020 2030
Emissions
Trading Forward without Regulatory risk to buyers x yrs agreed projected headroom against validated sectoral baseline
Voluntary Sectoral Approaches
are Compatible with Investment Needs
Business as usual – financial least cost, market failures
Credible Baseline: reflecting economically least cost domestically - independently validated against policies and measuresLow Carbon Path - reflecting economically least cost with incremental financing to reduce global externality - independently validated against policies and measures