Embed Size (px)
Citation preview
MARKET OUTLOOK & SUMMARY REPORT Summary: 27thJANUARY – 31stJANUARY 2014
Outlook: 3rdFEBRUARY– 8thFEBRUARY2014
MARKET SUMMARY FOR LAST WEEK (27th JANUARY – 31st JANUARY 2014)
Consumer spending ramps up, housing falters
Data released by the U.S Commerce Department real GDP grew at an annual rate of 3.2%, in the Q4
2013, down from 4.1% in Q3. However, this is still seen as solid result. The rise in GDP is supported
by the strong growth in consumer spending, as consumers opened up their wallets at the end of last
year, signalling that household’s confidence may be rising. Consumer spending contributed almost
2.3 points to fourth-quarter growth, up from almost 1.4 points in the third quarter. In contrast,
private investment decreased significantly in the fourth quarter by almost 2.0 points.
Russian economic growth slowed in 2013 to 1.3%
Russia’s economy grew 1.3% in 2013, marking the weakest pace of economic expansion since 2008.
This falls short of the economy ministry’s estimate of 1.4% and contrasts greatly with the 3.4%
growth recorded in 2012. The biggest drags on the economy were the utilities and constructions
sectors, which contracted 1.6% and 2.4% respectively. Russia’s economy has also been hit by weaker
demands for its exports and a decline in domestic investment activity. The economy is expected to
grow by around 2.5% this year. However, deputy economy minister Andrei Klepach said Friday that
growth may fall short of target, given the knock-on effect of lower retail sales growth.
Gold futures fall for the week, gain for the month
Gold futures edged lower on Friday, with prices ending lower on for the week following the Federal
Reserve’s decision on Wednesday to further taper its bond-buying program. Weakness in US stocks,
however, have helped boosted the overall price of gold for the month. Future prices fell 1.9% for the
week, but gained about 3.1% for the month.
10-year Treasury yield drops most since 2011
Market participants took a risk-averse tone, bidding up Treasuries and pushing down stocks. The
Federal Reserve’s decision to withdraw its bond-buying stimulus – which was cut by another $10
billion to $65 billion in monthly purchases – has mixed with surging fears of a slowdown in the
emerging markets to spook investors. The 10-year Treasury Notes benefitted from those fears, with
yields dropping 4.5 basis points to 2.649%, its lowest since early November. The benchmark yield
closed the week 7 basis points lower, and is 36 basis points lower for the month. The 30-year bond
slid 3 basis points to 3.603% and the 5-year note yield fell 4.5 basis points to 1.568%.
Mixed data on Friday confirmed a murky outlook for economic growth in the US. Personal spending
rose 0.4% in December, but personal incomes remain unchanged, and actually dropped 0.2% when
adjusting for taxes and inflation. Meanwhile, the employment cost index – which measures the cost
of labour – rose 0.5% in the fourth quarter, beating expectations of 0.4%. Treasurys also gained
Friday after reports that Euro-zone inflation plunged 0.7% in January, adding to fears that deflation
could slow down the pace of recovery in Europe.
January FOMC Meeting Statement: Fed Tapers $10 Billion To $65 Billion
As expected, the U.S. Federal Reserve on Wednesday voted unanimously to reduce asset purchases
on Feb. 1 by another $10 billion a month to $65 billion. The reduction was evenly split, with the
Treasury purchases cut by $5 billion to $35 billion and the mortgage-backed securities purchases
trimmed by $5 billion to $30 billion.
The Fed said information received since the Federal Open Market Committee met in December
indicates that growth in economic activity picked up in recent quarters, while labor market
indicators were mixed but on balance showed further improvement.
Emerging market stocks suffer worst sell-off since 2011
Currencies, stocks and bonds fell from Asia to Europe and Latin America, with the Russian rouble
sliding to five-year lows and central European countries such as Poland and Hungary also engulfed in
the turmoil.
Billions of dollars were withdrawn from emerging market equity funds this week – the largest equity
fund outflow from emerging markets since August 2011, according to a Bank of America Merrill
Lynch Global Research report.
The selloff was primarily driven by the fear of Chinese slowdown and the global economy is still
waiting for some kind of policy action from Bank of China. There was no sign of stock markets
stabilizing, with January’s falls wiping out all of December’s gains. Stocks had their worst January
performance in five years.
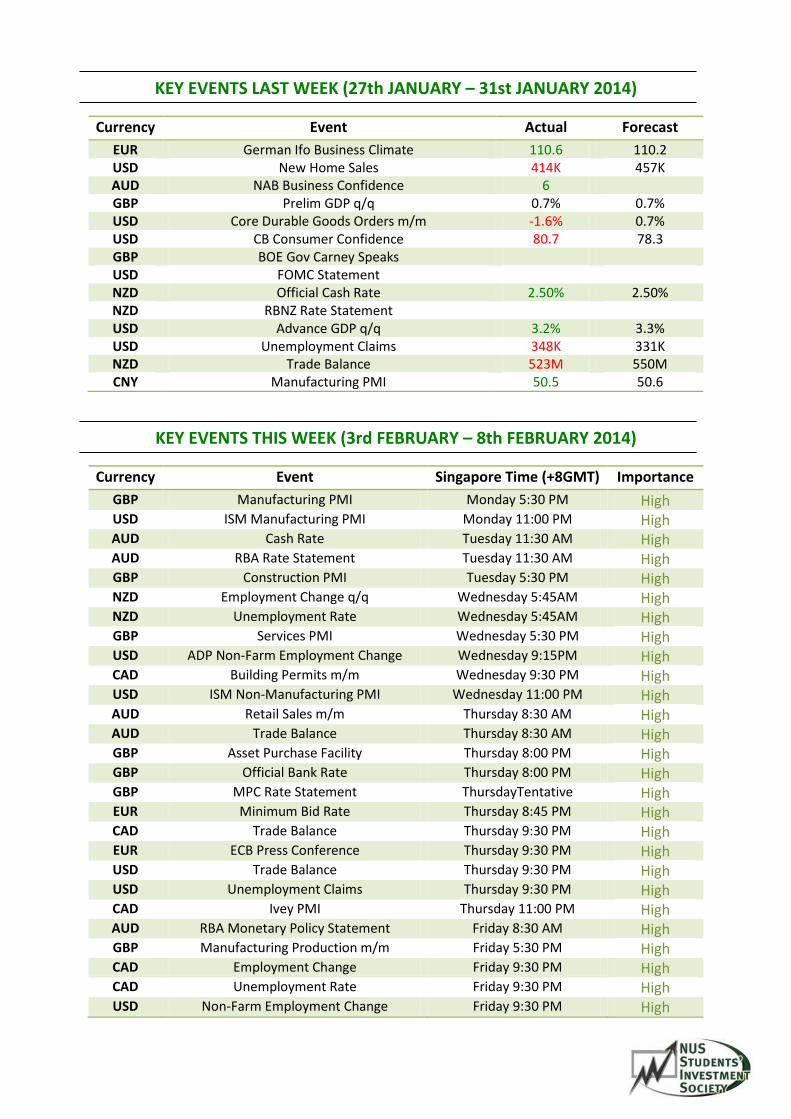
KEY EVENTS LAST WEEK (27th JANUARY – 31st JANUARY 2014)
Currency Event Actual Forecast
EUR German Ifo Business Climate 110.6 110.2 USD New Home Sales 414K 457K AUD NAB Business Confidence 6 GBP Prelim GDP q/q 0.7% 0.7% USD Core Durable Goods Orders m/m -1.6% 0.7% USD CB Consumer Confidence 80.7 78.3 GBP BOE Gov Carney Speaks USD FOMC Statement NZD Official Cash Rate 2.50% 2.50% NZD RBNZ Rate Statement USD Advance GDP q/q 3.2% 3.3% USD Unemployment Claims 348K 331K NZD Trade Balance 523M 550M CNY Manufacturing PMI 50.5 50.6
KEY EVENTS THIS WEEK (3rd FEBRUARY – 8th FEBRUARY 2014)
Currency Event Singapore Time (+8GMT) Importance
GBP Manufacturing PMI Monday 5:30 PM High USD ISM Manufacturing PMI Monday 11:00 PM High AUD Cash Rate Tuesday 11:30 AM High AUD RBA Rate Statement Tuesday 11:30 AM High GBP Construction PMI Tuesday 5:30 PM High NZD Employment Change q/q Wednesday 5:45AM High NZD Unemployment Rate Wednesday 5:45AM High GBP Services PMI Wednesday 5:30 PM High USD ADP Non-Farm Employment Change Wednesday 9:15PM High CAD Building Permits m/m Wednesday 9:30 PM High USD ISM Non-Manufacturing PMI Wednesday 11:00 PM High AUD Retail Sales m/m Thursday 8:30 AM High AUD Trade Balance Thursday 8:30 AM High GBP Asset Purchase Facility Thursday 8:00 PM High GBP Official Bank Rate Thursday 8:00 PM High GBP MPC Rate Statement ThursdayTentative High EUR Minimum Bid Rate Thursday 8:45 PM High CAD Trade Balance Thursday 9:30 PM High EUR ECB Press Conference Thursday 9:30 PM High USD Trade Balance Thursday 9:30 PM High USD Unemployment Claims Thursday 9:30 PM High CAD Ivey PMI Thursday 11:00 PM High AUD RBA Monetary Policy Statement Friday 8:30 AM High GBP Manufacturing Production m/m Friday 5:30 PM High CAD Employment Change Friday 9:30 PM High CAD Unemployment Rate Friday 9:30 PM High USD Non-Farm Employment Change Friday 9:30 PM High

SGX COMPANY EARNINGS RELEASE (CONFIRMED)
Company Date
Ascendas Hospitality Trust Thursday, 6th February
Singapore Airlines Thursday, 6th February
StarHub Thursday, 6th February
Great Eastern Holdings Friday, 7th February
United Overseas Insurance Friday, 7th February
Data as at 2/2/14
THIS WEEK’s FUNDAMENTAL ANALYSIS (FA) IDEA 1
Raffles Medical Group Ltd (BUY)
Ticker: RFMD:SP Last Closed Price: 3.05 12M TP: 3.43 Upside/Downside Potential: 12.5% COMPANY DESCRIPTION
Raffles Medical Group Ltd offers a full range of medical services, ranging from preventive to curative to consultancy services. They own a network of clinics and hospitals in Singapore, as well as a total of 4 medical centres in Hong Kong and Shanghai, China. In addition, they provide insurance services.
CONCLUSION To conclude, we favour Raffles Medical Group for its steady income growth and high potential for future earnings. With strong company fundamentals and positive macroeconomic indicators, we believe that Raffles Medical Group will be able to ride on the increase in demand for quality healthcare and expand its operations across the Asia-Pacific region. Using our valuation model, we determine our 12-month target price for RMG at 3.43. Additionally, we note that our estimate is actually a conservative one as other investment analysts have offered medium estimates of around 3.66. However, given that RMG averaged only a return of 4.08% in the past year, coupled by strong competition and other macro risks, we do not believe that RMG will hit the medium estimates. Moreover,the high forecasted PE-ratio suggests that the company might be fairly valued already. Nevertheless, with
KEY FIGURES Mkt Cap
SGD1,690.12mil
Issued Capital (m shrs) 554.14M
30 Day AvgVol 218,400
2010 2011 2012 2013F
Net Income (SGD M) 45.3 50.4 56.8 62.7 EPS (SGD) 0.87 0.95 0.11 0.12 P/E (x) 21.7 23.5 22.4 25.2 NAV per share (%) 0.54 0.62 0.71 0.77 Div Yield (%) 1.87 1.79 1.91 - ROE (%) 15.8 15.1 14.6 - Payout ratio (%) 40.5 42.1 42.7 -
NUS Invest Research Analyst Jeremy Ong Leong Wen
Bright Outlook for the Asia-Pacific Hospital Market
With the prevalence of chronic and infectious diseases, increasing affluence and demand for higher quality healthcare in the Asia-Pacific Market, the hospital and medical services industry is poised for strong growth in the coming years. The market has earned revenues of more than US$377.90B in 2012 and analysts estimate revenues to reach US$1085.98B in 2017. Raffles Medical Group is set to ride on the increase in health care demands and medical tourism in the areas of Singapore, China and Hong Kong to expand its operation and increase its future earnings.
Strong Earnings Growth and Balance Sheet
Raffles Medical Groupreported a 10.3% rise in earnings in Q3 2013, as net profits soared to $13.96M. This is due to higher patient load, better operating efficiencies and increased demand from corporate clients. Additionally, the cash and cash equivalents as at Q3 2013 has increased significantly to $146.1M, as compared to $87.98M from one year ago due to its strong cash flows from operations. Moreover, it has managed to reduce its interest-bearing short-term liabilities to $4.38M from $19.74M at the beginning of the year, suggesting that it has a healthy balance sheet to continue to support its strong earnings.
High Potential for Future Earnings Growth with Expansion Plans Undergoing
Raffles Medical Group seeks to further expand its operations in both Singapore and in China. RMG has agreed to buy a site adjacent to Raffles Hospital in North Bridge Road for $105.2M and have obtained permission from the Urban Redevelopment Authority to raise the plot ratio on its existing land for Raffles Hospital. This project is set to boost the facility’s space by about one-third, increasing its patient load and earnings. Furthermore, it has recently signed an agreement in partnership with China Merchants Group Ltd to build a 200-bed hospital in the Southern Chinese City of
negotiations on its expansion plans coming to a close, a healthy balance sheet and steady dividend yields, we believe that Raffles Medical Group remains a good buy for the growth investor.
Shen Zhen, taking advantage of the rising demand for high quality private healthcare in the rapidly growing Chinese market.
Key Macroeconomic and Expansion Risks
The more measured pace of economic growth in Singapore is set to have a dampening effect on healthcare demand. Furthermore, Raffles Medical Group continues to face stiff competition in the healthcare landscape from key players such as Religare Health Trust (RHT) and IHH Healthcare Bhd. (IHH), as new public and private hospitals are set up in the region.
In addition, Raffles Medical Group’s expansion plans have not been fully cast into stone yet and are still subject to approval by the Singapore authorities. One such expansion risk, for instance, occurred in March last year as RMG was denied its proposal to convert part of a building near the city’s Orchard Road shopping belt into a medical centre. The building has since then been put up for sale.
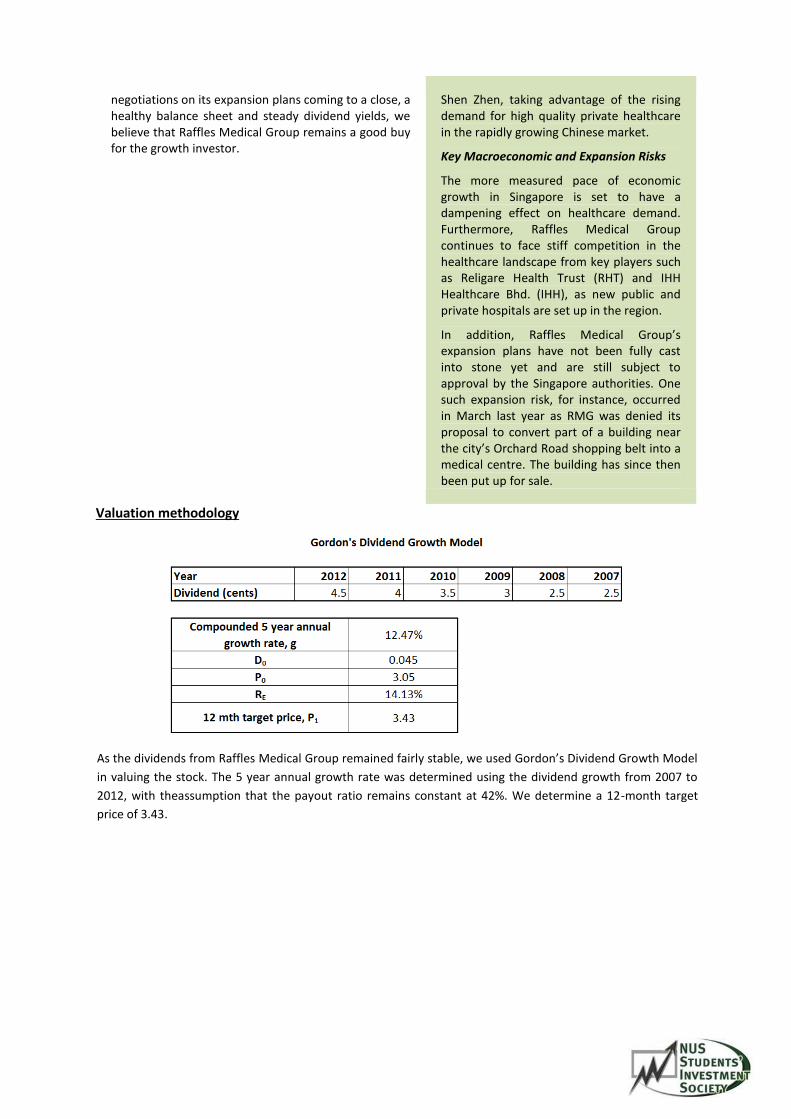
Valuation methodology
As the dividends from Raffles Medical Group remained fairly stable, we used Gordon’s Dividend Growth Model
in valuing the stock. The 5 year annual growth rate was determined using the dividend growth from 2007 to
2012, with theassumption that the payout ratio remains constant at 42%. We determine a 12-month target
price of 3.43.
THIS WEEK’S FUNDAMENTAL ANALYSIS (FA) IDEA 2
Tiger Airways Holdings Ltd (SELL)
Ticker: SGX: J7X Last Closed Price: 0.425 TP: 0.385 Upside/Downside Potential: -9.41%
COMPANY DESCRIPTION
Tiger Airways Holdings Ltd is a holding company for a group of low cost carriers operating in the Asia-Pacific region. Headquartered in Singapore, the group comprises of wholly owned Tiger Airways Singapore and partially owned Tigerair Australia (40%), Tigerair Philippines (disposed), Tigerair Mandala (33%) and the newly announced Tigerair Taiwan (10%). As of Dec 2013, Tigerair has a fleet of 51 Airbus A320-family aircraft with an average age under three years old. Apart from air tickets, Tiger Airways has been successful in generating ancillary revenues, which include checked baggage, sports equipment charges, inflight sales of gifts, duty free items, food and beverages, amongst other services.
CONCLUSION
Tiger Airways Holdings Ltd has sustained considerable
losses in the past year. Although the spike in losses
observed in the most recent quarter is a one off event
KEY FIGURES
Market Cap (SGD)
429.04 M
Outstanding Shares 986.29 M Price/Book ratio (mrq) 2.582 Avg Daily Vol (m shrs) 8.21
FY12 FY13 FY14F FY15F
Revenue (S$m) 618.18 866.22 754.3 834.3
Operating EBITDA (S$m)
(44.14) 45.47 12.37 54.16
Net profit (S$m) (104.3) (45.4) (29.1) (18.1)
EPS (SGD) (0.12) (0.05) (0.14) (0.03)
Div Yield (%) 0 0 0 0
ROE (%) (39.8) (20.2) (47.5) (8.4)
Net Gearing 170% 200% 125% 138%
P/B (x) 1.71 2.15 1.33 1.47
NUS Invest Research Analyst Joseph Soh
Exceptional charges, great losses on associates
In the quarter ended 31 Dec 2013 (3QFY14), Tiger Airways Holdings Ltd reported a loss of S$118.5 million, an immense deterioration from $2.0 million profit after tax in the previous quarter. $88.3 million of the loss were exceptional charges. These items consisted of a $30.3 million loss on the planned disposal of its 40% stake in Tigerair Philippines, and an impairment of associates (excluding Philippines subsidiary) amounting to $50.8 million. The group also sustained $23.1m as its share of losses of associates. Share of losses were broken down into Mandala ($11.2m), Australia ($7.4m), Philippines ($4.5m). Disposal of Tigerair Philippines is expected to be completed by 4QFY14 and the group expects no additional losses. Outlook of associates remains pessimistic, with forecasted losses ahead.
Airline industry overcapacity
Total capacity deployment by all airlines rose by 38% over the past year, causing overcapacity and empty planes. In 2QFY14, Tiger Airway’s Revenue Passenger Kilometre demand rose 21.9% yoy, below Available Seat Kilometre capacity growth of 27.5%. The gap increased in 3QFY14 when RPK and ASK growth were 9.2% and 23.3% yoy respectively. Passenger Load Factor subsequently fell 9.8% pointsyoy to only 75.8% in 3QFY14. Decline in passenger yields (revenue/RPK) accelerated from 6.7% in 2Q to 11% in 3Q. Combination of lower PLF and lower yield resulted in a big 21% yoy decrease in revenue per ASK. Within the region, Indonesia is likely to be the main cause of loss for the group. Yoy, Tigerair Singapore expanded its capacity deployment there from 2,520 one-way seats/week to 9,360 OWS/week. Additional capacity deployment was crucial to secure landing slots at its congested airports, but the drawback was losses by unfilled planes. With the supposed increased travelling due to year end festivities failing to bring any improvement, sudden significant increase in demand relative to ASK is hardly foreseeable and the group should continue to face near-term pressure.
Focusing on turnaround
Through the divestment of underperforming

attributed to exceptional charges and not operating
loss, it reflects weakness in Tiger Airways’ subsidiaries
amidst a highly competitive and saturated airline
industry around the region and world. The group has
since fully divested Tigerair Philippines (by end of FY14)
and partially divested its stake in Tigerair Australia to
Virgin Australia Holdings Ltd (sold Jul 2013), and also
created strategic collaborations and agreements with
several regional airlines. Tiger Airways’ expansion of its
network while maintaining an asset light strategy to
maximise returns have equipped them for a turnaround
as soon as the industry and market rebounds. However,
these initiatives have yet to make an impact on either
its PLF or bottom line. In view of pressure on yield and
load factors at Tiger Airways and sluggish operation
figures coupled with high gearing, the downside of this
stock outweighs its possibilities of a turnaround. Valued
at 1.05× BV FY14F. We recommend SELL at current
price.
Tigerair Philippines to Cebu Pacific, Tigerair further reduces expenses while strengthening the strategic alliance between the both. Subject to regulatory approvals, both airlines will form a commercial and operational collaboration on international/domestic air routes from the Philippines, creating the biggest flight network to the region. Additionally, the group has signed a joint venture with China Airlines to found Tigerair Taiwan, entered into an interline agreement with SpiceJet India, and deepened collaboration with interline partner Scoot. These actions taken by the group will allow them to expand its regional footprint in a capital efficient manner. Although Tigerair continues to face pressure on yield and load factors with no turnaround in sight yet, their actions suggests that they are ready to take advantage once the airline industry bounces back up.
THIS WEEK’s TECHNICAL ANALYSIS (TA) TRADE IDEA 1
Forex (FX): GBP/USD (Short) Current Price: 1.64330 Suggested Take Profit 1: 1.63000 Suggested Take Profit 2: 1.62350 Suggested Stop Loss 1: 1.64730 Suggested Stop Loss 2: 1.64876 Risk-Reward Ratio: 1 : 3.6
NUSInvest Analyst Nicholas Lim Bing Yi
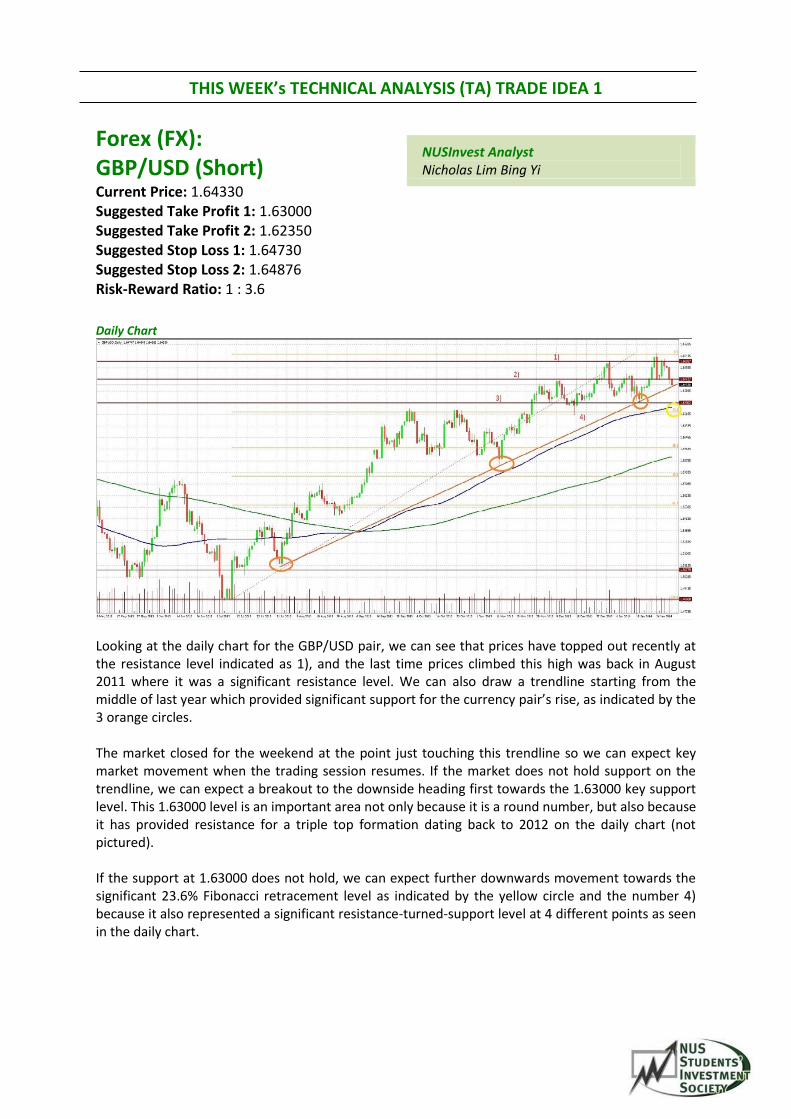
Daily Chart
Looking at the daily chart for the GBP/USD pair, we can see that prices have topped out recently at the resistance level indicated as 1), and the last time prices climbed this high was back in August 2011 where it was a significant resistance level. We can also draw a trendline starting from the middle of last year which provided significant support for the currency pair’s rise, as indicated by the 3 orange circles. The market closed for the weekend at the point just touching this trendline so we can expect key market movement when the trading session resumes. If the market does not hold support on the trendline, we can expect a breakout to the downside heading first towards the 1.63000 key support level. This 1.63000 level is an important area not only because it is a round number, but also because it has provided resistance for a triple top formation dating back to 2012 on the daily chart (not pictured). If the support at 1.63000 does not hold, we can expect further downwards movement towards the significant 23.6% Fibonacci retracement level as indicated by the yellow circle and the number 4) because it also represented a significant resistance-turned-support level at 4 different points as seen in the daily chart.
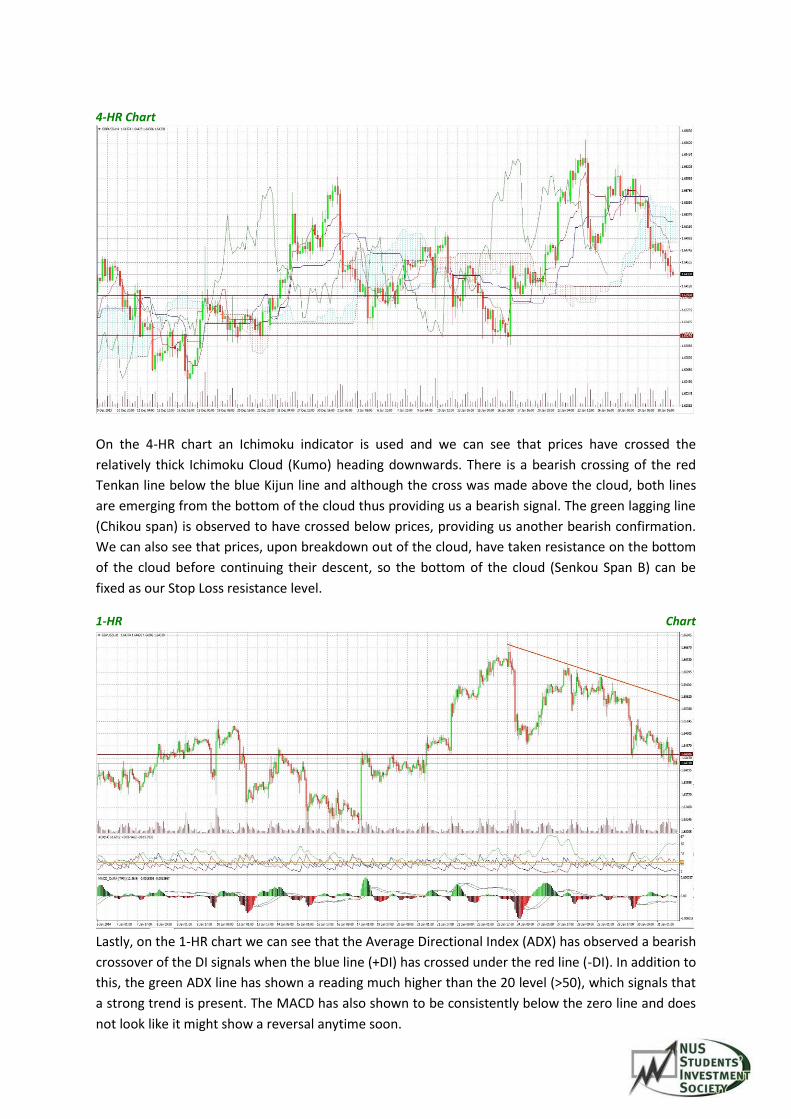
4-HR Chart
On the 4-HR chart an Ichimoku indicator is used and we can see that prices have crossed the
relatively thick Ichimoku Cloud (Kumo) heading downwards. There is a bearish crossing of the red
Tenkan line below the blue Kijun line and although the cross was made above the cloud, both lines
are emerging from the bottom of the cloud thus providing us a bearish signal. The green lagging line
(Chikou span) is observed to have crossed below prices, providing us another bearish confirmation.
We can also see that prices, upon breakdown out of the cloud, have taken resistance on the bottom
of the cloud before continuing their descent, so the bottom of the cloud (Senkou Span B) can be
fixed as our Stop Loss resistance level.
1-HR Chart
Lastly, on the 1-HR chart we can see that the Average Directional Index (ADX) has observed a bearish
crossover of the DI signals when the blue line (+DI) has crossed under the red line (-DI). In addition to
this, the green ADX line has shown a reading much higher than the 20 level (>50), which signals that
a strong trend is present. The MACD has also shown to be consistently below the zero line and does
not look like it might show a reversal anytime soon.

In conclusion, it is of my opinion that the GBP/USD has arrived at a critical decision point where the
bulls or the bears will be primed to take control for an extended period of time. Do make it a point
to monitor the UK’s release of the Manufacturing PMI at 5.30pm on the 3rd of February which is
expected to have a big impact on the currency’s direction. However, with that being said, the signals
thus far are there for a bearish breakout of the daily rising trendline and if the currency news are
aligned, hopefully we can catch a prosperous downwards wave to kickstart the Lunar New Year.
THIS WEEK’s TECHNICAL ANALYSIS (TA) TRADE IDEA 2
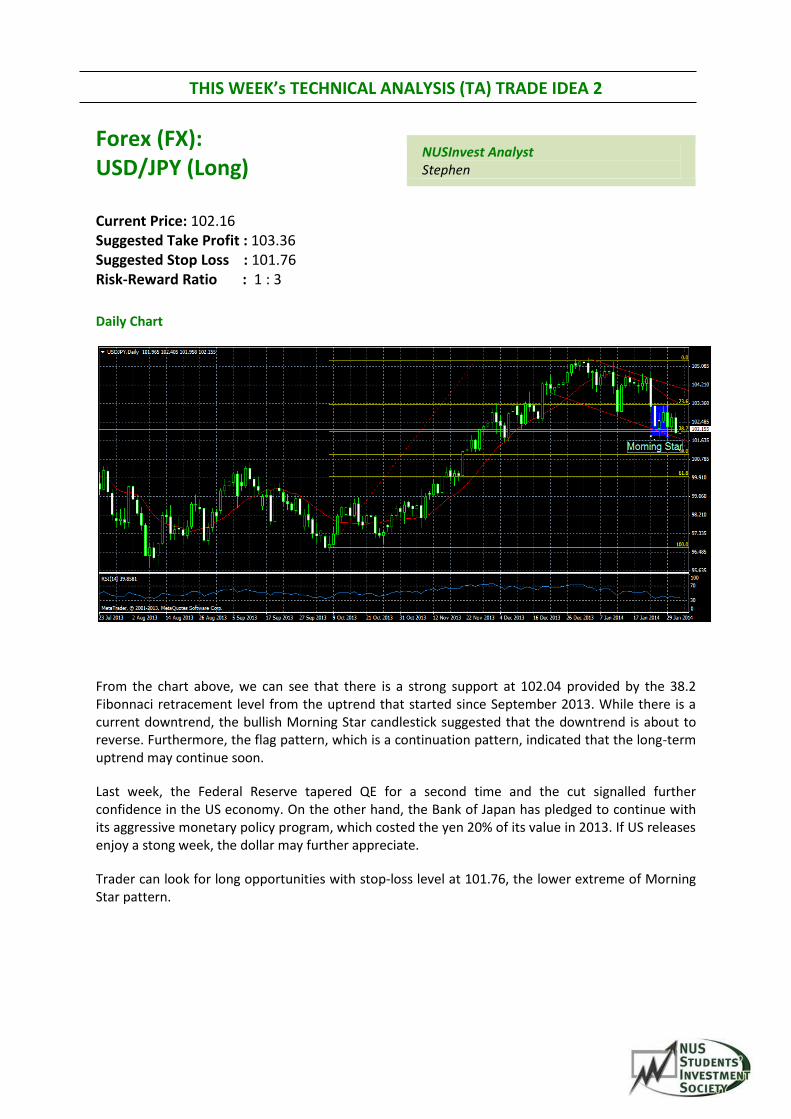
Forex (FX): USD/JPY (Long) Current Price: 102.16 Suggested Take Profit : 103.36 Suggested Stop Loss : 101.76 Risk-Reward Ratio : 1 : 3
NUSInvest Analyst Stephen
Daily Chart
From the chart above, we can see that there is a strong support at 102.04 provided by the 38.2 Fibonnaci retracement level from the uptrend that started since September 2013. While there is a current downtrend, the bullish Morning Star candlestick suggested that the downtrend is about to reverse. Furthermore, the flag pattern, which is a continuation pattern, indicated that the long-term uptrend may continue soon.
Last week, the Federal Reserve tapered QE for a second time and the cut signalled further confidence in the US economy. On the other hand, the Bank of Japan has pledged to continue with its aggressive monetary policy program, which costed the yen 20% of its value in 2013. If US releases enjoy a stong week, the dollar may further appreciate.
Trader can look for long opportunities with stop-loss level at 101.76, the lower extreme of Morning Star pattern.
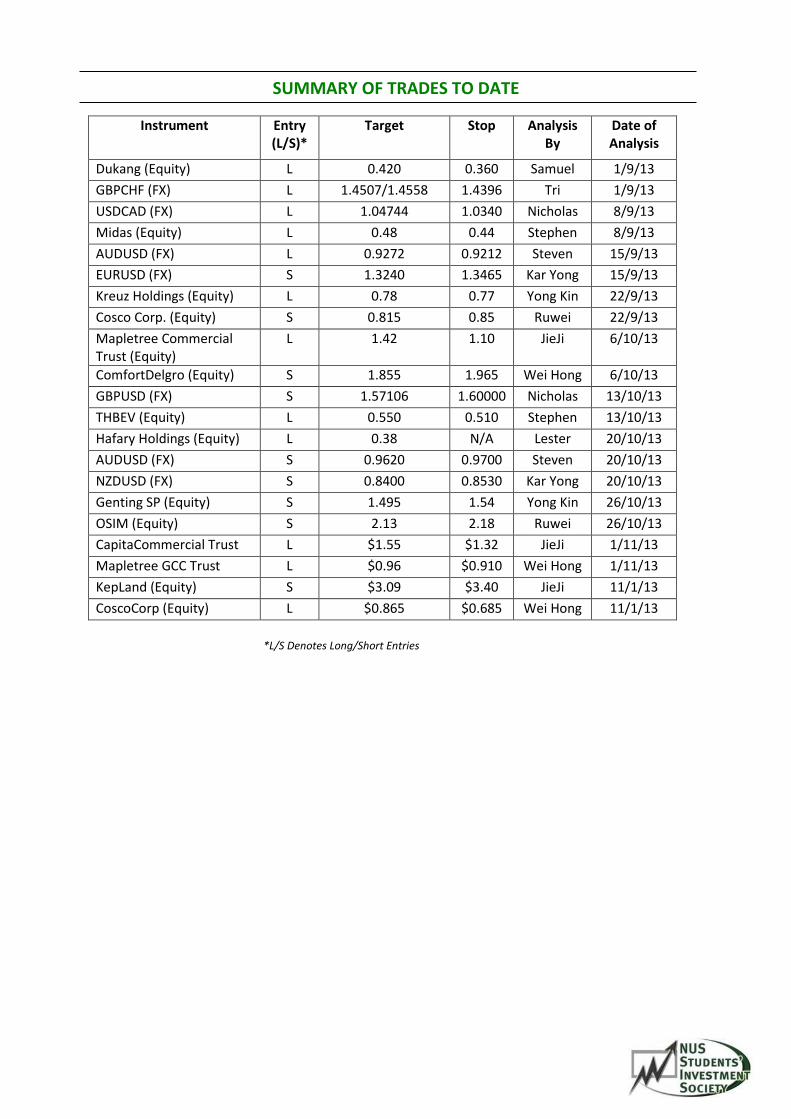
SUMMARY OF TRADES TO DATE
Instrument Entry (L/S)*
Target Stop Analysis By
Date of Analysis
Dukang (Equity) L 0.420 0.360 Samuel 1/9/13
GBPCHF (FX) L 1.4507/1.4558 1.4396 Tri 1/9/13
USDCAD (FX) L 1.04744 1.0340 Nicholas 8/9/13
Midas (Equity) L 0.48 0.44 Stephen 8/9/13
AUDUSD (FX) L 0.9272 0.9212 Steven 15/9/13
EURUSD (FX) S 1.3240 1.3465 Kar Yong 15/9/13
Kreuz Holdings (Equity) L 0.78 0.77 Yong Kin 22/9/13
Cosco Corp. (Equity) S 0.815 0.85 Ruwei 22/9/13
Mapletree Commercial Trust (Equity)
L 1.42 1.10 JieJi 6/10/13
ComfortDelgro (Equity) S 1.855 1.965 Wei Hong 6/10/13
GBPUSD (FX) S 1.57106 1.60000 Nicholas 13/10/13
THBEV (Equity) L 0.550 0.510 Stephen 13/10/13
Hafary Holdings (Equity) L 0.38 N/A Lester 20/10/13
AUDUSD (FX) S 0.9620 0.9700 Steven 20/10/13
NZDUSD (FX) S 0.8400 0.8530 Kar Yong 20/10/13
Genting SP (Equity) S 1.495 1.54 Yong Kin 26/10/13
OSIM (Equity) S 2.13 2.18 Ruwei 26/10/13
CapitaCommercial Trust L $1.55 $1.32 JieJi 1/11/13
Mapletree GCC Trust L $0.96 $0.910 Wei Hong 1/11/13
KepLand (Equity) S $3.09 $3.40 JieJi 11/1/13
CoscoCorp (Equity) L $0.865 $0.685 Wei Hong 11/1/13
*L/S Denotes Long/Short Entries

This research material has been prepared by NUS Invest. NUS Invest specifically prohibits the redistribution of this material in whole or in part without the written permission of NUS Invest. The research officer(s) primarily responsible for the content of this research material, in whole or in part, certifies that their views are accurately expressed and they will not receive direct or indirect compensation in exchange for expressing specific recommendations or views in this research material.Whilst we have taken all reasonable care to ensure that the information contained in this publication is not untrue or misleading at the time of publication, we cannot guarantee its accuracy or completeness, and you should not act on it without first independently verifying its contents. Any opinion or estimate contained in this report is subject to change without notice. We have not given any consideration to and we have not made any investigation of the investment objectives, financial situation or particular needs of the recipient or any class of persons, and accordingly, no warranty whatsoever is given and no liability whatsoever is accepted for any loss arising whether directly or indirectly as a result of the recipient or any class of persons acting on such information or opinion or estimate. You may wish to seek advice from a financial adviser regarding the suitability of the securities mentioned herein, taking into consideration your investment objectives, financial situation or particular needs, before making a commitment to invest in the securities. This report is published solely for information purposes, it does not constitute an advertisement and is not to be construed as a solicitation or an offer to buy or sell any securities or related financial instruments. No representation or warranty, either expressed or implied, is provided in relation to the accuracy, completeness or reliability of the information contained herein. The research material should not be regarded by recipients as a substitute for the exercise of their own judgement. Any opinions expressed in this research material are subject to change without notice.
©2013 NUS Invest