Embed Size (px)
DESCRIPTION
For the complete report, get in touch with us at : [email protected] The new report, ‘Software Testing Market in India’, states thatIndiahas become one of the major destinations for outsourcing software testing services owing to the availability of cost effective talent pool. Increasing number of software development companies are
Citation preview

Software Testing Market IndiaSoftware Testing Market ‐ India
May 2013

Executive Summary
Market
Software Testing market in India was valued at around INR xx bn in 20‐‐ and is projected to grow at a CAGR of roughly xx% between 20‐‐ to 20‐‐
Over the last decade, India has become one of the major destinations for outsourcing software testing services owing to the availability of cost effective talent pool g y p
Country X is the key market for the big Indian testing vendors, followed by Country Y and Country Z
Drivers– Dominance of IT Service Sector
Challenges– Dearth of Required Skill
Drivers & Challenges
– Growing Acceptance Among Customers
– Rapid Evolution of Vendor Capabilities
– Adoption of Unique Growth Strategies by Vendors
– Government Initiatives in Indian IT & ITeS Sector
– Competition with Other Countries
Trends Need for Mobile Application Testing
Shift towards Cloud based Testing
Growing Demand for Testing as a Service (TaaS)
Rise in Adoption of Automated Testing
Development of Domain‐specific Service Offerings
Competition
Growing Demand for Testing as a Service (TaaS)
Major Players
Company A Company B Company C
2
Company D Company E Company F
SOFTWARE TESTING MARKET IN INDIA 2013.PPT

•Macroeconomic Indicators
•Introduction
•Market Overview
•Types & BenefitsTypes & Benefits
•Drivers & Challenges
•Software Testing in Key Sectors•Software Testing in Key Sectors
•Trends
C titi L d•Competitive Landscape
•Opportunity & Recommendation
3SOFTWARE TESTING MARKET IN INDIA 2013.PPT
•Appendix

SAMPLE Macro Economic Indicators (1/3)
GDP at Factor Cost: Quarterly
INR tn
15
1413.9513 24
14.1213 40
10.70
13.1612.39
11.47
10.58
14
13
12
11
10
13.24
12.13
13.4012.62
11.66
13.0612.2911.52
Inflation Rate: Monthly
Q1
10
Q4Q3Q22012‐132011‐122010‐112009‐10
y
0.910.93
0 8
1.0
%
0.460.460.47
0.2
0.4
0.6
0.8
4
0.0
Dec 2012 ‐ Jan 2013Nov 2012 ‐ Dec 2012Oct 2012 ‐ Nov 2012Sep 2012 ‐ Oct 2012Aug 2012 ‐ Sep 2012
SOFTWARE TESTING MARKET IN INDIA 2013.PPT

Demand for software testing is on the rise to prevent huge losses…
•xx
Software Testing Market – Overview ‐ Global Market Size and Growth
INR tn
2.0
+5.1%x6x5x42.0
1.5
1.0
0.5
x5x4x3x2x1
0.0
20‐‐20‐‐20‐‐20‐‐20‐‐20‐‐
xx xx
x%
xx xx
x%
xxxx
5SOFTWARE TESTING MARKET IN INDIA 2013.PPT
y%

… incurred due to software bugs
Share of Testing Performance Pattern
Share of Spending
x1%x2%
x1%
1%y1%y2%
Pattern B
Pattern A
Spending in B
Spending in A
6SOFTWARE TESTING MARKET IN INDIA 2013.PPT

Quality assurance at low cost has attracted western software industry to Indian software testing market
• xx
Software Testing Market – Overview ‐ India India’s Contribution in Outsourced Testing
20‐‐ 20‐‐e
x1%
xxxx
x2%
y1%2%y2%
z1%
z3%z4%
z3%
7SOFTWARE TESTING MARKET IN INDIA 2013.PPT
xxxx
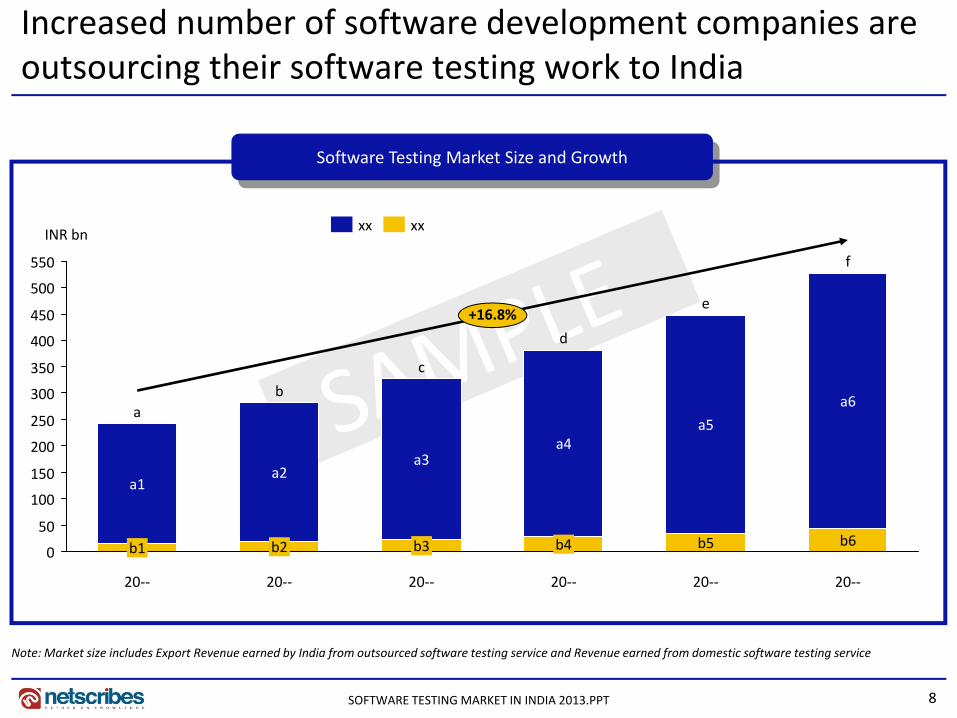
Increased number of software development companies are outsourcing their software testing work to India
Software Testing Market Size and Growth
500
550
INR bn
f
e
xxxx
300
350
400
450 +16.8%
a6
e
d
c
ba
100
150
200
250 a5a4
a3a2
a
a1
0
50
20‐‐
b6
20‐‐
b5
20‐‐
b4
20‐‐
b3
20‐‐
b2
20‐‐
b1
8
Note: Market size includes Export Revenue earned by India from outsourced software testing service and Revenue earned from domestic software testing service
SOFTWARE TESTING MARKET IN INDIA 2013.PPT

ITS gains more popularity as enterprises doesn’t feel the need to invest in expensive hardware & software
Software Testing Export – Market Size & Growth
INR bnf
xxxx
100
200
300
400
500 +16.4%f
f2
f1e
e2
e1d
d2
d1c
c2
c1b
b
b1aa1
0
100
20‐‐20‐‐20‐‐
d2
20‐‐
c2
20‐‐
b2
20‐‐
a2
Note: Software testing export corresponds to revenue earned from outsourced software testing service by India
x% y1%
Over y1% of the xx in India is captured
by the xx
20‐‐
y%y2%
9
xxxx xxxx
SOFTWARE TESTING MARKET IN INDIA 2013.PPT

Employing 180,000 people, premier software testing companies in India provides facilities and CoE to offer ITS
Market Share By Major Industry Verticals
1%
Market Share By Major Geographies
x2%
x1%
x4% Industry B
Industry A
y1%
y3% Country A
x3%Industry D
Industry C
y2%Country C
Country B
Market Share By Company Type in ITS
z1%
z2%
z1%
z3%
Type B
Type A
10
z2%Type C
Note: CoE refers to Centers of ExcellenceITS refers to Independent Testing Services
SOFTWARE TESTING MARKET IN INDIA 2013.PPT

Drivers & Challenges
Drivers
Dominance of IT Service Sector Ch llDominance of IT Service Sector
Growing Acceptance Among Customers
Challenges
Dearth of Required Skill
Rapid Evolution of Vendor Capabilities
Adoption of Unique Growth Strategies by Vendors
G I i i i i I di IT &
Competition with Other Countries
Government Initiatives in Indian IT & ITeS Sector
11SOFTWARE TESTING MARKET IN INDIA 2013.PPT

Established IT services sector in India facilitates the growth of testing market in India
•xx
Dominance of IT Service Sector Impact
Share in Global Offshore IT Services Market Share in Global ITeS/BPO Market
45%55% Country A
35%
6 %Country A
INR bn
Growth in IT Services Sector ‐ India
Country B 65% Country B
879.7739.2
626.5527.8447.3388.9341.2500
1,000
INR bn
+17%
12SOFTWARE TESTING MARKET IN INDIA 2013.PPT
0
20‐‐20‐‐20‐‐20‐‐20‐‐20‐‐20‐‐

Software Testing in Key Sectors (2/4)
Software Testing in Banking – Case Study
Vendor xx
Requirement Solution Benefits
Client xx
• xx • xx • xx
13
• xx
SOFTWARE TESTING MARKET IN INDIA 2013.PPT
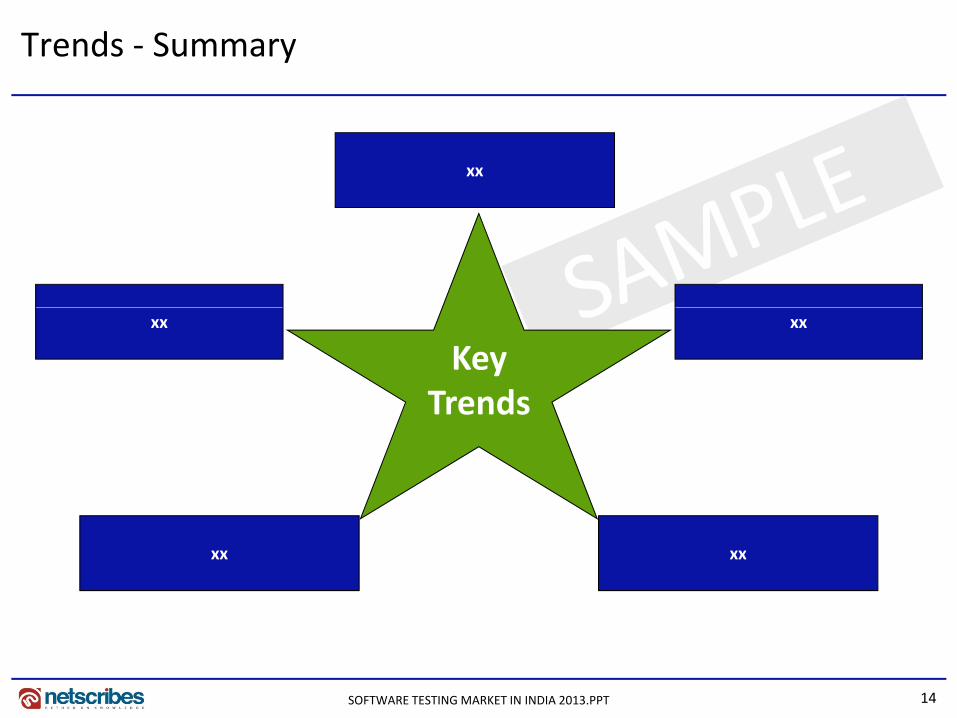
Trends ‐ Summary
xx
xxxx
Key TrendsTrends
xx xx
14SOFTWARE TESTING MARKET IN INDIA 2013.PPT

Rapid growth of mobile phone applications has led to increasing need for its testing
Need for Mobile Application Testing
Rising need for • xx
mobile application testing
xx xx
Requires xx xxRequires
xx
xx xx xxThings to Test
xx xx xx
Popular
15SOFTWARE TESTING MARKET IN INDIA 2013.PPT
mobile apps testing tools
xx xx

SAMPLE Porter’s Five Forces Analysis
Threat of New Entrants• xx
ImpactHigh
ImpactHighImpact
M di
ImpactMedium to High
Competitive Rivalry• xx
Bargaining Power of Buyers• xx
Medium
Bargaining Power of Suppliers• xx
Impact
Threat of Substitutes• xx
Low
16SOFTWARE TESTING MARKET IN INDIA 2013.PPT

SAMPLE Vendor Mapping
Major Testing Vendors Independent Testing Testing with Development Process
Player A
Player B
Player B
Player C
Player D
Player E
Player F
Player G
Player H
Player I
Player J
Player K
Player L
Player M
17
Player M
Player N
SOFTWARE TESTING MARKET IN INDIA 2013.PPT

SAMPLE Competitive Benchmarking (1/4)
Public Trading Comparables (FY 2012)
Player A Player B Player C Player D Player E
Market Capitalization (INR mn) ‐‐ ‐‐ ‐‐ ‐‐ ‐‐
Share Price (INR) ‐‐ ‐‐ ‐‐ ‐‐ ‐‐
EV/EBITDA (x) ‐‐ ‐‐ ‐‐ ‐‐ ‐‐
/EV/Revenue (x) ‐‐ ‐‐ ‐‐ ‐‐ ‐‐
PE Ratio ‐‐ ‐‐ ‐‐ ‐‐ ‐‐
18
Note: Top 5 Public companies based on the Market Capitalization; Market Capitalization, Share Price and PE ratio is as of 04/04/2013
SOFTWARE TESTING MARKET IN INDIA 2013.PPT
Competitive Benchmarking (2/4)
Key Ratios of 3 Major Private Companies – Operational Basis (FY 2012) (1/3)
100
%x3
Net MarginOperating Margin
20
40
60
80
100
x2
1
x1
y3y2
0
20
Player A
y1
Player CPlayer B
• xx
19SOFTWARE TESTING MARKET IN INDIA 2013.PPT

Major Public Companies ‐ Summary
120,000
130,000
140,000
Net Profit/Loss
Size of the Bubble represents Market Capitalization in INR mn
80 000
90,000
100,000
110,000
0,000
m2
m1
40 000
50,000
60,000
70,000
80,000
m3
10,000
20,000
30,000
40,000
m7 m6
m5
m4
m80
‐50,000 0 50,000 100,000 150,000 200,000 250,000 300,000 350,000 400,000 450,000 500,000 550,000 600,000
m7 m6
Total income
m8
Player HPlayer GPlayer FPlayer EPlayer DPlayer CPlayer A Player B
20
Note: All figures are in INR mn and are based on the latest financials available
SOFTWARE TESTING MARKET IN INDIA 2013.PPT

Public: Domestic Company – Player A (1/4)
Company Information Offices and Centres – India
Corporate AddressMGR Estates # 106‐107 Dwarakapuri Colony Punjagutta, Hyderabad
Andhra Pradesh 500082
Tel No. +91 40 3070 2250
Fax No. +91 40 2335 0667
Website www.cigniti.com/
Y f I tiYear of Incorporation ‐‐
Ticker Symbol 534758
Stock Exchange Bombay Stock ExchangeHyderabad
Head Office
Key People
Products and Services
Category Products/Services
Test advisory consulting, testing as a service, cloud based testing, functional Name Designation
IT Consulting and Other Services
gtesting, mobile testing, security testing, performance testing, test automation, compatibility testing, usability testing, and robotics testing
Name Designation
Chakkilam Venkat Subramanyam
Chairman & MD
Sudhakar Pennam Founder, President, CEO
Neravati Raja Chief Operating Officer
21
Neravati, Raja Chief Operating Officer
Chintala, SaiSenior Vice President of Global Enterprise Solution
SOFTWARE TESTING MARKET IN INDIA 2013.PPT
Note: The list of products and services is not exhaustive

SAMPLE i i l S h K i
Public: Domestic Company – Player A (2/4)
Financial Snapshot Key Ratios
Particulars y‐o‐y change (2012‐11)
2012 2011 2010 2009
Profitability RatiosOperating Margin ‐0.64 6.00% 6.64% 6.12% 6.40%
Net Profit/Loss
Total Income
338.3300
400 15
INR mn INR mn
Net Margin 0.98 3.49% 2.51% 1.19% 1.32%
Profit Before Tax Margin 1.41 5.27% 3.86% 1.93% 2.61%
Return on Equity 1.64 3.10% 1.46% 0.52% 0.58%
Return on Capital Employed 1.41 4.69% 3.27% 2.14% 2.38%
Return on Working Capital 10.99 20.76% 9.77% 5.99% 6.24%
Return on Assets ‐0.04 2.98% 3.02% 2.06% 2.29%
75.950.650.7
0
100
200
300
0
5
10
2012201120102009Financial Summary
• The company earned a net profit of INR 11.8 mn in FY 2012, as compared to net profit of INR 1.9 mn in FY 2011
• The company reported total income of INR 338.3 mn in FY
Return on Fixed Assets 14.90 20.11% 5.21% 3.34% 3.86%
Cost RatiosOperating costs (% of Sales) 0.65 93.98% 93.34% 93.88% 93.60%
Administration costs (% of Sales)
‐12.43 9.09% 21.53% 22.04% 24.58%
Interest costs (% of Sales) ‐2.14 0.96% 3.10% 3.95% 3.79%2012, registering an increase of 345.9% over FY 2011
• The company earned an operating margin of 6% in FY 2012, a decrease of 0.64 percentage points over FY 2011
• The company reported debt to equity ratio of 0.42 in FY 2012, an increase of 138.9 per cent over FY 2011
Interest costs (% of Sales) % % % %
Liquidity RatiosCurrent Ratio ‐71.78% 1.39 4.94 10.12 10.81
Cash Ratio ‐91.08% 0.06 0.63 0.95 0.11
Leverage RatiosDebt to Equity Ratio 138.92% 0.42 0.17 0.18 0.12
b i l ian increase of 138.9 per cent over FY 2011
Key Financial Performance Indicators
Indicators Value (04/04/2013)Market Capitalization (INR mn) 2,420Total Enterprise Value (INR mn)
Debt to Capital Ratio 97.99% 0.29 0.15 0.15 0.10
Interest Coverage Ratio 191.98% 6.27 2.15 1.55 1.69
Efficiency RatiosFixed Asset Turnover 327.64% 3.34 0.78 0.55 0.60
Asset Turnover 9.43% 0.50 0.45 0.34 0.36
Current Asset Turnover ‐16.54% 0.98 1.17 0.88 0.88
22
Total Enterprise Value (INR mn) ‐‐EPS (INR) 3.47PE Ratio (Absolute) 41.20
Working Capital Turnover 135.25% 3.45 1.47 0.98 0.97
Capital Employed Turnover 26.38% 0.63 0.49 0.37 0.39
Improved Decline
SOFTWARE TESTING MARKET IN INDIA 2013.PPT

SAMPLE Public: Domestic Company – Player A (3/4)
Key Business Segments Key Geographic Segments
100% 100%
Segment XSegment A
S X h b h lS t A h b th l
0%
50%
100%
100%
0%
50%
100%
100%
Segment X has been the only revenue generating segment for Player A during 2009‐12
Segment A has been the only revenue generating segment for Player A during 2009‐12
Business Highlights
0%
20‐‐
0%
20‐‐
Note: Business Segments and Geographic Segments are based on total revenues
Description News
Overview • xx
Industries Catered • xx
23
Expansion Plan • xx
SOFTWARE TESTING MARKET IN INDIA 2013.PPT

SAMPLE Public: Domestic Company – Player A – SWOT Analysis(4/4)
• xx
• xx
WS
TO• xx
• xx
24SOFTWARE TESTING MARKET IN INDIA 2013.PPT

SAMPLE Strategic Recommendations
xx xx xx
Recommendations for Vendors
• xx • xx • xx
xx xx
• xx • xx
25SOFTWARE TESTING MARKET IN INDIA 2013.PPT

Thank you for the attentionThe Software Testing Market – India 2013 report is a part of Netscribes’ IT & ITeS Series.For more detailed information or customized research requirements please contact:
Phone: +91 33 4027 6214 / 6215E‐Mail: [email protected]
Follow us on:
About NetscribesNetscribes is a knowledge‐consulting and solutions firm with clientele across the globe. The company’s expertise spans areas of investment & business research, business & corporate intelligence, content‐management services, and knowledge‐software services. At its core lies a true value proposition that draws upon a vast knowledge base. Netscribes is a one‐stop shop designed to fulfil clients’ profitability and growth objectives.
Disclaimer: This report is published for general information only. Although high standards have been used in the preparation of this report,Netscribes is not responsible for any loss or damage arising from use of this document This document is the sole property of Netscribes and
26SOFTWARE TESTING MARKET IN INDIA 2013.PPT
Netscribes is not responsible for any loss or damage arising from use of this document. This document is the sole property of Netscribes. and prior permission is required for guidelines on reproduction.