Embed Size (px)
DESCRIPTION
Here are the market statistics for February 2013 covering the Parksville and Qualicum Beach areas.
Citation preview

Parksville / Qualicumas at February 28, 2013
Cumulative Residential Average Single Family Sale Price
Single Family Units Reported Sold
NOTE: Figures are based on a "rolling total" from the past 12 months – i.e. 12 months to date instead of the calendar "year to date".
Source: Vancouver Island Real Estate Board - MLS® Statistics - February 28, 2013 Parksville / Qualicum - Page 1

Comparative Activity by Property TypeCurrent Month 12 Months to Date
This Year Last Year % Change This Year Last Year % Change
Lots5Units Listed
Units Reported SoldSell/List RatioReported Sales DollarsAverage Sell Price / UnitMedian Sell PriceSell Price / List PriceDays to SellActive Listings
101 3
$250,000 $644,000$250,000 $214,667$250,000
114% 86%7 248
-50%-67%
-61%16%
-97%
20% 30%
177 12323 41
$3,455,597 $7,055,050$150,243 $172,074$157,000
88% 89%85 168
44%-44%
-51%-13%
-49%
13% 33%
71 51
Single Family89Units Listed
Units Reported SoldSell/List RatioReported Sales DollarsAverage Sell Price / UnitMedian Sell PriceSell Price / List PriceDays to SellActive Listings
10737 29
$12,641,900 $11,742,400$341,673 $404,910$318,000
94% 95%53 48
-17%28%
8%-16%
10%
42% 27%
1,264 1,371520 603
$196,170,286 $234,984,709$377,251 $389,693$357,000
94% 94%71 68
-8%-14%
-17%-3%
4%
41% 44%
310 380
Condos (Apt)15Units Listed
Units Reported SoldSell/List RatioReported Sales DollarsAverage Sell Price / UnitMedian Sell PriceSell Price / List PriceDays to SellActive Listings
184 3
$832,900 $827,900$208,225 $275,967$259,900
91% 96%86 35
-17%33%
1%-25%
142%
27% 17%
223 26262 63
$13,636,709 $15,836,950$219,947 $251,380$214,000
91% 91%94 133
-15%-2%
-14%-13%
-29%
28% 24%
86 139
Condos (Patio)18Units Listed
Units Reported SoldSell/List RatioReported Sales DollarsAverage Sell Price / UnitMedian Sell PriceSell Price / List PriceDays to SellActive Listings
177 8
$1,743,000 $2,211,250$249,000 $276,406$244,000
92% 94%121 148
6%-12%
-21%-10%
-18%
39% 47%
186 17480 96
$24,164,550 $27,855,196$302,057 $290,158$292,000
95% 96%92 157
7%-17%
-13%4%
-41%
43% 55%
75 75
Condos (Twnhse)10Units Listed
Units Reported SoldSell/List RatioReported Sales DollarsAverage Sell Price / UnitMedian Sell PriceSell Price / List PriceDays to SellActive Listings
205 2
$1,259,500 $656,000$251,900 $328,000$221,000
96% 92%79 172
-50%150%
92%-23%
-54%
50% 10%
138 16542 40
$13,844,721 $15,542,229$329,636 $388,556$338,000
95% 93%73 115
-16%5%
-11%-15%
-36%
30% 24%
45 69
PLEASE NOTE: property does NOT INCLUDE acreage with house, condominiums, duplex/triplex, mobileSINGLE FAMILYhomes/on pad, single family waterfront or single family strata. LOTS do NOT INCLUDE acreage or waterfront acreage.
Source: Vancouver Island Real Estate Board - MLS® Statistics - February 28, 2013 Parksville / Qualicum - Page 2
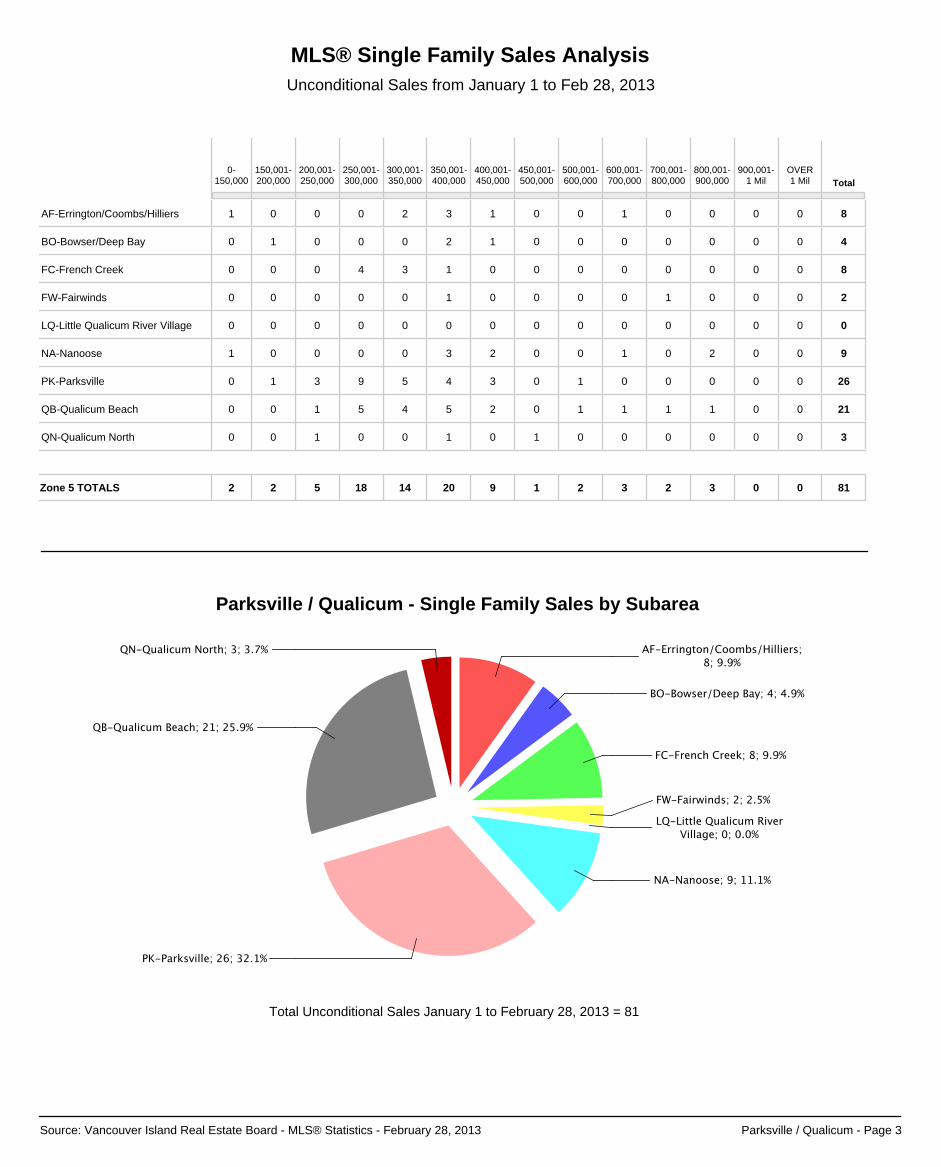
MLS® Single Family Sales AnalysisUnconditional Sales from January 1 to Feb 28, 2013
0-150,000
150,001-200,000
250,001-300,000
300,001-350,000
350,001-400,000
400,001-450,000
450,001-500,000
500,001-600,000
600,001-700,000
700,001-800,000
800,001-900,000
900,001-1 Mil
OVER1 Mil Total
200,001-250,000
8AF-Errington/Coombs/Hilliers 1 0 0 0 2 3 1 0 0 1 0 0 0 0
4BO-Bowser/Deep Bay 0 1 0 0 0 2 1 0 0 0 0 0 0 0
8FC-French Creek 0 0 0 4 3 1 0 0 0 0 0 0 0 0
2FW-Fairwinds 0 0 0 0 0 1 0 0 0 0 1 0 0 0
0LQ-Little Qualicum River Village 0 0 0 0 0 0 0 0 0 0 0 0 0 0
9NA-Nanoose 1 0 0 0 0 3 2 0 0 1 0 2 0 0
26PK-Parksville 0 1 3 9 5 4 3 0 1 0 0 0 0 0
21QB-Qualicum Beach 0 0 1 5 4 5 2 0 1 1 1 1 0 0
3QN-Qualicum North 0 0 1 0 0 1 0 1 0 0 0 0 0 0
Zone 5 TOTALS 8114 20 9 1 2 3 2 3 0 018522
Total Unconditional Sales January 1 to February 28, 2013 = 81
Parksville / Qualicum - Single Family Sales by Subarea
Source: Vancouver Island Real Estate Board - MLS® Statistics - February 28, 2013 Parksville / Qualicum - Page 3