Embed Size (px)
Citation preview

Market structure, liberalizationand performance in the Malawian
banking industry
By
Ephraim W. T. ChirwaDepartment of Economics
University of Malawi
AERC Research Paper 108African Economic Research Consortium, Nairobi
July 2001

© 2001, African Economic Research Consortium.
Published by: The African Economic Research ConsortiumP.O. Box 62882Nairobi, Kenya
Printed by: The Regal Press Kenya, Ltd.P.O. Box 46116Nairobi, Kenya
ISBN 9966-944-41-9

Table of contentsList of tablesList of figuresAbstractAcknowledgements
1. Introduction 1
2. Overview of the banking system in Malawi 4
3. Literature review 11
4. Methodology and data 19
5 Empirical results 22
6. Concluding remarks 37
Notes 40References 42AppendixesA. Portfolio approach of the banking firm 46B. Bank deposits and advances 49C. Variables used in the regression model

List of tables
1. Structure of deposits in the banking system, 1970–1994,in millions of Kwacha 5
2. Current share holding position in the banking system by 1994 73. Changes in the liquidity reserve requirement in percentages 84. Indicators of macroeconomic stability, 1970–1994,
in percentages 105. Changes in financial deepening and savings mobilization,
in percentages 236. Interest rates and intermediation margins, 1970–1994,
in percentages 247. Changes in interest rates and intermediation margins
in percentages 258. Intermediation: Changes in asset structure and sectoral
allocation of credit in percentages 289. Correlation analysis: Sectoral shift in commercial bank credit
(loans and advances) and profitability 2810. Changes in market structure and profitability in percentages 3111. Summary statistics of variables in regression analysis 3312. Regression results: Determinants of commercial bank profitability 3413. Computed elasticities from significant variables 35

List of figures
1. Distribution of domestic credit between private andpublic sector, 1970–1994 26
2. Commercial banks’ loans and advances by economicactivity, 1970–1994 26
3. Trend in market structure: Indexes of marketconcentration, 1970–1994 30
4. Return on assets for dominant commercial banks (percent) 32
5. Return on capital and equity for dominant commercial banks (percent) 32

Abstract
Financial sector reforms in Malawi began in the late 1980s as a continuation of structuraladjustment programmes sponsored by the International Monetary Fund and the WorldBank. Prior to liberalization, the financial system was highly repressed, with heavygovernment intervention in the banking sector through credit and interest rate controls.Furthermore, the banking sector was highly oligopolistic: two banks dominatedcommercial banking activities. Financial sector reforms led to the removal of creditceilings and interest rate controls and opened the banking system to new competition.This study examines the effect of financial sector reforms on market structure, financialintermediation, savings mobilization and commercial bank profitability in the Malawianbanking industry. The evidence in this study shows that some signs of financial repressionstill exist, although some positive developments have taken place. The results show thatfinancial liberalization has significantly increased financial depth and savings mobilization,increased credit to the manufacturing sector, and reduced the monopoly power in theMalawian banking system. However, real interest rates have fallen, intermediation marginshave increased, credit to the public sector has increased and that to the private sector hasfallen. Using the market structure–performance hypothesis, the study finds a significantrelationship between monopoly power and commercial bank profitability, but rejects theefficient market hypothesis. Thus, although interest rates were under control for most ofthe study period, other bank services that generate income for commercial banks weresubject to monopoly power abuse.

Acknowledgements
I would like to thank the African Economic Research Consortium (AERC) for fundingthis research project. I am also grateful to a number of people who provided commentsand guidance at the various AERC Biannual Research Workshops, particularly resourcepersons and fellow researchers. Specifically, I thank professors Ibrahim Elbadawi, PaulCollier, Machiko Nissanke, Chris Adam and Ernest Aryeetey, and anonymous AERCreferees for their tireless efforts in shaping the study. Nonetheless, I am solely responsiblefor any errors and omissions in this study.

MARKET STRUCTURE, LIBERALIZATION AND PERFORMANCE IN THE MALAWIAN BANKING INDUSTRY 1
1. Introduction
Background to the study
Traditionally banks have been heavily regulated by the monetary authorities. On theone hand, such regulation led financial markets in most developing countries,
especially in the 1970s and early 1980s, to be characterized by financial repression. InMalawi, as in most less developed countries (LDCs), the financial system was highlyrepressed, characterized by heavy regulation through credit and interest rate controlsuntil the late 1980s. This had negated the vital role the banking sector plays in economicdevelopment and growth. Government interventions in the financial system have beenthe basis of the McKinnon–Shaw hypothesis of financial repression in developingcountries (McKinnon, 1973; Shaw, 1973). It is argued that for sustainable growth, thebanking sector has to be effective and efficient to respond favourably to the needs of theproductive sectors of the economy. With the adoption of structural adjustment programmesin 1981, the Malawi Government embarked on financial liberalization that among otherthings led to the removal of restrictions on credit and interest rates charged by commercialbanks.
On the other hand, government intervention and regulation in the financial sectoralso created highly concentrated market structures in the banking industry, leading tomonopolistic or oligopolistic market structures. Economic theory predicts different welfareoutcomes for different market structures through firms’ price and non-price behaviours.The market structure–conduct–performance (SCP) hypothesis has been a basis foranalysing firm behaviour or performance given the structure of the market. Accordingto the SCP hypothesis market structure influences conduct (behaviour) of firms throughfor instance pricing and investment policies, and this in turn translates into performance.The definitive theoretical implication of the SCP hypothesis is that in concentrated marketsprices will be less favourable to consumers because of the noncompetitive behaviourthat arises in such markets. This hypothesis is a tool of analysis in industrial businessbehaviour, and is also applied in the banking sector especially in the developed countries.1
Until recently, the Malawian banking industry has been oligopolistic. At independencein 1964, two foreign commercial banks dominated the banking industry (Standard Bankand Barclays Bank), with the New Building Society (NBS), National Finance Company(NFC) and the Post Office Savings Bank (POSB) providing fringe competition. In 1971,the activities of Standard Bank and Barclays Bank were transferred to National Bank ofMalawi (NBM), effectively creating a monopoly situation for NBM. In 1969 the

2 RESEARCH PAPER 108
Commercial Bank of Malawi (CBM) was incorporated; it started operations in 1970providing fringe competition to National Bank of Malawi and offering similar commercialbanking facilities. The late 1980s and 1990s witnessed moderate entry into commercialbanking services by non-bank financial institutions. In 1987, Leasing and FinanceCompany of Malawi (LFC) was incorporated offering financial leases. In the 1990s thefinancial system opened up to entry. New banking institutions were incorporated such asINDEFinance, Finance Company of Malawi (FINCOM), First Merchant Bank (FMB)and Malawi Finance Bank (MFB). The POSB was incorporated into Malawi SavingsBank. Despite the changes, however, the two established commercial banks still dominatethe banking industry.
Justification and objectives of the study
There are numerous studies in developing countries on the structure of the financialsystem (both formal and informal), and its role in savings mobilization and
intermediation (Soyibo and Adekanye, 1992a, 1992b; Mrak, 1989; Fischer, 1989; Civelekand Al-Alami, 1991; Seck and El Nil, 1993; Agu, 1992). In Malawi, there have beenother studies undertaken that have also focused on savings mobilization and monetarypolicy including those by Chipeta and Mkandawire (1991, 1992) and Silumbu (1990).Chipeta and Mkandawire focused on the role of the informal sector and the link thatexists between the informal and formal/semi-formal sectors. Because of the lack ofeffective competition, however, the banking industry in Malawi has been characterizedby limited financial facilities, interlocking directorship and oligopolistic interdependence(MCCI, 1990; MDC and ERL, 1989). The latter problem has not been adequatelyinvestigated. This study notes the absence of empirical inquiry into the effects of marketstructure on the performance of the banking industry in Malawi, and attempts to providesuch missing empirical evidence. The concentration of bank deposits in a few commercialbanks is likely to have policy implications for the direction of reform in the financialsector. If there is evidence of a positive relationship between market structure andprofitability in the Malawian banking market, this would imply that regulatory policiesshould aim at changing market structure to increase competition or quality of bankservices.
The specific research problem being investigated by the study is the relevance ofmarket structure and behavioural elements to bank profitability, and the effect of financialreforms on savings mobilization and financial intermediation in the Malawian bankingindustry. The study in particular assesses whether competitive banking matters for thevibrancy of the financial system. The study has four specific objectives. First, to assessthe impact of financial sector reform on structural and policy variables in the Malawianbanking system. Second, to analyse the effects of liberalization measures on savings andintermediation. Third, to examine the effect of bank concentration on the profitabilityperformance. Finally, to make recommendations based on the study, focusing on areasof reform in the banking industry, that the authorities have to target in future.
MARKET STRUCTURE, LIBERALIZATION AND PERFORMANCE IN THE MALAWIAN BANKING INDUSTRY 3
Testable hypotheses
Proponents of financial liberalization argue that financial sector reforms that eliminatedirect government intervention in the financial system are expected to lead to financial
deepening (therefore increased savings mobilization); improved efficiency of the financialsystem resulting in lower intermediation margins; and increases in the flow of fundsbetween various segments of the financial system. Reforms are also expected to yieldgreater access to finance for hitherto marginalized borrowers, and a diminishing role ofthe informal financial sector (Aryeetey et al., 1997). Thus, with liberalization severalpolicy variables are expected to change, such as the interest rate structure, the structureof assets and liabilities, investment decisions by banks, and the cost structure. However,some of these policy variables can be influenced by the degree of competition in thefinancial sector. Proponents of competition policy have used the SCP framework to testwhether structural and behavioural characteristics of banks have some influence on bankprofitability. The SCP hypothesis predicts that market concentration lowers the cost ofcollusion between firms and results in higher than normal profits for all market participants(Evanoff and Fortier, 1988; Smirlock, 1985; Gilbert, 1984). However, following Demsetz(1973) and Peltzman (1977) there is a competing efficient market hypothesis that arguesthat an industry’s structure may exist as a result of superior efficiency in production byparticular firms, therefore obtaining larger market shares. Smirlock (1985) argued thatfirms possessing a comparative advantage in production become large and obtain a highmarket share and, as a result, the market becomes more concentrated. The efficientmarket hypothesis involves testing the relationship that exists between market share andfirm’s profitability.
The study intends to test the following hypotheses:
a) Savings mobilization and intermediation have increased as a result of financial sectorreforms.
b) Financial sector reforms have led to declining intermediation margins in the bankingindustry.
c) The composition of performing assets has changed in favour of the previouslyneglected sectors of the economy.
d) Deregulation of the banking industry, through changes in entry conditions and relatedfinancial reforms, has led to a decrease in monopoly power of banks.
e) Bank concentration has led to higher profitability of dominant firms in the bankingsector.

4 RESEARCH PAPER 108
2. Overview of the banking system in Malawi
Structural characteristics
The banking system in Malawi is segmented into the formal, semi-formal and informalsectors. This segmentation is large, but direct and indirect deposit links exist (Chipeta
and Mkandawire, 1992). In the formal sector there are a few players with branch networksconfined mostly to urban and semi-urban areas. As a result, the bulk of the 89% of thepopulation that is rural makes very little use of the formal banking sector. This locationproblem has led to the development of the semi-formal sector in the form of cooperativesavings associations and savings and credit associations. In addition, the informal bankingsector has proved vital for the rural population.2 Surveys by MCCI (1992) and WorldBank (1989, 1991) indicated that the financial sector in Malawi specializes in short-termcredit as opposed to the long-term loans that are necessary for industrial development.As Chipeta and Mkandawire (1996) argue, the commercial banking subsector has fortoo long focused on short-term lending that historically has largely targeted the foreigntrade sector and large enterprises, leaving a persistent unsatisfied demand for medium-term and long-term capital finance for both large-and small-scale enterprises. Becauseof structural adjustment programmes that incorporated financial sector reforms in 1988,however, many structural changes have since taken place in the financial sector.
Structure of the banking system
The Banking Act of 1989 distinguishes banking business from financial institutions.Banking business involves receiving funds from the public by accepting demand,
time and saving deposits or borrowing from the public or other banks, and using suchfunds in whole or in part for granting loans, advances and credit facilities and for investingfunds by other means. Financial institutions are institutions whose regular business consistsof granting loans, advances and credit facilities, and investing funds by other means, andwhose business is financed by own or borrowed funds or with funds not acquired byaccepting or soliciting deposits from the public. The financial institutions in Malawiinclude formal development finance institutions—Malawi Development Corporation(MDC) and Investment Development Bank (INDEBank)—and semi-formal developmentfinance institutions—Investment and Development Fund (INDEFund), Small EnterpriseDevelopment Organization of Malawi (SEDOM), Malawi Union of Savings and CreditCooperatives (MUSCO) and Malawi Rural Finance Company (MRFC) (see Chipeta and

MARKET STRUCTURE, LIBERALIZATION AND PERFORMANCE IN THE MALAWIAN BANKING INDUSTRY 5
Mkandawire, 1996). This study concentrates on the banking industry, including savingsbanks, and we can divide the formal banking system in Malawi into five markets:commercial banks, corporate banks, leasing finance, savings banks and building societies.These form the core of the financial system in Malawi. We will call noncommercialbank institutions non-bank financial institutions (NBFIs). Table 1 shows the distributionof deposits by type of bank in selected years. The data reveal that the commercial banksaccount for most of the deposits in the banking system; the dominance is quite apparentin the 1970s but falls in the 1980s and 1990s.
Table 1: Structure of deposits in Malawi's banking system, 1970–1994, in millions of kwacha
Category 1970–79 1980–89 1990–94
Value Share Value Share Value Share(%) (%) (%)
Commercial banks 85.8 84.1 377.0 79.1 1347.9 73.8Corporate banks - - - - 75.2 4.1Lease finance 0.4 0.4 9.0 1.9 124.8 6.8Savings banks 10.9 10.7 66.7 14.0 123.0 6.7Building societies 4.9 4.8 24.2 5.1 156.3 8.6
Source:RBM (various) Financial and Economic Review and Bank’s Annual Reports and Accounts (various)
Commercial banks. There are four commercial banks in Malawi. These banks acceptdeposits including checking accounts and offer credit services to both individuals andcompanies. Before 1995 two commercial banks operated in Malawi, the National Bankof Malawi, incorporated in 1971, and Commercial Bank of Malawi, founded in 1969.These banks offer traditional banking services including checking accounts, whichdistinguishes them from any other bank in Malawi. The two banks dominated commercialbanking and current account services until the First Merchant Bank in 1994 and theFinance Bank joined them in 1996. The new Banking Act of 1989 makes provision forlicensing additional commercial banks to foster competition in the financial sector.
Corporate banks. Corporate banks accept deposits only from corporate investors andinstitutions, with emphasis on time deposits. These banks have emerged as a result ofchanges in the Banking Act in 1989. The corporate banking sector comprises FinanceCompany of Malawi and INDEFinance, founded in 1991 and 1992, respectively. Thesebanks are registered under the Banking Act of 1989 and have provided additionalcompetition in the banking system.
Lease finance companies. Lease finance companies accept corporate deposits and providefinancial leases to companies. Currently, there are three leasing companies in Malawi:National Finance Company, Leasing and Finance Company, and CBM Financial ServicesLimited. National Finance Company (formerly National Mercantile Credit) is the oldest;it was established in 1958 and was the sole lease finance company operating in Malawi

6 RESEARCH PAPER 108
until the establishment of Leasing and Finance Company of Malawi in 1986 and CBMFinancial Services in 1992 as part of CBM diversification. The lending portfolio oflease finance companies is concentrated in financial leases to the transport sector. Theactivities of lease finance companies provided competition to commercial banks,especially in corporate financial facilities.
Savings banks. Savings banks mostly accept time and savings deposits from individualsand companies. The only savings bank is the Post Office Savings Bank (POSB),established in 1911 to provide facilities for small savers in both rural and urban areas.The POSB operated as a government department. The POSB has been vital in mobilizingsavings in the rural areas through its 300 outlets. POSB did not have a lending mandateand as a result most of its funds were invested in local registered stocks. However, in1990 the POSB was incorporated into a government company as Malawi Savings Bankand preparations are under way for offering normal banking activities including extensionof credit to the private sector.
Building societies. The New Building Society (NBS), established in 1964, is Malawi'sonly building society. Its main activity is to provide loans for commercial buildings andresidential housing. The NBS also accepts savings and time deposits and offers short-term private loans in addition to its lending activities to finance private dwellings andcommercial buildings. With innovativeness and improved quality in delivery of services,the NBS has attracted many more savers and has actively competed for savings with thetwo dominant commercial banks. Recently, commercial banks raised the minimum balanceon savings accounts to K500 but the NBS kept its minimum savings balance at K100.The NBS has capitalized on this development as most small investors closed their accountswith commercial banks. In addition, the computerization of deposit and withdrawaltransactions, tax-free accounts, and the ease in getting a line of credit against depositshave attracted many savers to NBS.
Ownership structure
Ownership structure in the banking industry in Malawi is also highly concentrated,with most banks being controlled by a small number of international, domestic
agricultural and industrial conglomerates with interlocking ownership across the economy.Table 2 presents the distribution of ownership in selected financial institutions in Malawi.ADMARC and Press Corporation own 87.43% of shares in National Bank of Malawi,while Press and MDC own 70% of Commercial Bank of Malawi. Such interlockingownership is likely to facilitate collusive pricing arrangements in the financial sectorand create credit bias towards subsidiaries of shareholders. In Malawi, it has resulted inidentical prices of major services for the two commercial banks, even since liberalization,suggesting scope for elements of collusion or interdependent behaviour. Furthermore,the government and parastatals are also dominant shareholders in the banking system. Itis, as well, interesting to note that there is a considerable degree of ownership in the
MARKET STRUCTURE, LIBERALIZATION AND PERFORMANCE IN THE MALAWIAN BANKING INDUSTRY 7
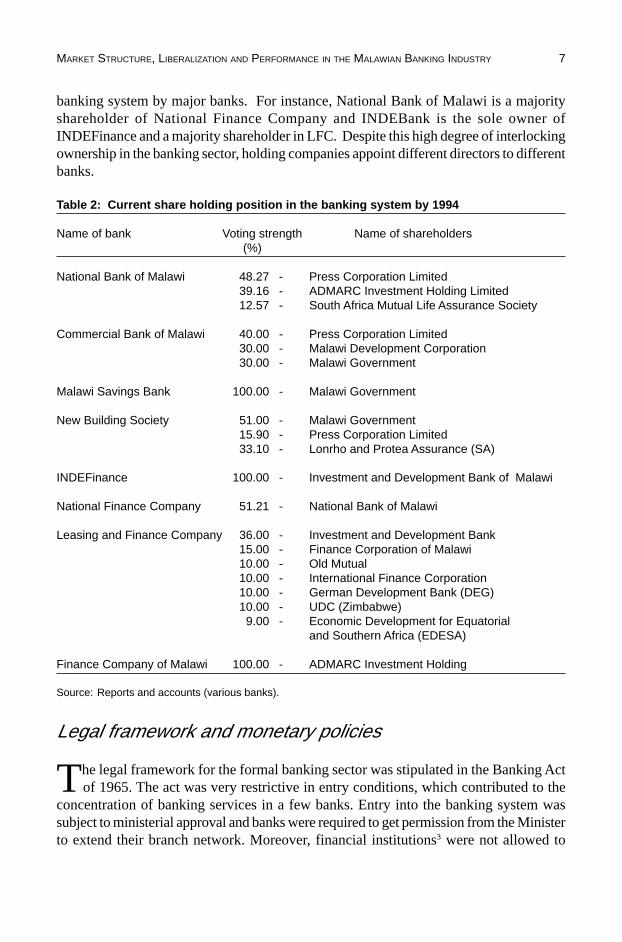
banking system by major banks. For instance, National Bank of Malawi is a majorityshareholder of National Finance Company and INDEBank is the sole owner ofINDEFinance and a majority shareholder in LFC. Despite this high degree of interlockingownership in the banking sector, holding companies appoint different directors to differentbanks.
Table 2: Current share holding position in the banking system by 1994
Name of bank Voting strength Name of shareholders(%)
National Bank of Malawi 48.27 - Press Corporation Limited39.16 - ADMARC Investment Holding Limited12.57 - South Africa Mutual Life Assurance Society
Commercial Bank of Malawi 40.00 - Press Corporation Limited30.00 - Malawi Development Corporation30.00 - Malawi Government
Malawi Savings Bank 100.00 - Malawi Government
New Building Society 51.00 - Malawi Government15.90 - Press Corporation Limited33.10 - Lonrho and Protea Assurance (SA)
INDEFinance 100.00 - Investment and Development Bank of Malawi
National Finance Company 51.21 - National Bank of Malawi
Leasing and Finance Company 36.00 - Investment and Development Bank15.00 - Finance Corporation of Malawi10.00 - Old Mutual10.00 - International Finance Corporation10.00 - German Development Bank (DEG)10.00 - UDC (Zimbabwe)
9.00 - Economic Development for Equatorialand Southern Africa (EDESA)
Finance Company of Malawi 100.00 - ADMARC Investment Holding
Source: Reports and accounts (various banks).
Legal framework and monetary policies
The legal framework for the formal banking sector was stipulated in the Banking Actof 1965. The act was very restrictive in entry conditions, which contributed to the
concentration of banking services in a few banks. Entry into the banking system wassubject to ministerial approval and banks were required to get permission from the Ministerto extend their branch network. Moreover, financial institutions3 were not allowed to

8 RESEARCH PAPER 108
have liabilities of more than ten times their paid-up capital. The Banking Act of 1965also stipulated that as a financial requirement for entry, commercial banks were supposedto have a minimum paid-up capital of K500,000, discount houses a minimum paid-upcapital of K200,000 and financial institutions a minimum paid-up capital of K100,000.
There were government interventions in the financial sector prior to liberalization.Monetary policy was characterized by control of interest rates and imposition of creditceilings on the commercial banks, which in turn led to credit rationing. The system ofintervention was such that the Reserve Bank of Malawi administered the interest ratestructure that set deposit rates while financial institutions set lending rates within aprescribed range. In addition, the Reserve Bank also prescribed preferential rates forlending to the agricultural sector at 2% less than the base lending rate.
Financial sector reforms in Malawi
The financial reform programme was initiated in 1987 as part of structural adjustment.Liberalization of the financial sector started with the liberalization of lending rates
in 1987. This was followed by deregulation of deposit rates in 1988 (Mamba, 1996).However, the Reserve Bank of Malawi actively uses the discount rate to influence thedirection of changes in the interest rate structure. The government maintained preferentiallending to the agricultural sector. In 1988, the monetary authorities abandoned creditceilings and credit rationing. The liquidity reserve requirement (LRR) was enforced at10% of commercial bank liabilities as a market instrument by the Reserve Bank tomoderate credit and money supply. The Reserve Bank paid interest on commercial bankreserves held as reserve requirements. Several adjustments have occurred and the ReserveBank adjusted the reserve requirement five times in 1990 as shown in Table 3. Due tofinancial liberalization, financial institutions are free to set their own prices guided bythe central bank discount rate (but they require no consultation with Reserve Bank) andgrant credit based on their risk management techniques.4
Table 3: Changes in the liquidity reserve requirement in percentages
Effective Date Liquidity reserve requirement
1 June 1989 102 January 1990 2515 May 1990 151 June 1990 101 September 1990 201 December 19901 201 August 1991 1523 December 1992 207 June 1993 2029 October 1993 30December 1994 35
Note: 1. The liquidity reserve requirement ceased to earn interest.Source: Ganiza (1995); Reserve Bank Financial and Economic Review (various issues); commercial banks’
annual reports and accounts (various issues).

MARKET STRUCTURE, LIBERALIZATION AND PERFORMANCE IN THE MALAWIAN BANKING INDUSTRY 9
In 1989, the government made changes to the Reserve Bank Act of 1965 and theBanking Act of 1965 and enacted the Reserve Bank Act of 1989 and Banking Act of1989. The Reserve Bank Act of 1989 broadened the powers and mandates of the centralbank. It gave due recognition to the market mechanism and empowered the central bankto supervise financial institutions while pursuing monetary policy by using market-basedinstruments (Malawi Government, 1989). In addition, the Reserve Bank of Malawi wasgiven the task of promoting the money and capital market in Malawi.
The Banking Act of 1989 aimed at creating an environment that would enhancecompetition in savings mobilization and intermediation. It opened the financial systemto new entries, specifying moderate entry requirements. The powers to regulate entrywere given to the Reserve Bank of Malawi, with the Minister endorsing recommendationsfrom the Reserve Bank and reasons for denial of entry clearly stipulated in the new act.The government changed the financial requirement of entry to K2 million for commercialbanks and K250,000 for financial institutions,5 with a provision for exceptions. Thesechanges immediately led to entry of three existing financial institutions, Leasing andFinance Company, Finance Corporation of Malawi and INDEBank, to commercialbanking activities and these were granted commercial banking licences. By the end of1995 another four new entrants had been granted commercial banking licences: CBMFinancial Services in the form of Commercial Bank of Malawi diversification in 1991,INDEFinance in 1991, First Merchant Bank of Malawi in 1994 and Finance Bank(Malawi) Limited in 1995. The entry of new firms is expected to bring efficiency gainsin the financial sector by reducing the monopoly power of the dominant commercialbanks.
The government abandoned the preferential treatment to agricultural sector lendingin 1990. In the same year, reserve requirements of commercial banks at Reserve Bankceased to earn interest (Ganiza, 1995; Mamba, 1996). In 1990 the Reserve Bank of Malawialso introduced the marketing of its own bills to mop up excess liquidity from the public.Since then the Reserve Bank has actively used open market operations. Although themajor players have been the commercial banks and other financial institutions, the financialinstitutions dominate the market for treasury bills and local registered stock. The bankingsystem in Malawi holds 77.99% and 58.7% of treasury bills and local registered stocks,respectively.
In order to force commercial banks to comply with the liquidity reserve requirement,an 18% penalty fee on shortfalls was introduced in 1992. The Reserve Bank adjusts thepenalty fee in line with the discount rate. For instance, in 1995 they adjusted the penaltyfor noncompliance with liquidity reserve requirement from 45% to 55% in April and to60% in June.
It is also important to note that the government implemented these financial reformswithin a very unstable macroeconomic environment characterized by high rates of inflationlargely due to structural rigidities of the economy and devaluation of currency, largebudget deficits and increased government borrowing from the banking sector, and balanceof payments instability. Table 4 shows the trend in some of the macroeconomic andpolicy variables since 1970. We can observe that inflation remained high and unstableeven after liberalization. Fiscal deficits as a share of gross domestic product averaged

10 RESEARCH PAPER 108
6.9% between 1970 and 1994. Before financial reforms were introduced in 1987, theshare of fiscal deficits to gross domestic product was 8.3%, the highest level being in1980 when it reached 15.9%. There has been a declining trend, though not systematic, inthe share of the fiscal deficit since liberalization. The fiscal deficit has averaged 4.1% inthe period after liberalization. The growth of real gross domestic product has also beenerratic, with large declines in the period after liberalization. The share of public sectorcredit in the banking system followed a declining trend from 1987, but there was a reversalin 1993. This was a result of the suspension of donor aid to Malawi, and most of thebudgetary requirements during this period (1993/94) were financed using domesticresources.
Table 4: Indicators of macroeconomic stability, 1970–1994 in percentages
Year Inflation Fiscal surplus Public sector Growth in real(Deficit)/GDP share of credit GDP
1970 7.94 -9.5 7.91 -1971 8.09 -7.4 8.52 25.071972 3.63 -5.6 21.51 7.501973 5.25 -5.0 25.63 12.351974 15.38 -6.4 29.52 7.441975 15.50 -9.2 46.41 5.531976 4.37 -6.1 45.90 6.221977 4.19 -6.3 33.52 4.341978 8.61 -9.3 33.26 8.231979 10.96 -9.1 34.16 3.541980 19.05 -15.9 41.30 -1.131981 10.40 -12.4 51.82 -4.701982 8.70 -7.6 53.53 2.831983 13.50 -7.1 52.12 3.531984 11.01 -5.2 58.11 4.451985 14.95 -8.4 65.62 4.461986 14.90 -9.9 68.63 1.091987 26.64 -8.6 72.48 2.251988 31.36 -6.0 54.86 3.291989 15.74 -4.2 46.45 4.061990 11.39 -3.1 19.65 4.771991 8.12 -5.0 19.11 7.791992 23.29 -3.8 43.74 -7.921993 22.79 -1.0 56.58 10.701994 34.62 -1.3 54.17 -11.52
Note: Financial reforms began in 1987Source:IMF (various), International Financial Statistics; RBM (various), Financial and Economic Review.

MARKET STRUCTURE, LIBERALIZATION AND PERFORMANCE IN THE MALAWIAN BANKING INDUSTRY 11
3. Literature review
Financial repression and financial liberalization
The financial sector is vital in facilitating economic growth and development.According to the exponents of financial repression (McKinnon, 1973; Shaw, 1973),
financial liberalization can foster economic growth. They argue that the financial sectorof the economy matters in economic development as it assists in the breakaway fromrepetition of repressed economic performance to accelerated growth of the economy(Shaw, 1973). The McKinnon–Shaw hypothesis postulates that government interventionsin various forms in less developed countries lead to financial repression. The economiesin these countries have been characterized by control of interest rates, imposition ofcredit ceilings, use of credit rationing, high levels of inflation and high public sectordeficits. These policies have meant that finance in these countries has been shallowcompared with national income or financial wealth. The interest rates on deposits havebeen low and negative and savings have been confined to a narrow range of financialinstruments. Government control of interest rates on loans and deposits tends to raisethe demand for and curtail the supply of funds. According to Aryeetey et al. (1997)unsatisfied demand for investible funds forces financial intermediaries to ration creditby means other than the interest rate while the informal market develops at uncontrolledrates.
Financial repression has also led to large differentials between deposit and lendingrates of interest (Shaw, 1973). There is also a tendency for the monetary authorities to sethigh reserve requirements in less developed countries. As Seck and El Nil (1993) argue,the high spread between lending and deposit rates can be viewed as an implicit tax throughhigh reserve requirements on the banking sector by the monetary authorities. Arguably,the legal liquidity reserves form a sizeable loanable fund that the financial institutionscould use to expand the size of their loan portfolio. It is likely that such high liquidityreserve requirements encourage crowding out of the private sector, and provide thegovernment with a buffer of resources to finance deficits (Gibson and Tsakalotos, 1994).In a study of nine African countries, Seck and El Nil (1993) observed that financialrepression was prevalent. Real interest rates were virtually negative and high inflationrates and large fiscal deficits characterized the economies. The intermediation marginswere twice those of the high income developing countries and industrial countries.Liquidity reserve requirements were in the order of 20–25%, about five times the averagefor industrial countries. Aryeetey et al. (1997) observe similar characteristics of financialrepression and fragmentation of the financial markets in Ghana, Malawi, Nigeria andTanzania.

12 RESEARCH PAPER 108
The role of an efficient banking system in economic growth and development lies insavings mobilization and intermediation. Banks, as financial intermediaries, channel fundsfrom surplus economic units to deficit units to facilitate trade and capital formation (Soyiboand Adekanye, 1992a). As Ncube and Senbet (1994) argued, an efficient financial systemis critical not only for domestic capital mobilization but also as a vehicle for gainingcompetitive advantage in the global markets for capital. For the financial system to beefficient, it must pay depositors favourable rates of interest and should charge borrowersfavourable rates of interest on loans. The financial intermediation activity in bankinginvolves screening borrowers and monitoring their activities, and these enhance efficiencyof resource use (Ncube and Senbet, 1994). The authors argue that small investors(depositors) who face costly contracting and asymmetric and imperfect informationappoint large financial institutions as delegated monitors in the intermediation process.These financial institutions receive large amounts of information from borrowers onwhich they base the decision to extend a line of credit to industry. It is within the efficientfinancial system argument that the Mckinnon–Shaw hypothesis of financial liberalizationhas been popularized. In essence, there have been many studies on the role of the realinterest rates in savings mobilization that have supported the positive relationship betweenreal interest rates and domestic savings. However, as Seck and El Nil (1993), Gibson andTsakalotos (1994), and Gonzales Arrieta (1988) note, most studies have mixed theempirical evidence, and the empirical tests have failed to lend support to the financialrepression hypothesis.
Given the financial characterization of developing economies, financial liberalizationis expected to generate positive gains to the economies if implemented properly. Seckand El Nil (1993) concluded that African countries stand to gain from financialliberalization because real deposit rates were found to have a positive impact on financialsavings, which in turn affects the level of investment positively. However, the design offinancial sector reforms is also important. As Nissanke (1994) argues, liberalizationprogrammes need to be realistic about the speed and sequencing of financial reforms.Furthermore, for financial liberalization to be successful there should be macroeconomicstability and adequate prudential supervision and regulation of banks. Gibson andTsakalotos (1994) note that the difficulties faced by many countries in liberalizing theirfinancial markets go beyond simply problems of macroeconomic stability. Financialmarkets are characterized by severe market failures that can lead to a case for governmentintervention. Diaz-Alejando (1985) argues that liberalization can lead to instability andquestions the ability of financial markets to allocate credit efficiently. Gibson andTsakalotos (1994) note that the experience with financial instability in many developingcountries suggests that liberalization promotes instability. They also argue that the conceptof financial repression used in the literature appears too broad, encompassing both positiveand negative aspects of government interventions in the financial markets that may maskthe need for institutional development.
In any case, financial liberalization is expected to generate several benefits that buildthe impetus for economic growth and development in developing countries.6 First,financial sector reforms are expected to lead to financial deepening, hence the stock offinancial assets relative to income is expected to increase with liberalization. Second,

MARKET STRUCTURE, LIBERALIZATION AND PERFORMANCE IN THE MALAWIAN BANKING INDUSTRY 13
the intermediation margins of the banking sector are expected to diminish withliberalization. Gibson and Tsakalotos (1994) note that competitive pressures that resultfrom conditions of free entry and competitive pricing will raise the functional efficiencyof intermediation by decreasing the spread between deposit and lending rates.7 Seck andEl Nil (1993) assert that financial liberalization may not help reduce interest spreads inAfrican countries if the reduction in reserve requirements and deregulation of the bankingsector are not coupled with the increase in competition in the sector. Third, liberalizationopens the way to superior allocation of savings by widening and diversifying the financialmarkets on which investment opportunities compete for savings flow. The market forsavings is extended in terms of scale, maturity and risk, and information for comparisonsof alternative facilities becomes available more cheaply (Shaw, 1973). Fourth, localcapital markets can be integrated into a common market, and new opportunities for poolingsavings and specialization in investment are created in the economy. Aryeetey et al.(1997) note that in this context, financial liberalization is expected to lead to thediminishing role of the informal financial sector.
Studies in Africa have shown that liberalization of the financial sector has proceededwith limited success. Seck and El Nil (1993) concluded that financial repression in Africancountries is likely to persist because governments have the incentive to perpetuate itgiven the incidence of high inflation, large budget deficits and limited access to foreigncapital. Thus, African countries are likely to face problems in getting their economiesout of the financial repression web because of high inflation rates that justify banks’ highintermediation margins, implicit tax that the government extracts from the banking systemthrough enforcement of below market rates, and high liquidity reserve requirements tohelp them finance often large deficits. Aryeetey et al. (1997) concluded that fragmentationof financial markets in Ghana, Malawi, Nigeria and Tanzania persisted several yearsafter initiation of financial sector reforms. The reasons attributed to this limited successinclude the fact that reform measures have mostly been incomplete and have not beenaccompanied by complementary measures to address underlying institutional andstructural constraints.
Market power and bank performance
The banking firm and structure–performance hypothesis
We can view a financial institution as a microeconomic firm that attempts to maximizean objective function in terminal wealth, where the bank firm uses quantity and/or
price variables such as asset quantities or prices as control variables (Santomore, 1984).However, according to Clark (1986) there are numerous models of the banking firm thatdeal with specific aspects of bank behaviour, but no single model is acceptable asdescriptive of all bank behaviour although the portfolio theory approach has played animportant role.8 In the portfolio choice models, banks seek to maximize profits definedby a feasible set of assets and liabilities with interest rates set by the bank and per unit

14 RESEARCH PAPER 108
costs incurred by the bank of producing each component of assets and liabilities. Thesebank models have incorporated various aspects of the competitive process and scaleeconomies.9 The basic portfolio model following Clark (1986) is presented in AppendixA.
The relationship between profitability and market structure has generated twocompeting hypotheses. On the one hand, the traditional market structure–conduct–performance (SCP) or collusion hypothesis (following Bain, 1951) postulates that marketstructure influences conduct (behaviour) of firms through, for instance, pricing andinvestment policies, and this in turn translates into performance. The definitive theoreticalimplication of the SCP hypothesis is that in concentrated markets prices will be lessfavourable to consumers because of noncompetitive behaviour that arises in such markets.On the other hand, the efficient market hypothesis following Demsetz (1973) and Peltzman(1977) postulates that market concentration is a result of firms’ superior efficiency, whichleads to larger market share and profitability. Several authors have tested these twohypotheses in various studies of the banking industry, but results are generally mixed(see Gilbert, 1984; Smirlock, 1985; Evanoff and Fortier, 1988; Clark, 1986; Molyneuxand Forbes, 1995; Maudos, 1998).
The traditional paradigm of assessing the effect of market power and performancehas been the structure–conduct–performance (SCP) model. This model assumes thatcertain market structures are conducive to monopolistic conduct, and this conduct enablesfirms to raise prices above costs thereby making abnormal profits. Therefore, the linkbetween market structure and profitability is through firms’ pricing behaviour. In perfectlycompetitive markets where firms face a perfectly elastic demand, theoretically the modelpredicts that there will be lower profitability compared with all other markets where thedemand is less elastic (George and Joll, 1971). The model is widely applied in theanalysis of industrial behaviour. Many researchers in the field of industrial economicshave empirically tested this hypothesis using the following specification:
π = f C B D( , , ) (1)
where π is the index of performance (profitability), C is a vector of variables denotingease of collusion, B is the vector of variables representing barriers to entry and D is thevector of demand variables. In his landmark study Bain (1951) found evidence in favourof a positive and significant relationship between concentration and profitability usingUS manufacturing data. Although the SCP hypothesis is widely applied in themanufacturing sector,10 more recently the model has been used in the banking industry.11
Civelek and Al-Alami (1991) rightly note that the banking industry is very important tothe economy and empirical evidence on the SCP relationship can help in governmentregulatory policies and in modifying the environment in which banks operate. Increasedbank concentration, by increasing the cost of credit, has the effect of reducing firms'demand for credit and consequently affects the level of intermediation and retards thegrowth of the economy.
The specification of the SCP model in banking has been based on the various theoriesof the banking firm (Mullineaux, 1978; Gilbert, 1984; Clark, 1986). The structure–

MARKET STRUCTURE, LIBERALIZATION AND PERFORMANCE IN THE MALAWIAN BANKING INDUSTRY 15
performance model is the profit–concentration relationship and postulated as:
πi if CR X= ( , ) (2)
where πis a measure of the profitability of ith bank as measured by the rate of returnon equity (or capital) or rate of return on assets, CR is the banks' index of concentration,and Xi denotes a vector of control variables that are exogenous to the bank and mayaffect prices through market or cost considerations. The empirical evidence in the profit–concentration hypothesis has generated mixed results (see Gilbert, 1984).
The mixed empirical results on the traditional profit–concentration hypothesis haveled to the questioning of the relevance of the structure–performance hypothesis as anexplanation of industrial or banking behaviour. Following Demsetz (1973) and Baumol(1982), alternative hypotheses have been tested as a direct challenge to the SCP hypothesis.Proponents of the efficient market hypothesis (Demsetz, 1973) have argued that marketconcentration is not a random event, but rather the result of firms with superior efficiencyobtaining a large market share. Thus, differences in firm-specific efficiencies withinmarkets create unequal market shares and high levels of concentration. As Molyneuxand Forbes (1995) and Smirlock (1985) note, the hypothesis is the market share–profitability relationship that we specify in the following form:
π = f CR MS X( , , ) (3)
where π is a profit measure, CR is a measure of market structure (a concentrationmeasure), MS is a measure of market share, and X is a vector of control variables thataccount for firm-specific and market-specific characteristics. The significance of marketshare (MS) in Equation 3 would imply support for the efficient structure hypothesis,while the significance of concentration ratio would support the traditional hypothesis.12
Maudos (1998) notes that the market share variable can capture the effects that are unre-lated to efficiency, and directly includes a measure of overall efficiency in Equation 3.
Baumol (1982), in the contestable market theory, raised serious questions about thevalidity of the structure–performance hypothesis. The market is contestable when barriersto entry and exit are not preclusive, such that no outside potential competitors can enterby undercutting the price and still make profits. In this case, there is no basis for assessinga significant value to the market concentration variable in determining profitability. Giventhe contestability of the market, it is possible to have outcomes approximating those ofperfect competition although the number of actual competitors is quite small.
The empirical tests of the competing hypotheses of market structure and efficientmarket have mainly used a single-equation, multiple-regression analysis approach.However, Clark (1986) argues that bank profits might be jointly determined with othervariables, especially where the firms being considered are multi-product in nature. Thisnecessitates the use of a simultaneous equation approach. Some researchers have arguedfor a Quiet Life hypothesis in the banking industry (Nyong, 1990). The Quiet Lifehypothesis states that uncertainty avoidance by large firms varies directly with the degree

16 RESEARCH PAPER 108
of market power that these firms possess. In such cases, banks with substantial marketpower may choose to trade some of their potential monopoly profits for a reduction inrisk by choosing safer portfolios.
Determinants of bank profitability
Several variables are used as determinants of bank profitability in SCP studies in thebanking industry. We can essentially divide bank studies into two groups based on
the variables used to measure bank performance as a dependent variable. On the onehand and in most studies, bank performance is measured by the level of bank profitability.The profitability measures include the rate of return on equity (ROE), rate of return oncapital (ROC) and rate of return on assets (ROA). In most bank studies, emphasis isplaced on measuring profitability in terms of ROC and ROA. Smirlock (1985) notes thatthe use of ROA has provided strongest evidence on the concentration–profitabilityrelationship in banking. Keeton and Matsunaga (1985) assert that ROA is especiallyuseful in measuring changes in bank performance over time since banks’ income andexpense components are more closely related to assets. Several studies of the structure–performance hypothesis in the banking system have used both ROA and ROE (Civelekand Al-Alami, 1991; Agu, 1992) and Smirlock (1985) used all the three measures.13
However, Civelek and Al-Alami (1991) found results based on ROA to be statisticallyvery inferior and justified the relative performance of ROE on the basis that it reflectsthe efforts of managers interested in maximizing shareholders’ wealth. Nonetheless, otherstudies have used ROA as a measure of profitability in testing the SCP hypothesis inbanking (see Molyneux and Forbes, 1995; Evanoff and Fortier, 1988). The basic argumentin favour of profitability measures in banking is that banks are essentially multi-productfirms and the use of profitability measures eliminates problems associated with cross-subsidization between products and services.
On the other hand, other researchers assess performance in terms of bank prices (Bergerand Hannan, 1989; Rose and Fraser, 1976). The justification for use of bank prices (interestrates) has been that the use of the price–concentration relationship instead of the profit–concentration relationship tests the structure performance hypothesis in a way that excludesthe efficient structure hypothesis (Berger and Hannan, 1989). The main argument in theprice–concentration relationship is that high levels of concentration allow fornoncompetitive behaviour that results in lower interest rates offered to depositors and/orhigher lending rates to borrowers. However, Molyneux and Forbes (1995) argued thatprice measures of performance create problems of cross-subsidization for a multi-productfirm. In addition, the use of prices does not take into account the effects of costs (Morris,1984). In any case, whatever the measure of performance, empirical results on thestructure–performance hypothesis are also mixed and the performance of the model inthe banking system is weaker than in manufacturing.14
At the centre of the traditional SCP hypothesis is the argument that marketconcentration is a determinant of profitability. Concentration, defined as the extent towhich most of the market’s output is produced by a few firms in the industry, forms thebasis for the explicit link between market structure and performance through firms’

MARKET STRUCTURE, LIBERALIZATION AND PERFORMANCE IN THE MALAWIAN BANKING INDUSTRY 17
conduct (Bain, 1951; Scherer and Ross, 1990). The definition of concentration in termsof output poses empirical problems in the banking industry because of its multi-productnature, although the main products are loan-making and deposit-taking services (Morris,1985). However, since deposit data are readily available, bank output is usually measuredby total deposits. Competition theorists argue that firms in highly concentrated industriesrefrain from competing among themselves and might also refrain from raising depositrates or lowering lending rates (Morris, 1984). This would result in higher than averageprofitability. The traditional expectation is that higher concentration leads to higher andmonopolistic performance.15
There are several measures of market concentration,16 but the most common measuresin both industrial and banking studies have been the concentration ratio (CR) and theHerfindahl–Hirschmann index (HHI) (Scherer and Ross, 1990; Morris, 1984; Civelekand Al-Alami, 1991; Agu, 1992). As Berger and Hannan (1989) point out, theory provideslittle guidance on the measure of monopoly power when the type of noncompetitivebehaviour is unknown.17 Results from empirical studies on the performance ofconcentration in banking are mixed.18 Civelek and Al-Alami (1991) find a statisticallysignificant relationship between concentration and performance in most years withperverse signs in some years in the Jordanian banking system, while Molyneux andForbes (1995) find overwhelming evidence of a significant positive relationship betweenconcentration and profitability. On the other hand, Agu (1992) finds no significantstatistical relationship between concentration and profitability. Where the market sharevariable is included in the model, the concentration ratio fares poorly and the results tendto support the efficient market hypothesis (Evanoff and Fortier, 1988; Smirlock, 1985).
The main variable in the efficient market hypothesis is the efficiency of firms that canbe proxied by market share (MS). We use the market share of industry deposit for thetwo dominant commercial banks to test the alternative hypothesis of efficient market.We expect a positive relationship between market share and profitability. Larger marketshares are a result of efficiency that in turn leads to higher profitability.
Several control variables that take into account firm-specific and market-specificcharacteristics are theoretically justified and included in empirical studies of the bankingindustry. One of the variables is bank size. Bank size is measured as banks total depositsor assets or as an average measure based on total assets (ASSET) (Civelek and Al-Alami,1991; Molyneux and Forbes, 1995; Smirlock, 1985; Evanoff and Fortier, 1988). Thebank size variable takes into account differences brought about by size such as economiesof scale. We expect that larger banks compared with smaller banks’ can reap economiesof scale and have greater diversification opportunities. However, according to Evanoffand Fortier (1988) and Smirlock (1985) any positive influence on profits from economiesof scale may be partially offset by greater ability to diversify assets resulting in a lowerrisk and a lower required return. Therefore, the impact of bank size, a priori, isindeterminant. The empirical results on the performance of the bank size variable aremixed, with conclusions of no economies of scale (Civelek and Al-Alami 1991; Molyneuxand Forbes, 1995) and others having significant positive (Evanoff and Fortier, 1988) andnegative (Smirlock, 1985) relationships.
Since profit measures are usually not risk adjusted, the capital–asset ratio (CAPAST)

18 RESEARCH PAPER 108
is included to account for differences in levels of risk between firms. Lower CAPAST isassociated with high risk. We hypothesize a negative relationship between capital assetratio and profitability performance.19 However, as a measure of risk, the capital assetratio also produces a perverse sign although it is statistically significant (Molyneux andForbes, 1995). Evanoff and Fortier (1988) found a significant negative relationshipbetween return on assets and capital–asset ratio.
Another measure of risk included is the loan–asset ratio (LTOAST).20 The loan–assetratio is traditionally included in the model to capture bank-specific risk. Portfolio theorypostulates that risky investments are usually associated with higher returns than primaryassets. The loan–asset ratio is expected to be positively correlated with bank profitability.Empirically, this measure of bank risk has produced perverse results, suggesting thatthere is risk reduction behaviour among bank managers (Civelek and Al-Alami 1991;Molyneux and Forbes, 1995; Evanoff and Fortier, 1988). Agu (1992) also found a negativeand weak statistical association between the loan–deposit ratio and profitabilityperformance in the Nigerian banking system.
The bank’s relative cost of funds is captured by the ratio of demand deposits to totaldeposits (DDTDEP).21 Demand deposits are a relatively inexpensive source of funds.We expect that the higher the ratio of demand deposits to total deposits, the higher thelevel of profitability. Evanoff and Fortier (1988) and Smirlock (1985) found a significantand positive relationship between the ratio of demand deposits to total deposits and bankprofitability.
Other variables are included to account for market demand characteristics. Theseinclude market size and market growth rate. Market size is measured by total marketdeposits (MKDEP). Large markets should be easy to enter and bank customers in suchmarkets tend to be sophisticated, hence a negative relationship between market size andprofitability. However, as noted by Evanoff and Fortier (1988) and Smirlock (1985), thisnegative relationship may be partially offset if banks in these markets take on riskierportfolios requiring higher returns. The relationship between market size and bankprofitability may be either positive or negative. The growth of the market (MKGRO) isincluded because rapid market growth expands profit opportunities for existing banks,but if growth encourages entry then a negative relationship may be observed. Civelekand Al-Alami (1991) have argued that larger market size or an expanding market enablesbanks to differentiate their products and consequently generate higher profits.
In summary, the SCP hypothesis has now been widely used in the analysis of bankmarkets and there exists evidence in support of the structure–performance hypothesis,although the competing efficient market hypothesis is also gaining empirical support.The specification of the model, though following the traditional form, has been enrichedby inclusion of control variables. The overall evidence suggests that high marketconcentration may be an institutional feature that limits savings mobilization andintermediation. Alternatively, the efficient market hypothesis asserts that marketconcentration results from firms’ ability to secure larger market shares because of theirefficiency.

MARKET STRUCTURE, LIBERALIZATION AND PERFORMANCE IN THE MALAWIAN BANKING INDUSTRY 19
4. Methodology and data
Methods and model specification
Financial sector reforms in Malawi were first introduced in 1987. In testing the financialliberalization hypothesis we divide the data into two sub-samples: the period before
liberalization (1970–1986) and the period after liberalization (1987–1994). We computethe averages of the two sub-samples and use the test of the difference between two meansto establish the statistical significance of the changes in performance of impact variables.In some cases, we compute the simple correlation coefficient to find the statisticalassociation between policy variables and bank profitability.
We test the collusion and efficient market hypotheses on commercial banks usingbanking industry data from 1970 to 1994. Interest rates and credit limits between 1970and 1986 were heavily regulated, thus banks’ decisions over prices during the periodbefore liberalization were restricted. However, the monetary authorities did not regulateother sources of income such as fees and commissions on various services. The marketstructure–profitability model specified in this study tests the traditional SCP and theefficient market hypotheses for commercial banks based on equations 2 and 3. Thisstudy examines the behaviour of the two commercial banks (the dominant firms) in thebanking industry, which may be pursuing joint profit maximization through their commonownership structure. We estimate the following lin-log equation based on other studies(Evanoff and Fortier, 1988; Smirlock, 1985):
π β β β β βDt t Dt Dt Dtn CR n MS n ASSET n CAPAST= + + +0 1 2 3 4l l l l( ) ( ) ( ) ( )
+ + +β β β5 6 7l l ln LTOAST n DDTDEP n MKDEPDt Dt t( ) ( ) ( )
+ + +β β ε8 9ln MKGRO REFORMt t( ) (4)
where for time t and dominant commercial banks D,
π = commercial bank profits measured by return on assets (ROA),return on equity (ROE) and return on capital (ROC).

20 RESEARCH PAPER 108
CR = three-firm concentration ratio (the share of bank deposits accountedfor by the three largest banks). The more concentrated the industrythe higher the level of profitability ( β1 0> ).
MS = market share of the two commercial banks. Larger market sharesare a result of efficiency, which in turn leads to higher profitability( β2 0> ).
ASSET = commercial bank assets (thousands of kwacha). The relationshipmay be positive, reflecting economies of scale, or negative,reflecting greater ability to diversify assets, which results in lower
risk and lower required return ( β3 0> or β3 0< ).
CAPAST = capital to asset ratio of commercial banks. Lower ratios show risky
positions, hence a negative relationship ( β4 0< ).
LTOAST = loan to asset ratio of commercial banks. This provides a measureof risk, since loans are riskier assets, and hence the higher the
ratio the higher the profitability ( β5 0> ).
DDTDEP = demand deposits to total deposits ratio of commercial banks. Thisvariable represents the relative cost of funds. Demand depositsare a cheaper source of funds and the higher the ratio, the higher
the level of profitability ( β6 0> ).
MKDEP = market deposits (thousands of kwacha) of the banking industry.This is a proxy for market potential. Higher profits are expectedwhen a larger market provides new opportunities, while lowerprofits may be expected if the large market makes entry relatively
easy ( β7 0> or β7 0< ).
MKGRO = annual growth rate of market deposits for the banking industry.Higher profits are expected when a market grows, while lowerprofits may be expected if the growing market makes entry
relatively easy ( β8 0> or β8 0< ).
REFORM = binary variable equal to 1 for t = 1987 to 1994 representing theliberalization period, otherwise zero. In cases where liberalizationmakes entry easy, we expect lower profitability as a result of actualand potential competition, otherwise liberalization can strengthen
the monopoly power of existing banks ( β9 0< or β9 0> ).
ln = natural logarithm.

MARKET STRUCTURE, LIBERALIZATION AND PERFORMANCE IN THE MALAWIAN BANKING INDUSTRY 21
Data
The data cover the period from 1970 to 1994. The main data sources are the annualreports and accounts for the financial institutions. These financial institutions are
National Bank of Malawi, Commercial Bank of Malawi, New Building Society, MalawiSavings Bank, INDEFinance, Leasing and Finance Company, and National FinanceCompany. Other sources are Financial and Economic Review and Annual Report of theReserve Bank of Malawi, and International Financial Statistics of the InternationalMonetary Fund. We exclude the National Finance Company in the regression analysisbecause data on profits are not available.

22 RESEARCH PAPER 108
5. Empirical results
Financial liberalization hypotheses
Savings mobilization and intermediation
Malawi’s banking system is a successful mobilizer of funds. Both the commercialbanking system and an array of deposit-taking and credit-making institutions have
managed to attract substantial resources into the financial system. Appendix B, TableB1, shows the relative importance of commercial banks and other banking institutions insavings mobilization. Total deposits increased by an average rate of 20.3% per annumbetween 1970 and 1994. The deposits of commercial banks have grown but the share ofdeposits has fallen especially since 1988. There has been tremendous growth of depositsin non-bank financial institutions since 1987. The financial interrelations ratio, definedas the ratio of deposits of non-bank financial institutions to deposits of commercial banks,shows the importance of the NBFIs. The financial interrelations ratio averaged 21.5% inthe 1970s, increasing to 24% in the 1980s and to 35.4% in the 1990s.
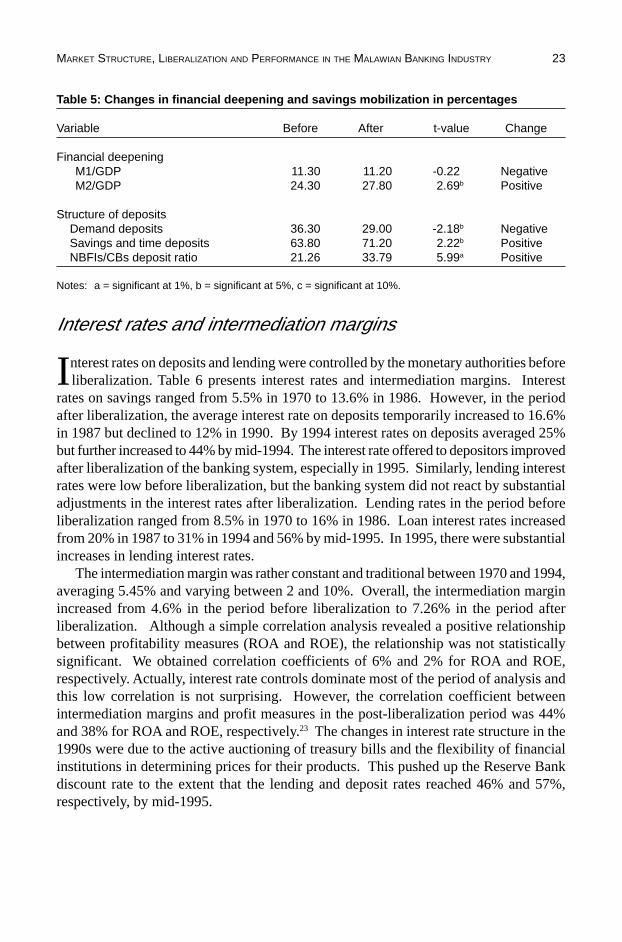
The effect of liberalization on financial deepening, savings mobilization andintermediation is presented in Table 5. Financial deepening is reflected by the changesin the ratio of money supply (M1 and M2) to gross domestic product (GDP). The ratio ofM1 to GDP fell from 11.3% before liberalization to 11.2% after liberalization. The ratioof broader money supply (M2) to gross domestic product increased significantly, at the5% level, from 24.3% before liberalization to 27.8% after liberalization. The financialinterrelations ratio computed as the ratio of deposits of non-bank financial institutions tocommercial bank deposits increased significantly, at the 1% level, from 21.3% beforeliberalization to 33.8% after liberalization. This underscores the importance of entry ofother banks in deposit mobilization.
There is a significant decline in the share of demand deposits in total domestic deposits,from 36.3% in the period before liberalization to 29% in the period after liberalization.This decline is significant at the 5% level. With liberalization there has been an increasein long-term liabilities in the banking system.22 Savings and time deposits in the bankingindustry increased from 63.8% in the period before liberalization to 71.2% in the periodafter liberalization. This study shows that there has been a significant change in savingsbehaviour from short-term to medium- and long-term savings, at the 5% level. Thedevelopments in financial deepening and savings mobilization in Malawi are encouraging,suggesting that liberalization of the financial sector has reduced financial repression.
MARKET STRUCTURE, LIBERALIZATION AND PERFORMANCE IN THE MALAWIAN BANKING INDUSTRY 23
Table 5: Changes in financial deepening and savings mobilization in percentages
Variable Before After t-value Change
Financial deepeningM1/GDP 11.30 11.20 -0.22 NegativeM2/GDP 24.30 27.80 2.69b Positive
Structure of deposits Demand deposits 36.30 29.00 -2.18b Negative Savings and time deposits 63.80 71.20 2.22b Positive NBFIs/CBs deposit ratio 21.26 33.79 5.99a Positive
Notes: a = significant at 1%, b = significant at 5%, c = significant at 10%.
Interest rates and intermediation margins
Interest rates on deposits and lending were controlled by the monetary authorities beforeliberalization. Table 6 presents interest rates and intermediation margins. Interest
rates on savings ranged from 5.5% in 1970 to 13.6% in 1986. However, in the periodafter liberalization, the average interest rate on deposits temporarily increased to 16.6%in 1987 but declined to 12% in 1990. By 1994 interest rates on deposits averaged 25%but further increased to 44% by mid-1994. The interest rate offered to depositors improvedafter liberalization of the banking system, especially in 1995. Similarly, lending interestrates were low before liberalization, but the banking system did not react by substantialadjustments in the interest rates after liberalization. Lending rates in the period beforeliberalization ranged from 8.5% in 1970 to 16% in 1986. Loan interest rates increasedfrom 20% in 1987 to 31% in 1994 and 56% by mid-1995. In 1995, there were substantialincreases in lending interest rates.
The intermediation margin was rather constant and traditional between 1970 and 1994,averaging 5.45% and varying between 2 and 10%. Overall, the intermediation marginincreased from 4.6% in the period before liberalization to 7.26% in the period afterliberalization. Although a simple correlation analysis revealed a positive relationshipbetween profitability measures (ROA and ROE), the relationship was not statisticallysignificant. We obtained correlation coefficients of 6% and 2% for ROA and ROE,respectively. Actually, interest rate controls dominate most of the period of analysis andthis low correlation is not surprising. However, the correlation coefficient betweenintermediation margins and profit measures in the post-liberalization period was 44%and 38% for ROA and ROE, respectively.23 The changes in interest rate structure in the1990s were due to the active auctioning of treasury bills and the flexibility of financialinstitutions in determining prices for their products. This pushed up the Reserve Bankdiscount rate to the extent that the lending and deposit rates reached 46% and 57%,respectively, by mid-1995.

24 RESEARCH PAPER 108
Table 6: Interest rates and intermediation margins, 1970–1994, in percentages
Nominal interest rates Inflation Real interest rates IntermediationYear Deposit Lending Deposit Lending Margin
1970 5.50 8.50 7.94 -2.26 0.52 3.001971 5.50 8.50 8.09 -2.39 0.38 3.001972 5.50 8.50 3.63 1.81 4.70 3.001973 5.50 8.50 5.25 0.24 3.09 3.001974 5.50 8.50 15.38 -8.57 -5.97 3.001975 5.50 8.50 15.50 -8.65 -6.06 3.001976 6.63 10.00 4.37 2.17 5.40 3.371977 7.17 10.00 4.19 2.86 5.58 2.831978 7.17 10.00 8.61 -1.32 1.28 2.831979 8.10 11.50 10.96 -2.58 0.48 3.401980 7.92 16.67 19.05 -9.35 -2.00 8.751981 9.75 18.50 10.40 -0.59 7.34 8.751982 9.75 18.50 8.70 0.97 9.02 8.751983 9.92 18.33 13.50 -3.15 4.26 8.411984 11.75 16.50 11.01 0.66 4.94 4.751985 12.50 18.38 14.95 -2.13 2.99 5.881986 13.58 16.00 14.90 -1.15 0.96 2.421987 16.58 20.00 26.64 -7.94 -5.24 3.421988 13.50 22.25 31.36 -13.59 -6.93 8.751989 12.75 23.00 15.74 -2.59 6.27 10.251990 12.10 21.00 11.39 0.64 8.63 8.901991 12.50 20.00 8.12 4.05 10.98 7.501992 16.50 22.00 23.29 -5.51 -1.05 5.501993 21.75 29.50 22.79 -0.85 5.47 7.751994 25.00 31.00 34.62 -7.14 -2.69 6.00
Source: IMF (various) International Financial Statistics; RBM (various), Financial and EconomicReview.
In real terms, deposit rates were mostly negative, averaging -2.66% per annum overthe period of analysis. Due to high rates of inflation during the period after liberalization,real interest rate on deposits fell to -4.21% compared with -1.97% in the period beforeliberalization. In contrast, real lending rates were generally positive, and recorded anaverage annual rate of 2.09% between 1970 and 1994. Real lending rates averaged 2.17%per annum in the period before liberalization but declined to 1.93% in the period afterliberalization.
Significant changes in interest rates only occurred in nominal rates at the 1% level(Table 7). This was a result of rising inflation in the period after liberalization. Theaverage rate of inflation doubled between the two periods, and nominal interest ratesalso doubled. Real interest rates show that there was a decline (though not significant)before and after liberalization. The behaviour of the intermediation margin is different,almost doubling in nominal rates and increasing significantly, at the 5% level, in realterms. Real lending rates were much higher than real savings rates.

MARKET STRUCTURE, LIBERALIZATION AND PERFORMANCE IN THE MALAWIAN BANKING INDUSTRY 25
Table 7: Changes in interest rates and intermediation margins in percentages
Variable Before After t-value Change
Nominal rates Deposit rate 8.07 16.34 5.88a Positive Lending rate 12.67 23.69 6.15a Positive Intermediation margin 4.60 7.26b 2.71b Positive
Real rates Deposit rate -1.97 -4.12 -1.20 Negative Lending rate 2.17 1.93 -0.12 Negative Intermediation margin 4.14 6.05 2.19b Positive
Inflation rate 10.40 21.70 4.34b Positive
Notes: a = significant at 1%, b = significant at 5%, c = significant at 10.
Shift in sectoral allocation of domestic credit
The banking system also plays a role in delivery of credit to various sectors of theeconomy. However, financial institutions extend most credit to large and well-
established enterprises and limited credit facilities are advanced to micro, small andmedium-scale enterprises perceived as high risk borrowers.24 Loans and advances to theprivate sector have grown substantially, at an average annual rate of 18.3% between1970 and 1994. Figure 1 shows the trend in the distribution of credit between the privateand public sectors. In the 1970s, the share of domestic credit to the private sector was71.4%, compared with 28.6% for the share of credit to the public sector. However, creditto the private sector fell and that to the public sector rose between 1981 and 1988. As aresult, the share of domestic credit to the private sector fell to 43.5% and that of thepublic sector increased to 56.5% in the 1980s. In 1990 and 1991, the private sectoraccounted for most of domestic credit. Due to suspension of donor aid and external loanspending democratic elections in 1992, government borrowing from the banking systemincreased substantially, leading to a reversal in allocation of credit between 1992 and1994.
Most credit has been directed to the trading and agricultural sectors (see Table B2 inAppendix B) through commercial bank loans and advances. Figure 2 shows commercialbank loans and advances by sector. During the period 1970–1994, agriculture,manufacturing, trading and other sectors accounted for 35.9%, 13.2%, 27.2% and 23.7%,respectively. During the period before liberalization, the agricultural sector accountedfor 37.9% and the trading sector accounted for about 26.7%, while the manufacturingsector accounted for only 9.5% of total advances. In the period after liberalization,however, the dominance of the agriculture sector fell to 31.8%, while the proportion ofadvances to trading and manufacturing sectors increased to 28.2% and 21%, respectively.Credit to the agricultural sector dominated in domestic credit in the period beforeliberalization as a result of deliberate government policy to direct credit to the mainstayof the economy, the agricultural sector. This policy was abandoned in 1990. The removal

26 RESEARCH PAPER 108
Figure 1. Distribution of domestic credit between private and public sector, 1970–1994
0
20
40
60
80
100
Years
Pe
rce
nt
70 71 72 73 74 75 76 77 78 79 80 81 82 83 84 85 86 87 88 89 90 91 92 93 94
Agriculture Manufacturing Distribution (Trade)
Figure 2: Commercial banks’ loans and advances by economic activity, 1970–1994
0
20
40
60
80
100
Years
Per
cent
70 71 72 73 74 75 76 77 78 79 80 81 82 83 84 85 86 87 88 89 90 91 92 93 94
Private Sector Public Sector

MARKET STRUCTURE, LIBERALIZATION AND PERFORMANCE IN THE MALAWIAN BANKING INDUSTRY 27
of preferential treatment of the agricultural sector enabled the share of commercial banks’advances to the manufacturing sector to increase. These changes are significant andliberalization has enabled banks to freely allocate loans to various economic activities.
The impact of financial sector reforms on intermediation is presented in Table 8. Interms of structure of assets, there has been a decline in loans and advances as a share oftotal assets from 54.96% in the period before liberalization to 45.65% in the period afterliberalization. However, this decline is not statistically significant. The share of treasurybills and local registered stocks in total assets also declined from 23.15% in the periodbefore liberalization to 19.34% in the period after liberalization. Although savingsmobilization has increased since liberalization, this has not been accompanied by anincrease in the proportion of assets that financial institutions lend out to the private sector.There is excess liquidity in the formal banking sector in Malawi. This may not be surprisingbecause in the period after liberalization the required reserve ratio increased from 10%in 1989 to 35% in 1994. The result is an increase in liquidity. For instance, commercialbanks’ deposits with Reserve Bank, currency in cash and balances with other banks wereonly 21.89% of total assets before liberalization, but increased to 35.01% in the periodafter liberalization. Aryeetey et al. (1997) note that the intermediation role of the informalsector increased with liberalization, in contrast to the formal sector.
Table 8: Intermediation: changes in asset structure and sectoral allocation of credit inpercentages
Variable Before After t-value Change
Asset structure (banking industry) Loans and advances 54.96 45.65 -2.33b Negative Treasury bills 23.15 19.34 -2.11b Negative Cash and Reserve Bank balances 21.89 35.01 4.24a Positive Fixed assets 4.97 4.36 -1.25 Negative
Sectoral allocation of credit Private sector 60.10 54.10 -0.81 Negative Public sector 39.90 45.90 0.81 Positive
(Commercial banks only) Agriculture sector 37.90 31.80 -0.87 Negative Manufacturing sector 9.50 21.00 5.08a Positive Distribution (trade) sector 26.70 28.20 0.28 Positive
Notes: a = significant at 1%; b = significant at 5%; c = significant at 10%.
In terms of sectoral allocation of credit, there has been an insignificant decline in thebanking system’s credit to the private sector, from 60.1% in the period before liberalizationto 54.1% in the period after liberalization. Consequently, the public sector hasinsignificantly gained the share in domestic credit from the banking system. Thedistribution of credit from commercial banks by economic activity shows that theagricultural sector still accounts for most credit. However, there has been an insignificant
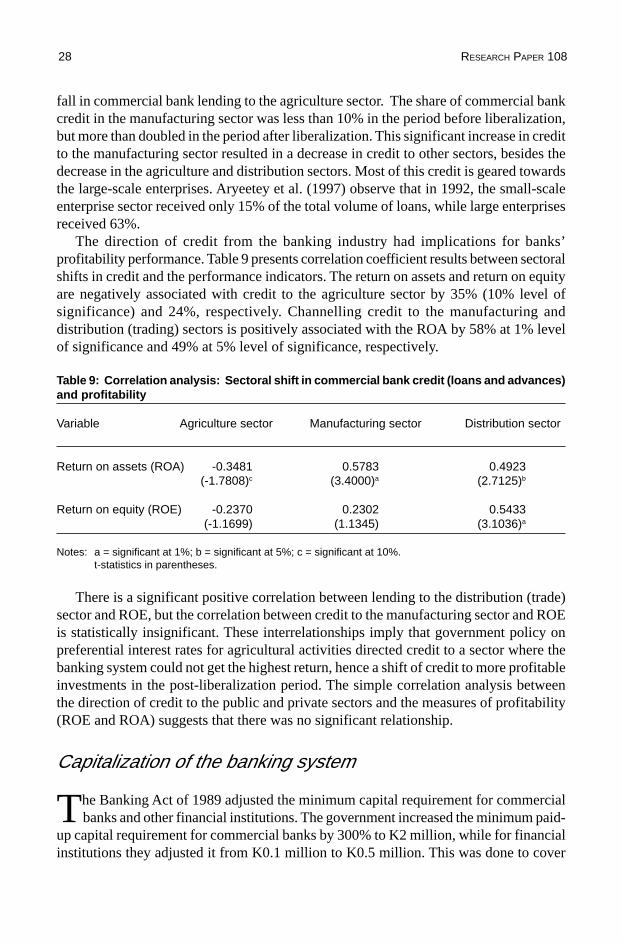
28 RESEARCH PAPER 108
fall in commercial bank lending to the agriculture sector. The share of commercial bankcredit in the manufacturing sector was less than 10% in the period before liberalization,but more than doubled in the period after liberalization. This significant increase in creditto the manufacturing sector resulted in a decrease in credit to other sectors, besides thedecrease in the agriculture and distribution sectors. Most of this credit is geared towardsthe large-scale enterprises. Aryeetey et al. (1997) observe that in 1992, the small-scaleenterprise sector received only 15% of the total volume of loans, while large enterprisesreceived 63%.
The direction of credit from the banking industry had implications for banks’profitability performance. Table 9 presents correlation coefficient results between sectoralshifts in credit and the performance indicators. The return on assets and return on equityare negatively associated with credit to the agriculture sector by 35% (10% level ofsignificance) and 24%, respectively. Channelling credit to the manufacturing anddistribution (trading) sectors is positively associated with the ROA by 58% at 1% levelof significance and 49% at 5% level of significance, respectively.
Table 9: Correlation analysis: Sectoral shift in commercial bank credit (loans and advances)and profitability
Variable Agriculture sector Manufacturing sector Distribution sector
Return on assets (ROA) -0.3481 0.5783 0.4923(-1.7808)c (3.4000)a (2.7125)b
Return on equity (ROE) -0.2370 0.2302 0.5433(-1.1699) (1.1345) (3.1036)a
Notes: a = significant at 1%; b = significant at 5%; c = significant at 10%.t-statistics in parentheses.
There is a significant positive correlation between lending to the distribution (trade)sector and ROE, but the correlation between credit to the manufacturing sector and ROEis statistically insignificant. These interrelationships imply that government policy onpreferential interest rates for agricultural activities directed credit to a sector where thebanking system could not get the highest return, hence a shift of credit to more profitableinvestments in the post-liberalization period. The simple correlation analysis betweenthe direction of credit to the public and private sectors and the measures of profitability(ROE and ROA) suggests that there was no significant relationship.
Capitalization of the banking system
The Banking Act of 1989 adjusted the minimum capital requirement for commercialbanks and other financial institutions. The government increased the minimum paid-
up capital requirement for commercial banks by 300% to K2 million, while for financialinstitutions they adjusted it from K0.1 million to K0.5 million. This was done to cover

MARKET STRUCTURE, LIBERALIZATION AND PERFORMANCE IN THE MALAWIAN BANKING INDUSTRY 29
depositors from risks of bank failure or bankruptcy, justifiable in the absence of depositinsurance facilities in the banking system. However, the existing banks were alreadywell capitalized and this rule only applied to new entrants. In any case, the bankingsystem has accumulated substantial reserves, and on average has about 100 times theminimum capital requirement. In the period before liberalization, for example, the averagecapitalization (equity and reserves) of the banking system was 905% of the minimumcapital requirement, and increased to 5,580% of the minimum capital requirement in theperiod after liberalization. The banking system capitalization in terms of equity only wasK7.3 million in the period before liberalization, and increased substantially to K64.6million in the period after liberalization.
Deposits and market structure
Deposits in the banking system are dominated by a few banks. This implies that thebanking system in Malawi is highly concentrated. Figure 3 shows the trend in market
structure using various indexes of market concentration. The one-firm concentrationratio (CR1) shows that one bank dominates the share of deposits in the banking systemand accounts for not less than 40% of bank deposits. However, it is also clear from thefigure that the monopoly power of the largest banks has been falling, especially sinceliberalization. The trend of the two-firm concentration ratio (CR2) is more or less stable,although a decline is witnessed since 1987.
The three-firm concentration ratio (CR3) reflects increasing monopolistic oroligopolistic positions in the 1970s and early 1980s, but monopoly power declined duringthe post-liberalization period. Using the Herfindahl–Hirschmann index (HHI), thedeclining trend of monopoly power and the role of new competition is apparent. TheHHI also shows that there has been instability in the market power since 1970, but a realdownward trend started in 1987. Comparatively, the average HHI was 42.59% in theperiod before liberalization, but fell to 33.29% in the period after liberalization. Theextent of changes in the monopoly power in the banking system is presented in Table 10.All measures of concentration show that after liberalization, the level of monopoly powerin the banking industry declined. We also observe significant increases in the level ofprofitability as reflected by the return on assets during the same period. This seems to bea perverse result for the market structure hypothesis. However, the comparison of thechanges in the means for market structure and profitability masks the relationship betweenthe two variables over time, as monopoly power is just one of the many factors thatexplain bank profitability. The increase in profitability in the liberalization period varieswith many factors that may suggest any or a combination of reduction in costs, increasesin productivity and efficiency, the quality of the portfolio, market expansion, andeffectiveness of competition.
There are several explanations for the trend in monopoly power in the banking system.The relative stability of the monopoly power, especially as reflected by the concentrationratios, arises because new entrants have mainly concentrated on corporate deposits andhave therefore not diverted the clientele for commercial banks. The period after

30 RESEARCH PAPER 108
liberalization also witnessed tremendous growth in the market: The market for depositsgrew on average at 20.3% per year, with growth rates of 16.88% and 27.04% in theperiods before and after liberalization, respectively. Such high growth rates have enabledthe market to accommodate new entrants without substantial loss of market shares bythe incumbents.
Figure 3: Trend in market structure: Indexes of market concentration, 1970–1994
20
40
60
80
100
Years
Pe
rce
nt
70 71 72 73 74 75 76 77 78 79 80 81 82 83 84 85 86 87 88 89 90 91 92 93 94
CR1 CR2 CR3 HHI

MARKET STRUCTURE, LIBERALIZATION AND PERFORMANCE IN THE MALAWIAN BANKING INDUSTRY 31
Table 10: Changes in market structure and profitability in percentages
Variables Before After t-value Change
Indexes of market concentration CR1 58.58 49.39 -4.70a Negative CR2 82.60 74.84 -5.70a Negative CR3 94.41 86.44 -6.36a Negative HHI 42.59 33.29 -7.20a Negative
Profitability ROE 34.25 46.66 1.47 Positive ROA 2.25 4.52 3.65a Positive ROC 16.82 23.74 1.33 Positive
Notes: a = significant at 1%; b = significant at 5%; c = significant at 10%.
The declining trend in monopoly power in the late 1980s is a direct result ofliberalization measures. Financial liberalization meant that entry in the financial systemis relatively free. With the new Banking Act of 1989, the number of banks in the financialsystem also increased from five banks to eight banks by 1994, and to ten banks by thefirst quarter of 1996. This has increased the level of actual and potential competition inthe banking sector. The new entrants have mainly used price competition and productinnovation as an entry strategy. For example, Leasing and Finance entered the marketwith interest rates on deposits 4% higher than those offered by commercial banks. FirstMerchant Bank and Finance Bank entered the market with higher interest rates on depositsand a new innovation of offering interest on high value current accounts.
As Gibson and Tsakalotos (1994) note, a number of consequences follow fromincreased competition. First is a deterioration in the risk–return relationship and looseningof credit limits as banks compete with one another to maintain, if not increase, theirmarket share. Second, increasing competition may lead to falling profits as some banksmay be willing to accept short-run losses in the hope of future monopoly profits ascompetition stifles. However, in the short and medium term, this competition in Malawihas had limited effect on the market power of National Bank and Commercial Bank,since the two new entrants that have full commercial banking services only entered themarket in 1995 and 1996.
Determinants of bank profitability
Market power in the banking industry is tested using a single-equation multipleregression analysis. Table 11 presents summary statistics of the variables used in
the regression analysis of the structure–performance relationship (see Appendix C). Returnon equity (ROE) and return on capital (ROC) show a mean profitability of 43.45% and23.78%, respectively. The standard deviation and maximum rates are also high. Theaverage profitability measured by return on assets (ROA) is 3.24% with a standarddeviation of about half the mean rate. The trends in the profitability of commercial banks

32 RESEARCH PAPER 108
are presented in figures 4 and 5. All profitability measures show that in the early 1970sbank profitability increased, but then deteriorated from 1979 through to 1984 when itpicked up to match the mid-1970s levels. During the period of poor performance, theeconomy in general was in a crisis, which affected banks’ major customers such as stateenterprises and large private enterprises. Commercial bank profitability also shows adeclining trend since 1990, reflecting the potential effect of competition as more financialinstitutions were granted commercial banking licenses. The standard deviation, themaximum and minimum values of the three-firm concentration ratio (CR), shows thatthere has been little variability of monopoly power. The variability as indicated by thestandard deviation is also low for CAPAST, LTOAST and DDTDEP, suggesting thatthese ratios were relatively stable over the study period.
Figure 4: Return on assets for dominant commercial banks (percent)
-20
0
20
40
60
80
Years
Per
cent
70 71 72 73 74 75 76 77 78 79 80 81 82 83 84 85 86 87 88 89 90 91 92 93 94
Return on Capital (ROC) Return on Equity (ROE)
Figure 5: Return on capital and equity for dominant commercial banks (percent)
-2
0
2
4
6
8
Years
Per
cent
70 71 72 73 74 75 76 77 78 79 80 81 82 83 84 85 86 87 88 89 90 91 92 93 94
Return on Asset (ROA)

MARKET STRUCTURE, LIBERALIZATION AND PERFORMANCE IN THE MALAWIAN BANKING INDUSTRY 33
In order to avoid spurious regression, we use the Dickey–Fuller unit root tests toestablish stationarity and order of integration as reported in Table 11. We cannot rejectthe presence of a unit root in levels, but it is rejected in the first difference for all theseries. Thus, all the series are integrated of order 1. We only estimate the long-runrelationship that exists between market structure and profitability.
Table 11: Summary statistics of variables in regression analysis
Variable Unit of Mean SD Max. Min. Augmented Dickey–Fuller Tests a
measure Levels b First Orderdifference c
ROA Percent 3.24 2.00 7.27 -0.03 -2.1827 -6.3698 (0) I(1)ROE Percent 43.45 24.11 82.59 -0.49 -2.4195 -5.5968 (0) I(1)ROC Percent 23.78 16.48 46.82 -0.15 -1.8350 -4.0107 (0) I(1)
CR Percent 91.84 4.87 96.15 79.51 -2.7805 -3.4279 (4) I(1)MS Percent 80.11 4.93 87.57 70.18 -1.7687 -4.1233 (1) I(1)ASSET MK d 535232 622828 2647076 45000 -1.8535 -2.8448 (0) I(1)CAPAST Percent 15.82 4.90 27.52 7.91 -1.6895 -3.8825 (2) I(1)LTOAST Percent 56.75 12.10 77.90 35.35 -2.1688 -3.2948 (1) I(1)DDTDEP Percent 42.31 10.75 65.68 29.38 -0.8693 -3.3975 (1) I(1)MKTDEP MK d 597095 753921 3150177 41877 -0.5153 -3.8620 (0) I(1)MKTGRO Percent 20.23 11.51 44.91 1.94 -1.8260 -4.1600 (2) I(1)REFORM Binary 0.32 0.48 1.00 0.00 - - -
Notes: a. Unit root tests for all independent variables are applied on variables in naturallogarithms.
b. Two lags are used and the MacKinnon critical values for the ADF are:1% = -4.4415, 5% = -3.6330, 10% = -3.2535.
c. Number of lags used and the MacKinnon critical values for the DF are:1% = -3.7497, 5% = -2.9969, 10% = -2.6381;for ADF: 1% = -3.8304, 5% = -3. 0294, 10% = -2.6552.
d. Thousands of Malawi kwacha.
Market power in the banking industry is tested using a single-equation multipleordinary least squares (OLS) regression analysis. Table 12 reports regression resultsfrom estimating Equation 4 above. For each performance measure we estimate thecollusion model and efficient market model. The first equation tests the collusionhypothesis. In the second equation we introduce market share and test the efficient markethypothesis. We also test the equations for serial correlation, normality and misspecificationusing the LM serial correlation test, Jarque-Bera normality test and the RESETspecification test, respectively. The null hypotheses of serial correlation, misspecificationand that residuals are not white noise were rejected at the 1% level. The explanatorypower of the model ranges from 61% to 81%. Thus, the model explains most of thevariation in commercial banks’ profitability. Table 13 provides computed elasticities ofvariables that are significant at least at the 10% level.

34 RESEARCH PAPER 108
Tab
le 1
2:
Reg
ress
ion
res
ult
s: D
eter
min
ants
of
com
mer
cial
ban
k p
rofi
tab
ility
πE
qnC
onst
ant
CR
MS
AS
SE
TC
AP
AS
TLT
OA
ST
DD
TD
EP
MK
DE
PM
KG
RO
RE
FO
RM
R2
DW
F
RO
A3.
1-2
96.2
2341
.629
-1.
094
0.32
64.
328
13.1
882.
372
0.00
91.
163
0.73
51.
935.
559
(-2.
566)
(2.2
30)
(0.0
88)
(0.1
26)
(2.1
18)
(4.3
44)
(0.1
83)
(0.0
21)
(0.7
59)
[0.6
0]
3.2
-244
.244
45.3
29-1
4.89
713
.240
-1.8
205.
052
13.1
47-9
.770
0.05
31.
456
0.74
01.
984.
747
(-1.
579)
(2.2
24)
(-0.
521)
(0.4
99)
(-0.
371)
(2.0
12)
(4.2
29)
(-0.
364)
(0.1
14)
(0.8
74)
[0.5
8]
RO
E3.
3-3
683.
3357
8.59
6-
65.6
53-1
1.48
425
.230
159.
990
-30.
186
-1.1
2320
.503
0.61
31.
793.
163
(-2.
192)
(2.1
30)
(0.3
63)
(-0.
304)
(0.8
48)
(3.6
21)
(0.1
60)
(-0.
174)
(0.9
20)
[0.4
2]
3.4
-19
38.1
070
2.81
9-5
00.1
9547
3.44
3-8
3.54
349
.533
158.
616
-437
.988
0.33
730
.365
0.64
91.
943.
085
(-0.
897)
(2.4
68)
(-1.
251)
(1.2
76)
(-1.
220)
(1.4
12)
(3.6
52)
(1.1
68)
(0.0
52)
(1.3
05)
[0.4
4]
RO
C3.
5-1
598.
9023
0.83
0-
31.7
01-2
8.13
118
.890
83.2
76-9
.927
-1.3
454.
140
0.82
81.
779.
655
(-2.
092)
(1.8
68)
(0.3
86)
(-1.
638)
(1.3
96)
(4.1
43)
(-0.
115)
(-0.
458)
(0.4
08)
[0.7
4]
3.6
-911
.296
279.
773
-197
.071
192.
366
-56.
521
28.4
6582
.735
-170
.553
-0.7
708.
025
0.84
11.
788.
787
(-0.
915)
(2.1
32)
(-1.
070)
1.12
5)(-
1.79
1)(1
.760
)(4
.133
)(-
0.98
7)(-
0.25
9)(0
.748
)[0
.74]
Not
es:
a.A
ll in
depe
nden
t var
iabl
es, e
xcep
t RE
FO
RM
, are
in n
atur
al lo
garit
hm.
The
refo
re, t
he a
bsol
ute
chan
ge in
the
depe
nden
t var
iabl
e fo
r a
perc
enta
ge c
hang
e in
the
inde
pend
ent v
aria
ble
is o
btai
ned
by m
ultip
lyin
g th
e co
effic
ient
by
0.01
.b.
Fig
ures
in p
aren
thes
es a
re t-
stat
istic
s. T
he fo
llow
ing
sign
ifica
nce
leve
ls a
nd t
valu
es a
pply
for
25 o
bser
vatio
ns:
1% =
2.7
87, 5
% =
2.0
60, 1
0% =
1.7
08.
c.F
igur
es in
bra
cket
s ar
e ad
just
ed R
2 .d.
All
the
equa
tions
pas
sed
the
LM s
eria
l cor
rela
tion
test
, Jar
que-
Ber
a no
rmal
ity te
st a
nd R
ES
ET
spe
cific
atio
n te
st.

MARKET STRUCTURE, LIBERALIZATION AND PERFORMANCE IN THE MALAWIAN BANKING INDUSTRY 35
The results show support for the traditional concentration–conduct–performance orcollusion hypothesis. The coefficient of the three-firm concentration ratio is statisticallysignificant at 5% irrespective of measure of performance. The elasticity of commercialbank profitability with respect to market concentration ranges from 9.71% in Equation3.5 to 16.18% in Equation 3.4, as Table 13 shows. These results support the collusionhypothesis in the banking industry in Malawi. Molyneux et al. (1994) also accept thestructure–conduct–performance paradigm in the Spanish banking industry. The inclusionof market share does not significantly improve the explanatory power of the model, anddoes not change the significance and sign of the market concentration variables. Mostempirical studies show that inclusion of market share makes concentration insignificantor negatively associated with profitability (Smirlock, 1985; Maudos, 1998). Therelationship between market share and profitability is negative and insignificantirrespective of the measure of profitability. This relationship is weak in the Malawianbanking industry because of the high correlation between concentration and market share,since two commercial banks dominate the banking industry.
Table 13: Computed elasticities from significant variables*
Variables ROA ROE ROC3.1 3.2 3.3 3.4 3.5 3.6
CR 12.87 14.02 13.32 16.18 9.71 11.76CAPAST - - - - - -2.38LTOAST 1.34 1.56 - - - 1.20DDTDEP 4.08 4.07 3.68 3.65 3.50 3.48
Note: *Evaluated at the mean of the dependent variables.
Of the control variables only DDTDEP, LTOAST and CAPAST are at least statisticallysignificant. The coefficient of DDTDEP has the expected positive sign in all equationswhatever the profitability measure and specification. In all the equations, the coefficientof DDTDEP is significant at the 1% level. The elasticity of profitability with respect toDDTDEP ranges from 3.48% to 4.08%. We also note that ROA is more sensitive toDDTDEP than ROE and ROC. The significance and consistency of this variable confirmthe notion that demand deposits are a cheaper source of funds for the banking industry.The performance of this variable is similar to that found in other studies (Smirlock,1985; Evanoff and Fortier, 1988).
The ratio of loans to assets, LTOAST, is only significant in three specifications,particularly when we use ROA and ROC as measures of profitability. The coefficient ofLTOAST is consistently positive, as expected, in all specifications. LTOAST is positivelyassociated with ROA and its coefficient is statistically significant at 5% in both cases.With respect to ROC, the coefficient of LTOAST is statistically significant at the 10%level only when we include the market share variable. The elasticity of profitability withrespect to the loan–asset ratio ranges from 1.56% to 1.20%. The performance of theLTOAST variable has mostly produced perverse results, with negative coefficients(Molyneux and Forbes, 1995; Evanoff and Fortier, 1988; Maudos, 1998).

36 RESEARCH PAPER 108
The capital–asset ratio, CAPAST, is statistically significant at the 10% level only inthe case where we use ROC as a profitability measure with the inclusion of market share.The coefficient of CAPAST is generally negative, although we also obtain a positivecoefficient in one specification. The other control variables including ASSET, MKDEP,MKGRO and REFORM are not statistically significant. The coefficient of ASSET isconsistently positive, supporting the scale economy argument, but is not significant inall specifications. The coefficients of market demand variables are inconsistent and highlyinsignificant. Financial sector reforms provide an environment conducive to high bankprofitability as reflected by the consistency of the dummy variable REFORM. However,the effect of financial sector liberalization is not statistically significant.
Overall, the study supports the traditional structure–conduct–performance hypothesis,suggesting the role of monopoly power in determining commercial banks’ profitabilityin the Malawian banking industry. Commercial banks may exercise monopoly power oninterest rate margins, which increased significantly after liberalization, and other incomeearning services such as fees and commissions. The data do not support the efficientmarket hypothesis, and the coefficient of market share is negative in all specifications.However, we must exercise caution in this judgement because others (Maudos, 1998)note that market share is a poor proxy for efficiency and propose inclusion of a directmeasure of efficiency. Maudos (1998) introduces a measure of overall efficiency withmarket concentration and market share and finds the coefficients of both efficiency andmarket share to be highly significant while the coefficient of concentration is eithernegative or insignificant.

MARKET STRUCTURE, LIBERALIZATION AND PERFORMANCE IN THE MALAWIAN BANKING INDUSTRY 37
6. Concluding remarks
This study attempts to provide empirical evidence on the effect of financial sectorreforms on financial intermediation, savings mobilization and market structure, and
to investigate the relationship among market structure, bank behaviour and profitabilityperformance in the Malawian banking industry. This study tested two hypotheses. First,we examined the financial liberalization hypothesis based on the McKinnon–Shaw thesis,which focuses on the impact of financial sector reforms on savings mobilization andintermediation, behaviour of real interest rates, and the structure of assets. Second, thestructure–conduct–performance hypothesis in the Bainian tradition investigates the effectof financial sector reforms on monopoly power and the relationship that exists betweenmarket structure and performance. We also test the alternative efficient market hypothesis.
With respect to the financial liberalization hypothesis, the study provides someevidence that financial sector reforms have reduced financial repression in the formalbanking system in Malawi. The results compare favourably with those by Aryeetey et al.(1997), although there are stronger differences in this study between the periods beforeand after liberalization with the use of a longer time horizon. Nonetheless, some signs offinancial repression are still evident several years after financial liberalization. Theevidence in favour of financial liberalization is remarkable as for financial deepeningand shift in credit to non-preferential sectors. The ratio of M2 to GDP has increased andnon-bank financial institutions are playing a greater role in the financial sector. Theshare of demand deposits in total deposits has significantly fallen in favour of a significantincrease in the share of time and savings deposits. The share of credit to the agriculturalsector has fallen in favour of a significant increase in the share of credit to themanufacturing sector. We also find a high correlation between bank profitability and thedirection of credit. Credit to the agricultural sector was associated with low bankprofitability while that to the manufacturing and distribution sectors was associated withhigh profitability. This provides justification for the banks to diversify their income-earning assets away from the agricultural sector in the period after liberalization.
On the perverse side, the share of loans and advances in total assets has fallen, indicatingthe impact of the high liquidity reserve requirement and increases in cash holdings bybanks and other non-performing assets. The share of credit to the public sector increased,while that to the private sector declined, suggesting a crowding out effect. The indicatorsof the behaviour of interest rates and intermediation margins show that real interest ratesdeclined after liberalization,contrary to the predictions of the financial liberalization thesis.The improvements in real interest rates have been adversely affected by macroeconomicinstability due to high levels of inflation, upward adjustments in liquidity reserve

38 RESEARCH PAPER 108
requirement and fiscal indiscipline. Inflation and fiscal indiscipline partly resulted fromthe economic liberalization programme initiated in 1981. The financial liberalizationhypothesis also predicts that the spread between lending and savings interest rates willdiminish with liberalization, but the evidence in this study shows a significant increasein intermediation margins. Average monopoly power as measured by the concentrationindexes has fallen significantly.
The relationship between market structure and performance was investigated using aregression analysis of commercial banks’ profitability. We have examined two competinghypotheses—whether collusion or efficiency is the more important determinants ofcommercial banks’ profitability. The results of the study provide evidence in favour ofthe traditional structure–conduct–performance (collusion) hypothesis in the Malawianbanking industry. Intermediation margins are high and increased significantly followingthe introduction of financial sector reforms. The simple correlation coefficient betweenintermediation margin and profitability, though positive, is not statistically significant,possibly masked by the long period of interest rate controls during the period beforefinancial sector reforms and the fact that other sources of revenue may play a significantrole. The overall performance in terms of interest income compared with other sourcesof income, such as fees and commissions on specialized services, shows that monopolypower is one of the determinants of commercial banks’ profitability.
These results point to the fact that fees and commissions, which form part of theincome for commercial banks that the authorities do not regulate, may be high becauseof lack of competition. Other sources of revenue for commercial banks are transactioncosts that savers and borrowers pay, including commission charges on foreign exchangetransactions, bank charges, penalties on returned cheques, mail transfer charges, loan oroverdraft application fees, and cable charges. The results show that if there is concernabout monopoly powers in multi-service (multi-product) firms such as banks, it is notonly the structure of interest rates (intermediation margins) that matters. Transactioncosts that savers and depositors incur are also potential avenues for the exercise ofmonopoly power by banks, and may affect the ability of the banks to mobilize savingsand to extend credit to productive sectors of the economy.
Data from the Malawian banking industry do not support the relationship betweenmarket share and profitability. Thus, it is not the efficiency of commercial banks thatexplains variations in profitability over time in the Malawian banking industry. Otherscholars also note that market share is a poor proxy of efficiency, so that we need a directmeasure of efficiency to test the efficient market hypothesis.
We also find the ratio of demand deposits to total deposits and the loan–asset ratio tobe other important and significant determinants of commercial bank profitability.However, commercial banks’ profitability is more sensitive to monopoly power than tothe ratio of demand deposits to total deposits. We also note that commercial bankprofitability increased after financial sector reforms, although the relationship is notstatistically significant.
Financial reforms in the Malawian formal banking industry are almost complete.However, one aspect that requires further reform is the high liquidity reserve requirement.If the concern is risk in the banking system, the monetary authorities should encourage

MARKET STRUCTURE, LIBERALIZATION AND PERFORMANCE IN THE MALAWIAN BANKING INDUSTRY 39
the development of deposit insurance institutions, rather than resorting to direct controlthat results in financing government deficits and hence contributes to macroeconomicinstability. The policy implications that emerge from the market structure–performancehypotheses are twofold. First, the monetary authorities should determine the relativeimportance of fees and commissions vis-a-vis interest income in the revenue function ofbanks, to examine the extent to which each component is subject to abuse of monopolypower. Thus, if the concern is monopoly power, interest margins are not the only sourcesof revenue that exist in multi-service firms such as banks. Second, the current ownershipstructure in the banking industry, in which the state has a dominant ownership position,facilitates collusion. The government should therefore encourage new entry in commercialbanking activities, for instance by divesting its ownership to the private sector in thefinancial sector. The current state of competition in the banking system is fringe, withtwo banks accounting for 75% of the market and the other nine banks only 25%.
Nonetheless, we require further research to understand the institutional frameworkand operations of financial institutions in Malawi. First, there is need to determine thespecific components of income-earning services that may be subject to abuse of monopolypower. Second, there is need to further test the SCP hypothesis after a long period ofcompetitive banking activities. The dominant commercial banks in this study startedfacing competition in similar services only in 1995, and it would be interesting to studythe trend in monopoly power in the post-1995 period. Finally, the issue of the effectivenessof bank supervision during and after the liberalization period has not been investigatedand requires further research in the Malawian banking industry.

40 RESEARCH PAPER 108
Notes
1. See surveys by Clark (1986), Evanoff and Fortier (1988), and Gilbert (1984).2. Chipeta and Mkandawire (1991) estimated that in terms of credit extended to the
private sector, the informal sector is larger than the formal and semi-formal sectors.3. Financial institutions were defined in the Banking Act of 1965 as those institutions
carrying out banking business that were not commercial banks, discount housesor an accepting house.
4. However, the new Reserve Bank of Malawi Act of 1989 gives powers to the centralbank to prescribe credit ceilings for banks and financial institutions aimed at limitingthe availability of credit in the economy (under section 33 of the act).
5. The Banking Act of 1989 defines financial institutions as those whose regularbusiness consists of granting loans, advances and credit facilities and whosebusiness is not financed by soliciting deposits from the public. These includepension funds, insurance companies, investment funds and investment companies.
6. See Shaw (1973), Aryeetey et al. (1997), and Seck and El Nil (1993). Gibson andTsakalotos (1994) provide a good review of the benefits of financial liberalizationand its limitations.
7. However, excessive competition may bring about unproductive and potentiallydestabilizing speculative activity such as foreign exchange speculation, which maycreate instability in the banking system.
8. See Klein (1971) and Santomore (1984) for an extensive survey of models of thebanking firm.
9. See Klein (1971), Santomore (1984) and Mullineaux (1978).10. See Scherer and Ross (1990), Lee (1992), and George and Joll (1971) for a review
of studies in manufacturing industries.11. See surveys by Gilbert (1984), Smirlock (1985), Evanoff and Fortier (1988), and
Clark (1986).12. Maudos (1998) and Smirlock (1985) give alternative explanations of the traditional
and efficient market hypotheses when both variables are significant.13. See Gilbert (1984) for alternative measures of bank performance that have been
used in empirical work.14. See Gilbert (1984), Morris (1984), Civelek and Al-Alami (1991), Berger and
Hannan (1989), and Molyneux and Forbes (1995) for some of the studies.15. However, see Demsetz (1973) and Baumol (1982) for alternative hypotheses of
efficient structure and contestable markets, respectively.

MARKET STRUCTURE, LIBERALIZATION AND PERFORMANCE IN THE MALAWIAN BANKING INDUSTRY 41
16. See Davies (1979), Rose and Fraser (1976), and Vanlommel et al. (1977) for adiscussion of alternative concentration measures used in empirical studies.
17. See Sleuwaegen and Dehandschutter (1986) and Dansby and Willig (1979).18. See Morris (1984) and Gilbert (1984) for a review of some of the studies. Other
studies include Smirlock (1985) and Evanoff and Fortier (1988).19. See Mitchell (1984) and Evanoff and Fortier (1988).20. Civelek and Al-Alami (1991), Molyneux and Forbes (1995), and Agu (1992) use
the loan–deposit ratio.21. See Evanoff and Fortier (1988) and Smirlock (1985).22. This positive trend is also noted by Aryeetey et al. (1997) using 1980 and 1992
figures.23. These simple correlation coefficients were not statistically significant using the t-
test.24. See Aryeetey et al. (1997) and Chipeta and Mkandawire (1996).25. The efficient market hypothesis is still rejected if we exclude the market
concentration variable. The coefficient of market share is negative and/orstatistically insignificant.

42 RESEARCH PAPER 108
References
Agu, C.C. 1992. “Analysis of the determinants of the Nigerian banking systems’ profitsand profitability performance”. Savings and Development, 16 (4): 353–369.
Aryeetey, E., H. Hettige, M. Nissanke and W. Steel. 1997. “Financial market fragmentationand reforms in Ghana, Malawi, Nigeria and Tanzania”. The World Bank EconomicReview, 11 (2): 195–218.
Bain, J.S. 1951. “The relation of profit rate to industry concentration: Americanmanufacturing, 1936–1940”. Quarterly Journal of Economics, 65 (3): 293–324.
Baumol, W. 1982. “Contestable markets: An uprising in the theory of industry structure”.American Economic Review, 72 (1): 1–15.
Berger, A.N. and T.H. Hannan. 1989. “The price–concentration relationship in banking”.Review of Economics and Statistics, 71 (2): 291–299.
Caves, R.E. 1981. “Diversification and seller concentration: Evidence from changes1963–72”. Review of Economics and Statistics, 63 (2): 289–293.
Chipeta, C. and M.L.C. Mkandawire. 1996. “Financial integration and development insub-Saharan Africa: The formal and semi-formal financial sectors in Malawi”.Working Paper 89, Overseas Development Institute, London.
Chipeta, C. and M.L.C. Mkandawire. 1992. Links between the Informal and Formal/Semi-Formal Financial Sectors in Malawi. AERC Research Paper No. 14. Nairobi:Initiative Publishers.
Chipeta, C. and M.L.C. Mkandawire. 1991. The Informal Financial Sector andMacroeconomic Adjustment in Malawi. AERC Research Paper No. 4. Nairobi:Initiative Publishers.
Civelek, M.M. and M.W. Al-Alami. 1991. “An empirical investigation of theconcentration–profitability relationship in the Jordanian banking system”. Savingsand Development, 15 (3): 247–259.
Clark, J.A. 1986. “Single-equation, multiple regression methodology: Is it an appropriatemethodology for the structure–performance relationship in banking”. Journal ofMonetary Economics, 18 (3): 259–312.
Dansby, R. E. and R.D. Willig. 1979. “Industrial performance gradient index”. AmericanEconomic Review, 69 (3): 249–260.
Davies, S. 1979. “Choosing between concentration indices: The iso-concentration curve”.Economica, 46 (181): 67–75.
Demsetz, H. 1973. “Industry structure, market rivalry and public policy”. Journal ofLaw and Economics, 16 (1): 1–19.

MARKET STRUCTURE, LIBERALIZATION AND PERFORMANCE IN THE MALAWIAN BANKING INDUSTRY 43
Diaz-Alejando, C. 1985. “Good-bye financial repression, hello financial crash”. Journalof Development Economics, 19 (1–2): 1–24.
Evanoff, D.D. and D.L. Fortier. 1988. “Reevaluation of the structure–conduct–performance paradigm in banking”. Journal of Financial Services Research, 1(3): 249–60.
Fischer, B. 1989. “Savings mobilization in developing countries: Bottlenecks and reformproposals”. Savings and Development, 13 (2): 117–131.
Ganiza, M. 1995. “The effects of nonbank financial intermediaries on the demand formoney: The case of Malawi”. Unpublished MA Thesis, University of Malawi,Department of Economics, Zomba.
George, K.D. and C. Joll. 1971. Industrial Organisation: Competition, Growth andStructural Change. London: George Allen and Unwin.
Gibson, H.D. and E. Tsakalotos. 1994. “The scope and limits of financial liberalizationin developing countries: A critical survey”. Journal of Development Studies, 30(3): 578–628.
Gilbert, R.A. 1984. “Bank market structure and competition: A survey”. Journal of Money,Credit and Banking, 16 (4): 617–45.
Gonzales Arrieta, G. 1988. “Interest rates, savings and growth in LDCs: An assessmentof recent empirical research”. World Development, 16 (5): 589–605.
Keeton, W.R. and L. Matsunaga. 1985. “Profits of commercial banks in Tenth Districtstates”. Economic Review of Federal Reserve Bank of Kansas City, June: 3–22.
Klein, M.A. 1971. “A theory of the banking firm”. Journal of Money, Credit and Banking,3: 205–218.
Lee, N. 1992. “Market structure and trade in developing countries”. In G. K. Helleiner,ed., Trade Policy, Industrialisation and Development: New Perspectives. Oxford:Clarendon Press.
Malawi Chambers of Commerce and Industry (MCCI).1992. Malawi Business, XL (Aug/Sept).
Malawi Chambers of Commerce and Industry (MCCI). 1990. “Private sector investment:Policies and prospects”. Position paper.
Malawi Development Corporation (MDC) and Economic Resource Ltd (ERL). 1989.Investing in Malawi. Blantyre: MDC.
Malawi Government. 1989. Malawi Government Gazette. Zomba: Government Press.Mamba, P. 1996. “Structural adjustment programmes in Malawi”. Paper presented at
Chancellor College, University of Malawi.Maudos, J. 1998. “Market structure and performance in Spanish banking using a direct
measure of efficiency”. Applied Financial Economics, 8: 191–200.McKinnon, R.I. 1973. Money and Capital in Economic Development. Washington, D.C.:
The Brookings Institution.Mitchell, K. 1984. “Capital adequacy at commercial banks”. Economic Review of Federal
Reserve Bank of Kansas City, Sept/Oct: 17–30.Molyneux, P. and W. Forbes. 1995. “Market structure and performance in European
banking”. Applied Economics, 27 (1): 155–159.

44 RESEARCH PAPER 108
Molyneux, P., D.M. Lloyd-Williams and J. Thornton. 1994. “Market structure andperformance in Spanish banking”. Journal of Banking and Finance, 18: 433–444.
Morris, C. 1985. “Banking market structure in Tenth District, 1973–83". EconomicReview of Federal Reserve Bank of Kansas City, July/August: 18–31.
Morris, C. 1984. “The competitive effects of interstate banking”. Economic Review ofFederal Reserve Bank of Kansas City, November: 3–16.
Mrak, M. 1989. “Role of informal financial sector in the mobilization and allocation ofhousehold savings: The case of Zambia”. Savings and Development, 13 (1): 65–68.
Mullineaux, D. 1978. “Economies of scale and organisational efficiency in banking: Aprofit function approach”. Journal of Finance, 28 (1): 259–280.
Ncube, M. and L.W. Senbet. 1994. “Perspectives on financial regulation and liberalizationin Africa under incentive problems and asymmetric information”. Paper presentedat the AERC Research Workshop, Nairobi, 2–8 December.
Nissanke, M. 1994. “Financial policies and intermediation performance”. In W. VanDer Geest, ed., Negotiating Structural Adjustment in Africa. London: James Currey.
Nyong, M.O. 1990. “Market structure, risk and profitability in banking: The Quiet Lifehypothesis and relative economic efficiency”. Development Policy Review, 8 (2):179–201.
Peltzman, S. 1977. “The gains and losses from industrial concentration”. Journal ofLaw and Economics, 20 (October): 229–263.
Rose, S.A. and D.R. Fraser. 1976. “The relationship between stability and change inmarket structure: An analysis of bank prices”. Journal of Industrial Economics,24 (4): 251–266.
Santomore, A.M. 1984. “Modelling the banking firm: A survey”. Journal of Money,Credit and Banking, 16 (4): 576–602.
Scherer, F. M. and D. Ross. 1990. Industrial Market Structure and Economic Performance.Boston: Houghton Mifflin Company.
Seck, D. and Y.H. El Nil. 1993. “Financial liberalization in Africa”. World Development,21 (11): 1867–1881.
Shaw, E.M. 1973. Financial Deepening in Economic Development. Oxford: OxfordUniversity Press.
Silumbu, E.B.D. 1990. “Exchange rate management, macro-credit restraint, and structuraladjustment in Malawi during 1981–1987”. University of Malawi, Department ofEconomics, Working Paper No. 7.
Sleuwaegen, L. and W. Dehandschutter. 1986. “The critical choice between theconcentration ratio and the H-index in assessing industry performance”. Journalof Industrial Economics, 35 (2): 193–208.
Smirlock, M. 1985. “Evidence on the (non)relationship between concentration andprofitability in banking”. Journal of Money, Credit and Banking, 17 (1): 69–83.
Soyibo, A. and F. Adekanye. 1992a. Financial System Regulation, Deregulation andSavings Mobilization in Nigeria. AERC Research Paper No. 11. Nairobi: InitiativePublishers.

MARKET STRUCTURE, LIBERALIZATION AND PERFORMANCE IN THE MALAWIAN BANKING INDUSTRY 45
Soyibo, A. and F. Adekanye. 1992b. The Nigerian Banking System in the Context ofPolicies of Financial Regulation and Deregulation. AERC Research Paper No.17. Nairobi: Initiative Publishers.
Vanlommel, E., B. de Brabander and D. Liebaers. 1977. “Industrial concentration inBelgium: Empirical comparison of alternative seller concentration measures”.Journal of Industrial Economics, 26 (1): 1–20.
World Bank. 1991. Malawi: Financial Sector and Enterprise Development Project. ReportNo. 9096-MAI.
World Bank. 1989. Malawi: Industrial Sector Memorandum. Washington D.C.: The WorldBank.

46 RESEARCH PAPER 108
Appendix A: Portfolio theory approach of thebanking firm
Assume that the bank manager (owner) has an exponential utility function that isconcave in the uncertain end of period profit. Maximization of expected utility is
equivalent to maximization of the certainty equivalent of profit:
CE E b( ) ( ) ( / )π π σπ= − 2 2 (A1)
subject to a balanced sheet constraint, where E0 is the expectations operator and b is a
measure of the bank's absolute risk aversion. Profit, variance and the balance sheetconstraint are expressed, respectively, as:
π = − − −==
∑∑( ) ( )r c A r c Di i i k k kk
n
i
m
11(A2)
σ π ππ2 2= −E E[( ( )) ] (A3)
A Dii
m
kk
n
= =∑ ∑=
1 1(A4)
where Ai and Dk are a feasible set of assets and liabilities, ri and rk are interesting rateson the ith assets and kth liability, and ci and ck are per unit cost of producing each of thei asset and k liabilities.
Under the assumption of quantity uncertainty, the variance can be written as:
σ σ σ σπ2 2 2 2 2
111 1
2= − + + + − −=== = ≠∑∑∑ ∑( ) ( ) ( )( )
( )
r c r c r c r ci i Ai k k Dki
m
k
n
i
m
i i j j Aijj i j
m

MARKET STRUCTURE, LIBERALIZATION AND PERFORMANCE IN THE MALAWIAN BANKING INDUSTRY 47
+ + + + − += = ≠ = =∑ ∑ ∑ ∑2 2
1 1 1k l
n
k k l l Dkll k l
n
i
m
i i k k AiDkk
n
r c r c r c r c( )( ) ( )( )( )
σ σ (A1.5)
Differentiating the Lagrangian function Φ with respect to interest rates, ri and rk ,
assuming that all variances and convariances are insensitive to changes in interest rates,obtains the following first-order conditions:
A + )r/A)(c - r( = r/ iiiiii δδδδΦ
- (b/2) 2 (r - c ) + 2 (r - c ) + 2 (r + c ) i i Ai2
i j
j j Aij
k
k k AiDkσ σ σ≠∑ ∑
- ( A / r ) = 0i iλ δ δ (A6)
δ δ δ δΦ/ r = - (r + c )( D / r ) + D k k k k k k
- (b/2) 2 (r + c ) + 2 (r + c ) + 2 (r - c ) k k Dk2
k l
l l Dkl
i
i i AiDkσ σ σ≠
∑ ∑
- ( D / r ) = 0k kλ δ δ (A7)
Assuming uncertainty in asset demand and deposit supply given the selection of ri andr
k, the bank’s optimality condition from maximizing (A1) subject to (A4) with respect to
r1 and r
k, for all i and k is:
iAi
ii i
r 1 + 1
e - c -
b
(deltaA / r )
δ
x (r - c ) + (r - c ) + (r + c )i i Ai2
j=1 i_j
m
j j Aij
k=1
n
k k AiDkσ σ σ∑ ∑
= r 1 - 1
e + c +
b
( D / r ) k
Dkk
k k
δ δ

48 RESEARCH PAPER 108
x (r + c ) + (r + c ) + (r - c )k k Dk2
l=1 k_l
n
l l Dkl
i=1
m
i i AiDkσ σ σ∑ ∑
(A8)
where e represents respective elasticities.
QED

MARKET STRUCTURE, LIBERALIZATION AND PERFORMANCE IN THE MALAWIAN BANKING INDUSTRY 49
Appendix B: Bank deposits and advances
Table B1: Structure of deposits by type of bank in thousand kwacha
Year Commercial bank Non-bank financial Ratio of NBFI deposits(CB) deposits institution (NBFI) to CB deposits
deposits
1970 32943 8934 27.12
1971 34943 10279 29.42
1972 44347 11319 25.52
1973 55522 14032 25.27
1974 73326 17994 24.54
1975 83314 17296 20.76
1976 94961 16760 17.65
1977 121906 17829 14.63
1978 141944 22659 15.96
1979 174667 24790 14.19
1980 188011 29522 15.70
1981 236869 34756 14.67
1982 242471 43920 18.11
1983 244406 57729 23.62
1984 317649 84427 26.58
1985 330454 79421 24.03
1986 389524 92352 23.71
1987 519748 128537 24.73
1988 635101 205235 32.32
1989 665393 243028 36.52
1990 791156 261285 33.03
1991 936343 287609 30.72
1992 1115531 420447 37.69
1993 1525529 648304 42.50
1994 2371088 779089 32.86
Sources: RBM (various), Economic and Financial Review; annual reports and accounts for individual banks.

50 RESEARCH PAPER 108Ta
ble
B2:
Co
mm
erci
al b
anks
’ ad
van
ces
by
eco
no
mic
act
ivit
y, 1
970–
1994
Tho
usan
ds o
f Mal
awi k
wac
haP
ropo
rtio
n of
the
tota
l (pe
rcen
t)Ye
arA
gric
ultu
reM
anuf
actu
ring
Dis
trib
utio
nO
ther
Tota
lA
gric
ultu
reM
anuf
actu
ring
Dis
trib
utio
nO
ther
(Tra
de)
(Tra
de)
1970
2086
4526
7406
7620
2163
89.
6420
.92
34.2
335
.22
1971
3015
4834
1053
791
7027
556
10.9
417
.54
38.2
433
.28
1972
3306
5617
1263
311
399
3295
510
.03
17.0
438
.33
34.5
919
7357
0523
0813
284
7886
2918
319
.55
7.91
45.5
227
.02
1974
7763
3976
2622
987
3046
698
16.6
28.
5156
.17
18.6
919
7513
606
6059
2501
310
549
5522
724
.64
10.9
745
.29
19.1
019
7627
872
7652
2132
814
890
7174
238
.85
10.6
729
.73
20.7
519
7730
190
1267
529
980
1350
186
346
34.9
614
.68
34.7
215
.64
1978
5376
313
552
2519
328
344
1208
5244
.49
11.2
120
.85
23.4
519
7981
853
9667
3675
242
333
1706
0547
.98
5.67
21.5
424
.81
1980
9267
166
8916
548
5633
717
2245
53.8
03.
889.
6132
.71
1981
9427
260
5320
387
6907
718
9789
49.6
73.
1910
.74
36.4
019
8211
5128
7819
1972
379
444
2221
1451
.83
3.52
8.88
35.7
719
8313
8520
1083
830
684
8404
126
4083
52.4
54.
1011
.62
31.8
219
8411
3463
1978
029
791
4126
220
4296
55.5
49.
6814
.58
20.2
019
8511
7866
9849
2881
024
668
1811
9365
.05
5.44
15.9
013
.61
1986
1334
6415
261
4153
442
113
2323
7257
.44
6.57
17.8
718
.12
1987
1090
3724
690
3469
934
936
2033
6253
.62
12.1
417
.06
17.1
819
8892
323
4861
171
749
5761
127
0294
34.1
617
.98
26.5
421
.31
1989
1257
0783
403
1054
6661
521
3760
9733
.42
22.1
828
.04
16.3
619
9013
6201
1192
2217
3636
8395
351
3012
26.5
523
.24
33.8
516
.36
1991
1425
9217
1811
2262
0211
6414
6570
1921
.70
26.1
534
.43
17.7
219
9221
9917
1342
5134
6548
1819
5588
2671
24.9
115
.21
39.2
620
.61
1993
8430
852
409
5305
356
071
2458
4134
.29
21.3
221
.58
22.8
119
9428
3001
3268
8526
8754
2092
2110
8786
126
.01
30.0
524
.70
19.2
3
Sou
rces
: RB
M (
vario
us)
Eco
nom
ic a
nd F
inan
cial
Rev
iew
; ann
ual r
epor
ts a
nd a
ccou
nts
for
indi
vidu
al b
anks
.

MARKET STRUCTURE, LIBERALIZATION AND PERFORMANCE IN THE MALAWIAN BANKING INDUSTRY 51A
pp
end
ix C
:V
aria
ble
s u
sed
in t
he
reg
ress
ion
mo
del
YE
AR
R
OA
R
OE
R
OC
C
RM
S A
SS
ET
CA
PA
ST
LTO
AS
TD
DT
DE
PM
KD
EP
MK
GR
O
1970
1.45
723
.600
7.80
791
.109
78.6
6645
000
18.6
5958
.025
60.4
1641
877
19.4
219
710.
539
9.16
03.
039
91.4
3377
.269
4247
917
.741
62.8
6265
.678
4522
27.
9919
721.
885
33.5
5615
.128
92.6
9979
.666
5066
012
.462
65.2
3554
.766
5566
623
.09
1973
3.43
458
.097
43.4
2493
.453
79.8
2660
289
7.90
763
.773
58.7
2369
554
24.9
519
743.
920
71.9
3444
.821
94.6
8180
.296
8035
48.
746
56.2
6952
.865
9132
031
.29
1975
5.26
778
.050
44.4
6295
.002
82.8
0994
510
11.8
4652
.478
60.5
3610
0610
10.1
719
765.
782
82.5
9546
.823
95.3
8784
.998
1083
3912
.348
67.1
2547
.850
1117
2111
.04
1977
3.74
351
.493
32.5
8796
.036
87.2
4113
7725
11.4
8670
.809
42.9
8813
9735
25.0
719
785.
347
75.1
8731
.638
96.3
1686
.234
1708
1116
.900
69.7
9444
.804
1646
0317
.80
1979
2.49
335
.099
13.9
7096
.620
87.5
7121
2612
17.8
4775
.216
35.7
3319
9457
21.1
719
80-0
.031
-0.4
90-0
.490
96.4
9686
.429
2372
6320
.758
77.9
0329
.993
2175
339.
0619
811.
165
16.5
2916
.529
96.7
3387
.204
2710
4012
.607
60.6
7931
.673
2716
2524
.87
1982
0.40
06.
019
6.01
995
.763
84.6
6429
2329
17.0
5564
.091
33.8
5028
6391
5.44
1983
1.10
316
.459
16.4
5995
.181
80.8
9330
9509
21.0
3458
.504
31.0
2030
2135
5.55
1984
0.79
214
.221
14.2
2295
.725
79.0
0239
1268
18.8
1642
.308
29.3
7740
2076
33.0
819
852.
467
41.1
9241
.193
94.5
9580
.623
4413
3925
.125
45.1
0632
.064
4098
751.
9419
862.
919
49.1
2249
.122
94.2
8680
.835
5374
4427
.523
43.1
9936
.668
4818
7617
.57
1987
2.95
153
.792
53.7
9293
.964
79.8
4365
0101
20.0
5135
.349
32.4
6065
0965
35.0
919
883.
858
54.5
0454
.504
92.4
5975
.577
7346
9013
.555
35.8
8638
.843
8403
3629
.09
1989
4.36
856
.402
56.4
0288
.908
73.2
4776
6524
13.1
9448
.200
36.1
2790
8421
8.10
1990
6.26
370
.105
70.1
0688
.622
75.1
7394
8795
16.6
1554
.336
38.3
7010
5244
115
.85
1991
5.24
749
.271
49.2
7186
.263
76.5
0211
0202
015
.034
62.8
8840
.655
1223
952
16.3
019
927.
270
65.3
0665
.306
82.3
9572
.627
1351
150
17.4
3862
.745
42.5
7915
3597
825
.49
Not
es:
RO
A,
RO
E,
RO
C,
CR
3, C
AP
AS
T, L
TO
AS
T, D
DT
DE
P a
nd M
KT
GR
O a
re m
easu
red
in p
erce
ntag
es,
whi
le A
SS
ET
and
MK
TD
EP
are
in t
hous
ands
of
Mal
awi
kwac
ha.
Sou
rce:
Aut
hor’
s ca
lcul
atio
ns.

52 RESEARCH PAPER 108
Other publications in the AERC Research Papers Series:
Structural Adjustment Programmes and the Coffee Sector in Uganda, by Germina Ssemogerere, ResearchPaper 1.
Real Interest Rates and the Mobilization of Private Savings in Africa, by F.M. Mwega, S.M. Ngola and N.Mwangi, Research Paper 2.
Mobilizing Domestic Resources for Capital Formation in Ghana: The Role of Informal FinancialMarkets, by Ernest Aryeetey and Fritz Gockel, Research Paper 3.
The Informal Financial Sector and Macroeconomic Adjustment in Malawi, by C. Chipeta and M.L.C.Mkandawire, Research Paper 4.
The Effects of Non-Bank Financial Intermediaries on Demand for Money in Kenya, by S.M. Ndele,Research Paper 5.
Exchange Rate Policy and Macroeconomic Performance in Ghana, by C.D. Jebuni, N.K. Sowa and K.S.Tutu, Research Paper 6.
A Macroeconomic-Demographic Model for Ethiopia, by Asmerom Kidane, Research Paper 7.Macroeconomic Approach to External Debt: The Case of Nigeria, by S. Ibi Ajayi, Research Paper 8.The Real Exchange Rate and Ghana’s Agricultural Exports, by K. Yerfi Fosu, Research Paper 9.The Relationship between the Formal and Informal Sectors of the Financial Market in Ghana, by E.
Aryeetey, Research Paper 10.Financial System Regulation, Deregulation and Savings Mobilization in Nigeria, by A. Soyibo and F.
Adekanye, Research Paper 11.The Savings-Investment Process in Nigeria: An Empirical Study of the Supply Side, byA. Soyibo,
Research Paper 12.Growth and Foreign Debt: The Ethiopian Experience, 1964–86, by B. Degefe, Research Paper 13.Links between the Informal and Formal/Semi-Formal Financial Sectors in Malawi, by C. Chipeta and
M.L.C. Mkandawire, Research Paper 14.The Determinants of Fiscal Deficit and Fiscal Adjustment in Côte d’Ivoire, by O. Kouassy and B.
Bohoun, Research Paper 15.Small and Medium-Scale Enterprise Development in Nigeria, by D.E. Ekpenyong and M.O. Nyong,
Research Paper 16.The Nigerian Banking System in the Context of Policies of Financial Regulation and Deregulation, by A.
Soyibo and F. Adekanye, Research Paper 17.Scope, Structure and Policy Implications of Informal Financial Markets in Tanzania, by M. Hyuha, O.
Ndanshau and J.P. Kipokola, Research Paper 18.European Economic Integration and the Franc Zone: The Future of the CFA Franc After 1996. Part I:
Historical Background and a New Evaluation of Monetary Cooperation in the CFA Countries, byAllechi M’Bet and Madeleine Niamkey, Research Paper 19.
Revenue Productivity Implications of Tax Reform in Tanzania by Nehemiah E. Osoro, Research Paper 20.The Informal and Semi-formal Sectors in Ethiopia: A Study of the Iqqub, Iddir and Savings and Credit
Cooperatives, by Dejene Aredo, Research Paper 21.Inflationary Trends and Control in Ghana, by Nii K. Sowa and John K. Kwakye, Research Paper 22.Macroeconomic Constraints and Medium-Term Growth in Kenya: A Three-Gap Analysis, by F.M.
Mwega, N. Njuguna and K. Olewe-Ochilo, Research Paper 23.The Foreign Exchange Market and the Dutch Auction System in Ghana, by Cletus K. Dordunoo,
Research Paper 24.Exchange Rate Depreciation and the Structure of Sectoral Prices in Nigeria under an Alternative Pricing
Regime, 1986–89, by Olu Ajakaiye and Ode Ojowu, Research Paper 25.Exchange Rate Depreciation, Budget Deficit and Inflation - The Nigerian Experience, by F. Egwaikhide,
L. Chete and G. Falokun, Research Paper 26.Trade, Payments Liberalization and Economic Performance in Ghana, by C.D. Jebuni, A.D. Oduro and
K.A. Tutu, Research Paper 27.Constraints to the Development and Diversification of Non-Traditional Exports in Uganda, 1981–90, by
G. Ssemogerere and L.A. Kasekende, Research Paper 28.

MARKET STRUCTURE, LIBERALIZATION AND PERFORMANCE IN THE MALAWIAN BANKING INDUSTRY 53
Indices of Effective Exchange Rates: A Comparative Study of Ethiopia, Kenya and the Sudan, byAsmerom Kidane, Research Paper 29.
Monetary Harmonization in Southern Africa, by C. Chipeta and M.L.C. Mkandawire, Research Paper 30.Tanzania’s Trade with PTA Countries: A Special Emphasis on Non-Traditional Products, by Flora
Mndeme Musonda, Research Paper 31.Macroeconomic Adjustment, Trade and Growth: Policy Analysis Using a Macroeconomic Model of
Nigeria, by C. Soludo, Research Paper 32.Ghana: The Burden of Debt Service Payment under Structural Adjustment, by Barfour Osei, Research
Paper 33.Short-Run Macroeconomic Effects of Bank Lending Rates in Nigeria, 1987-91: A Computable General
Equilibrium Analysis, by D. Olu Ajakaiye, Research Paper 34.Capital Flight and External Debt in Nigeria, by S. Ibi Ajayi, Research Paper 35.Institutional Reforms and the Management of Exchange Rate Policy in Nigeria, by Kassey Odubogun,
Research Paper 36.The Role of Exchange Rate and Monetary Policy in the Monetary Approach to the Balance of Payments:
Evidence from Malawi, by Exley B.D. Silumbu, Research Paper 37.Tax Reforms in Tanzania: Motivations, Directions and Implications, by Nehemiah E. Osoro, Research
Paper 38.Money Supply Mechanisms in Nigeria, 1970–88, by Oluremi Ogun and Adeola Adenikinju, Research
Paper 39.Profiles and Determinants of Nigeria’s Balance of Payments: The Current Account Component, 1950–88,
by Joe U. Umo and Tayo Fakiyesi, Research Paper 40.Empirical Studies of Nigeria’s Foreign Exchange Parallel Market I: Price Behaviour and Rate Determi-
nation, by Melvin D. Ayogu, Research Paper 41.The Effects of Exchange Rate Policy on Cameroon’s Agricultural Competitiveness, by Aloysius Ajab
Amin, Research Paper 42.Policy Consistency and Inflation in Ghana, by Nii Kwaku Sowa, Research Paper 43.Fiscal Operations in a Depressed Economy: Nigeria, 1960-90, by Akpan H. Ekpo and John E. U.
Ndebbio, Research Paper 44.Foreign Exchange Bureaus in the Economy of Ghana, by Kofi A. Osei, Research Paper 45.The Balance of Payments as a Monetary Phenomenon: An Econometric Study of Zimbabwe’s Experience,
by Rogers Dhliwayo, Research Paper 46.Taxation of Financial Assets and Capital Market Development in Nigeria, by Eno L. Inanga and Chidozie
Emenuga, Research Paper 47.The Transmission of Savings to Investment in Nigeria, by Adedoyin Soyibo, Research Paper 48.A Statistical Analysis of Foreign Exchange Rate Behaviour in Nigeria’s Auction, by Genevesi O. Ogiogio,
Research Paper 49.The Behaviour of Income Velocity in Tanzania 1967–1994, by Michael O.A. Ndanshau, Research Paper
50.Consequences and Limitations of Recent Fiscal Policy in Côte d’Ivoire, by Kouassy Oussou and Bohoun
Bouabre, Research Paper 51.Effects of Inflation on Ivorian Fiscal Variables: An Econometric Investigation, by Eugene Kouassi,
Research Paper 52.European Economic Integration and the Franc Zone: The Future of the CFA Franc after 1999, Part II,
by Allechi M’Bet and Niamkey A. Madeleine, Research Paper 53.Exchange Rate Policy and Economic Reform in Ethiopia, by Asmerom Kidane, Research Paper 54.The Nigerian Foreign Exchange Market: Possibilities for Convergence in Exchange Rates, by P. Kassey
Garba, Research Paper 55.Mobilizing Domestic Resources for Economic Development in Nigeria: The Role of the Capital Market,
by Fidelis O. Ogwumike and Davidson A. Omole, Research Paper 56.Policy Modelling in Agriculture: Testing the Response of Agriculture to Adjustment Policies in Nigeria,
by Mike Kwanashie, Abdul-Ganiyu Garba and Isaac Ajilima, Research Paper 57.Price and Exchange Rate Dynamics in Kenya: An Empirical Investigation (1970–1993), by Njuguna S.
Ndung’u, Research Paper 58.

54 RESEARCH PAPER 108
Exchange Rate Policy and Inflation: The case of Uganda, by Barbara Mbire, Research Paper 59.Institutional, Traditional and Asset Pricing Characteristics of African Emerging Capital Markets, by Ino
L. Inanga and Chidozie Emenuga, Research Paper 60.Foreign Aid and Economic Performance in Tanzania, by Timothy S. Nyoni, Research Paper 61.Public Spending, Taxation and Deficits: What is the Tanzanian Evidence? by Nehemiah Osoro, Research
Paper 62.Adjustment Programmes and Agricultural Incentives in Sudan: A Comparative Study, by Nasredin A. Hag
Elamin and Elsheikh M. El Mak, Research Paper 63.Intra-industry Trade between Members of the PTA/COMESA Regional Trading Arrangement, by Flora
Mndeme Musonda, Research Paper 64.Fiscal Operations, Money Supply and Inflation in Tanzania, by A.A.L. Kilindo, Research Paper 65.Growth and Foreign Debt: The Ugandan Experience, by Barbara Mbire, Research Paper 66.Productivity of the Nigerian Tax System: 1970–1990, by Ademola Ariyo, Research Paper 67.Potentials for Diversifying Nigeria's Non-oil Exports to Non-Traditional Markets, by A. Osuntogun, C.C.
Edordu and B.O. Oramah, Research Paper 68.Empirical Studies of Nigeria’s Foreign Exchange Parallel Market II: Speculative Efficiency and Noisy
Trading, by Melvin Ayogu, Research Paper 69.Effects of Budget Deficits on the Current Account Balance in Nigeria: A Simulation Exercise, by Festus
O. Egwaikhide, Research Paper 70.Bank Performance and Supervision in Nigeria: Analysing the Transition to a Deregulated Economy, by
O.O. Sobodu and P.O. Akiode, Research Paper 71.Financial Sector Reforms and Interest Rate Liberalization: The Kenya Experience by R.W. Ngugi and
J.W. Kabubo, Research Paper 72.Local Government Fiscal Operations in Nigeria, by Akpan H. Ekpo and John E.U. Ndebbio, Research
Paper 73.Tax Reform and Revenue Productivity in Ghana, by Newman Kwadwo Kusi, Research Paper 74.Fiscal and Monetary Burden of Tanzania’s Corporate Bodies: The Case of Public Enterprises, by H.P.B.
Moshi, Research Paper 75.Analysis of Factors Affecting the Development of an Emerging Capital Market: The Case of the Ghana
Stock Market, by Kofi A. Osei, Research Paper 76.Ghana: Monetary Targeting and Economic Development, by Cletus K. Dordunoo and Alex Donkor,
Research Paper 77.The Nigerian Economy: Response of Agriculture to Adjustment Policies, by Mike Kwanashie, Isaac
Ajilima and Abdul-Ganiyu Garba, Research Paper 78.Agricultural Credit Under Economic Liberalization and Islamization in Sudan, by Adam B. Elhiraika and
Sayed A. Ahmed, Research Paper 79.Study of Data Collection Procedures, by Ademola Ariyo and Adebisi Adeniran, Research Paper 80.Tax Reform and Tax Yield in Malawi, by C. Chipeta, Research Paper 81.Real Exchange Rate Movements and Export Growth: Nigeria, 1960–1990, by Oluremi Ogun, Research
Paper 82.Macroeconomic Implications of Demographic Changes in Kenya, by Gabriel N. Kirori and Jamshed Ali,
Research Paper 83.An Empirical Evaluation of Trade Potential in the Economic Community of West African States, by E.
Olawale Ogunkola, Research Paper 84.Cameroon's Fiscal Policy and Economic Growth, by Aloysius Ajab Amin, Research Paper 85.Economic Liberalization and Privatization of Agricultural Marketing and Input Supply in Tanzania: A
Case Study of Cashewnuts, byNgila Mwase, Research Paper 86.Price, Exchange Rate Volatility and Nigeria’s Agricultural Trade Flows: A Dynamic Analysis, by A.A.
Adubi and F. Okunmadewa, Research Paper 87.The Impact of Interest Rate Liberalization on the Corporate Financing Strategies of Quoted Companies
in Nigeria, by Davidson A. Omole and Gabriel O. Falokun, Research Paper 88.The Impact of Government Policy on Macroeconomic Variables, by H.P.B. Moshi and A.A.L. Kilindo,
Research Paper 89.

MARKET STRUCTURE, LIBERALIZATION AND PERFORMANCE IN THE MALAWIAN BANKING INDUSTRY 55
External Debt and Economic Growth in Sub-Saharan African Countries: An Econometric Study, byMilton A. Iyoha, Research Paper 90.
Determinants of Imports in Nigeria: A Dynamic Specification, by Festus O. Egwaikhide, Research Paper91.
Macroeconomic Effects of VAT in Nigeria: A Computable General Equilibrium Analysis, by Prof. D. OluAjakaiye, Research Paper 92.
Exchange Rate Policy and Price Determination in Botswana, by Jacob K. Atta, Keith R. Jefferis, ItaMannathoko and Pelani Siwawa-Ndai, Research Paper 93.
Monetary and Exchange Rate Policy in Kenya, by Njuguna S. Ndung'u, Research Paper 94.Health Seeking Behaviour in the Reform Process for Rural Households: The Case of Mwea Division,
Kirinyaga District, Kenya, by Rose Ngugi, Research Paper 95.Trade and Exchange Rate Policy Options for the CFA Countries: Simulations with a CGE Model for
Cameroon, by Dominique Njinkeu and Ernest Bamou, Research Paper 96.Trade Liberalization and Economic Performance of Cameroon and Gabon, by Ernest Bamou, Research
Paper 97.Quality Jobs or Mass Employment, by Kwabia Boateng, Research Paper 98.Real Exchange Rate Price and Agricultural Supply Response in Ethiopia: The Case of Perennial Crops,
by Asmerom Kidane, Research Paper 99.Determinants of Private Investment Behaviour in Ghana, by Yaw Asante, Research Paper 100.An Analysis of the Implementation and Stability of Nigerian Agricultural Policies, 1970–1993, by P.
Kassey Garba, Research Paper 101.Poverty, Growth and Inequality in Nigeria: A Case Study, by Ben E. Aigbokhan, Research Paper 102.The Effect of Export Earnings Fluctuations on Capital Formation in Nigeria, by Godwin Akpokodje,
Research Paper 103.Nigeria: Towards and Optimal Macroeconomic Management of Public Capital, by Melvin D. Ayogu,
Research Paper 104.International Stock Market Linkages in Southern Africa, by K.R. Jefferis, C.C. Okeahalam, and T.T.
Matome, Research Paper 105.
An Empirical Analysis of Interest Rate Spread in Kenya, by Rose W. Ngugi, Research Paper 106The Parallel Foreign Exchange Market and Macroeconomic Performance in Ethiopia, by Derrese
Degefa, Research Paper 107.