Embed Size (px)
Citation preview
Market SurveyUK Agricultural Land 2016
Savills World Research UK Rural
savills.co.uk/research
A mixed pictureValues will be more varied, but strong prices can still be achieved
Farmland values The farmland values are derived from Savills Farmland Value Survey, which is a comprehensive record of the value of a range of types and quality of bare agricultural land by region since 1992. It is based on the quarterly valuation of a static portfolio of nine types of bare land with vacant possession in 25 regions across Great Britain by a panel of Savills agricultural valuers and others who are experts in their region. It is based on local knowledge, which is sourced primarily from local transaction information, but also takes into account special purchasers, unusual properties, and the tone of the market in the area at that time.
The survey is a general indicator of market conditions at the time of the survey, with no reference to future market conditions. The data is for general informative purposes only and should not be used as the basis of any property valuation or appraisal. Range values are not definitive and they do not indicate realisable values on a forced sale. Savills accepts no liability whatsoever for any direct or consequential loss arising from the use of this data.
FootnoteWe have revised our publicly marketed farmland supply series with the new series backdated to the beginning of 2013. The new series captures a slightly increased area but the annual changes in supply are very similar to our previous series and the overall historical contraction in long-term supply is unchanged.
We have been aware of the changing methods for marketing farms and for the past three years we have been tracking farms advertised in the regional farming press and those advertised electronically in addition to the nationally publicly marketed series we have published.
A significant number of properties are now advertised online, particularly smaller farms and many of these are no longer advertised in the printed media.
savills.co.uk/research 03
2016
An east-west divide in value growth has been created, in what was a mixed year for farmland
2015 was a year of change across the farmland markets of Great Britain. For the first time in a decade,
price falls in arable land values were recorded in the eastern counties of England, according to the Savills Farmland Value Survey.
Grassland values, generally in the west, which have lagged behind arable values, have continued to increase. This has created an east–west divide (as illustrated by the map on page 07) and also mirrors the contrasting supply dynamics, as noted on page 04, which has also been a contributory factor to supporting values in the west.
Farmers made up 50% of farmland sellers last year – the highest proportion in seven years as low commodity prices and the short-term outlook for UK agriculture prompted some to capitalise on high average land values and retire.
Farmers made up the smallest proportion of buyers since 2003 – at 43% of all transactions. Meanwhile, non-farmers including lifestyle buyers, investors and institutional/corporate buyers represented the biggest percentage of purchasers in the past 12 years.
Expansion of an existing holding was the principal motivation to buy, representing the predominant reason in more than half of all transactions, with three-quarters of those farmers who took on more land citing expansion as the reason to buy.
Just short of 176,500 acres of farmland were publicly marketed across Great Britain in 2015. This was an increase of 24%, or an additional 34,000 acres compared with 2014.
Across England, market activity increased by 16% to around 120,000 acres with a clear divide between the eastern and western regions. Increased supply was recorded in
the eastern regions, most notably in the East Midlands.
In contrast, reduced supply was recorded down the western side of England. In Scotland market activity increased 47% in 2015, which may be the result of a combination of factors including pressure on farm incomes and some pent-up activity following a year of uncertainty caused by the Scottish Referendum. Long-term investmentIn the light of recent market evidence, the short to medium-term expectations for commodity prices and therefore farm profitability, we have downgraded our forecasts for the next five years (see page 08). We expect values to be much more varied than in the past five years.
Exceptional prices may still be achieved if all the right factors come together, but conversely it is very likely that there will be more farms where potential sale prices fail to reach expectations or they fail to sell. We expect this market will last three to four years until commodity prices start to recover, following stronger global growth.
Farmland is a long-term investment and the fundamental factors supporting UK farmland value growth remain: supply is historically low, the product is finite, there are competing land uses and a variety of ownership motives will all support farmland values in the long term. n
2015 SUMMARY
Analysis of farm transactions indicates that buyer and seller motives
remained diverse in 2015See pages 04/05
Average values of ‘all types’ of farmland in England fell in the east
and increased in the westSee pages 06/07
Market evidence suggests that values will be more varied than
in the previous five yearsSee pages 08/09
Farming offers many investment routes for those willing to venture
into global marketsSee page 10
ForewordAgricultural Land
Alex LawsonDirectorFarms and Estates020 7409 [email protected]
04
Market Survey | Agricultural Land
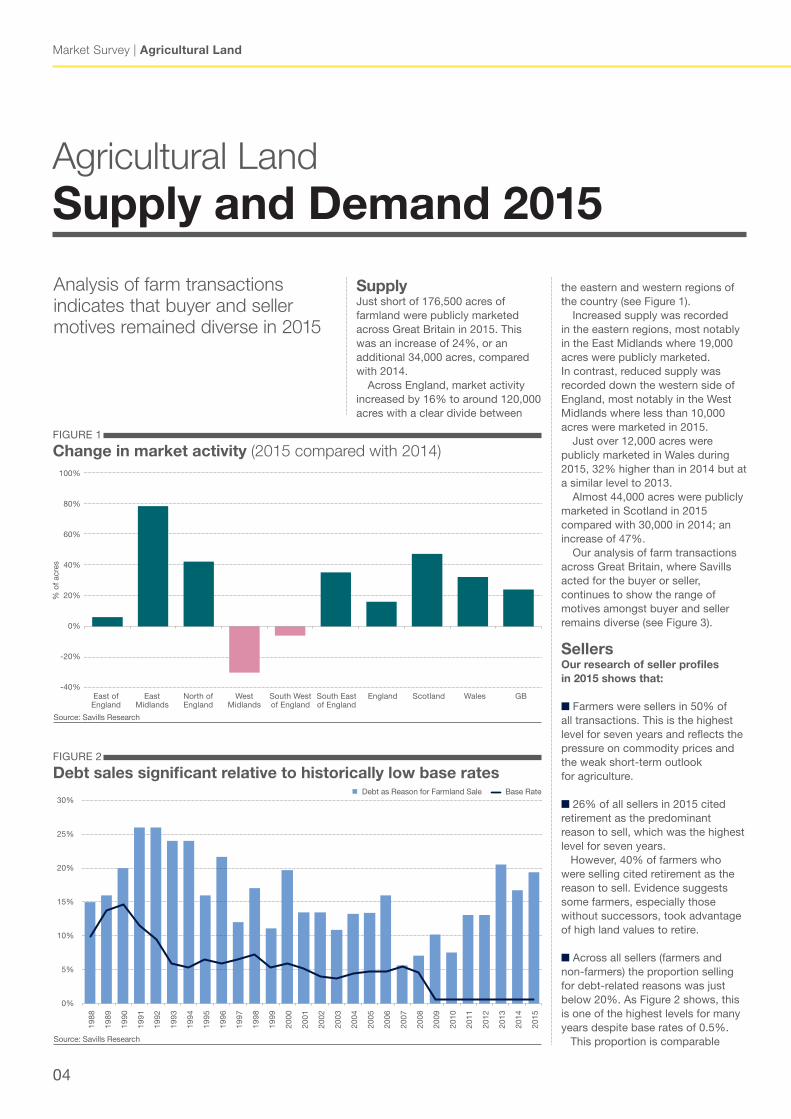
Supply Just short of 176,500 acres of farmland were publicly marketed across Great Britain in 2015. This was an increase of 24%, or an additional 34,000 acres, compared with 2014.
Across England, market activity increased by 16% to around 120,000 acres with a clear divide between
the eastern and western regions of the country (see Figure 1).
Increased supply was recorded in the eastern regions, most notably in the East Midlands where 19,000 acres were publicly marketed. In contrast, reduced supply was recorded down the western side of England, most notably in the West Midlands where less than 10,000 acres were marketed in 2015.
Just over 12,000 acres were publicly marketed in Wales during 2015, 32% higher than in 2014 but at a similar level to 2013.
Almost 44,000 acres were publicly marketed in Scotland in 2015 compared with 30,000 in 2014; an increase of 47%.
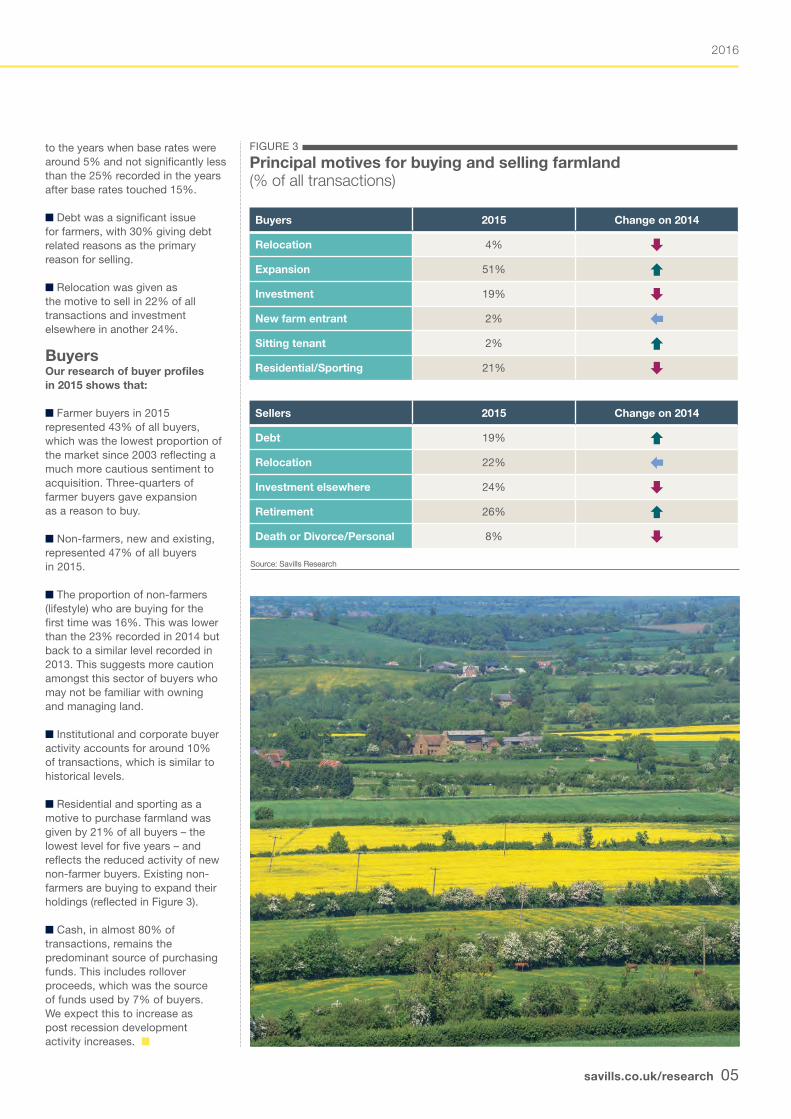
Our analysis of farm transactions across Great Britain, where Savills acted for the buyer or seller, continues to show the range of motives amongst buyer and seller remains diverse (see Figure 3).
SellersOur research of seller profiles in 2015 shows that:
n Farmers were sellers in 50% of all transactions. This is the highest level for seven years and reflects the pressure on commodity prices and the weak short-term outlook for agriculture.
n 26% of all sellers in 2015 cited retirement as the predominant reason to sell, which was the highest level for seven years. However, 40% of farmers who were selling cited retirement as the reason to sell. Evidence suggests some farmers, especially those without successors, took advantage of high land values to retire.
n Across all sellers (farmers and non-farmers) the proportion selling for debt-related reasons was just below 20%. As Figure 2 shows, this is one of the highest levels for many years despite base rates of 0.5%. This proportion is comparable
FIGURE 1
Change in market activity (2015 compared with 2014)
Source: Savills Research
Agricultural LandSupply and Demand 2015
FIGURE 2
Debt sales significant relative to historically low base rates
Source: Savills Research
Analysis of farm transactions indicates that buyer and seller motives remained diverse in 2015
East of England
EastMidlands
North ofEngland
WestMidlands
South Westof England
South Eastof England
England Scotland Wales GB
100%
80%
60%
40%
20%
0%
-20%
-40%
% o
f acr
es
30%
25%
20%
15%
10%
5%
0%
1988
1989
1990
1991
1992
1993
1994
1995
1996
1997
1998
1999
2000
2001
2002
2003
2004
2005
2006
2007
2008
2009
2010
2011
2012
2013
2014
2015
n Debt as Reason for Farmland Sale Base Rate
savills.co.uk/research 05
2016
to the years when base rates were around 5% and not significantly less than the 25% recorded in the years after base rates touched 15%.
n Debt was a significant issue for farmers, with 30% giving debt related reasons as the primary reason for selling.
n Relocation was given as the motive to sell in 22% of all transactions and investment elsewhere in another 24%.
BuyersOur research of buyer profiles in 2015 shows that:
n Farmer buyers in 2015 represented 43% of all buyers, which was the lowest proportion of the market since 2003 reflecting a much more cautious sentiment to acquisition. Three-quarters of farmer buyers gave expansion as a reason to buy.
n Non-farmers, new and existing, represented 47% of all buyers in 2015.
n The proportion of non-farmers (lifestyle) who are buying for the first time was 16%. This was lower than the 23% recorded in 2014 but back to a similar level recorded in 2013. This suggests more caution amongst this sector of buyers who may not be familiar with owning and managing land.
n Institutional and corporate buyer activity accounts for around 10% of transactions, which is similar to historical levels.
n Residential and sporting as a motive to purchase farmland was given by 21% of all buyers – the lowest level for five years – and reflects the reduced activity of new non-farmer buyers. Existing non-farmers are buying to expand their holdings (reflected in Figure 3).
n Cash, in almost 80% of transactions, remains the predominant source of purchasing funds. This includes rollover proceeds, which was the source of funds used by 7% of buyers. We expect this to increase as post recession development activity increases. n
Source: Savills Research
FIGURE 3
Principal motives for buying and selling farmland (% of all transactions)
Buyers 2015 Change on 2014
Relocation 4% Expansion 51% Investment 19% New farm entrant 2% Sitting tenant 2% Residential/Sporting 21%
Sellers 2015 Change on 2014
Debt 19% Relocation 22% Investment elsewhere 24% Retirement 26% Death or Divorce/Personal 8%
06
Market Survey | Agricultural Land
Agricultural LandAverage value change
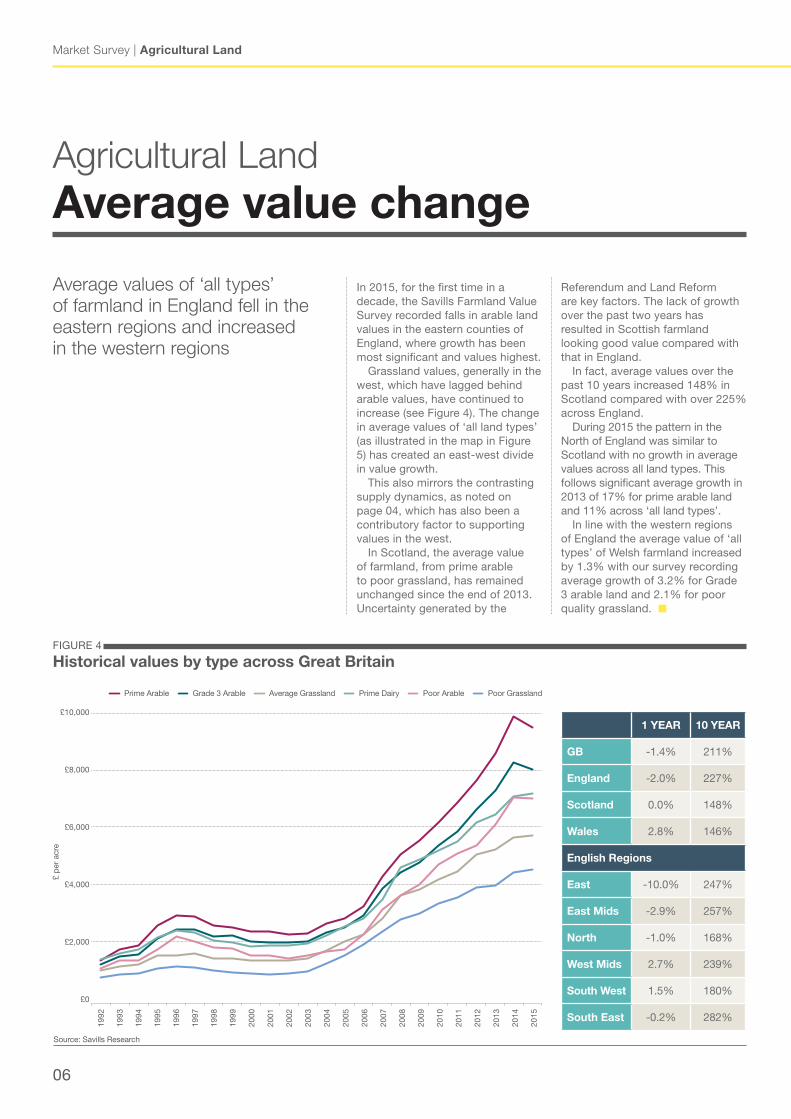
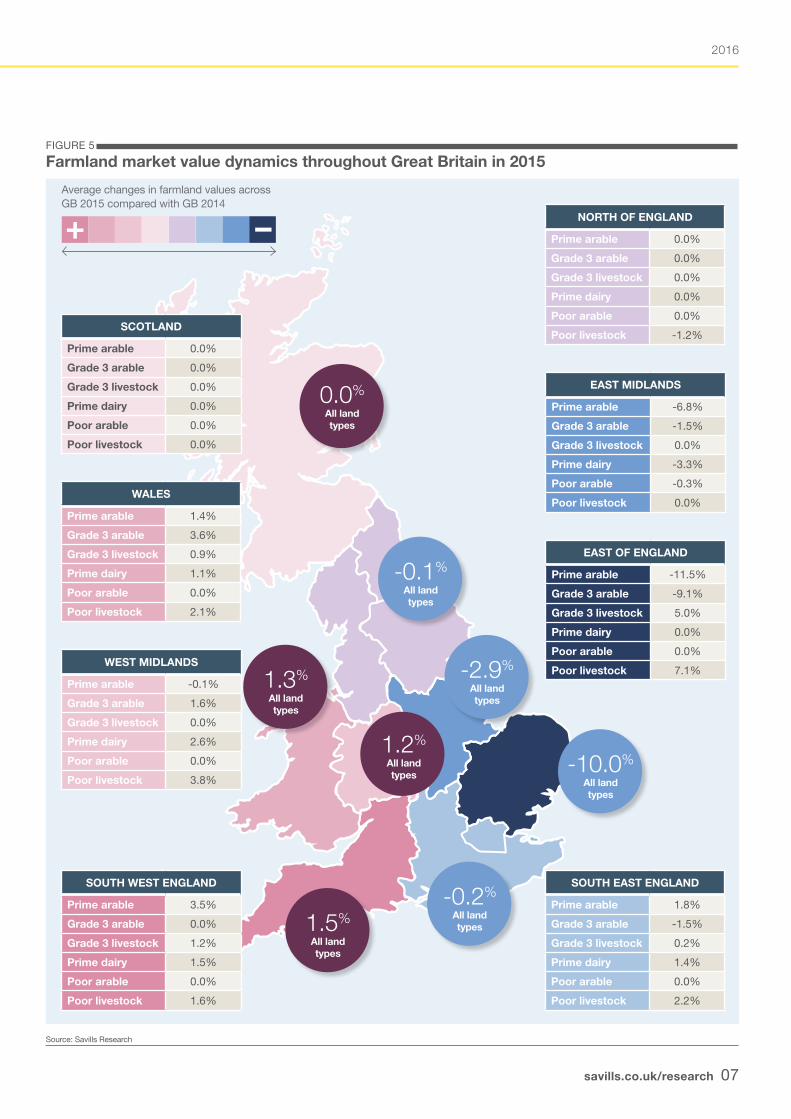
In 2015, for the first time in a decade, the Savills Farmland Value Survey recorded falls in arable land values in the eastern counties of England, where growth has been most significant and values highest.
Grassland values, generally in the west, which have lagged behind arable values, have continued to increase (see Figure 4). The change in average values of ‘all land types’ (as illustrated in the map in Figure 5) has created an east-west divide in value growth.
This also mirrors the contrasting supply dynamics, as noted on page 04, which has also been a contributory factor to supporting values in the west.
In Scotland, the average value of farmland, from prime arable to poor grassland, has remained unchanged since the end of 2013. Uncertainty generated by the
Average values of ‘all types’ of farmland in England fell in the eastern regions and increased in the western regions
Referendum and Land Reform are key factors. The lack of growth over the past two years has resulted in Scottish farmland looking good value compared with that in England.
In fact, average values over the past 10 years increased 148% in Scotland compared with over 225% across England.
During 2015 the pattern in the North of England was similar to Scotland with no growth in average values across all land types. This follows significant average growth in 2013 of 17% for prime arable land and 11% across ‘all land types’.
In line with the western regions of England the average value of ‘all types’ of Welsh farmland increased by 1.3% with our survey recording average growth of 3.2% for Grade 3 arable land and 2.1% for poor quality grassland. n
FIGURE 4
Historical values by type across Great Britain
Source: Savills Research
1 YEAR 10 YEAR
GB -1.4% 211%
England -2.0% 227%
Scotland 0.0% 148%
Wales 2.8% 146%
English Regions
East -10.0% 247%
East Mids -2.9% 257%
North -1.0% 168%
West Mids 2.7% 239%
South West 1.5% 180%
South East -0.2% 282%
£ p
er a
cre
£10,000
£8,000
£6,000
£4,000
£2,000
£0
1992
1993
1994
1995
1996
1997
1998
1999
2000
2001
2002
2003
2004
2005
2006
2007
2008
2009
2010
2011
2012
2013
2014
2015
Prime Arable Grade 3 Arable Average Grassland Prime Dairy Poor Arable Poor Grassland
savills.co.uk/research 07
2016
NORTH OF ENGLAND
Prime arable 0.0%
Grade 3 arable 0.0%
Grade 3 livestock 0.0%
Prime dairy 0.0%
Poor arable 0.0%
Poor livestock -1.2%
WEST MIDLANDS
Prime arable -0.1%
Grade 3 arable 1.6%
Grade 3 livestock 0.0%
Prime dairy 2.6%
Poor arable 0.0%
Poor livestock 3.8%
SOUTH WEST ENGLAND
Prime arable 3.5%
Grade 3 arable 0.0%
Grade 3 livestock 1.2%
Prime dairy 1.5%
Poor arable 0.0%
Poor livestock 1.6%
SOUTH EAST ENGLAND
Prime arable 1.8%
Grade 3 arable -1.5%
Grade 3 livestock 0.2%
Prime dairy 1.4%
Poor arable 0.0%
Poor livestock 2.2%
Source: Savills Research
FIGURE 5
Farmland market value dynamics throughout Great Britain in 2015
EAST MIDLANDS
Prime arable -6.8%
Grade 3 arable -1.5%
Grade 3 livestock 0.0%
Prime dairy -3.3%
Poor arable -0.3%
Poor livestock 0.0%
EAST OF ENGLAND
Prime arable -11.5%
Grade 3 arable -9.1%
Grade 3 livestock 5.0%
Prime dairy 0.0%
Poor arable 0.0%
Poor livestock 7.1%
0.0%
All land types
1.5%
All land types
1.3%
All land types
-0.1%
All land types
-2.9%
All land types
-0.2%
All land types
-10.0%
All land types
–+
SCOTLAND
Prime arable 0.0%
Grade 3 arable 0.0%
Grade 3 livestock 0.0%
Prime dairy 0.0%
Poor arable 0.0%
Poor livestock 0.0%
WALES
Prime arable 1.4%
Grade 3 arable 3.6%
Grade 3 livestock 0.9%
Prime dairy 1.1%
Poor arable 0.0%
Poor livestock 2.1%
1.2%
All land types
Average changes in farmland values across GB 2015 compared with GB 2014
08
Market Survey | Agricultural Land
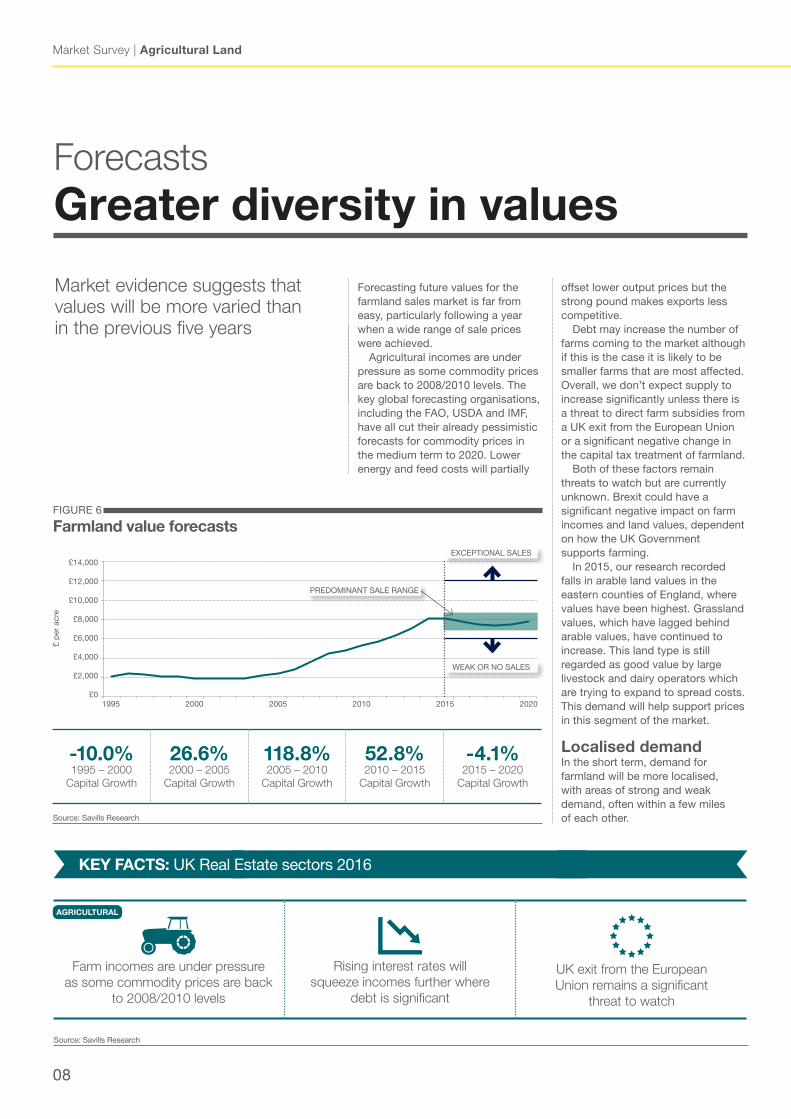
Forecasting future values for the farmland sales market is far from easy, particularly following a year when a wide range of sale prices were achieved.
Agricultural incomes are under pressure as some commodity prices are back to 2008/2010 levels. The key global forecasting organisations, including the FAO, USDA and IMF, have all cut their already pessimistic forecasts for commodity prices in the medium term to 2020. Lower energy and feed costs will partially
offset lower output prices but the strong pound makes exports less competitive.
Debt may increase the number of farms coming to the market although if this is the case it is likely to be smaller farms that are most affected. Overall, we don’t expect supply to increase significantly unless there is a threat to direct farm subsidies from a UK exit from the European Union or a significant negative change in the capital tax treatment of farmland.
Both of these factors remain threats to watch but are currently unknown. Brexit could have a significant negative impact on farm incomes and land values, dependent on how the UK Government supports farming.
In 2015, our research recorded falls in arable land values in the eastern counties of England, where values have been highest. Grassland values, which have lagged behind arable values, have continued to increase. This land type is still regarded as good value by large livestock and dairy operators which are trying to expand to spread costs. This demand will help support prices in this segment of the market.
Localised demandIn the short term, demand for farmland will be more localised, with areas of strong and weak demand, often within a few miles of each other.
ForecastsGreater diversity in values
Market evidence suggests that values will be more varied than in the previous five years
Source: Savills Research
FIGURE 6
Farmland value forecasts
£14,000
£12,000
£10,000
£8,000
£6,000
£4,000
£2,000
£0
£ p
er a
cre
1995 2000 2005 2010 2015 2020
EXCEPTIONAL SALES
WEAK OR NO SALES
PREDOMINANT SALE RANGE
-10.0%1995 – 2000
Capital Growth
26.6%2000 – 2005
Capital Growth
118.8%2005 – 2010
Capital Growth
52.8%2010 – 2015
Capital Growth
-4.1%2015 – 2020
Capital Growth
KEY FACTS: UK Real Estate sectors 2016
Source: Savills Research
AGRICULTURAL
Farm incomes are under pressure as some commodity prices are back
to 2008/2010 levels
Rising interest rates will squeeze incomes further where
debt is significant
UK exit from the European Union remains a significant
threat to watch
savills.co.uk/research 09
2016
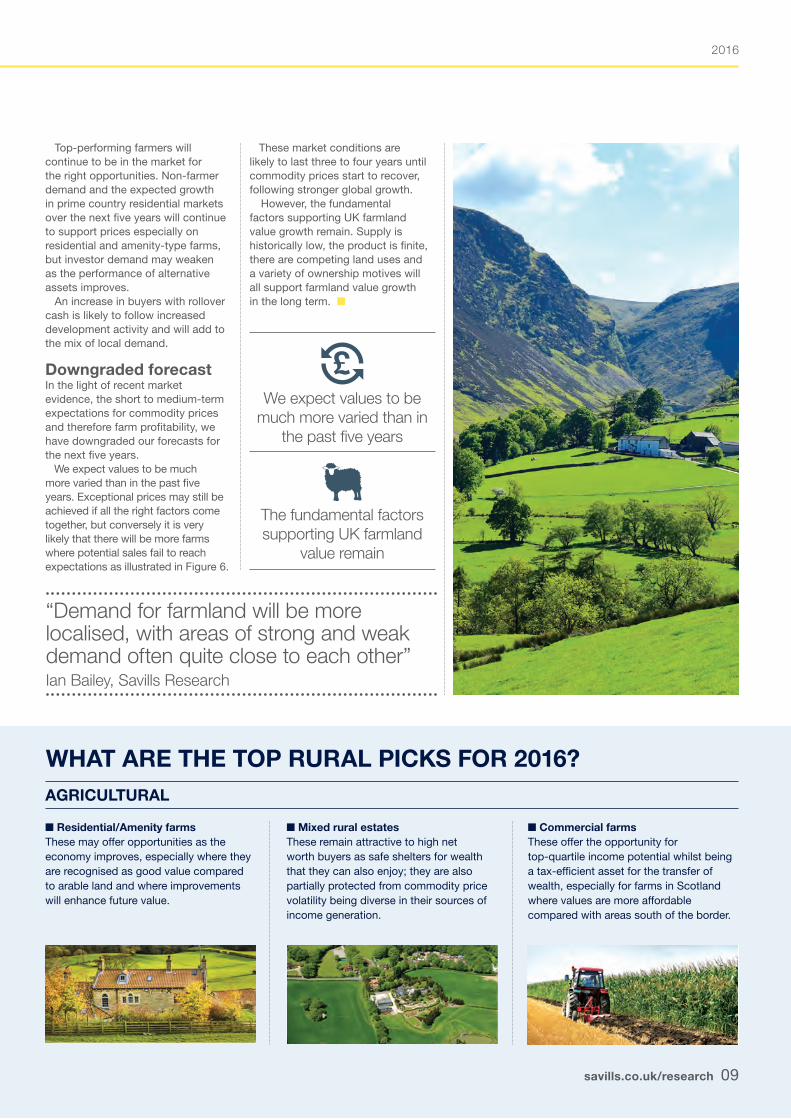
Top-performing farmers will continue to be in the market for the right opportunities. Non-farmer demand and the expected growth in prime country residential markets over the next five years will continue to support prices especially on residential and amenity-type farms, but investor demand may weaken as the performance of alternative assets improves. An increase in buyers with rollover cash is likely to follow increased development activity and will add to the mix of local demand.
Downgraded forecastIn the light of recent market evidence, the short to medium-term expectations for commodity prices and therefore farm profitability, we have downgraded our forecasts for the next five years. We expect values to be much more varied than in the past five years. Exceptional prices may still be achieved if all the right factors come together, but conversely it is very likely that there will be more farms where potential sales fail to reach expectations as illustrated in Figure 6.
AGRICULTURAL
n Residential/Amenity farms These may offer opportunities as the economy improves, especially where they are recognised as good value compared to arable land and where improvements will enhance future value.
n Mixed rural estates These remain attractive to high net worth buyers as safe shelters for wealth that they can also enjoy; they are also partially protected from commodity price volatility being diverse in their sources of income generation.
n Commercial farms These offer the opportunity for top-quartile income potential whilst being a tax-efficient asset for the transfer of wealth, especially for farms in Scotland where values are more affordable compared with areas south of the border.
WHAT ARE THE TOP RURAL PICKS FOR 2016?
We expect values to be much more varied than in
the past five years
The fundamental factors supporting UK farmland
value remain
These market conditions are likely to last three to four years until commodity prices start to recover, following stronger global growth.
However, the fundamental factors supporting UK farmland value growth remain. Supply is historically low, the product is finite, there are competing land uses and a variety of ownership motives will all support farmland value growth in the long term. n
“Demand for farmland will be more localised, with areas of strong and weak demand often quite close to each other” Ian Bailey, Savills Research
Market Survey | Agricultural Land
10
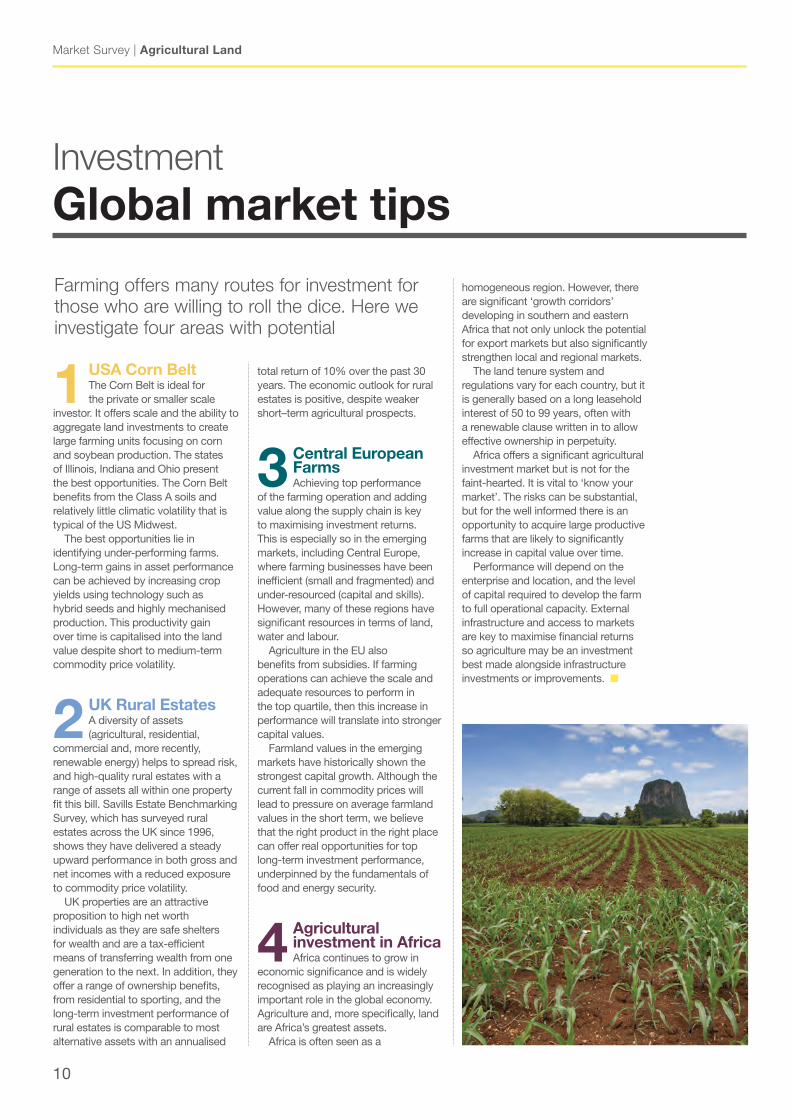
1 USA Corn Belt The Corn Belt is ideal for the private or smaller scale
investor. It offers scale and the ability to aggregate land investments to create large farming units focusing on corn and soybean production. The states of Illinois, Indiana and Ohio present the best opportunities. The Corn Belt benefits from the Class A soils and relatively little climatic volatility that is typical of the US Midwest.
The best opportunities lie in identifying under-performing farms. Long-term gains in asset performance can be achieved by increasing crop yields using technology such as hybrid seeds and highly mechanised production. This productivity gain over time is capitalised into the land value despite short to medium-term commodity price volatility.
2 UK Rural EstatesA diversity of assets (agricultural, residential,
commercial and, more recently, renewable energy) helps to spread risk, and high-quality rural estates with a range of assets all within one property fit this bill. Savills Estate Benchmarking Survey, which has surveyed rural estates across the UK since 1996, shows they have delivered a steady upward performance in both gross and net incomes with a reduced exposure to commodity price volatility.
UK properties are an attractive proposition to high net worth individuals as they are safe shelters for wealth and are a tax-efficient means of transferring wealth from one generation to the next. In addition, they offer a range of ownership benefits, from residential to sporting, and the long-term investment performance of rural estates is comparable to most alternative assets with an annualised
total return of 10% over the past 30 years. The economic outlook for rural estates is positive, despite weaker short–term agricultural prospects.
3 Central European Farms Achieving top performance
of the farming operation and adding value along the supply chain is key to maximising investment returns. This is especially so in the emerging markets, including Central Europe, where farming businesses have been inefficient (small and fragmented) and under-resourced (capital and skills). However, many of these regions have significant resources in terms of land, water and labour.
Agriculture in the EU also benefits from subsidies. If farming operations can achieve the scale and adequate resources to perform in the top quartile, then this increase in performance will translate into stronger capital values.
Farmland values in the emerging markets have historically shown the strongest capital growth. Although the current fall in commodity prices will lead to pressure on average farmland values in the short term, we believe that the right product in the right place can offer real opportunities for top long-term investment performance, underpinned by the fundamentals of food and energy security.
4 Agricultural investment in AfricaAfrica continues to grow in
economic significance and is widely recognised as playing an increasingly important role in the global economy. Agriculture and, more specifically, land are Africa’s greatest assets.
Africa is often seen as a
homogeneous region. However, there are significant ‘growth corridors’ developing in southern and eastern Africa that not only unlock the potential for export markets but also significantly strengthen local and regional markets.
The land tenure system and regulations vary for each country, but it is generally based on a long leasehold interest of 50 to 99 years, often with a renewable clause written in to allow effective ownership in perpetuity.
Africa offers a significant agricultural investment market but is not for the faint-hearted. It is vital to ‘know your market’. The risks can be substantial, but for the well informed there is an opportunity to acquire large productive farms that are likely to significantly increase in capital value over time.
Performance will depend on the enterprise and location, and the level of capital required to develop the farm to full operational capacity. External infrastructure and access to markets are key to maximise financial returns so agriculture may be an investment best made alongside infrastructure investments or improvements. n
InvestmentGlobal market tips
Farming offers many routes for investment for those who are willing to roll the dice. Here we investigate four areas with potential
savills.co.uk/research 011
Date
Savills plcSavills plc is a global real estate services provider listed on the London Stock Exchange. We have an international network of more than 700 offices and associates throughout the Americas, the UK, continental Europe, Asia Pacific, Africa and the Middle East, offering a broad range of specialist advisory, management and transactional services to clients all over the world.
This report is for general informative purposes only. It may not be published, reproduced or quoted in part or in whole, nor may it be used as a basis for any contract, prospectus, agreement or other document without prior consent. Whilst every effort has been made to ensure its accuracy, Savills accepts no liability whatsoever for any direct or consequential loss arising from its use. The content is strictly copyright and reproduction of the whole or part of it in any form is prohibited without written permission from Savills Research.
Savills Farm Agency team Please contact us for further information
Ian BaileyHead of Rural Research01797 230 [email protected]
NationalAlex Lawson020 7409 [email protected]
NationalGiles Wordsworth020 7075 [email protected]
Central/West/WalesRichard Binning01865 269 [email protected]
MidlandsAndrew Pearce01522 508 [email protected]
EastChristopher Miles01603 229 [email protected]
ScotlandCharles Dudgeon0131 247 [email protected]
SouthDavid Cross01722 426 [email protected]
South WestPenny Dart01392 455 [email protected]
South EastChris Spofforth01444 446 [email protected]
NorthAndrew Black01904 617 [email protected]
Julie BaxterResearch Analyst 01483 203 492 [email protected]

33 Margaret StreetLondon W1G 0JD020 7499 8644
savills.co.uk


![Thurston County Agricultural Land Pocket Gopher Evaluation · [THURSTON COUNTY AGRICULTURAL LAND POCKET GOPHER EVALUATION] March 30, 2014 3 Thurston County Agricultural Land Pocket](https://img.pdfslide.net/doc/110x75/5b00b2377f8b9a256b90627a/thurston-county-agricultural-land-pocket-gopher-evaluation-thurston-county-agricultural.jpg)