Embed Size (px)
Citation preview


M A R K E T U P D AT E
Giving our family of investors many reasons to celebrate
E q u i t yEconomy: This month saw the much awaited
announcement of the annual Monetary and Creditpolicy by the Reserve Bank of India. Overall thetone of the policy was positive with no reversal ofliberalization process. Since most of measures tocontrol money supply like raising interest rates, CRRetc. had already been announced in the previousmonth, the policy refrained from any furtherannouncements probably awaiting the impact of theearlier measures. The central bank clearly outlinedits comfort with economic momentum and projecteda growth of 8.5% for the current fiscal. The policyintroduced a host of measures that permitsincreased access for resident Indians-individualsand corporates to invest and take foreign exchangeabroad. This, the RBI hopes might counter theproblems created by excessive money supply.Inflation has been forecasted to be at 5% for 2007-2008. Although the biggest concern this month forlarge exporters was the continuous strengthening ofthe currency for a 9 year historic high when itbreached Rs.41. We believe that RBI’s emphasis onensuring credit availability for productive purposesclarifies that industrial and economic growth remainsa key focus for the central bank.
Corporate: The result season began this monthwith most corporates performing exceptionally well.Annual results from most of the corporates onexpected lines and the outlook for FY08 appearsupbeat. Most index heavy weights have declared their
The first month of the new financial year witnessed a good rally in the indices. The sensex rallied by morethan 1400 points in this period. The fund got a few opportunities to unwind the arbitrage positions early inthe month. The cost of carry was good during the major part of the month. The month of April sawexceptional rollovers of more than 80% to the May series. Most of our short futures positions were rolled-over to the May series at good rates. Volatility in the indices near the previous highs would enhance thearbitrage returns. As expected, the previous few months have been really good for arbitrage . Going forwardthe opportunities may be on the lower side ( a typical annual phenomena) , but expect the same to pick uppretty soon.
D e r i v a t i v e s
The FPJ Business Journal May 2007 3
results and have shown strong profit growth. Next 2months will see several companies in the midcapsegment declare this results which should keep themarkets excited about their prospects as well. Thedemand outlook appears robust in most sectorsincluding technology, capital goods and construction.
Markets: The month began on a bad note as themarkets reacted to the CRR and interest rate hikeannounced by RBI on 29th April 2007. Sensex fell616.73 points or 4.72% at 12455.37, and the Niftydown 187.95 points or 4.92% at 3633.6 on 2nd April2007, the first trading day of the month. Rest of themonth saw a gradual stabilization followed by asharp improvement in the fortunes of the marketdriven by strong results and better outlook. At theend of April, Sensex was at 13872, and the Niftywas at 4088 – a sharp upmove of 12% in the monthwhich took several by surprise.
Our view in the previous month, that marketsshould bottomout in March and subsequently themarkets should move up, now stands vindicated.We are still enthused at the opportunities availablein the mid-cap/small cap segment of the market andwould still count on them to outperform forremainder of the year. Indian markets might lookmore at the global cues during the current month.We stick to our view that fundamentals remainextremely positive and long term investors canexpect robust returns.(Source: Bloomberg)

M A R K E T U P D AT E
Giving our family of investors many reasons to celebrate
4 May 2007 The FPJ Business Journal
The domestic bond market ended lower last month on tight domesticliquidity situation and tight monetary policy. Reserve Bank of Indiamaintained a status quo and kept the key interest rates unchanged inthe annual review of the monetary policy.
Key highlights of the Review of the monetary policy-April 2007● Repo Rate unchanged at 7.75% and reverse repo rate unchanged
at 6.00%.● Bank Rate and Cash Reserve Ratio kept unchanged at 6.00%
and 6.50% respectively.● GDP growth projection for 2007-08 set at 8.50%.● Inflation to be contained close to 5.0 per cent during 2007-08.
Going forward, the resolve is to condition policy and perceptionsfor inflation in the range of 4.0-4.5 per cent over the medium term.
● M3 expansion to be contained at around 17.0-17.5 per cent during2007-08.
● Deposits projected to increase by around Rs.4,90,000 crore during2007-08.
● Adjusted non-food credit projected to increase by around 24.0-25.0 per cent during 2007-08.
● Appropriate liquidity to be maintained to meet legitimate creditrequirements consistent with price and financial stability.
● Ceiling interest rate on FCNR (B) deposits reduced by 50 basispoints to LIBOR minus 75 basis points.
● Ceiling interest rate on NR(E)RA deposits reduced by 50 basispoints to LIBOR/SWAP rates.
The 10-year benchmark yield eased after the RBI kept key ratesunchanged in the policy, but later on rose sharply on hawkish commentsfrom the RBI governor and threat of surprise monetary action. Higherthan expected weekly inflation number and RBI’s bias towards tightliquidity situation led to negative sentiments in the market Domesticliquidity conditions eased but continued to remain firm on back of outflowon account of CRR hike, MSS and government bond issuances. Shortterm money market rates were volatile and remained firm, call rateseased from the previous months highs but continued to remained firm.
Factor: InflationShort Term: Negative — Medium Term: Neutral
Inflation continued to surprise on the negative side. WholesalePrice Index (WPI) inflation for the week ended April, 14, 2007 was at6.09% on back of pressure on primary articles. The primary productindex rose to 219.1 as compared to 214.30 last month. Going forwardin the month of May 2007, headline inflation is likely to remain firmand is likely to range in the band of 6.00%-6.25%. The RBI has set atarget of inflation at 5.00% for the financial year 2007-08 and4%-4.5% for the medium term in the annual review of the credit policy.(Source: Bloomberg)
Factor: LiquidityShort Term: Negative — Medium Term: Neutral
Domestic liquidity situation improved but continued to remain tighton back of outflow on account of Cash Reserve Ratio (CRR) hike,Market Stabilisation Scheme (MSS) outflow and government bondoutflow. Liquidity situation improved over the last month due togovernment spending and systemic flows on account of redemptionand coupon flows. Call rates traded lower in a band of 5% to 15%.Money market rates were volatile and ended firm on cautious outlookon liquidity. Average repo bids at the RBI Liquidity Adjustment Facility(LAF) auctions were around Rs 3522 crores as compared to Rs 16200crores in the last month. The RBI has hiked the ceiling of MSS issuanceto Rs 110000 crores for the FY 2007-08.
Factor: Global Interest Rate ScenarioShort Term: Neutral — Medium Term: Positive
US bond yields traded in a tight range and ended marginally loweron back of mixed economic data. Data showing a pickup in inflationand a slow first-quarter economic growth have clouded expectationsof a cut in Federal Reserve interest rates this year. The US economygrew at 1.3% growth in first-quarter gross domestic product, muchlower than the market expectation, raising hopes that the Fed wouldease monetary policy to stimulate the economy. The US economy islikely to keep interest rates stable in the near term and will resort toeasing monetary policy once inflation is under control.(Source: Bloomberg)
Factor: Monetary PolicyShort Term: Negative — Medium Term: Negative
Reserve Bank of India maintained a status quo and kept the keyinterest rates unchanged in the annual review of the monetary policy.The RBI has maintained a stance of a swift response as in the past,with all appropriate measures to all situations impinging on inflationexpectations and the growth momentum. The policy continues to laygreater emphasis on price stability and well-anchored inflationexpectations while ensuring a monetary and interest rate environmentthat supports growth momentum The RBI will continue to adopt a tightmonetary policy in view of controlling inflationary expectation and growthmomentum.
Factor: ForexShort Term: Positive — Medium Term: Neutral
The rupee witnessed a sharp rally during the month on continuedFII flows in the equity market, dollar weakening and exporters sellingdollars. The rupee ended at 40.91, higher by around 6.00% as comparedto the last month. Absence of RBI in the forex market also boosted therupee. Forex reserves continued to rise at record levels and stood atUSD 203 billion for the week ended 20th April 2007. At present levelsthe Indian rupee is overvalued by around 11%-12% on REER basis.Forward premiums rose as the rupee continued to appreciate.One-month forward premium rose to a high of 9.00% during the month.We expect the rupee to trend lower from the present levels, on expectedRBI intervention in the forex market. (Source: Bloomberg)
Outlook: Indian bond yields will trade in a range bound manner onback of tight monetary policy, higher inflation expectation and continuedsupply of government bonds. Market will focus on economic data fordirection on interest rates. Uncertainty surrounding any surprisemonetary policy by the RBI depending on the evolving economicscenario will prevent participants from taking aggressive position. The10-year benchmark yield is likely to remain in range of 8.00%-8.20% inthe next month. The short end of the curve is likely to remain firm onRBI bias towards tight liquidity and the RBI will continue to takeappropriate monetary measures to maintain adequate liquidity in thesystem.
Strategy: The short end of the curve is likely to remain firm onback of tight monetary policy and RBI bias towards tight liquidity.Government bond supply and MSS auctions will continue to putpressure on systematic liquidity. However, any intervention in theforex market by the RBI will help easing the liquidity situation. Weare running low average maturity across all our schemes. Our strategywill be to focus at the shorter end of the curve and continue torebalance the portfolio to take advantage of the flatness in the moneymarket curve.
Indicators Current Month Last month M-o-M VariationForex Reserves* USD Bln 203.88 197.94 5.94Credit Off take* -Rs Crs 1,859,774 1,821,118 38656Credit Deposit Ratio * 73.47 74.54WPI Inflation*(%) 6.09 6.46 -0.3710-Year Yield - India* (%) 8.16 8.02 0.1410-year Yield - USA* (%) 4.69 4.61 0.08Exchange Rate* USD/INR 40.91 43.49 -2.58Brent Crude per/bbl* 68.00 66.00 2Reverse Repo-Daily Avg Rs Crs 2,558.00 15,800.00 (13,242.00)Repo Average-Daily Avg Rs Crs 3,522.00 16,200.00 (12,678.00)
* Data Reported as on month-end, Source RBI, Bloomberg.
D e b t
NAV as on April 30, 2007 :
Growth Plan (Rs.) : 35.91Dividend Plan (Rs.) : 16.14
Inception : 1st April, 1995
Fund Manager : Sandip Sabharwal
Investment Objective :To provide optimum capital growth and appreciation.
PORTFOLIO as on April 30, 2007Issuer Market Value % to Rating
(Rs. In Lacs) NAV
Auto 818.20 11.87Mahindra & Mahindra 485.28 7.04Maruti Udyog 332.92 4.83
Auto Ancillaries 571.33 8.29Apollo Tyre 571.33 8.29
Construction 456.50 6.62Hindustan Construction Co. 319.79 4.64Hindustan Construction Co. - Futures 136.71 1.98
Consumer Non Durable 553.67 8.03Gitanjali Gems 263.45 3.82Hindustan Lever 4.19 0.06Mc Dowell 286.03 4.15
Industrial Capital Goods 1,341.60 19.47Bharat Heavy Electricals 580.91 8.43Bharati Shipyard 520.58 7.55Kalpataru Power Transmission 240.11 3.48
Industrial Products 339.98 4.93Cummins India 339.98 4.93
Media & Entertainment 271.81 3.94Zee Telefilms 271.81 3.94
Non Ferrous Metals 11.64 0.17Hindalco 11.64 0.17
Petroleum Products 1.57 0.02Reliance Industries 1.57 0.02
Pharmaceuticals 290.46 4.21Dr. Reddy’s Lab. 290.46 4.21
Real Estate Developers 685.42 9.95Ansal Properties & Infrastructure 132.37 1.92Orbit Corporation 212.55 3.08Orbit Corporation Detachable warrant 14.53 0.21Peninsula Land 325.97 4.73
Software 451.80 6.56Mphasis BFL 451.80 6.56
Textile Products 484.32 7.03Bombay Rayon Fashions 484.32 7.03
Textiles & Apparel 0.02 0.00Flora Textiles 0.02 0.00
Total Equity 6,278.32 91.11
EQUITY OPTION (26.58) (0.39)NIFTY-OPMAY2007 (19.09) (0.28)NIFTY-OPMAY2007 (7.49) (0.11)
Total Debt (26.58) (0.39)
CBLO & Others* 639.54 9.28
Total 6,891.28 100.00
(*includes net receivables / payables, if any)
Total Corpus as on April 30, 2007 - Rs. 68.91 Crores
Portfolio Turnover Ratio : 0.1513
Performance (%) as on April 30, 2007 :Plan 1 Yr 3 Yrs 5 Yrs Incep.*Growth Plan 4.64 32.81 38.19 11.16BSE Sensex** 15.15 34.87 32.94 13.30
* Inception date = Allotment date i.e. 01.04.1995** Benchmark Index: BSE SENSEXNote: Compounded Annualised Growth Returns (CAGR)for period 1 year or more, with reinvestment of dividends(if any). Past performance may or may not be sustainedin future.
Dividend History :FY 2006-07 Dividend Plan : 20.00%FY 2005-06 Dividend Plan : 40.00%FY 2004-05 Dividend Plan : 45.00%FY 2003-04 Dividend Plan : 20.00%
After payment of dividend, the NAV will fall to the extent ofpayout and distribution taxes wherever applicable. Pastperformance may or may not be sustained in future. Theface value per unit is Rs.10/-.
JM Equity Fund (An open-ended growth scheme)
Giving our family of investors many reasons to celebrate
JM EQUITY FUNDIN EQUITY - DIVERSIFIED CATEGORY
(176 Open-Ended Schemes) for 3 and 5 yearsperiods ending April 2007.
Value Research Rating###The FPJ Business Journal May 2007 5
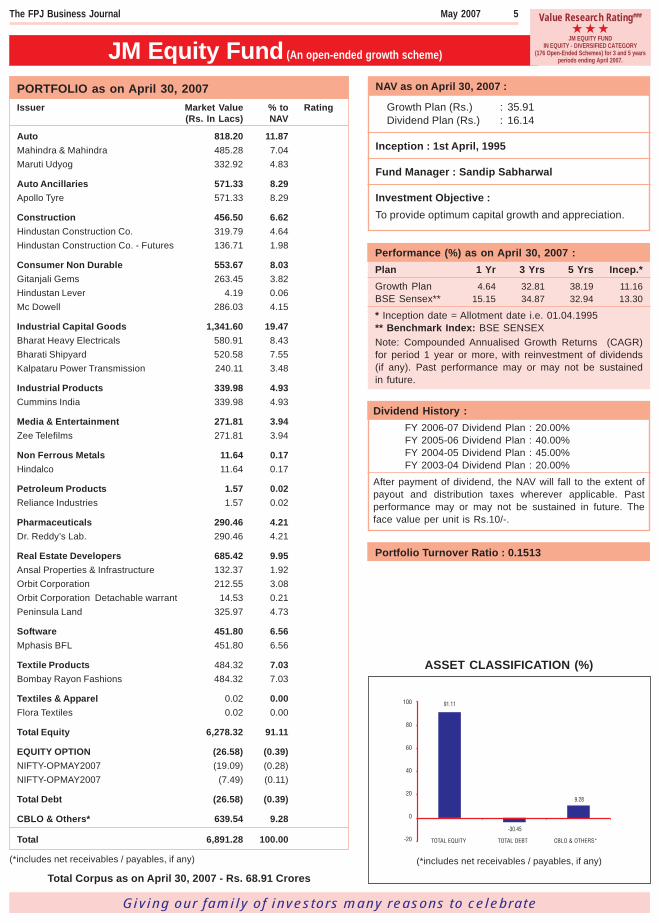
ASSET CLASSIFICATION (%)
(*includes net receivables / payables, if any)
JM Balanced Fund (An open-ended balanced scheme)
Giving our family of investors many reasons to celebrate
NAV as on April 30, 2007 :
Growth Plan (Rs.) : 23.50Dividend Plan (Rs.) : 17.85
Inception : 1st April, 1995
Fund Manager : Sandeep Neema
Investment Objective :To provide steady current income as well as long termgrowth of capital.
PORTFOLIO as on April 30, 2007Issuer Market Value % to Rating
(Rs. In Lacs) NAV
Auto 46.98 3.25Tata Motors 46.98 3.25
Cement 23.84 1.65Orient Paper & Industries 23.84 1.65
Construction 91.79 6.35Era Constructions (India) 91.79 6.35
Consumer Non Durable 86.94 6.02Dabur India 38.56 2.67Hindustan Lever 48.38 3.35
Ferrous Metals 35.63 2.47Jindal Steel & Power 35.63 2.47
Finance 57.01 3.95Reliance Capital 57.01 3.95
Industrial Capital Goods 129.42 8.96Alstom Ltd. 88.97 6.16Emco Ltd. 40.45 2.80
Media & Entertainment 37.68 2.61Entertainment Network (India) 37.68 2.61
Metals & Mining 58.22 4.03J S W Steel 58.22 4.03
Non Ferrous Metals 3.49 0.24Hindalco 3.49 0.24
Pesticides 66.11 4.58United Phosphorous 66.11 4.58
Real Estate Developers 62.72 4.34Orbit Corporation 44.30 3.07Orbit Corporation Detachable warrant 3.03 0.21Peninsula Land 15.39 1.07
Software 66.85 4.63HCL Technologies 66.85 4.63
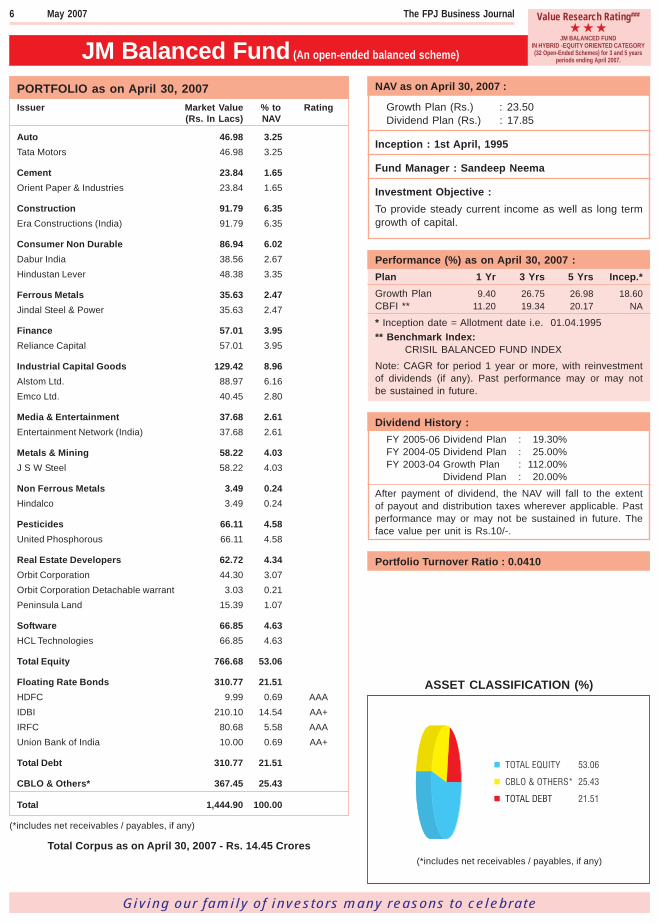
Total Equity 766.68 53.06
Floating Rate Bonds 310.77 21.51HDFC 9.99 0.69 AAAIDBI 210.10 14.54 AA+IRFC 80.68 5.58 AAAUnion Bank of India 10.00 0.69 AA+
Total Debt 310.77 21.51
CBLO & Others* 367.45 25.43
Total 1,444.90 100.00
(*includes net receivables / payables, if any)
Total Corpus as on April 30, 2007 - Rs. 14.45 Crores
Portfolio Turnover Ratio : 0.0410
Performance (%) as on April 30, 2007 :Plan 1 Yr 3 Yrs 5 Yrs Incep.*Growth Plan 9.40 26.75 26.98 18.60CBFI ** 11.20 19.34 20.17 NA
* Inception date = Allotment date i.e. 01.04.1995** Benchmark Index:
CRISIL BALANCED FUND INDEXNote: CAGR for period 1 year or more, with reinvestmentof dividends (if any). Past performance may or may notbe sustained in future.
Dividend History :FY 2005-06 Dividend Plan : 19.30%FY 2004-05 Dividend Plan : 25.00%FY 2003-04 Growth Plan : 112.00%
Dividend Plan : 20.00%
After payment of dividend, the NAV will fall to the extentof payout and distribution taxes wherever applicable. Pastperformance may or may not be sustained in future. Theface value per unit is Rs.10/-.
ASSET CLASSIFICATION (%)
(*includes net receivables / payables, if any)
JM BALANCED FUNDIN HYBRID -EQUITY ORIENTED CATEGORY(32 Open-Ended Schemes) for 3 and 5 years
periods ending April 2007.
Value Research Rating###6 May 2007 The FPJ Business Journal
NAV as on April 30, 2007 :
JM Basic Fund (Rs.) : 20.68
Inception : 2nd June, 1997
Fund Manager : Asit Bhandarkar
Investment Objective :The primary objective of the Scheme will be to providecapital appreciation to its Unitholders through judiciousdeployment of the corpus of the Scheme in sectorscategorized under “basic industry” in the normal parlanceand in context of the Indian economy, including but notlimited to, energy, petrochemicals, oil & gas, powergeneration & distribution and electrical equipmentsuppliers, metals and building material. The fund wouldcontinue to remain open-ended with a sector focus.
Performance (%) as on April 30, 2007 :Plan 1 3 5 Incep.*
Year Years YearsBasic Fund 17.53 26.61 34.21 35.94BSE BII** 9.84 NA NA NA
* Inception date = Allotment date i.e. 02.06.1997** Benchmark Index: BSE Basic Industries Index ( )
Benchmark index has been changed from S&P CNXPetrochemical Index to BSE Basic Industries Index ( )
w.e.f. June 22, 2005Note: CAGR for period 1 year or more, with reinvestmentof dividends (if any). Past performance may or may notbe sustained in future.All rights in the BSE Basic Industries Index( ) vest inBSE. BSE and BSE Basic Industries Index( ) aretrademarks of BSE and are used by the JM Financial AssetManagement Pvt. Ltd. under license. BSE shall not beliable in any manner whatsoever (including in negligence)for any loss arising to any person whosoever out of use ofor reliance on the BSE Basic Industries Index( ) by anyperson.
JM Basic Fund (An open-ended sector scheme)
Portfolio Turnover Ratio : 0.0758
Giving our family of investors many reasons to celebrate
Dividend History :FY 2004-05 : 10.00% FY 2002-03 : 45.00%FY 2003-04 : 87.50% FY 2000-01 : 182.50%
After payment of dividend, the NAV will fall to the extentof payout and distribution taxes wherever applicable. Pastperformance may or may not be sustained in future. Theface value per unit is Rs.10/-.
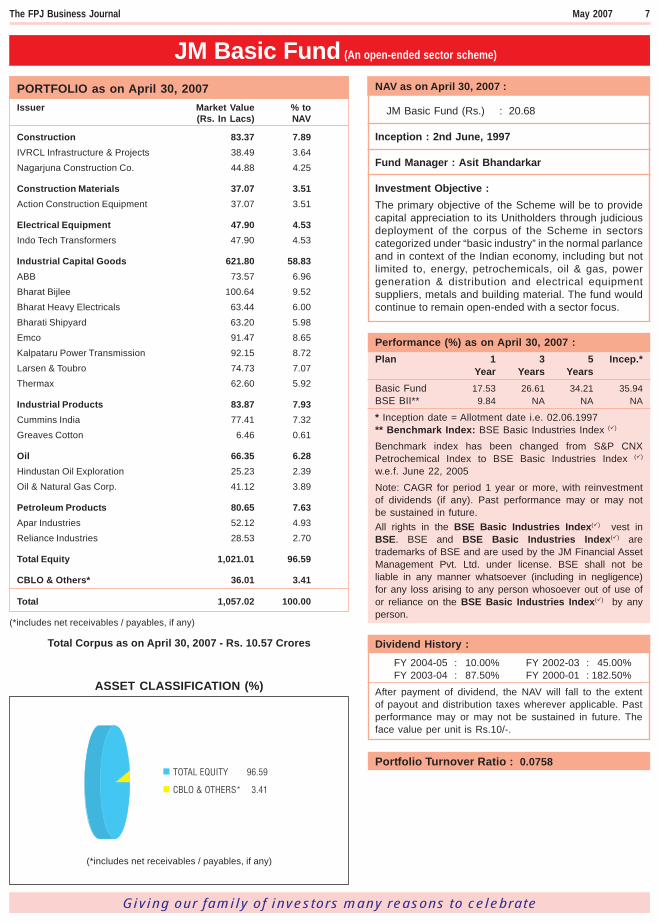
ASSET CLASSIFICATION (%)
(*includes net receivables / payables, if any)
PORTFOLIO as on April 30, 2007Issuer Market Value % to
(Rs. In Lacs) NAV
Construction 83.37 7.89IVRCL Infrastructure & Projects 38.49 3.64Nagarjuna Construction Co. 44.88 4.25
Construction Materials 37.07 3.51Action Construction Equipment 37.07 3.51
Electrical Equipment 47.90 4.53Indo Tech Transformers 47.90 4.53
Industrial Capital Goods 621.80 58.83ABB 73.57 6.96Bharat Bijlee 100.64 9.52Bharat Heavy Electricals 63.44 6.00Bharati Shipyard 63.20 5.98Emco 91.47 8.65Kalpataru Power Transmission 92.15 8.72Larsen & Toubro 74.73 7.07Thermax 62.60 5.92
Industrial Products 83.87 7.93Cummins India 77.41 7.32Greaves Cotton 6.46 0.61
Oil 66.35 6.28Hindustan Oil Exploration 25.23 2.39Oil & Natural Gas Corp. 41.12 3.89
Petroleum Products 80.65 7.63Apar Industries 52.12 4.93Reliance Industries 28.53 2.70
Total Equity 1,021.01 96.59
CBLO & Others* 36.01 3.41
Total 1,057.02 100.00
(*includes net receivables / payables, if any)
Total Corpus as on April 30, 2007 - Rs. 10.57 Crores
The FPJ Business Journal May 2007 7
Giving our family of investors many reasons to celebrate
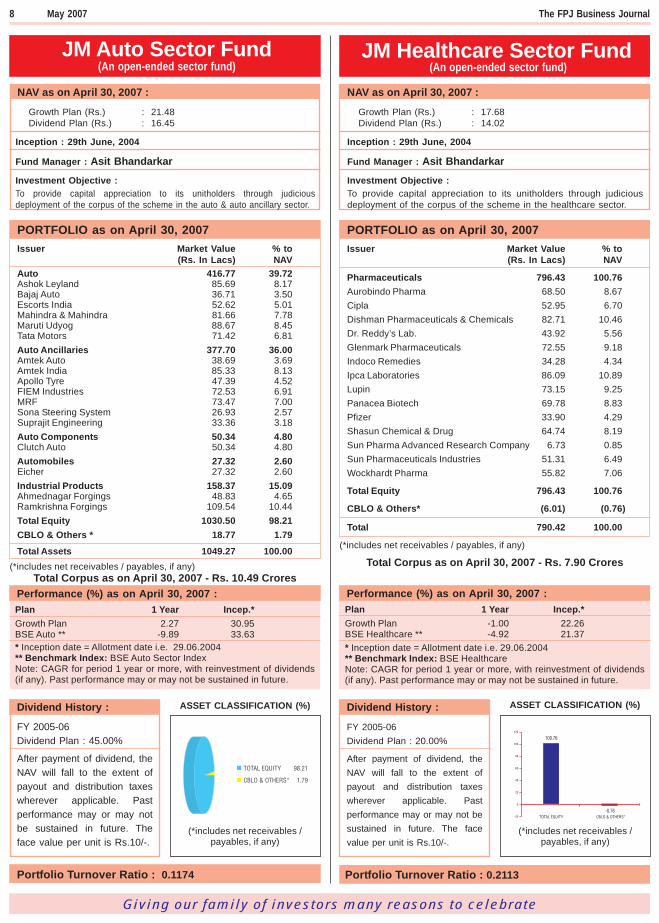
JM Auto Sector Fund(An open-ended sector fund)
JM Healthcare Sector Fund (An open-ended sector fund)
PORTFOLIO as on April 30, 2007Issuer Market Value % to
(Rs. In Lacs) NAVAuto 416.77 39.72Ashok Leyland 85.69 8.17Bajaj Auto 36.71 3.50Escorts India 52.62 5.01Mahindra & Mahindra 81.66 7.78Maruti Udyog 88.67 8.45Tata Motors 71.42 6.81Auto Ancillaries 377.70 36.00Amtek Auto 38.69 3.69Amtek India 85.33 8.13Apollo Tyre 47.39 4.52FIEM Industries 72.53 6.91MRF 73.47 7.00Sona Steering System 26.93 2.57Suprajit Engineering 33.36 3.18Auto Components 50.34 4.80Clutch Auto 50.34 4.80Automobiles 27.32 2.60Eicher 27.32 2.60Industrial Products 158.37 15.09Ahmednagar Forgings 48.83 4.65Ramkrishna Forgings 109.54 10.44Total Equity 1030.50 98.21CBLO & Others * 18.77 1.79
Total Assets 1049.27 100.00(*includes net receivables / payables, if any)
Total Corpus as on April 30, 2007 - Rs. 10.49 CroresPerformance (%) as on April 30, 2007 :Plan 1 Year Incep.*Growth Plan 2.27 30.95BSE Auto ** -9.89 33.63* Inception date = Allotment date i.e. 29.06.2004** Benchmark Index: BSE Auto Sector IndexNote: CAGR for period 1 year or more, with reinvestment of dividends(if any). Past performance may or may not be sustained in future.
Performance (%) as on April 30, 2007 :Plan 1 Year Incep.*Growth Plan -1.00 22.26BSE Healthcare ** -4.92 21.37* Inception date = Allotment date i.e. 29.06.2004** Benchmark Index: BSE HealthcareNote: CAGR for period 1 year or more, with reinvestment of dividends(if any). Past performance may or may not be sustained in future.
PORTFOLIO as on April 30, 2007Issuer Market Value % to
(Rs. In Lacs) NAV
Pharmaceuticals 796.43 100.76Aurobindo Pharma 68.50 8.67Cipla 52.95 6.70Dishman Pharmaceuticals & Chemicals 82.71 10.46Dr. Reddy’s Lab. 43.92 5.56Glenmark Pharmaceuticals 72.55 9.18Indoco Remedies 34.28 4.34Ipca Laboratories 86.09 10.89Lupin 73.15 9.25Panacea Biotech 69.78 8.83Pfizer 33.90 4.29Shasun Chemical & Drug 64.74 8.19Sun Pharma Advanced Research Company 6.73 0.85Sun Pharmaceuticals Industries 51.31 6.49Wockhardt Pharma 55.82 7.06
Total Equity 796.43 100.76
CBLO & Others* (6.01) (0.76)
Total 790.42 100.00
(*includes net receivables / payables, if any)
Total Corpus as on April 30, 2007 - Rs. 7.90 Crores
NAV as on April 30, 2007 :
Growth Plan (Rs.) : 21.48Dividend Plan (Rs.) : 16.45
Inception : 29th June, 2004
Fund Manager : Asit Bhandarkar
Investment Objective :To provide capital appreciation to its unitholders through judiciousdeployment of the corpus of the scheme in the auto & auto ancillary sector.
NAV as on April 30, 2007 :
Growth Plan (Rs.) : 17.68Dividend Plan (Rs.) : 14.02
Inception : 29th June, 2004
Fund Manager : Asit Bhandarkar
Investment Objective :To provide capital appreciation to its unitholders through judiciousdeployment of the corpus of the scheme in the healthcare sector.
Portfolio Turnover Ratio : 0.1174 Portfolio Turnover Ratio : 0.2113
ASSET CLASSIFICATION (%)
(*includes net receivables /payables, if any)
Dividend History :
FY 2005-06Dividend Plan : 45.00%
After payment of dividend, theNAV will fall to the extent ofpayout and distribution taxeswherever applicable. Pastperformance may or may notbe sustained in future. Theface value per unit is Rs.10/-.
Dividend History :
FY 2005-06Dividend Plan : 20.00%
After payment of dividend, theNAV will fall to the extent ofpayout and distribution taxeswherever applicable. Pastperformance may or may not besustained in future. The facevalue per unit is Rs.10/-.
ASSET CLASSIFICATION (%)
(*includes net receivables /payables, if any)
8 May 2007 The FPJ Business Journal
Giving our family of investors many reasons to celebrate
NAV as on April 30, 2007 :
Growth Plan (Rs.) : 10.03Dividend Plan (Rs.) : 10.03
Inception : 7th April, 2006
Fund Manager : Sandeep Neema
Investment Objective :To generate medium to long term capital growth from aportfolio that is substantially constituted of equity &equity related securities of companies which couldbenefit from the structural changes brought about bythe continuing liberalization in economic policies andinvestments by the Government in the housing,infrastructure and financial services sectors.
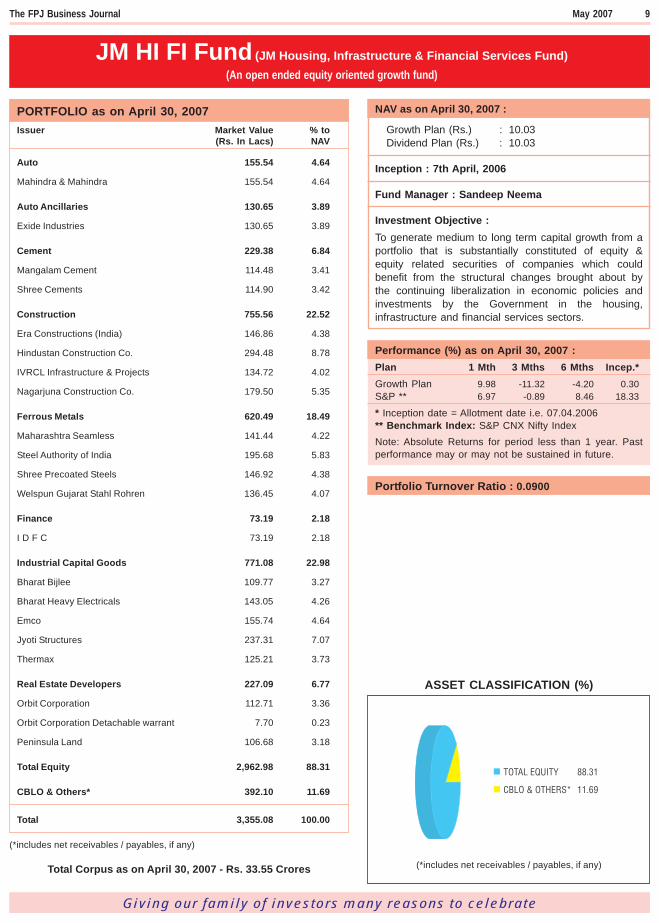
JM HI FI Fund (JM Housing, Infrastructure & Financial Services Fund)(An open ended equity oriented growth fund)
ASSET CLASSIFICATION (%)
(*includes net receivables / payables, if any)
Performance (%) as on April 30, 2007 :Plan 1 Mth 3 Mths 6 Mths Incep.*Growth Plan 9.98 -11.32 -4.20 0.30S&P ** 6.97 -0.89 8.46 18.33
* Inception date = Allotment date i.e. 07.04.2006** Benchmark Index: S&P CNX Nifty IndexNote: Absolute Returns for period less than 1 year. Pastperformance may or may not be sustained in future.
Portfolio Turnover Ratio : 0.0900
PORTFOLIO as on April 30, 2007Issuer Market Value % to
(Rs. In Lacs) NAV
Auto 155.54 4.64
Mahindra & Mahindra 155.54 4.64
Auto Ancillaries 130.65 3.89
Exide Industries 130.65 3.89
Cement 229.38 6.84
Mangalam Cement 114.48 3.41
Shree Cements 114.90 3.42
Construction 755.56 22.52
Era Constructions (India) 146.86 4.38
Hindustan Construction Co. 294.48 8.78
IVRCL Infrastructure & Projects 134.72 4.02
Nagarjuna Construction Co. 179.50 5.35
Ferrous Metals 620.49 18.49
Maharashtra Seamless 141.44 4.22
Steel Authority of India 195.68 5.83
Shree Precoated Steels 146.92 4.38
Welspun Gujarat Stahl Rohren 136.45 4.07
Finance 73.19 2.18
I D F C 73.19 2.18
Industrial Capital Goods 771.08 22.98
Bharat Bijlee 109.77 3.27
Bharat Heavy Electricals 143.05 4.26
Emco 155.74 4.64
Jyoti Structures 237.31 7.07
Thermax 125.21 3.73
Real Estate Developers 227.09 6.77
Orbit Corporation 112.71 3.36
Orbit Corporation Detachable warrant 7.70 0.23
Peninsula Land 106.68 3.18
Total Equity 2,962.98 88.31
CBLO & Others* 392.10 11.69
Total 3,355.08 100.00
(*includes net receivables / payables, if any)
Total Corpus as on April 30, 2007 - Rs. 33.55 Crores
The FPJ Business Journal May 2007 9
Performance (%) as on April 30, 2007 :Plan 1 Month 3 Months Incep.*Growth Plan 8.42 0.10 0.40BSE Finance ** 6.31 -4.10 -2.67* Inception date = Allotment date i.e. 07.12.2006** Benchmark Index: BSE Finance Index ( ) $
Note: Absolute Returns for period less than 1 year. Past performancemay or may not be sustained in future.$ Refer page no. 11.
PORTFOLIO as on April 30, 2007Issuer Market Value % to
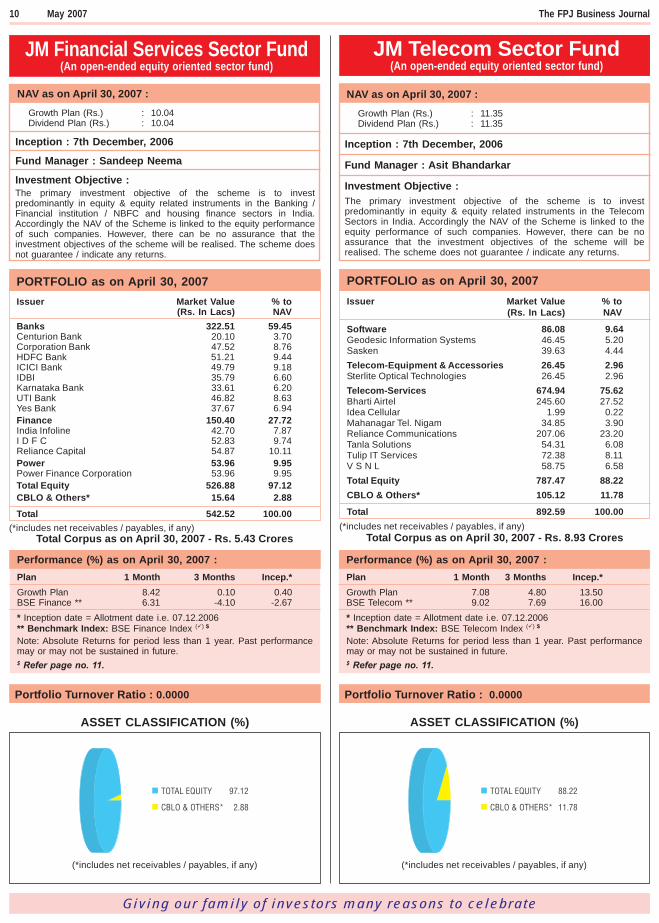
(Rs. In Lacs) NAVBanks 322.51 59.45Centurion Bank 20.10 3.70Corporation Bank 47.52 8.76HDFC Bank 51.21 9.44ICICI Bank 49.79 9.18IDBI 35.79 6.60Karnataka Bank 33.61 6.20UTI Bank 46.82 8.63Yes Bank 37.67 6.94Finance 150.40 27.72India Infoline 42.70 7.87I D F C 52.83 9.74Reliance Capital 54.87 10.11Power 53.96 9.95Power Finance Corporation 53.96 9.95Total Equity 526.88 97.12CBLO & Others* 15.64 2.88
Total 542.52 100.00(*includes net receivables / payables, if any)
Total Corpus as on April 30, 2007 - Rs. 5.43 Crores
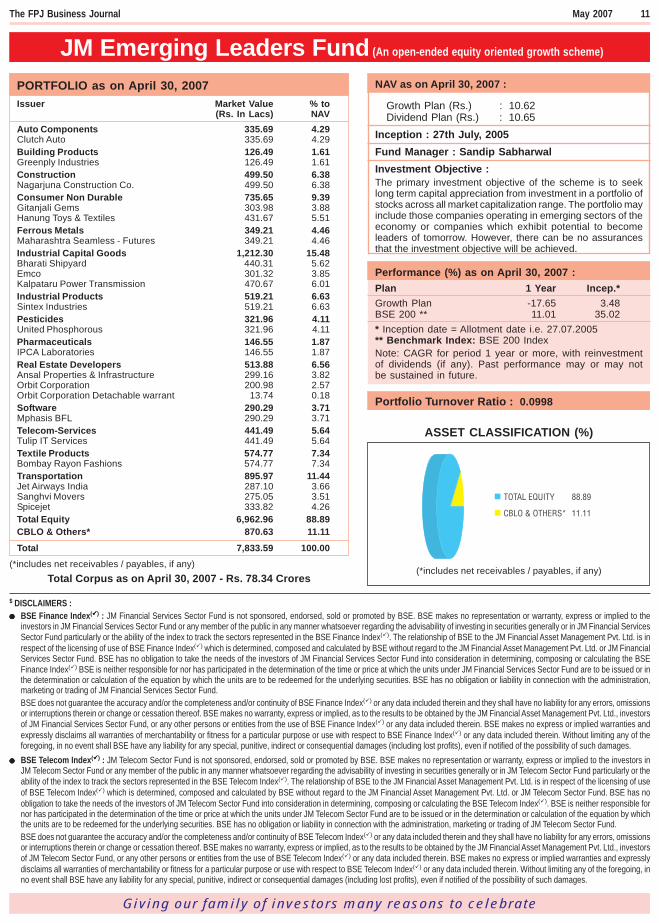
PORTFOLIO as on April 30, 2007Issuer Market Value % to
(Rs. In Lacs) NAV
Software 86.08 9.64Geodesic Information Systems 46.45 5.20Sasken 39.63 4.44Telecom-Equipment & Accessories 26.45 2.96Sterlite Optical Technologies 26.45 2.96Telecom-Services 674.94 75.62Bharti Airtel 245.60 27.52Idea Cellular 1.99 0.22Mahanagar Tel. Nigam 34.85 3.90Reliance Communications 207.06 23.20Tanla Solutions 54.31 6.08Tulip IT Services 72.38 8.11V S N L 58.75 6.58Total Equity 787.47 88.22CBLO & Others* 105.12 11.78
Total 892.59 100.00(*includes net receivables / payables, if any)
Total Corpus as on April 30, 2007 - Rs. 8.93 Crores
Performance (%) as on April 30, 2007 :Plan 1 Month 3 Months Incep.*Growth Plan 7.08 4.80 13.50BSE Telecom ** 9.02 7.69 16.00* Inception date = Allotment date i.e. 07.12.2006** Benchmark Index: BSE Telecom Index ( ) $
Note: Absolute Returns for period less than 1 year. Past performancemay or may not be sustained in future.$ Refer page no. 11.
Portfolio Turnover Ratio : 0.0000 Portfolio Turnover Ratio : 0.0000
ASSET CLASSIFICATION (%)
(*includes net receivables / payables, if any)
ASSET CLASSIFICATION (%)
(*includes net receivables / payables, if any)
JM Financial Services Sector Fund(An open-ended equity oriented sector fund)
JM Telecom Sector Fund(An open-ended equity oriented sector fund)
NAV as on April 30, 2007 :
Growth Plan (Rs.) : 11.35Dividend Plan (Rs.) : 11.35
Inception : 7th December, 2006
Fund Manager : Asit Bhandarkar
Investment Objective :The primary investment objective of the scheme is to investpredominantly in equity & equity related instruments in the TelecomSectors in India. Accordingly the NAV of the Scheme is linked to theequity performance of such companies. However, there can be noassurance that the investment objectives of the scheme will berealised. The scheme does not guarantee / indicate any returns.
NAV as on April 30, 2007 :
Growth Plan (Rs.) : 10.04Dividend Plan (Rs.) : 10.04
Inception : 7th December, 2006
Fund Manager : Sandeep Neema
Investment Objective :The primary investment objective of the scheme is to investpredominantly in equity & equity related instruments in the Banking /Financial institution / NBFC and housing finance sectors in India.Accordingly the NAV of the Scheme is linked to the equity performanceof such companies. However, there can be no assurance that theinvestment objectives of the scheme will be realised. The scheme doesnot guarantee / indicate any returns.
Giving our family of investors many reasons to celebrate
10 May 2007 The FPJ Business Journal
PORTFOLIO as on April 30, 2007Issuer Market Value % to
(Rs. In Lacs) NAVAuto Components 335.69 4.29Clutch Auto 335.69 4.29Building Products 126.49 1.61Greenply Industries 126.49 1.61Construction 499.50 6.38Nagarjuna Construction Co. 499.50 6.38Consumer Non Durable 735.65 9.39Gitanjali Gems 303.98 3.88Hanung Toys & Textiles 431.67 5.51Ferrous Metals 349.21 4.46Maharashtra Seamless - Futures 349.21 4.46Industrial Capital Goods 1,212.30 15.48Bharati Shipyard 440.31 5.62Emco 301.32 3.85Kalpataru Power Transmission 470.67 6.01Industrial Products 519.21 6.63Sintex Industries 519.21 6.63Pesticides 321.96 4.11United Phosphorous 321.96 4.11Pharmaceuticals 146.55 1.87IPCA Laboratories 146.55 1.87Real Estate Developers 513.88 6.56Ansal Properties & Infrastructure 299.16 3.82Orbit Corporation 200.98 2.57Orbit Corporation Detachable warrant 13.74 0.18Software 290.29 3.71Mphasis BFL 290.29 3.71Telecom-Services 441.49 5.64Tulip IT Services 441.49 5.64Textile Products 574.77 7.34Bombay Rayon Fashions 574.77 7.34Transportation 895.97 11.44Jet Airways India 287.10 3.66Sanghvi Movers 275.05 3.51Spicejet 333.82 4.26Total Equity 6,962.96 88.89CBLO & Others* 870.63 11.11
Total 7,833.59 100.00(*includes net receivables / payables, if any)
Total Corpus as on April 30, 2007 - Rs. 78.34 Crores
Performance (%) as on April 30, 2007 :Plan 1 Year Incep.*Growth Plan -17.65 3.48BSE 200 ** 11.01 35.02* Inception date = Allotment date i.e. 27.07.2005** Benchmark Index: BSE 200 IndexNote: CAGR for period 1 year or more, with reinvestmentof dividends (if any). Past performance may or may notbe sustained in future.
Portfolio Turnover Ratio : 0.0998
JM Emerging Leaders Fund (An open-ended equity oriented growth scheme)
NAV as on April 30, 2007 :
Growth Plan (Rs.) : 10.62Dividend Plan (Rs.) : 10.65
Inception : 27th July, 2005Fund Manager : Sandip SabharwalInvestment Objective :The primary investment objective of the scheme is to seeklong term capital appreciation from investment in a portfolio ofstocks across all market capitalization range. The portfolio mayinclude those companies operating in emerging sectors of theeconomy or companies which exhibit potential to becomeleaders of tomorrow. However, there can be no assurancesthat the investment objective will be achieved.
(*includes net receivables / payables, if any)
ASSET CLASSIFICATION (%)
$ DISCLAIMERS :●●●●● BSE Finance Index( ) : JM Financial Services Sector Fund is not sponsored, endorsed, sold or promoted by BSE. BSE makes no representation or warranty, express or implied to the
investors in JM Financial Services Sector Fund or any member of the public in any manner whatsoever regarding the advisability of investing in securities generally or in JM Financial ServicesSector Fund particularly or the ability of the index to track the sectors represented in the BSE Finance Index( ). The relationship of BSE to the JM Financial Asset Management Pvt. Ltd. is inrespect of the licensing of use of BSE Finance Index( ) which is determined, composed and calculated by BSE without regard to the JM Financial Asset Management Pvt. Ltd. or JM FinancialServices Sector Fund. BSE has no obligation to take the needs of the investors of JM Financial Services Sector Fund into consideration in determining, composing or calculating the BSEFinance Index( ) BSE is neither responsible for nor has participated in the determination of the time or price at which the units under JM Financial Services Sector Fund are to be issued or inthe determination or calculation of the equation by which the units are to be redeemed for the underlying securities. BSE has no obligation or liability in connection with the administration,marketing or trading of JM Financial Services Sector Fund.BSE does not guarantee the accuracy and/or the completeness and/or continuity of BSE Finance Index( ) or any data included therein and they shall have no liability for any errors, omissionsor interruptions therein or change or cessation thereof. BSE makes no warranty, express or implied, as to the results to be obtained by the JM Financial Asset Management Pvt. Ltd., investorsof JM Financial Services Sector Fund, or any other persons or entities from the use of BSE Finance Index( ) or any data included therein. BSE makes no express or implied warranties andexpressly disclaims all warranties of merchantability or fitness for a particular purpose or use with respect to BSE Finance Index( ) or any data included therein. Without limiting any of theforegoing, in no event shall BSE have any liability for any special, punitive, indirect or consequential damages (including lost profits), even if notified of the possibility of such damages.
●●●●● BSE Telecom Index( ) : JM Telecom Sector Fund is not sponsored, endorsed, sold or promoted by BSE. BSE makes no representation or warranty, express or implied to the investors inJM Telecom Sector Fund or any member of the public in any manner whatsoever regarding the advisability of investing in securities generally or in JM Telecom Sector Fund particularly or theability of the index to track the sectors represented in the BSE Telecom Index( ). The relationship of BSE to the JM Financial Asset Management Pvt. Ltd. is in respect of the licensing of useof BSE Telecom Index( ) which is determined, composed and calculated by BSE without regard to the JM Financial Asset Management Pvt. Ltd. or JM Telecom Sector Fund. BSE has noobligation to take the needs of the investors of JM Telecom Sector Fund into consideration in determining, composing or calculating the BSE Telecom Index( ). BSE is neither responsible fornor has participated in the determination of the time or price at which the units under JM Telecom Sector Fund are to be issued or in the determination or calculation of the equation by whichthe units are to be redeemed for the underlying securities. BSE has no obligation or liability in connection with the administration, marketing or trading of JM Telecom Sector Fund.BSE does not guarantee the accuracy and/or the completeness and/or continuity of BSE Telecom Index( ) or any data included therein and they shall have no liability for any errors, omissionsor interruptions therein or change or cessation thereof. BSE makes no warranty, express or implied, as to the results to be obtained by the JM Financial Asset Management Pvt. Ltd., investorsof JM Telecom Sector Fund, or any other persons or entities from the use of BSE Telecom Index( ) or any data included therein. BSE makes no express or implied warranties and expresslydisclaims all warranties of merchantability or fitness for a particular purpose or use with respect to BSE Telecom Index( ) or any data included therein. Without limiting any of the foregoing, inno event shall BSE have any liability for any special, punitive, indirect or consequential damages (including lost profits), even if notified of the possibility of such damages.
Giving our family of investors many reasons to celebrate
The FPJ Business Journal May 2007 11
PORTFOLIO as on April 30, 2007
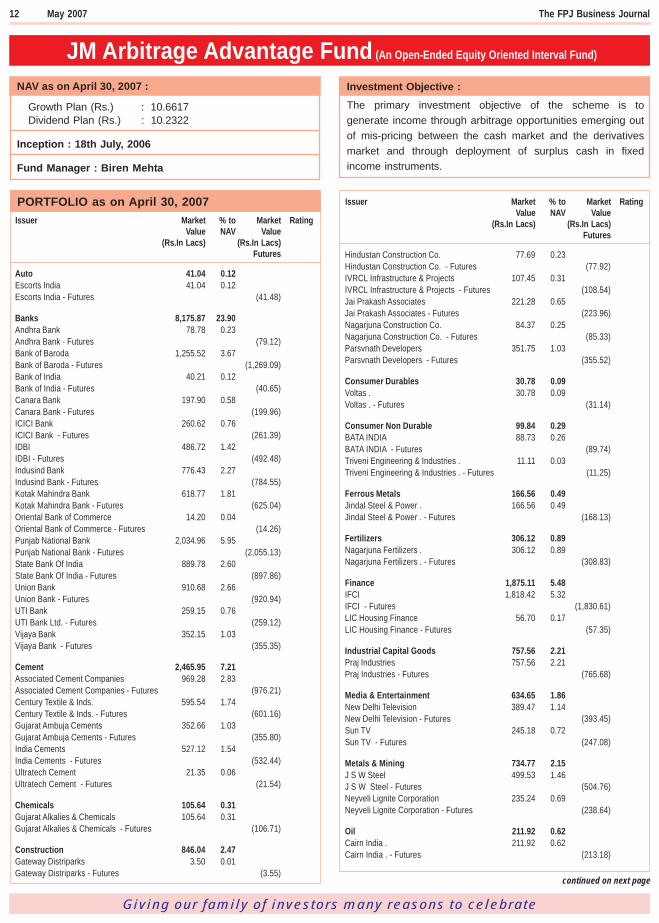
JM Arbitrage Advantage Fund (An Open-Ended Equity Oriented Interval Fund)
Giving our family of investors many reasons to celebrate
Issuer Market % to Market RatingValue NAV Value
(Rs.In Lacs) (Rs.In Lacs)Futures
Issuer Market % to Market RatingValue NAV Value
(Rs.In Lacs) (Rs.In Lacs)Futures
NAV as on April 30, 2007 :
Growth Plan (Rs.) : 10.6617Dividend Plan (Rs.) : 10.2322
Inception : 18th July, 2006
Fund Manager : Biren Mehta
Investment Objective :
The primary investment objective of the scheme is togenerate income through arbitrage opportunities emerging outof mis-pricing between the cash market and the derivativesmarket and through deployment of surplus cash in fixedincome instruments.
Auto 41.04 0.12Escorts India 41.04 0.12Escorts India - Futures (41.48)
Banks 8,175.87 23.90Andhra Bank 78.78 0.23Andhra Bank - Futures (79.12)Bank of Baroda 1,255.52 3.67Bank of Baroda - Futures (1,269.09)Bank of India 40.21 0.12Bank of India - Futures (40.65)Canara Bank 197.90 0.58Canara Bank - Futures (199.96)ICICI Bank 260.62 0.76ICICI Bank - Futures (261.39)IDBI 486.72 1.42IDBI - Futures (492.48)Indusind Bank 776.43 2.27Indusind Bank - Futures (784.55)Kotak Mahindra Bank 618.77 1.81Kotak Mahindra Bank - Futures (625.04)Oriental Bank of Commerce 14.20 0.04Oriental Bank of Commerce - Futures (14.26)Punjab National Bank 2,034.96 5.95Punjab National Bank - Futures (2,055.13)State Bank Of India 889.78 2.60State Bank Of India - Futures (897.86)Union Bank 910.68 2.66Union Bank - Futures (920.94)UTI Bank 259.15 0.76UTI Bank Ltd. - Futures (259.12)Vijaya Bank 352.15 1.03Vijaya Bank - Futures (355.35)
Cement 2,465.95 7.21Associated Cement Companies 969.28 2.83Associated Cement Companies - Futures (976.21)Century Textile & Inds. 595.54 1.74Century Textile & Inds. - Futures (601.16)Gujarat Ambuja Cements 352.66 1.03Gujarat Ambuja Cements - Futures (355.80)India Cements 527.12 1.54India Cements - Futures (532.44)Ultratech Cement 21.35 0.06Ultratech Cement - Futures (21.54)
Chemicals 105.64 0.31Gujarat Alkalies & Chemicals 105.64 0.31Gujarat Alkalies & Chemicals - Futures (106.71)
Construction 846.04 2.47Gateway Distriparks 3.50 0.01Gateway Distriparks - Futures (3.55)
continued on next page
12 May 2007 The FPJ Business Journal
Hindustan Construction Co. 77.69 0.23Hindustan Construction Co. - Futures (77.92)IVRCL Infrastructure & Projects 107.45 0.31IVRCL Infrastructure & Projects - Futures (108.54)Jai Prakash Associates 221.28 0.65Jai Prakash Associates - Futures (223.96)Nagarjuna Construction Co. 84.37 0.25Nagarjuna Construction Co. - Futures (85.33)Parsvnath Developers 351.75 1.03Parsvnath Developers - Futures (355.52)
Consumer Durables 30.78 0.09Voltas . 30.78 0.09Voltas . - Futures (31.14)
Consumer Non Durable 99.84 0.29BATA INDIA 88.73 0.26BATA INDIA - Futures (89.74)Triveni Engineering & Industries . 11.11 0.03Triveni Engineering & Industries . - Futures (11.25)
Ferrous Metals 166.56 0.49Jindal Steel & Power . 166.56 0.49Jindal Steel & Power . - Futures (168.13)
Fertilizers 306.12 0.89Nagarjuna Fertilizers . 306.12 0.89Nagarjuna Fertilizers . - Futures (308.83)
Finance 1,875.11 5.48IFCI 1,818.42 5.32IFCI - Futures (1,830.61)LIC Housing Finance 56.70 0.17LIC Housing Finance - Futures (57.35)
Industrial Capital Goods 757.56 2.21Praj Industries 757.56 2.21Praj Industries - Futures (765.68)
Media & Entertainment 634.65 1.86New Delhi Television 389.47 1.14New Delhi Television - Futures (393.45)Sun TV 245.18 0.72Sun TV - Futures (247.08)
Metals & Mining 734.77 2.15J S W Steel 499.53 1.46J S W Steel - Futures (504.76)Neyveli Lignite Corporation 235.24 0.69Neyveli Lignite Corporation - Futures (238.64)
Oil 211.92 0.62Cairn India . 211.92 0.62Cairn India . - Futures (213.18)
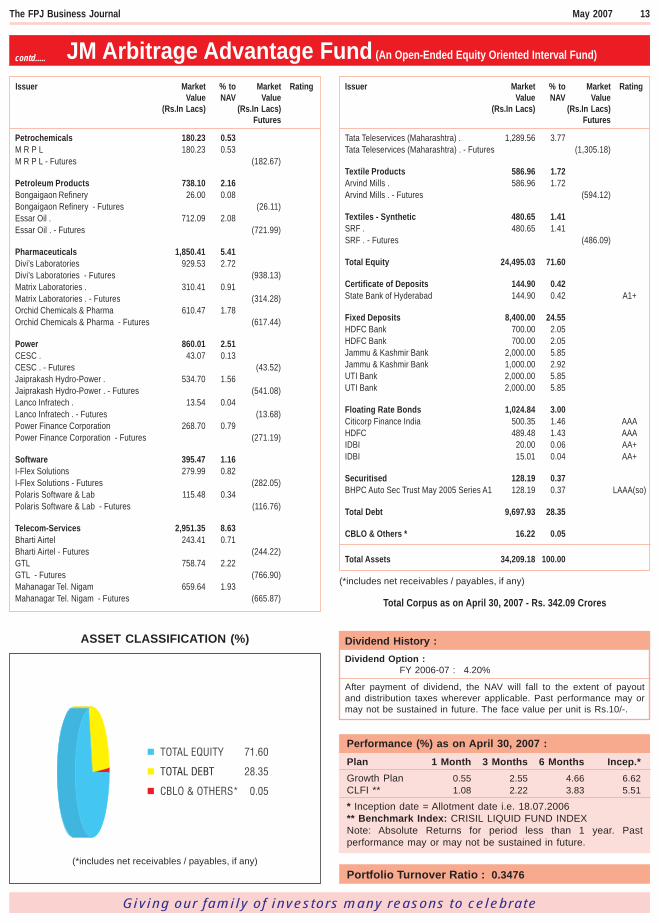
JM Arbitrage Advantage Fund (An Open-Ended Equity Oriented Interval Fund)
Issuer Market % to Market RatingValue NAV Value
(Rs.In Lacs) (Rs.In Lacs)Futures
Issuer Market % to Market RatingValue NAV Value
(Rs.In Lacs) (Rs.In Lacs)Futures
contd.....
ASSET CLASSIFICATION (%)
(*includes net receivables / payables, if any)
The FPJ Business Journal May 2007 13
Performance (%) as on April 30, 2007 :Plan 1 Month 3 Months 6 Months Incep.*Growth Plan 0.55 2.55 4.66 6.62CLFI ** 1.08 2.22 3.83 5.51
* Inception date = Allotment date i.e. 18.07.2006** Benchmark Index: CRISIL LIQUID FUND INDEXNote: Absolute Returns for period less than 1 year. Pastperformance may or may not be sustained in future.
Dividend History :Dividend Option :
FY 2006-07 : 4.20%
After payment of dividend, the NAV will fall to the extent of payoutand distribution taxes wherever applicable. Past performance may ormay not be sustained in future. The face value per unit is Rs.10/-.
Giving our family of investors many reasons to celebrate
Petrochemicals 180.23 0.53M R P L 180.23 0.53M R P L - Futures (182.67)
Petroleum Products 738.10 2.16Bongaigaon Refinery 26.00 0.08Bongaigaon Refinery - Futures (26.11)Essar Oil . 712.09 2.08Essar Oil . - Futures (721.99)
Pharmaceuticals 1,850.41 5.41Divi’s Laboratories 929.53 2.72Divi’s Laboratories - Futures (938.13)Matrix Laboratories . 310.41 0.91Matrix Laboratories . - Futures (314.28)Orchid Chemicals & Pharma 610.47 1.78Orchid Chemicals & Pharma - Futures (617.44)
Power 860.01 2.51CESC . 43.07 0.13CESC . - Futures (43.52)Jaiprakash Hydro-Power . 534.70 1.56Jaiprakash Hydro-Power . - Futures (541.08)Lanco Infratech . 13.54 0.04Lanco Infratech . - Futures (13.68)Power Finance Corporation 268.70 0.79Power Finance Corporation - Futures (271.19)
Software 395.47 1.16I-Flex Solutions 279.99 0.82I-Flex Solutions - Futures (282.05)Polaris Software & Lab 115.48 0.34Polaris Software & Lab - Futures (116.76)
Telecom-Services 2,951.35 8.63Bharti Airtel 243.41 0.71Bharti Airtel - Futures (244.22)GTL 758.74 2.22GTL - Futures (766.90)Mahanagar Tel. Nigam 659.64 1.93Mahanagar Tel. Nigam - Futures (665.87)
Tata Teleservices (Maharashtra) . 1,289.56 3.77Tata Teleservices (Maharashtra) . - Futures (1,305.18)
Textile Products 586.96 1.72Arvind Mills . 586.96 1.72Arvind Mills . - Futures (594.12)
Textiles - Synthetic 480.65 1.41SRF . 480.65 1.41SRF . - Futures (486.09)
Total Equity 24,495.03 71.60
Certificate of Deposits 144.90 0.42State Bank of Hyderabad 144.90 0.42 A1+
Fixed Deposits 8,400.00 24.55HDFC Bank 700.00 2.05HDFC Bank 700.00 2.05Jammu & Kashmir Bank 2,000.00 5.85Jammu & Kashmir Bank 1,000.00 2.92UTI Bank 2,000.00 5.85UTI Bank 2,000.00 5.85
Floating Rate Bonds 1,024.84 3.00Citicorp Finance India 500.35 1.46 AAAHDFC 489.48 1.43 AAAIDBI 20.00 0.06 AA+IDBI 15.01 0.04 AA+
Securitised 128.19 0.37BHPC Auto Sec Trust May 2005 Series A1 128.19 0.37 LAAA(so)
Total Debt 9,697.93 28.35
CBLO & Others * 16.22 0.05
Total Assets 34,209.18 100.00
(*includes net receivables / payables, if any)
Total Corpus as on April 30, 2007 - Rs. 342.09 Crores
Portfolio Turnover Ratio : 0.3476

Giving our family of investors many reasons to celebrate
Scheme JM JM JM JM JM G-Sec JM JM JM JMDetails Income Fund High Liquidity Money G-Sec Fund Fund (PF & Short Term Floater Fund Equity & MIP Fund
Fund Manager Fund (Regular Plan) PF Plus Plan) Fund Derivative Fund
Launch Date Dec 1994 Dec 1997 Sept 2006 Sept 1999 Sept 1999 June 2002 June 2003 Feb 2005 Aug 2003**Super IP:May ‘04 PF Plus: LTP-PP° :Premium Plan - Dec 2003 Sept 2004Daily Div Option:10 Feb 2006
Entry Load Nil Nil Nil Nil Nil Nil Nil Nil Nil
Exit Load 0.40% if = < Nil Regular & 0.25% for Nil Nil STP : Nil For investments 0.50%~Rs.5 lakhs if Super Plan: Nil investment 0.60 %(+) LTP: 0.50% = of less than & incl.redeemed / Super Plus Plan: upto Rs.2 lakhs < Rs.5.00 lakhs Rs.1 Crore: 2% forswitched w.e.f. 01/02/2007, if redeemed / if redeemed / investments< 90 days 0.1% if redeemed switched switched redeemed withinfrom date of within 7 < 90 days < 90 days 25 days from theinvestment. calendar days from date of from date of date of allotment.Nil > Rs.5 lakhs. from the date investment. investment. 1.5% for investments
of allotment of Nil > Rs.5 lakhs. redeemed withinunits. LTP-PP°: Nil 85 days from the
date of allotment.1% for investmentsredeemed within175 days from thedate of allotment.For investmentsabove Rs. 1 Crore:0.50% for investmentsredeemed / switchedout within 25 daysfrom the date ofallotment.
Plans / Growth Plan Growth Plan Regular Plan: Growth option PF Plan: Growth Plan Short Term Plan: Growth option Growth Planoptions Dividend Plan Dividend Plan Growth option Dividend option Growth option Dividend Plan Growth option Dividend option Dividend Plan -
Growth Plan - Daily Div. Plan Dividend option Bonus option Dividend option Institutional Dividend option Bonus option Mly. Div. optionBonus option Growth Plan - Super Plan: PF Plus Plan: Plan: Long Term Plan: Qly. Div. option
Bonus option Growth option Growth option Growth option Growth option Ann. Div. optionDividend Plan - Dividend option Dividend option Dividend option Dividend optionQly. Div. option Super Plus Plan: Long Term Plan -Premium Plan - Growth option Premium Plan:Daily Div. option Dividend option Growth optionInstitutional Plan: Dividend optionGrowth optionDividend optionDaily Div. optionSuper Inst. Plan:Growth optionDaily Div. optionWkly Div. option
Dividend Quarterly $ Daily / Weekly / Daily Quarterly - Fortnightly Short Term - Monthly /Frequency¥ Qtly (with compulsory Plan - Daily Quarterly /
* Daily / Weekly re-investment) Long Term AnnuallyPlan - QuarterlyLTP-PP°Fortnightly
Minimum Rs. 5000 Rs. 5000 Rs.100000 Rs. 5000 Rs. 5000 Rs. 5000 Rs. 5000 Rs. 5000 Rs. 10000Investment▲ # Rs. 1 Lakh PF Plus: *Rs. 1 Lakh LTP-PP°:
* Rs. 1 Crore Rs. 1 Lakh Rs.1 Lakh** Rs. 5 Crore
Redemption T + 2 T + 1 T+1 T + 2 T + 2 T + 1 T + 1 T + 2 (***) T + 2Time¤ Working Days Working Days Working Days Working Days Working Days Working Days Working Days Working Days Working Days
SCHEMES AT A GLANCE
14 May 2007 The FPJ Business Journal

The FPJ Business Journal May 2007 15
SCHEMES AT A GLANCEScheme JM JM JM JM JM JM JM JM JM JMDetails Equity Fund Balanced Basic Fund Auto Sector Healthcare Emerging HI FI Fund Arbitrage Financial Telecom
Fund Fund Sector Leaders Advantage Services SectorFund Fund Fund Sector Fund Fund
Launch Date Dec 1994 Dec 1994 Mar 1997 June, 2004 June, 2004 June, 2005 Feb 2006 June 2006 Nov 2006 Nov 2006
Entry Load 2.25% µ 2.25% µ 2.25% µ 2.25% µ 2.25% µ 2.25% µ 2.25% µ Nil 2.25% µ 2.25% µ
Exit Load Nil Nil Nil Nil Nil Nil Nil 1% if Nil for Nil for2.25% ß 2.25% ß 2.25% ß 2.25% ß 2.25% ß 2.25% ß 2.25% ß redeemed investment < investment<
within Rs.3 crores; Rs.3 crores;3 months of 1% for 1% forallotment / investments> investments>transfer of or =Rs.3 or =Rs.3units crores crores
if redeemed/ if redeemed/switched switchedwithin within6 months 6 monthsof allotment of allotmentof units ß of units ß
Plans / Growth Plan Growth Plan - Growth Plan Growth Plan Growth Plan Growth Plan Growth Plan Growth Plan Growth Planoptions Dividend Plan Dividend Plan Dividend Plan Dividend Plan Dividend Plan Dividend Plan Dividend Plan Dividend Plan Dividend Plan
Dividend - - - - - - - - - -Frequency¥
Minimum Rs. 5000 Rs. 5000 Rs. 5000 Rs. 5000 Rs. 5000 Rs. 5000 Rs. 5000 Rs. 5000 Rs. 5000 Rs. 5000Investment▲
Redemption T + 3 T + 3 T + 3 T + 3 T + 3 T + 3 T + 3 T + 2 (***) T + 3 T + 3Time¤ Working Days Working Days Working Days Working Days Working Days Working Days Working Days Working Days Working Days Working Days
Giving our family of investors many reasons to celebrate
ABBREVIATIONS : $ Regular Plan. # For Regular - Daily Dividend Plans / Options. ^ For investment upto Rs. 2 lakhs if redeemed / switchout within 90 days.* For Institutional Plan. ** For Super Institutional Plan. + 0.60% (at applicable NAV) if redeemed [either through normal redemption or exercising Fixed PeriodRedemption Option (FPRO)] or switched out within 180 days from the date of making the investment. The exit load however, would not be applicable for casescovered under Automatic Annual Reinvestment Option (AARO) & Automatic Capital Appreciation Withdrawal Option (ACAWO). ¤It will be our endeavor todispatch redemption proceeds as indicated in the table above. As per the Regulations, the Fund is required to dispatch redemption proceeds within 10 Businessdays of receiving a valid redemption request. For further details, investors are requested to refer to the Scheme Offer Document. ° LTP-PP : Long Term Plan -Premium Plan. ~ 0.50% if redeemed within 3 months for investments upto and including Rs.5 Lakhs and NIL for investments exceeding Rs.5 Lakhs. Howeverno exit load is applicable for investors availing Systematic Withdrawal Option. μ 2.25% of NAV on all investments of less than Rs. 3 crores; Nil on all investmentsof Rs. 3 crores and above. Nil for investors under Systematic Investment Facility (SIF) and Systematic Transfer Facility (STF). ß 2.25% of NAV for investmentsthrough STF and SIF, if redeemed within 1 year of transfer / allotment. (&) The notional value exposure in derivatives securities would be reckoned for thepurposes of the specified limits, the margin money deployed on these positions would be included in the Money Market Category. (&&) including securitized debtupto a maximum of 30% of net assets of this scheme. ▲ After the minimum investment, additional investment under all Schemes / Plans is in multiples of Re.1/-. For ongoing investment in an existing folio, the minimum investment will be Rs. 1,000/- and in multiples of Re.1/- thereafter. For investing under SIF/STF/SWP option, please refer to respective scheme offer documents. ¥ Dividends shall be declared at the discretion of the Trustee subject to availability of distributableprofits as computed in accordance with SEBI (Mutual Funds) Regulations, 1996.( ) The redemption shall be in terms of Interval Period defined hereinbelow.Redemption request can be submitted to the official point of acceptance on any business day till 3.00 pm. All redemption requests received till Friday (in casesuch Friday is a holiday then the last business day) of the week preceding the interval period, would be processed at the NAV of the Interval Period. The Intervalperiod will be the settlement Thursday (the settlement day for derivatives segment in the NSE which is currently last Thursday of the month) or any day whichis declared as the settlement day for Derivatives segment by the NSE.Illustrative Example:
Interval Period Applications for redemption/switchout Applicable NAV for theredemption/switchout
For Sept ’06 - 28.09.2006 All redemption requests received on 25.08.2006 after 3.00 p.m. and NAV of 28.09.2006during the period 28.08.2006 to 22.09.2006 before 3.00 p.m.
For Oct ’06 - 26.10.2006 All redemption requests received on 22.09.2006 after 3.00 p.m. and NAV of 26.10.2006during the period 25.09.2006 to 20.10.2006 before 3.00 p.m.
It is clarified that the cut-off timings will also be applicable to investments made through “sweepmode”.Investors will not have to bear entry load, wherever applicable, for their inter-equity and intra equity scheme switches except in case of (i) switches to / fromJM Arbitrage Advantage Fund from / to any equity scheme and (ii) switches from any scheme to an equity scheme during its New Fund Offer period.
The above details are subject to provisions laid down in the respective scheme Offer Documents.
Giving our family of investors many reasons to celebrate
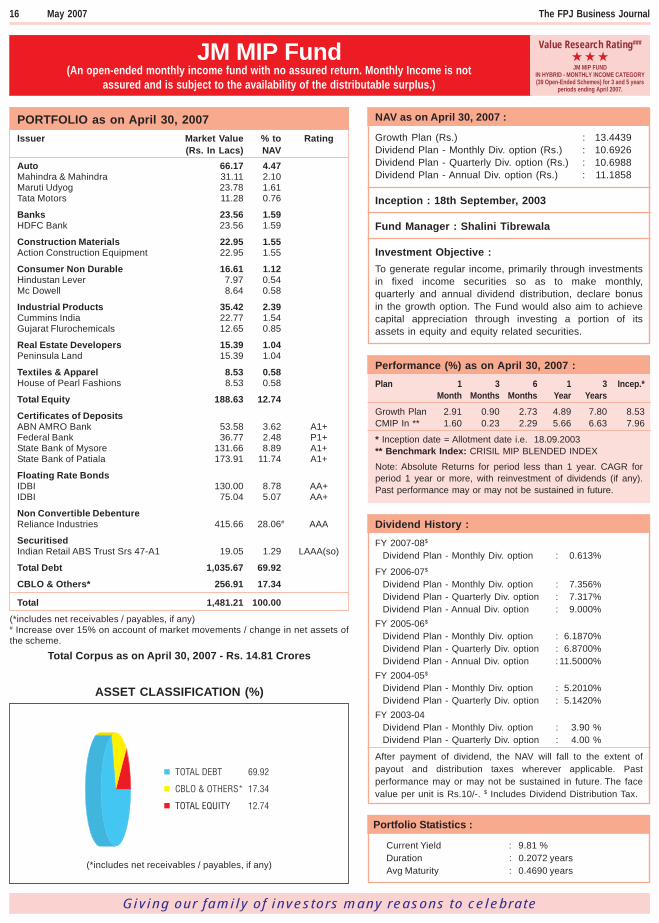
JM MIP Fund(An open-ended monthly income fund with no assured return. Monthly Income is not
assured and is subject to the availability of the distributable surplus.)
PORTFOLIO as on April 30, 2007Issuer Market Value % to Rating
(Rs. In Lacs) NAVAuto 66.17 4.47Mahindra & Mahindra 31.11 2.10Maruti Udyog 23.78 1.61Tata Motors 11.28 0.76
Banks 23.56 1.59HDFC Bank 23.56 1.59
Construction Materials 22.95 1.55Action Construction Equipment 22.95 1.55
Consumer Non Durable 16.61 1.12Hindustan Lever 7.97 0.54Mc Dowell 8.64 0.58
Industrial Products 35.42 2.39Cummins India 22.77 1.54Gujarat Flurochemicals 12.65 0.85
Real Estate Developers 15.39 1.04Peninsula Land 15.39 1.04
Textiles & Apparel 8.53 0.58House of Pearl Fashions 8.53 0.58
Total Equity 188.63 12.74
Certificates of DepositsABN AMRO Bank 53.58 3.62 A1+Federal Bank 36.77 2.48 P1+State Bank of Mysore 131.66 8.89 A1+State Bank of Patiala 173.91 11.74 A1+
Floating Rate BondsIDBI 130.00 8.78 AA+IDBI 75.04 5.07 AA+
Non Convertible DebentureReliance Industries 415.66 28.06# AAA
SecuritisedIndian Retail ABS Trust Srs 47-A1 19.05 1.29 LAAA(so)
Total Debt 1,035.67 69.92
CBLO & Others* 256.91 17.34
Total 1,481.21 100.00
(*includes net receivables / payables, if any)# Increase over 15% on account of market movements / change in net assets ofthe scheme.
Total Corpus as on April 30, 2007 - Rs. 14.81 Crores
NAV as on April 30, 2007 :
Growth Plan (Rs.) : 13.4439Dividend Plan - Monthly Div. option (Rs.) : 10.6926Dividend Plan - Quarterly Div. option (Rs.) : 10.6988Dividend Plan - Annual Div. option (Rs.) : 11.1858
Inception : 18th September, 2003
Fund Manager : Shalini Tibrewala
Investment Objective :To generate regular income, primarily through investmentsin fixed income securities so as to make monthly,quarterly and annual dividend distribution, declare bonusin the growth option. The Fund would also aim to achievecapital appreciation through investing a portion of itsassets in equity and equity related securities.
Performance (%) as on April 30, 2007 :Plan 1 3 6 1 3 Incep.*
Month Months Months Year YearsGrowth Plan 2.91 0.90 2.73 4.89 7.80 8.53CMIP In ** 1.60 0.23 2.29 5.66 6.63 7.96
* Inception date = Allotment date i.e. 18.09.2003** Benchmark Index: CRISIL MIP BLENDED INDEX
Note: Absolute Returns for period less than 1 year. CAGR forperiod 1 year or more, with reinvestment of dividends (if any).Past performance may or may not be sustained in future.
Dividend History :FY 2007-08$
Dividend Plan - Monthly Div. option : 0.613%
FY 2006-07$
Dividend Plan - Monthly Div. option : 7.356%Dividend Plan - Quarterly Div. option : 7.317%Dividend Plan - Annual Div. option : 9.000%
FY 2005-06$
Dividend Plan - Monthly Div. option : 6.1870%Dividend Plan - Quarterly Div. option : 6.8700%Dividend Plan - Annual Div. option :11.5000%
FY 2004-05$
Dividend Plan - Monthly Div. option : 5.2010%Dividend Plan - Quarterly Div. option : 5.1420%
FY 2003-04Dividend Plan - Monthly Div. option : 3.90 %Dividend Plan - Quarterly Div. option : 4.00 %
After payment of dividend, the NAV will fall to the extent ofpayout and distribution taxes wherever applicable. Pastperformance may or may not be sustained in future. The facevalue per unit is Rs.10/-. $ Includes Dividend Distribution Tax.
Portfolio Statistics :
Current Yield : 9.81 %Duration : 0.2072 yearsAvg Maturity : 0.4690 years
ASSET CLASSIFICATION (%)
(*includes net receivables / payables, if any)
JM MIP FUNDIN HYBRID - MONTHLY INCOME CATEGORY(39 Open-Ended Schemes) for 3 and 5 years
periods ending April 2007.
Value Research Rating###
16 May 2007 The FPJ Business Journal
The FPJ Business Journal May 2007 17
NAV as on April 30, 2007 :
Growth Plan (Rs.) : 28.8712Dividend Plan (Rs.) : 10.2144Growth Plan - Bonus option (Rs.) : 11.8114
Inception : 1st April, 1995
Fund Manager : Dwijendra Srivastava
Investment Objective :
To generate stable long term returns with low risk strategyand capital appreciation / accretion through investment indebt instruments and related securities besidespreservation of capital.
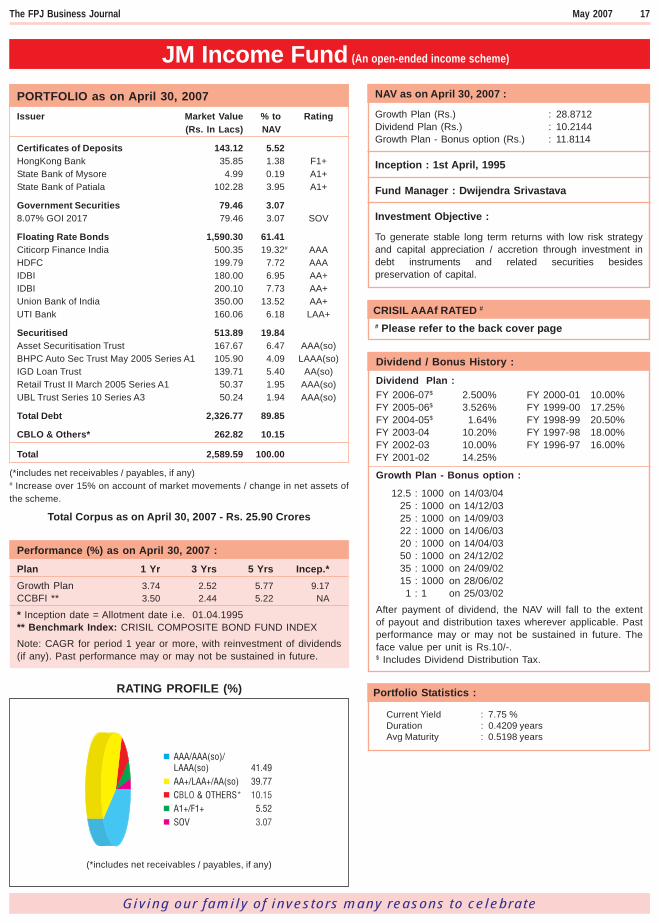
PORTFOLIO as on April 30, 2007Issuer Market Value % to Rating
(Rs. In Lacs) NAV
Certificates of Deposits 143.12 5.52HongKong Bank 35.85 1.38 F1+State Bank of Mysore 4.99 0.19 A1+State Bank of Patiala 102.28 3.95 A1+
Government Securities 79.46 3.078.07% GOI 2017 79.46 3.07 SOV
Floating Rate Bonds 1,590.30 61.41Citicorp Finance India 500.35 19.32# AAAHDFC 199.79 7.72 AAAIDBI 180.00 6.95 AA+IDBI 200.10 7.73 AA+Union Bank of India 350.00 13.52 AA+UTI Bank 160.06 6.18 LAA+
Securitised 513.89 19.84Asset Securitisation Trust 167.67 6.47 AAA(so)BHPC Auto Sec Trust May 2005 Series A1 105.90 4.09 LAAA(so)IGD Loan Trust 139.71 5.40 AA(so)Retail Trust II March 2005 Series A1 50.37 1.95 AAA(so)UBL Trust Series 10 Series A3 50.24 1.94 AAA(so)
Total Debt 2,326.77 89.85
CBLO & Others* 262.82 10.15
Total 2,589.59 100.00
(*includes net receivables / payables, if any)# Increase over 15% on account of market movements / change in net assets ofthe scheme.
Total Corpus as on April 30, 2007 - Rs. 25.90 Crores
Performance (%) as on April 30, 2007 :
Plan 1 Yr 3 Yrs 5 Yrs Incep.*Growth Plan 3.74 2.52 5.77 9.17CCBFI ** 3.50 2.44 5.22 NA
* Inception date = Allotment date i.e. 01.04.1995** Benchmark Index: CRISIL COMPOSITE BOND FUND INDEXNote: CAGR for period 1 year or more, with reinvestment of dividends(if any). Past performance may or may not be sustained in future.
Dividend / Bonus History :
Dividend Plan :FY 2006-07$ 2.500% FY 2000-01 10.00%FY 2005-06$ 3.526% FY 1999-00 17.25%FY 2004-05$ 1.64% FY 1998-99 20.50%FY 2003-04 10.20% FY 1997-98 18.00%FY 2002-03 10.00% FY 1996-97 16.00%FY 2001-02 14.25%
Growth Plan - Bonus option :
12.5 : 1000 on 14/03/0425 : 1000 on 14/12/0325 : 1000 on 14/09/0322 : 1000 on 14/06/0320 : 1000 on 14/04/0350 : 1000 on 24/12/0235 : 1000 on 24/09/0215 : 1000 on 28/06/021 : 1 on 25/03/02
After payment of dividend, the NAV will fall to the extentof payout and distribution taxes wherever applicable. Pastperformance may or may not be sustained in future. Theface value per unit is Rs.10/-.$ Includes Dividend Distribution Tax.
JM Income Fund (An open-ended income scheme)
CRISIL AAAf RATED ## Please refer to the back cover page
Portfolio Statistics :
Current Yield : 7.75 %Duration : 0.4209 yearsAvg Maturity : 0.5198 years
RATING PROFILE (%)
(*includes net receivables / payables, if any)
Giving our family of investors many reasons to celebrate
CRISIL AAAf RATED ## Please refer to the back cover page
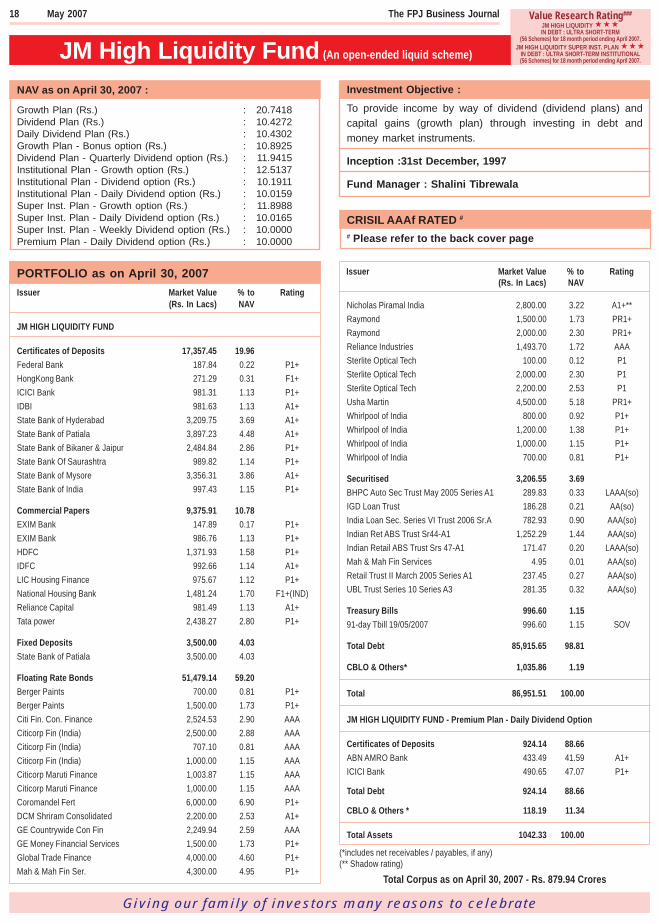
PORTFOLIO as on April 30, 2007Issuer Market Value % to Rating
(Rs. In Lacs) NAV
JM HIGH LIQUIDITY FUND
Certificates of Deposits 17,357.45 19.96Federal Bank 187.84 0.22 P1+
HongKong Bank 271.29 0.31 F1+
ICICI Bank 981.31 1.13 P1+
IDBI 981.63 1.13 A1+
State Bank of Hyderabad 3,209.75 3.69 A1+
State Bank of Patiala 3,897.23 4.48 A1+
State Bank of Bikaner & Jaipur 2,484.84 2.86 P1+
State Bank Of Saurashtra 989.82 1.14 P1+
State Bank of Mysore 3,356.31 3.86 A1+
State Bank of India 997.43 1.15 P1+
Commercial Papers 9,375.91 10.78EXIM Bank 147.89 0.17 P1+
EXIM Bank 986.76 1.13 P1+
HDFC 1,371.93 1.58 P1+
IDFC 992.66 1.14 A1+
LIC Housing Finance 975.67 1.12 P1+
National Housing Bank 1,481.24 1.70 F1+(IND)
Reliance Capital 981.49 1.13 A1+
Tata power 2,438.27 2.80 P1+
Fixed Deposits 3,500.00 4.03State Bank of Patiala 3,500.00 4.03
Floating Rate Bonds 51,479.14 59.20Berger Paints 700.00 0.81 P1+
Berger Paints 1,500.00 1.73 P1+
Citi Fin. Con. Finance 2,524.53 2.90 AAA
Citicorp Fin (India) 2,500.00 2.88 AAA
Citicorp Fin (India) 707.10 0.81 AAA
Citicorp Fin (India) 1,000.00 1.15 AAA
Citicorp Maruti Finance 1,003.87 1.15 AAA
Citicorp Maruti Finance 1,000.00 1.15 AAA
Coromandel Fert 6,000.00 6.90 P1+
DCM Shriram Consolidated 2,200.00 2.53 A1+
GE Countrywide Con Fin 2,249.94 2.59 AAA
GE Money Financial Services 1,500.00 1.73 P1+
Global Trade Finance 4,000.00 4.60 P1+
Mah & Mah Fin Ser. 4,300.00 4.95 P1+
Issuer Market Value % to Rating(Rs. In Lacs) NAV
18 May 2007 The FPJ Business Journal
Giving our family of investors many reasons to celebrate
Value Research Rating###
JM HIGH LIQUIDITY IN DEBT : ULTRA SHORT-TERM
(56 Schemes) for 18 month period ending April 2007.JM HIGH LIQUIDITY SUPER INST. PLAN
IN DEBT : ULTRA SHORT-TERM INSTITUTIONAL(56 Schemes) for 18 month period ending April 2007.
JM High Liquidity Fund (An open-ended liquid scheme)
Investment Objective :
To provide income by way of dividend (dividend plans) andcapital gains (growth plan) through investing in debt andmoney market instruments.
Inception :31st December, 1997
Fund Manager : Shalini Tibrewala
NAV as on April 30, 2007 :
Growth Plan (Rs.) : 20.7418Dividend Plan (Rs.) : 10.4272Daily Dividend Plan (Rs.) : 10.4302Growth Plan - Bonus option (Rs.) : 10.8925Dividend Plan - Quarterly Dividend option (Rs.) : 11.9415Institutional Plan - Growth option (Rs.) : 12.5137Institutional Plan - Dividend option (Rs.) : 10.1911Institutional Plan - Daily Dividend option (Rs.) : 10.0159Super Inst. Plan - Growth option (Rs.) : 11.8988Super Inst. Plan - Daily Dividend option (Rs.) : 10.0165Super Inst. Plan - Weekly Dividend option (Rs.) : 10.0000Premium Plan - Daily Dividend option (Rs.) : 10.0000
Nicholas Piramal India 2,800.00 3.22 A1+**
Raymond 1,500.00 1.73 PR1+
Raymond 2,000.00 2.30 PR1+
Reliance Industries 1,493.70 1.72 AAA
Sterlite Optical Tech 100.00 0.12 P1
Sterlite Optical Tech 2,000.00 2.30 P1
Sterlite Optical Tech 2,200.00 2.53 P1
Usha Martin 4,500.00 5.18 PR1+
Whirlpool of India 800.00 0.92 P1+
Whirlpool of India 1,200.00 1.38 P1+
Whirlpool of India 1,000.00 1.15 P1+
Whirlpool of India 700.00 0.81 P1+
Securitised 3,206.55 3.69BHPC Auto Sec Trust May 2005 Series A1 289.83 0.33 LAAA(so)
IGD Loan Trust 186.28 0.21 AA(so)
India Loan Sec. Series VI Trust 2006 Sr.A 782.93 0.90 AAA(so)
Indian Ret ABS Trust Sr44-A1 1,252.29 1.44 AAA(so)
Indian Retail ABS Trust Srs 47-A1 171.47 0.20 LAAA(so)
Mah & Mah Fin Services 4.95 0.01 AAA(so)
Retail Trust II March 2005 Series A1 237.45 0.27 AAA(so)
UBL Trust Series 10 Series A3 281.35 0.32 AAA(so)
Treasury Bills 996.60 1.1591-day Tbill 19/05/2007 996.60 1.15 SOV
Total Debt 85,915.65 98.81
CBLO & Others* 1,035.86 1.19
Total 86,951.51 100.00
JM HIGH LIQUIDITY FUND - Premium Plan - Daily Dividend Option
Certificates of Deposits 924.14 88.66ABN AMRO Bank 433.49 41.59 A1+
ICICI Bank 490.65 47.07 P1+
Total Debt 924.14 88.66
CBLO & Others * 118.19 11.34
Total Assets 1042.33 100.00
(*includes net receivables / payables, if any)(** Shadow rating)
Total Corpus as on April 30, 2007 - Rs. 879.94 Crores
JM High Liquidity Fund (An open-ended liquid scheme)contd....
Giving our family of investors many reasons to celebrate
Dividend / Bonus History :FY 2007-08$
Dividend Plan : 0.795%Daily Dividend Plan : 0.742%Inst. Plan - Dividend option : 0.776%Inst. Plan - Daily Dividend option : 0.713%Super Inst. Plan - Daily Div. option : 0.713%Premium Plan - Daily Div. option : 0.613%
FY 2006-07$
Dividend Plan : 5.906%Daily Dividend Plan : 7.049%Inst. Plan - Dividend option : 5.855%Inst. Plan - Daily Dividend option : 6.868%Super Inst. Plan - Weekly Div. option : 5.944%Super Inst. Plan - Daily Div. option : 6.982%Premium Plan - Daily Div. option : 6.918%
FY 2005-06$
Dividend Plan : 4.5880%Daily Dividend Plan : 5.0985%Inst. Plan - Dividend option : 4.9020%Inst. Plan - Daily Dividend option : 5.2423%Super Inst. Plan - Weekly Div. option : 5.2540%Super Inst. Plan - Daily Div. option : 5.5167%Premium Plan - Daily Div. option : 0.8614%
FY 2004-05$
Dividend Plan : 22.3350%Daily Dividend Plan : 4.2926%Inst. Plan - Dividend option : 4.4630%Inst. Plan - Daily Dividend option : 4.4686%Super Inst. Plan - Weekly Div. option : 3.9730%Super Inst. Plan - Daily Div. option : 4.0218%
FY 2003-04Dividend Plan : 4.950%Daily Dividend Plan : 4.333%Dividend Plan - Quarterly option : 19.000%Dividend Plan - Annual option : 19.000%Inst. Plan - Dividend option : 4.205%Inst. Plan - Daily Dividend option : 2.866%
FY 2002-03 (Dividend Plan) : 1.180%FY 2001-02 (Dividend Plan) : 7.275%FY 2000-01 (Dividend Plan) : 7.525%FY 1999-00 (Dividend Plan) : 8.500%
Growth Plan - Bonus option :190 : 1000 on 23/10/2006
After payment of dividend, the NAV will fall to the extent of payoutand distribution taxes wherever applicable. Past performance may ormay not be sustained in future. The face value per unit is Rs.10/-.$ Includes Dividend Distribution Tax.
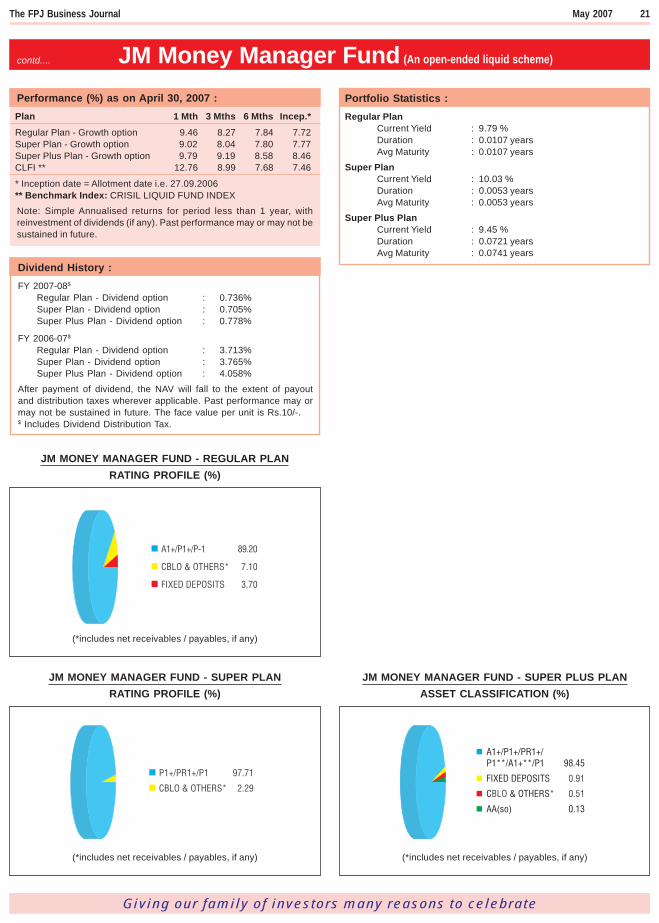
JM HIGH LIQUIDITY FUND - PREMIUM PLANRATING PROFILE (%)
(*includes net receivables/payables)
Performance (%) as on April 30, 2007 :Plan 1 3 6
Month Months Months
Growth Plan 8.96 8.48 7.97CLFI ** 12.76 8.99 7.68
Plan 1 Yr 3 Yrs 5 Yrs Incep.*
Growth Plan 7.27 5.58 5.64 8.13CLFI ** 6.73 5.39 5.26 NA
* Inception date = Allotment date i.e. 31.12.1997** Benchmark Index: CRISIL LIQUID FUND INDEX
Note: Simple Annualised returns for period less than 1 year,CAGR for period 1 year or more, with reinvestment of dividends(if any). Past performance may or may not be sustained in future.
The FPJ Business Journal May 2007 19
Portfolio Statistics :
High Liquidity FundCurrent Yield : 8.66 %Duration : 0.1022 yearsAvg Maturity : 0.1022 years
High Liquidity Fund - Premium Plan - Daily Div. OptionCurrent Yield : 7.60 %Duration : 0.2949 yearsAvg Maturity : 0.2949 years
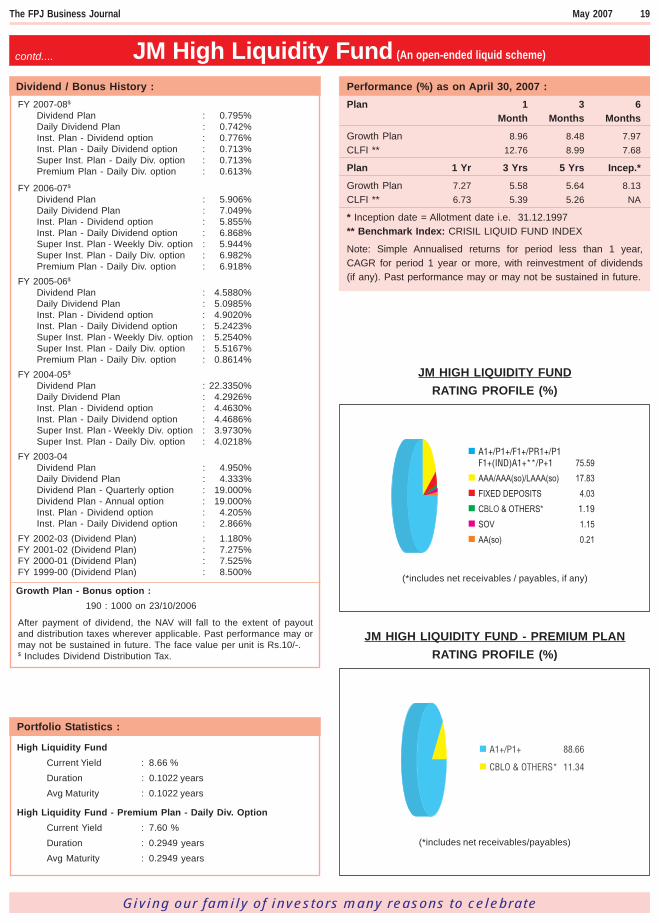
JM HIGH LIQUIDITY FUNDRATING PROFILE (%)
(*includes net receivables / payables, if any)

Giving our family of investors many reasons to celebrate
NAV as on April 30, 2007 :
Regular Plan - Growth option : 10.4545Regular Plan - Dividend option : 10.0000Super Plan - Growth option : 10.4574Super Plan - Dividend option : 10.0000Super Plus Plan - Growth option : 10.4982Super Plus Plan - Dividend option : 10.0000
JM Money Manager Fund (An open-ended liquid scheme)
PORTFOLIO as on April 30, 2007Issuer Market Value % to Rating
(Rs. In Lacs) NAV
Portfolio of REGULAR PLAN
Bill - Rediscounting 188.19 5.80HDFC Bank 08/05/07 119.78 3.69 P1+HDFC Bank 19/07/2007 68.41 2.11 P1+
Certificates of Deposits 999.15 30.81Standard Chartered Bank 999.15 30.81 P1+
Commercial Papers 4.89 0.15Tata Power 4.89 0.15 P1+
Fixed Deposits 120.00 3.70State Bank of Bikaner & Jaipur 120.00 3.70
Floating Rate Bonds 1,700.00 52.43Berger Paints 100.00 3.08 P1+DCM Shriram Consolidated 200.00 6.17 A1+GE Money Financial Services 100.00 3.08 P1+Mah & Mah Fin Ser. 200.00 6.17 P1+Redington India 300.00 9.25 P1+Sterlite Optical Tech 200.00 6.17 P1Whirlpool of India 300.00 9.25 P1+Whirlpool of India 300.00 9.25 P1+
Total Debt 3,012.23 92.90
CBLO & Others* 230.27 7.10
Total 3,242.50 100.00
Portfolio of SUPER PLAN
Certificates of Deposits 284.76 47.58Standard Chartered Bank 284.76 47.58 P1+
Floating Rate Bonds 300.00 50.13Raymond 100.00 16.71 PR1+Sterlite Optical Tech 100.00 16.71 P1Whirlpool of India 100.00 16.71 P1+
Total Debt 584.76 97.71
CBLO & Others* 13.72 2.29
Total 598.48 100.00
Portfolio of SUPER PLUS PLAN
Bill - Rediscounting 7.82 0.02HDFC Bank 19/07/2007 7.82 0.02 P1+
Certificates of Deposits 13,368.44 30.57American Express Bank 499.13 1.14 A1+Federal Bank 7.95 0.02 P1+HongKong Bank 505.75 1.16 F1+
20 May 2007 The FPJ Business Journal
Investment Objective :An open-ended liquid scheme which seeks to provide income by way ofdividend (dividend option) and capital gains (growth option) throughinvesting in debt and money market instruments.
Inception : 27th September, 2006
Fund Manager : Shalini Tibrewala
Issuer Market Value % to Rating(Rs. In Lacs) NAV
ICICI Bank 997.36 2.28 P1+ICICI Bank 2,473.24 5.66 P1+ICICI Bank 980.78 2.24 P1+State Bank of Indore 997.38 2.28 P1+State Bank of Mysore 1,835.21 4.20 A1+State Bank of Patiala 2,310.57 5.28 A1+State Bank of Travancore 491.56 1.12 P1+State Bank of Bikaner & Jaipur 992.09 2.27 P1+State Bank of Bikaner & Jaipur 892.65 2.04 P1+State Bank of Patiala 384.77 0.88 A1+
Commercial Papers 2,973.74 6.80IDFC 1,489.00 3.41 A1+Kotak Mahindra Primus 1,484.74 3.40 P1+
Fixed Deposits 400.00 0.91State Bank of Patiala 400.00 0.91
Floating Rate Bonds 19,200.00 43.91Berger Paints 2,100.00 4.80 P1+Berger Paints 1,700.00 3.89 P1+Bombay Dyeing & Mfg. 1,000.00 2.29 A1+**DCM Shriram Consolidated 100.00 0.23 A1+GE Money Financial Services 400.00 0.91 P1+Global Trade Finance 1,000.00 2.29 P1+Hindustan National Glass & Ind. 2,000.00 4.57 PR1+Mah & Mah Fin Ser. 500.00 1.14 P1+Nicholas Piramal India 2,200.00 5.03 A1+**Raymond 2,300.00 5.26 PR1+Redington India 1,700.00 3.89 P1+Sterlite Optical Tech 2,100.00 4.80 P1Sterlite Optical Tech 1,300.00 2.97 P1Whirlpool of India 700.00 1.60 P1+Whirlpool of India 100.00 0.23 P1+
Privately Placed Debenture 7,500.00 17.15Bombay Dyeing & Mfg. Co. 1,500.00 3.43 A1+**Essel Propack 1,500.00 3.43 P1+**Manaksia 2,000.00 4.57 PR1+Ranbaxy Holding Company 2,500.00 5.72 P1
Securitised 55.89 0.13IGD Loan Trust 55.89 0.13 AA(so)
Total Debt 43,505.89 99.49
CBLO & Others* 221.05 0.51
Total 43,726.94 100.00
(*includes net receivables / payables, if any)(** Shadow rating)
Total Corpus as on April 30, 2007 - Rs. 475.68 Crores
Giving our family of investors many reasons to celebrate
The FPJ Business Journal May 2007 21
Performance (%) as on April 30, 2007 :Plan 1 Mth 3 Mths 6 Mths Incep.*Regular Plan - Growth option 9.46 8.27 7.84 7.72Super Plan - Growth option 9.02 8.04 7.80 7.77Super Plus Plan - Growth option 9.79 9.19 8.58 8.46CLFI ** 12.76 8.99 7.68 7.46
* Inception date = Allotment date i.e. 27.09.2006** Benchmark Index: CRISIL LIQUID FUND INDEX
Note: Simple Annualised returns for period less than 1 year, withreinvestment of dividends (if any). Past performance may or may not besustained in future.
Dividend History :FY 2007-08$
Regular Plan - Dividend option : 0.736%Super Plan - Dividend option : 0.705%Super Plus Plan - Dividend option : 0.778%
FY 2006-07$
Regular Plan - Dividend option : 3.713%Super Plan - Dividend option : 3.765%Super Plus Plan - Dividend option : 4.058%
After payment of dividend, the NAV will fall to the extent of payoutand distribution taxes wherever applicable. Past performance may ormay not be sustained in future. The face value per unit is Rs.10/-.$ Includes Dividend Distribution Tax.
Portfolio Statistics :Regular Plan
Current Yield : 9.79 %Duration : 0.0107 yearsAvg Maturity : 0.0107 years
Super PlanCurrent Yield : 10.03 %Duration : 0.0053 yearsAvg Maturity : 0.0053 years
Super Plus PlanCurrent Yield : 9.45 %Duration : 0.0721 yearsAvg Maturity : 0.0741 years
JM Money Manager Fund (An open-ended liquid scheme)contd....
(*includes net receivables / payables, if any)
JM MONEY MANAGER FUND - SUPER PLANRATING PROFILE (%)
(*includes net receivables / payables, if any)
JM MONEY MANAGER FUND - REGULAR PLANRATING PROFILE (%)
(*includes net receivables / payables, if any)
JM MONEY MANAGER FUND - SUPER PLUS PLANASSET CLASSIFICATION (%)
NAV as on April 30, 2007 :
Regular Plan - Growth option (Rs.) : 21.2170Regular Plan - Dividend option (Rs.) : 10.1423Regular Plan - Bonus option (Rs.) : 10.3208PF Plan - Growth option (Rs.) : 21.9661PF Plan - Dividend option (Rs.) : 20.1275PF Plus Plan - Growth option (Rs.) : 10.9950PF Plus Plan - Dividend option (Rs.) : 10.9975
Inception :Regular & PF Plan : 29th September, 1999PF Plus Plan : 15th January, 2004
Fund Manager : Dwijendra Srivastava
Investment Objective :To provide ultimate level of safety to its unitholders throughinvestments in sovereign securities issued by the Centraland State Government.
PORTFOLIO as on April 30, 2007Issuer Market Value % to Rating
(Rs. In Lacs) NAV
Portfolio of REGULAR PLANGovernment Securities 327.66 98.207.38% GOI - 2015 190.60 57.13 SOV8.07% GOI - 2017 137.06 41.08 SOVTotal Debt 327.66 98.20CBLO & Others* 5.99 1.80
Total 333.65 100.00
Portfolio of PF PLAN
Government Securities 225.36 98.677.38% GOI - 2015 190.60 83.45 SOV8.07% GOI - 2017 34.76 15.22 SOVTotal Debt 225.36 98.67CBLO & Others* 3.04 1.33
Total 228.40 100.00
Portfolio of PF PLUS PLAN
Government Securities 817.11 98.277.38% GOI - 2015 571.79 68.77 SOV8.07% GOI - 2017 245.32 29.50 SOVTotal Debt 817.11 98.27CBLO & Others* 14.40 1.73
Total 831.51 100.00(*includes net receivables / payables, if any)
Total Corpus as on April 30, 2007 - Rs. 13.94 Crores
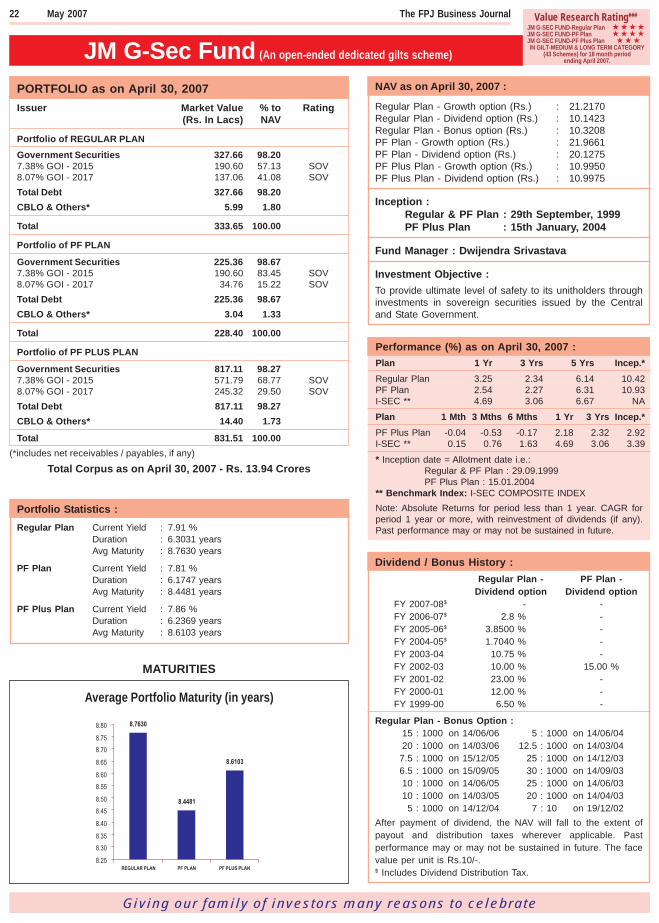
JM G-Sec Fund (An open-ended dedicated gilts scheme)
Giving our family of investors many reasons to celebrate
MATURITIES
Average Portfolio Maturity (in years)
Dividend / Bonus History :Regular Plan - PF Plan -
Dividend option Dividend optionFY 2007-08$ - -FY 2006-07$ 2.8 % -FY 2005-06$ 3.8500 % -FY 2004-05$ 1.7040 % -FY 2003-04 10.75 % -FY 2002-03 10.00 % 15.00 %FY 2001-02 23.00 % -FY 2000-01 12.00 % -FY 1999-00 6.50 % -
Regular Plan - Bonus Option :15 : 1000 on 14/06/06 5 : 1000 on 14/06/0420 : 1000 on 14/03/06 12.5 : 1000 on 14/03/04
7.5 : 1000 on 15/12/05 25 : 1000 on 14/12/036.5 : 1000 on 15/09/05 30 : 1000 on 14/09/0310 : 1000 on 14/06/05 25 : 1000 on 14/06/0310 : 1000 on 14/03/05 20 : 1000 on 14/04/03
5 : 1000 on 14/12/04 7 : 1000 on 19/12/02After payment of dividend, the NAV will fall to the extent ofpayout and distribution taxes wherever applicable. Pastperformance may or may not be sustained in future. The facevalue per unit is Rs.10/-.$ Includes Dividend Distribution Tax.
Portfolio Statistics :Regular Plan Current Yield : 7.91 %
Duration : 6.3031 yearsAvg Maturity : 8.7630 years
PF Plan Current Yield : 7.81 %Duration : 6.1747 yearsAvg Maturity : 8.4481 years
PF Plus Plan Current Yield : 7.86 %Duration : 6.2369 yearsAvg Maturity : 8.6103 years
Value Research Rating###
JM G-SEC FUND-Regular PlanJM G-SEC FUND-PF PlanJM G-SEC FUND-PF Plus PlanIN GILT-MEDIUM & LONG TERM CATEGORY
(43 Schemes) for 18 month periodending April 2007.
Performance (%) as on April 30, 2007 :Plan 1 Yr 3 Yrs 5 Yrs Incep.*Regular Plan 3.25 2.34 6.14 10.42PF Plan 2.54 2.27 6.31 10.93I-SEC ** 4.69 3.06 6.67 NA
Plan 1 Mth 3 Mths 6 Mths 1 Yr 3 Yrs Incep.*PF Plus Plan -0.04 -0.53 -0.17 2.18 2.32 2.92I-SEC ** 0.15 0.76 1.63 4.69 3.06 3.39
* Inception date = Allotment date i.e.:Regular & PF Plan : 29.09.1999PF Plus Plan : 15.01.2004
** Benchmark Index: I-SEC COMPOSITE INDEXNote: Absolute Returns for period less than 1 year. CAGR forperiod 1 year or more, with reinvestment of dividends (if any).Past performance may or may not be sustained in future.
22 May 2007 The FPJ Business Journal
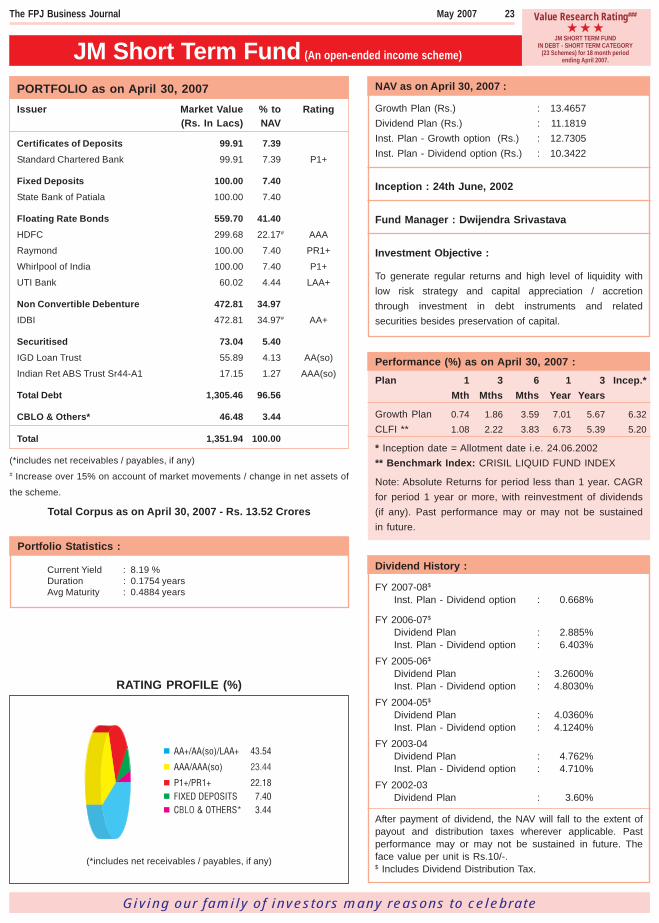
NAV as on April 30, 2007 :
Growth Plan (Rs.) : 13.4657Dividend Plan (Rs.) : 11.1819Inst. Plan - Growth option (Rs.) : 12.7305Inst. Plan - Dividend option (Rs.) : 10.3422
Inception : 24th June, 2002
Fund Manager : Dwijendra Srivastava
Investment Objective :
To generate regular returns and high level of liquidity withlow risk strategy and capital appreciation / accretionthrough investment in debt instruments and relatedsecurities besides preservation of capital.
Dividend History :
FY 2007-08$
Inst. Plan - Dividend option : 0.668%
FY 2006-07$
Dividend Plan : 2.885%Inst. Plan - Dividend option : 6.403%
FY 2005-06$
Dividend Plan : 3.2600%Inst. Plan - Dividend option : 4.8030%
FY 2004-05$
Dividend Plan : 4.0360%Inst. Plan - Dividend option : 4.1240%
FY 2003-04Dividend Plan : 4.762%Inst. Plan - Dividend option : 4.710%
FY 2002-03Dividend Plan : 3.60%
After payment of dividend, the NAV will fall to the extent ofpayout and distribution taxes wherever applicable. Pastperformance may or may not be sustained in future. Theface value per unit is Rs.10/-.$ Includes Dividend Distribution Tax.
Performance (%) as on April 30, 2007 :Plan 1 3 6 1 3 Incep.*
Mth Mths Mths Year Years
Growth Plan 0.74 1.86 3.59 7.01 5.67 6.32CLFI ** 1.08 2.22 3.83 6.73 5.39 5.20
* Inception date = Allotment date i.e. 24.06.2002** Benchmark Index: CRISIL LIQUID FUND INDEX
Note: Absolute Returns for period less than 1 year. CAGRfor period 1 year or more, with reinvestment of dividends(if any). Past performance may or may not be sustainedin future.
Portfolio Statistics :
Current Yield : 8.19 %Duration : 0.1754 yearsAvg Maturity : 0.4884 years
JM Short Term Fund (An open-ended income scheme)
Giving our family of investors many reasons to celebrate
PORTFOLIO as on April 30, 2007Issuer Market Value % to Rating
(Rs. In Lacs) NAV
Certificates of Deposits 99.91 7.39Standard Chartered Bank 99.91 7.39 P1+
Fixed Deposits 100.00 7.40State Bank of Patiala 100.00 7.40
Floating Rate Bonds 559.70 41.40HDFC 299.68 22.17# AAA
Raymond 100.00 7.40 PR1+
Whirlpool of India 100.00 7.40 P1+
UTI Bank 60.02 4.44 LAA+
Non Convertible Debenture 472.81 34.97IDBI 472.81 34.97# AA+
Securitised 73.04 5.40IGD Loan Trust 55.89 4.13 AA(so)
Indian Ret ABS Trust Sr44-A1 17.15 1.27 AAA(so)
Total Debt 1,305.46 96.56
CBLO & Others* 46.48 3.44
Total 1,351.94 100.00
(*includes net receivables / payables, if any)# Increase over 15% on account of market movements / change in net assets of
the scheme.
Total Corpus as on April 30, 2007 - Rs. 13.52 Crores
JM SHORT TERM FUNDIN DEBT - SHORT TERM CATEGORY
(23 Schemes) for 18 month periodending April 2007.
Value Research Rating###
RATING PROFILE (%)
(*includes net receivables / payables, if any)
The FPJ Business Journal May 2007 23
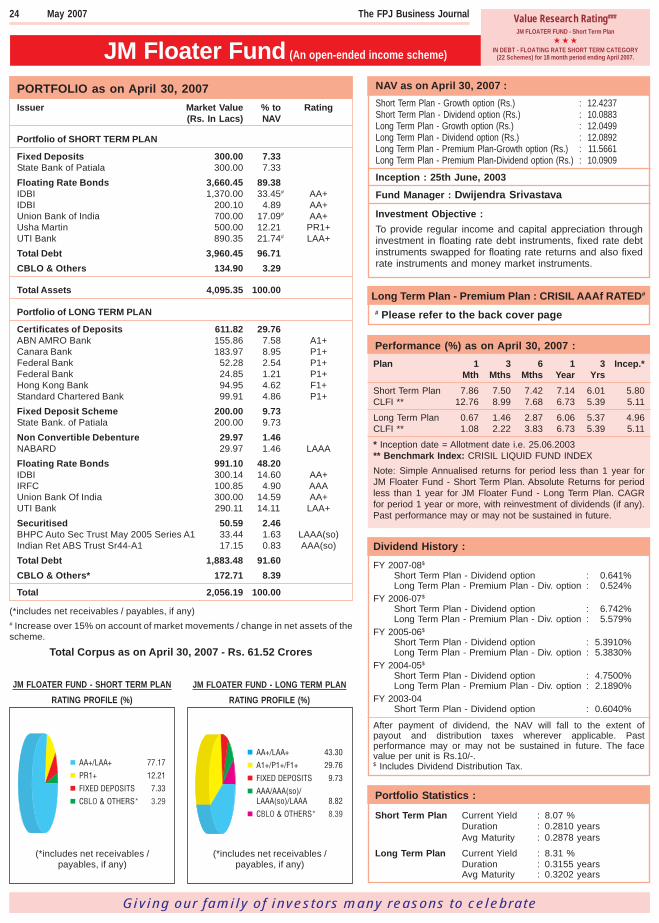
NAV as on April 30, 2007 :Short Term Plan - Growth option (Rs.) : 12.4237Short Term Plan - Dividend option (Rs.) : 10.0883Long Term Plan - Growth option (Rs.) : 12.0499Long Term Plan - Dividend option (Rs.) : 12.0892Long Term Plan - Premium Plan-Growth option (Rs.) : 11.5661Long Term Plan - Premium Plan-Dividend option (Rs.) : 10.0909
Inception : 25th June, 2003
Fund Manager : Dwijendra Srivastava
Investment Objective :To provide regular income and capital appreciation throughinvestment in floating rate debt instruments, fixed rate debtinstruments swapped for floating rate returns and also fixedrate instruments and money market instruments.
JM Floater Fund (An open-ended income scheme)
Giving our family of investors many reasons to celebrate
Long Term Plan - Premium Plan : CRISIL AAAf RATED#
# Please refer to the back cover page
Performance (%) as on April 30, 2007 :Plan 1 3 6 1 3 Incep.*
Mth Mths Mths Year YrsShort Term Plan 7.86 7.50 7.42 7.14 6.01 5.80CLFI ** 12.76 8.99 7.68 6.73 5.39 5.11
Long Term Plan 0.67 1.46 2.87 6.06 5.37 4.96CLFI ** 1.08 2.22 3.83 6.73 5.39 5.11
* Inception date = Allotment date i.e. 25.06.2003** Benchmark Index: CRISIL LIQUID FUND INDEXNote: Simple Annualised returns for period less than 1 year forJM Floater Fund - Short Term Plan. Absolute Returns for periodless than 1 year for JM Floater Fund - Long Term Plan. CAGRfor period 1 year or more, with reinvestment of dividends (if any).Past performance may or may not be sustained in future.
Dividend History :FY 2007-08$
Short Term Plan - Dividend option : 0.641%Long Term Plan - Premium Plan - Div. option : 0.524%
FY 2006-07$
Short Term Plan - Dividend option : 6.742%Long Term Plan - Premium Plan - Div. option : 5.579%
FY 2005-06$
Short Term Plan - Dividend option : 5.3910%Long Term Plan - Premium Plan - Div. option : 5.3830%
FY 2004-05$
Short Term Plan - Dividend option : 4.7500%Long Term Plan - Premium Plan - Div. option : 2.1890%
FY 2003-04Short Term Plan - Dividend option : 0.6040%
After payment of dividend, the NAV will fall to the extent ofpayout and distribution taxes wherever applicable. Pastperformance may or may not be sustained in future. The facevalue per unit is Rs.10/-.$ Includes Dividend Distribution Tax.
Portfolio Statistics :
Short Term Plan Current Yield : 8.07 %Duration : 0.2810 yearsAvg Maturity : 0.2878 years
Long Term Plan Current Yield : 8.31 %Duration : 0.3155 yearsAvg Maturity : 0.3202 years
JM FLOATER FUND - SHORT TERM PLAN
RATING PROFILE (%)
(*includes net receivables /payables, if any)
JM FLOATER FUND - LONG TERM PLAN
RATING PROFILE (%)
(*includes net receivables /payables, if any)
PORTFOLIO as on April 30, 2007Issuer Market Value % to Rating
(Rs. In Lacs) NAV
Portfolio of SHORT TERM PLAN
Fixed Deposits 300.00 7.33State Bank of Patiala 300.00 7.33Floating Rate Bonds 3,660.45 89.38IDBI 1,370.00 33.45# AA+IDBI 200.10 4.89 AA+Union Bank of India 700.00 17.09# AA+Usha Martin 500.00 12.21 PR1+UTI Bank 890.35 21.74# LAA+Total Debt 3,960.45 96.71CBLO & Others 134.90 3.29
Total Assets 4,095.35 100.00
Portfolio of LONG TERM PLAN
Certificates of Deposits 611.82 29.76ABN AMRO Bank 155.86 7.58 A1+Canara Bank 183.97 8.95 P1+Federal Bank 52.28 2.54 P1+Federal Bank 24.85 1.21 P1+Hong Kong Bank 94.95 4.62 F1+Standard Chartered Bank 99.91 4.86 P1+Fixed Deposit Scheme 200.00 9.73State Bank. of Patiala 200.00 9.73Non Convertible Debenture 29.97 1.46NABARD 29.97 1.46 LAAAFloating Rate Bonds 991.10 48.20IDBI 300.14 14.60 AA+IRFC 100.85 4.90 AAAUnion Bank Of India 300.00 14.59 AA+UTI Bank 290.11 14.11 LAA+Securitised 50.59 2.46BHPC Auto Sec Trust May 2005 Series A1 33.44 1.63 LAAA(so)Indian Ret ABS Trust Sr44-A1 17.15 0.83 AAA(so)Total Debt 1,883.48 91.60CBLO & Others* 172.71 8.39
Total 2,056.19 100.00
(*includes net receivables / payables, if any)# Increase over 15% on account of market movements / change in net assets of thescheme.
Total Corpus as on April 30, 2007 - Rs. 61.52 Crores
JM FLOATER FUND - Short Term Plan
IN DEBT - FLOATING RATE SHORT TERM CATEGORY(22 Schemes) for 18 month period ending April 2007.
Value Research Rating###24 May 2007 The FPJ Business Journal
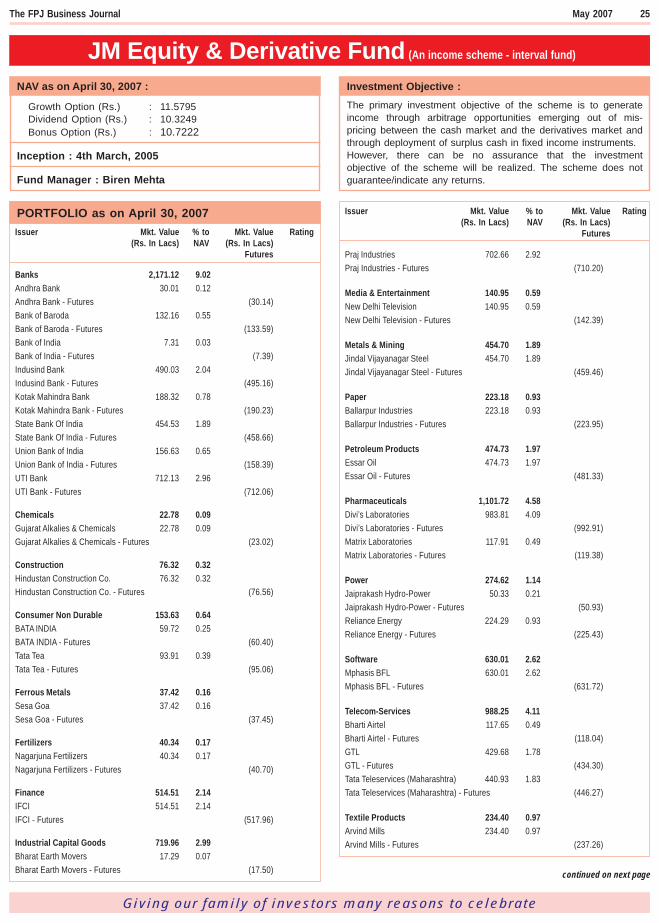
Giving our family of investors many reasons to celebrate
NAV as on April 30, 2007 :
Growth Option (Rs.) : 11.5795Dividend Option (Rs.) : 10.3249Bonus Option (Rs.) : 10.7222
Inception : 4th March, 2005
Fund Manager : Biren Mehta
PORTFOLIO as on April 30, 2007Issuer Mkt. Value % to Mkt. Value Rating
(Rs. In Lacs) NAV (Rs. In Lacs)Futures
Banks 2,171.12 9.02Andhra Bank 30.01 0.12
Andhra Bank - Futures (30.14)
Bank of Baroda 132.16 0.55
Bank of Baroda - Futures (133.59)
Bank of India 7.31 0.03
Bank of India - Futures (7.39)
Indusind Bank 490.03 2.04
Indusind Bank - Futures (495.16)
Kotak Mahindra Bank 188.32 0.78
Kotak Mahindra Bank - Futures (190.23)
State Bank Of India 454.53 1.89
State Bank Of India - Futures (458.66)
Union Bank of India 156.63 0.65
Union Bank of India - Futures (158.39)
UTI Bank 712.13 2.96
UTI Bank - Futures (712.06)
Chemicals 22.78 0.09Gujarat Alkalies & Chemicals 22.78 0.09
Gujarat Alkalies & Chemicals - Futures (23.02)
Construction 76.32 0.32Hindustan Construction Co. 76.32 0.32
Hindustan Construction Co. - Futures (76.56)
Consumer Non Durable 153.63 0.64BATA INDIA 59.72 0.25
BATA INDIA - Futures (60.40)
Tata Tea 93.91 0.39
Tata Tea - Futures (95.06)
Ferrous Metals 37.42 0.16Sesa Goa 37.42 0.16
Sesa Goa - Futures (37.45)
Fertilizers 40.34 0.17Nagarjuna Fertilizers 40.34 0.17
Nagarjuna Fertilizers - Futures (40.70)
Finance 514.51 2.14IFCI 514.51 2.14
IFCI - Futures (517.96)
Industrial Capital Goods 719.96 2.99Bharat Earth Movers 17.29 0.07
Bharat Earth Movers - Futures (17.50)
JM Equity & Derivative Fund (An income scheme - interval fund)
Investment Objective :The primary investment objective of the scheme is to generateincome through arbitrage opportunities emerging out of mis-pricing between the cash market and the derivatives market andthrough deployment of surplus cash in fixed income instruments.However, there can be no assurance that the investmentobjective of the scheme will be realized. The scheme does notguarantee/indicate any returns.
Issuer Mkt. Value % to Mkt. Value Rating(Rs. In Lacs) NAV (Rs. In Lacs)
Futures
continued on next page
The FPJ Business Journal May 2007 25
Praj Industries 702.66 2.92
Praj Industries - Futures (710.20)
Media & Entertainment 140.95 0.59New Delhi Television 140.95 0.59
New Delhi Television - Futures (142.39)
Metals & Mining 454.70 1.89Jindal Vijayanagar Steel 454.70 1.89
Jindal Vijayanagar Steel - Futures (459.46)
Paper 223.18 0.93Ballarpur Industries 223.18 0.93
Ballarpur Industries - Futures (223.95)
Petroleum Products 474.73 1.97Essar Oil 474.73 1.97
Essar Oil - Futures (481.33)
Pharmaceuticals 1,101.72 4.58Divi’s Laboratories 983.81 4.09
Divi’s Laboratories - Futures (992.91)
Matrix Laboratories 117.91 0.49
Matrix Laboratories - Futures (119.38)
Power 274.62 1.14Jaiprakash Hydro-Power 50.33 0.21
Jaiprakash Hydro-Power - Futures (50.93)
Reliance Energy 224.29 0.93
Reliance Energy - Futures (225.43)
Software 630.01 2.62Mphasis BFL 630.01 2.62
Mphasis BFL - Futures (631.72)
Telecom-Services 988.25 4.11Bharti Airtel 117.65 0.49
Bharti Airtel - Futures (118.04)
GTL 429.68 1.78
GTL - Futures (434.30)
Tata Teleservices (Maharashtra) 440.93 1.83
Tata Teleservices (Maharashtra) - Futures (446.27)
Textile Products 234.40 0.97Arvind Mills 234.40 0.97
Arvind Mills - Futures (237.26)
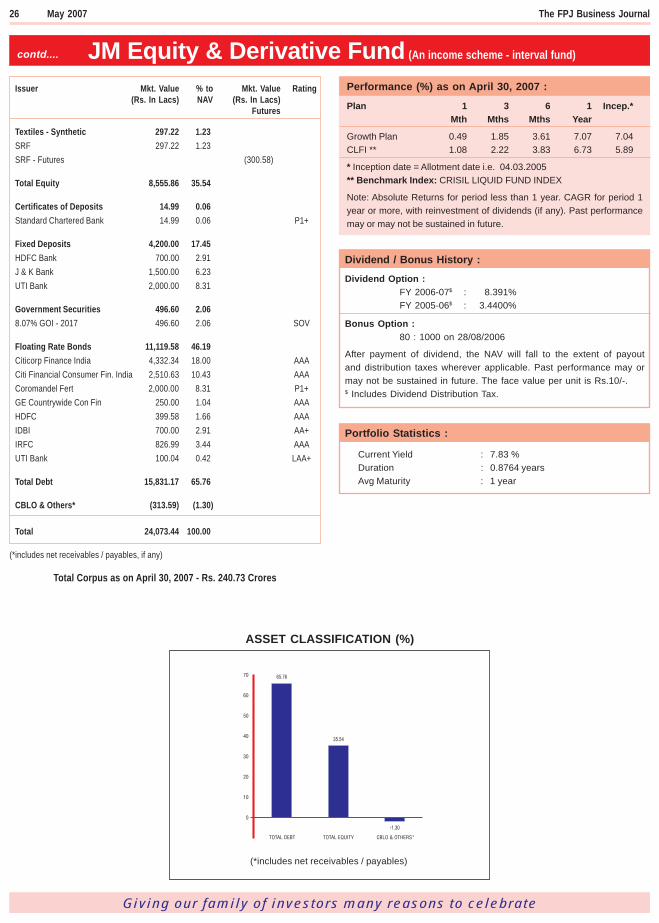
JM Equity & Derivative Fund (An income scheme - interval fund)contd....
Giving our family of investors many reasons to celebrate
Performance (%) as on April 30, 2007 :
Plan 1 3 6 1 Incep.*Mth Mths Mths Year
Growth Plan 0.49 1.85 3.61 7.07 7.04CLFI ** 1.08 2.22 3.83 6.73 5.89
* Inception date = Allotment date i.e. 04.03.2005** Benchmark Index: CRISIL LIQUID FUND INDEX
Note: Absolute Returns for period less than 1 year. CAGR for period 1year or more, with reinvestment of dividends (if any). Past performancemay or may not be sustained in future.
Dividend / Bonus History :
Dividend Option :FY 2006-07$ : 8.391%FY 2005-06$ : 3.4400%
Bonus Option :80 : 1000 on 28/08/2006
After payment of dividend, the NAV will fall to the extent of payoutand distribution taxes wherever applicable. Past performance may ormay not be sustained in future. The face value per unit is Rs.10/-.$ Includes Dividend Distribution Tax.
Portfolio Statistics :
Current Yield : 7.83 %Duration : 0.8764 yearsAvg Maturity : 1 year
26 May 2007 The FPJ Business Journal
Textiles - Synthetic 297.22 1.23
SRF 297.22 1.23
SRF - Futures (300.58)
Total Equity 8,555.86 35.54
Certificates of Deposits 14.99 0.06
Standard Chartered Bank 14.99 0.06 P1+
Fixed Deposits 4,200.00 17.45
HDFC Bank 700.00 2.91
J & K Bank 1,500.00 6.23
UTI Bank 2,000.00 8.31
Government Securities 496.60 2.06
8.07% GOI - 2017 496.60 2.06 SOV
Floating Rate Bonds 11,119.58 46.19
Citicorp Finance India 4,332.34 18.00 AAA
Citi Financial Consumer Fin. India 2,510.63 10.43 AAA
Coromandel Fert 2,000.00 8.31 P1+
GE Countrywide Con Fin 250.00 1.04 AAA
HDFC 399.58 1.66 AAA
IDBI 700.00 2.91 AA+
IRFC 826.99 3.44 AAA
UTI Bank 100.04 0.42 LAA+
Total Debt 15,831.17 65.76
CBLO & Others* (313.59) (1.30)
Total 24,073.44 100.00
(*includes net receivables / payables, if any)
Total Corpus as on April 30, 2007 - Rs. 240.73 Crores
Issuer Mkt. Value % to Mkt. Value Rating(Rs. In Lacs) NAV (Rs. In Lacs)
Futures
ASSET CLASSIFICATION (%)
(*includes net receivables / payables)