Embed Size (px)
Citation preview

MARKET WATCH: INFORMATION AND AVAILABILITYCASCADES AMONG THE MEDIA AND INVESTORS
IN THE U.S. IPO MARKET
TIMOTHY G. POLLOCKPennsylvania State University
VIOLINA P. RINDOVAUniversity of Texas–Austin
PATRICK G. MAGGITTIVillanova University
In this study we advance current research on social influence in markets by examininghow the recency and availability of information about others’ actions within andbetween different communities influence their allocation of attention and their eval-uations. Specifically, we examine how the media and investors allocate attention toand evaluate newly public firms in the days following their initial public offerings(IPOs). Our findings have implications for understanding the fieldwide processesthrough which the value of new firms is established in markets.
Scholars in a variety of disciplines study howmarket actors find, provide, and use informationbecause information is essential to the assessmentof value in market exchanges. Organizational andstrategy researchers have shown that the actions ofcentral, powerful, and high-status actors (Certo,2003; Certo, Daily, Cannella, & Dalton, 2003; Deeds,Mang, & Frandsen, 2004; Haunschild, 1994; Podolny,1993; Rao, Greve, & Davis, 2001) and informationintermediaries such as financial analysts and themedia (Deephouse, 2000; Lamertz & Baum, 1998;Lounsbury & Rao, 2004; Pollock & Rindova, 2003;Rao et al., 2001; Zuckerman, 1999) influence theactions of others and shape market outcomes. Al-though this research has accumulated considerableevidence that market outcomes reflect social influ-ence and that this influence depends on the at-tributes of the actors and the social structures thatconnect them, it has directed less attention to the
influence the accumulation of collective actionshas on market behaviors.
In this article, we argue the collective momentumreflected in the aggregation of a social group’s ac-tions is an important market-structuring mecha-nism that conveys information about the prevailingwisdom or preferences of that community.1 Ourwork builds on two separate but related streams ofresearch that explore these dynamics. The firststream of research uses the concept of informationcascades2 (Amihud, Hauser, & Kirsch, 2003; Baner-jee, 1992; Bikhchandani, Hirschleifer, & Welch,1998; Bonardi & Keim, 2005; Welch, 1992) to cap-ture the dynamic processes of social influence.Scholars in this tradition argue that under condi-tions of uncertainty it is rational for individuals toignore their private information or preferences and
The first and second authors contributed equally tothis article. We gratefully acknowledge the financial sup-port of the Ewing Marion Kauffman Foundation for com-pleting this study. We would like to thank AssociateEditor Duane Ireland and three anonymous reviewers fortheir many helpful comments during the review process.We would also like to thank Martin Kilduff, Huggy Rao,Wes Sine, and seminar participants at Emory University,Michigan State University, Pennsylvania State Univer-sity, and the University of North Carolina–Chapel Hill fortheir comments on earlier versions of this paper. Wethank Shannon Lamote for help with data collection.
1 We use the term “community” to refer to a group ofmarket actors who all participate in the same activity andpursue broadly similar goals, perform broadly similarroles, and follow broadly similar norms in pursuit oftheir market objectives.
2 Two studies appeared contemporaneously in the fi-nance literature introducing the terms “information cas-cade” (Welch, 1992) and “herding” (Banerjee, 1992) todescribe the same phenomenon, and both of these termsare used interchangeably in the finance literature (e.g.,Banerjee, 1992; Bikhchandani et al., 1992; Welch, 1992;Graham, 1999; Bikhchandani & Sharma, 2001). We pri-marily use the term “information cascade” because wediscuss this phenomenon in relation to availabilitycascades.
� Academy of Management Journal2008, Vol. 51, No. 2, 335–358.
335
Copyright of the Academy of Management, all rights reserved. Contents may not be copied, emailed, posted to a listserv, or otherwise transmitted without the copyright holder’s expresswritten permission. Users may print, download or email articles for individual use only.
“follow the crowd” by imitating the recent actionsof peers who are presumed to be better informedwhen making investment decisions (Bikhchandaniet al., 1998). The concept of information cascadesthus recognizes that a firm’s valuation is a functionof the prior levels of investor interest it has at-tracted. In a separate stream of research, politicalscientists have argued that public opinion (Kuran &Sunstein, 1999; Sunstein, 2003, 2004) is similarlybased on follow-the-crowd dynamics. They haveintroduced the concept of “availability cascades” todescribe the “self-reinforcing process of collectivebelief formation by which an expressed perceptiontriggers a chain reaction that gives the perceptionincreasing plausibility through its rising availabil-ity in public discourse” (Kuran & Sunstein, 1999:683). Thus, both concepts address a similar issue—how the observed actions of others influence a focalactor’s behavior in uncertain environments—yetthey suggest different logics of imitation. Whereasinformation cascades are seen as resulting fromactors’ efforts to gain information advantages,availability cascades are seen as an outcome of theneed to reduce cognitive effort and act in ways thatare consistent with the majority’s behavior.
Organizational scholars have long been inter-ested in the same question as cascade theorists andhave studied it from the perspectives of institu-tional isomorphism (e.g., DiMaggio & Powell, 1983;Mizruchi & Fein, 1999), interorganizational conta-gion (e.g., Davis & Greve, 1997; Greve, 1995; Greve& Taylor, 2000), and organizational learning (e.g.,Haunschild & Miner, 1997; Haunschild & Sullivan,2002; Kim & Miner, 2007). Much of this researchhas emphasized how social actors decide whom toimitate and/or learn from, and how organizationalpractices become widely adopted, stable features ofa given context (Leblebici, Salancik, Copay, & King,1991). In contrast, the cascades perspectives em-phasize the dynamic and reversible nature of theprocesses of imitation and social influence andstress that even actors who do not have status,prestige, or extensive network ties can nonethelesstrigger cascades in the adoption of particular opin-ions and practices (Kuran & Sunstein, 1999). Fur-ther, cascade theorists are attuned to the fragility ofthese collective processes and the possibilities forchanges in collective behaviors as new informationbecomes available. Thus, cascades perspectives canenrich organizational research on social influencein markets by explicitly focusing on the temporari-ness of imitation and changes in behavior once newinformation becomes available (Goeree, Palfrey,Rogers, & McKelvey, 2006; Rao et al., 2001). Inconsidering both information and availability cas-cades simultaneously, our goal is to increase un-
derstanding of the factors that make social influ-ence in markets both inertial and fragile.
In particular, we build on the observation that,although the availability and the information cas-cades arguments both concern market actors reduc-ing uncertainty about choices by imitating others,they focus on different underlying mechanismsthat can drive follow-the-crowd behaviors. Infor-mation cascades are viewed as arising from a ra-tional quest for informational advantages and areexpected to be fragile, as they are easily changed byrecent news (Goeree et al., 2006; Welch, 1992). Incontrast, availability cascades arise from the dom-inance of information that is easy to recall and usebecause it has become widely available and there-fore socially verified and reinforced (Kuran & Sun-stein, 1999; Sunstein, 2004). In this view, socialinfluence is more inertial in the information cas-cades perspective because it reflects accumulatedhistory and experience. Thus, these different con-ceptualizations of the logics of imitation imply thatdifferent behaviors are likely to be informative tomarket actors and to stimulate imitation. Prior re-search, however, has not explicitly considered theimplications of these differences and their effectson market actions and outcomes. Instead, scholarshave tended to study these processes in isolation(e.g., Amihud et al., 2003; Hung & Plott, 2001; Sun-stein, 2004; Welch, 2000) or used the two types ofcascades interchangeably without acknowledgingtheir underlying differences (e.g., Bonardi & Keim,2005; Pollock & Rindova, 2003; Rao et al., 2001).Further, these researchers have only studied situa-tions in which all actors are taking the same type ofaction and have not explored the extent to whichboth types of cascades operate simultaneously,leaving open the question of the type of actions thatmay affect one type of cascade or the other.
To address these issues, we identified two com-munities of market actors—media organizationsand investors—that are likely to exhibit both in-formation and availability cascade dynamics asthey attempt to reduce uncertainty regarding theactions to take vis-a-vis firms that have just com-pleted initial public offerings (IPOs). We examinethe extent to which the media and investors fol-low the logics of information and/or availabilitycascades by considering both the effects of theincoming information conveyed by recent actionsand the effects of widely available informationbased on accumulated past actions. We furthertheorize that efforts to reduce uncertainty moti-vate the media and investors to take cues from theother community’s actions, leading to the spreadof social influence across communities. Our ap-proach extends work on social influence in mar-
336 AprilAcademy of Management Journal
kets by examining both the social influencewithin a given community (i.e., intracascade dy-namics) and between or across two communities(i.e., intercascade dynamics). To gain a greaterunderstanding of the specific mechanisms under-lying these influence processes, we examine thedynamics of cascade effects on two differenttypes of actions identified by prior research asdistinct components of decision making underuncertainty: allocation of attention and evalua-tion (Benjamin & Podolny, 1999; Pollock & Gu-lati, 2007; Pollock & Rindova, 2003; Rindova,Petkova, & Kotha, 2007; Zuckerman, 1999).
Our approach enables us to develop a richer the-oretical understanding of social influence in mar-kets, and in particular of the role of different cas-cade processes in shaping market outcomes. Indoing so, we not only respond to calls for more“mechanism-based” theorizing in organization stud-ies (Davis & Marquis, 2005), but also address aquestion of considerable pragmatic importance:What social processes shape the performance ofnewly public firms? Our study extends prior re-search that has shown information intermediariessuch as financial analysts and the media influencethe market performance of firms (Pollock &Rindova, 2003; Rao et al., 2001; Rindova et al.,2007; Zuckerman, 1999) by examining how infor-mation intermediaries themselves are influencedby the actions of those they seek to inform—in ourcase, investors. Developing a more complete pic-ture of the processes that influence the perfor-mance of IPO firms can inform the managementpractices involved in the transition of entrepre-neurial firms from private to public status (Aldrich,1999; Fischer & Pollock, 2004; Martens, 2004; Pol-lock & Rindova, 2003).
THEORY AND HYPOTHESES
Cascades among and between Investorsand the Media
Before discussing the differences in the theoreti-cal logics of information and availability cascades,we first discuss why the actions of investors andthe media in the IPO market context can be fruit-fully analyzed from a cascades perspective. Cas-cades are viewed as pervasive outcomes in situa-tions characterized by high levels of uncertainty,where public choices are made sequentially andactors are rewarded for behaviors consistent withthe majority’s behavior (Neill, 2005). The environ-ment faced by the media and investors in the IPOmarket meets these conditions because: (1) both
communities face a similar problem—assessing thevalue (either the financial value or the newsworthi-ness) of newly public firms under highly uncertainconditions arising from the limited track recordsand lack of prior trading histories for these firms;and (2) actors in both communities stand to gainwhen they take actions that are consistent with, butslightly ahead of, those of the majority in theirrespective communities (Shoemaker & Reese, 1996;Welch, 1992).
Finance scholars have long recognized that theIPO context is conducive to information cascades(e.g., Amihud et al., 2003; Welch, 1992) becauseinvestors must make trading decisions about stocksthat have not been publicly traded and do not havea history of price change they can rely on to deter-mine firm value (Figlewski, 1982). As a result, sub-stantial uncertainty about the appropriate valueand potential of IPO firms exists (Thomas, 2002).For investors, making a choice differing from thatof the majority can result in either missing an op-portunity or sustaining a loss.
Mass media researchers have not analyzed mediacoverage from a cascade perspective, but they haveaccumulated extensive evidence that the search for“news” is fraught with uncertainty, leading jour-nalists to imitate each others’ actions. Sigal ex-plained the dynamic of imitation in the media asfollows: “So long as newsmen follow the same rou-tines, espousing the same professional values, andusing each other as standards of comparison, news-making will tend to be insular and self-reinforc-ing. . . . It provides them [journalists] with a modi-cum of certitude that enables them to act in anotherwise uncertain environment” (1973: 180–181).Like other cognitively constrained actors, jour-nalists reduce uncertainty by sharing informationand sources (Rogers, 2002) and by relying on thesocial proof provided by the actions (i.e., thepublications and broadcasts) of competing newsoutlets (Hirsch, 1977; Shoemaker & Reese, 1996;Sigal, 1973).
Further, journalistic success depends less on re-porting important stories that others are not cover-ing than on getting the “scoop” and being the firstto report on the same story that others are chasing(Shudson, 1986). As Shoemaker and Reese ex-plained: “The desire to be unique is far outweighedby the risk of being different and, perhaps, wrong infull view of the nation” (1996: 125). For this reason,journalists also tend to frame their coverage of sto-ries similarly, as framing a story differently thanmost other news outlets could lead to questionsabout the accuracy and fairness of the outlying
2008 337Pollock, Rindova, and Maggitti
organization’s reporting.3 In sum, the combined ef-fect of the uncertainty surrounding journalisticwork and the rewards for making choices consis-tent with the majority’s choices produces the con-ditions associated with the emergence of cascades(Hung & Plott, 2001). Although past research hasdocumented the existence of cascades in thesecommunities, it has not studied the full range offactors that shape the cascade process.
As noted earlier, virtually all extant research oncascades demonstrates the assumption that marketactors imitate the actions of peers, or actors who arein the same professional community and are takingthe same type of action (e.g., investors’ decisions totrade a stock; media organizations’ decisions tocover particular firms). However, as our previousdiscussion suggests, both the media and investorsstand to gain the most by acting consistently withbut slightly ahead of their peers (i.e., buying beforeothers bid a price up; getting a scoop). To accom-plish these objectives, investors and the medianeed to both reduce uncertainty by confirmingtheir expectations against the actions of others andseeking information that gives them some advan-tage. One potential source of such information isthe actions of actors in another professional com-munity. Another community’s actions may beviewed as informative if its members are believedto have access to superior information and/or ana-lytical capabilities that they can bring to bear on thedecision at hand (Rao et al., 2001). For example,journalists may view investors as having a greaterability than they themselves possess to evaluate theperformance potential of IPO firms (Rao et al.,2001), and investors may view journalists as havingsuperior access to specific information about a firm(Busse & Green, 2002; Hoffman & Ocasio, 2001).Thus, the same needs that motivate actors to look attheir peers’ actions to figure out what to do are alsolikely to motivate them to look to the actions ofactors in other communities as a way to supple-ment or extend their understanding of the collec-tive wisdom “in the market.” By overlooking thepossibility that social influence can be propagatedthrough the collective beliefs exhibited via cascade
behaviors in another community, past research hasconsiderably limited the conceptualization andempirical examination of cascade processes.
In sum, both media organizations and investorsface the need to reduce uncertainty and have in-centives to pursue information advantages whendeciding what actions to take regarding newly pub-lic firms, and prior finance and mass communica-tion research has pointed to imitation as an impor-tant mechanism through which they accomplishthese goals. However, though the fact that socialinfluence is central to the valuation and coverage offirms is acknowledged, the dynamics of social in-fluence are not well understood. In particular, thepossibility of intercascade influence has been over-looked. This intriguing possibility also suggests theneed for a deeper investigation of the mechanismsof social influence that underlie cascades. In thefollowing section, we turn our attention to the log-ics of influence and action suggested by the con-cepts of information and availability cascades.
Information and Availability Cascades
The concept of information cascades. The infor-mation cascade perspective is a rational actormodel that emphasizes the pursuit of informationadvantages by imitating the actions of those be-lieved to be better informed, even when the signalsthey are responding to are unobservable (Bikchan-dani et al., 1998). Even if an actor holds privateinformation that contradicts the action being ob-served, the information cascades perspective sug-gests it is more rational for the actor to disregard itsprivate information and instead imitate others’ ob-served actions (Bikchandani et al., 1998; Welch,1992). Since information cascades arise from a sim-ple, uncertainty-reducing decision heuristic oftengrounded in little or no “real” information, cascadeparticipants’ commitment to the course of action isexpected to be fragile and easily changed whennew information becomes available (Goeree et al.,2006; Welch, 2000). Supporting these arguments,Rao and colleagues (2001) found that once twoanalysts started covering a company, other analystsbecame increasingly likely to initiate coverage.However, later-adopting analysts tended to beoverly optimistic in their predictions of the firm’sexpected earnings and were quicker to cease cov-erage as new information about the company be-came available.
The concept of availability cascades. Accord-ing to the availability cascade perspective (Kuran &Sunstein, 1999), a subset of information can cometo dominate the formation of collective beliefs andactions because individuals tend to rely on readily
3 Even if the initial framing turns out to be in error, aslong as it is consistent with the framing of the majority noone news organization is likely to be singled out or cen-sured. For example, although the CEOs of Tyco, Enron,and World Com all received consistently positive mediacoverage lauding them for their strategic acumen, noparticular media organization suffered any significantdamage after these CEOs were found to have destroyedshareholder value through reckless strategic choices andillegal behaviors.
338 AprilAcademy of Management Journal

available information and to seek social approvalby behaving in a manner consistent with the ma-jority’s behavior (Cialdini, 2004; Rao et al., 2001).As a result, this information tends to become morewidely used and persistently available at the col-lective level, crowding out alternatives and becom-ing the predominant input underlying future judg-ments and decisions (Sherman, Cialdini, &Schwartzman, 1985; Slovic, 2000). The literatureon availability cascades provides little guidance onthe characteristics that lead a particular piece ortype of information to become widely availablethrough social reinforcement and collective use,but social cognition research suggests informationthat is more salient at the individual level may alsobe more likely to become widely available at thecollective level owing to its ease of recall (Fiske &Taylor, 1991).
At the individual level, stimuli become salient ifthey stand out from their context. Characteristicsthat make stimuli salient include their extremity(Taylor & Fiske, 1975) and frequency (Crocker &McGraw, 1984; Hawkins & Hoch, 1992; Kahneman,Slovic, & Tversky, 1982; McArthur & Post, 1977).Extreme and/or frequently occurring stimuli tendto dominate perception and are more likely to berecalled and acted upon (Bonardi & Keim, 2005).When this process is aggregated and these individ-ual tendencies are collectively reinforced, salientstimuli can become widely available and triggeravailability cascades. Throughout the remainder ofthis article, we refer to such stimuli as widely avail-able. Further, because availability cascades arisefrom efforts to minimize cognitive effort and in-crease social conformity, and because they arebased on a subset of information that has becomewidely available through past use, they are ex-pected to persist—even though, like informationcascades, they may be based on little substantiveinformation.
The foregoing arguments suggest that, to the ex-tent the information conveyed via the extreme orcumulative past actions of others influences marketactors, availability cascades are at work; and to theextent the information conveyed by recent actionsinfluences market actors, information cascades areoperating. In other words, the two perspectivesplace differential importance on the roles that“news” and “history” play in influencing marketactors. To address the extent to which these differ-ent mechanisms are at work, we distinguish be-tween recent and what we have termed “widelyavailable actions,” which are actions that, becauseof either their extremity or pervasiveness, are likelyto be salient at the individual level and to becomemagnified and socially reinforced at the collective
level. In the next section, we briefly discuss twotypes of actions—allocation of attention and eval-uation—likely to be influenced by these processes.
Attention from and Evaluation by theMedia and Investors
Organizational researchers increasingly recog-nize that choice under uncertainty involves twodistinct actions: selection of a subset of firms tofocus attention on, and evaluation of the relativemerits of their competing offerings (Hoffman &Ocasio, 2001; Pollock & Rindova, 2003; Rindova,Williamson, Petkova, & Server, 2005; Zuckerman,1999). Attention determines where market actorsfocus their cognitive efforts because both individ-uals and organizations have limited attentional ca-pacities (March & Simon, 1958; Ocasio, 1997). Bothwidely available and recent actions have the poten-tial to affect the allocation of limited attention.Widely available information tends to be more eas-ily invoked and frequently used, thereby minimiz-ing the cognitive effort required for its identifica-tion and processing (Tversky & Kahneman, 1973).As a result, actors are likely to allocate future at-tention to actors and events that are easily recalled.However, the unfamiliar also draws attention (Star-buck & Milliken, 1988), so recent stimuli can alsoattract attention because of their potential novelty.Applied to the context of market actors makingchoices among firms competing for their resources,these arguments suggest that both the cumulativeprior and the recent attention a firm has receivedincrease the likelihood it will to continue to attractattention.
In addition to allocating attention, another cog-nitive task actors perform in uncertain environ-ments is evaluating, which requires drawing con-clusions about often unobservable attributes, suchas underlying firm or product quality (Connelly,Arkes, & Hammond, 2000; Hsee, Lowenstein,Blount, & Bazerman, 1999). Evaluations are basedon interpreting cues about a firm itself as well as onevaluations made by others (Rindova et al., 2005).When the subject is unfamiliar, evaluators are es-pecially uncertain about the accuracy of their as-sessments (Eagly & Chaiken, 1993; Higgins, 1996);thus, they will be likely to look at the assessmentsof others when deciding what to do (Benjamin &Podolny, 1999), and their opinions are likely to beeasily influenced by the recent evaluations offeredby others (Einhorn, 1982; Einhorn & Hogarth, 1981;Schwarz & Bohner, 2001). Therefore, as with atten-tion, both recent and widely available evaluationsby others increase the likelihood that similar eval-uations will follow.
2008 339Pollock, Rindova, and Maggitti
Investor attention and evaluation. Prior re-search in both finance and management has treatedthe demand for an IPO firm’s shares (or turnover inshares traded) as an indicator of investor attention,and the price of a stock as an indicator of investors’evaluation of a firm (e.g., Amihud et al., 2003; Certoet al., 2001; Cornelli & Goldreich, 2001; Ellis,Michaely, & O’Hara, 2000; Nelson, 2003; Pollock &Rindova, 2003). Organizational scholars in partic-ular have emphasized that although stock prices“are viewed in the financial economics literature asproviding ‘hard’ numbers that reflect the true un-derlying economic value of the firm . . . [they]should perhaps be viewed as ‘soft’ numbers thatreflect the subjective perceptions of a heteroge-neous audience, neatly quantified and aggregated”(Westphal & Zajac, 1998: 130–131). This processbecomes particularly apparent in the IPO context.
The initial price of an IPO firm’s stock is set priorto public trading by the underwriters leading theoffering, who presumably have both the expertiseand market information necessary to accuratelyprice the securities (Cornelli & Goldreich, 2001).However, on their first day of trading most IPOstocks close at a price significantly higher thantheir initial offering price. Finance scholars havetermed this phenomenon “underpricing” (Ibbotson& Ritter, 1995) to reflect the belief that underwriterstry to set the initial price of the stock at a levelsomewhat lower than its expected market value inorder to stimulate early investor participation (Ben-vineste & Spindt, 1989; Ibbotson & Ritter, 1995).4
Such discounting is observed systematically acrossIPOs,5 so some level of underpricing is expected;however, some IPOs exhibit dramatic differencesbetween their offering and closing prices (Ritter &Welch, 2002). Such large deviations from the offer-ing price are unusual and surprising, so high levelsof underpricing are likely to be noticed and dis-cussed, and likely to become widely availableinformation.
Similarly, prior research has shown that IPOfirms also experience high levels of turnover on theday they go public. For example, Ellis and col-leagues (2000) found that the first day’s turnover ison average 30 times greater than the daily turnoverduring the 60 days following an IPO. Again, the
more extreme the level of initial turnover, the moresalient the actions, and the more available the in-formation is likely to be as an input for futureinvestor decisions. Daily turnover and daily marketreturns in the days after an IPO are likely to be lessnotable, and therefore less available; however, be-cause they reflect more recent information about afirm, they may attract investor attention because oftheir potential to reveal new information.
Media attention and evaluation. The cumula-tive prior media coverage a firm has received is anindicator of the attention the media has given thefirm. In general, newly public firms tend to receiverelatively little media coverage (Pollock & Rindova,2003; Rindova et al., 2007). Thus, in addition toincreasing a firm’s immediate exposure (Crocker &McGraw, 1984; Hawkins & Hoch, 1992), a highlevel of coverage also increases the likelihood itwill receive subsequent attention, because exten-sive coverage is somewhat unusual and is thusmore widely available to journalists (Pollock &Rindova, 2003; Rindova et al., 2007). Similar argu-ments can be made about the effects of cumulativeprior coverage that offers positive evaluations.6 Me-dia coverage tends to be neutral in tenor (Deep-house, 2000; Pollock & Rindova, 2003), so positiveevaluations in the media are less common thangeneral coverage. Thus, under the same dynamicsdiscussed above, the more positive evaluations thatare published about a firm, the more widely avail-able they are to other journalists, and the less un-certainty these journalists are likely to have aboutoffering positive evaluations themselves. However,as with investors, widely available past actionsmay convey a different type of information thanrecent actions, so the tenor of a recent article pro-vides more up-to-date information about the eval-uation of others.
To summarize, we argue that the concept of in-formation cascades suggests that the informationconveyed by recent collective actions influencesmarket behaviors, whereas the concept of availabil-ity cascades suggests that the information conveyedby past collective actions that have become widelyavailable influences market behaviors. Integratingthe logic of the two suggests that both recent andavailable past actions may be informative and in-fluence market actors’ behaviors. Further, as dis-cussed earlier, because investors and the media can
4 To maintain consistency with the literature in thisarea, throughout the remainder of this article we refer tothe change in stock price on the first day of trading as“underpricing.”
5 Prior research suggests average underpricing for theperiod of our study of about 12 percent (Ritter & Welch,2002).
6 Our hypotheses and analysis focus only on positiveevaluations because in our data there were very fewinstances of negative media evaluations. We discuss theimplications of this focus later in the paper under futureresearch directions.
340 AprilAcademy of Management Journal
be viewed as two communities that are likely totake each other’s actions into account when allo-cating attention and making evaluative judgments,we expect the widely available and recent actionsof the members of each community will also haveintercascade effects and influence the attention andevaluations that an IPO firm receives in the othercommunity. Together these arguments suggest thefollowing set of hypotheses:
Hypothesis 1a. The widely available attentionand the recent attention an IPO firm has re-ceived from a focal community are both posi-tively associated with the future attention thefirm will receive from that community.
Hypothesis 1b. The widely available attentionand the recent attention an IPO firm has re-ceived from another community are both pos-itively associated with the future attention thefirm will receive from a focal community.
Hypothesis 2a. The widely available and therecent positive evaluations an IPO firm hasreceived in a focal community are both pos-itively associated with the future positiveevaluations the firm will receive from thatcommunity.
Hypothesis 2b. The widely available and therecent positive evaluations an IPO firm hasreceived from another community are bothpositively associated with the future positiveevaluations the firm will receive from a focalcommunity.
Combined Effects of Recent andWidely Available Actions
In addition to having direct effects, widely avail-able and recent information may also interact wheninfluencing how actors attend to and use infor-mation under conditions of uncertainty. Becausedecisions about allocating attention requiremechanisms for identifying potentially valuablecandidates among numerous and often ambiguousalternatives, market actors are likely to rely onreadily available, externally validated cues in mak-ing these determinations (Rindova et al., 2005;Zuckerman, 1999). This reliance occurs becausebroad scanning for new alternatives is likely to beboth costly and risky, given the breadth of possiblealternatives and the relatively low likelihood offinding valuable new alternatives (Akerlof, 1970;Stiglitz, 2000).
In keeping with these arguments, research on thesocial construction of markets provides evidencethat market actors rely on preexisting categoriza-
tion schemes to simplify their information process-ing and focus their limited attention on the mostrelevant actors and issues (Lounsbury & Rao, 2004;Porac, Thomas, Wilson, Paton, & Kanfer, 1995; Po-rac, Wade, & Pollock, 1999; Reger & Huff, 1994). Byonly allocating attention to subjects that fall intoparticular categories, market actors use their cogni-tive resources efficiently, just expending effort andother resources to manage interactions with thosedeemed relevant (Porac et al., 1995). Marketing re-searchers have similarly observed that consumersfocus their evaluation efforts on products andbrands that are already included in their “consid-eration sets,” defined as the subset of brands ofwhich the consumers are chronically aware (Mitra,1995). In other words, competitive categorizationsand consideration sets stabilize the allocation ofattention, making some firms readily available inmemory and reducing the search costs associatedwith identifying potentially relevant or valuablealternatives (Roberts & Lattin, 1997). Together theseideas suggest structuring mechanisms that directattention to a given firm and make it likely the firmwill continue to receive attention in the future as amatter of course. We argue that widely availableinformation about a firm serves as one such mech-anism. To the degree widely available informationabout a firm’s prior collective attention exists, in-formation about recent attention is less likely to beinformative to investors and the media when theyare deciding where they should focus their ownattention. As such, widely available attention islikely to reduce the effect of recent attention on thefuture attention a firm receives.
In contrast to their effects on attention, widelyavailable evaluations about a firm may increase theeffects of recent evaluations on the future evalua-tions it receives. This dynamic occurs because eval-uative judgments are only made within the subsetof firms on which attention is focused (Zuckerman,1999). Further, the cognitive task involved in mak-ing evaluations is to increase precision in judgingthe relative merits of alternative offerings (Hsee etal., 1999; Tversky & Kahneman, 1974). Widelyavailable prior evaluations can facilitate this taskby serving as “quasi-prior beliefs.” The more avail-able prior evaluations are, the easier it is to catego-rize recent evaluations as consistent or inconsistentwith them (Kelley, 1972). Even if these availableevaluations are inaccurate or not fully accepted byan individual, to the degree the individual is awareof them, they can become part of the memory con-tent he or she accesses in processing information toform new evaluations (Edwards & Smith, 1996).Since a good deal of evidence suggests individualscannot assess new information independently of
2008 341Pollock, Rindova, and Maggitti
their prior knowledge and beliefs (Lord, Ross, &Lepper, 1979; Nisbett & Ross, 1980), prior availableevaluations are likely to provide a baseline againstwhich incoming information is compared, increas-ing the efficiency with which the confirmation anddisconfirmation processes required to form newevaluations are accomplished (Kunda, 1990). Thus,we expect that greater availability of prior evalua-tions within a community will increase the influ-ence of recent evaluations on future evaluations.
Finally, just as we expect availability of informa-tion within a community to moderate the effects ofrecent actions, we similarly expect the availabilityof information about actions in another communityto also moderate the effects of recent attention andevaluations in the focal community. However, thedynamics of intercascade influence are likely to beslightly different from those of intracascade influ-ence. So far our arguments have emphasized howimitating the widely available actions of membersof one’s focal community provides “confirmationbenefits,” or ensures that these actions are consis-tent with those of the majority of one’s peers. How-ever, we also argued that market actors seek infor-mation advantages that enable them to take actionsslightly before the majority of their peers. By look-ing to the actions of market actors in another com-munity, they can gain such “discovery benefits.”The fact that knowledgeable actors in another com-munity are focusing their attention on, or makingsimilar evaluations of, the same firms provides sig-nals that can reduce perceived uncertainty amongboth the media and investors. What is particularlyinteresting about the widely available actions ofactors in another community is that they hold thepotential to offer both confirmation and discoverybenefits. To the degree that these actions are takenby different types of actors who may have system-atically different access to information or exper-tise, they may reveal new information, therebyyielding discovery benefits. At the same time, be-cause these actions have become widely availablein another community, they reflect a collective con-sensus and provide confirmation benefits. As such,they can reduce uncertainty and search costs suffi-ciently to enable changes in the consideration setsof actors in the focal community. In other words,the available actions of another community mayalter the way market actors use the informationconveyed by the actions of their peers. More spe-cifically, widely available actions in another com-munity are also likely to confirm the informationrevealed by recent actions within the focal commu-nity, thereby enhancing the effects of recent atten-tion and evaluations within a community onsubsequent attention allocation and evaluations.
Taken together, the preceding arguments lead tothe following hypotheses:
Hypothesis 3a. The widely available attentionan IPO firm has received from a focal commu-nity reduces the effect of recent attention fromthe focal community on the future attentionthe firm receives from that community
Hypothesis 3b. The widely available atten-tion an IPO firm has received from anothercommunity increases the effect of recent at-tention from the focal community on the fu-ture attention the firm receives from the focalcommunity
Hypothesis 4a. The widely available positiveevaluations an IPO firm has received from afocal community increase the effect of recentpositive evaluations from the focal communityon the future positive evaluations the firm re-ceives from that community
Hypothesis 4b. The widely available positiveevaluations an IPO firm has received from an-other community increase the effect of recentpositive evaluations from the focal communityon the future positive evaluations the firm re-ceives from the focal community.
DATA AND METHODS
Data
The flow of information about U.S. IPO firms isregulated by the Securities and Exchange Commis-sion (SEC). The SEC restricts public communica-tions by an offering firm from the time the IPO isregistered with the SEC until 25 days after theoffering (known as “the quiet period”) in order tolimit possible hyping of the stock (Bradley, Jordan,& Ritter, 2003; Husick & Arrington, 1998). Further,the underwriters’ analysts are prohibited from is-suing recommendations during the 25 days follow-ing the IPO7 (Bradley et al., 2003). These regula-tions limit the flow of information from the IPOfirm and provide an excellent opportunity forstudying the influence of market actors’ observedactions on market dynamics in a realistic setting.Following prior research in this context, webounded the period of the study to the 60 daysfollowing the day of the IPO (Ellis et al., 2000).
The sample for this study was drawn from allIPOs conducted in 1992, which was a relativelytypical year for offerings, with neither an unusually
7 This time frame was increased to 40 days in 2001 inthe wake of the scandals during the IPO market bubble.
342 AprilAcademy of Management Journal
large or small number and an average level of un-derpricing (11.7%) consistent with historical aver-ages (12%) (Ritter & Welch, 2002). Following priorIPO research (e.g., Ritter, 1991; Welbourne & An-drews, 1996), we excluded closed-end mutualfunds, real estate investment trusts (REITS), unitofferings, spin-offs, demutualizations of savingsbanks and insurance companies, and reverse lever-aged buyouts (LBOs) from the sample. The finalsample contained 245 IPOs. Missing data reducedthe sample to 225 IPOs. Since our unit of analysiswas the firm-day, our total number of observationswas 13,500 firm-days.
Measures
Investor-related dependent measures. Investorevaluations were operationalized as a firm’s dailyreturn, which is the percent change in stock pricefrom the end of the prior day to the end of thecurrent day. Daily returns were calculated from day2 through day 61 because the first day’s return isthe degree of underpricing an IPO experienced,which, because of its distinct theoretical signifi-cance, is included in the models as a separate vari-able. The data used to calculate this measure weredrawn from the Center for Research on SecuritiesPricing (CRSP) database.
Investor attention was operationalized as dailyturnover, which is the percentage of the total sharesa firm has offered that are traded on a given day.Higher turnover indicates greater investor attentionto the company (Pollock & Rindova, 2003). Likedaily returns, daily turnover was calculated overdays 2–61. The data used to calculate this measurewere drawn from the CRSP database and the offer-ing prospectuses.
Investor-related independent measures. Avail-able investor evaluations were operationalized asthe degree of underpricing, which equals the per-cent change in stock price (priceend � priceinitial/priceinitial � 100) on the first day of public trading.We used underpricing to operationalize availableinvestor evaluations because large deviations fromexpectations (i.e., high underpricing) are likely tobe highly salient (Fiske & Taylor, 1991).
Available investor attention was operationalizedas the first day’s turnover in a firm’s stock, which isthe percentage of IPO shares traded on the day theoffering company goes public. The number ofshares traded on the day of an IPO is typicallymuch higher than the number traded on subse-quent days (Ellis et al., 2000; Pollock & Rindova,2003). So, like underpricing, high levels of tradingin a company’s stock on the day it goes public canbe highly salient to investors.
Recent investor evaluations were operationalizedas the daily return lagged by one day (daily re-turnt � 1). This measure captured the most recentevaluative choices investors could observe.
Recent investor attention was operationalized asdaily turnover lagged by one day (daily turnovert � 1).This measure captured the most recent attentionalchoices investors could observe.
Media-related dependent measures. The dataused to create the media variables were collectedfrom all newspaper and print magazine articlesavailable on Lexis-Nexis (in the “major newspa-pers,” “major magazines,” and “trade magazines”databases) for each IPO firm for the 12 monthsbefore an IPO and the 61 trading days after the IPO.Pre-IPO coverage data were collected to help estab-lish the availability of information about the firms.To construct these measures, we collected and con-tent-analyzed 514 pre-IPO and 401 post-IPO mediaarticles.
Media attention was a dummy variable coded 1 ifa firm received any media coverage on a given day.To explore cascade effects, we needed to determinethe probability of a firm’s receiving coverage, givenpast coverage by the media. Therefore, the depen-dent variable needed to be a dichotomous variableallowing for the use of event history–modelingtechniques, such as the discrete time event historymodels used in our analysis. The dichotomousvariable also accurately captured the pattern of me-dia coverage we observed, because we found only14 instances out of more than 13,000 firm-day ob-servations in which a company received two mediamentions on a given day. No company receivedmore than two mentions a day in our sample.
Media evaluation was a dummy variable coded 1if a firm received media coverage containing a pos-itive evaluative statement about the firm on a givenday. We focused on positive evaluations becauseonly 5 percent of the articles in our sample werenegative in tone, making it difficult to obtain sta-tistically valid estimates along this dimension.There were no instances in our sample of a com-pany receiving more than one positive article on agiven day. As in prior research (Brown & Deegan,1998; Deephouse, 2000; Pollock & Rindova, 2003),a trained coder assessed each article as positive,negative, or neutral in its discussion of the com-pany. Neutral statements were those that simplyreported facts, whereas positive statements con-tained evaluative content, as illustrated in the fol-lowing example (the evaluative content is under-lined): “If personal computers had counterpartsamong network operating systems, the AppleMacintosh’s counterpart might be Vines from Ban-yan Systems Inc., and the IBM PC’s might be Net-
2008 343Pollock, Rindova, and Maggitti
ware from Novell. Like the Mac, Vines is the moreinteresting, even innovative, product. It is easier formost people to use and has some nice design fea-tures and a fanatical following among users”(Miller, 1992).
We chose the article as the unit of analysis be-cause each article represents a discrete choice by amedia organization regarding whether and how tocover a firm. However, because past research hassuggested that one article may contain multipleaccounts (Lamertz & Baum, 1998), each reference tothe firm was coded as positive, negative, or neutralin tone. Articles with relatively equal instances ofpositive and negative references were coded asneutral because the negative references tended toqualify or offer counterpoints to positive refer-ences, thereby tempering the evaluative tone (e.g.,the firm has introduced a potentially technologi-cally superior product, but there are concerns aboutthe product’s reliability).
To calculate intercoder reliabilities, one of theauthors coded all articles and press releases(used in constructing the control variables, asdiscussed below) for a random subsample of tencompanies. We calculated intercoder reliabilityusing Cohen’s kappa (Cohen, 1968), which cap-tures the degree of agreement between two cod-ers, adjusted for the likelihood of agreement bychance. The Cohen’s kappa was .86, indicatinghigh interrater agreement.
Media-related independent measures. Avail-able media attention was operationalized as thetotal number of articles about a firm published from12 months prior to the IPO’s registration with theSEC until two days before the observation day. Inour tables, this variable is identified as cumulativemedia attentiont � 2. We aggregated articles fromthe pre- and post-IPO periods to better capture thelevel of accumulated media attention.8 If multiplearticles were published about a company on a givenday, they are captured in the measure.
Available media evaluation was measured thesame way as cumulative media coverage andreflects the total number of positive articlesabout each IPO firm (cumulative positive mediacoveraget � 2).
Recent media attention was operationalized as
the daily post-IPO media coverage measure laggedby one day (daily media attentiont � 1).
Recent media evaluation was operationalized asthe daily positive post-IPO media coverage mea-sure lagged by one day (daily positive mediacoveraget � 1).
Control variables. The growing body of researchon IPOs suggests a variety of different factors thatmay influence the outcomes under consideration inthis study. In addition to the various media andstock performance measures mentioned above, weincluded an extensive set of variables to control forthese effects, as well as for factors that could offeralternative explanations of our results.
Although we were focusing on the effects of in-formation conveyed by the choices of market ac-tors, we also controlled for the effects of informa-tion provided directly by IPO firms via pressreleases.9 We collected 444 post-IPO press releasesfrom the Business Wires database of Lexis-Nexisand content-analyzed them to construct daily andcumulative total and positive press release mea-sures analogous to the media availability and re-cency measures.
The characteristics of an IPO firm itself can alsoinfluence the demand for and performance of itsoffering, as well as the likelihood that the firm willreceive coverage. Prior research has used the fac-tors identified by Gutterman (1991) as the charac-teristics employed by the investment community toassess IPO firm quality (Pollock & Rindova, 2003).Following this research, we included the followingvariables as controls for firm quality: firm sales in1991,10 firm net income in 1991 (before interest andtaxes), average top management team tenure, per-centage of an offering represented by insider sellingof stock (percentage of insider selling), and thenumber of risk factors included in the offeringprospectus.
Lead institutional investor size was measured asthe total assets under management at the end of1991 by the institutional investor that owned thelargest proportion of an IPO firm’s stock at the endof the quarter in which it went public. This variablewas transformed into its natural logarithm to pre-
8 In analyses not reported here, we separated the pre-and post-IPO time periods and included them as separatemeasures. Both measures were significant, and the re-sults were substantively the same as those reported here.We retained the aggregate measure because it is moreconsistent with the theoretical construct of availableattention.
9 Even during the post-IPO quiet period, “Firms maymake statements of fact regarding business develop-ments and may respond to inquiries from analysts andshareholders regarding factual matters” (Bradley et al.,2003: 1).
10 Sales were transformed into their natural logarithmto reduce the effects of extreme values. Since some of theIPO firms had no sales in 1991, we added 1 to the sales ofeach company prior to transforming the variable.
344 AprilAcademy of Management Journal
vent extreme values from driving the analysis.Larger institutional investors are more likely to belong-term investors, and their participation in anoffering can send positive signals to the media andthe market about their perceptions of the invest-ment quality of the firm. Institutional investor own-ership data were drawn from Disclosure’s CompactD SEC database collection. These data were used toidentify the lead institutional investor for each IPO.Institutional investor size information was drawnfrom Nelson’s Directory of Investment Managers,Institutional Investor’s annual listing of the 300largest investment managers and the CDA/Wiesen-berger Investment Companies Yearbook.
Underwriter reputation was used to control forthe signaling effects and resources that a high-sta-tus underwriter brings to bear when it takes a com-pany public (Carter & Manaster, 1990). Followingthe method employed by Pollock and his col-leagues (Fischer & Pollock, 2004; Pollock, 2004;Pollock & Rindova, 2003), the underwriter reputa-tion measure was based on “tombstone” position-ings in 1991 and ranged from 0 to 1.11 Positions intombstone announcements have been widely usedin academic research as an indicator of investmentbank status and reputation (Carter & Manaster,1990; Podolny, 1993). Each underwriter’s statusclass was reverse-coded and divided by the totalnumber of classes reflected in a tombstone. Forexample, if a tombstone had three classes of under-writers, the first class was coded 1, the second classwas coded .67, and the third class was coded .33.An underwriter’s reputation score equaled the av-erage score calculated over all the syndicates inwhich the underwriter participated. Data on under-writing syndicates used to calculate underwriterreputation were drawn from Disclosure’s CompactD database.
Venture capital backing was included as a con-trol because the presence of a venture capitalist atthe time of an IPO can influence perceptions of IPOfirm legitimacy and market outcomes (Gulati & Hig-gins, 2003; Megginson & Weiss, 1991). A dummyvariable was coded 1 if the company had receivedventure financing prior to the IPO and 0 otherwise.
Offer value was measured as the total number ofshares offered during an IPO multiplied by the
offering price. The value, or size, of an offering cansend signals to the market about its relative qualityand stability (Ibbotson & Ritter, 1995). We trans-formed this variable into its natural logarithm toreduce the effect of extreme values.
Dummy variables for year quarters (quarter 1,etc.) were included to control for within-year vari-ances in the IPO market, since particular indus-tries, and the IPO market in general, can go in andout of favor in less than a year (Ritter, 1984).
Industry dummies were included because sys-tematic differences could exist between companiesin different industries for both the independent anddependent variables. Six industry dummy vari-ables were included in the analysis: biotechnology,software, electrical manufacturing, finance, retail,and services. These categories parsimoniously cap-ture the variety of industries represented in the IPOmarket in 1992.
Firm age at IPO equaled the number of yearssince incorporation. This variable was log-trans-formed to reduce the effects of extreme values onthe analysis. As some companies went public thesame year they were founded, we added a 1 to allobservations before transforming the variable.
A selectivity instrument was also calculated be-cause unobserved capabilities and other firm-spe-cific factors might increase both media coverageand attention and positive evaluations from inves-tors, creating a potential endogeneity problem inevaluating the relationship between media cover-age and investor behaviors (Pollock & Rindova,2003). To the degree that all firms are not equallylikely to receive media coverage, the results of anal-yses predicting investor behaviors using these me-dia measures may be biased. One approach oftenused to deal with this problem is to employ Heck-man’s method for correcting selection bias (seeHeckman [1979] and Shaver [1998] for detailed dis-cussions of this approach). We used a probit regres-sion in the first stage of the analysis to predict thelikelihood a firm will receive media coverage fol-lowing its IPO. This regression was used to create aselectivity instrument (Rao et al., 2001) that wasincluded in subsequent regression models. The in-strument controlled for biases associated with thelikelihood that a firm receives media coverage. Thefollowing variables were included in the regres-sion: a dummy variable indicating whether a firmhad received media coverage prior to the IPO; thefirm’s total assets in the year prior to the IPO;dummy variables indicating whether the stock waspriced higher than the initial range listed in theprospectus (indicating significant investor interestin the offering) or below the initial offering range(indicating a lack of interest); the total number of
11 Tombstones are the announcements of a new offer-ing of a stock or bond typically found in publicationssuch as the Wall Street Journal and the Investment Deal-er’s Digest. A bank’s position on the tombstone reflectsboth the number of shares it will be allocated for sale andits status within the investment banking community(Carter & Manaster, 1990; Podolny, 1993).
2008 345Pollock, Rindova, and Maggitti
press releases the company issued in the post-IPOperiod; the tenor of these press releases, calculatedusing the Janis-Fadner coefficient of imbalance(Deephouse, 2000; Janis & Fadner, 1965; Pollock &Rindova, 2003); and two dummy variables indicat-ing whether the company was located in the north-eastern United States or in California. These tworegions of the country served as home to almosthalf the companies in our sample, as well as to alarge number of media outlets, thus increasing thelikelihood that firms from these regions receivedmedia coverage.
Method of Analysis
The data used to test our hypotheses about mediaattention and evaluation were analyzed using dis-crete time event history techniques to capture thedynamics of cascade behaviors. We estimated logitmodels of dichotomous outcomes for pooled timeseries data in which the same units are observedat multiple intervals (Allison, 1984; Yamaguchi,1991). Covariates are allowed, but not required, tovary between time periods. Since the data con-tained multiple observations of the same IPO firmthat were not independent across spells, we em-ployed the cluster command in Stata 9.0, whichprovided a more conservative test of the hypothe-ses by calculating robust estimators of variance.12
We used ordinary least squares (OLS) regressions topredict daily returns and turnover, once again em-ploying the cluster command. Finally, to reducenonessential collinearity in our models (Cohen, Co-hen, West, & Aiken, 2003), we mean-centered thevariables used in our interactions. These trans-formed measures were included in all regressions;however, for ease of interpretation, the untrans-formed measures were used in calculating the de-scriptive statistics.
RESULTS
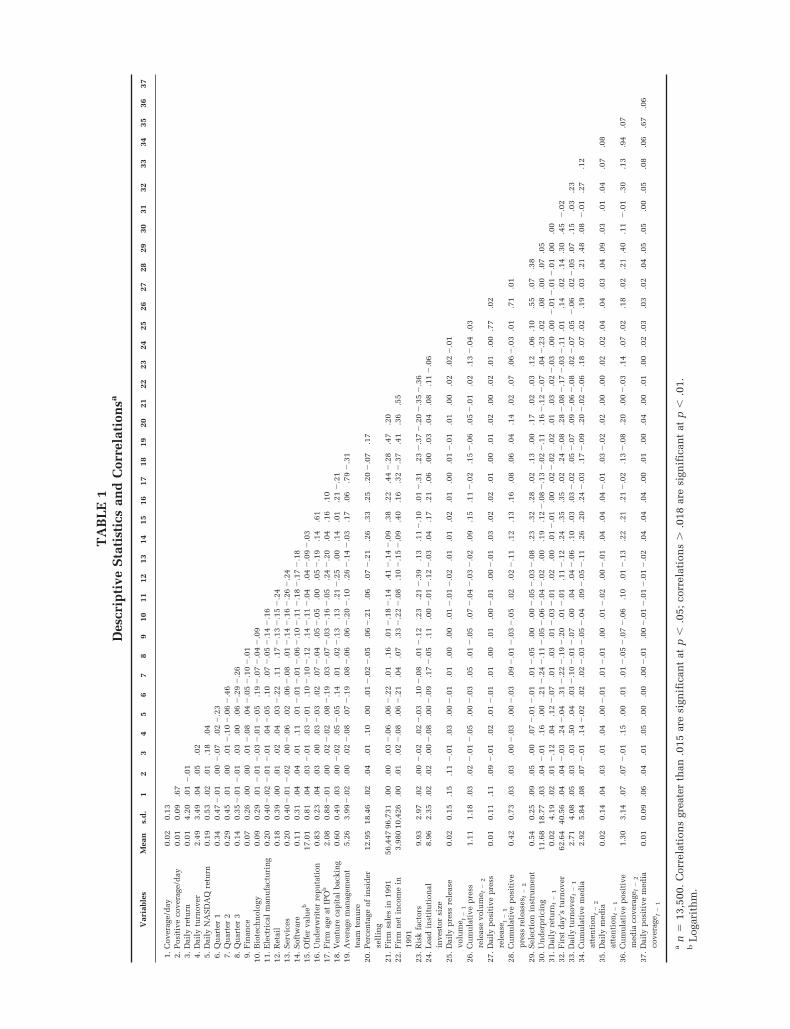
Table 1 presents the descriptive statistics andcorrelations for all the variables. The high correla-tion between the cumulative media attention andevaluation measures suggested collinearity was apotential problem in our analysis. We conductedvariance inflation factor (VIF) tests to assess thepotential problem; the overall VIF never exceeded2.50 and the individual VIFs for the two measures
in question were both approximately 10 (all otherswere approximately 3 or less). Using rule-of-thumbcutoffs of 10 for the overall model and 30 for indi-vidual variables (see the 2003 Stata 8.0 Manual),we judged that collinearity did not appear to be aproblem in our models. However, as a further pre-caution, in analyses not reported here we createdan instrumental variable for cumulative positiveevaluations by regressing this measure on cumula-tive media attention and included the residual fromthis regression in our models. The results were thesame as those reported here.
Tables 2 and 3 present the results of the discretetime event history regressions predicting daily me-dia attention and positive evaluations. Tables 4 and5 present the results of the OLS regressions predict-ing daily turnover and daily returns. In each table,model 1 includes the control variables, model 2adds the main effect variables, model 3 adds theintracascade interaction between availability andrecency, model 4 includes the interaction betweenintercascade availability and intracascade recency,and model 5 presents the saturated model includ-ing both interactions.
Hypotheses 1a and 2a argue that the availableand recent attention an IPO firm receives within afocal community affects the future attention andpositive evaluations the firm receives within thatcommunity. Model 2 in each table tests these hy-potheses. Our results strongly support the notionthat widely available actions shape the allocationof future attention, as both cumulative media atten-tion and turnover on the first day of an IPO havepositive and significant effects in the media andinvestor models, respectively. The results in sup-port of recent attention were mixed. Although theprior day’s turnover, which measures recent atten-tion, positively affects the next day’s turnover, re-cent media attention was not significantly relatedto receiving subsequent attention. The analysestesting Hypothesis 2a yielded a different pattern ofresults. Supporting Hypothesis 2a, cumulativeprior positive media evaluations have a positive,significant effect on subsequent positive evalua-tions and recent positive evaluations do not. Fur-ther, when the interactions are included, the effectsof recent positive coverage become negative andsignificant. The results in Table 5 show no supportfor Hypothesis 2a within the investor community.Underpricing does not have a significant effect ondaily returns, and the prior day’s daily return has asignificant negative effect, opposite the relation-ship predicted in Hypothesis 2a.
In sum, both Hypothesis 1a and Hypothesis 2areceive partial support. Widely available actionshave positive, significant effects on both attention
12 We also reran these analyses using the Cox propor-tional hazards model. The results were substantially thesame as those presented here, and there were no differ-ences in the hypothesized relationships.
346 AprilAcademy of Management Journal
TA
BL
E1
Des
crip
tive
Sta
tist
ics
and
Cor
rela
tion
sa
Var
iabl
esM
ean
s.d
.1
23
45
67
89
1011
1213
1415
1617
1819
2021
2223
2425
2627
2829
3031
3233
3435
3637
1.C
over
age/
day
0.02
0.13
2.P
osit
ive
cove
rage
/day
0.01
0.09
.67
3.D
aily
retu
rn0.
014.
20.0
1�
.01
4.D
aily
turn
over
2.49
3.49
.04
.05
.02
5.D
aily
NA
SD
AQ
retu
rn0.
190.
53.0
2.0
1.1
8.0
46.
Qu
arte
r1
0.34
0.47
�.0
1.0
0�
.07
.02
�.2
37.
Qu
arte
r2
0.29
0.45
.01
.00
.01
�.1
0�
.06
�.4
68.
Qu
arte
r3
0.14
0.35
�.0
1�
.01
.03
.00
.06
�.2
9�
.26
9.F
inan
ce0.
070.
26.0
0.0
0.0
1�
.08
.04
�.0
5�
.10
�.0
110
.B
iote
chn
olog
y0.
090.
29.0
1�
.01
�.0
3�
.01
�.0
5.1
9�
.07
�.0
4�
.09
11.
Ele
ctri
cal
man
ufa
ctu
rin
g0.
200.
40�
.02
�.0
1�
.01
.04
�.0
5.1
0.0
7�
.05
�.1
4�
.16
12.
Ret
ail
0.18
0.39
.00
.01
.02
.04
.03
�.2
2.1
1.1
7�
.13
�.1
5�
.24
13.
Ser
vice
s0.
200.
40�
.01
�.0
2.0
0�
.06
.02
.06
�.0
8.0
1�
.14
�.1
6�
.26
�.2
414
.S
oftw
are
0.11
0.31
.04
.04
.01
.11
.01
�.0
1�
.01
�.0
6�
.10
�.1
1�
.18
�.1
7�
.18
15.
Off
erva
lueb
17.0
10.
81.0
4.0
3�
.01
.03
�.0
1.1
0�
.10
�.1
2.1
4�
.11
�.0
4.0
4�
.09
�.0
316
.U
nd
erw
rite
rre
pu
tati
on0.
830.
23.0
4.0
3.0
0.0
3�
.03
.02
.07
�.0
4.0
5�
.05
.00
.05
�.1
9.1
4.6
117
.F
irm
age
atIP
Ob
2.08
0.88
�.0
1.0
0.0
2�
.02
.08
�.1
9.0
3�
.07
�.0
3�
.16
�.0
5.2
4�
.20
.04
.16
.10
18.
Ven
ture
cap
ital
back
ing
0.60
0.49
.03
.00
�.0
2.0
5�
.05
.14
.01
.02
�.1
3.1
3.2
1�
.25
.00
.14
.01
.21
�.2
119
.A
vera
gem
anag
emen
tte
amte
nu
re5.
263.
99�
.02
.00
.02
�.0
8.0
7�
.19
.08
�.0
6.0
6�
.20
�.1
0.2
6�
.14
�.0
3.1
7.0
6.7
9�
.31
20.
Per
cen
tage
ofin
sid
erse
llin
g12
.95
18.4
6.0
2.0
4.0
1.1
0.0
0.0
1�
.02
�.0
5.0
6�
.21
.06
.07
�.2
1.2
6.3
3.2
5.2
0�
.07
.17
21.
Fir
msa
les
in19
9156
,447
96,7
31.0
0.0
0.0
3�
.06
.06
�.2
2.0
1.1
6.0
1�
.18
�.1
4.4
1�
.14
�.0
9.3
8.2
2.4
4�
.28
.47
.20
22.
Fir
mn
etin
com
ein
1991
3,98
010
,426
.00
.01
.02
�.0
8.0
6�
.21
.04
.07
.33
�.2
2�
.08
.10
�.1
5�
.09
.40
.16
.32
�.3
7.4
1.3
6.5
5
23.
Ris
kfa
ctor
s9.
932.
97.0
2.0
0�
.02
.02
�.0
3.1
0�
.08
.01
�.1
2.2
3.2
1�
.39
.13
.11
�.1
0.0
1�
.31
.23
�.3
7�
.20
�.3
5�
.36
24.
Lea
din
stit
uti
onal
inve
stor
size
8.96
2.35
.02
.02
.00
�.0
8.0
0�
.09
.17
�.0
5.1
1.0
0�
.01
�.1
2�
.03
.04
.17
.21
.06
.00
.03
.04
.08
.11
�.0
6
25.
Dai
lyp
ress
rele
ase
volu
me t
�1
0.02
0.15
.15
.11
�.0
1.0
3.0
0�
.01
.01
.00
.00
.01
�.0
1�
.02
.01
.01
.02
.01
.00
.01
�.0
1.0
1.0
0.0
2.0
2�
.01
26.
Cu
mu
lati
vep
ress
rele
ase
volu
me t
�2
1.11
1.18
.03
.02
�.0
1�
.05
.00
�.0
3.0
5.0
1�
.05
.07
�.0
4�
.03
�.0
2.0
9.1
5.1
1�
.02
.15
�.0
6.0
5�
.01
.02
.13
�.0
4.0
3
27.
Dai
lyp
osit
ive
pre
ssre
leas
e t�
1
0.01
0.11
.11
.09
�.0
1.0
2.0
1�
.01
.01
.00
.01
.00
�.0
1.0
0�
.01
.03
.02
.02
.01
.00
.01
.02
.00
.02
.01
.00
.77
.02
28.
Cu
mu
lati
vep
osit
ive
pre
ssre
leas
est
�2
0.42
0.73
.03
.03
.00
�.0
3.0
0�
.03
.09
�.0
1�
.03
�.0
5.0
2.0
2�
.11
.12
.13
.16
.08
.06
.04
.14
.02
.07
.06
�.0
3.0
1.7
1.0
1
29.
Sel
ecti
onin
stru
men
t0.
540.
25.0
9.0
5.0
0.0
7�
.01
�.0
1.0
1�
.05
.00
.00
�.0
5�
.03
�.0
8.2
3.3
2.2
8.0
2.1
3.0
0.1
7.0
2.0
3.1
2.0
6.1
0.5
5.0
7.3
830
.U
nd
erp
rici
ng
11.6
818
.77
.03
.04
�.0
1.1
6.0
0.2
1�
.24
�.1
1�
.05
�.0
6�
.04
�.0
2.0
0.1
9.1
2�
.08
�.1
3�
.02
�.1
1.1
6�
.12
�.0
7.0
4�
.23
.02
.08
.00
.07
.05
31.D
aily
retu
rnt
�1
0.02
4.19
.02
.01
�.1
2.0
4.1
2�
.07
.01
.03
.01
�.0
3�
.01
.02
.00
.01
�.0
1.0
0.0
2�
.02
.02
.01
.03
.02
�.0
3.0
0.0
0�
.01
�.0
1�
.01
.00
.00
32.
Fir
std
ay’s
turn
over
62.6
440
.56
.04
.04
�.0
3.2
4�
.04
.31
�.2
2�
.19
�.2
0.0
1�
.01
.11
�.1
2.2
4.3
5.3
5.0
2.2
4�
.08
.28
�.0
8�
.17
�.0
3�
.11
.01
.14
.02
.14
.30
.45
�.0
233
.Dai
lytu
rnov
ert
�1
2.71
4.08
.05
.03
.03
.50
.04
.03
�.1
0�
.01
�.0
7.0
0.0
4.0
4�
.06
.10
.03
.03
�.0
2.0
5�
.07
.09
�.0
6�
.08
.02
�.0
7.0
5�
.06
.02
�.0
5.0
7.1
5.0
3.2
334
.C
um
ula
tive
med
iaat
ten
tion
t�
2
2.92
5.84
.08
.07
�.0
1.1
4�
.02
.02
.02
�.0
3�
.05
�.0
4.0
9�
.05
�.1
1.2
6.2
0.2
4�
.03
.17
�.0
9.2
0�
.02
�.0
6.1
8.0
7.0
2.1
9.0
3.2
1.4
8.0
8�
.01
.27
.12
35.
Dai
lym
edia
atte
nti
ont
�1
0.02
0.14
.04
.03
.01
.04
.00
�.0
1.0
1�
.01
.00
.01
�.0
2.0
0�
.01
.04
.04
.04
�.0
1.0
3�
.02
.02
.00
.00
.02
.02
.04
.04
.03
.04
.09
.03
.01
.04
.07
.08
36.
Cu
mu
lati
vep
osit
ive
med
iaco
vera
get
�2
1.30
3.14
.07
.07
�.0
1.1
5.0
0.0
1.0
1�
.05
�.0
7�
.06
.10
.01
�.1
3.2
2.2
1.2
1�
.02
.13
�.0
8.2
0.0
0�
.03
.14
.07
.02
.18
.02
.21
.40
.11
�.0
1.3
0.1
3.9
4.0
7
37.
Dai
lyp
osit
ive
med
iaco
vera
get
�1
0.01
0.09
.06
.04
.01
.05
.00
.00
.00
�.0
1.0
0�
.01
�.0
1�
.01
�.0
2.0
4.0
4.0
4.0
0.0
1.0
0.0
4.0
0.0
1.0
0.0
2.0
3.0
3.0
2.0
4.0
5.0
5.0
0.0
5.0
8.0
6.6
7.0
6
an
�13
,500
.C
orre
lati
ons
grea
ter
than
.015
are
sign
ific
ant
atp
�.0
5;co
rrel
atio
ns
�.0
18ar
esi
gnif
ican
tat
p�
.01.
bL
ogar
ith
m.
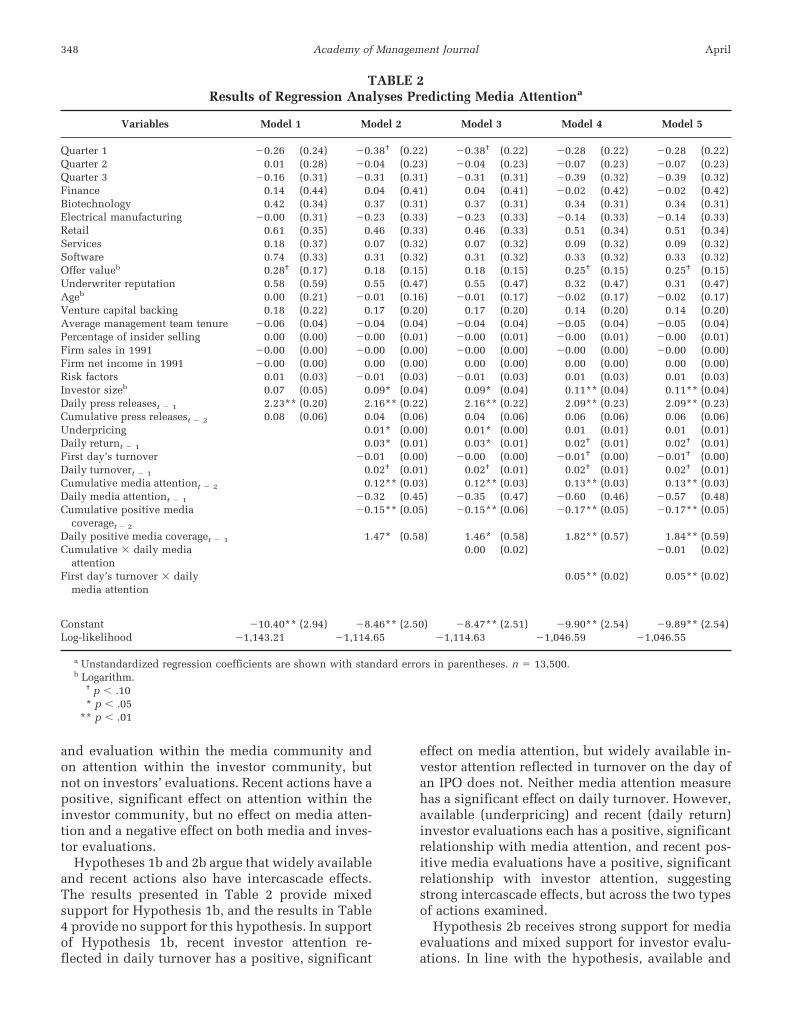
and evaluation within the media community andon attention within the investor community, butnot on investors’ evaluations. Recent actions have apositive, significant effect on attention within theinvestor community, but no effect on media atten-tion and a negative effect on both media and inves-tor evaluations.
Hypotheses 1b and 2b argue that widely availableand recent actions also have intercascade effects.The results presented in Table 2 provide mixedsupport for Hypothesis 1b, and the results in Table4 provide no support for this hypothesis. In supportof Hypothesis 1b, recent investor attention re-flected in daily turnover has a positive, significant
effect on media attention, but widely available in-vestor attention reflected in turnover on the day ofan IPO does not. Neither media attention measurehas a significant effect on daily turnover. However,available (underpricing) and recent (daily return)investor evaluations each has a positive, significantrelationship with media attention, and recent pos-itive media evaluations have a positive, significantrelationship with investor attention, suggestingstrong intercascade effects, but across the two typesof actions examined.
Hypothesis 2b receives strong support for mediaevaluations and mixed support for investor evalu-ations. In line with the hypothesis, available and
TABLE 2Results of Regression Analyses Predicting Media Attentiona
Variables Model 1 Model 2 Model 3 Model 4 Model 5
Quarter 1 �0.26 (0.24) �0.38† (0.22) �0.38† (0.22) �0.28 (0.22) �0.28 (0.22)Quarter 2 0.01 (0.28) �0.04 (0.23) �0.04 (0.23) �0.07 (0.23) �0.07 (0.23)Quarter 3 �0.16 (0.31) �0.31 (0.31) �0.31 (0.31) �0.39 (0.32) �0.39 (0.32)Finance 0.14 (0.44) 0.04 (0.41) 0.04 (0.41) �0.02 (0.42) �0.02 (0.42)Biotechnology 0.42 (0.34) 0.37 (0.31) 0.37 (0.31) 0.34 (0.31) 0.34 (0.31)Electrical manufacturing �0.00 (0.31) �0.23 (0.33) �0.23 (0.33) �0.14 (0.33) �0.14 (0.33)Retail 0.61 (0.35) 0.46 (0.33) 0.46 (0.33) 0.51 (0.34) 0.51 (0.34)Services 0.18 (0.37) 0.07 (0.32) 0.07 (0.32) 0.09 (0.32) 0.09 (0.32)Software 0.74 (0.33) 0.31 (0.32) 0.31 (0.32) 0.33 (0.32) 0.33 (0.32)Offer valueb 0.28† (0.17) 0.18 (0.15) 0.18 (0.15) 0.25† (0.15) 0.25† (0.15)Underwriter reputation 0.58 (0.59) 0.55 (0.47) 0.55 (0.47) 0.32 (0.47) 0.31 (0.47)Ageb 0.00 (0.21) �0.01 (0.16) �0.01 (0.17) �0.02 (0.17) �0.02 (0.17)Venture capital backing 0.18 (0.22) 0.17 (0.20) 0.17 (0.20) 0.14 (0.20) 0.14 (0.20)Average management team tenure �0.06 (0.04) �0.04 (0.04) �0.04 (0.04) �0.05 (0.04) �0.05 (0.04)Percentage of insider selling 0.00 (0.00) �0.00 (0.01) �0.00 (0.01) �0.00 (0.01) �0.00 (0.01)Firm sales in 1991 �0.00 (0.00) �0.00 (0.00) �0.00 (0.00) �0.00 (0.00) �0.00 (0.00)Firm net income in 1991 �0.00 (0.00) 0.00 (0.00) 0.00 (0.00) 0.00 (0.00) 0.00 (0.00)Risk factors 0.01 (0.03) �0.01 (0.03) �0.01 (0.03) 0.01 (0.03) 0.01 (0.03)Investor sizeb 0.07 (0.05) 0.09* (0.04) 0.09* (0.04) 0.11** (0.04) 0.11** (0.04)Daily press releasest � 1 2.23** (0.20) 2.16** (0.22) 2.16** (0.22) 2.09** (0.23) 2.09** (0.23)Cumulative press releasest � 2 0.08 (0.06) 0.04 (0.06) 0.04 (0.06) 0.06 (0.06) 0.06 (0.06)Underpricing 0.01* (0.00) 0.01* (0.00) 0.01 (0.01) 0.01 (0.01)Daily returnt � 1 0.03* (0.01) 0.03* (0.01) 0.02† (0.01) 0.02† (0.01)First day’s turnover �0.01 (0.00) �0.00 (0.00) �0.01† (0.00) �0.01† (0.00)Daily turnovert � 1 0.02† (0.01) 0.02† (0.01) 0.02† (0.01) 0.02† (0.01)Cumulative media attentiont � 2 0.12** (0.03) 0.12** (0.03) 0.13** (0.03) 0.13** (0.03)Daily media attentiont � 1 �0.32 (0.45) �0.35 (0.47) �0.60 (0.46) �0.57 (0.48)Cumulative positive media
coveraget � 2
�0.15** (0.05) �0.15** (0.06) �0.17** (0.05) �0.17** (0.05)
Daily positive media coveraget � 1 1.47* (0.58) 1.46* (0.58) 1.82** (0.57) 1.84** (0.59)Cumulative � daily media
attention0.00 (0.02) �0.01 (0.02)
First day’s turnover � dailymedia attention
0.05** (0.02) 0.05** (0.02)
Constant �10.40** (2.94) �8.46** (2.50) �8.47** (2.51) �9.90** (2.54) �9.89** (2.54)Log-likelihood �1,143.21 �1,114.65 �1,114.63 �1,046.59 �1,046.55
a Unstandardized regression coefficients are shown with standard errors in parentheses. n � 13,500.b Logarithm.
† p � .10* p � .05
** p � .01
348 AprilAcademy of Management Journal
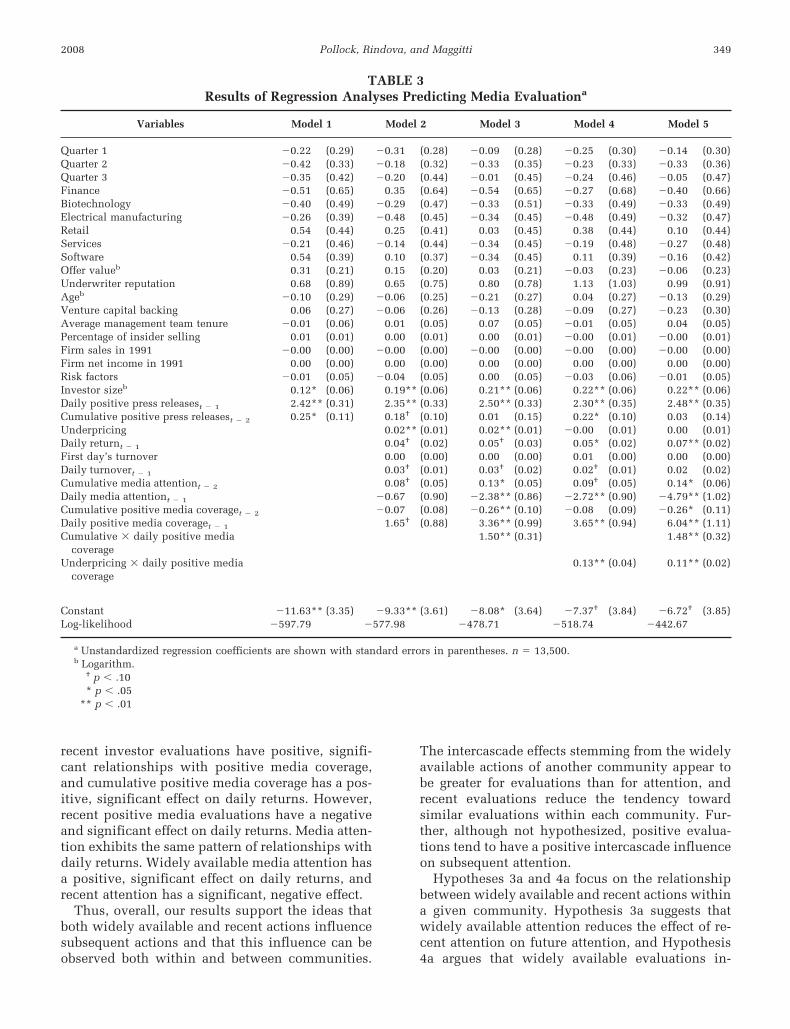
recent investor evaluations have positive, signifi-cant relationships with positive media coverage,and cumulative positive media coverage has a pos-itive, significant effect on daily returns. However,recent positive media evaluations have a negativeand significant effect on daily returns. Media atten-tion exhibits the same pattern of relationships withdaily returns. Widely available media attention hasa positive, significant effect on daily returns, andrecent attention has a significant, negative effect.
Thus, overall, our results support the ideas thatboth widely available and recent actions influencesubsequent actions and that this influence can beobserved both within and between communities.
The intercascade effects stemming from the widelyavailable actions of another community appear tobe greater for evaluations than for attention, andrecent evaluations reduce the tendency towardsimilar evaluations within each community. Fur-ther, although not hypothesized, positive evalua-tions tend to have a positive intercascade influenceon subsequent attention.
Hypotheses 3a and 4a focus on the relationshipbetween widely available and recent actions withina given community. Hypothesis 3a suggests thatwidely available attention reduces the effect of re-cent attention on future attention, and Hypothesis4a argues that widely available evaluations in-
TABLE 3Results of Regression Analyses Predicting Media Evaluationa
Variables Model 1 Model 2 Model 3 Model 4 Model 5
Quarter 1 �0.22 (0.29) �0.31 (0.28) �0.09 (0.28) �0.25 (0.30) �0.14 (0.30)Quarter 2 �0.42 (0.33) �0.18 (0.32) �0.33 (0.35) �0.23 (0.33) �0.33 (0.36)Quarter 3 �0.35 (0.42) �0.20 (0.44) �0.01 (0.45) �0.24 (0.46) �0.05 (0.47)Finance �0.51 (0.65) 0.35 (0.64) �0.54 (0.65) �0.27 (0.68) �0.40 (0.66)Biotechnology �0.40 (0.49) �0.29 (0.47) �0.33 (0.51) �0.33 (0.49) �0.33 (0.49)Electrical manufacturing �0.26 (0.39) �0.48 (0.45) �0.34 (0.45) �0.48 (0.49) �0.32 (0.47)Retail 0.54 (0.44) 0.25 (0.41) 0.03 (0.45) 0.38 (0.44) 0.10 (0.44)Services �0.21 (0.46) �0.14 (0.44) �0.34 (0.45) �0.19 (0.48) �0.27 (0.48)Software 0.54 (0.39) 0.10 (0.37) �0.34 (0.45) 0.11 (0.39) �0.16 (0.42)Offer valueb 0.31 (0.21) 0.15 (0.20) 0.03 (0.21) �0.03 (0.23) �0.06 (0.23)Underwriter reputation 0.68 (0.89) 0.65 (0.75) 0.80 (0.78) 1.13 (1.03) 0.99 (0.91)Ageb �0.10 (0.29) �0.06 (0.25) �0.21 (0.27) 0.04 (0.27) �0.13 (0.29)Venture capital backing 0.06 (0.27) �0.06 (0.26) �0.13 (0.28) �0.09 (0.27) �0.23 (0.30)Average management team tenure �0.01 (0.06) 0.01 (0.05) 0.07 (0.05) �0.01 (0.05) 0.04 (0.05)Percentage of insider selling 0.01 (0.01) 0.00 (0.01) 0.00 (0.01) �0.00 (0.01) �0.00 (0.01)Firm sales in 1991 �0.00 (0.00) �0.00 (0.00) �0.00 (0.00) �0.00 (0.00) �0.00 (0.00)Firm net income in 1991 0.00 (0.00) 0.00 (0.00) 0.00 (0.00) 0.00 (0.00) 0.00 (0.00)Risk factors �0.01 (0.05) �0.04 (0.05) 0.00 (0.05) �0.03 (0.06) �0.01 (0.05)Investor sizeb 0.12* (0.06) 0.19** (0.06) 0.21** (0.06) 0.22** (0.06) 0.22** (0.06)Daily positive press releasest � 1 2.42** (0.31) 2.35** (0.33) 2.50** (0.33) 2.30** (0.35) 2.48** (0.35)Cumulative positive press releasest � 2 0.25* (0.11) 0.18† (0.10) 0.01 (0.15) 0.22* (0.10) 0.03 (0.14)Underpricing 0.02** (0.01) 0.02** (0.01) �0.00 (0.01) 0.00 (0.01)Daily returnt � 1 0.04† (0.02) 0.05† (0.03) 0.05* (0.02) 0.07** (0.02)First day’s turnover 0.00 (0.00) 0.00 (0.00) 0.01 (0.00) 0.00 (0.00)Daily turnovert � 1 0.03† (0.01) 0.03† (0.02) 0.02† (0.01) 0.02 (0.02)Cumulative media attentiont � 2 0.08† (0.05) 0.13* (0.05) 0.09† (0.05) 0.14* (0.06)Daily media attentiont � 1 �0.67 (0.90) �2.38** (0.86) �2.72** (0.90) �4.79** (1.02)Cumulative positive media coveraget � 2 �0.07 (0.08) �0.26** (0.10) �0.08 (0.09) �0.26* (0.11)Daily positive media coveraget � 1 1.65† (0.88) 3.36** (0.99) 3.65** (0.94) 6.04** (1.11)Cumulative � daily positive media
coverage1.50** (0.31) 1.48** (0.32)
Underpricing � daily positive mediacoverage
0.13** (0.04) 0.11** (0.02)
Constant �11.63** (3.35) �9.33** (3.61) �8.08* (3.64) �7.37† (3.84) �6.72† (3.85)Log-likelihood �597.79 �577.98 �478.71 �518.74 �442.67
a Unstandardized regression coefficients are shown with standard errors in parentheses. n � 13,500.b Logarithm.
† p � .10* p � .05
** p � .01
2008 349Pollock, Rindova, and Maggitti

crease the influence of recent evaluations on futureevaluations. Our results provide no support forHypothesis 3a and strong support for Hypothesis4a. Although neither intracascade interaction issignificant in predicting media and investor atten-tion, both intracascade interactions are positiveand significant in Tables 3 and 5 predicting futuremedia and investor evaluations.
Finally, Hypotheses 3b and 4b suggest that inter-cascade attention has a positive moderating effecton recent intracascade attention and evaluations.Hypothesis 3b is partially supported. The interac-tion between recent investor attention and recentmedia attention is positive and significant; how-
ever, the interaction between cumulative media at-tention and recent investor attention is not signifi-cant. In contrast, both the interaction betweenwidely available investor evaluations and recentmedia evaluations, and that between widely avail-able media evaluations and recent investor evalua-tions, are positive and significant, providing sup-port for Hypothesis 4b.
DISCUSSION
Research in a number of disciplines has adopteda cascades perspective as scholars begin to developa richer understanding of the dynamics of social
TABLE 4Results of Regression Analyses Predicting Investor Attentiona
Variables Model 1 Model 2 Model 3 Model 4 Model 5
Daily NASDAQ return 0.16* (0.07) 0.05 (0.05) 0.05 (0.05) 0.05 (0.05) 0.05 (0.05)Quarter 1 �0.73* (0.29) �0.53** (0.16) �0.53** (0.16) �0.53** (0.16) �0.53** (0.16)Quarter 2 �1.16** (0.29) �0.50** (0.17) �0.51** (0.17) �0.49** (0.17) �0.50** (0.17)Quarter 3 �0.55† (0.32) �0.12 (0.17) �0.13 (0.17) �0.12 (0.17) �0.13 (0.17)Finance �0.73* (0.33) �0.18 (0.18) �0.19 (0.18) �0.18 (0.18) �0.19 (0.18)Biotechnology 0.40 (0.35) 0.27 (0.18) 0.27 (0.18) 0.27 (0.18) 0.27 (0.18)Electrical manufacturing 0.67* (0.31) 0.38* (0.18) 0.39* (0.17) 0.38* (0.18) 0.38* (0.18)Retail 1.04** (0.32) 0.37* (0.16) 0.37* (0.16) 0.37* (0.16) 0.36* (0.16)Services �0.03 (0.27) 0.02 (0.15) 0.02 (0.15) 0.02 (0.15) 0.02 (0.15)Software 1.03** (0.38) 0.35 (0.22) 0.35 (0.22) 0.34 (0.22) 0.35 (0.22)Offer valueb 0.25 (0.17) �0.01 (0.09) �0.00† (0.09) �0.01 (0.09) �0.00 (0.09)Underwriter reputation �0.09 (0.49) �0.20 (0.27) �0.20 (0.27) �0.20 (0.27) �0.21 (0.27)Ageb 0.19 (0.18) 0.10 (0.10) 0.10 (0.10) 0.10 (0.10) 0.10 (0.10)Venture capital backing 0.10 (0.21) �0.03 (0.11) �0.04 (0.11) �0.03 (0.11) �0.03 (0.11)Average management team tenure �0.10** (0.04) �0.05* (0.02) �0.05* (0.02) �0.05* (0.02) �0.05* (0.02)Percentage of insider selling 0.01* (0.01) 0.00 (0.00) 0.00 (0.00) 0.00 (0.00) 0.00 (0.00)Firm sales in 1991 �0.00* (0.00) �0.00 (0.00) �0.00 (0.00) �0.00 (0.00) �0.00 (0.00)Firm net income in 1991 �0.00 (0.00) �0.00 (0.00) �0.00 (0.00) �0.00 (0.00) �0.00 (0.00)Risk factors �0.03 (0.04) �0.01 (0.02) �0.01 (0.02) �0.01 (0.02) �0.01 (0.02)Investor sizeb �0.09* (0.04) �0.03† (0.02) �0.03† (0.02) �0.03† (0.02) �0.03† (0.02)Selectivity instrument 1.41** (0.38) 0.24 (0.23) 0.24 (0.23) 0.22 (0.23) 0.22 (0.23)Cumulative press releasest � 2 �0.36** (0.07) �0.17** (0.04) �0.17** (0.04) �0.16** (0.04) �0.17** (0.04)Daily press releasest � 1 0.04 (0.20) �0.03 (0.18) �0.03 (0.19) �0.03 (0.18) �0.03 (0.18)Underpricing 0.01* (0.00) 0.01† (0.00) 0.01* (0.00) 0.01† (0.00)Daily returnt � 1 0.02† (0.01) 0.02† (0.01) 0.02† (0.01) 0.02† (0.01)First day’s turnover 0.01** (0.00) 0.01** (0.00) 0.01** (0.00) 0.01** (0.00)Daily turnovert � 1 0.38** (0.02) 0.37** (0.02) 0.38** (0.02) 0.37** (0.02)Cumulative media attentiont � 2 0.02 (0.03) 0.02 (0.03) 0.02 (0.03) 0.02 (0.03)Daily media attentiont � 1 0.02 (0.05) 0.02 (0.05) 0.02 (0.05) 0.02 (0.05)Cumulative positive media coveraget � 2 �0.17 (0.24) �0.17 (0.24) �0.18 (0.24) �0.18 (0.23)Daily positive media coveraget � 1 1.13† (0.59) 1.12† (0.58) 1.13† (0.59) 1.12† (0.59)First day’s turnover � daily turnover 0.00 (0.00) 0.00 (0.00)Cumulative media attention � daily turnover �0.00 (0.00) �0.00 (0.00)
Constant �0.71 (2.72) 3.43* (1.38) 3.41* (1.39) 3.45* (1.38) 3.42* (1.39)R2 0.08 0.28 0.28 0.28 0.28
a Measured as daily turnover. Unstandardized regression coefficients are shown, with standard errors in parentheses. n � 13,500.b Logarithm.
† p � .10* p � .05
** p � .01
350 AprilAcademy of Management Journal
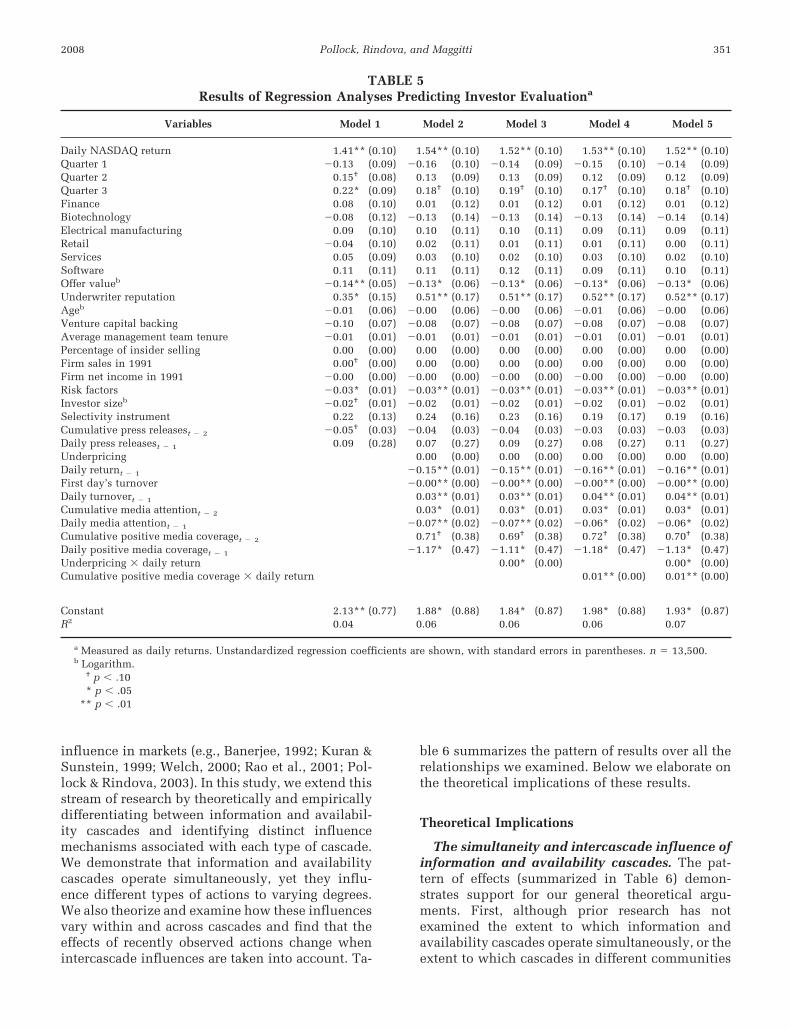
influence in markets (e.g., Banerjee, 1992; Kuran &Sunstein, 1999; Welch, 2000; Rao et al., 2001; Pol-lock & Rindova, 2003). In this study, we extend thisstream of research by theoretically and empiricallydifferentiating between information and availabil-ity cascades and identifying distinct influencemechanisms associated with each type of cascade.We demonstrate that information and availabilitycascades operate simultaneously, yet they influ-ence different types of actions to varying degrees.We also theorize and examine how these influencesvary within and across cascades and find that theeffects of recently observed actions change whenintercascade influences are taken into account. Ta-
ble 6 summarizes the pattern of results over all therelationships we examined. Below we elaborate onthe theoretical implications of these results.
Theoretical Implications
The simultaneity and intercascade influence ofinformation and availability cascades. The pat-tern of effects (summarized in Table 6) demon-strates support for our general theoretical argu-ments. First, although prior research has notexamined the extent to which information andavailability cascades operate simultaneously, or theextent to which cascades in different communities
TABLE 5Results of Regression Analyses Predicting Investor Evaluationa
Variables Model 1 Model 2 Model 3 Model 4 Model 5
Daily NASDAQ return 1.41** (0.10) 1.54** (0.10) 1.52** (0.10) 1.53** (0.10) 1.52** (0.10)Quarter 1 �0.13 (0.09) �0.16 (0.10) �0.14 (0.09) �0.15 (0.10) �0.14 (0.09)Quarter 2 0.15† (0.08) 0.13 (0.09) 0.13 (0.09) 0.12 (0.09) 0.12 (0.09)Quarter 3 0.22* (0.09) 0.18† (0.10) 0.19† (0.10) 0.17† (0.10) 0.18† (0.10)Finance 0.08 (0.10) 0.01 (0.12) 0.01 (0.12) 0.01 (0.12) 0.01 (0.12)Biotechnology �0.08 (0.12) �0.13 (0.14) �0.13 (0.14) �0.13 (0.14) �0.14 (0.14)Electrical manufacturing 0.09 (0.10) 0.10 (0.11) 0.10 (0.11) 0.09 (0.11) 0.09 (0.11)Retail �0.04 (0.10) 0.02 (0.11) 0.01 (0.11) 0.01 (0.11) 0.00 (0.11)Services 0.05 (0.09) 0.03 (0.10) 0.02 (0.10) 0.03 (0.10) 0.02 (0.10)Software 0.11 (0.11) 0.11 (0.11) 0.12 (0.11) 0.09 (0.11) 0.10 (0.11)Offer valueb �0.14** (0.05) �0.13* (0.06) �0.13* (0.06) �0.13* (0.06) �0.13* (0.06)Underwriter reputation 0.35* (0.15) 0.51** (0.17) 0.51** (0.17) 0.52** (0.17) 0.52** (0.17)Ageb �0.01 (0.06) �0.00 (0.06) �0.00 (0.06) �0.01 (0.06) �0.00 (0.06)Venture capital backing �0.10 (0.07) �0.08 (0.07) �0.08 (0.07) �0.08 (0.07) �0.08 (0.07)Average management team tenure �0.01 (0.01) �0.01 (0.01) �0.01 (0.01) �0.01 (0.01) �0.01 (0.01)Percentage of insider selling 0.00 (0.00) 0.00 (0.00) 0.00 (0.00) 0.00 (0.00) 0.00 (0.00)Firm sales in 1991 0.00† (0.00) 0.00 (0.00) 0.00 (0.00) 0.00 (0.00) 0.00 (0.00)Firm net income in 1991 �0.00 (0.00) �0.00 (0.00) �0.00 (0.00) �0.00 (0.00) �0.00 (0.00)Risk factors �0.03* (0.01) �0.03** (0.01) �0.03** (0.01) �0.03** (0.01) �0.03** (0.01)Investor sizeb �0.02† (0.01) �0.02 (0.01) �0.02 (0.01) �0.02 (0.01) �0.02 (0.01)Selectivity instrument 0.22 (0.13) 0.24 (0.16) 0.23 (0.16) 0.19 (0.17) 0.19 (0.16)Cumulative press releasest � 2 �0.05† (0.03) �0.04 (0.03) �0.04 (0.03) �0.03 (0.03) �0.03 (0.03)Daily press releasest � 1 0.09 (0.28) 0.07 (0.27) 0.09 (0.27) 0.08 (0.27) 0.11 (0.27)Underpricing 0.00 (0.00) 0.00 (0.00) 0.00 (0.00) 0.00 (0.00)Daily returnt � 1 �0.15** (0.01) �0.15** (0.01) �0.16** (0.01) �0.16** (0.01)First day’s turnover �0.00** (0.00) �0.00** (0.00) �0.00** (0.00) �0.00** (0.00)Daily turnovert � 1 0.03** (0.01) 0.03** (0.01) 0.04** (0.01) 0.04** (0.01)Cumulative media attentiont � 2 0.03* (0.01) 0.03* (0.01) 0.03* (0.01) 0.03* (0.01)Daily media attentiont � 1 �0.07** (0.02) �0.07** (0.02) �0.06* (0.02) �0.06* (0.02)Cumulative positive media coveraget � 2 0.71† (0.38) 0.69† (0.38) 0.72† (0.38) 0.70† (0.38)Daily positive media coveraget � 1 �1.17* (0.47) �1.11* (0.47) �1.18* (0.47) �1.13* (0.47)Underpricing � daily return 0.00* (0.00) 0.00* (0.00)Cumulative positive media coverage � daily return 0.01** (0.00) 0.01** (0.00)
Constant 2.13** (0.77) 1.88* (0.88) 1.84* (0.87) 1.98* (0.88) 1.93* (0.87)R2 0.04 0.06 0.06 0.06 0.07
a Measured as daily returns. Unstandardized regression coefficients are shown, with standard errors in parentheses. n � 13,500.b Logarithm.
† p � .10* p � .05
** p � .01
2008 351Pollock, Rindova, and Maggitti
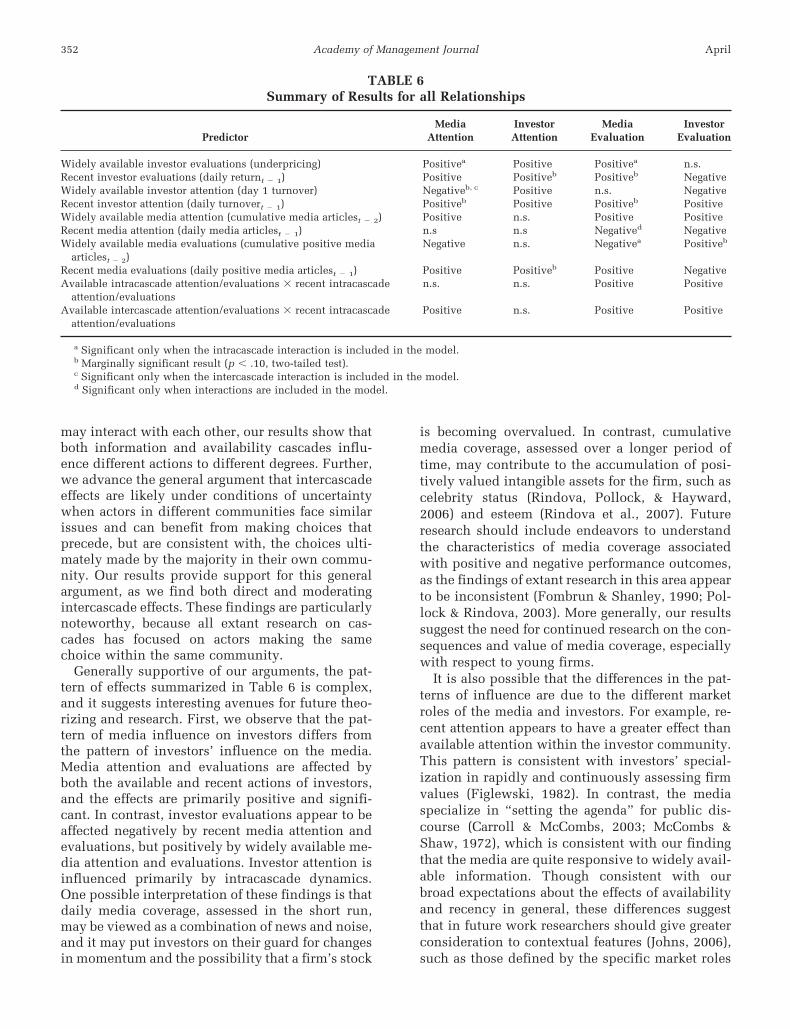
may interact with each other, our results show thatboth information and availability cascades influ-ence different actions to different degrees. Further,we advance the general argument that intercascadeeffects are likely under conditions of uncertaintywhen actors in different communities face similarissues and can benefit from making choices thatprecede, but are consistent with, the choices ulti-mately made by the majority in their own commu-nity. Our results provide support for this generalargument, as we find both direct and moderatingintercascade effects. These findings are particularlynoteworthy, because all extant research on cas-cades has focused on actors making the samechoice within the same community.
Generally supportive of our arguments, the pat-tern of effects summarized in Table 6 is complex,and it suggests interesting avenues for future theo-rizing and research. First, we observe that the pat-tern of media influence on investors differs fromthe pattern of investors’ influence on the media.Media attention and evaluations are affected byboth the available and recent actions of investors,and the effects are primarily positive and signifi-cant. In contrast, investor evaluations appear to beaffected negatively by recent media attention andevaluations, but positively by widely available me-dia attention and evaluations. Investor attention isinfluenced primarily by intracascade dynamics.One possible interpretation of these findings is thatdaily media coverage, assessed in the short run,may be viewed as a combination of news and noise,and it may put investors on their guard for changesin momentum and the possibility that a firm’s stock
is becoming overvalued. In contrast, cumulativemedia coverage, assessed over a longer period oftime, may contribute to the accumulation of posi-tively valued intangible assets for the firm, such ascelebrity status (Rindova, Pollock, & Hayward,2006) and esteem (Rindova et al., 2007). Futureresearch should include endeavors to understandthe characteristics of media coverage associatedwith positive and negative performance outcomes,as the findings of extant research in this area appearto be inconsistent (Fombrun & Shanley, 1990; Pol-lock & Rindova, 2003). More generally, our resultssuggest the need for continued research on the con-sequences and value of media coverage, especiallywith respect to young firms.
It is also possible that the differences in the pat-terns of influence are due to the different marketroles of the media and investors. For example, re-cent attention appears to have a greater effect thanavailable attention within the investor community.This pattern is consistent with investors’ special-ization in rapidly and continuously assessing firmvalues (Figlewski, 1982). In contrast, the mediaspecialize in “setting the agenda” for public dis-course (Carroll & McCombs, 2003; McCombs &Shaw, 1972), which is consistent with our findingthat the media are quite responsive to widely avail-able information. Though consistent with ourbroad expectations about the effects of availabilityand recency in general, these differences suggestthat in future work researchers should give greaterconsideration to contextual features (Johns, 2006),such as those defined by the specific market roles
TABLE 6Summary of Results for all Relationships
PredictorMedia
AttentionInvestorAttention
MediaEvaluation
InvestorEvaluation
Widely available investor evaluations (underpricing) Positivea Positive Positivea n.s.Recent investor evaluations (daily returnt � 1) Positive Positiveb Positiveb NegativeWidely available investor attention (day 1 turnover) Negativeb, c Positive n.s. NegativeRecent investor attention (daily turnovert � 1) Positiveb Positive Positiveb PositiveWidely available media attention (cumulative media articlest � 2) Positive n.s. Positive PositiveRecent media attention (daily media articlest � 1) n.s n.s Negatived NegativeWidely available media evaluations (cumulative positive media
articlest � 2)Negative n.s. Negativea Positiveb
Recent media evaluations (daily positive media articlest � 1) Positive Positiveb Positive NegativeAvailable intracascade attention/evaluations � recent intracascade
attention/evaluationsn.s. n.s. Positive Positive
Available intercascade attention/evaluations � recent intracascadeattention/evaluations
Positive n.s. Positive Positive
a Significant only when the intracascade interaction is included in the model.b Marginally significant result (p � .10, two-tailed test).c Significant only when the intercascade interaction is included in the model.d Significant only when interactions are included in the model.
352 AprilAcademy of Management Journal
of actors, when assessing the dynamics of socialinfluence in markets.
Interaction between recency and availability.Another important theoretical contribution of ourstudy is that we examine how widely available andrecent information interact to influence attentionand evaluation. We generally find that availabili-ty—both within the same community and in an-other community—increases the effect of recent in-formation, and this effect is more consistent forevaluation than attention. These results suggestthat, for firms about which information becomeswidely available, recent information has a greaterimpact because the firm is monitored more ac-tively. These results also support our argument thatwide availability of information may be an impor-tant market-structuring mechanism leading a sub-set of firms to become increasingly prominent andto have superior economic performance (Rindovaet al., 2005). Future research in strategy and organ-ization theory could benefit from developing a bet-ter understanding of the role that such temporarystructures based on collective beliefs may play ingenerating positive feedback effects that lead to theaccumulation intangible assets and advantageousmarket positions for firms.
Implications for organization theory. Finally,our findings offer new insights into the ways mar-ket participants use information conveyed by oth-ers’ actions to manage uncertainty. As such, it ad-vances organizational research on how mimeticbehaviors affect market activities (e.g., Derfus, Mag-gitti, Grimm, & Smith, 2008; Kraatz, 1998; Kraatz &Moore, 2002; Rao et al., 2001). Much of this re-search has emphasized how social influence is con-veyed through institutionalized practices, socialnetworks, and learning, yet we demonstrate a morediffused process of social influence based on thenature of the actions taken by communities of mar-ket participants, their collective momentum anddirection, and the market roles of different actors.Our study also offers additional insights into thecognitive bases of persistence and change in socialsystems that may not be apparent when a re-searcher is studying these systems from a purelystructural point of view or considering interactionswithin a single community. By integrating informa-tion and availability cascades arguments, and bycontrasting intracascade and intercascade influ-ences, our study opens up an important directionfor future research on social influence in markets.
Implications for Managers
In addition to its theoretical implications, ourstudy also has significant implications for entrepre-
neurs contemplating or going through the IPO pro-cess. Understanding the dynamics and influence ofinformation in markets is critical to successfullygarnering all the resources possible from an IPO.Although prior research has demonstrated that in-formation intermediaries such as financial analystsand the media influence firms’ legitimacy (Pollock& Rindova, 2003; Zuckerman, 1999) and expecta-tions of their future performance (Rao et al., 2001),our study shows how intermediaries and investorsdynamically influence each others’ allocation ofattention to and evaluation of newly public firms.Our analysis and results also provide some poten-tially useful insights for entrepreneurs who wouldlike to shape these processes to their advantage. Forexample, the results of our study suggest that sim-ply courting short-term media attention about sin-gle events may not yield positive benefits for a firm,but the ability to sustain media attention can leadto positive effects on its market performance. Thus,entrepreneurs should consider developing a “me-dia strategy” that enables them to attract ongoingmedia attention, thereby influencing their firms’early market performance. In a recent comparativecase study of reputation building by new firms,Rindova and her colleagues (2007) provided evi-dence that Amazon.com developed such a mediastrategy by continuously releasing informationabout a variety of actions, rather than seeking tomake “big bang” product announcements. Our re-sults also provide support for this approach. Al-though the effects of firm press releases are treatedas a control variable in our analysis, our resultsshow a positive association between firms’ pressreleases and media attention. In sum, understand-ing the interactions between firm, media, and in-vestor actions should be considered an importantaspect of the IPO process.
Limitations and Future Research Directions
Like any study, this one has limitations that sug-gest future research directions. One potential limi-tation of this study arises from the period observed.We chose to focus on a relatively short time periodafter firms’ IPOs to limit the probability that endog-enous or exogenous events with significant infor-mation value might change the course of the cas-cades we sought to observe. However, it is possiblethat a different pattern of results would emerge if alonger post-IPO period were considered. Future re-search can explore the relative impact of differentinformation attributes and the operation of the twotypes of cascades over longer periods.
A second limitation of our study is that we wereunable to differentiate between information ob-
2008 353Pollock, Rindova, and Maggitti

tained directly by reporters or investors from pri-mary sources and that gleaned through secondarymeans. Our study design reflects the logic of cas-cades, which emphasizes that under conditions ofuncertainty actors choose to ignore their privateinformation and beliefs, an expectation that hasbeen supported in laboratory settings. However, itis possible that in realistic settings actors use infor-mation from different sources differently. It is alsoimportant to recognize that, in contrast to eventstudies (e.g., Busse & Green, 2002; Westhphal &Zajac, 1998), this study does not focus on the effecton investors of any particular piece of media-pro-vided information, but rather on the aggregate ef-fects of the collective behaviors of investors and themedia on each others’ actions. Our approach isconsistent with prior research that uses aggregatebehaviors as an indicator of information cascadesin markets (Amihud et al., 2003). Because it exam-ines aggregate media and investor actions, ourstudy cannot replicate the microstructures of infor-mation cascades observed in the laboratory, or dif-ferentiate between the effects of actions taken bydifferent types of investors (e.g., institutional inves-tors versus private individuals, public versus pri-vate fund managers) and media organizations (e.g.,newspapers and general magazines versus special-ized trade publications). It is possible, given differ-ences in levels of expertise, reputation, risk orien-tation, or other characteristics, that different typesof investors may interpret media-provided informa-tion and other investors’ actions in different ways,and different types of media organizations may re-spond to both the market and other media organi-zations differently. Future research could endeavorto disaggregate “investors” and “the media” intofiner categorical delineations in order to determinewhat role the characteristics of the different actorsthemselves play in information use.
We also did not differentiate between prestigiousand nonprestigious media outlets in assessing theirinfluence on cascade behaviors. The availabilitycascade perspective explicitly emphasizes the rolethat little-known actors (e.g., “availability entrepre-neurs”; Kuran & Sunstein, 1999) can play in insti-gating cascades. However, prestigious individualshave been shown to influence information cascades(Rao et al., 2001). We explored this issue in analy-ses not reported here by including a dummy vari-able in our regression models for media coverageissued by BusinessWeek, Fortune, and the WallStreet Journal, three prestigious and nationally dis-tributed business publications. Coverage by theseoutlets constituted about 8 percent of all the arti-cles published during the post-IPO period, or lessthan two-tenths of a percent of the observations in
our sample. The effect of this measure was gener-ally nonsignificant,13 and none of our substantiveresults changed. Given the low incidence of articlespublished by these prominent media outlets in ourdata, we suggest that understanding the role ofactor prestige in cascade dynamics is yet anotherinteresting future direction for the growing area ofresearch on social influence in markets.
Also, we only empirically examined the effects ofpositive evaluations, because negative coveragewas very infrequent in our data, as noted earlier.Thus, although we have endeavored to developtheoretical arguments that apply to both to positiveand negative evaluations, we could not empiricallytest whether negative evaluations affect cascade be-haviors differently than positive evaluations. Giventhat negative coverage tends to be rare for IPO firmsin general, an important direction for future re-search would be to examine the dynamics of cas-cade influence in contexts associated with specificnegative events, such as organizational crises.
Finally, we do not account for influences thatmay arise from actors other than firm, media, andinvestors. For example, customers, suppliers, and afirm’s investment bank or venture capitalist back-ers might all engage in activities or share informa-tion that could influence our outcomes of interest.However, to the extent that these other sources ofinformation affect media coverage or investor ac-tivity, they would create error variance in ourmodels, making it more difficult to find signifi-cant results for the relationships of interest inthis study. Given our findings about the signifi-cance of intercascade influence, future researchshould continue to disentangle the informationeffects of the actions of different stakeholdergroups and interacting communities.
REFERENCES
Akerlof, G. A. 1970. The market for “lemons”: Quality,uncertainty and the market mechanism. QuarterlyJournal of Economics, 84: 488–500.
Aldrich, H. 1999. Organizations evolving. London:Sage.
Allison, P. 1984. Event history analysis: Regression forlongitudinal event data. Beverly Hills, CA: Sage.
Amihud, Y., Hauser, S., & Kirsch, A. 2003. Allocations,adverse selection and cascades in IPOs: Evidence
13 A marginally significant effect in the main effectsmodel predicting media evaluations was the only excep-tion, and it disappeared once the interactions wereincluded.
354 AprilAcademy of Management Journal

from the Tel Aviv stock exchange. Journal of Finan-cial Economics, 68: 137–158.
Banerjee, A. V. 1992. A simple model of herd behavior.Quarterly Journal of Economics, 107: 797–817.
Benjamin, B. A., & Podolny, J. M. 1999. Status, quality,and social order in the California wine industry.Administrative Science Quarterly 44: 563–589.
Benveniste, L. M., & Spindt, P. A. 1989. How investmentbankers determine the offer price and allocation ofnew issues. Journal of Financial Economics 24:343–361.
Bikhchandani, S., Herschleifer, D., & Welch, I. 1998.Learning from the behavior of others: Conformity,fads, and informational cascades. Journal of Eco-nomic Perspectives, 12(3): 151–170.
Bikchandani, S., & Sharma, S. 2001. Herding behavior infinancial markets. IMF Staff Papers, 47: 279–310.
Bonardi, J. P., & Keim, G. D. 2005. Corporate politicalstrategies for widely salient issues. Academy ofManagement Review, 30: 355–376.
Bradley, D. J., Jordan, B. D., & Ritter, J. R. 2003. The quietperiod goes out with a bang. Journal of Finance, 58:1–36.
Brown, N., & Deegan, C. 1998. The public discourse ofenvironmental performance information—A dualtest of media agenda setting theory and institutionaltheory. Accounting and Business Research, 29: 21–41.
Busse, J. A., & Green, T. C. 2002. Market efficiency in realtime. Journal of Financial Economics, 65: 415–437.
Carroll, C. E., & McCombs, M. 2003. Agenda setting ef-fects of business news on the public’s images andopinions about major corporations. Corporate Rep-utation Review, 6: 36–46.
Carter, R. B., & Manaster, S. 1990. Initial public offeringsand underwriter reputation. Journal of Finance, 65:1045–1067.
Certo, S. T. 2003. Influencing IPO investors with prestige:Signaling with board structures. Academy of Man-agement Review, 28: 432–446.
Certo, S. T., Daily, C. M., Cannella, A. A., & Dalton, D. R.2003. Giving money to get money: How CEO stockoptions and CEO equity enhance IPO valuations.Academy of Management Journal, 46: 643–644.
Cialdini, R. B. 2004. The science of persuasion. Scien-tific American (Special edition: Mind), 284(2): 76–82.
Cohen, J. 1968. Weighted kappa: Nominal scale agree-ment with provision for scaled agreement or partialcredit. Psychological Bulletin, 70: 213–220.
Cohen, J., Cohen, P., West, S., & Aiken, L. 2003. Appliedmultiple regression/correlation analysis for the be-havioral sciences. Mahwah, NJ: Erlbaum.
Connelly, T., Arkes, H. R., & Hammond, K. R. 2000.
Judgment and decision making. New York: Cam-bridge University Press.
Cornelli, F., & Goldreich, D. 2001. Bookbuilding andstrategic allocation. Journal of Finance, 56: 2337–2370.
Crocker, J. K, & McGraw, M. 1984. What’s good for thegoose is not good for the gander: Solo status as anobstacle to occupational achievement for males andfemales. American Behavioral Scientist, 27: 357–369.
Davis, G. F., & Greve, H. R. 1997. Corporate elite networksand governance changes in the 1980’s. American Jour-nal of Sociology, 103: 1–37.
Davis, G. F., & Marquis, C. 2005. Prospects for organizationtheory in the early twenty-first century: Institutionalfields and mechanisms. Organization Science, 16:332–343.
Deeds, D., Mang, P., & Frandsen, M. 2004. The influencesof firms’ and industries’ legitimacy on the flow ofcapital into high-technology ventures. Strategic Or-ganization, 2: 9–34.
Deephouse, D. L. 2000. Media reputation as a strategicresource: An integration of mass communication andresource based theories. Journal of Management,26: 1091–1112.
Derfus, P. J., Maggitti, P. G., Grimm, C. M., & Smith, K. G.2008. The Red Queen effect: Competitive actions andfirm performance. Academy of Management Jour-nal, 51: 61–80.
DiMaggio, P. J., & Powell, W. W. 1983. The iron cagerevisited: Institutional isomorphism and collectiverationality in organizational fields. American Socio-logical Review, 48: 147–160.
Eagly, A. H., & Chaiken, S. 1993. The psychology ofattitudes. Ft. Worth, TX: Harcourt Brace Jovanovich.
Edwards, K, & Smith, E. E. 1996. The disconfirmationbias in the evaluation of arguments. Journal of Per-sonality and Social Psychology, 71: 5–24.
Einhorn, H. J. 1982. Learning from experience and sub-optimal rules in decision making. In D. Kahneman,P. Slovic, & A. Tversky (Eds.), Judgment under un-certainty: Heuristics and biases: 268–286. Cam-bridge, U.K.: Cambridge University Press.
Einhorn, H. J., & Hogarth, R. M. 1981. Behavioral deci-sion theory: Processes of judgement and choice. InM. R. Rosenzweig & L. W. Porter (Eds.), Annualreview of psychology, 32: 53–88. Palo Alto, CA:Annual Reviews.
Ellis, K., Michaely, R., & O’Hara, M. 2000 When theunderwriter is the market maker: An examination oftrading in the IPO aftermarket. Journal of Finance,55: 1039–1074.
Figlewski, S. 1982. Information diversity and market be-havior. Journal of Finance, 37: 87–102.
Fischer, H. M., & Pollock, T. G. 2004. Effects of social
2008 355Pollock, Rindova, and Maggitti

capital and power on surviving transformationalchange: The case of initial public offerings. Acad-emy of Management Journal, 47: 463–481.
Fiske, S. T., & Taylor, S. E. 1991. Social cognition. NewYork: McGraw Hill.
Goeree, J. K., Palfrey, T. R., Rogers, B. W., & McKelvey,R. D. 2006. Self-correcting information cascades.Unpublished working paper, Princeton University,Princeton, NJ.
Graham, J. R. 1999. Herding among investment newslet-ters: Theory and practice. Journal of Finance, 54:237–268.
Greve, H. R. 1995. Jumping ship: The diffusion of strategyabandonment. Administrative Science Quarterly,41: 29–60.
Greve, H. R., & Taylor, A. 2000. Innovations as catalystsfor organizational change: Shifts in organizationalcognition and search. Administrative ScienceQuarterly, 45: 54–80.
Gulati, R., & Higgins, M. C. 2003. Which ties matterwhen? The contingent effects of interorganizationalpartnerships on IPO success. Strategic Manage-ment Journal, 24: 127–144.
Gutterman, A. 1991. Marketing the initial public offering:Strategic planning analysis—Part II. Securities Reg-ulation Law Journal, 18: 422–432.
Haunschild, P. R. 1994. How much is that companyworth? Interorganizational relationships, uncer-tainty and acquisition premiums. AdministrativeScience Quarterly, 39: 391–411.
Haunschild, P. R., & Miner, A. S. 1997. Modes of interor-ganizational imitation: The effects of outcome sa-lience and uncertainty. Administrative ScienceQuarterly, 42: 472–500.
Haunschild, P. R., & Sullivan, B. N. 2002. Learning fromcomplexity: Effects of prior accidents and incidentson airlines’ learning. Administrative Science Quar-terly, 47: 609–643.
Hawkins, S. A., & Hoch, S. J. 1992. Low-involvementlearning: Memory without evaluation. Journal ofConsumer Research, 19: 212–216
Heckman, J. J. 1979. Sample selection bias as a specifi-cation error. Econometrica, 47: 153–162.
Higgins, E. T. 1996. Knowledge activation: Accessibility,applicability, and salience. In E. T. Higgins & A.Kruglanski (Eds.), Social psychology: Handbook ofbasic principles: 133–168. New York: GuilfordPress.
Hirsch, P. 1977. Occupational, organizational and insti-tutional models in mass media research: Toward anintegrated framework. In P. M. Hirsch, P. V. Miller, &F. G. Kline (Eds.), Strategies for communicationresearch: 13–40. Beverly Hills, CA: Sage.
Hoffman, A., & Ocasio, W. 2001. Not all events are at-tended equally: Toward a middle range theory of
industry attention to external events. OrganizationScience 12: 414–434.
Hsee, C. K., Loewenstein, G. F., Blount, S., & Bazerman,M. H. 1999. Preference reversal between joint andseparate evaluations of options: A review and theo-retical analysis. Psychological Bulletin, 125: 576–590.
Hung, A. A., & Plott, C. R. 2001. Information cascades:Replication and an extension to majority rule andconformity-rewarding institutions. American Eco-nomic Review, 91: 1508–1520.
Husick, G. C., & Arrington, J. M. 1998. The initial publicoffering: A practical guide for executives. NewYork: Bowne & Co.
Ibbotson, R. G., & Ritter, J. R. 1995. Initial public offer-ings. In R. Jarrow et al. (Eds.), Handbook in opera-tions research and management science: 993–1016. London: Elsevier Sciences B.V.
Janis, I. L., & Fadner, R. 1965. The coefficient of imbal-ance. In H. Lasswell, N. Leites, & associates (Eds.),Language of politics: 153–169. Cambridge, MA:MIT Press.
Johns, G. 2006. The essential impact of context on organ-izational behavior. Academy of Management Re-view, 2: 386–408.
Kahneman, D., Slovic, P., & Tversky, A. 1982. Judgmentunder uncertainty: Heuristics and biases. Cam-bridge and New York: Cambridge University Press.
Kelley, H. 1972. Causal schemata in the attribution pro-cess. In E. E. Jones, D. E. Kanouse, H. H. Kelly, R. E.Nisbett, S. Valins, & B. Weiner (Eds.), Attribution:Perceiving the causes of behavior. Morristown, NJ:General Learning Press.
Kim, J., & Miner, A. S. 2007. Vicarious learning from thefailure and near failure of others: Evidence from theU.S. commercial banking industry. Academy ofManagement Journal,50: 687–714.
Kraatz, M. S. 1998. Learning by association? Interorgan-izational networks and adaptation to environmentalchange Academy of Management Journal, 41: 621–643.
Kraatz, M. S., & Moore, J. H. 2002. Executive migrationand institutional change. Academy of ManagementJournal, 45: 120–143.
Kunda, Z. 1990. The case for motivated reasoning. Psy-chological Bulletin, 108: 480–498.
Kuran, T., & Sunstein, C. 1999. Availability cascades andrisk regulation. Stanford Law Review, 51: 683–768.
Lamertz, K., & Baum, J. 1998. The legitimacy of organi-zational downsizing in Canada: An analysis of ex-planatory media accounts. Canadian Journal of Ad-ministrative Sciences, 15: 93–107.
Leblebici, H., Salancik, G. R., Copay, A., & King, T. 1991.Institutional change and the transformation of inter-organizational fields: An organizational history of
356 AprilAcademy of Management Journal

the U.S. radio broadcasting industry. Administra-tive Science Quarterly, 36: 333–363.
Lord, C. G., Ross, L., & Lepper, M. R. 1979. Biased assim-ilation and attitude polarization: The effects of priortheories on subsequently considered evidence. Jour-nal of Personality and Social Psychology, 37:2098–2109.
Lounsbury, M., & Rao, H. 2004. Sources of durability andchange in market classifications: A study of the re-constitution of product classifications in the Ameri-can mutual fund industry, 1944–1985. Social Forces,82: 969–999.
March, J., & Simon, H. 1958. Organizations. New York:Wiley.
Martens, M. L. 2004. IPO effects: Corporate restructuringwhen a firm goes public. Journal of Public Affairs,4: 125S–139S.
McArthur, L. Z., & Post, D. L. 1977. Figural emphasis andperson perception. Journal of Experimental SocialPsychology, 13: 520–535.
McCombs, M., & Shaw, D. 1972. The agenda-setting func-tion of mass media. Public Opinion Quarterly 36:176–187.
Megginson, W. L., & Weiss, K. 1991. Venture capitalistcertification in initial public offerings. Journal ofFinance, 46: 879–903.
Miller, S. C. 1992. Networking: Managing systems withthousands of users. New York Times, September 27:3–8.
Mitra, A. 1995. Advertising and the stability of consider-ation sets over multiple purchase occasions. Inter-national Journal of Research in Marketing, 12: 81–94.
Mizruchi, M. S., & Fein, L. C. 1999. The social construc-tion of organizational knowledge: A study of the usesof coercive, mimetic and normative isomorphism.Administrative Science Quarterly, 44: 653–683.
Neill, D. B. 2005. Cascade effects in heterogeneous pop-ulations. Rationality and Society, 17(2): 191–241.
Nelson, T. 2003. The persistence of founder influence:Management, ownership, and performance effects atinitial public offerings. Strategic ManagementJournal, 24: 707–724.
Nisbett R. E., & Ross, L. 1980. Human inference: Strat-egies and shortcomings of social judgment. Engle-wood Cliffs, NJ: Prentice Hall.
Ocasio, W. 1997. Towards an attention-based view of thefirm. Strategic Management Journal, 18: 187–206.
Podolny, J. 1993. A status-based model of market com-petition. American Journal of Sociology, 98: 829–872.
Pollock, T. G. 2004. The benefits and costs of underwrit-ers’ social capital in the U.S. initial public offeringsmarket. Strategic Organization, 2: 357–388.
Pollock, T. G., & Gulati, R. 2007. Standing out from thecrowd: The visibility enhancing effects of IPO-re-lated signals on alliance formations by entrepreneur-ial firms. Strategic Organization, 5: 339–372.
Pollock, T. G., & Rindova, V. P. 2003. Media legitimationeffects in the market for initial public offerings.Academy of Management Journal, 46: 631–642.
Porac, J. F., Thomas, H., Wilson, F., Paton, D., & Kanfer,A. 1995. Rivalry and the industry model of Scottishknitwear producers. Administrative Science Quar-terly, 40: 203–227.
Porac, J. F., Wade, J. B., & Pollock, T. G. 1999. Industrycategorizations and the politics of the comparablefirm in CEO compensation. Administrative ScienceQuarterly, 44: 112–144.
Rao, H., Greve, H., & Davis, G. 2001. Fool’s gold: Socialproof in the initiation and abandonment of coverageby Wall Street analysts. Administrative ScienceQuarterly, 46: 502–526.
Reger, R. K., & Huff, A. S. 1993. Strategic groups: Acognitive perspective. Strategic Management Jour-nal, 14: 103–124.
Rindova, V. P., Petkova, A., & Kotha S. 2007. Standingout: How new firms in emerging markets build rep-utation in the media. Strategic Organization, 5(1):1–39.
Rindova, V. P., Pollock, T. G., & Hayward, M. L. A. 2006.Celebrity firms: The social construction of marketpopularity. Academy of Management Review, 31:50–71.
Rindova V. P., Williamson I. O., Petkova, A. P., & Server,J. M. 2005. Being good or being known: An empiricalexamination of the dimensions, antecedents, andconsequences of organizational reputation. Acad-emy of Management Journal, 48: 1033–1049.
Ritter, J. R. 1984. The “hot issue” market of 1980. Journalof Business, 57: 215–240.
Ritter, J. R. 1991. The long-run performance of initialpublic offerings. Journal of Finance, 46: 3–27.
Ritter, J. R., & Welch, I. 2002. A review of IPO activity,pricing and allocations. Journal of Finance, 57:1795–1828.
Roberts, J. H., & Lattin, J. M. 1997. Consideration: Reviewof research and prospects for future insights. Journalof Marketing Research, 34: 406–410.
Rogers, E. M. 2002. Intermedia processes and powerfulmedia effects. In J. Bryant & D. Zillman (Eds.), Mediaeffects: Advances in theory and research: 199–214. Mahwah, NJ: Erlbaum.
Schwarz, N., & Bohner, G. 2001. The construction ofattitudes. In A. Tesser & N. Schwarz (Eds.), Black-well handbook of social psychology: 436–457. Ox-ford, U.K.: Blackwell.
Shaver, M. 1998. Accounting for endogeniety when as-sessing strategy performance: Does entry mode
2008 357Pollock, Rindova, and Maggitti
choice affect FDI survival? Management Science,44: 571–585.
Sherman, S. J., Cialdini, R. B., & Schwartzman, D. F.1985. Imagining can heighten or lower the perceivedlikelihood of contracting a disease: The mediatingeffect of ease of imagery. Personality and SocialPsychology Bulletin, 11: 118–127.
Shoemaker, P. J., & Reese, S. D. 1996. Mediating themessage. New York: Longman.
Shudson, M. 1986. What time means in a news story.Gannett occasional paper no. 4, Gannett Center forMedia Studies, New York.
Sigal, L. V. 1973. Reporters and officials. Lexington,MA: Heath.
Slovic, P. 2000. The perception of risk. Sterling, VA:Earthscan Publications.
Starbuck, W., & Milliken, F. 1988. Executive perceptualfilters: What they notice and how they make sense.In D. Hambrick (Ed.), The executive effect: Con-cepts and methods for studying top managers: 35–65. Greenwich, CT: JAI Press.
Stiglitz, J. 2000. The contribution of the economics ofinformation to twentieth century economics. Quar-terly Journal of Economics, 104: 1441–1478.
Sunstein, C. R. 2003. What’s available? Social influencesand behavioral economics. Northwestern Law Re-view, 97: 1295–1314.
Sunstein, C. R. 2004. Fear and liberty. Social Research,71: 967–996.
Taylor, S. E., & Fiske, S. T. 1975. Point of view andperceptions of causality. Journal of Personality andSocial Psychology, 32: 439–445.
Thomas, S. 2002. The saga of the first stock index futurescontract: Benchmarks, models and learning. Journalof Money, Credit and Banking, 34: 767–808.
Tversky, A., & Kahneman, D. 1973. Availability: A heu-ristic for judging frequency and probability. Cogni-tive Psychology, 5: 207–232.
Welbourne, T. M., & Andrews, A. O. 1996. Predicting theperformance of initial public offerings: Should hu-man resource management be in the equation? Acad-emy of Management Journal, 39: 891–919.
Welch, I. 1992. Sequential sales, learning and cascades.Journal of Finance, 47: 695–732.
Welch, I. 2000. Herding among security analysts. Journalof Financial Economics, 58: 369–396.
Westphal, J. D., & Zajac, E. J. 1998. The symbolic man-agement of stockholders: Corporate governance re-forms and shareholder reactions. AdministrativeScience Quarterly, 43: 127–153.
Yamaguchi, K. 1991. Event history analysis. NewburyPark, CA: Sage.
Zuckerman, E. W. 1999. The categorical imperative: Se-curities analysts and the illegitimacy discount.American Journal of Sociology, 104: 1398–1438.
Timothy G. Pollock ([email protected]) is an associateprofessor of management in the Smeal College of Busi-ness at the Pennsylvania State University. He receivedhis Ph.D. in organizational behavior from the Universityof Illinois at Urbana-Champaign. His research focuses onhow social and political factors such as reputation, ce-lebrity, social capital, impression management activities,media accounts, and the power of different actors influ-ence corporate governance, strategic decision making inentrepreneurial firms, and the social construction of en-trepreneurial market environments.
Violina P. Rindova ([email protected]) isan associate professor of management in the McCombsSchool of Business at the University of Texas–Austin.She received her Ph.D. in strategy from the Stern Schoolof Business, New York University. Her research focuseson the creation of intangible assets, such as reputationand celebrity, and the sociocognitive processes throughwhich value, meaning, and advantages are socially con-structed in markets.
Patrick G. Maggitti ([email protected]) isan assistant professor of management and entrepeneur-ship in the School of Business at Villanova University.His research focuses on the dynamics of competition,innovation, and decision making. He received his Ph.D.in strategic management from the Robert H. Smith Schoolof Business at the University of Maryland, College Park.
358 AprilAcademy of Management Journal