Embed Size (px)
Citation preview

Marketing Apples in a Global Environment: Challenges and
Opportunities
by
Dr. Roberta CookUniversity of California Davis
March 2003

Overview of Presentation
•US apple situation – Area and Production– Trade– Consumption
•Global apple production•Emphasis on China•Global apple trade patterns•Global consumption patterns•Marketing issues
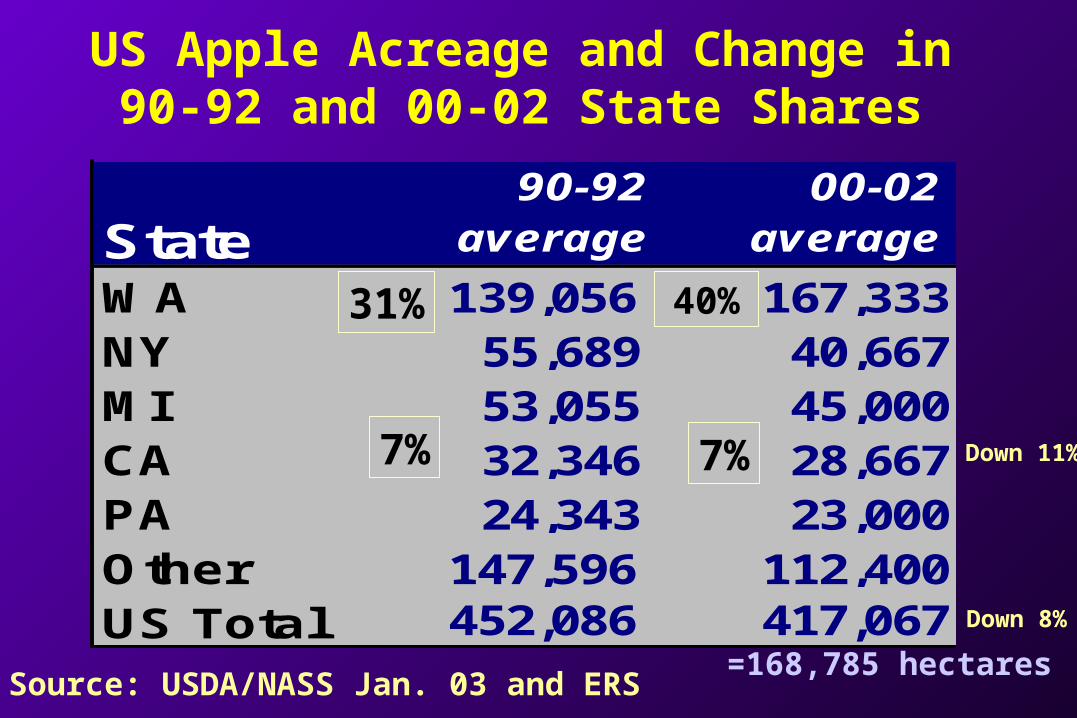
US Apple Acreage and Change in 90-92 and 00-02 State Shares
Source: USDA/NASS Jan. 03 and ERS
State 90-92
average00-02
average
WA 139,056 167,333NY 55,689 40,667MI 53,055 45,000CA 32,346 28,667PA 24,343 23,000Other 147,596 112,400US Total 452,086 417,067
7% 7%
40%31%
=168,785 hectares
Down 8%
Down 11%
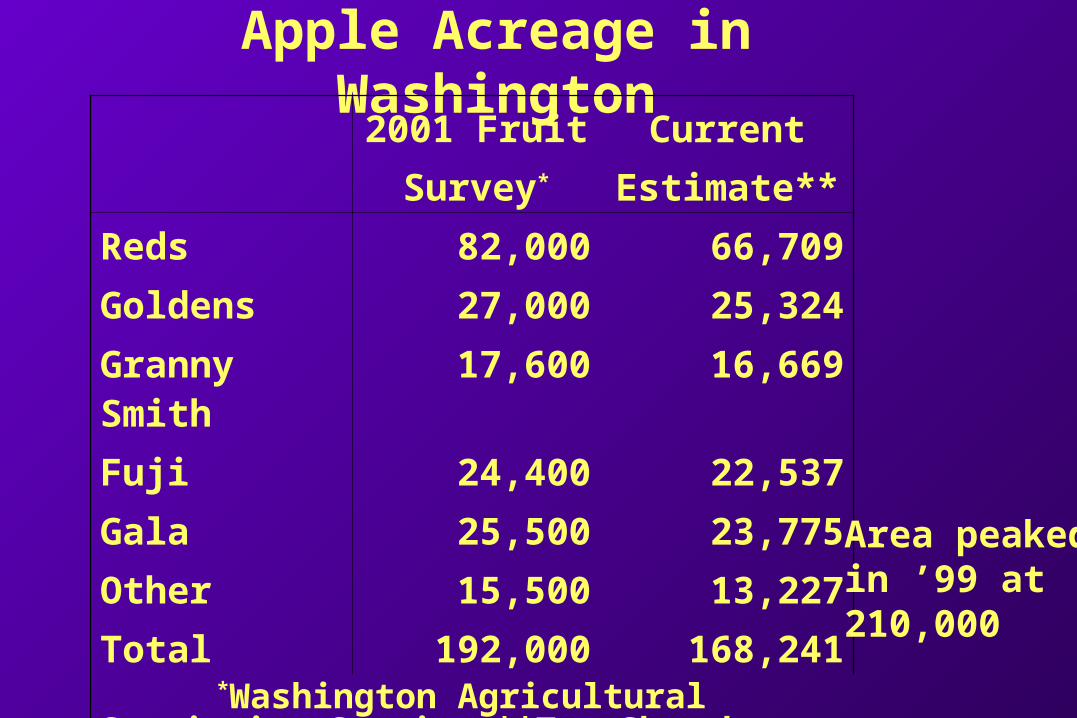
Apple Acreage in Washington2001 Fruit
Survey*
Current
Estimate**
Reds 82,000 66,709
Goldens 27,000 25,324
Granny Smith 17,600 16,669
Fuji 24,400 22,537
Gala 25,500 23,775
Other 15,500 13,227
Total 192,000 168,241 *Washington Agricultural Statistics Service;**Tom Shotzko
Area peakedin ’99 at 210,000
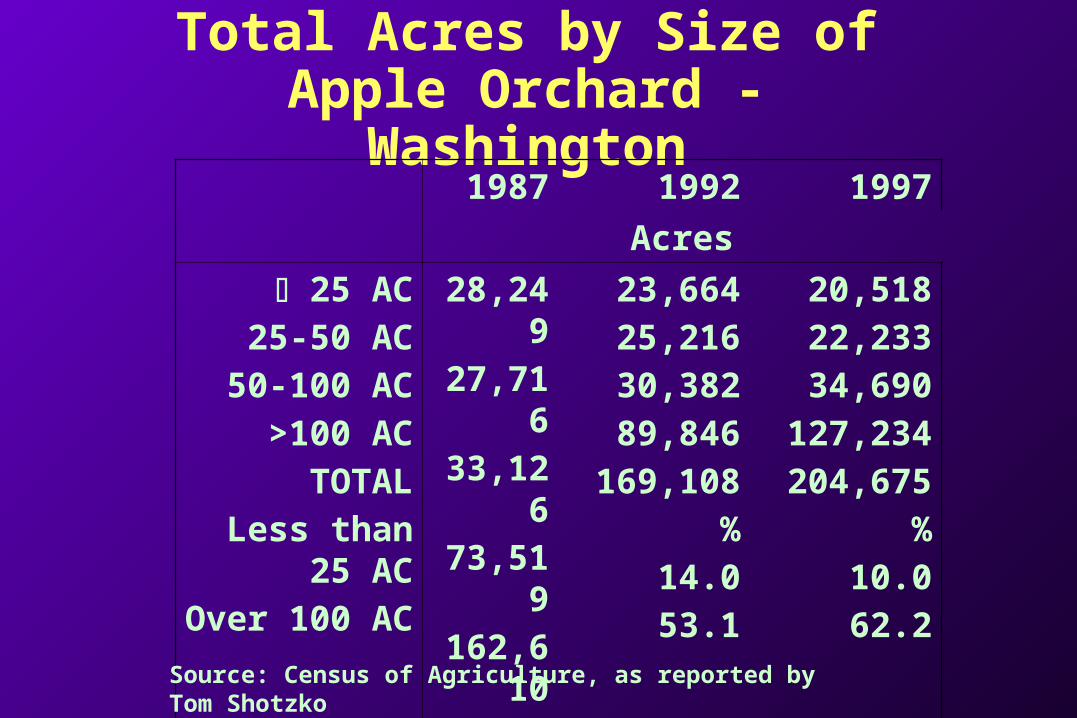
Total Acres by Size of Apple Orchard -
Washington1987 1992 1997
Acres
25 AC
25-50 AC
50-100 AC
>100 AC
TOTAL
Less than 25 AC
Over 100 AC
28,249
27,716
33,126
73,519
162,610
%
17.4
45.2
23,664
25,216
30,382
89,846
169,108
%
14.0
53.1
20,518
22,233
34,690
127,234
204,675
%
10.0
62.2Source: Census of Agriculture, as reported by Tom Shotzko
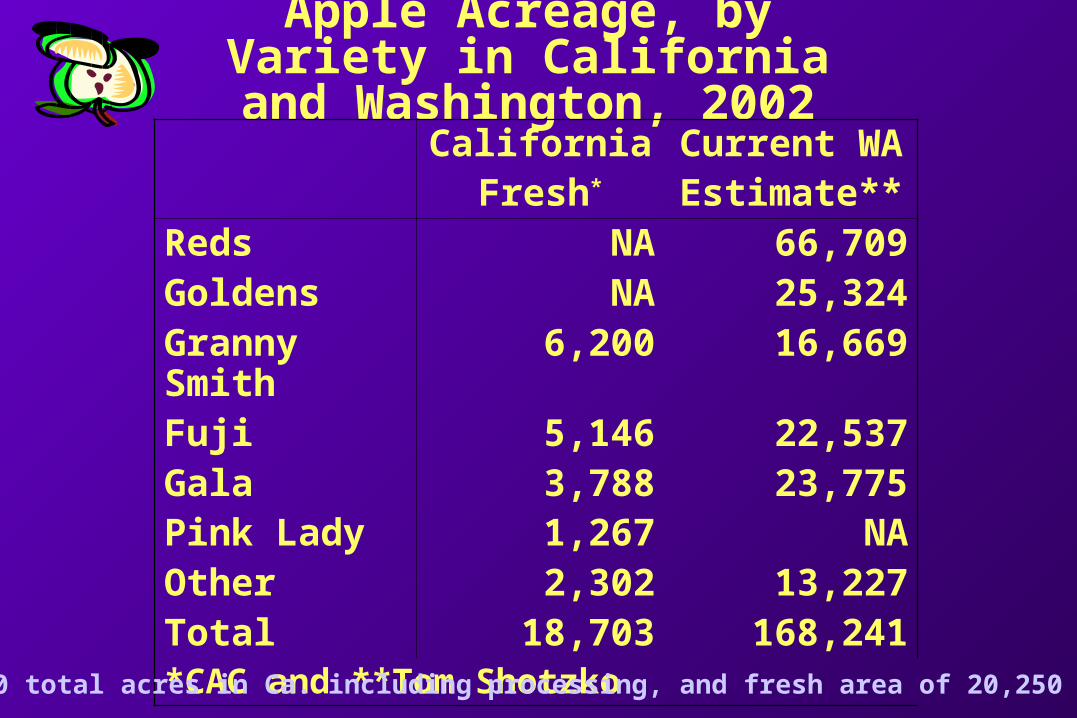
Apple Acreage, by Variety in California and Washington, 2002
CaliforniaFresh*
Current WAEstimate**
Reds NA 66,709Goldens NA 25,324Granny Smith 6,200 16,669Fuji 5,146 22,537GalaPink Lady
3,7881,267
23,775NA
Other 2,302 13,227Total 18,703 168,241*CAC and **Tom Shotzko
Likely 22,000 total acres in Ca. including processing, and fresh area of 20,250 in 2000, CAC
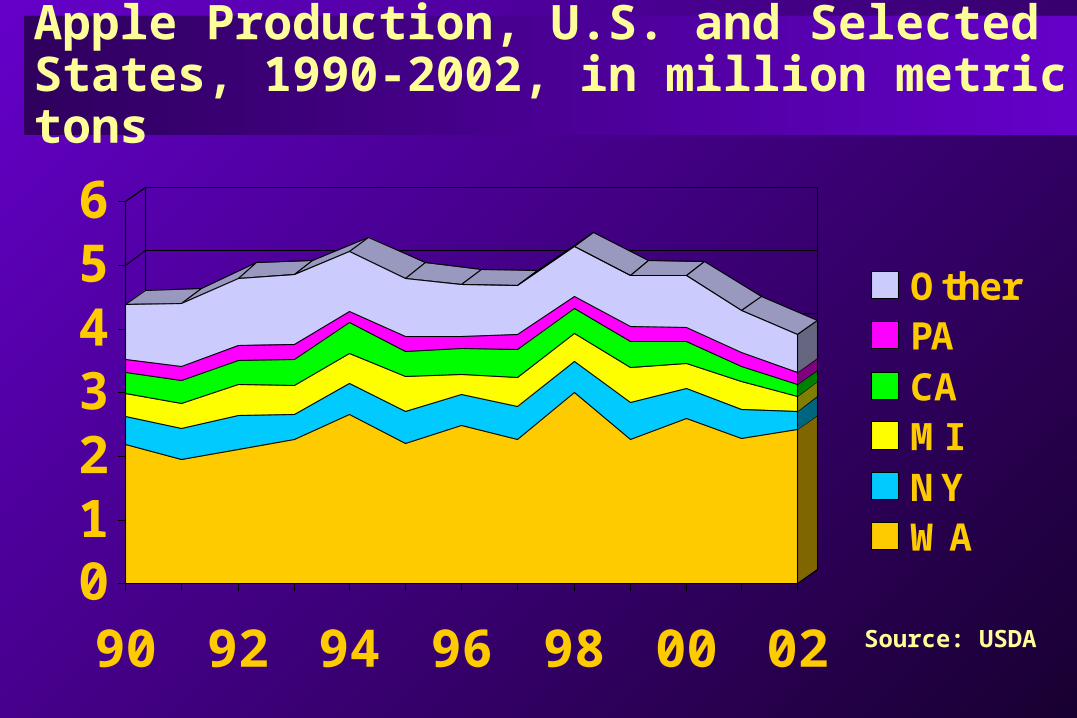
Apple Production, U.S. and Selected States, 1990-2002, in million metric tons
0123456
90 92 94 96 98 00 02
OtherPACAMINYWA
Source: USDA
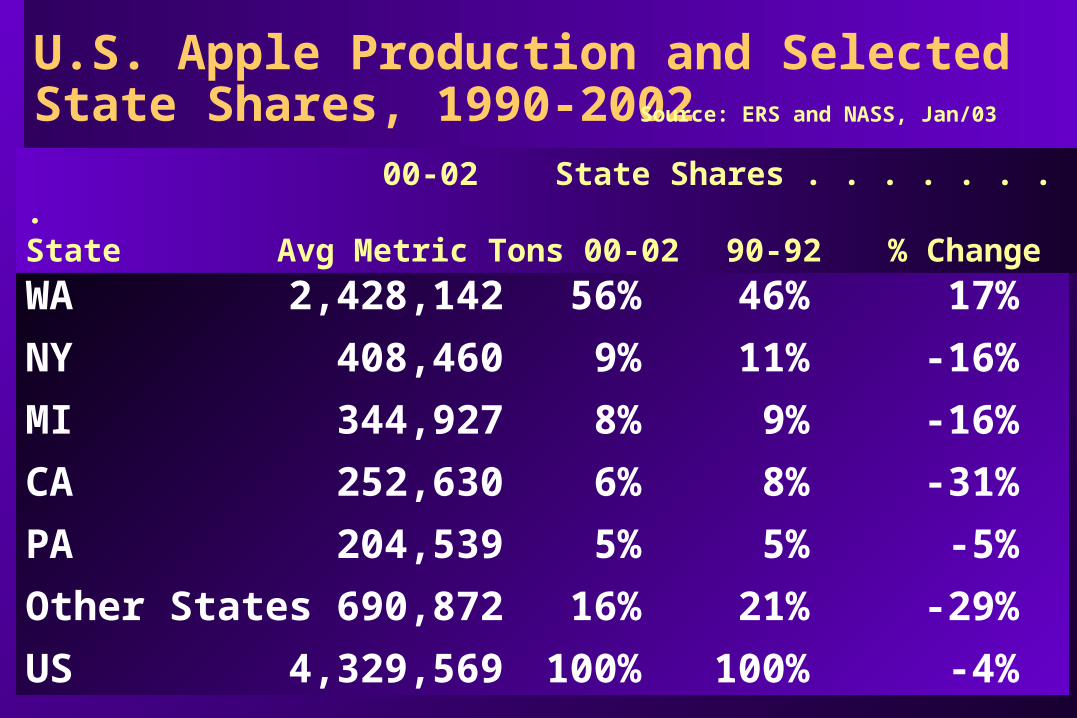
U.S. Apple Production and Selected State Shares, 1990-2002
WA 2,428,142 56% 46% 17%
NY 408,460 9% 11% -16%
MI 344,927 8% 9% -16%
CA 252,630 6% 8% -31%
PA 204,539 5% 5% -5%
Other States 690,872 16% 21% -29%
US 4,329,569 100% 100% -4%
Source: ERS and NASS, Jan/03
00-02 State Shares . . . . . . . . State Avg Metric Tons 00-02 90-92 % Change

California Fresh Apple Production, by Variety, 42 lb. Cartons
2002/03 2001/02
Granny Smith 2,235,993 2,437,835
Fuji 649,120 1,060,491
Gala
Pink Lady
1,015,111
266,877
1,102,086
239,581
Other 96,660 111,462
Total 4,263,761 4,951,455Source: California Apple Commission, as of Dec. 1, 2002
WA Fujis down to 9 million boxes in 02/03 and Pink Ladies down to 500,000; WAC

0
5,000
10,000
15,000
20,000
25,000
1998 1999 2000 2001 2002 2003
(f)
Western U.S. Fuji Production in 1000 42-lb units
Source: U.S. Apple Association, Aug.2003 update

0
100,000
200,000
300,000
400,000
500,000
1998 2000 2002(f)
Western U.S. Fuji Production in metric tons
Forecast prior to frost
2002 RevisedWa. and Ca.
Source: US Apples and 2002 revision from the WAC

0123456
77 78 79 80 81 82 83 84 85 86 87 88 89 90 91 92 93 94 95 96 97 98 99 0 1 2
US Utilization of Apples 1977-2002US Utilization of Apples 1977-2002
FRESFRESHH
PROCESSEDPROCESSED
In Million Metric In Million Metric TonsTons
‘‘77 77 ‘80 ‘85 ‘80 ‘85 ‘90 ‘90 ‘95 ’02*‘95 ’02*
Update:4,237,100 totalShort tons in 2002; 2002 fresh/proc. sharesestimated
Sources: Sources: thru 01 thru 01 ERS/USDA, ERS/USDA, 10-02; NASS 10-02; NASS Jan. 03 for Jan. 03 for 20022002
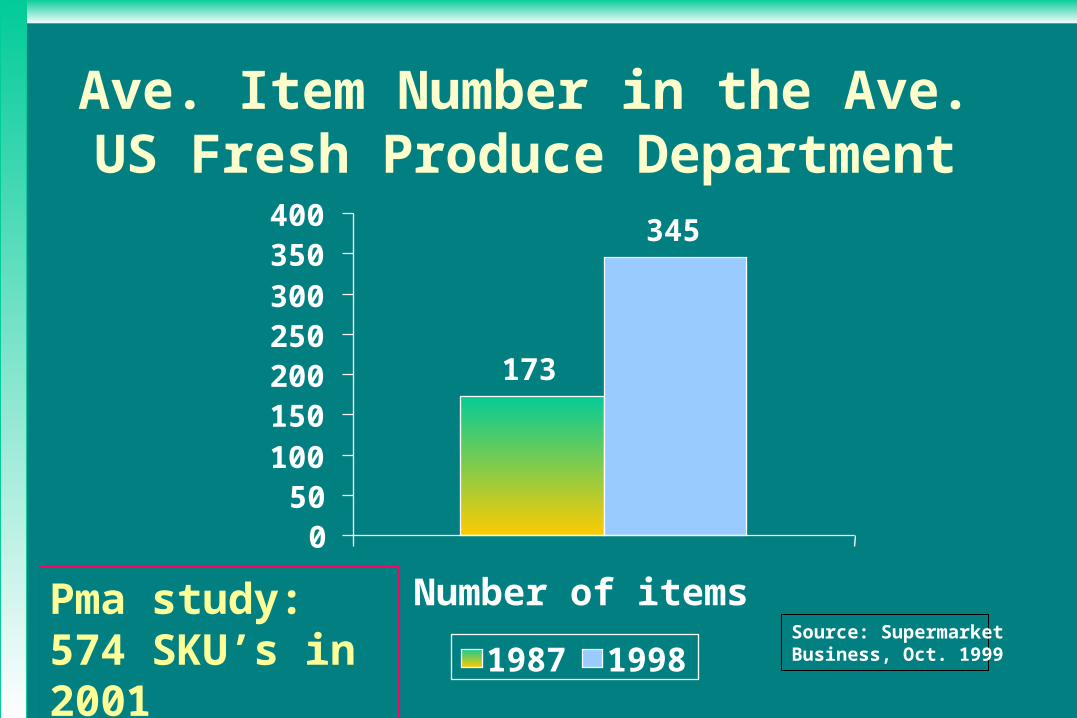
Ave. Item Number in the Ave. US Fresh Produce Department
173
345
050
100150200250300350400
Number of items
1987 1998Source: SupermarketBusiness, Oct. 1999
Pma study:574 SKU’s in 2001

U.S. Per Capita Consumption of Fresh Apples and Pears
12
10
8
6
4
2
077/78........................92/93......97/98..01/02
Source: ERS, USDA
kg
87/8897/98
APPLES
PEARS1.4
7.2

US Per Capita Utilization of Apples in pounds
0
10
20
30
40
50
60
76 79 82 85 88 91 94 97 00
Processed,excl juice
Fresh
J uice
Source: USDA/ERS

US PER CAPITA FRUIT CONSUMPTION, POUNDS 1977-2001
0
50
100
150
200
250
300
1977 1979 1981 1983 1985 1987 1989 1991 1993 1995 1997 1999 2001
ProcessedCitrus
ProcessedNoncitrus
FreshCitrus
FreshNoncitrus
Source: USDA/ERS, Oct. 2002
Pou
nd
s p
er
cap
ita
273
90
85
2474
269
5426
71
118
Total for 2001 reaches 279 including some berries and olives.
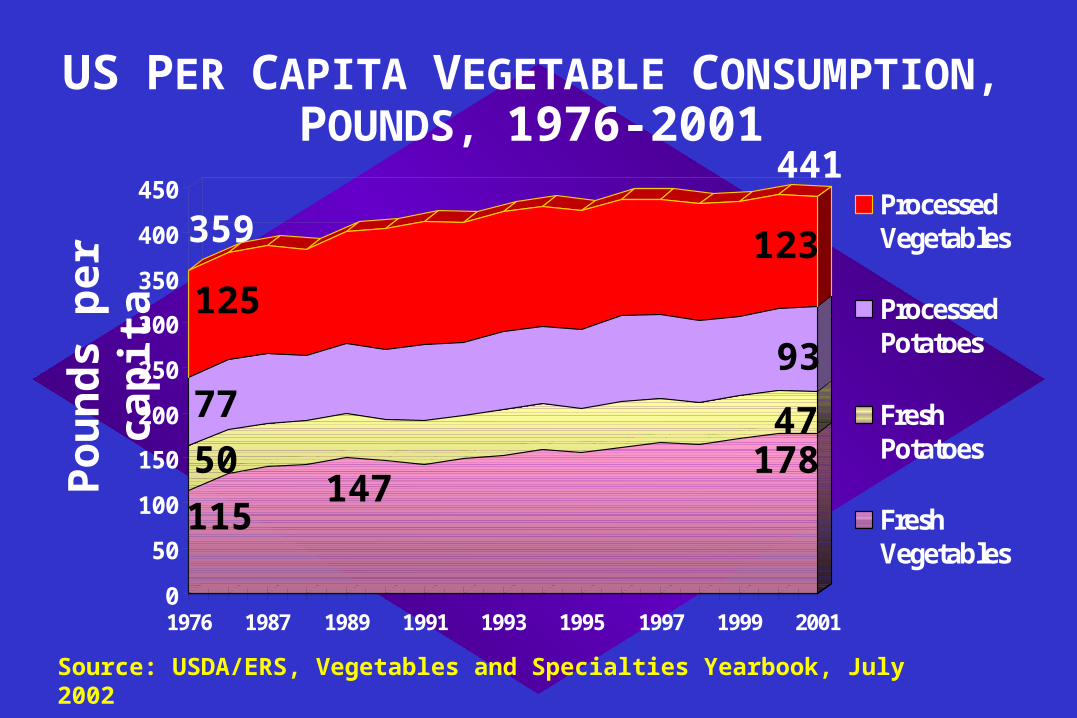
US PER CAPITA VEGETABLE CONSUMPTION, POUNDS, 1976-2001
0
50
100
150
200
250
300
350
400
450
1976 1987 1989 1991 1993 1995 1997 1999 2001
ProcessedVegetables
ProcessedPotatoes
FreshPotatoes
FreshVegetables
Source: USDA/ERS, Vegetables and Specialties Yearbook, July 2002
Pou
nd
s p
er
cap
ita
17847
93
123
441
359
115147
125
77
50

0100200300400500600700
OthersHong KongI ndonesiaTaiwanMexicoJ apanAustraliaArgentinaSouth AfricaCanadaNew ZealandChile
Fresh Apples: U.S. Imports & Exports by Key Country
1000 m
etr
ic t
on
s
1992 1997
IMP EXP IMP EXP IMP EXP IMP EXP
2002
Source: ERS, USDA
2001
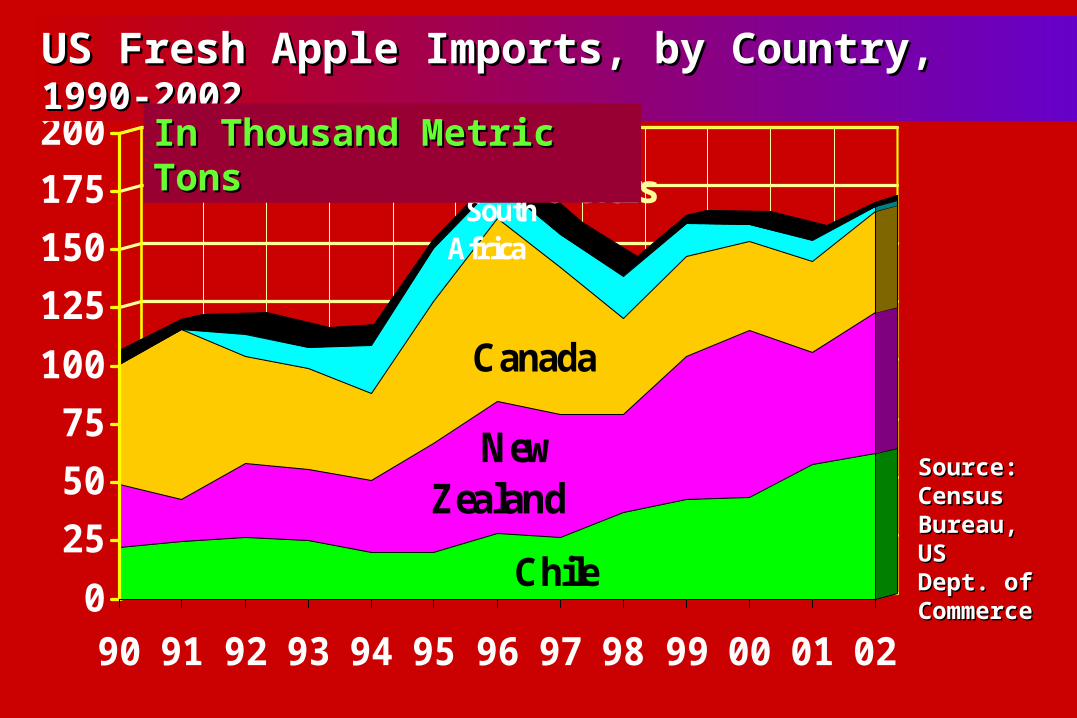
Chile
New Zealand
Canada
South Africa
Others
0
25
50
75
100
125
150
175
200
90 91 92 93 94 95 96 97 98 99 00 01 02
US Fresh Apple Imports, by Country, US Fresh Apple Imports, by Country, 1990-1990-20022002
In Thousand Metric In Thousand Metric TonsTons
Source: Source: Census Census Bureau, Bureau, US US Dept. of Dept. of CommerceCommerce

0100200300400500600700800
90 92 94 96 98 00 02
IndonesiaIndonesia
Source: Source: Bureau Bureau of the of the Census, US Census, US Dept. of Dept. of CommerceCommerce
US Fresh Apple Exports, by Country, US Fresh Apple Exports, by Country, 1990-1990-20022002
In Thousand Metric In Thousand Metric TonsTons
OtherOther
MexicoMexicoTaiwanTaiwanCanadaCanada
Hong Hong KongKong
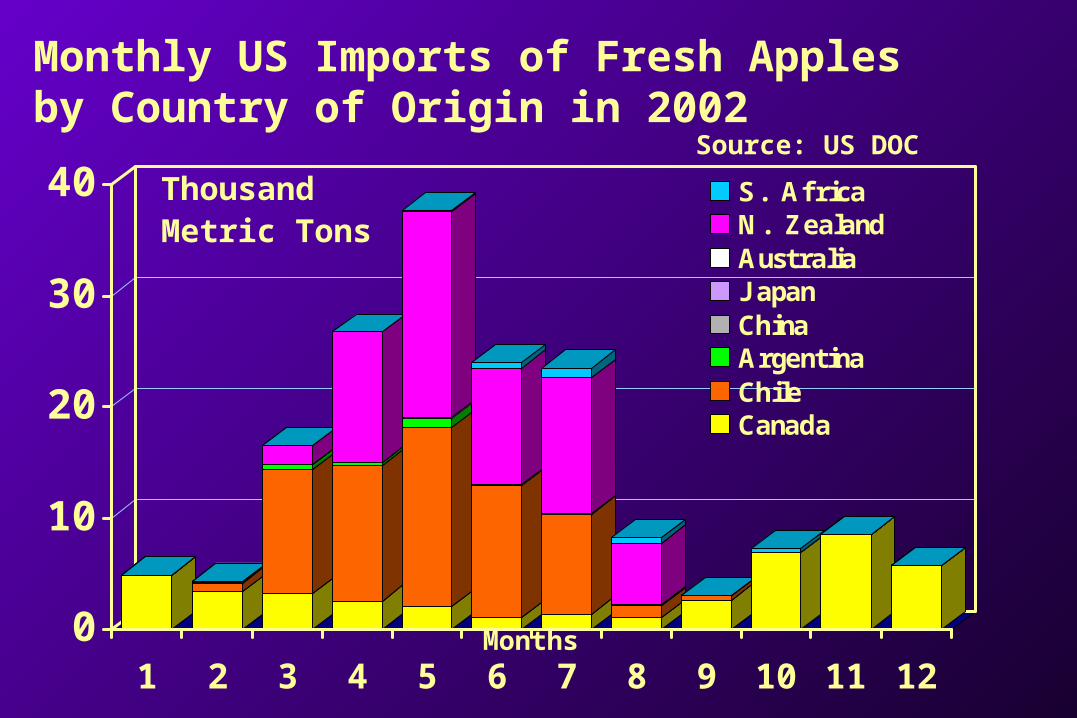
Monthly US Imports of Fresh Apples by Country of Origin in 2002
0
10
20
30
40
1 2 3 4 5 6 7 8 9 10 11 12
S. AfricaN. ZealandAustraliaJ apanChinaArgentinaChileCanada
Source: US DOC
Thousand Metric Tons
Months
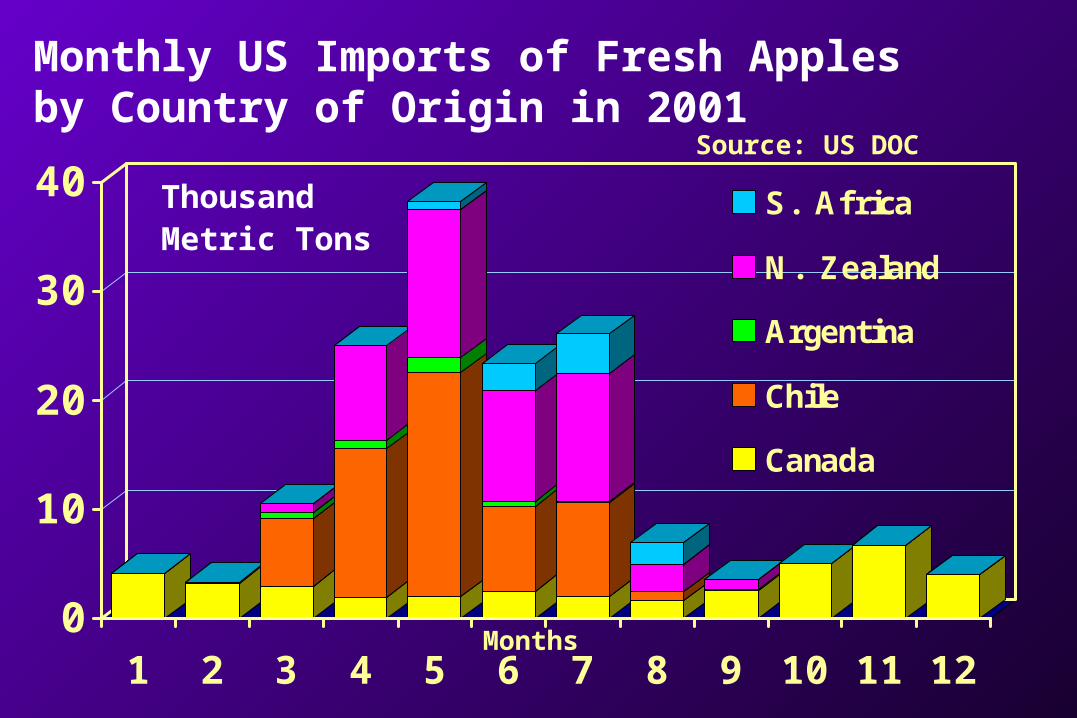
Monthly US Imports of Fresh Apples by Country of Origin in 2001
0
10
20
30
40
1 2 3 4 5 6 7 8 9 10 11 12
S. Africa
N. Zealand
Argentina
Chile
Canada
Source: US DOC
Thousand Metric Tons
Months

Monthly US Imports of Fresh Apples by Country of Origin in 2000
0
10
20
30
40
1 2 3 4 5 6 7 8 9 10 11 12
S. AfricaN. ZealandArgentinaUruguayBrazilChileCanada
Source: US DOC
Thousand Metric Tons
Months
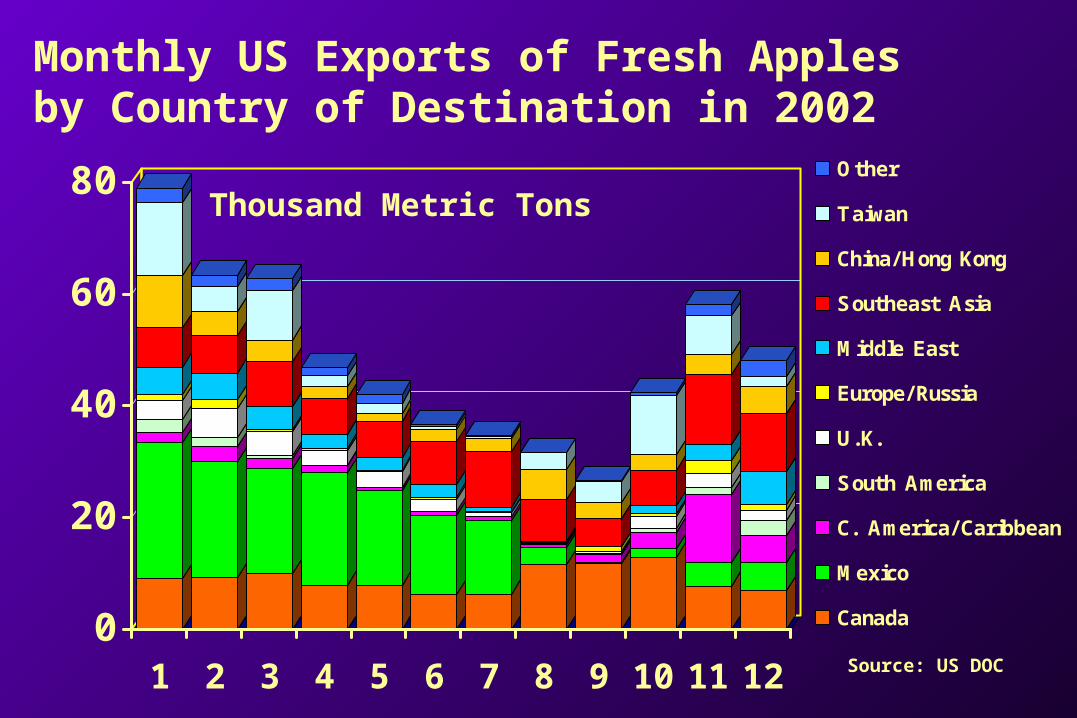
Monthly US Exports of Fresh Apples by Country of Destination in 2002
0
20
40
60
80
1 2 3 4 5 6 7 8 9 10 11 12
Other
Taiwan
China/Hong Kong
Southeast Asia
Middle East
Europe/Russia
U.K.
South America
C. America/Caribbean
Mexico
Canada
Source: US DOC
Thousand Metric Tons
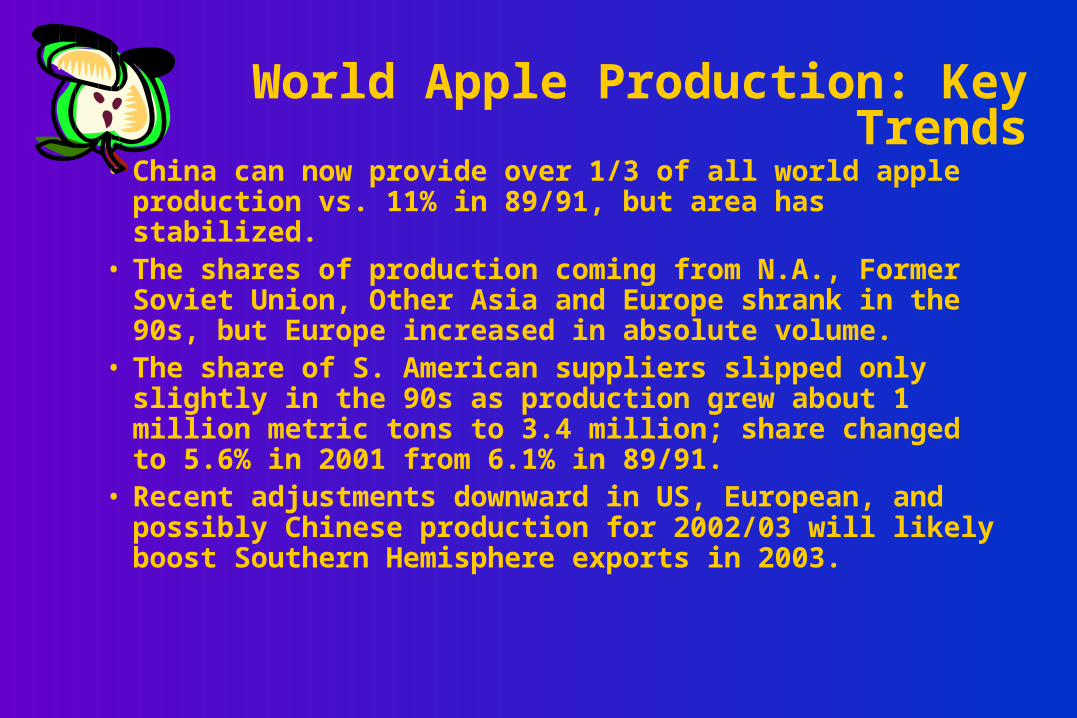
World Apple Production: Key Trends
• China can now provide over 1/3 of all world apple production vs. 11% in 89/91, but area has stabilized.
• The shares of production coming from N.A., Former Soviet Union, Other Asia and Europe shrank in the 90s, but Europe increased in absolute volume.
• The share of S. American suppliers slipped only slightly in the 90s as production grew about 1 million metric tons to 3.4 million; share changed to 5.6% in 2001 from 6.1% in 89/91.
• Recent adjustments downward in US, European, and possibly Chinese production for 2002/03 will likely boost Southern Hemisphere exports in 2003.
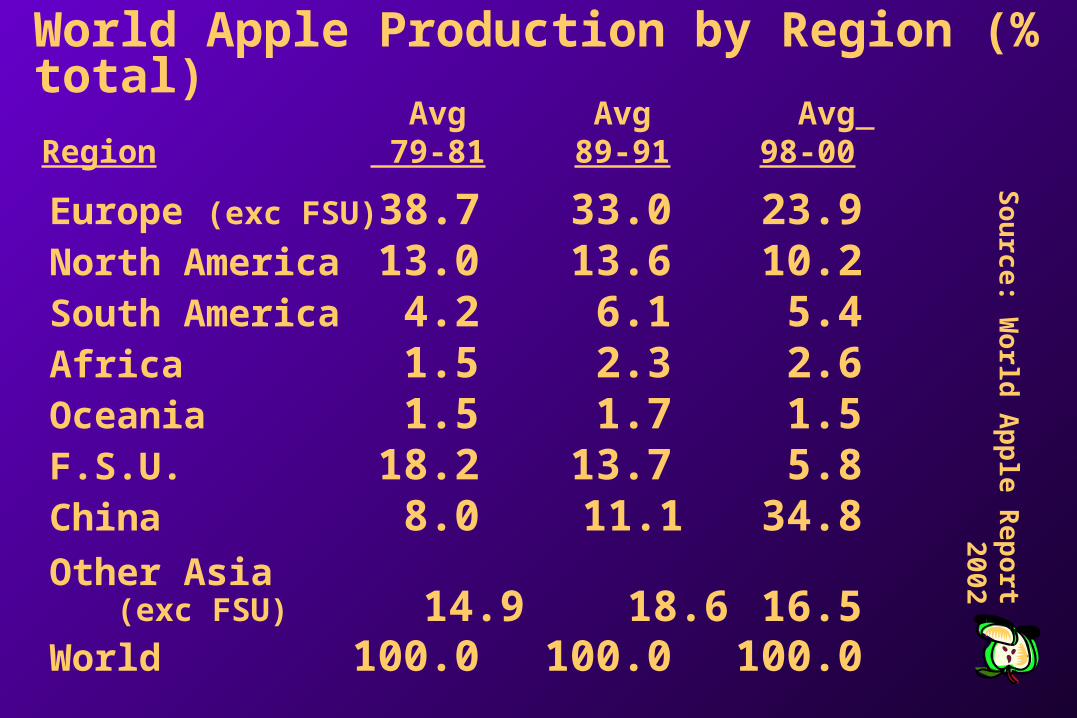
World Apple Production by Region (% total)
Sou
rce: W
orld
Ap
ple
Rep
ort
2002
Europe (exc FSU)38.7 33.0 23.9North America 13.0 13.6 10.2South America 4.2 6.1 5.4Africa 1.5 2.3 2.6Oceania 1.5 1.7 1.5F.S.U. 18.2 13.7 5.8China 8.0 11.1 34.8Other Asia (exc FSU) 14.9 18.6 16.5World 100.0 100.0 100.0
Avg Avg Avg Region 79-81 89-91 98-00
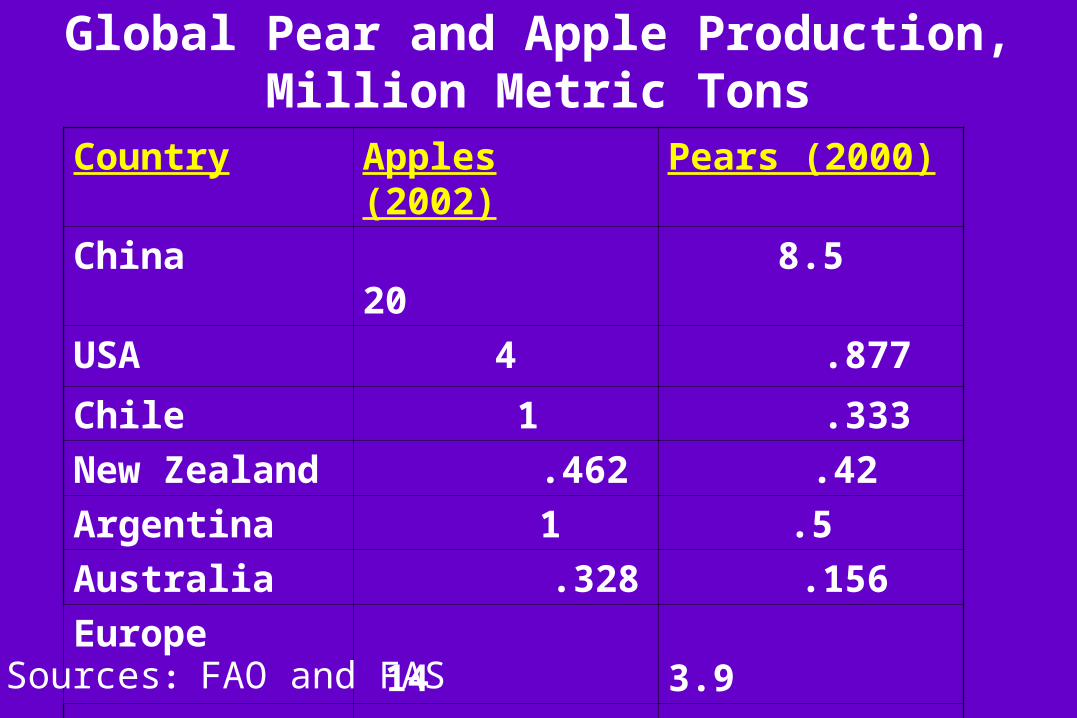
Global Pear and Apple Production, Million Metric Tons
Country Apples (2002) Pears (2000)
China 20 8.5
USA 4 .877
Chile 1 .333
New Zealand .462 .42
Argentina 1 .5
Australia .328 .156
Europe 14 3.9
World 60 16.9Sources: FAO and FAS

World Per Capita Fresh Apple Supplies 1990-2001, kilograms per person
0
4
8
12
16
20
90 91 92 93 94 95 96 97 98 99 00 01
China Rest of World
Production grew by 50% vs. 15% growthin world population.
Source: World Apple Review 2002

Source: FAS, USDA
Apples: Total Production & Net Fresh Production,in million metric tons, Key Selected Countries
0
10
20
30
40
50 South AfricaChileBrazilArgentinaAust/NZealandChinaOtherE. Eur/RussiaU.S.TurkeyJ apanFrance/GermanyBenelux
99/00... 00/01... 2002...
Fresh Fresh Fresh
TotalTotal
Total
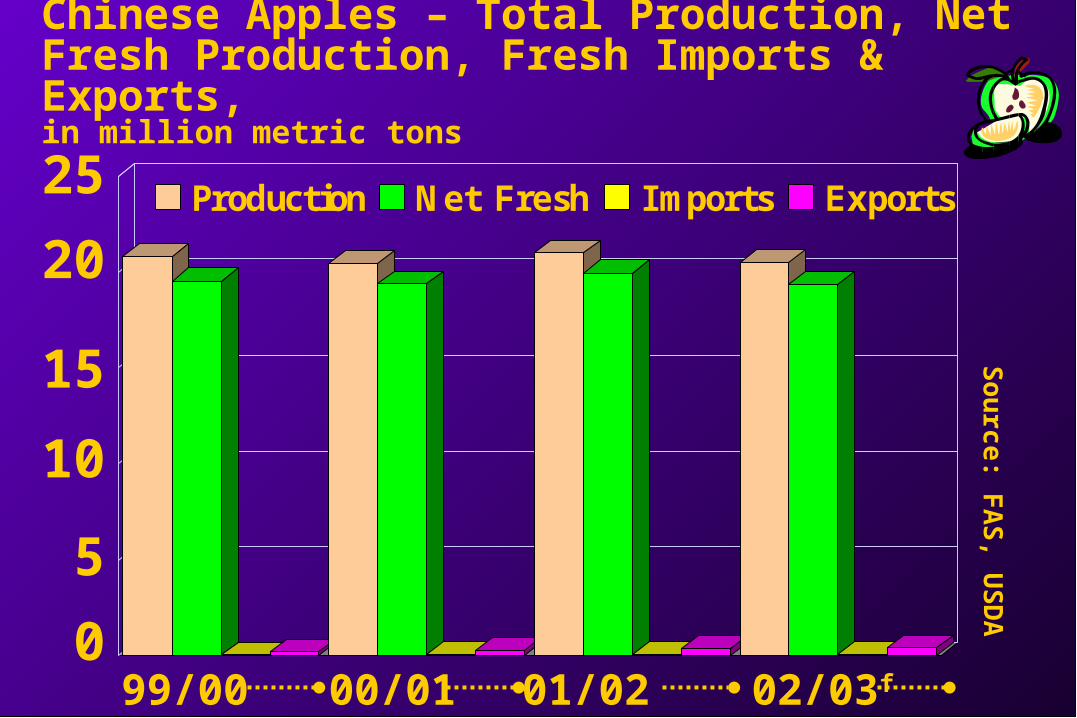
Chinese Apples – Total Production, Net Fresh Production, Fresh Imports & Exports,in million metric tons
Sou
rce: F
AS
, US
DA
25
20
15
10
5
0
99/00 00/01 01/02
Production Net Fresh Imports Exports
02/03f
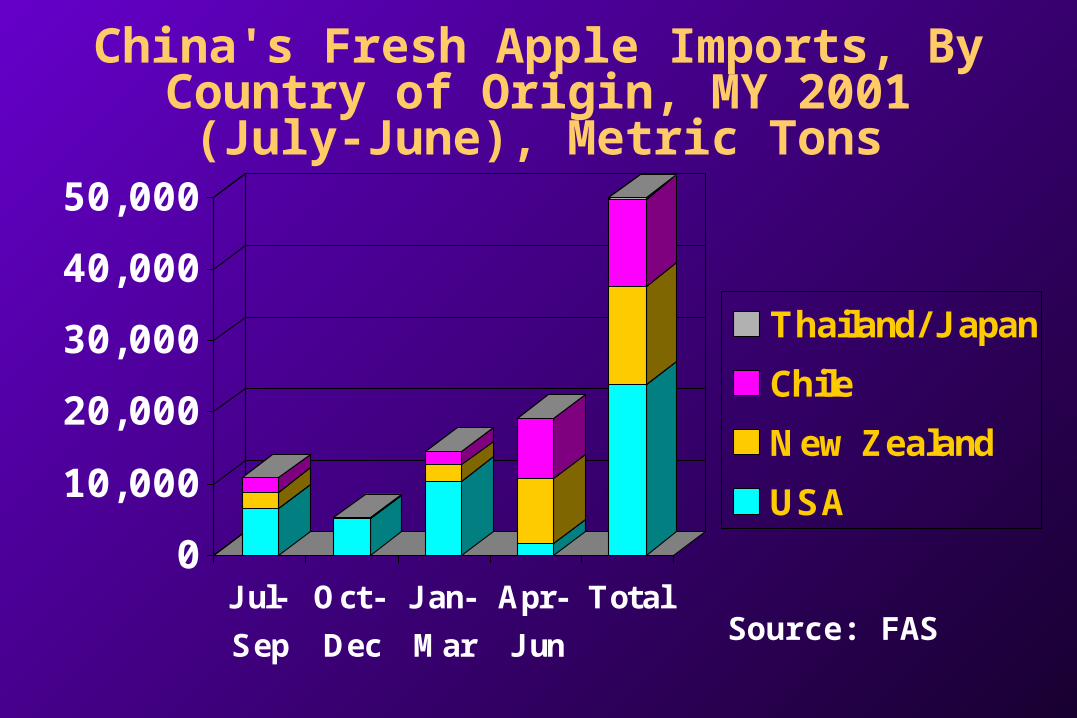
China's Fresh Apple Imports, By Country of Origin, MY 2001 (July-June),
Metric Tons
0
10,000
20,000
30,000
40,000
50,000
J ul-
Sep
Oct-
Dec
J an-
Mar
Apr-
J un
Total
Thailand/ J apan
Chile
New Zealand
USA
Source: FAS

N. Hemisphere Net Fresh Apple Production, Key Countries Excluding China,in million metric tons181512
9
6
30
Other
Russian Fed.
U.S.
Turkey
J apan
France/Germany
Benelux
99/00 00/01 01/02 02/03f Source: FAS, USDA

Southern Hemisphere Big Six: Long-term Upward Trend Broken
metr
ic t
on
s
0
1,000
2,000
3,000
4,000
5,000
90 92 94 96 98 '00 '02
Source: World Apple Review 2002 and FAS for 2001 and 2002, updated in 2003

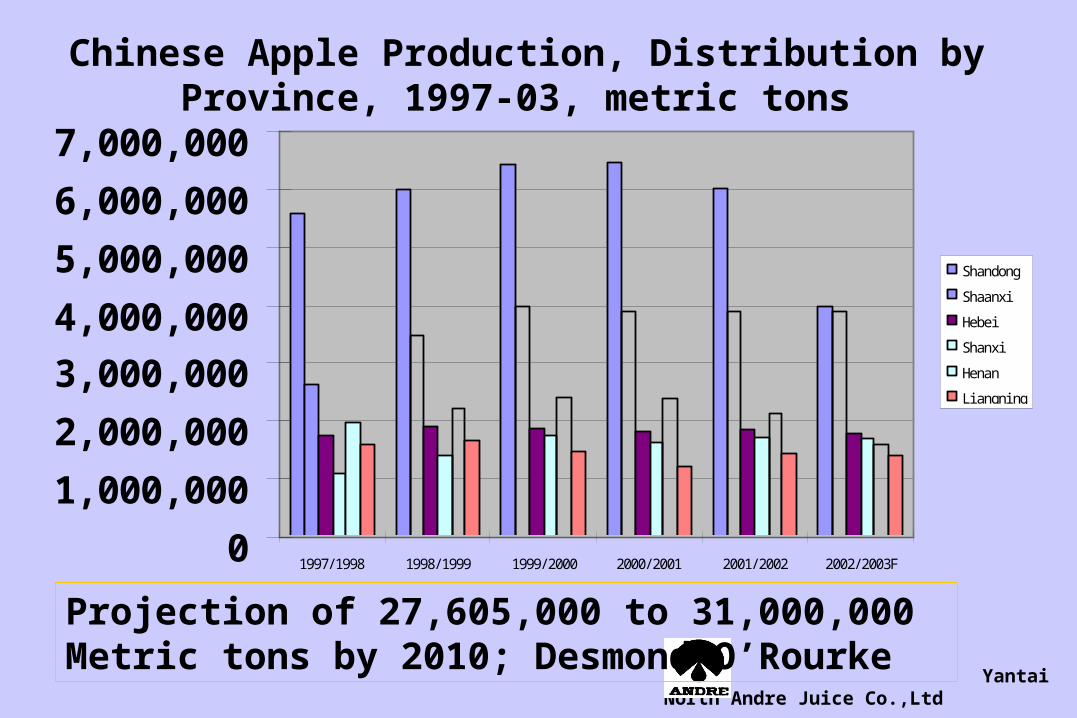
0
5000000
10000000
15000000
20000000
25000000
1997/ 1998 1998/ 1999 1999/ 2000 2000/ 2001 2001/ 2002 2002/ 2003F
Total Crop.
Yantai North Andre Juice Co.,Ltd
Apple Production in China, 1997-03, Metric Tons
Area in 2000 of 2,254,100 hectares vs. 2,986,900 in 1996. 50% are Fujis,12-15% are Red Delicious.

Yantai North Andre Juice Co.,Ltd
Guo Guang Fuji
APPLE PRICES IN CHINA
Yantai North Andre Juice Co.,Ltd
0
1, 000, 000
2, 000, 000
3, 000, 000
4, 000, 000
5, 000, 000
6, 000, 000
7, 000, 000
1997/ 1998 1998/ 1999 1999/ 2000 2000/ 2001 2001/ 2002 2002/ 2003F
Shandong
Shaanxi
Hebei
Shanxi
Henan
Li angni ng
Chinese Apple Production, Distribution by Province, 1997-03, metric tons
Projection of 27,605,000 to 31,000,000 Metric tons by 2010; Desmond O’Rourke
Yantai North Andre Juice Co.,Ltd
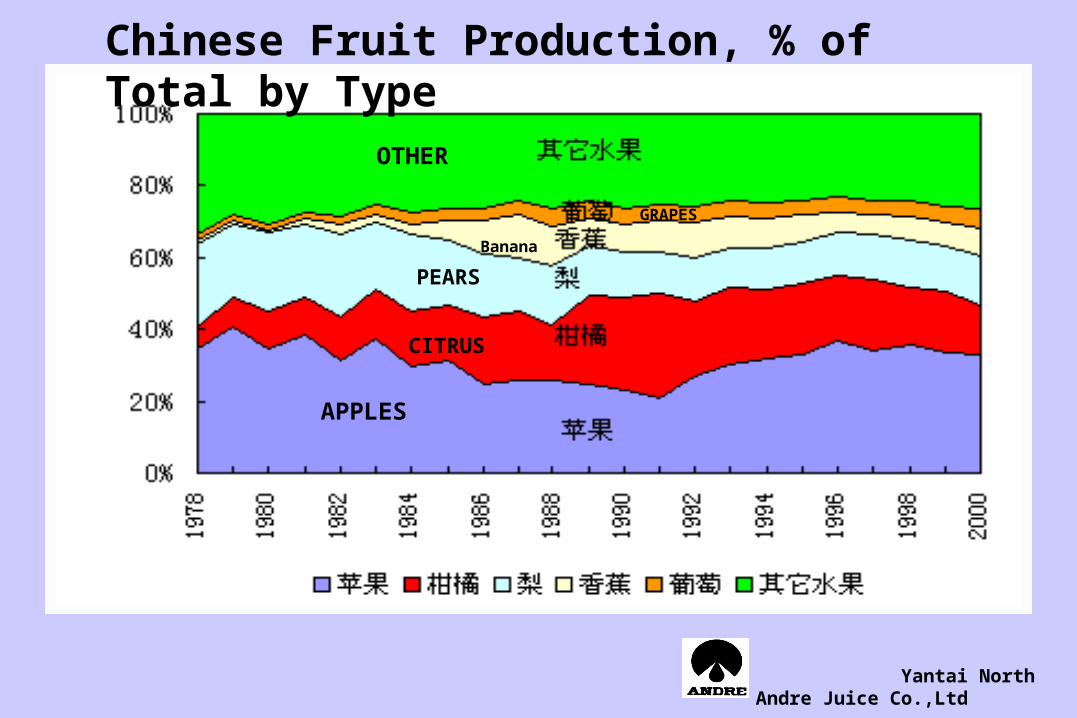
OTHER
APPLES
CITRUS
PEARS
Banana
GRAPES
Chinese Fruit Production, % of Total by Type
Yantai North Andre Juice Co.,Ltd
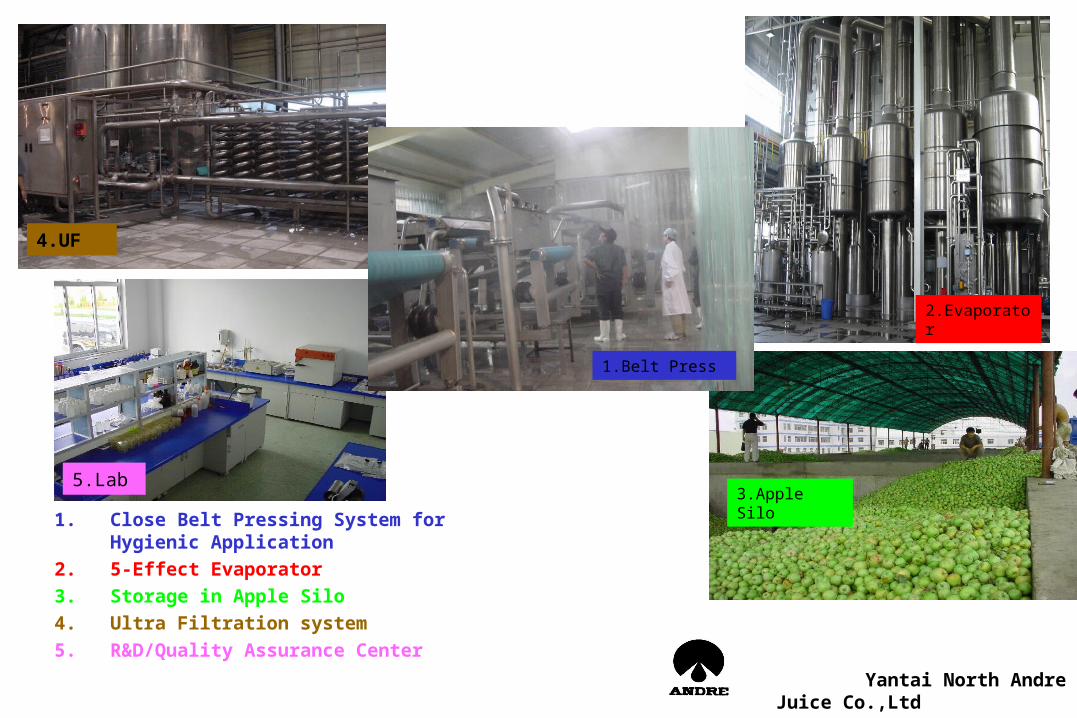
1. Close Belt Pressing System for Hygienic Application
2. 5-Effect Evaporator
3. Storage in Apple Silo
4. Ultra Filtration system
5. R&D/Quality Assurance Center
2.Evaporator
3.Apple Silo
4.UF
5.Lab
1.Belt Press
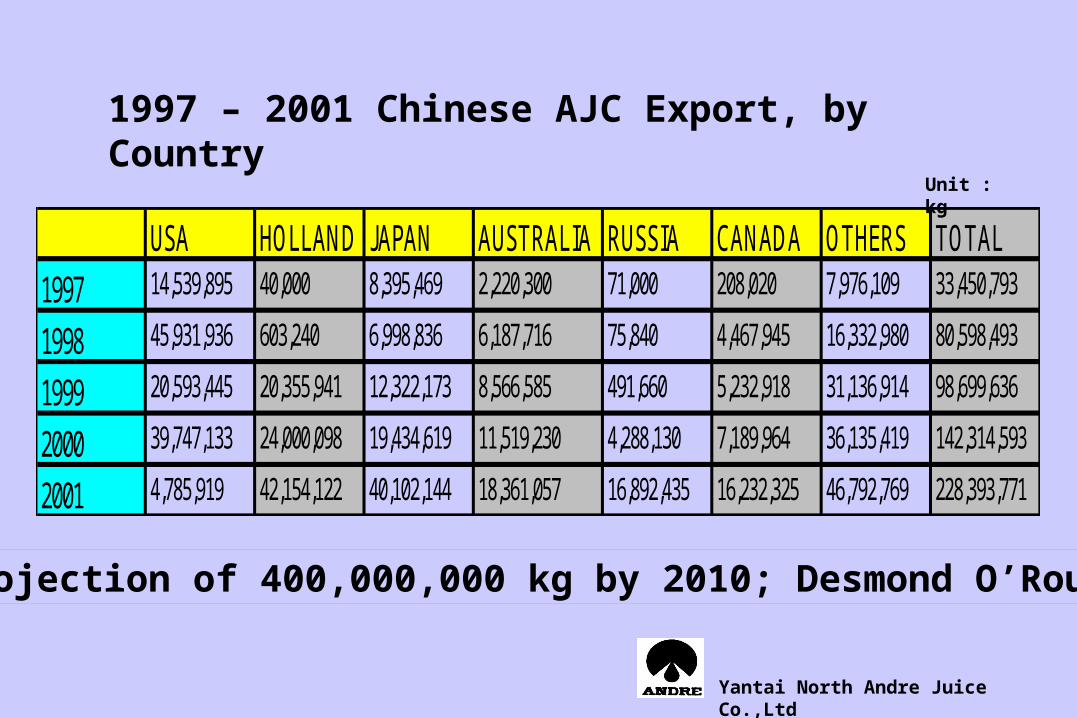
USA HOLLAND JAPAN AUSTRALIA RUSSIA CANADA OTHERS TOTAL
1997 14,539,895 40,000 8,395,469 2,220,300 71,000 208,020 7,976,109 33,450,793
1998 45,931,936 603,240 6,998,836 6,187,716 75,840 4,467,945 16,332,980 80,598,493
1999 20,593,445 20,355,941 12,322,173 8,566,585 491,660 5,232,918 31,136,914 98,699,636
2000 39,747,133 24,000,098 19,434,619 11,519,230 4,288,130 7,189,964 36,135,419 142,314,593
2001 4,785,919 42,154,122 40,102,144 18,361,057 16,892,435 16,232,325 46,792,769 228,393,771
1997 – 2001 Chinese AJC Export, by Country
Unit : kg
Yantai North Andre Juice Co.,Ltd
Projection of 400,000,000 kg by 2010; Desmond O’Rourke
0
500
1,000
1,500
1997 1998 1999 2000 2001
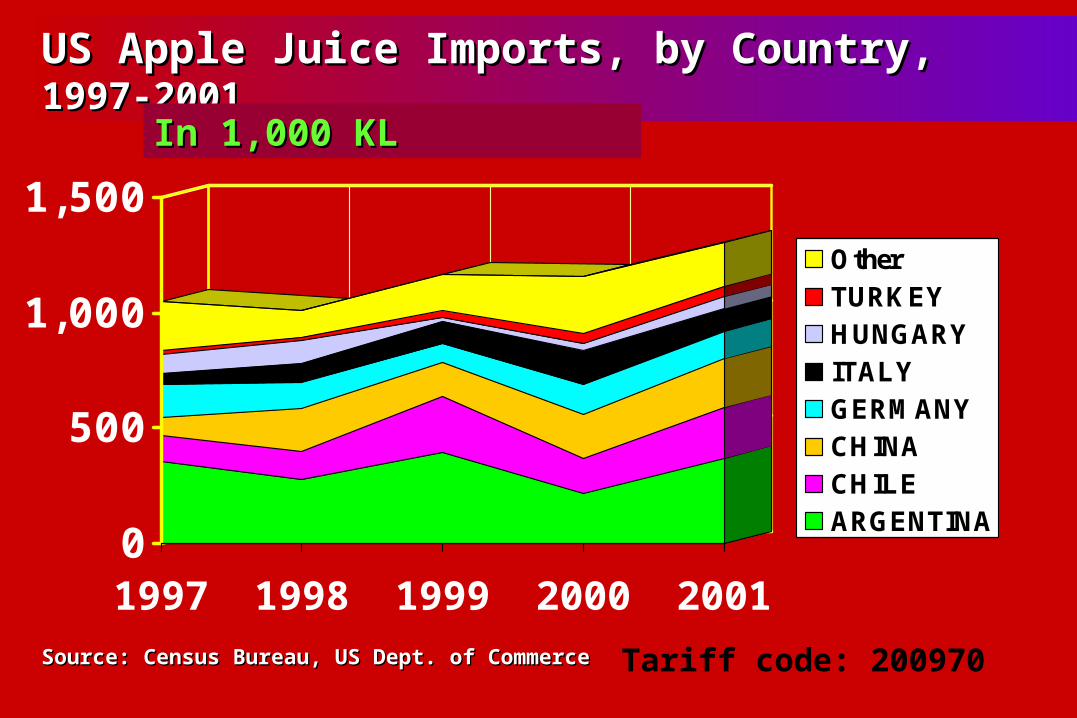
OtherTURKEYHUNGARYITALYGERMANYCHINACHILEARGENTINA
US Apple Juice Imports, by Country, US Apple Juice Imports, by Country, 1997-1997-20012001
In 1,000 KLIn 1,000 KL
Source: Census Bureau, US Dept. of Source: Census Bureau, US Dept. of CommerceCommerce
Tariff code: 200970
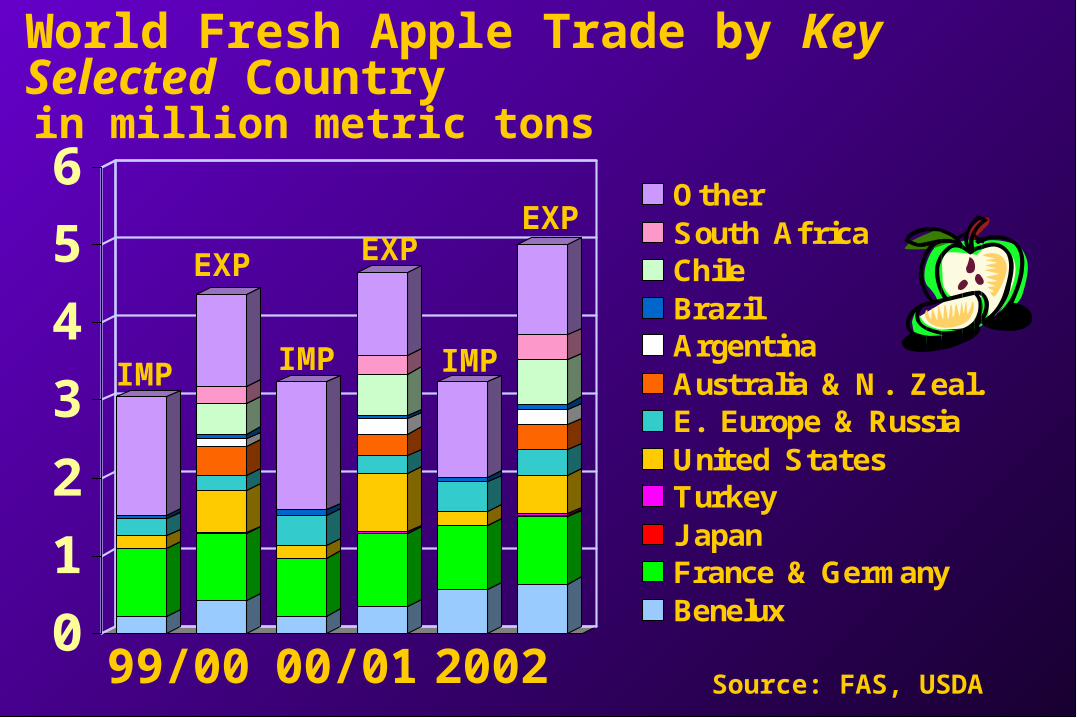
World Fresh Apple Trade by Key Selected Country
Source: FAS, USDA
0
1
2
3
4
5
6OtherSouth AfricaChileBrazilArgentinaAustralia & N. Zeal.E. Europe & RussiaUnited StatesTurkeyJ apanFrance & GermanyBenelux
99/00 00/01 2002
in million metric tons
IMP IMP IMP
EXP EXP EXP

Chilean Apple Exports: Changes in Market Share by Destination
Europe 46% 35% 32% 32%
U.S.A. 7% 8% 12% 12%
L. America & Caribbean19% 37% 36% 39%
Other 28% 20% 19% 18%
Grand Total 100% 100% 100% 100%
Source: Chilean Fruit Exporter's Association
Country 92-93 97-98 00-01 01-02
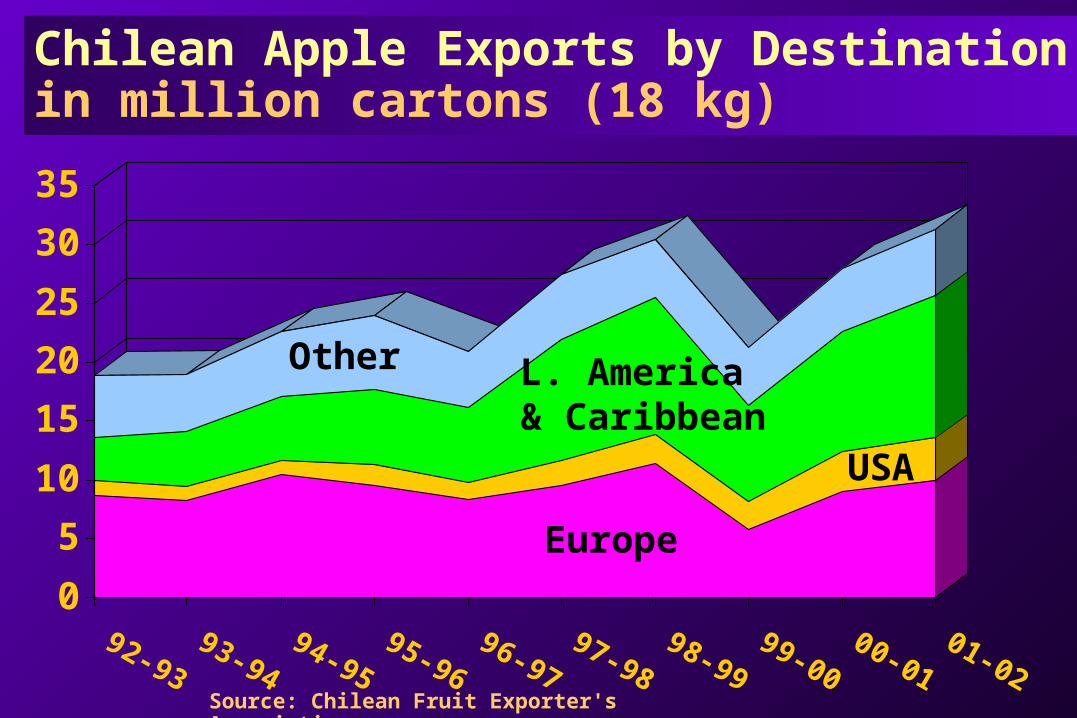
Chilean Apple Exports by Destinationin million cartons (18 kg)
0
5
10
15
20
25
30
35
92- 9393- 94
94- 9595- 96
96- 9797- 98
98- 9999- 00
00- 0101- 02
Europe
Other L. America & Caribbean
USA
Source: Chilean Fruit Exporter's Association
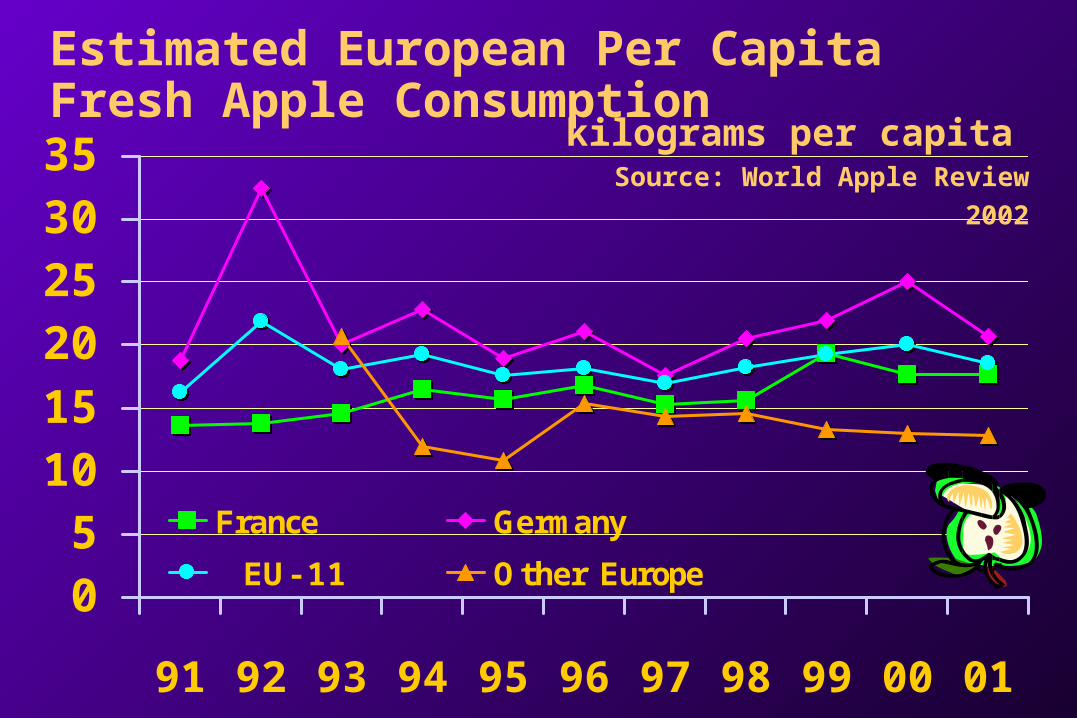
Estimated European Per Capita Fresh Apple Consumption
05
101520253035
91 92 93 94 95 96 97 98 99 00 01
France Germany
EU- 11 Other Europe
kilograms per capita
Source: World Apple Review 2002
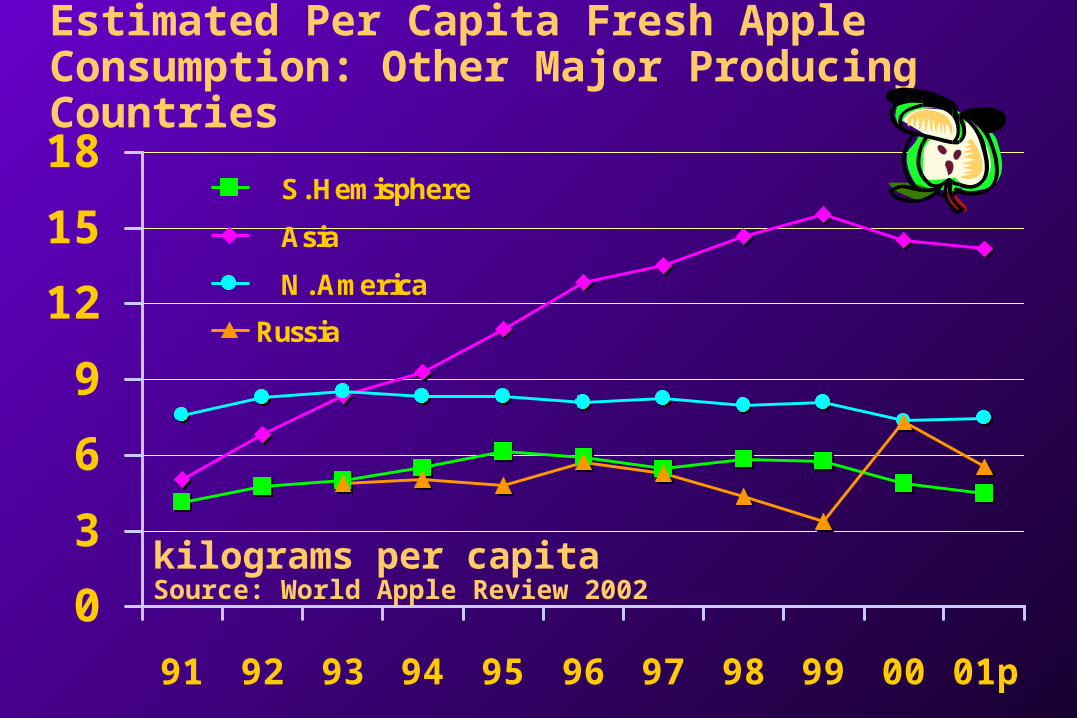
Estimated Per Capita Fresh Apple Consumption: Other Major Producing Countries
0
3
6
9
12
15
18
91 92 93 94 95 96 97 98 99 00 01p
S.Hemisphere
Asia
N.America
Russia
kilograms per capita Source: World Apple Review 2002
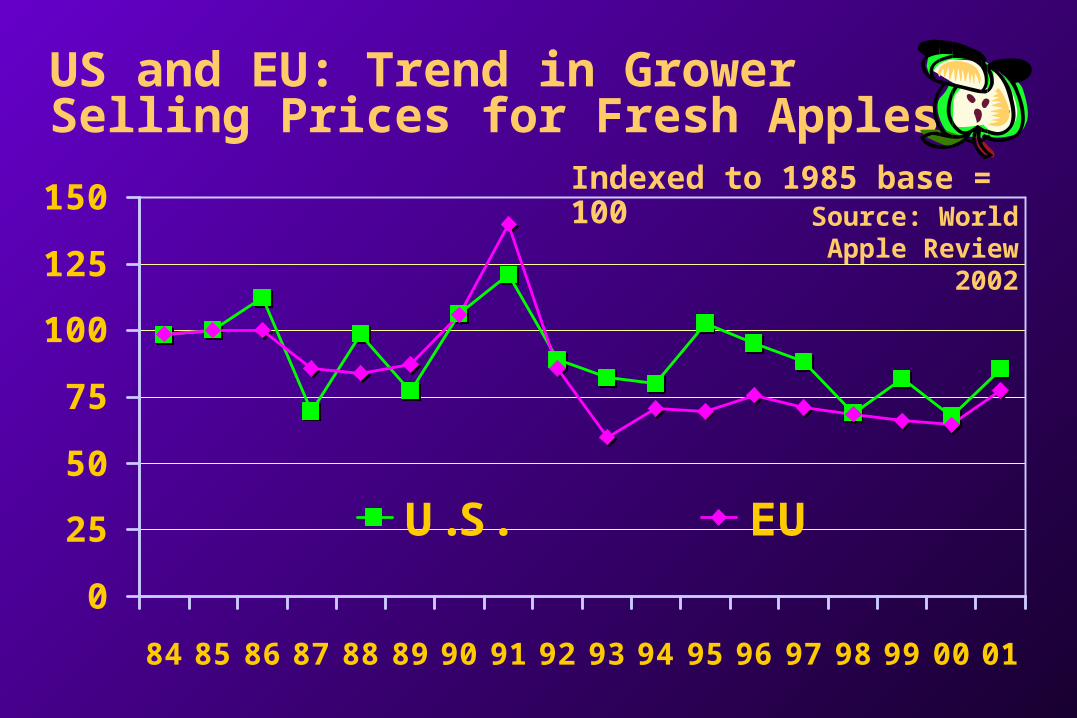
US and EU: Trend in Grower Selling Prices for Fresh Apples
0
25
50
75
100
125
150
84 85 86 87 88 89 90 91 92 93 94 95 96 97 98 99 00 01
U.S. EU
Source: World Apple Review
2002
Indexed to 1985 base = 100

United States: Annual Average Retail Price of Fresh Red Delicious Apples 1980-2001
0102030405060708090
100
80 82 84 86 88 90 92 94 96 98 00
Actual Deflated
cents/lb - current & deflatedSource: World Apple Review 2002

Farm value 19¢Marketing bill 81¢
19¢
Other costs - 4.0¢
Business taxes - 3.5¢
Repairs - 1.5¢
Interest - 2.5¢
Rent - 4.0¢
Depreciation – 3.5¢
Advertising - 4.0¢
Profits - 4.5¢
Energy - 3.5¢
Transportation - 4.0¢
Packaging - 8.0¢
Source: ERS/USDA
Labor - 38¢
WHAT a DOLLAR SPENT for FOOD PAID FOR in 2000 in the USA
0
25
50
75
100
125
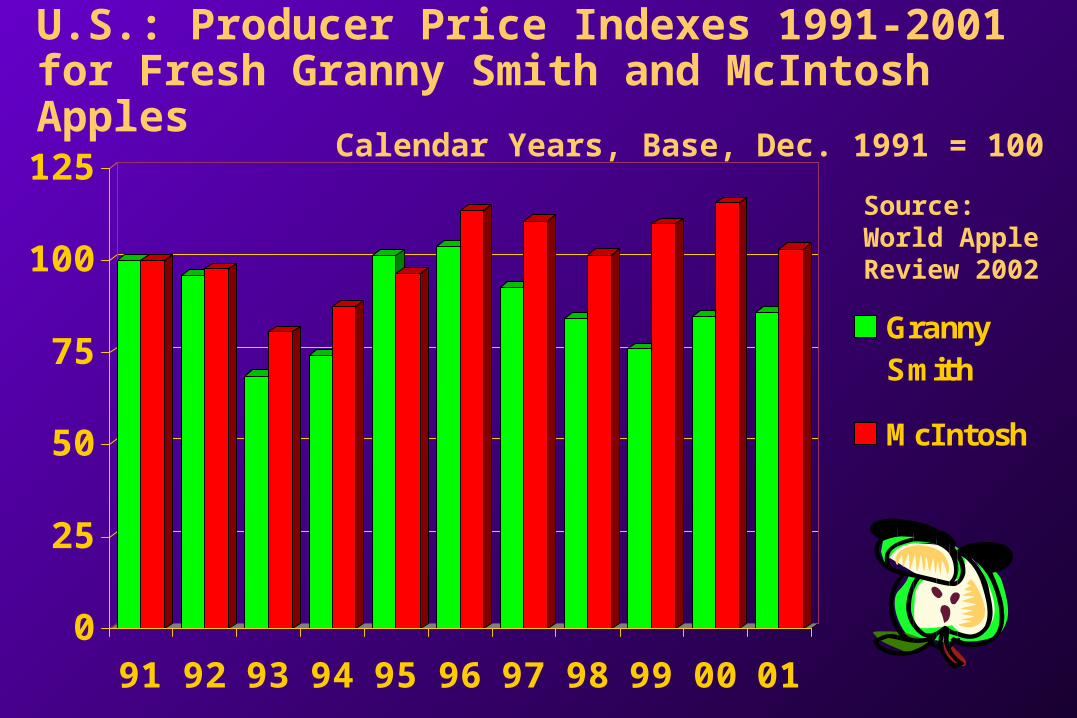
91 92 93 94 95 96 97 98 99 00 01
GrannySmith
McIntosh
U.S.: Producer Price Indexes 1991-2001 for Fresh Granny Smith and McIntosh Apples
Calendar Years, Base, Dec. 1991 = 100
Source: World Apple Review 2002
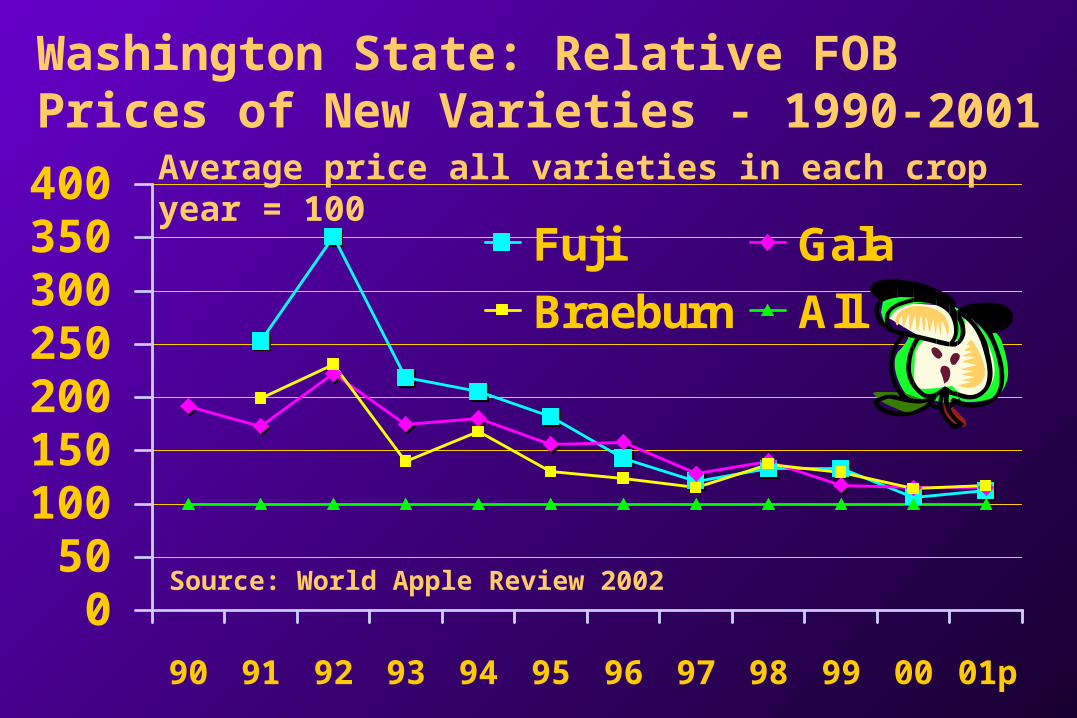
Washington State: Relative FOB Prices of New Varieties - 1990-2001
050
100150200250300350400
90 91 92 93 94 95 96 97 98 99 00 01p
Fuji Gala
Braeburn All
Average price all varieties in each crop year = 100
Source: World Apple Review 2002
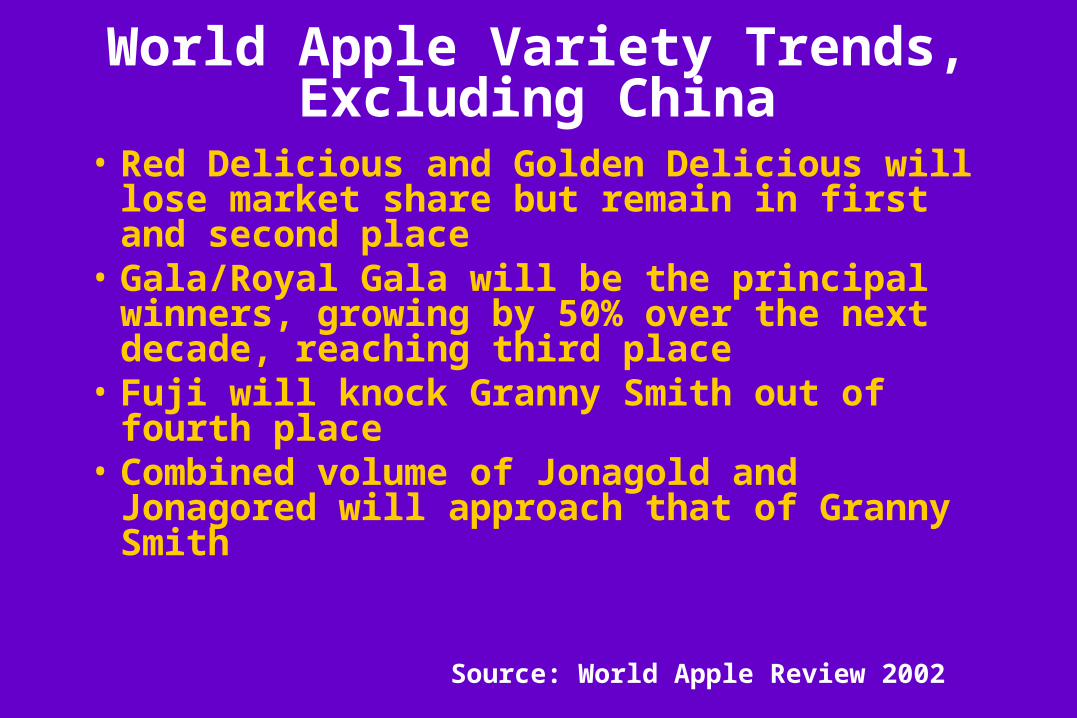
World Apple Variety Trends, Excluding China
• Red Delicious and Golden Delicious will lose market share but remain in first and second place
• Gala/Royal Gala will be the principal winners, growing by 50% over the next decade, reaching third place
• Fuji will knock Granny Smith out of fourth place
• Combined volume of Jonagold and Jonagored will approach that of Granny Smith
Source: World Apple Review 2002

World Apple Variety Trends, Excluding China
• Idared keeps growing, especially in Eastern Europe
• Braeburn follows in 8th place• McIntosh, Elstar, Cortland, Cox’s Orange and
Empire will be stable• Pink Lady production will triple between
2000 and 2010, but it won’t surpass 1% of production in the principal producing countries
• Other growth varieties: Cameo, Honeycrisp, Pacific Rose, Fiesta and Sundowner
Source: World Apple Review 2002

France: Apple export destinations & volumes, 1998 & 2000, 1000 metric tons
0 50 100 150 200 250
Former USSR
Germany/Austria
Scandinavia
Other
Benelux
Spain/Portugal
UK/ I reland
light = 1998dark = 2000
Totals:1998 - 766,207 tons2000 – 847,833 tons
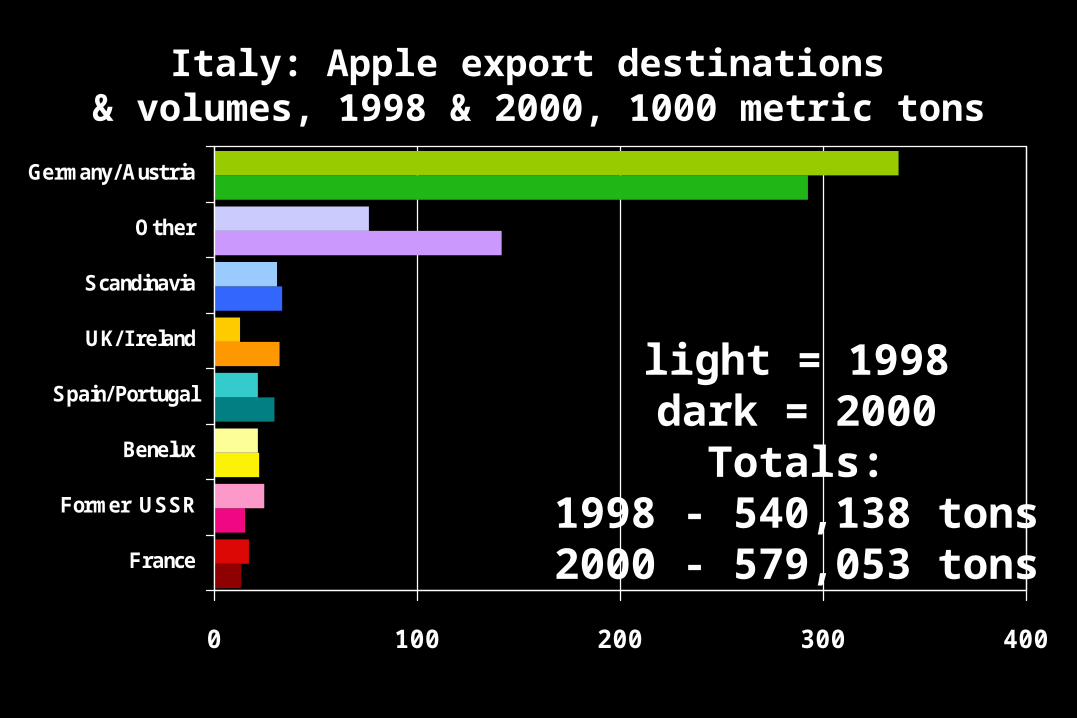
Italy: Apple export destinations & volumes, 1998 & 2000, 1000 metric tons
0 100 200 300 400
France
Former USSR
Benelux
Spain/Portugal
UK/I reland
Scandinavia
Other
Germany/Austria
light = 1998dark = 2000
Totals:1998 - 540,138 tons2000 - 579,053 tons

Netherlands: Apple export destinations & volumes, 1998 & 2000, 1000 metric tons
0 50 100 150 200
Spain/Portugal
France
Benelux
Other
UK/I reland
Scandinavia
Former USSR
Germany/Austria
light = 1998dark = 2000
Totals:1998 - 376,870 tons2000 – 294,356 tons
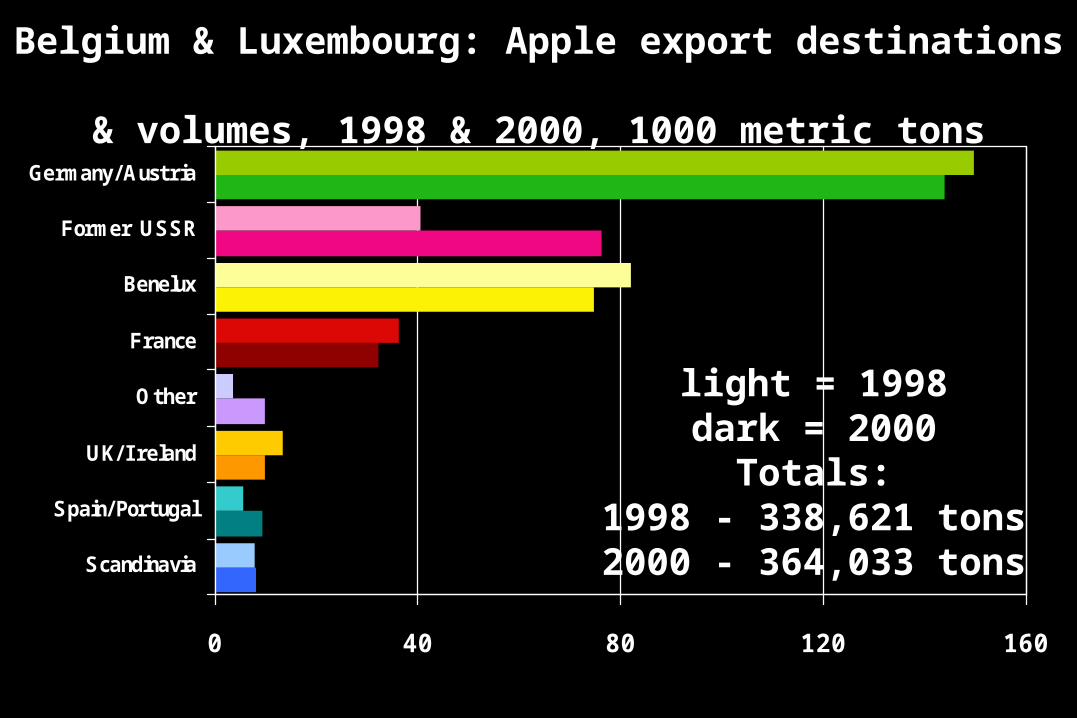
Belgium & Luxembourg: Apple export destinations
& volumes, 1998 & 2000, 1000 metric tons
0 40 80 120 160
Scandinavia
Spain/Portugal
UK/I reland
Other
France
Benelux
Former USSR
Germany/Austria
light = 1998dark = 2000
Totals:1998 - 338,621 tons2000 - 364,033 tons

1 Supercenters U.S. $217.80 40%
2 Carrefour/Promodès France $62.29 71%
3 Holland $59.70 92%
4 U.S. $50.10 91%
5 Germany/Switz. $44.37 50%
6 U.S. $38.30 90%
7 Kmart U.S. $34.62 37%
8 Safeway U.S. $34.30 92%
TOP 2001 GLOBAL FOOD RETAILERS sales % grocery
rank sales company ($ billion) sales
30 grocery retailers account for 10% of global food retail sales.
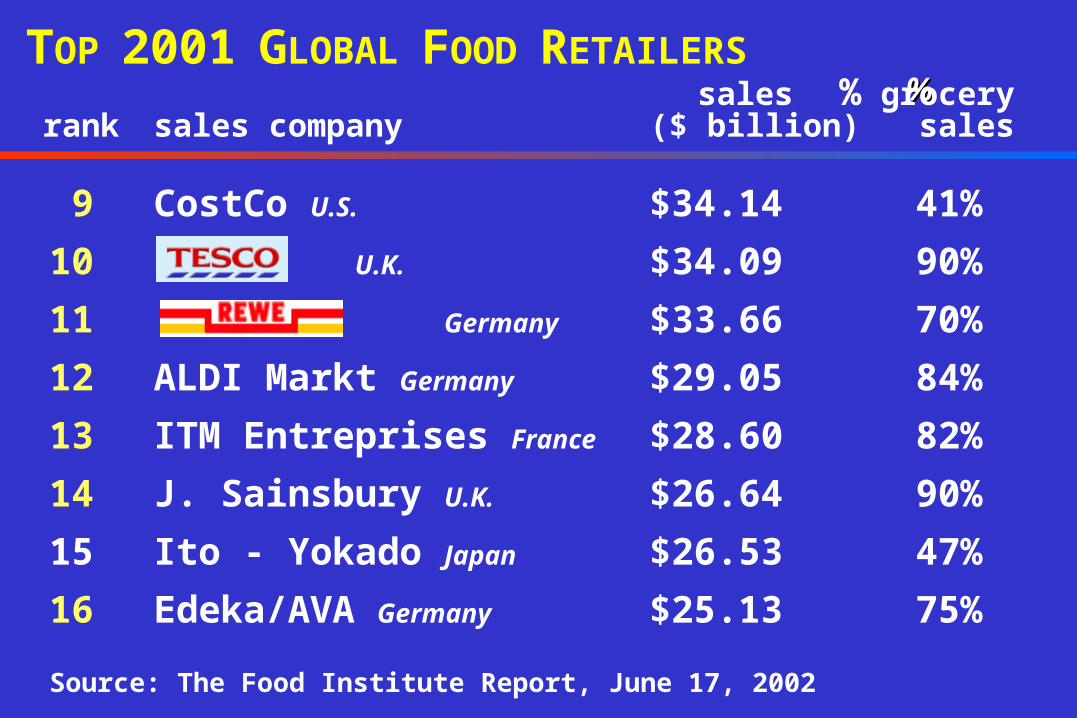
9 CostCo U.S. $34.14 41%
10 U.K. $34.09 90%
11 Germany $33.66 70%
12 ALDI Markt Germany $29.05 84%
13 ITM Entreprises France $28.60 82%
14 J. Sainsbury U.K. $26.64 90%
15 Ito - Yokado Japan $26.53 47%
16 Edeka/AVA Germany $25.13 75%
%%TOP 2001 GLOBAL FOOD RETAILERS
sales % groceryrank sales company ($ billion) sales
Source: The Food Institute Report, June 17, 2002
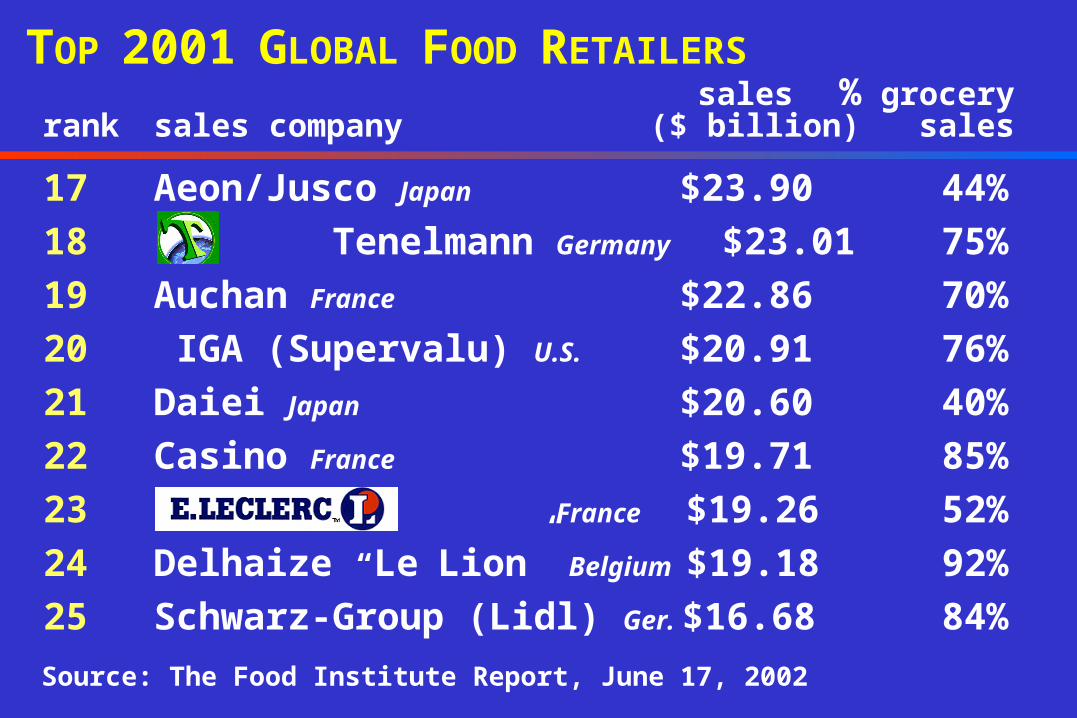
17 Aeon/Jusco Japan $23.90 44%
18 Tenelmann Germany $23.01 75%
19 Auchan France $22.86 70%
20 IGA (Supervalu) U.S. $20.91 76%
21 Daiei Japan $20.60 40%
22 Casino France $19.71 85%
23 E. Leclerc France $19.26 52%
24 Delhaize “Le Lion” Belgium $19.18 92%
25 Schwarz-Group (Lidl) Ger. $16.68 84%
TOP 2001 GLOBAL FOOD RETAILERS sales % grocery
rank sales company ($ billion) sales
Source: The Food Institute Report, June 17, 2002

Building Retail Partnerships
Effective TacticsShopper Savvy
Loyalty Card Better Systems
Results-driven Tracking Focus
Dept. ProfitabilityStrategic Approach
Category DevelopmentBest PracticesStore-level ResearchPurchase TriggersConsumer DriversLong view
Fact-based Selling Innovative
Marketing/ Merchandising
Efficient Practices “Category” vs.
“Item” Perspective
Retailer/ Wholesaler Grower/Shipper Boards/Commissions
• Roles and Responsibilities
Source: Adapted from The Perishables Group