Embed Size (px)
Citation preview
Marketing food environment and food consumption in children:
Moderation by food-related psychosocial factors
Catherine Paquet, University of South Australia
Luc de Montigny, de Montigny Consulting
David Buckeridge, McGill University
Alice Labban, Pepperdine University
Uku Vainik, McGill University
Vinita Akula, McGill University
Melissa Iskandar, McGill University
Yu Ma, University of Alberta
Laurette Dubé, McGill University
Food environment and diet/weight outcomes
• Emphasis on local accessibility/availability of food outlets (e.g. fast food restaurants, supermarkets) with limited attention to other drivers of food-related purchasing behaviour.
• Lack of attention to individual differences that may be explaining different levels of responsiveness to local food environment (beyond socio-demographic factors).
2
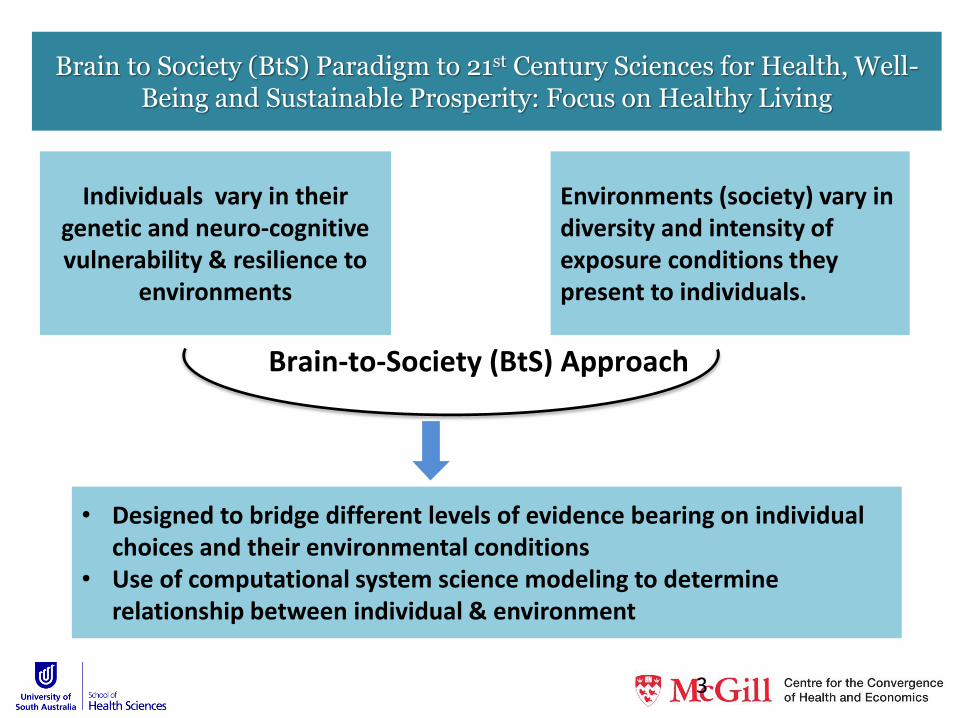
Brain-to-Society (BtS) Approach
Individuals vary in their genetic and neuro-cognitive vulnerability & resilience to
environments
Environments (society) vary in diversity and intensity of exposure conditions they present to individuals.
• Designed to bridge different levels of evidence bearing on individual choices and their environmental conditions
• Use of computational system science modeling to determine relationship between individual & environment
3
Brain to Society (BtS) Paradigm to 21st Century Sciences for Health, Well-Being and Sustainable Prosperity: Focus on Healthy Living

Responsiveness to food cues and rewards
4
• Sensitivity to reward moderate the effect of food environment (Paquet et al, AJCN, 2010).
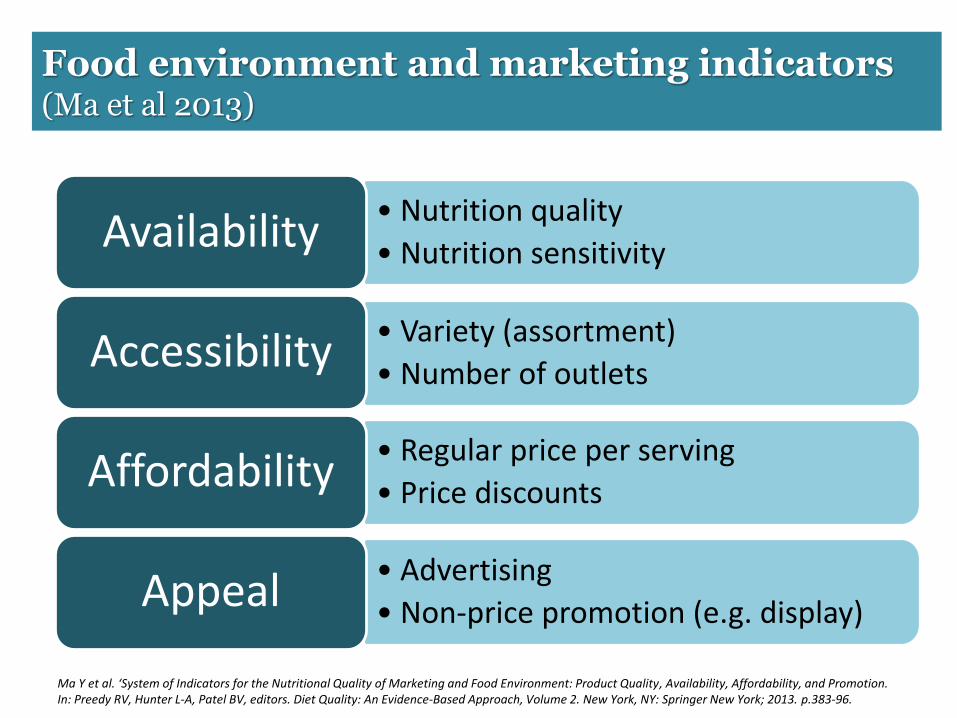
• Nutrition quality
• Nutrition sensitivityAvailability
• Variety (assortment)
• Number of outletsAccessibility
• Regular price per serving
• Price discountsAffordability
• Advertising
• Non-price promotion (e.g. display)Appeal
Food environment and marketing indicators(Ma et al 2013)
Ma Y et al. ‘System of Indicators for the Nutritional Quality of Marketing and Food Environment: Product Quality, Availability, Affordability, and Promotion. In: Preedy RV, Hunter L-A, Patel BV, editors. Diet Quality: An Evidence-Based Approach, Volume 2. New York, NY: Springer New York; 2013. p.383-96.
Aim
To investigate psychosocial factors that could help identify children who are more likely to be
influenced by food marketing strategies.
6
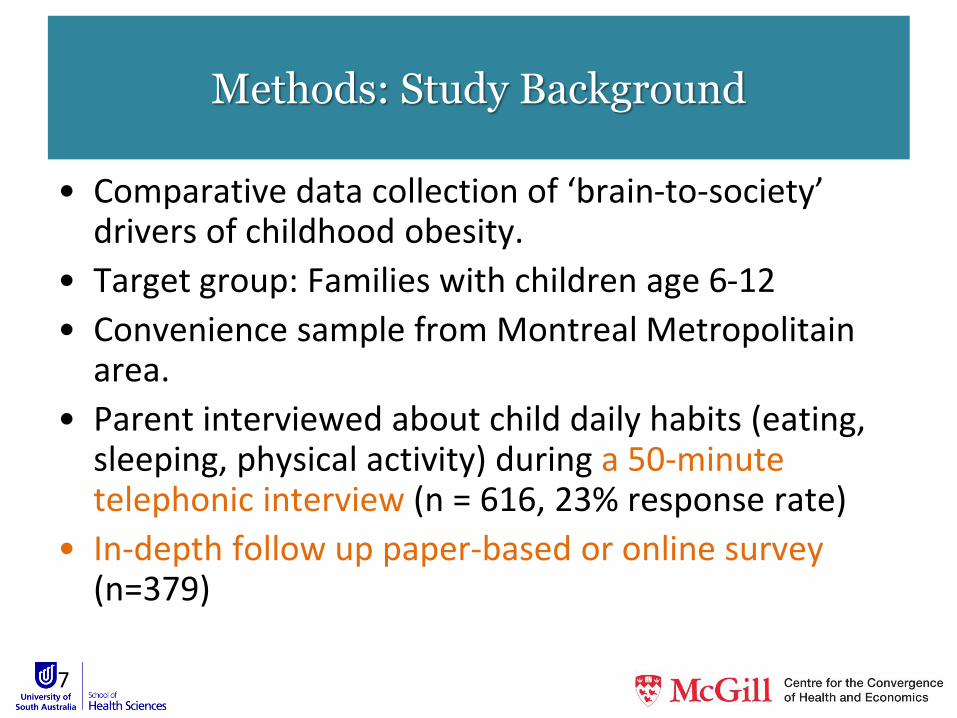
Methods: Study Background
7
• Comparative data collection of ‘brain-to-society’ drivers of childhood obesity.
• Target group: Families with children age 6-12
• Convenience sample from Montreal Metropolitainarea.
• Parent interviewed about child daily habits (eating, sleeping, physical activity) during a 50-minute telephonic interview (n = 616, 23% response rate)
• In-depth follow up paper-based or online survey (n=379)
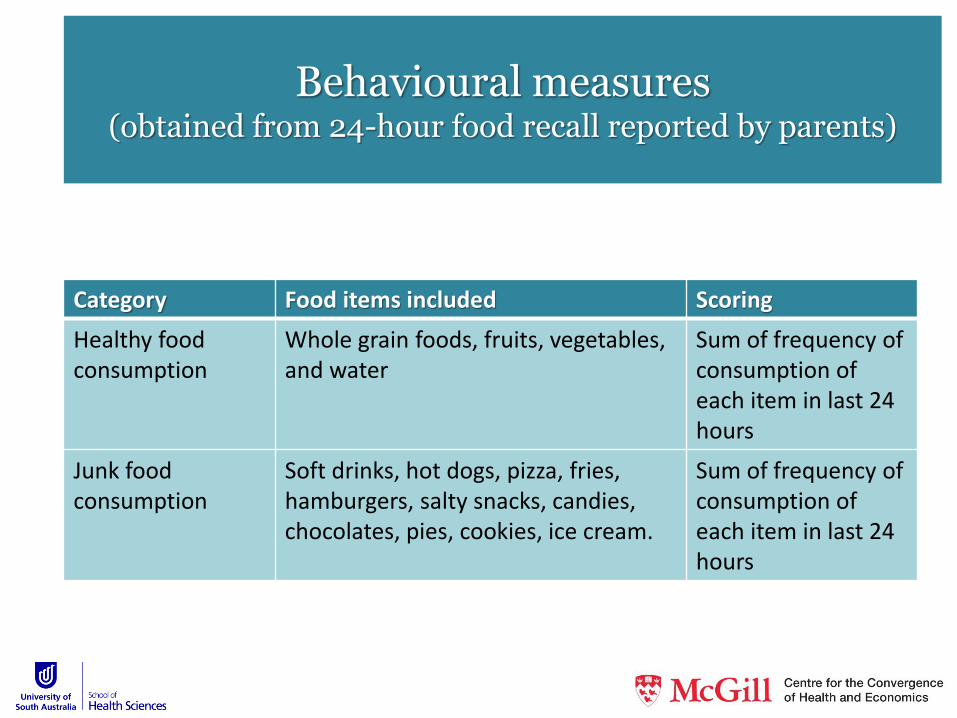
Behavioural measures(obtained from 24-hour food recall reported by parents)
Category Food items included Scoring
Healthy food consumption
Whole grain foods, fruits, vegetables, and water
Sum of frequency of consumption of each item in last 24 hours
Junk food consumption
Soft drinks, hot dogs, pizza, fries, hamburgers, salty snacks, candies, chocolates, pies, cookies, ice cream.
Sum of frequency of consumption of each item in last 24 hours
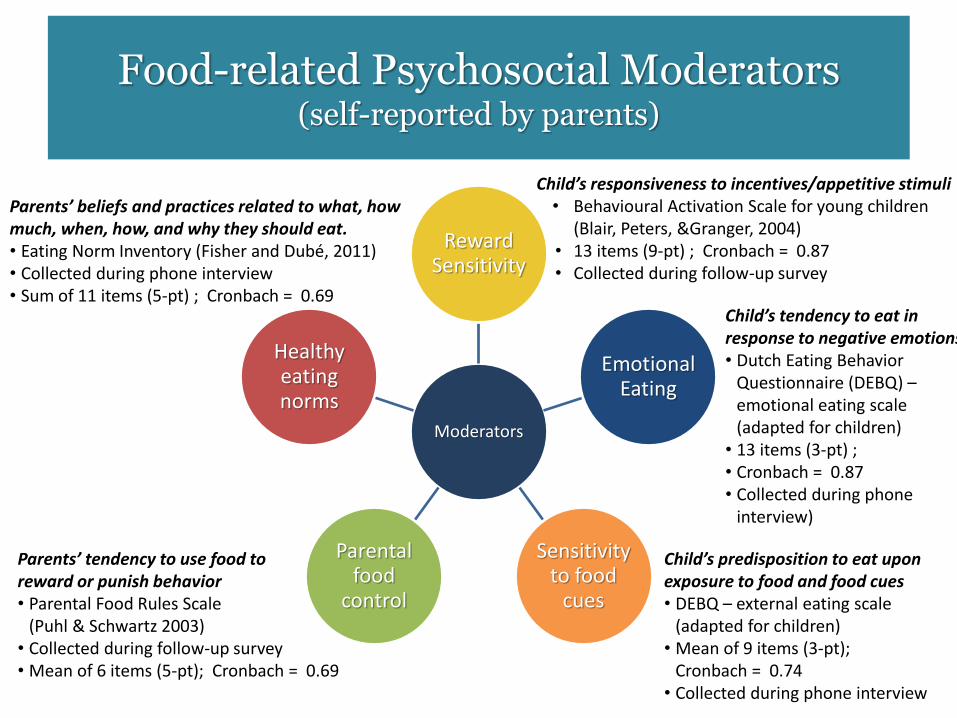
Food-related Psychosocial Moderators(self-reported by parents)
Moderators
Reward Sensitivity
Emotional Eating
Sensitivity to food
cues
Parental food
control
Healthy eating norms
Child’s responsiveness to incentives/appetitive stimuli• Behavioural Activation Scale for young children
(Blair, Peters, &Granger, 2004)• 13 items (9-pt) ; Cronbach = 0.87• Collected during follow-up survey
Child’s tendency to eat in response to negative emotions• Dutch Eating Behavior
Questionnaire (DEBQ) –emotional eating scale (adapted for children)
• 13 items (3-pt) ; • Cronbach = 0.87• Collected during phone
interview)
Child’s predisposition to eat upon exposure to food and food cues• DEBQ – external eating scale
(adapted for children)• Mean of 9 items (3-pt);
Cronbach = 0.74• Collected during phone interview
Parents’ beliefs and practices related to what, how much, when, how, and why they should eat.• Eating Norm Inventory (Fisher and Dubé, 2011)• Collected during phone interview• Sum of 11 items (5-pt) ; Cronbach = 0.69
Parents’ tendency to use food to reward or punish behavior• Parental Food Rules Scale
(Puhl & Schwartz 2003) • Collected during follow-up survey• Mean of 6 items (5-pt); Cronbach = 0.69
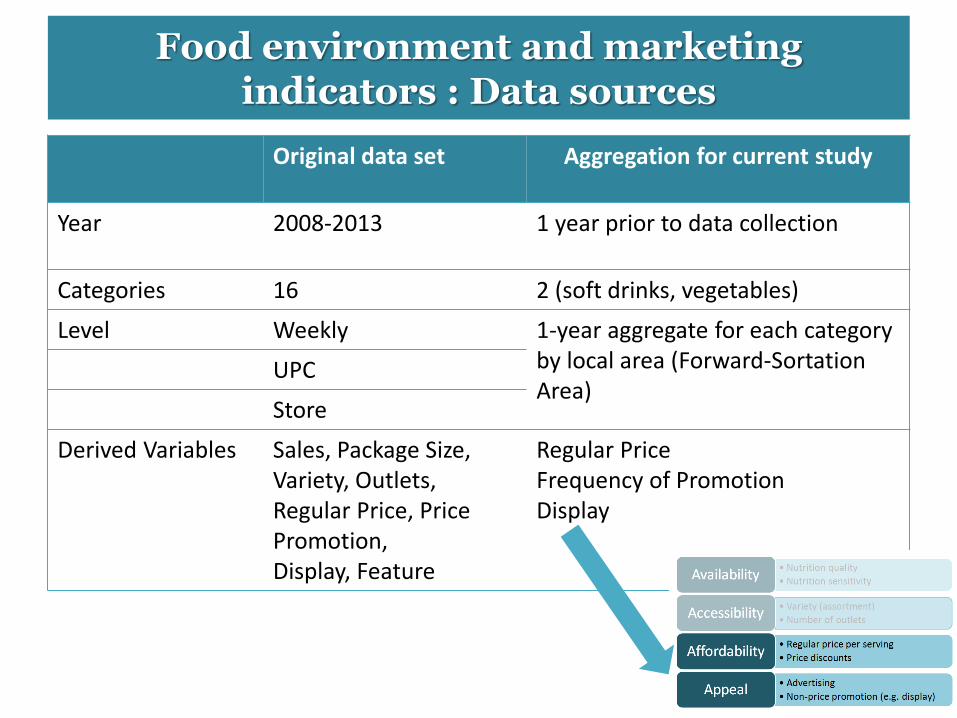
Food environment and marketing indicators : Data sources
Original data set Aggregation for current study
Year 2008-2013 1 year prior to data collection
Categories 16 2 (soft drinks, vegetables)
Level Weekly 1-year aggregate for each categoryby local area (Forward-SortationArea)
UPC
Store
Derived Variables Sales, Package Size,Variety, Outlets, Regular Price, Price Promotion,Display, Feature
Regular PriceFrequency of PromotionDisplay
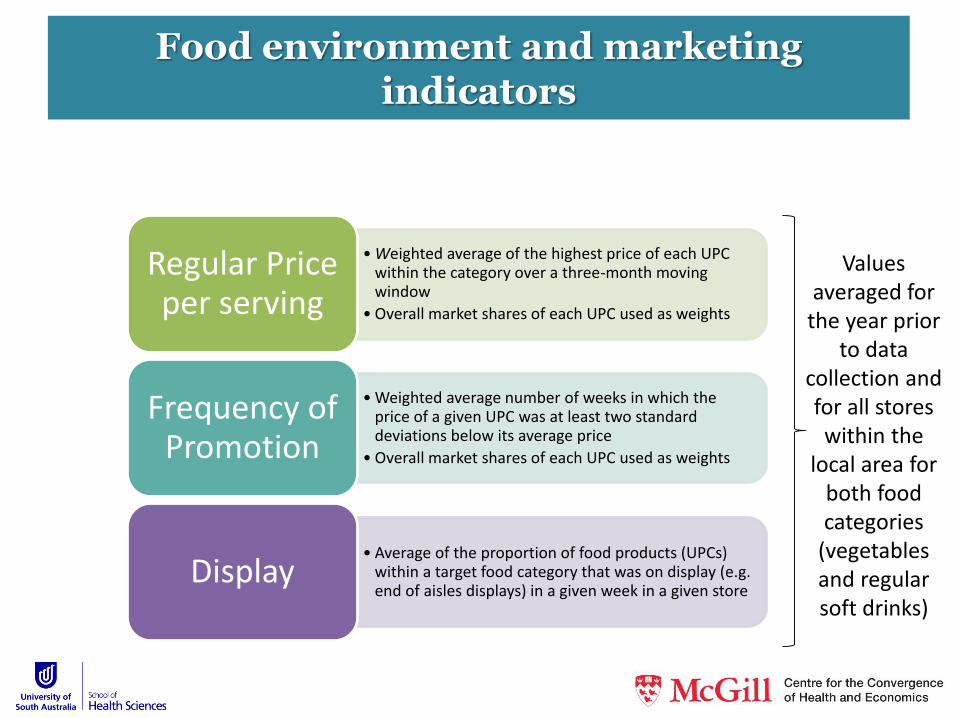
Food environment and marketing indicators
• Weighted average of the highest price of each UPC within the category over a three-month moving window
• Overall market shares of each UPC used as weights
Regular Price per serving
• Weighted average number of weeks in which the price of a given UPC was at least two standard deviations below its average price
• Overall market shares of each UPC used as weights
Frequency of Promotion
• Average of the proportion of food products (UPCs) within a target food category that was on display (e.g. end of aisles displays) in a given week in a given store
Display
Values averaged for
the year prior to data
collection and for all stores within the
local area for both food categories
(vegetables and regular soft drinks)
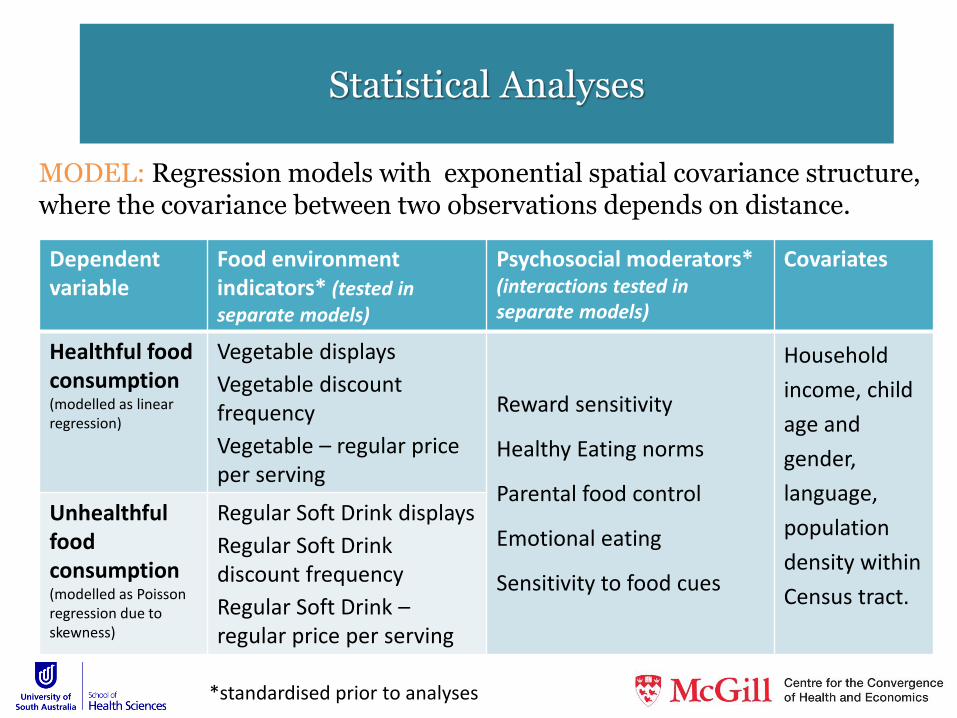
Statistical Analyses
MODEL: Regression models with exponential spatial covariance structure, where the covariance between two observations depends on distance.
Dependent variable
Food environment indicators* (tested in separate models)
Psychosocial moderators*(interactions tested in separate models)
Covariates
Healthful food consumption (modelled as linear regression)
Vegetable displays
Vegetable discount frequency
Vegetable – regular price per serving
Reward sensitivity
Healthy Eating norms
Parental food control
Emotional eating
Sensitivity to food cues
Household
income, child
age and
gender,
language,
population
density within
Census tract.
Unhealthful food consumption (modelled as Poisson regression due to skewness)
Regular Soft Drink displays
Regular Soft Drinkdiscount frequency
Regular Soft Drink –regular price per serving
*standardised prior to analyses
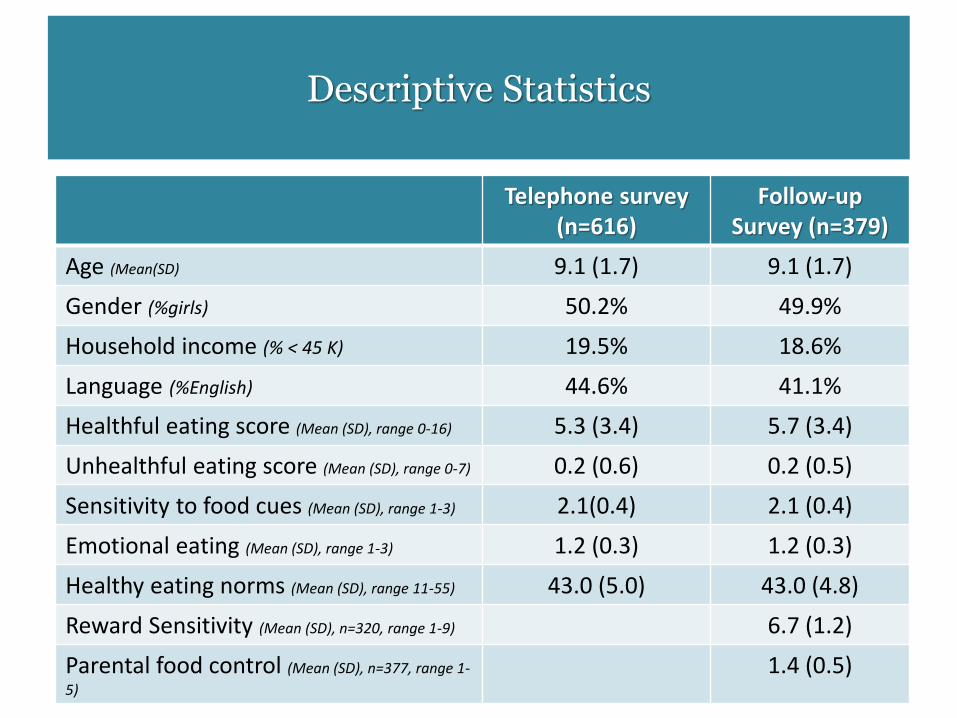
Descriptive Statistics
Telephone survey (n=616)
Follow-upSurvey (n=379)
Age (Mean(SD) 9.1 (1.7) 9.1 (1.7)
Gender (%girls) 50.2% 49.9%
Household income (% < 45 K) 19.5% 18.6%
Language (%English) 44.6% 41.1%
Healthful eating score (Mean (SD), range 0-16) 5.3 (3.4) 5.7 (3.4)
Unhealthful eating score (Mean (SD), range 0-7) 0.2 (0.6) 0.2 (0.5)
Sensitivity to food cues (Mean (SD), range 1-3) 2.1(0.4) 2.1 (0.4)
Emotional eating (Mean (SD), range 1-3) 1.2 (0.3) 1.2 (0.3)
Healthy eating norms (Mean (SD), range 11-55) 43.0 (5.0) 43.0 (4.8)
Reward Sensitivity (Mean (SD), n=320, range 1-9) 6.7 (1.2)
Parental food control (Mean (SD), n=377, range 1-
5)
1.4 (0.5)

Main effects of Moderators*
Healthful food consumption Unhealthful food consumption
Estimate 95%CI P RR* 95%CI P
Sensitivity to food cues(1SD; n=580)
-0.17 (-0.45, 0.11) 0.23 1.06 (0.86, 1.30) 0.60
Emotional eating(1SD; n=580)
-0.04 (-0.32, 0.24) 0.77 1.07 (0.89, 1.29) 0.45
Healthy eating norms (1SD; n=580)
0.35 (0.05, 0.60) 0.02 0.87 (0.72, 1.06) 0.17
Reward sensitivity (1SD; n=311)
0.22 (-0.18, 0.61) 0.28 0.84 (0.64, 1.12) 0.23
Food control (1SD; n=361)
-0.09 (-0.45, 0.27) 0.62 0.99 (0.76, 1.31) 0.97
Models adjusted for child age, gender, household income, language, and population densityRR= Relative Risk
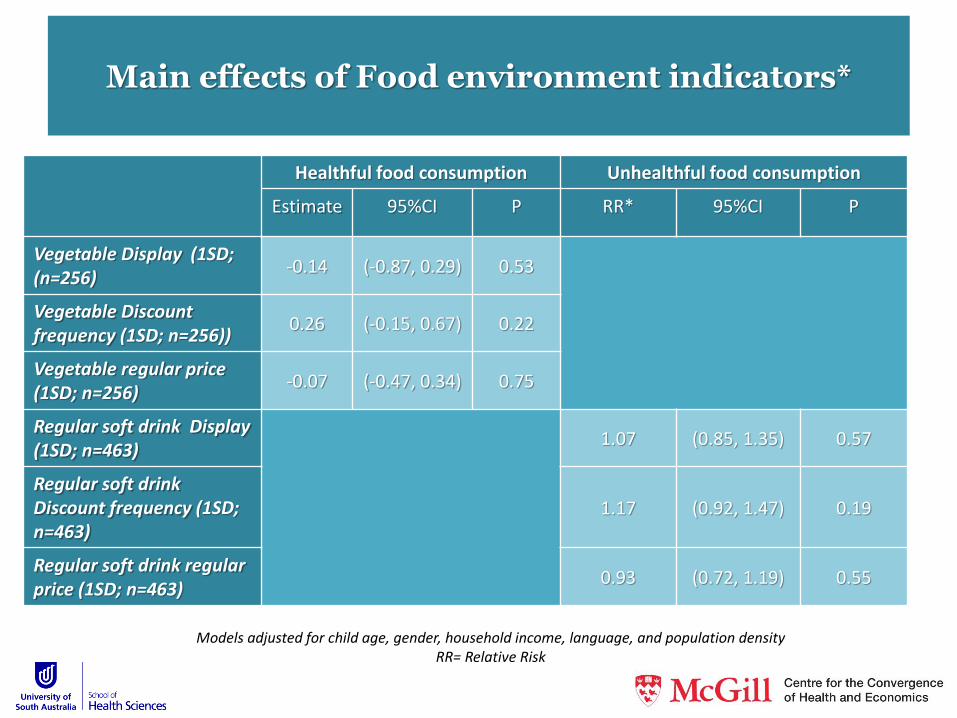
Main effects of Food environment indicators*
Healthful food consumption Unhealthful food consumption
Estimate 95%CI P RR* 95%CI P
Vegetable Display (1SD;(n=256)
-0.14 (-0.87, 0.29) 0.53
Vegetable Discount frequency (1SD; n=256))
0.26 (-0.15, 0.67) 0.22
Vegetable regular price (1SD; n=256)
-0.07 (-0.47, 0.34) 0.75
Regular soft drink Display(1SD; n=463)
1.07 (0.85, 1.35) 0.57
Regular soft drink Discount frequency (1SD; n=463)
1.17 (0.92, 1.47) 0.19
Regular soft drink regular price (1SD; n=463)
0.93 (0.72, 1.19) 0.55
Models adjusted for child age, gender, household income, language, and population densityRR= Relative Risk
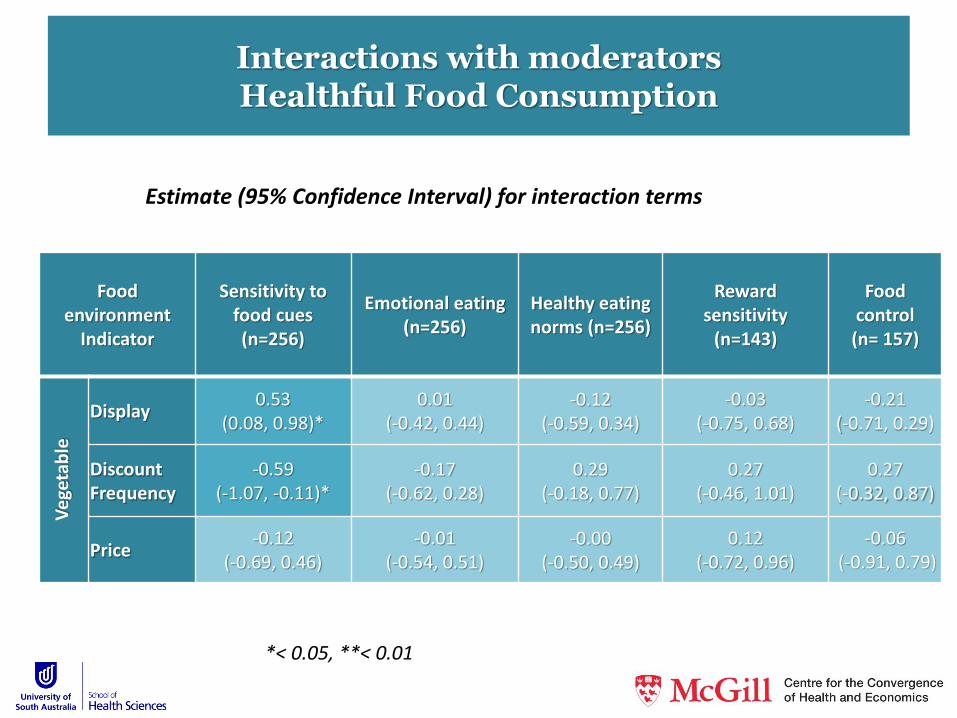
Interactions with moderators Healthful Food Consumption
Food environment
Indicator
Sensitivity to food cues (n=256)
Emotional eating (n=256)
Healthy eating norms (n=256)
Reward sensitivity
(n=143)
Food control(n= 157)
Ve
geta
ble
Display0.53
(0.08, 0.98)*0.01
(-0.42, 0.44)-0.12
(-0.59, 0.34)-0.03
(-0.75, 0.68)-0.21
(-0.71, 0.29)
Discount Frequency
-0.59(-1.07, -0.11)*
-0.17 (-0.62, 0.28)
0.29 (-0.18, 0.77)
0.27 (-0.46, 1.01)
0.27 (-0.32, 0.87)
Price-0.12
(-0.69, 0.46)-0.01
(-0.54, 0.51)-0.00
(-0.50, 0.49)0.12
(-0.72, 0.96)-0.06
(-0.91, 0.79)
*< 0.05, **< 0.01
Estimate (95% Confidence Interval) for interaction terms

Interactions with moderators - Unhealthful Food Consumption -
Food environmentIndicator
Sensitivity to food cues (n=463)
Emotionaleating (n=463)
Healthy eating norms (n=463)
Reward sensitivity
(n=245)
Food control
(n= 282)
Re
gula
rso
ft d
rin
k Display0.96
(0.77, 1.19)0.81
(0.65, 1.02)1.07
(0.89, 1.28)1.26
(0.90, 1.77)0.85
(0.58, 1.24)
Discount Frequency
0.98 (0.79, 1.23)
0.78(0.64, 0.96)*
1.05 (0.86, 1.27)
1.24 (0.89, 1.72)
0.87(0.63, 1.22)
Price0.98
(0.79, 1.21)1.26
(0.94, 1.68)0.78
(0.61, 0.99)*0.78
(0.51, 1.18)1.14
(0.84, 1.55)
*< 0.05, **< 0.01
Relative Risk (95% Confidence Interval) for interaction terms
Discussion
• Differences in response to healthful food marketing strategies seem mostly related to sensitivity to food cues.
• The success of affordability strategies (pricing and discounts) for unheathful foods might depend on emotional eating tendencies and parents’ healthy eating norms.
• Follow up studies needed for definitive answer on the moderating influence of reward sensitivity and food control
18
Conclusions
• Children differ in their responsiveness to promotion strategies in food stores.
• Design of interventions related to in-store food marketing strategies should consider the type of strategy most likely to be effective for the target population.
19

Funding
This study was funded by a Collaborative Team Grant, Canada – India Initiative on Childhood funded by the
Canadian Institutes of Health Research and the Indian Council of Medical Research (#85512). Catherine Paquet is funded by a National Health and Medical Research Council
(NHMRC) Program Grant (#0631947).
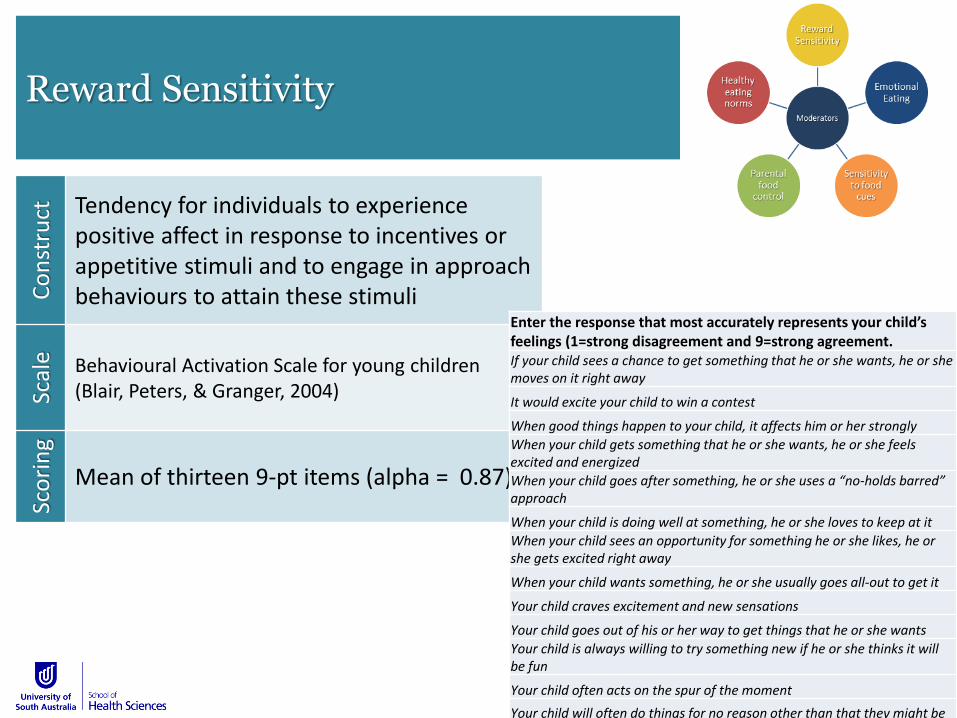
Reward Sensitivity
Co
nst
ruct Tendency for individuals to experience
positive affect in response to incentives or appetitive stimuli and to engage in approach behaviours to attain these stimuli
Scal
e Behavioural Activation Scale for young children (Blair, Peters, & Granger, 2004)
Sco
rin
g
Mean of thirteen 9-pt items (alpha = 0.87)
Enter the response that most accurately represents your child’s feelings (1=strong disagreement and 9=strong agreement.If your child sees a chance to get something that he or she wants, he or she moves on it right away
It would excite your child to win a contest
When good things happen to your child, it affects him or her strongly
When your child gets something that he or she wants, he or she feels excited and energized
When your child goes after something, he or she uses a “no-holds barred” approach
When your child is doing well at something, he or she loves to keep at it
When your child sees an opportunity for something he or she likes, he or she gets excited right away
When your child wants something, he or she usually goes all-out to get it
Your child craves excitement and new sensations
Your child goes out of his or her way to get things that he or she wants
Your child is always willing to try something new if he or she thinks it will be fun
Your child often acts on the spur of the moment
Your child will often do things for no reason other than that they might be fun
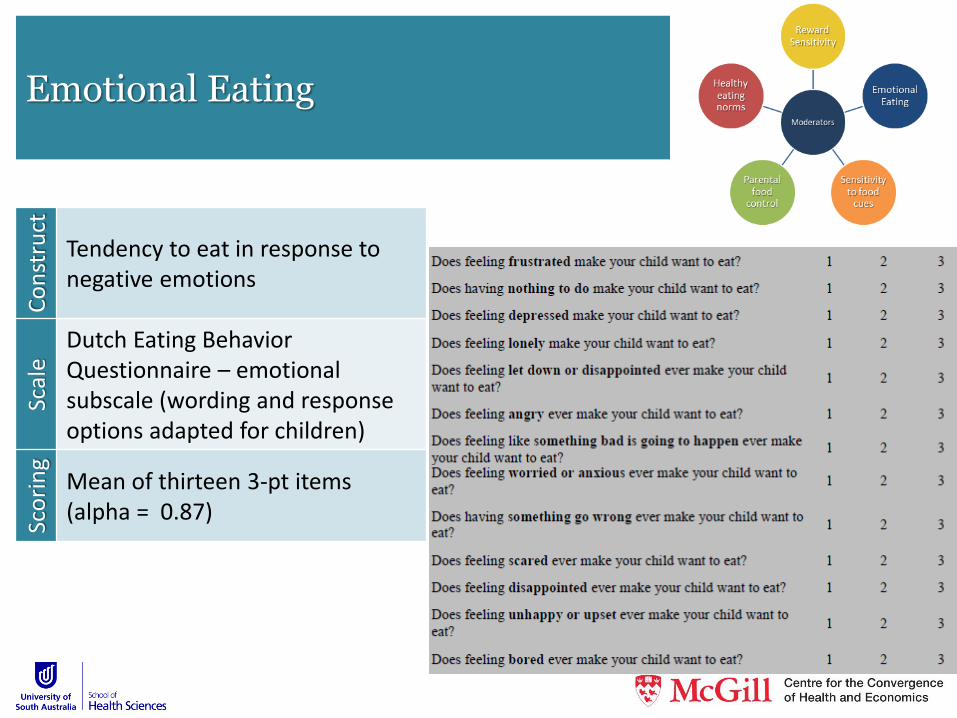
Emotional Eating
Co
nst
ruct
Tendency to eat in response to negative emotions
Scal
e
Dutch Eating Behavior Questionnaire – emotional subscale (wording and response options adapted for children)
Sco
rin
g
Mean of thirteen 3-pt items(alpha = 0.87)
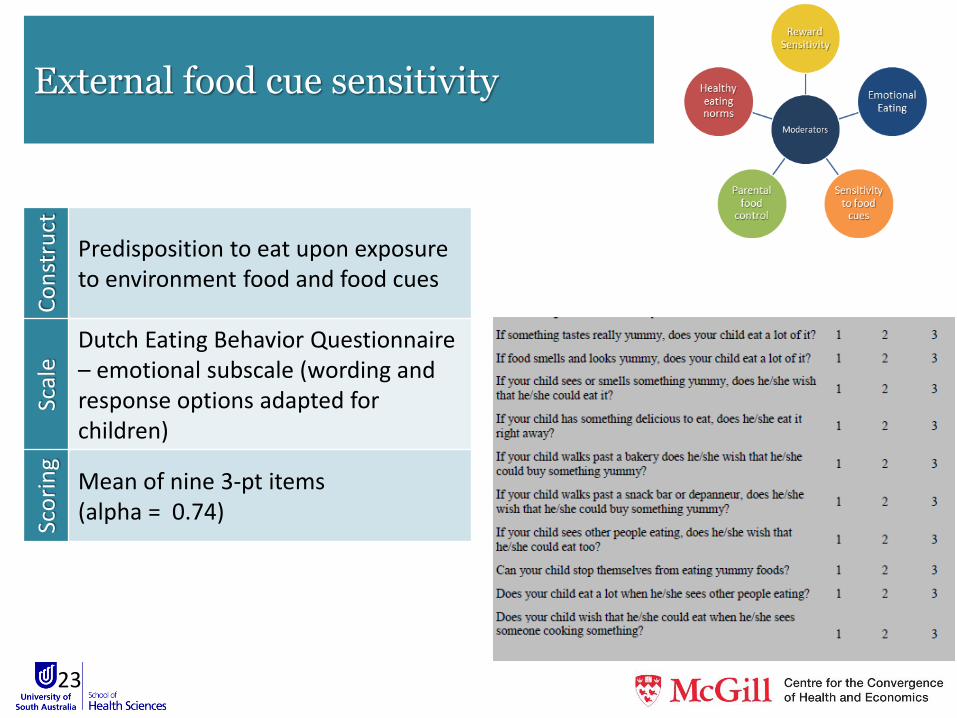
External food cue sensitivity
23
Co
nst
ruct
Predisposition to eat upon exposure to environment food and food cues
Scal
e
Dutch Eating Behavior Questionnaire – emotional subscale (wording and response options adapted for children)
Sco
rin
g
Mean of nine 3-pt items(alpha = 0.74)
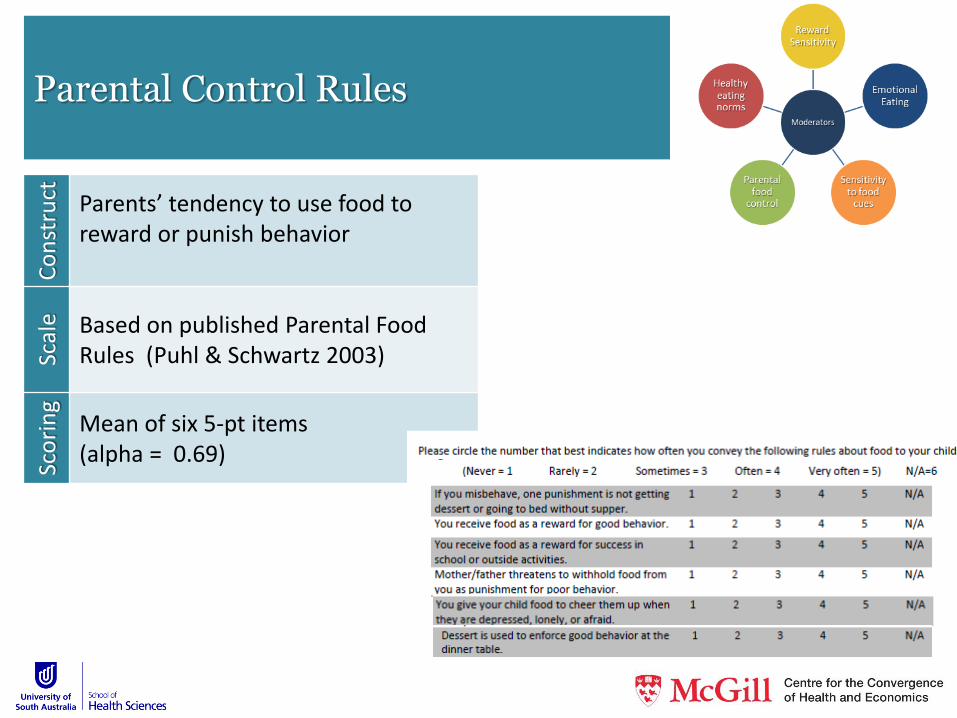
Parental Control Rules
Co
nst
ruct Parents’ tendency to use food to
reward or punish behavior
Scal
e Based on published Parental Food Rules (Puhl & Schwartz 2003)
Sco
rin
g
Mean of six 5-pt items(alpha = 0.69)

Healthy Eating Norms
Co
nst
ruct Parents’ beliefs and practices
related to what, how much, when, how, and why they should eat.
Scal
e Eating Norm Inventory (Fisher and Dubé, 2011)
Sco
rin
g
Sum of eleven 5-pt items(alpha = 0.69)
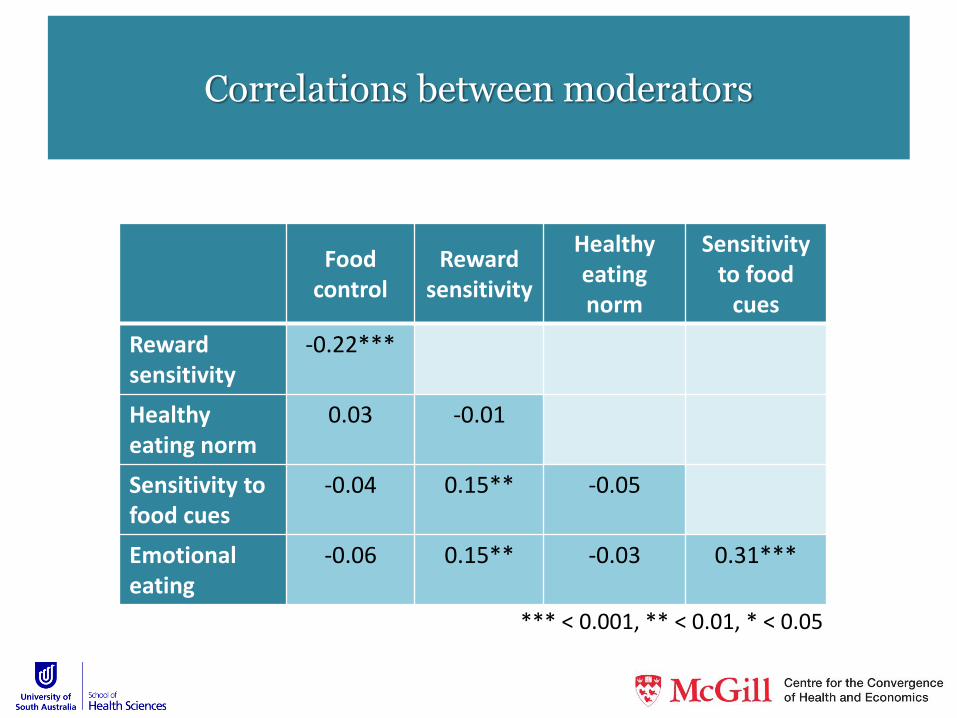
Correlations between moderators
Foodcontrol
Reward sensitivity
Healthyeating norm
Sensitivityto food
cues
Reward sensitivity
-0.22***
Healthyeating norm
0.03 -0.01
Sensitivity to food cues
-0.04 0.15** -0.05
Emotional eating
-0.06 0.15** -0.03 0.31***
*** < 0.001, ** < 0.01, * < 0.05
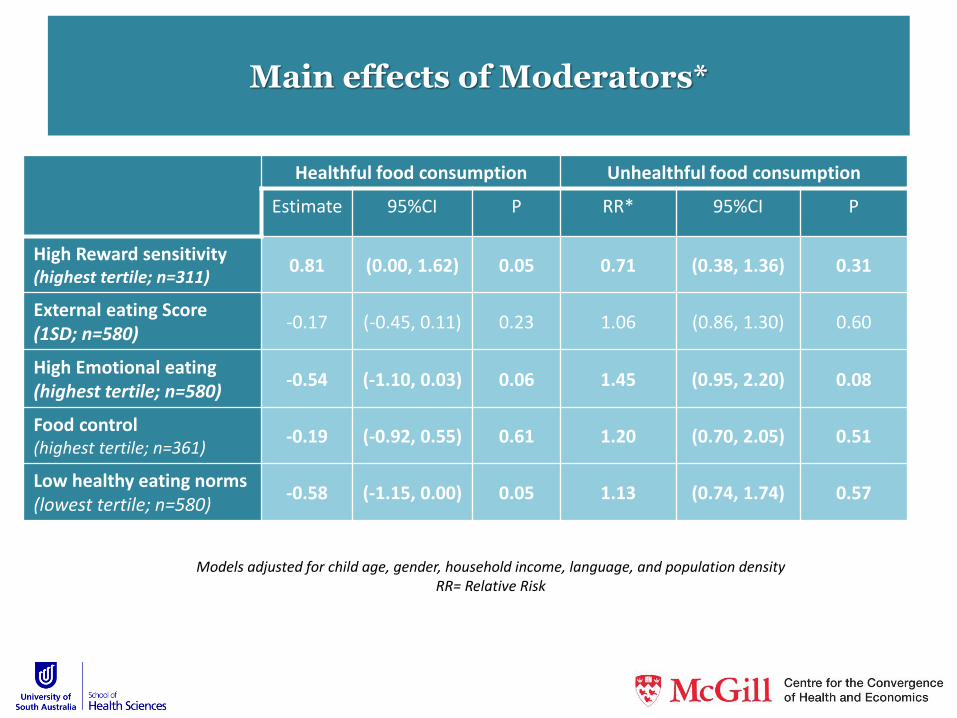
Main effects of Moderators*
Healthful food consumption Unhealthful food consumption
Estimate 95%CI P RR* 95%CI P
High Reward sensitivity (highest tertile; n=311)
0.81 (0.00, 1.62) 0.05 0.71 (0.38, 1.36) 0.31
External eating Score(1SD; n=580)
-0.17 (-0.45, 0.11) 0.23 1.06 (0.86, 1.30) 0.60
High Emotional eating(highest tertile; n=580)
-0.54 (-1.10, 0.03) 0.06 1.45 (0.95, 2.20) 0.08
Food control (highest tertile; n=361)
-0.19 (-0.92, 0.55) 0.61 1.20 (0.70, 2.05) 0.51
Low healthy eating norms (lowest tertile; n=580)
-0.58 (-1.15, 0.00) 0.05 1.13 (0.74, 1.74) 0.57
Models adjusted for child age, gender, household income, language, and population densityRR= Relative Risk
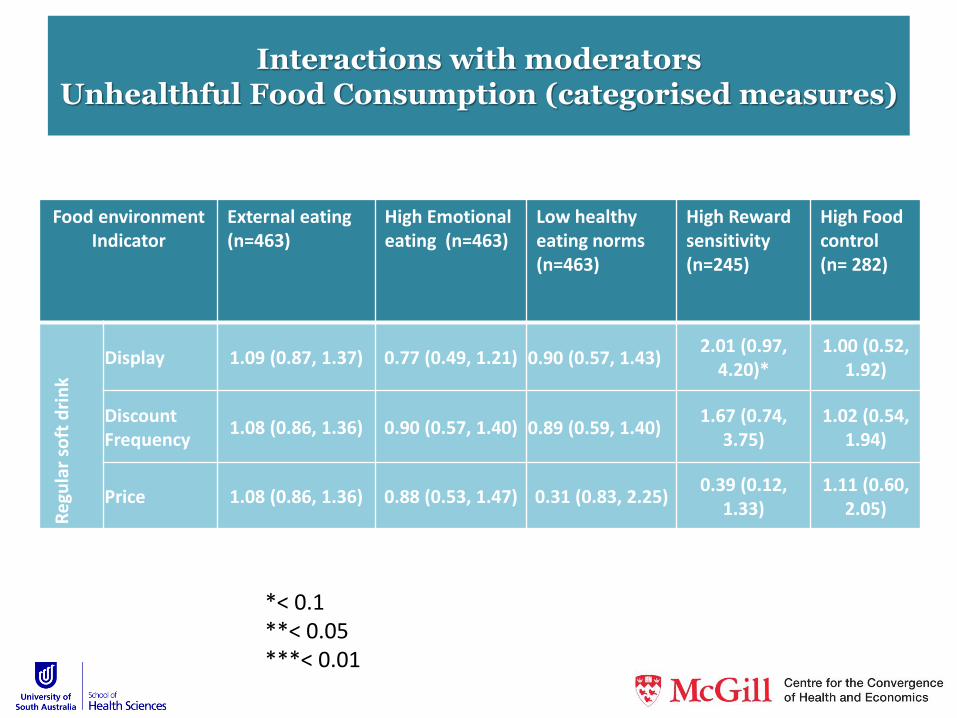
Interactions with moderators Unhealthful Food Consumption (categorised measures)
Food environmentIndicator
External eating (n=463)
High Emotionaleating (n=463)
Low healthy eating norms (n=463)
High Reward sensitivity (n=245)
High Food control(n= 282)
Re
gula
rso
ft d
rin
k
Display 1.09 (0.87, 1.37) 0.77 (0.49, 1.21) 0.90 (0.57, 1.43)2.01 (0.97,
4.20)*1.00 (0.52,
1.92)
Discount Frequency
1.08 (0.86, 1.36) 0.90 (0.57, 1.40) 0.89 (0.59, 1.40)1.67 (0.74,
3.75)1.02 (0.54,
1.94)
Price 1.08 (0.86, 1.36) 0.88 (0.53, 1.47) 0.31 (0.83, 2.25)0.39 (0.12,
1.33)1.11 (0.60,
2.05)
*< 0.1**< 0.05***< 0.01
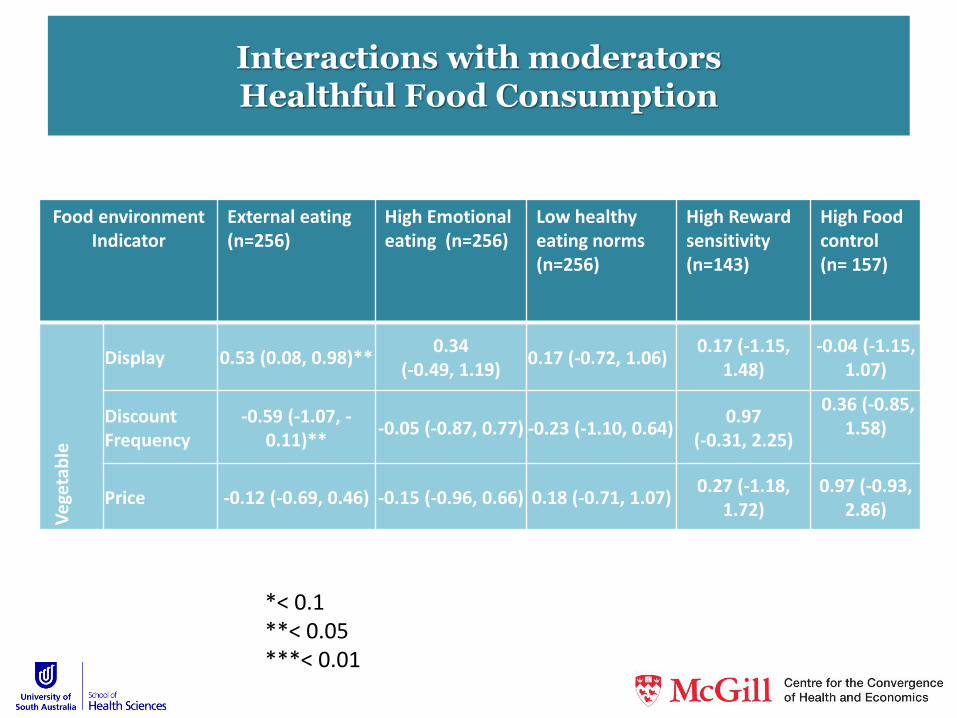
Interactions with moderators Healthful Food Consumption
Food environmentIndicator
External eating (n=256)
High Emotionaleating (n=256)
Low healthy eating norms (n=256)
High Reward sensitivity (n=143)
High Food control(n= 157)
Ve
geta
ble
Display 0.53 (0.08, 0.98)**0.34
(-0.49, 1.19)0.17 (-0.72, 1.06)
0.17 (-1.15, 1.48)
-0.04 (-1.15, 1.07)
Discount Frequency
-0.59 (-1.07, -0.11)**
-0.05 (-0.87, 0.77) -0.23 (-1.10, 0.64)0.97
(-0.31, 2.25)
0.36 (-0.85, 1.58)
Price -0.12 (-0.69, 0.46) -0.15 (-0.96, 0.66) 0.18 (-0.71, 1.07)0.27 (-1.18,
1.72)0.97 (-0.93,
2.86)
*< 0.1**< 0.05***< 0.01