Embed Size (px)
Citation preview

Marketing of Soda, Candy, Snacks and Fast Foods Drowns Out Healthful Messages
Consumers UnionPublisher of Consumer Reports
CPEHNCalifornia Pan-Ethnic Health Network
September 2005

Consumers Union is a nonprofit membership organization founded in 1936 to provide consumers with information, education, and counsel about goods, services, health, and personal finance, and to advocate for consumers in every possible forum. Consumers Union, publisher of Consumer Reports and www.consumerreports.org, derives its income solely from the sale of these and other publications and services, and from noncommercial contributions, grants, and fees. The California Pan-Ethnic Health Network (CPEHN) works to ensure that all Californians have access to quality health care and can live healthy lives. CPHEN gathers the strength of communities of color to build a united and powerful voice in health advocacy. Together, they work to evolve health care from a one-size-fits-all approach to a system that works for people from all cultural and ethnic backgrounds. ©
2005 Consumers Union of U.S., Inc. Permission to copy, disseminate, or otherwise use this work is normally granted as long as ownership is properly attributed to Consumers Union.

Marketing of Soda, Candy, Snacks and Fast Foods Drowns Out Healthful Messages
654 13th Street
Oakland, CA 94612 (510) 832-1160
(510) 832-1175 Fax www.cpehn.org [email protected]
1535 Mission Street
San Francisco, CA 94103 (415) 431-6747
(415) 431-0906 Fax www.consumersunion.org


OUT OF BALANCE 1
INTRODUCTION
By now, there is hardly an American who has not heard the U.S. Surgeon General’s oft-
repeated warning that America is in the midst of an obesity epidemic. By definition, an
epidemic is a rapidly spreading disease that calls for a concerted public health response.
As of 2002, 31.1 percent of adults age 20-74 in the United States were obese and another
34.1 percent were overweight1—a total of 65.2 percent, or nearly two-thirds, of adults
either obese or overweight.2 This represents a startlingly rapid increase in obesity rates,
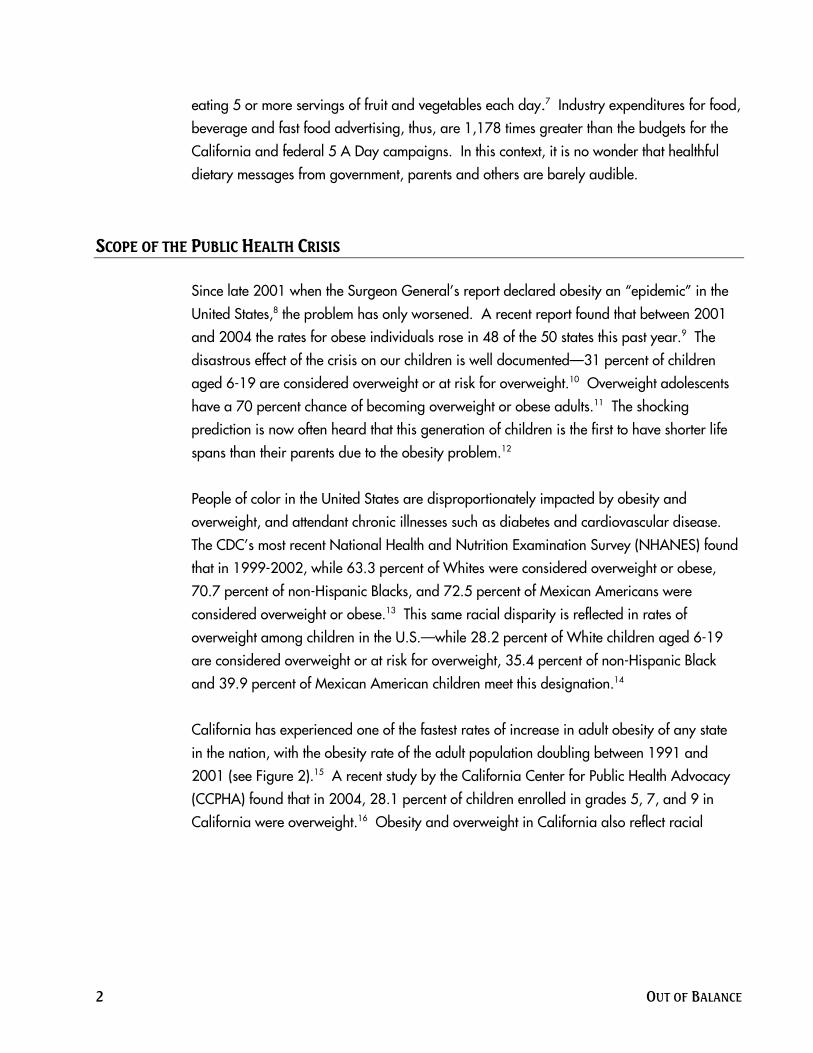
doubling over the past thirty years.3 The cost of the obesity and overweight epidemic to the
health care system, including to government coffers, is equally startling: $78.5 billion for the
nation annually4 and $8.4 billion for California alone (see Figure 1).5
Cost of Obesity to Nation and CaliforniaFIGURE 1
Source: Centers for Disease Control and Prevention, www.cdc.gov/nccdphp/dnpa/obesity/economic_consequences.html (national figures in 1998 dollars); California Department of Health Services, “The Economic Costs of Physical Inactivity, Obesity, and Overweight in California Adults”, www.dhs.ca.gov/ps/cdic/cpns/press/downloads/CostofObesityToplineReport.pdf (Apr. 2005) (California figures in 2000 dollars); Telephone conversation with Director of Communications, Produce for Better Health Foundation, 9/2/05 (citing 2004’s Form 990); telephone conversation with former Director, federal 5 A Day Program at the National Cancer Institute, 8/31/05 (2004 budget); telephone conversation with Communications Manager, California Nutrition Network, 8/26/05 (FY 2004-2005 budget).
Dol
lars
(Bi
llion
s)
$47.5
$78.5
$0.0049$6.4
$8.4
$0.0047
$0.0
$10.0
$20.0
$30.0
$40.0
$50.0
$60.0
$70.0
$80.0
$90.0
Nationwide (1998) California (2000)
Aggregate Medical Expenditures forObesity Alone in AdultsAggregate Medical Expenditures forObesity and Overweight in AdultsFIVE A DAY (2004)
In this paper, Consumers Union uses recently released data to highlight one of the key
factors contributing to this public health crisis: the unending barrage of food, beverage,
and fast food advertising in the United States. The $11.26 billion spent on advertising by
the food, beverage, and restaurant industries in 20046 dwarfed the mere $9.55 million
spent on communications for the federal and California “5 A Day” programs to encourage
2 OUT OF BALANCE
eating 5 or more servings of fruit and vegetables each day.7 Industry expenditures for food,
beverage and fast food advertising, thus, are 1,178 times greater than the budgets for the
California and federal 5 A Day campaigns. In this context, it is no wonder that healthful
dietary messages from government, parents and others are barely audible.
SCOPE OF THE PUBLIC HEALTH CRISIS
Since late 2001 when the Surgeon General’s report declared obesity an “epidemic” in the
United States,8 the problem has only worsened. A recent report found that between 2001
and 2004 the rates for obese individuals rose in 48 of the 50 states this past year.9 The
disastrous effect of the crisis on our children is well documented—31 percent of children
aged 6-19 are considered overweight or at risk for overweight.10 Overweight adolescents
have a 70 percent chance of becoming overweight or obese adults.11 The shocking
prediction is now often heard that this generation of children is the first to have shorter life
spans than their parents due to the obesity problem.12
People of color in the United States are disproportionately impacted by obesity and
overweight, and attendant chronic illnesses such as diabetes and cardiovascular disease.
The CDC’s most recent National Health and Nutrition Examination Survey (NHANES) found
that in 1999-2002, while 63.3 percent of Whites were considered overweight or obese,
70.7 percent of non-Hispanic Blacks, and 72.5 percent of Mexican Americans were
considered overweight or obese.13 This same racial disparity is reflected in rates of
overweight among children in the U.S.—while 28.2 percent of White children aged 6-19
are considered overweight or at risk for overweight, 35.4 percent of non-Hispanic Black
and 39.9 percent of Mexican American children meet this designation.14
California has experienced one of the fastest rates of increase in adult obesity of any state
in the nation, with the obesity rate of the adult population doubling between 1991 and
2001 (see Figure 2).15 A recent study by the California Center for Public Health Advocacy
(CCPHA) found that in 2004, 28.1 percent of children enrolled in grades 5, 7, and 9 in
California were overweight.16 Obesity and overweight in California also reflect racial

OUT OF BALANCE 3
disparities. African American, Latino, Native American, and Alaska Native adults are more
likely to be overweight or obese than their White counterparts.17 CCPHA’s study revealed
that the prevalence of overweight among California children in grades 5, 7, and 9 is
highest among Pacific Islander (35.9 percent), Latino (35.4 percent), American
Indian/Alaska Native (31.7 percent), and African-American (28.7 percent) children.18
Obesity Doubles in California in Ten Years
FIGURE 2
Source: Centers for Disease Control and Prevention, www.cdc.gov/nccdphp/dnpa/obesity/trend/prev_reg.htm.
Perc
enta
ge o
f Adu
lts W
ho A
re O
bese
10.00%
20.90%
0.00%
5.00%
10.00%
15.00%
20.00%
25.00%
1991 1995 1998 1999 2000 2001
EATING TRENDS REFLECT ADVERTISING TRENDS
Eating more and exercising less, nutrition experts agree, are primary causes for the recent
increase in obesity and overweight among American adults and children.19 Between 1985
and 2000, U.S. Department of Agriculture (USDA) reports tell us, Americans ate more
calories, refined carbohydrates, and fats without a corresponding increase in the level of
physical activity.20 As Marion Nestle, Chair of New York University’s Department of
Nutrition, Food Studies, and Public Health,
points out, “the increased calories in American diets come from eating more food in
general, but especially more of foods high in fat (meat, dairy, fried foods, grain dishes with
added fat), sugar (soft drinks, juice drinks, desserts), and salt (snack foods).”21

4 OUT OF BALANCE
Despite the proven health benefits of eating five servings of fruits and vegetables a day, a
mere 22.6 percent of Americans consume five or more servings of fruits and vegetables a
day.22 The numbers are only slightly better in California, where 26.9 percent of people eat
five or more servings a day.23 In addition, according to the USDA variety in both fruit and
vegetable consumption is sorely lacking with just five vegetables accounting for nearly half
of all vegetables consumed (frozen potatoes, fresh potatoes, potato chips, iceberg lettuce,
and canned tomatoes).24
Selected Food Consumption Trends for Children and Teens, 1977-2002
FIGURE 3
Source: U.S. Department of Agriculture, “Changes Over 25 Years in the Dietary Intakes of Children 6-19 Years” (Apr. 2005) (courtesy of author Rhonda Sebastian).
(subset of Vegetables) 45%
24%
-32%
-42%
220%
180%
208%
413%
320%
320%
-50% 0% 50% 100% 150% 200% 250% 300% 350% 400% 450%
Fried Potatoes
Vegetables
Candy
Pizza
Savory Snacks
Children, 6-11 YearsTeens, 12-19 Years
Children and youth fare even worse when it comes to meeting nutritional recommendations,
both at the state and national levels. Only 22 percent of young people in the United States
eat the recommended five or more servings of fruits and vegetables each day.25 In fact,
vegetable consumption among children and teens diminished by 42 percent and 32 percent
respectively between 1997 and 2002 (see Figure 3). In California, a state-wide study
revealed that a mere 2 percent of California’s teenagers meet all five diet and activity
recommendations included in the 2000 Dietary Guidelines for Americans.26
Consumption of soft drinks has been linked to weight gain among children and
adolescents.27 Yet, by 2001-02, soda composed 50 percent of the total beverage intake for

OUT OF BALANCE 5
U.S. teens aged 12-19,28 a 58.5 percent increase since 1997 (see Figure 4). During this
same period, milk consumption decreased nearly 9 percent for teens and more than 20
percent for children aged 6-11. Kids are also eating much more fast food than they did in
the past: nearly 20 percent of caloric intake among 12- to 18-year-olds come from fast
food, compared with 6.5 percent in the late 1970s.29
Beverage Consumption Trends for Children and Teens, 1977-2002
58.54%
33.52%
37.04%
16.15%
77.73%
54.25%
-8.95%
-20.42%
-30.00% -20.00% -10.00% 0.00% 10.00% 20.00% 30.00% 40.00% 50.00% 60.00% 70.00% 80.00%
Soda
Fruit Drinks
Fruit Juice
Milk
Children, 6-11 Years
Teens, 12-19 Years
FIGURE 4
Source: U.S. Department of Agriculture, “Changes Over 25 Years in the Dietary Intakes of Children 6-19 Years” (Apr. 2005) (courtesy of author Rhonda Sebastian).
FOOD AND BEVERAGE MARKETING EXPENDITURES
A variety of complex factors have led Americans to eat such a poorly balanced diet. Lack
of access to affordable, fresh food in many low-income neighborhoods; changed family
structures with more single parents than ever spending less time at home; and a federal
farm subsidy program that promotes the surplus production of corn and grains above other
crops are surely some of the contributing factors. Personal responsibility for food choices as
well must be acknowledged. Similarly, the overwhelming presence of food and beverage
advertising in American life is a powerful part of the context that cannot be ignored in a
discussion of eating and obesity trends in the United States.

6 OUT OF BALANCE
The National Cancer Institute (NCI) has noted that, “Commercial advertisers have learned
that a consistent and prominent presence in the marketplace is key to achieving and holding
market share.”30 The statistics for food and beverage advertising in 2004 bear this out,
with advertising expenditures for “measured media” in the food, beverage and candy
industries in 2004 totaling $6.84 billion, and restaurants adding another $4.42 billion, for
a total of $11.26 billion.31 Advertising Age defines “measured media” as the variety of
measurable, traditional marketing strategies utilized to sell goods—magazine, newspaper,
billboard, network and cable television ads, radio spots, and internet advertising. For 2004,
the most popular advertising media for the food, beverage, and candy industries was
network TV, followed by magazine advertising, and then cable TV.32
FOOD AND BEVERAGE ADVERTISING EXPENDITURES VS. 5 A DAY 33
When commercial advertising efforts are grouped together and compared to the resources
allocated for the promotion of healthful messages through the 5 A Day program, the one-
sidedness of the national nutritional conversation appears in stark relief:
Measured Advertising Dollars (2004) for Food, Beverages, Candy and Restaurants Compared to 5-A-Day
$4,700,000
$4,855,000
$4,417,600,000
$6,840,100,000
$0 $1,000,000,000 $2,000,000,000 $3,000,000,000 $4,000,000,000 $5,000,000,000 $6,000,000,000 $7,000,000,000
CALIFORNIA FIVE A DAY
NATIONAL FIVE A DAY
Restaurants
Food, beverages & candy
FIGURE 5
Source: “50th Annual 100 Leading National Advertisers”, Advertising Age, June 27, 2005. Accessed August 5, 2005. <http://www.adage.com/images/random/lna2005.pdf>; Telephone conversation with Director of Communications, Produce for Better Health Foundation, 9/2/05 (citing 2004’s Form 990); telephone conversation with former Director, federal 5 A Day program at the National Cancer Institute, 8/31/05 (2004 budget); telephone conversation with Communications Manager, California Nutrition Network, 8/26/05 (FY 2004-2005 budget).

OUT OF BALANCE 7
(1) Figure 5 demonstrates the dramatic contrast in 2004 between food, beverage, candy,
and restaurant industry advertising expenditures ($11.26 billion) and the communications
expenditures for the federal 5 A Day program ($4.85 million)34
and the California 5 A Day program ($4.7 million),35 funded through the USDA’s Food
Stamp program.
(2) Figure 6 shows the growth of U.S. food industry advertising over the past eight years,
according to Advertising Age annual reports.
Domestic Spending on Food Advertising(Measured Media, Nominal Dollars)
$0.0
$2.0
$4.0
$6.0
$8.0
$10.0
$12.0
1997 1998 1999 2000 2001 2002 2003 2004
Food, beverages, candy
Restaurants, fast food
Food and restaurantscombined
FIGURE 6
Source: Advertising Age, Annual Reports on 100 Leading National Advertisers (1998-2005).
Dol
lars
(Bi
llion
s)

8 OUT OF BALANCE
(3) Figure 7 compares restaurant expenditures in 2004 on various “megabrands”—brands
for which companies spent more than $10 million per year on measured advertising—
compared to 5 A Day advertising expenditures. This shows that the cited fast food
restaurants alone—with advertising totaling $2.3 billion—overwhelm the federal and
California 5 A Day programs’ communications expenditures—just $9.55 million—by
24,300 percent.
Measured Advertising Dollars (2004) for Selected Fast Food Brands
$4,700,000
$4,855,000
$99,300,000
$200,905,000
$203,377,000
$223,582,000
$310,217,000
$313,381,000
$353,580,000
$614,002,000
$2,318,344,000
$0 $500,000,000 $1,000,000,000 $1,500,000,000 $2,000,000,000 $2,500,000,000
CALIFORNIA FIVE A DAY
NATIONAL FIVE A DAY
Arby's
Taco Bell
Pizza Hut
Kentucky Fried Chicken
Subway Restaurants
Burger King
Wendy's
McDonald's
ALL BELOW (except Five A Day)
FIGURE 7
Rest
aura
nt B
rand
Source: “The Top 200 Megabrands”, Advertising Age. July 18, 2005. Accessed August 7, 2005. <http://www.adage.com/images/random/lna2005.pdf>; “50th Annual 100 Leading National Advertisers”, Advertising Age. June 27, 2005. Accessed August 5, 2005. <http://www.adage.com/images/random/lna2005.pdf>; Telephone conversation with Director of Communications, Produce for Better Health Foundation, 9/2/05 (citing 2004’s Form 990); telephone conversation with former Director, federal 5 A Day program at the National Cancer Institute, 8/31/05 (2004 budget); telephone conversation with Communications Manager, California Nutrition Network, 8/26/05 (FY 2004-2005 budget).

OUT OF BALANCE 9
(4) Figure 8 shows advertising expenditures in 2004 for selected sodas, snacks, and
candies contrasted to 5 A Day expenditures. Even the lowest expenditure on advertising for
a single product on the chart, Dove Candy & Ice Cream, is greater than the combined
communications budgets for the federal and California 5 A Day programs.
Measured Advertising Dollars (2004) for Selected Soda, Snack, and Candy Brands
$4,700,000
$4,855,000
$10,874,000
$16,286,000
$18,648,000
$19,369,000
$20,637,000
$25,702,000
$27,491,000
$32,435,000
$34,608,000
$45,024,000
$52,684,000
$55,015,000
$57,803,000
$72,768,000$93,497,000
$99,700,000
$104,762,000
$211,654,000
$246,243,000
$0 $50,000,000 $100,000,000 $150,000,000 $200,000,000 $250,000,000
CALIFORNIA FIVE A DAY
NATIONAL FIVE A DAYDove Candy & Ice Cream
Chex Mix Snack Mix
Starburst CandySkittles
Kool-Aid
LunchablesDoritos
Sunshine Cheez-It7-UpLays
M&MsPringles
Mountain DewSnickers
Nestle
Hershey'sDr. Pepper
Pepsi
Coca-Cola
FIGURE 8
Bran
d
Source: “The Top 200 Megabrands”, Advertising Age. July 18, 2005. Accessed August 7, 2005. <http://www.adage.com/images/random/lna2005.pdf>; “50th Annual 100 Leading National Advertisers”, Advertising Age. June 27, 2005. Accessed August 5, 2005. <http://www.adage.com/images/random/lna2005.pdf>; Telephone conversation with Director of Communications, Produce for Better Health Foundation, 9/2/05 (citing 2004’s Form 990); telephone conversation with former Director, federal 5 A Day program at the National Cancer Institute, 8/31/05 (2004 budget); telephone conversation with Communications Manager, California Nutrition Network, 8/26/05 (FY 2004-2005 budget).
UNMEASURED MEDIA
As startling as these charts are, they do not even take into account another category of
advertising expenditure—a large and growing portion of overall marketing spending which
Advertising Age terms “unmeasured media.” This category includes marketing strategies
used by food companies for which ad buy data may not be accessible, such as direct mail,
sales promotion, couponing, catalogs, and special events.36

10 OUT OF BALANCE
It is not possible at this time to provide comprehensive information on advertising
expenditures for unmeasured media for food and beverage products and restaurants for
2004.37 However, the 2004 estimates for company-wide unmeasured media spending by
the two leading soda and fast food companies are as follows:
Burger King Measured $314,443,000 Unmeasured $227,700,000
Coca Cola Measured $379,425,000 Unmeasured $161,126,000
McDonald’s Measured $639,226,000 Unmeasured $749,636,000
Pepsi Measured $861,404,000 Unmeasured $400,757,00038
As well, in response to television ad-skipping technologies and renewed public attention on
the volume of TV advertising directed at children, food, beverage, candy, and fast food
companies are increasingly using non-traditional marketing methods, including:
• increased use of product placements or “branded content”;39
• word of mouth and “buzz” marketing;40
• advergaming (advertising immersed in games);41
• branded internet environments;42
• web-based cross promotions;43 and
• cell phone and text messaging ads,44 among others.
Clearly, unmeasured media and non-traditional marketing strategies are a significant,
burgeoning part of the food and beverage advertising world.45 Thus, the $11.26 billion
overall advertising figure highlighted throughout this report vastly understates the true extent
of marketing expenditures by these industries.
MARKETING TO COMMUNITIES OF COLOR
Savvy food companies and advertisers target people of color directly through “ethnic-
oriented” media outlets and programs. In 2004, the food, beverage, and candy industries
spent over $260 million to pitch their products to consumers of Hispanic-oriented broadcast
TV networks, cable stations, and Spanish-language magazines and newspapers.46
Similarly, six of the top ten advertisers on Black Entertainment Television (BET) in 1999 were
food or beverage companies, which together spent $30.5 million to market their goods to
viewers of BET that year.47 In August 2005, Kraft announced the launch of its first
marketing effort targeting Asian Americans, which was to include print ads placed in

OUT OF BALANCE 11
Chinese newspapers and bilingual “brand ambassadors” deployed to retailers to provide
information to shoppers on products such as Oreos, Ritz, Kraft Barbecue Sauce, Capri Sun,
and Philly Cream Cheese.48 Advertising to communities of color is a growing industry, with
ad agencies specializing in “ethnic markets” vying for accounts from large companies.
The targeting of communities of color by food companies is not inherently negative, as
information about available consumer goods should be accessible to all communities. What
is disturbing is the finding of a number of recent studies that the types of food and
beverages advertised to African-Americans and Latinos are often less healthful than those
marketed to general audiences.
A 2005 study in the journal BMC Public Health found that 52 percent of the food and
beverage advertisements in popular Hispanic women’s magazines were for “overtly
unhealthy food and drink”,49 while this number dropped to 29 percent for mainstream
women’s magazines targeted at a predominantly White audience.50 A recent survey of
prime-time television programs found that far more food commercials appear on shows with
large African-American audiences than those for general audiences and that most of these
advertisements are for “fast food, candy, soda, or meat (e.g. sausages, cold cuts).”51
TARGET MARKETING TO CHILDREN
Food, beverage, candy and restaurant companies are focusing increasing attention on
selling to children, a demographic group estimated to influence a staggering $680 billion of
household spending per year.52 Heavy marketing to children is driven largely by the desire
to develop brand awareness and loyalty at an early age. James U. McNeal, a noted youth
marketing consultant notes that children become “brand conscious” at about 24 months of
age, and by three years old can make a connection that a brand can say something about
their personalities—e.g. that they are strong, cool or smart.53 A 2000 study by toy
marketing strategists found that 2-5 year olds demonstrate brand knowledge and influence
at a level demonstrated only by older children in decades past.54
Of the top six brands of which these very young children were aware, four were food
brands: Cheerios, McDonald’s, Pop-Tarts, and Coke (the other two brands were Disney
and Barbie).55 According to McNeal, by the time kids reach first grade they typically are
loyal to one brand within each of the major categories of food they regularly consume such

12 OUT OF BALANCE
as cereal, candy and soft drinks. Youth marketing firms rely on the fact that brands you are
emotionally connected to as a child you remain connected to as an adult.56
Television advertising and in-school marketing are two of the most prevalent forms of
marketing to children. It is well documented that food is the most frequently advertised
product category on children’s television, and that the foods promoted during the hours
when children watch TV are predominantly high in sugar and fat, with almost no references
to fruits or vegetables.57 One recent study revealed that convenience and fast foods and
sweets comprised 83 percent of foods advertised during television programs heavily viewed
by children.58
According to Alex Molnar, Director of the Commercialism in Education Research Unit
(CERU) of Arizona State University, the majority of children attending public schools in the
United States are exposed to advertising and other marketing activities while in school. The
bulk of these marketing efforts are financed by companies that sell foods of minimal
nutritional value or foods high in fat, sugar or salt.59 In-school commercial activities include:
(1) product sales, through vending machines, soft drink “pouring rights” agreements
(exclusive contracts), branded fast food, and fundraisers; (2) direct advertising, such as food
and beverage ads in schools; and (3) indirect advertising, such as corporate-sponsored
educational programs, sports sponsorships, and incentive programs using contests and
coupons.60
New avenues such as digital and other non-traditional means of advertising described
above are gaining on television and in-school advertising as popular strategies for selling to
youth. In a July 2005 comment to the Federal Trade Commission (FTC), American
University Professor Kathryn C. Montgomery stated that, “[t]he interactive media are
ushering in an entirely new set of relationships, breaking down traditional barriers between
‘content and commerce,’ and creating unprecedented intimacies between children and
marketers.”61 Much of this new marketing—through the internet, through engagement of
“word of mouth” teams, through text messaging ads—takes place without parental
knowledge.
OUT OF BALANCE 13
THE “5 A DAY” PROGRAM
California blazed the trail in 1988 in creating the 5 A Day program, which was initially
funded by a grant from the National Cancer Institute (NCI). California’s Department of
Health Services conducted an extensive review of the scientific literature, concluded that a
minimum target of 5 servings of vegetables and fruit daily was required for a healthy diet,
and developed a statewide dietary change campaign.62 The long-range goal of the
campaign was to reduce the incidence of cancer and other chronic diseases.
The specific program objectives were to increase public awareness of the importance of the
simple regimen of eating at least 5 servings of vegetables and fruits per day and to provide
consumers with specific information about ways to incorporate more servings of these foods
into their daily eating patterns.63 The program demonstrated success—statewide population
surveys conducted in 1989 and 1991 found that “vegetable and fruit consumption rose by
0.3 servings for both Caucasian and African American adults, a rate four times higher than
secular trends.“64
In light of the accomplishments of the California model, the 5 A Day program was adopted
federally in 1991. A public-private partnership structure was created pairing the National
Cancer Institute with a new “Produce for Better Health Foundation” started with contributions
from 60 companies and commodity groups. Social marketing techniques guided the
communications plan for the program. Spending on a national media campaign to spread
the word about healthful consumption of fruit and vegetables has always been a part of the
5 A Day program, but funding for that effort has been extremely limited. In 2004, the
communications budget for the federal 5 A Day program was $4.85 million.65
Notwithstanding its limited budget, the federal 5 A Day campaign has shown encouraging
results in improving public awareness. The percentage of Americans who know they should
eat “5 A Day” has increased nearly five-fold – from 8 to 36 percent—since program began
in 1991.66
Today, the California 5 A Day campaign receives ongoing primary funding from the United
States Department of Agriculture (USDA) Food Stamp Program. Because of this funding
source, the mission of the California program has been mainly to target low-income
Californians. Specifically, 50 percent of the impressions made by California’s 5 A Day
program must be targeted to populations that are eligible for food stamps. The
communications budget for the California 5 A Day campaign was $4.7 million for FY
2004-05, including advertising production costs.67

14 OUT OF BALANCE
RECOMMENDATIONS
Policymakers searching for solutions to redress the obesity epidemic-- and the severe
disparity between the advertising of foods of minimal nutritional value and the advertising
of five or more servings of vegetables and fruit per day-- will need to look at dual
approaches. On one side of the imbalance, policymakers must consider how to elevate the
5 A Day program to a true campaign with funding sufficient to raise its visibility to
approach that of soda, candy, snacks, and fast foods. Ideally, from a public health
perspective, the components of a healthy diet would receive greater visibility than foods and
beverages of little or no nutritional value. This seems unlikely in America today. Thus,
policymakers should also, on the other side of the imbalance, address the sheer magnitude
of product advertising for these foods and consider whether and how to restrict the current
torrent of marketing, especially to children.
On the federal level, activities are underway to explore approaches to regulating food
advertising and marketing particularly with regard to children. The Institute of Medicine
(IOM), the Federal Trade Commission (FTC), and the Federal Communications Commission
(FCC) have roles to play and are examining what they might do. For example, regulating
advertising of children currently rests with the Children’s Advertising Review Unit (CARU), a
self-regulatory body of the Council of Better Business Bureaus, Inc. Many parties, including
Consumers Union, believe that this self-regulatory structure is not working.68 The FTC
recently held a workshop on the advertising of food to children.69 The FCC currently
regulates children’s advertising, enforcing the Children’s Television Act of 1990 passed by
Congress that year. An IOM study on food marketing to children is due by year’s end.
Two bills currently pending before Congress, S.799 introduced by Senator Edward Kennedy
and S.1074 introduced by Senator Tom Harkin, address some food marketing issues. And
Congress always holds the purse strings that could raise funding levels for the federal 5 A
Day program.

OUT OF BALANCE 15
Meanwhile, some steps policymakers in California can take to help level the playing field
include:
1. BANNING THE ADVERTISING AND MARKETING OF UNHEALTHY FOODS IN
CALIFORNIA PUBLIC SCHOOLS.
Positive farm-to-school and other healthful eating initiatives are springing up in some parts
of California. At the same time, however, as discussed above, advertising and marketing of
unhealthy foods in schools has reached unprecedented levels. Alex Molnar, Director of the
Commercialism in Education Research Unit (CERU) of Arizona State University, has recently
found that the majority of children attending public schools in the United States are exposed
to advertising and other marketing activities while in school. The bulk of these marketing
efforts are financed by companies that sell foods of minimal nutritional value or foods high
in fat, sugar or salt.70
The Legislature and the Governor should take action on this issue by enacting a ban on the
advertising and marketing of unhealthy foods to children and adolescents in California's
public schools. This would be a natural extension of the state’s current ban on the sale of
unhealthy beverages in elementary and middle schools, the nutritional standards
requirement on “competitive foods” sold in elementary and middle schools, and the pending
bills—SB 12 and SB 965—that would create more rigorous nutrition standards for food sold
on K-12 campuses and eliminate all sales of soda on high school campuses, respectively.71
This year, four states have introduced legislation restricting the advertising and marketing of
foods of minimal nutritional value on school grounds or school buses—Maine (LD 796),
Massachusetts (SB 1921), Oregon (SB 560 and SB 860), and Pennsylvania (HB 185).72
California should take similar action to keep schools free of marketing messages for
unhealthful food and beverages.
In the meantime, local school districts can take action on this issue right now by passing
resolutions to ban advertising and marketing of low nutritional value foods in their school
districts, include restrictions on contracts between schools and outside vendors that sell or
advertise unhealthful foods in public schools. A survey of California high schools found
that, in 2000, 13 percent of the respondents prohibited fast food and beverage advertising
on the campuses.73 A subsequent survey in 2003 found that the number dropped even
lower, and only 6 percent of the respondents banned such advertising.74 In 1999, the San
Francisco Unified School District’s Board of Education passed the “Commercial-Free Schools
Act”, which limited in-school advertising.75

16 OUT OF BALANCE
State agencies such as the California Department of Health Services and the California
Department of Education should provide support and technical assistance to school districts
working to ban the marketing of unhealthful food and beverages from schools.
2. SUBSTANTIALLY INCREASING FUNDING TO CALIFORNIA’S 5 A DAY CAMPAIGN TO
PROMOTE CONSUMPTION OF FIVE OR MORE SERVINGS OF FRUITS AND VEGETABLES
PER DAY.
As on so many consumer and public policy fronts, California led the way on promoting
dietary change with the original California 5 A Day campaign, the model upon which the
federal 5 A Day program is based. Today, California's allocation of funds for public
awareness in this one state alone, drawn from USDA Food Stamp funds, is equivalent to the
direct federal 5 A Day expenditure for the entire nation. But we can do—and need to do—
more.
The Governor and state officials should commit to significantly more funding for the
communication and education efforts of the 5 A Day program. When the national
marketing of candy, foods, and beverages of no nutritional value such as M&Ms, Coca-
Cola, and Lay’s Potato Chips, and of restaurants like McDonald’s and Burger King, exceeds
the national budget for 5 A Day by one thousand or two thousand to one, it is not enough
to double, or triple, or quadruple the budget for California's 5 A Day program. When the
cost to California of obesity (not including overweight) is $6.4 billion annually, it is a far
more prudent fiscal policy to invest in a ten-fold, twenty-fold, or thirty-fold increase in
prevention now in order to save billions of dollars later.
While such an increase still would not begin to approach the gargantuan annual
advertising budgets of major food companies, it would at least begin to redress the
imbalance in messages. More resources are sorely needed for this program to even begin
to compete with food industry dollars for ad space and airtime.
OUT OF BALANCE 17
FUNDS TO INCREASE THE ACTIVITIES OF THE CALIFORNIA 5 A DAY CAMPAIGN COULD
BE RAISED BY:
(a) Disallowing California's state tax (or federal tax) deductions by corporations for
advertising and marketing expenses related to unhealthy food.
According to a study published by the California Department of Health Services in April
2004, the problem of obesity and overweight in adults currently costs the state $8.4 billion
in medical care, workers compensation, and lost productivity.76 At the same time, food
companies promoting their goods in California are permitted to write off advertising
expenses from their federal and state taxes.
Earlier this year, the Congressional Research Service estimated that food producers’ tax
deductions for advertising expenses in 2001 (most recent figures) totaled $12.6 billion; the
federal tax revenues associated with and foregone by allowing those deductions for
advertising expenditures claimed by food producers is estimated to be $4.2 billion.77 In
California, all corporations (not just food and beverage companies) filing returns in 2002
collectively took over $148 billion in deductions for advertising.78 Disallowing the state tax
deduction for advertising for food, beverage, candy, and fast-food corporations could
provide substantial dedicated revenues to the state. These funds could then be used to pay
for an increase in the 5 A Day program.
(b) Placing a small tax on soft drinks, snack foods, fast foods, or the advertising of
these items.
According to one study, as of 2000 eighteen states had taxes on soft drinks, candy, and
snack foods.79 For example, California has a sales tax on carbonated soft drinks, but not
on candy or snack foods sold in grocery stores. The study estimated that California's 7.25
percent sales tax on soft drinks generated $218 million in revenues annually, and also
estimated that a one-cent tax nationally on soft drinks would generate approximately $1.5
billion annually in revenue.80 Unfortunately, these taxes on less nutritious foods are not
earmarked, partially or wholly, for activities promotions of healthy eating, such as the 5 A
Day program. California has the opportunity to be the first in the nation to specify that
taxes levied on snack foods or sodas be used to fight the obesity epidemic by promoting the
eating of healthy foods.

18 OUT OF BALANCE
CONCLUSION
The causes of this nation’s obesity epidemic are many and complex. Lack of access to
affordable, fresh food in many low-income neighborhoods; changed family structures with
more single parents than ever with less time at home; neighborhoods that lack access to
open space for exercise; and the dominance of sedentary lifestyles that plague modern life
all contribute to the problem. To be sure, an element of personal responsibility for food
choices must be acknowledged.
Just as individuals and families must take responsibility for dietary decisions, so must the
food, beverage, and fast-food industries take responsibility for excessive marketing of foods
with little or no nutritional value—what the advertising world calls “surround marketing” to
capture consumer attention at every possible moment. A legislative ban on marketing of
unhealthful products in the schools would provide a needed respite for our children and
adolescents.
Today’s din of commercial food and beverage messages combined with study-of-the-week
dietary findings creates a cacophony of dietary advice. The 5 A Day program’s simple fruit
and vegetable consumption message can be lost in the mix. While the program has been
effective in raising public awareness, 64 percent of Americans still remain unaware that
eating at least 5 servings of varied vegetables and fruits each day can improve health
outcomes and help manage weight gain. A concerted public health response to the obesity
epidemic calls for investing significant funds in 5 A Day efforts to truly create a unified
campaign for widespread changes in Americans’ dietary practices.

OUT OF BALANCE 19
ENDNOTES
1 National Center for Health Statistics, Health, United States, 2004, with chartbook on trends in the health of Americans. 2004. Accessed September 10, 2005 <http://www.cdc.gov/nchs/data/hus/hus04.pdf>. 2 The National Institutes of Health (NIH) use body mass index (BMI) to classify people as obese, overweight, or neither. An individual’s body mass index equals the individual’s weight in kilograms divided by the square of the individual’s height in meters. According to the Centers for Disease Control, “obese” is defined as a BMI greater than or equal to 30; and “overweight but not obese” is defined as a BMI greater than 25 but less than 30. (Centers for Disease Control. Defining Overweight and Obesity. 2005. Accessed on September 10, 2005 <http://198.246.96.2/NCCDPHP/dnpa/obesity/defining.htm>.) 3 National Center for Health Statistics, op. cit. 4 Centers for Disease Control and Prevention, “Overweight and Obesity, Economic Consequences”. Accessed Aug 29, 2005. <http://198.246.96.2/NCCDPHP/dnpa/obesity/economic_consequences.htm>. 5 Chenoweth D, The economic costs of physical inactivity, obesity and overweight in California adults: health care, workers’ compensation, and lost productivity. Cancer Prevention and Nutrition Section, California Department of Health Services; 2005. 6 Advertising Age, “50th Annual 100 Leading National Advertisers”. June 27, 2005. Accessed August 5, 2005 <http://www.adage.com/images/random/lna2005.pdf >. 7 Telephone conversation with Director of Communications, Produce for Better Health Foundation, citing 2004’s Form 990 on September 2, 2005; telephone conversation with former Director, federal 5 A Day For Better Health Program at the National Cancer Institute on August 31, 2005; telephone conversation with Communications Manager of California Nutrition Network on August 26, 2005. The 2004 communications budget for the federal 5 A Day program is $4.85 million and the 2004 communications budget for the California 5 A Day program is $4.7 million. This yields a combined total of $9.55 million. 8 U.S. Dept. of Health and Human Services, The Surgeon General's call to action to prevent and decrease overweight and obesity. Rockville, MD: U.S. Department of Health and Human Services, Public Health Service, Office of the Surgeon General; 2001. 9 Trust for America’s Health, F as in Fat: How Obesity Policies are Failing in America. Washington, DC ( 2005). 10 Hedley AA, Ogden CL, Johnson CL, Carroll MD, Curtin LR, Flegal KM, “ Prevalence of overweight and obesity among US children, adolescents, and adults 1999-2002.” JAMA. 2004; 291: 2847-2850. 11U. S. Dept. of Health and Human Services, op. cit. 12 Belluck, Pam, “Children’s Life Expectancy Being Cut Short by Obesity.” New York Times. March 17, 2005. 13 Hedley, op. cit. 14 Ibid. 15 Centers for Disease Control, Prevalence of Obesity Among U.S. Adults by State Behavioral Risk Factor Surveillance System. Accessed May 15, 2004. <http://cdc.gov/nccdphp/dnpa/obesity/trend/prev_reg.htm>. 16 California Center for Public Health Advocacy, The Growing Epidemic: Child Overweight Rates on the Rise in California Assembly Districts. August 2005. 17 California Health Interview Survey, Health of California’s Adults, Adolescents and Children: Findings from CHIS 2001. 2005. Accessed September 2, 2005 <www.chis.ucla.edu/ber/state.asp?tableID=13>. 18 California Center for Public Health Advocacy, op. cit. 19 Grantmakers in Health, Weighing in on Obesity, America’s Growing Health Epidemic. Washington, DC: Grantmakers in Health; 2002. 20 Putnam J, Allhouse J, Kantor LS, “ U.S. Per Capita Food Supply Trends: More Calories, Refined Carbohydrates, and Fats,” FoodReview. Vol. 25, Issue 3. Economic Research Service, USDA, 2002. 21 Nestle, Marion, Food Politics (Berkeley: University of California Press, 2002) p. 10.

20 OUT OF BALANCE
22 Centers for Disease Control: Behavior Risk Factor Surveillance System. California 2003: Adults consuming five or more servings of fruits and vegetables per day. Accessed August 29, 2005 <http://apps.nccd.cdc.gov/brfss/display.asp?cat=FV&yr=2003&qkey=4415&state=CA>. 23 Ibid. 24 Putnam., op. cit. 25 Centers for Disease Control, Physical Activity and Good Nutrition: Essential Elements to Prevent Chronic Diseases and Obesity. 2003. Accessed September 9, 2005 <http://www.cdc.gov/nccdphp/aag/pdf/aag_dnpa2005.pdf>. 26 Foerster S, Fierro M, Gregson J, Hudes M, Oppen M, Sugerman S, 1998 California Teen Exercising and Nutrition Survey Media Highlights. Berkeley: Public Health Institute; September 2000. 27 Berkey C, Rockett H, Field A, Gillman M, Colditz G ,”Sugar-added beverages and adolescent weight gain,” Obesity Research. 2004, 12:778-88. 28 U.S. Department of Agriculture, Changes Over 25 Years in the Dietary Intakes of Children 6-19 Years. April 2005. Courtesy of author Rhonda Sebastian. 29 Austin SB, Melly SJ, Sanchez BN, Patel A, Buka S, Gortmaker S, “Clustering of Fast Food Restaurants Around Schools,” American Journal of Public Health. 2005; 95:1575-1581. 30 National Cancer Institute, 5 a Day for Better Health Program Evaluation Report. 2000. Accessed September 4, 2005 <www.cancercontrol.cancer.gov/5ad_exec.html>. 31 Advertising Age, op.cit. Each year Advertising Age magazine publishes a report on the 100 Leading National Advertisers in the United States. This year’s, published in June 2005, ranks various advertising sectors and provides data by brands as well as companies on 2004 advertising expenditures. 32 Advertising Age, op.cit. 33 The full name of the federal 5 A Day program is “5 A Day for Better Health Program.” The full name of the California program is “California 5 a Day – for Better Health! Campaign.” For the purposes of this report, both programs are referred to as “5 A Day.” 34 Telephone conversation with Director of Communications, Produce for Better Health Foundation, citing 2004’s Form 990 on September 2, 2005; telephone conversation with former Director, federal 5 A Day For Better Health Program at the National Cancer Institute on August 31, 2005. 35 Telephone conversation with Communications Manager, California Nutrition Network on August 26, 2005. 36 Advertising Age, op.cit. 37 Advertising Age estimates and compiles the amount of “unmeasured media” advertising spending by company, and not by brand or industry, in its annual report. Because some corporations have a small number of food products among their various brands and Advertising Age only provides unmeasured media spending by company, a company-wide figure would reflect expenditures on a broader universe of products than examined here. 38 Advertising Age, op. cit. 39 Initiative Magazine, an advertising industry publication, in discussing expectations for 2005 stated that “a key trend will be the growing number of brands choosing ‘branded content’ as the main plank of their marketing strategies. This year the TV networks will become more open to discussing innovative content options, in order to bring in added revenue” (“A World of Change,” Initiative Magazine Winter 2005: 8. Available on-line at <http://www.initiative.com/static/InitMag4.html> Accessed August 23, 2005.) While deriving an expenditure figure for food, beverage and restaurant “branded content” is not possible, last year $3.46 billion was estimated as spent overall on branded content for all products, up from just $1.63 billion in 1999. Elliot, Stuart, “More Products Get Roles in Shows, and Marketers Wonder if They’re Getting Their Money’s Worth.” The New York Times March 29, 2005. 40Some new advertising firms specialize in enlisting consumers to tout products. For example, the Tremor Group, an organization formed by Proctor and Gamble, has recruited 275,000 teens to create “buzz” about a variety of brands and products through on-line modes such as instant messaging and chat rooms. Reportedly, Tremor Group has used this network to test and promote Coke and Pringles. Wells, Melanie, “Kid Nabbing.” Forbes.com February 2, 2004. Accessed August 8, 2005 < http://www.forbes.com/free_forbes/2004/0202/084.html>.

OUT OF BALANCE 21
41 Kathryn C. Montgomery, Ph.D., Professor, School of Communication, American University, “Statement at Federal Trade Commission Workshop: Perspectives on Marketing, Self-Regulation, & Childhood Obesity,” July 14-15, 2005. Available on-line at <http://www.soc.american.edu/main.cfm?pageid=1345>. Accessed September 9, 2005. 42 See, e.g. <http://www.mycoke.com>. 43 Last year, Proctor and Gamble launched a campaign with Nickelodeon’s popular show, Fairly OddParents, placing codes in Pringles packages that enabled kids to go to Nick.com, insert the code, and play games. Montgomery, op. cit. 44 A recent study by the Yankee Group found that both McDonald’s and Kellogg conducted text- messaging trials by placing access codes on 250 million take out bags and 80 million cereal boxes respectively. Montgomery, op. cit. 45 “Forrestor Research Releases US Online Advertising And Marketing Forecast –Market to Reach $26 Billion by 2010” Forrestor Research Press Release, May 3 2005. Accessed September 9, 2005 <http://www.forrestor.com/ER/Press/Release/0,1769,1003,00.html>. Olsen, Stephanie, “Special Report: Digital ads tune in” Cnet News.com. April 29, 2005. Accessed September 9, 2005 <http://news.com.com/Digital+ads+tune+in/2009-1025_3-5201803.html>. 46 “Hispanic Fact Pack: Annual Guide to Hispanic Advertising and Marketing 2005 Edition,” Advertising Age in association with the Association of Hispanic Advertising Agencies. 2005. Accessed August 12, 2005 <http://www.adage.com/images/random/hispfactpack05.pdf>. Advertising Age, op. cit. 47 Williams, Jerome D, working paper, "Advertising Expenditures By Firm and Brand in African American-oriented Electronic and Print Media: An Analysis of 1999 Competitive Media Reporting (CMR) Data," University of Texas at Austin Advertising Department. (2005) 48 Reyes, Sonia, “Targeting: Kraft Initiative Woos Asian American Moms,” Brandweek. July 25, 2005. Accessed on August 27, 2005 <http://www.admerasia.com/kraftmom.html>. 49 In this study, foods and beverages coded as “unhealthy” included: candy, ice cream, gelatin desserts, other desserts, chips and other high-fat/low-nutrient snacks (e.g. cheese puffs), granola bars containing chocolate, fast food, non-diet sodas, juice drinks with added sugar and coffee drinks with added sugar and creamer. 50 Duerksen S, Mikail A, Tom L, Patton A, Lopez J, Amador X, Vargas R, Victorio M, Kustin B, Sadler G, “Health disparities and advertising content of women’s magazines: a cross-sectional study,” BMC Public Health. 2005; 5:85. 51 Henderson V, Kelly B, “Food Advertising in the Age of Obesity: Content Analysis of Food Advertising on General Market and African American Television,” Journal of Nutrition Education and Behavior, July-August 2005; 37: 191-196. 52 Comiteau J, citing James U. McNeal in, “When Does Brand Loyalty Start?” Adweek, March 24, 2003. McNeal states that in 2000, American children age 4-12 spent $30 billion of their own money, directly requested about $310 billion of purchases by parents, and indirectly influenced another $340 billion of parental spending, making them responsible for a whopping $680 billion of household spending per year. 53 Ibid. 54 Ibid. 55 Ibid. 56 Ibid. 57 Gamble M, Cotunga N, “A quarter century of TV food advertising targeted at children,” American Journal of Health Behavior. 1999; 23:261-267. 58 Harrison K, Marske A, ”Nutritional content of foods advertised during the television programs children watch most,” American Journal of Public Health. 2005; 95:1568-1574. 59 Molnar A, Director of the Commercialism in Education Research Unit (CERU) of Arizona State University, in telephone conversation September 6, 2005. Detailed results of CERU’s recently completed national survey of food and beverage marketers’ presence in schools will be forthcoming in Fall 2005. 60 U.S. General Accounting Office. Public education: Commercial activities in schools. GAO/HEHS-00-156. Washington, DC: US General Accounting Office; 2000. 61 Montgomery, op. cit.
22 OUT OF BALANCE
62 National Cancer Institute. 5 a Day for Better Health Program Evaluation Report. 2000. Accessed September 4, 2005 <www.cancercontrol.cancer.gov/5ad_origins.html>. 63 Ibid. 64 National Cancer Institute, op. cit., citing Foerster SB, Hudes M. 1989 California dietary practices survey: focus on fruits and vegetables – final report. Nutrition and Cancer Prevention Program, California Department of Health Services; 1993. 65 This figure was derived by combining the 2004 communications budgets of Produce for Better Health ($1,505,000) and the National Cancer Institute’s 5 A Day program ($3,350,000). These budget figures were obtained through personal communications with the Director of Communications, Produce for Better Health Foundation on September 2, 2005, and the former Director, federal 5 A Day For Better Health Program at the National Cancer Institute on August 31, 2005. 66 Centers for Disease Control. What is 5 A Day? 2005. Accessed on September 1, 2005 <http://www.cdc.gov/nccdphp/dnpa/5aday/whatis.htm>. 67 Telephone conversation with Communications Manager, California Nutrition Network on August 26, 2005; telephone conversation with Assistant Chief of California Nutrition Network on August 30, 2005. 68 Caroline Mayer, “Minding Nemo: Pitches to Kids Feed Debate About a Watchdog”, Washington Post, p. F1 (Feb. 27, 2005); Center for Science in the Public Interest, “Guidelines for Responsible Marketing to Children”, http://www.cspinet.org/marketingguidelines.pdf (Jan. 2005). 69 The Federal Trade Commission and the Department of Health and Human Services held a public workshop on July 14-15, 2005, entitled “Marketing, Self-Regulation & Childhood Obesity”. Their notice in the Federal Register acknowledged that childhood obesity “has become one of the top public health issues in the United States”. The workshop’s purpose was to bring together representatives from the food and beverage industries, media and entertainment companies, medical and nutrition experts, consumer organizations, advertising specialists, and other experts to discuss self-regulation and the marketing of food and beverages to children. 70 Fed. Reg. 25060 (May 12, 2005); 70 Fed. Reg. 45721 (Aug. 8, 2005). 70 Molnar, op. cit. Results of CERU’s recent national survey of food and beverage marketers’ presence in schools will be forthcoming in Fall 2005. 71 Trust for America’s Health, op. cit.; California Center for Public Health Advocacy. California Votes to Limit School Soda and Junk Food Sales. September 2005. Accessed September 10, 2005 < http://www.publichealthadvocacy.org/limits/index.html>. 72 Health Policy Tracking Service. State Actions to Promote Nutrition, Increase Physical Activity and Prevent Obesity: A Legislative Overview Thompson West: July 11, 2005. Available on-line at <http://www.rwjf.org/files/research/July%202005%20-%20Report.pdf>. Accessed on September 2, 2005. 73 Public Health Institute, 2000 California High School Fast Food Survey: Findings and Recommendations. Feb 2000. Accessed on September 10, 2005 <http://www.phi.org/pdf-library/fastfoodsurvey2000.pdf>. 74 Public Health Institute, 2003 California High School Fast Food Survey: Findings and Recommendations. 2003. Accessed on September 10, 2005 < http://www.phi.org/pdf-library/fastfoodsurvey2003.pdf >. 75 Public Health Institute, California’s Obesity Crisis: Focus on Solutions: What Schools Can Do: Food Advertising and Marketing to Children and Youth Mar. 2004. Accessed on September 10, 2005 <http://www.phi.org/pdf-library/lean-pb2.pdf>. 76 Chenoweth, op. cit. 77 Congressional Research Service memo to Senator Tom Harkin, “Tax Revenue Associated With Domestic Food Advertising Directed at Younger Children,” February 17, 2005. 78 California Franchise Tax Board, “Annual Report 2003”, p. 160 (table C-4). 79 Jacobson M, Brownell K, “Small Taxes on Soft Drinks and Snack Foods to Promote Health” American Journal of Public Health. June 2000; 90:854-857. 80 Jacobson, op. cit.

West Coast Office
1535 Mission Street San Francisco, CA 94103