Embed Size (px)
Citation preview
8/8/2019 Marketing Research 08
http://slidepdf.com/reader/full/marketing-research-08 1/26
Chapter Eight
Measurement and Scaling:Fundamentals and Comparative
Scaling

8/8/2019 Marketing Research 08
http://slidepdf.com/reader/full/marketing-research-08 2/26
8-2
Chapter Outline
1) Overview
2) Measurement and Scaling
3) Primary Scales of Measurement
i. Nominal Scale
ii. Ordinal Scale
iii. Interval Scale
iv. Ratio Scale4) A Comparison of Scaling Techniques

8/8/2019 Marketing Research 08
http://slidepdf.com/reader/full/marketing-research-08 3/26
8-3
Chapter Outline
5) Comparative Scaling Techniques
i. Paired Comparison
ii. Rank Order Scaling
iii. Constant Sum Scaling
iv. Q-Sort and Other Procedures
6) Verbal Protocols
7) International Marketing Research8) Ethics in Marketing Research

8/8/2019 Marketing Research 08
http://slidepdf.com/reader/full/marketing-research-08 4/26
8-4
Chapter Outline
9) Internet and Computer Applications
10) Focus on Burke
11) Summary
12) Key Terms and Concepts

8/8/2019 Marketing Research 08
http://slidepdf.com/reader/full/marketing-research-08 5/26
8-5
Measurement and Scaling
Measurement means assigning numbers or othersymbols to characteristics of objects according tocertain prespecified rules.
One-to-one correspondence between the numbers
and the characteristics being measured. (samedollar figures are assigned to household withidentical annual incomes.)
The rules for assigning numbers should bestandardized and applied uniformly.
Rules must not change over objects or time.

8/8/2019 Marketing Research 08
http://slidepdf.com/reader/full/marketing-research-08 6/26
8-6
Measurement and Scaling
Scaling involves creating a continuum upon whichmeasured objects are located.
Consider an attitude scale from 1 to 100. Each
respondent is assigned a number from 1 to 100, with1 = Extremely Unfavorable, and 100 = ExtremelyFavorable. Measurement is the actual assignment of a number from 1 to 100 to each respondent. Scalingis the process of placing the respondents on a
continuum with respect to their attitude towarddepartment stores.
8/8/2019 Marketing Research 08
http://slidepdf.com/reader/full/marketing-research-08 7/26
8-7
7 38
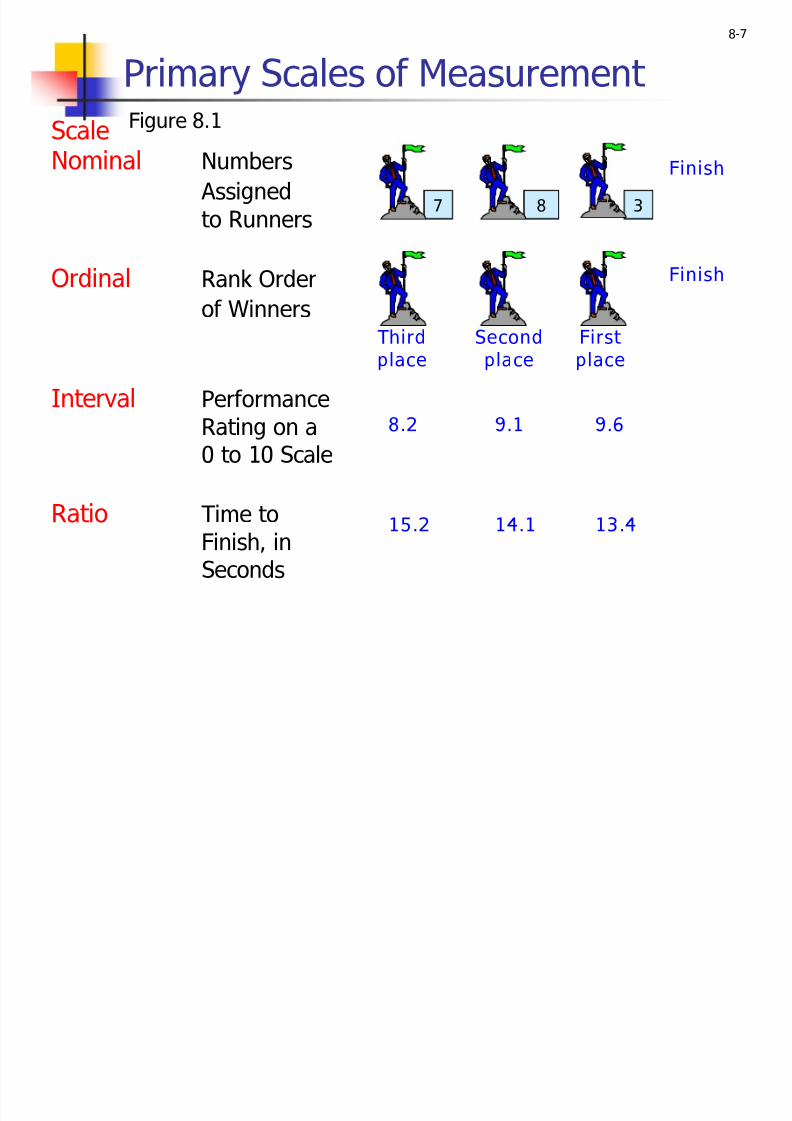
Primary Scales of Measurement
ScaleNominal Numbers
Assignedto Runners
Ordinal Rank Orderof Winners
Interval PerformanceRating on a0 to 10 Scale
Ratio Time to
Finish, inSeconds
Figure 8.1
Thirdplace
Secondplace
Firstplace
Finish
Finish
8.2 9.1 9.6
15.2 14.1 13.4

8/8/2019 Marketing Research 08
http://slidepdf.com/reader/full/marketing-research-08 8/26
8-8Primary Scal es of Measur em ent Nominal Scal e
The num bers s er ve only as la bels or t a gs for i dentifyin g an d classifyin g objects .
When us ed for i dentification , t her e is a strict on e-to-on e corr es pon denc e bet ween t he num bers an d t he
o bjects . The num bers do not r efl ect t he amount of t he
c haract eristic poss ess ed by t he o bjects .
The only permissi bl e o peration on t he num bers in a nominal scal e is countin g.
Only a limit ed num ber of statistics , all of whic h ar ebas ed on fr equ ency counts , ar e permissi bl e, e.g.,perc enta ges , an d mo de.

8/8/2019 Marketing Research 08
http://slidepdf.com/reader/full/marketing-research-08 9/26
8-9
Illustration of Primary Scales of Measurement
Table 8.2
Nominal Ordinal Ratio
Scale Scale ScalePreference $ spent last
No. Store Rankings 3 months
1. Lord & Taylor
2. Macy¶s
3. Kmart
4. Rich¶s
5. J.C. Penney
6. Neiman Marcus7. Target
8. Saks Fifth Avenue
9. Sears
10.Wal-Mart
IntervalScale
PreferenceRatings
1-7 11-177 79 5 15 0
2 25 7 17 200
8 82 4 14 0
3 30 6 16 100
1 10 7 17 250
5 53 5 15 35
9 95 4 14 0
6 61 5 15 100
4 45 6 16 0
10 115 2 12 10
8/8/2019 Marketing Research 08
http://slidepdf.com/reader/full/marketing-research-08 10/26
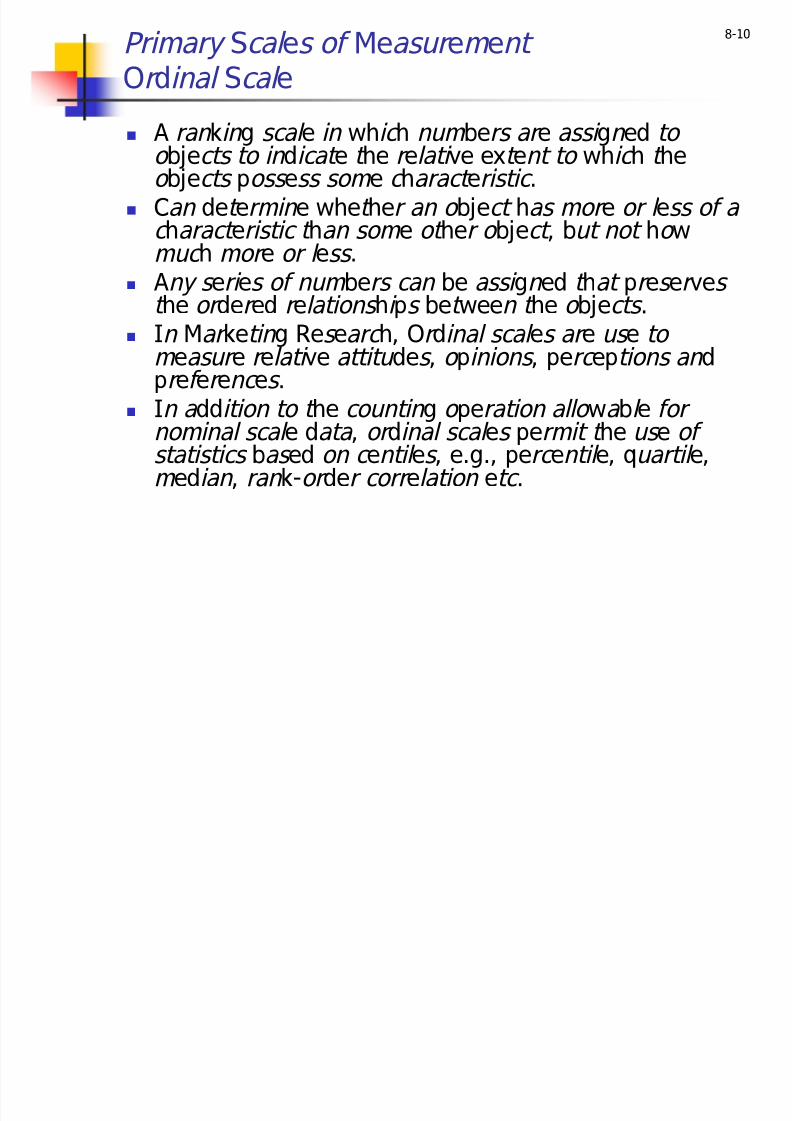
8-10Primary Scal es of Measur em ent Or dinal Scal e
A ran kin g scal e in whic h num bers ar e assi gn ed to o bjects to in dicat e t he r elati ve ext ent to whic h t heo bjects poss ess som e c haract eristic .
Can det ermin e whet her an o bject has mor e or l ess of a c haract eristic t han som e ot her o bject , but not ho wmuc h mor e or l ess .
Any s eri es of num bers can be assi gn ed t hat pr es er ves t he or der ed r elations hi ps bet ween t he o bjects .
In Mar ketin g Res earc h, Or dinal scal es ar e us e to m easur e r elati ve attitu des , o pinions , perc eptions an dpr ef er enc es .
In a ddition to t he countin g o peration allo wa bl e for nominal scal e data , or dinal scal es permit t he us e of statistics bas ed on c entil es , e.g., perc entil e, quartil e,m edian , ran k-or der corr elation etc .

8/8/2019 Marketing Research 08
http://slidepdf.com/reader/full/marketing-research-08 11/26
8-11Primary Scal es of Measur em ent Int er val Scal e
Num erically equal distanc es on t he scal e r epr es ent equal valu es in t he c haract eristic bein g m easur ed.
It permits com parison of t he diff er enc es bet ween o bjects . (ratin gs ar e gi ven )
The location of t he zero point is not fi xed. Bot h t he
zero point an d t he units of m easur em ent ar ear bitrary .
Any positi ve lin ear transformation of t he form y = a + bx will pr es er ve t he pro perti es of t he scal e.
It is not m eanin gful to ta ke ratios of scal e valu es . Statistical t ec hni qu es t hat may be us ed inclu de all of
t hos e t hat can be a ppli ed to nominal an d or dinal data , an d in a ddition t he arit hm etic m ean , stan dar ddeviation , an d ot her statistics commonly us ed in
mar ketin g r es earc h.

8/8/2019 Marketing Research 08
http://slidepdf.com/reader/full/marketing-research-08 12/26
8-12Primary Scal es of Measur em ent Ratio Scal e
Poss ess es all t he pro perti es of t he nominal , or dinal ,an d int er val scal es .
It has an a bsolut e zero point .
It is m eanin gful to com put e ratios of scal e valu es .
Only pro portionat e transformations of t he form y =bx, wher e b is a positi ve constant , ar e allo wed.
All statistical t ec hni qu es can be a ppli ed to ratio data .

8/8/2019 Marketing Research 08
http://slidepdf.com/reader/full/marketing-research-08 13/26
8-13
Primary Scales of Measurement Table 8.1
Scal Basic
C aracter istics
C
Examples
Marketi
Examples
Nomi al Numbers dent fy
& ssify bjects
Social Security
nos., numbering
of f ootball layers
Brand nos., store
ty es
Percentages,
mode
Chi-square,
binomial test
Ordi al Nos. indicate the relative ositions
of objects but not
the magnitude of
diff erences
between them
Quality rankings,rankings of teams
in a tournament
Pref erence rankings, market
osition, social
class
Percentile,median
Rank-or der correlation,
Friedman
ANOV A
atio Zero oint is f ixed,
ratios of scale
values can be
compared
Length, weight Age, sales,
income, costs
Geometric
mean, harmonic
mean
Coeff icient of
variation
erm issible Statistics
Descriptive Inf erential
I terval Diff erences
between objects
Temperature
(Fahrenheit)
Attitudes,
opinions, index
Range, mean,
standar d
Product-
moment
8/8/2019 Marketing Research 08
http://slidepdf.com/reader/full/marketing-research-08 14/26
8-14
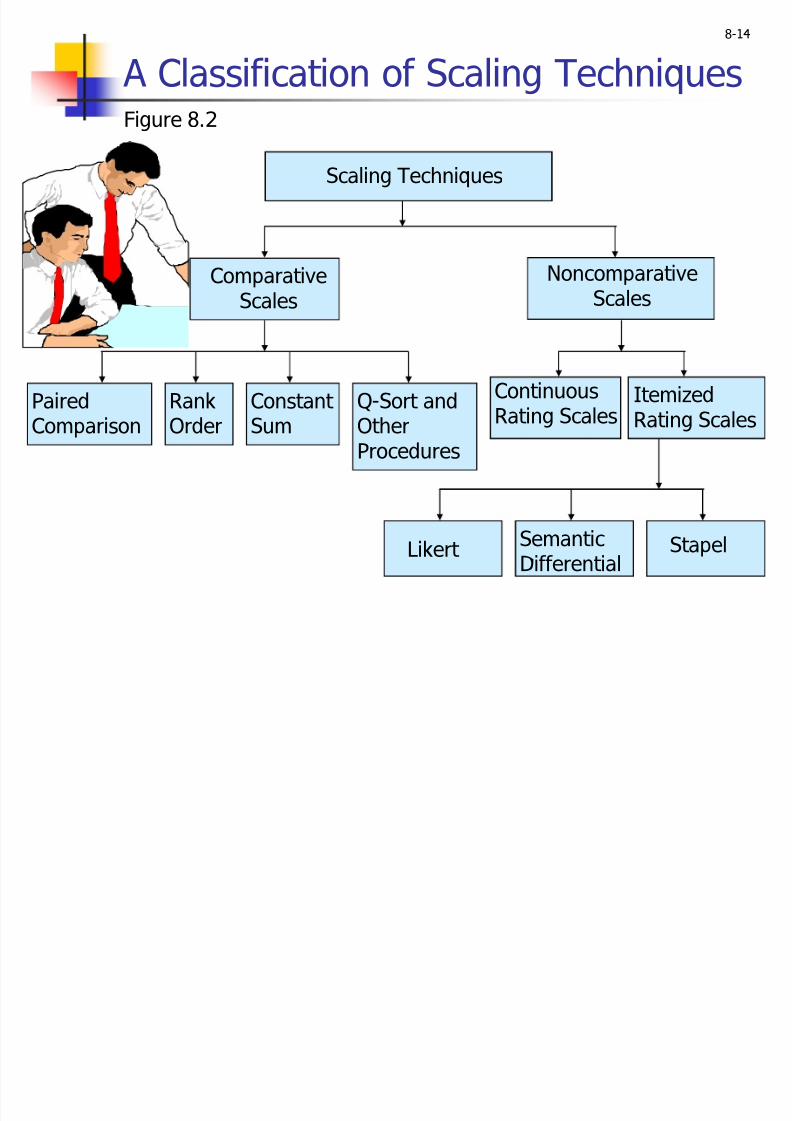
A Classification of Scaling Techniques
Likert SemanticDifferential Stapel
Figure 8.2
Scaling Techniques
NoncomparativeScales
ComparativeScales
PairedComparison
RankOrder
Constant Sum
Q-Sort andOtherProcedures
Continuous
Rating Scales
Itemized
Rating Scales

8/8/2019 Marketing Research 08
http://slidepdf.com/reader/full/marketing-research-08 15/26
8-15
A Comparison of Scaling Techniques
Comparative scales involve the direct comparisonof stimulus objects. Comparative scale data must beinterpreted in relative terms and have only ordinal orrank order properties.
In noncomparative scales, each object is scaledindependently of the others in the stimulus set. Theresulting data are generally assumed to be interval orratio scaled.

8/8/2019 Marketing Research 08
http://slidepdf.com/reader/full/marketing-research-08 16/26
8-16
Relative Advantages of Comparative Scales
Small differences between stimulus objects can bedetected.
Same known reference points for all respondents.
Easily understood and can be applied.
Involve fewer theoretical assumptions. Tend to reduce halo or carryover effects from one
judgment to another.

8/8/2019 Marketing Research 08
http://slidepdf.com/reader/full/marketing-research-08 17/26
8-17
Relative Disadvantages of Comparative Scales
Ordinal nature of the data Inability to generalize beyond the stimulus objects
scaled.

8/8/2019 Marketing Research 08
http://slidepdf.com/reader/full/marketing-research-08 18/26
8-18Comparativ e Scaling Techniqu es Pair ed Comparison Scaling
A r espon dent is pr es ent ed with t wo o bjects an das ked to s el ect on e accor ding to som e crit erion . (eg .Co ke an d Pepsi )
Th e data o btain ed ar e or dinal in natur e.
Pair ed comparison scaling is th e most wi del y us edcomparativ e scaling t echniqu e.
With n bran ds , [n (n - 1) /2] pair ed comparisons ar er equir ed
Un der th e assumption o f transitivit y, it is possi bl e to conv ert pair ed comparison data to a ran k or der .

8/8/2019 Marketing Research 08
http://slidepdf.com/reader/full/marketing-research-08 19/26

8/8/2019 Marketing Research 08
http://slidepdf.com/reader/full/marketing-research-08 20/26
8-20
Paired Comparison Selling
The most common method of taste testing is paired comparison. Theconsumer is asked to sample two different products and select the onewith the most appealing taste. The test is done in private and aminimum of 1,000 responses is considered an adequate sample. A blindtaste test for a soft drink, where imagery, self -perception and brandreputation are very important factors in the consumers purchasingdecision, may not be a good indicator of performance in themarketplace. The introduction of New Coke illustrates this point. NewCoke was heavily favored in blind paired comparison taste tests, but itsintroduction was less than successful, because image plays a major rolein the purchase of Coke.
A paired comparisontaste test

8/8/2019 Marketing Research 08
http://slidepdf.com/reader/full/marketing-research-08 21/26
8-21Comparativ e Scaling Techniqu es Ran k Or der Scaling
Respon dents ar e pr es ent ed with s ev eral o bjects simultan eousl y an d as ked to or der or ran k th em accor ding to som e crit erion .
It is possi bl e that th e r espon dent ma y disli ke th ebran d ran ked 1 in an a bsolut e s ens e.
Furth ermor e, ran k or der scaling also r esults in or dinal data .
Onl y (n - 1) scaling decisions n eed be ma de in ran kor der scaling .

8/8/2019 Marketing Research 08
http://slidepdf.com/reader/full/marketing-research-08 22/26
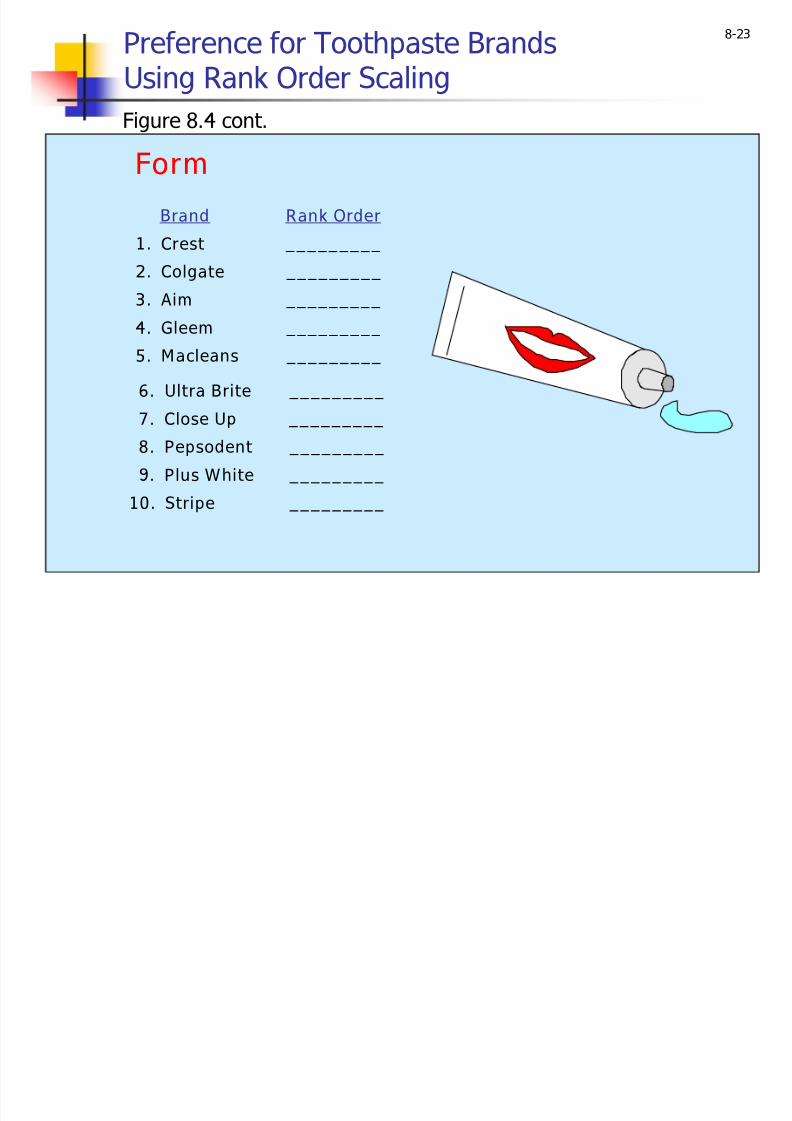
8-22Preference for Toothpaste BrandsUsing Rank Order Scaling
Figure 8.4
Instructions: Rank the various brands of toothpaste in orderof preference. Begin by picking out the one brand that youlike most and assign it a number 1. Then find the second most preferred brand and assign it a number 2. Continue this
procedure until you have ranked all the brands of toothpastein order of preference. The least preferred brand should beassigned a rank of 10.
No two brands should receive the same rank number.
The criterion of preference is entirely up to you. There is noright or wrong answer. Just try to be consistent.
8/8/2019 Marketing Research 08
http://slidepdf.com/reader/full/marketing-research-08 23/26
8-23
Brand Rank Order
1. Crest _________
2. Co
lgate _________3. Aim _________
4. Gleem _________
5. Macleans _________
6. Ultra Brite _________
7. Close Up _________
8. Pepsodent _________
9. Plus White _________
10. Stripe _________
Preference for Toothpaste BrandsUsing Rank Order Scaling
Figure 8.4 cont.
Form
8/8/2019 Marketing Research 08
http://slidepdf.com/reader/full/marketing-research-08 24/26
8-24Comparativ e Scaling Techniqu es Constant Sum Scaling
Respon dents allocat e a constant sum o f units , such as 100 points to attri but es o f a pro duct to r ef l ect th eir importanc e.
If an attri but e is unimportant , th e r espon dent assigns it zero points .
If an attri but e is t wic e as important as som e oth er attri but e, it r ec eiv es t wic e as man y points .
Th e sum o f all th e points is 100. enc e, th e nam e o f th e scal e.

8/8/2019 Marketing Research 08
http://slidepdf.com/reader/full/marketing-research-08 25/26
8-25Importance of Bathing Soap AttributesUsing a Constant Sum Scale
Figure 8.5
Instructions
On the next slide, there are eight attributes of
bathing soaps. Please allocate 100 points amongthe attributes so that your allocation reflects therelative importance you attach to each attribute.The more points an attribute receives, the moreimportant the attribute is. If an attribute is not at
all important, assign it zero points. If an attribute istwice as important as some other attribute, it should receive twice as many points.

8/8/2019 Marketing Research 08
http://slidepdf.com/reader/full/marketing-research-08 26/26
8-26
Figure 8.5 cont.
Form Average Responses of Three Segments
Attribute Segment I Segment II Segment III1. Mildness
2. Lather3. Shrinkage4. Price5. Fragrance
6. Packaging7. Moisturizing8. Cleaning Power
Sum
8 2 42 4 173 7
53 171
7 55 3 20
13 60 15100 100 100
Importance of Bathing Soap AttributesUsing a Constant Sum Scale