Embed Size (px)
Citation preview

MARKETPLACE HOUSING and COMMERCIAL IMPACT ASSESSMENT
City of Wyoming Village of Lockland
April 2008
by

Commercial Impact Analysis & Marketplace Housing Assessment City of Wyoming and Village of Lockland
April 2008 Page 2
INTRODUCTION
The following is a comprehensive Commercial Impact and Marketplace Housing Assessment compiled for the marketplace surrounding the City of Wyoming and the Village of Lockland. The market-based analysis was conducted utilizing com-mercial data gathered on competitive projects in the proposed trade area, recorded commercial inventory and activity,
and specific household demographics, residential transfers, and expenditure data to estimate future space demands, po-tential for development, and trends in the marketplace.
Scope of Assessment Page 3 Definitions Page 4
City of Wyoming Master Plan Page 5 Professional Observations Page 6
Commercial Impact Analysis Page 7 Commercial Trade Areas Page 8
Retail Trade Area Overview Page 9-11 Office Market Assessment Page 12-14 Retail and Office Findings Page 15
Marketplace Housing Assessment Page 16 Marketplace Search Areas Page 17-18 Household Demographic Data Page 19-24
Housing Market Performance Page 25-27 Professional Recommendations Page 28-31
Confidentiality and Disclaimers Page 32
TABLE of CONTENTS

Commercial Impact Analysis & Marketplace Housing Assessment City of Wyoming and Village of Lockland
April 2008 Page 3
SCOPE OF ASSESSMENT
The Village of Lockland and the City of Wyoming have joined forces to better understand their development potential. Both municipalities share Business Districts located along Wyoming Avenue and extending from State Route 4 in Wyo-ming eastward into Lockland, past Interstate 75 and beyond. With a desire to fully understand the current residential
and commercial real estate market conditions, Wyoming and Lockland have engaged Property Advisors to provide the Scope of Services outlined below:
Marketplace Housing Study. The Marketplace Housing Study will identify and measure the household profiles, consumer buying
power and market depth of the City of Wyoming, Village of Lockland and surrounding housing markets (Demographic Areas) based upon 2007 U.S. Census data. Consultant will also gather information on recorded housing transfers of all types within the same competitive housing market (Search Area) over the last three years. The analysis intends to reveal specific housing trends,
unserved housing needs and development or redevelopment opportunities.
� Current year household demographic data within the Demographic Areas and select surrounding cities, as agreed by Client
and Consultant, in both tabular form and then geographically mapped for relevant metrics by US Census block group.
� Current year psychographic lifestyle segmentation data within the same Demographic Areas and the same select sur-
rounding cities in both tabular form and then mapped for dominant segments by US Census block group.
� Trends and analyses of all recorded housing transfer activity within the Search Area for the prior three years, sorted by
major neighborhood or subdivisions, home product type, sales price and sales date. Professional and market-comparative conclusions into the Search Area’s depth and character of current housing stock, housing performance, and expected
housing market potential.
� Professional recommendations on any and all unserved and underserved housing market positions by product and mix,
with suggested price points. Executive Summary of these findings.
Commercial Impact Study. To optimize these preparations and launch a positive economic spiral for the City and Village, Con-sultant will conduct a feasibility study of each commercial property type and incorporate the impact of additional residential devel-
opment for the City and Village, plus its surrounding communities. In addition, Consultant will conduct an overall competitive analysis to optimize the overall redevelopment strategy.
� Supply and demand analysis of all retail, office and restaurant product within identified, relevant trade areas.
� Professional recommendations on market absorption of retail, office and restaurant product, including recommended lease
rates and tenant finish allowances.
� Identification of retail and office shortfalls by category in the same relevant trade areas, taking into account the concentra-
tion of current year psychographic lifestyle segments found in the Marketplace Housing Study.

Commercial Impact Analysis & Marketplace Housing Assessment City of Wyoming and Village of Lockland
April 2008 Page 4
Housing Search Area Housing activity and housing demand were analyzed within the Search Area by collecting housing transfer data of
the surrounding the cities, or areas of Wyoming, Lockland, Finneytown, Woodlawn, and Lincoln Heights.
Immediate Trade Area (ITA) The ITA was used for the Commercial Impact Analysis and encompasses a 1-mile radius around the center point
(CP) of Oak and Wyoming Avenues. This considers the supply and potential demand within the trade area, and
encompasses both Wyoming’s and Lockland’s Business Districts. Primary Trade Area (PTA):
The PTA encompasses a 3-mile radius around the CP. This area inventories competitive supply and commercial demand potentially captured by the Wyoming and Lockland primary market area.
Secondary Trade Area (STA):
The STA was also captured for purposes of commercial supply and demand, which encompasses the PTA and ITA in their entirety, and extends further to include a 6-mile radius from the CP.
Cincinnati-Middletown Metropolitan Statistical Area (MSA):
The MSA represents the larger regional population, and contains the following counties: Butler, Warren, Hamilton, Clermont, and Brown (Ohio); Boone, Kenton, Campbell, Gallatin, Grant, Pendleton, and Bracken (Kentucky); Franklin, Dearborn, and Ohio (Indiana).
Mixed-Use: A development, within one or several buildings, that combines at least three significant revenue-producing uses
that are physically and functionally integrated and developed in conformance with a coherent plan.
The following product types are analyzed within this report:
Residential: Property used primarily as a place to live. Retail: Property used by a retail business for the sale of merchandise or services.
Restaurant: Place where meals are served to the public. Office: Building used exclusively or primarily for office use, as opposed to manufacturing, warehousing, or other uses.
ASSESSMENT DEFINITIONS

Commercial Impact Analysis & Marketplace Housing Assessment City of Wyoming and Village of Lockland
April 2008 Page 5
The market “canvas” for our analyses was the established and progressive City of Wyoming Master Plan, an elegant concentration of real estate
assets that was launched by the City to establish Zones of Potential Change, preservation, and conservation.
North Pike Zone is home to the Wyoming Recreation Center, and also hosts the retail and grocery destinations where many Wyoming residents shop
and bank. Many of the retail choices are actually located in Woodlawn. There are few retail shops in Wyoming in the North Pike Zone, one that may come available for redevelopment in the future.
The Promenade is a small strip of retail stores and cafes at the corner of Wyoming Avenue and Springfield Pike. It serves as the entryway into the
Business District located in the City Center. South Pike Zone is located in Springfield Township.
This zone boasts retail and consumer service centers that cater to Wyoming residents as well as those from Springfield Township.
The City Center is a mixed-use area of town that affords boutique retail and restaurants, homes on smaller lots and apartment buildings atop retail in
both Wyoming and Lockland. Lockland’s street layout and zoning is very similar to that of Wyoming’s, however, property owners have not maintained the buildings over the years, creating a visually eroded
look of Lockland’s share of the Business District. As noted by the green boundaries at left, some of the
Zones of Potential Change are located outside Wyoming City limits. Purposefully drawn in this manner, Wyoming realizes
that initial investment in the neighboring areas would likely sustain their community health for years to come.
City of Wyoming Master Plan—Zones of Potential Change

Commercial Impact Analysis & Marketplace Housing Assessment City of Wyoming and Village of Lockland
April 2008 Page 6
� There is today a high concentration of affluent and lifestyle driven households in the City of Wyoming,
characterized by larger homes and families, higher-paying jobs in more distant employment centers with longer com-mutes, and overall superior household buying power for a range of goods, services and experiences.
� The housing market in Wyoming remains strong, but is lacking single-family attached product at the en-
try-level, upscale price range of $200,000 to $300,000. For-sale attached housing product is vital to creating a vibrant mixed-use town center, although there remains a paucity of attached housing choices. From our experience, we believe that sustainable town centers are driven by the diversity of their residential components and choices be-cause they help to attract diverse residents that will sustain a community’s health over time.
� The Village of Lockland shows high-earning residents seemingly unserved by Lockland’s current housing stock. This
demonstrates that Lockland has potential to offer new and higher valued housing stock to cater to these households, and potentially attract more to the area.
� Lockland has the potential to offer neighborhood serving retail that would cater to the needs of residents
near its Business District. Lockland’s challenge lies within its ability to offer a genuine “place” that provides the quality of lifestyle many contributing households seek. Without this, their current residents must travel outside the Village to find this experience in other communities.
� Both the Village of Lockland and the City of Wyoming offer very limited retail options. Because of this, we see a
strong amount of retail leakage into surrounding communities. Retail dollars spent by residents from Wyo-ming and Lockland are spent in communities such as Finneytown (Springfield Township), Woodlawn and Hartwell. Wyoming and Lockland should collaborate in thought and resources to provide options that cater to their residents
needs and allow them to invest into their own communities.
� Our Commercial Impact Analysis has found that the immediate submarkets of Wyoming and Lockland
currently have the demand necessary to support new office and retail commercial space. Household demo-graphic and other commercial market factors reveal that 200,000 SF of office, and 250,000 SF of retail could be ab-
sorbed by Lockland and Wyoming over the next five years. With the proper development design and strategy, these commercial offerings would not only cater to the household consumers looking for convenient shopping options, but also to the consumers looking for a shopping and entertainment lifestyle experience.
� This additional commercial demand within Wyoming and Lockland must be strategically located within the community.
A development strategy should be launched through the combined efforts of Lockland and Wyoming in order to balance and maximize community impact and spur additional economic activity.
Property Advisors believes a strong market understanding combined with traditional planning and physical analysis will lead to powerful, economically driven and sustainable development strategies.
PROFESSIONAL MARKET OBSERVATIONS

Commercial Impact Analysis & Marketplace Housing Assessment City of Wyoming and Village of Lockland
April 2008 Page 7
COMMERCIAL IMPACT ASSESSMENT City of Wyoming
Village of Lockland

Commercial Impact Analysis & Marketplace Housing Assessment City of Wyoming and Village of Lockland
April 2008 Page 8
The City of Wyoming and Village of Lockland’s com-mercial environment is impacted by activity beyond their boundaries. To capture the data that represents
those areas, Property Advisors selected the intersec-tion of Oak and Wyoming Avenues as this assess-ment’s center point (CP) shown as the red star at left. Also shown in color shades are Wyoming, Lockland,
Woodlawn, Lincoln Heights and Finneytown. From the CP, three distinct Trade Areas were established as the Immediate, Primary and Secondary Trade Areas.
These areas are defined as follows: IMMEDIATE TRADE AREA (ITA) The Immediate Trade Area represents a one-mile ra-
dius from the center point and incorporates the most relevant demand for the City of Wyoming and Village of Lockland, shown in dark blue.
PRIMARY TRADE AREA (PTA) The Primary Trade Area encompasses the ITA and ex-tends the radius three miles from the center point. The
PTA includes the additional Villages of Woodlawn and Glendale, plus a large portion of Springfield Township, shown in blue.
SECONDARY TRADE AREA (STA) The Secondary Trade Area encompasses both the ITA
and STA, extending six miles form the center point. This STA captures the majority of the commercial in-ventory in the Cincinnati MSA, including the submar-kets of Kenwood, Blue Ash, Tri County and Norwood,
shown in light blue.
Property Advisors examined the commercial inventory, competitive projects, and other relevant market fac-tors within these Areas to measure the possible com-
mercial space that could be supported in the combined Wyoming and Lockland community. By examining the commer-cial environments of the ITA, PTA, and STA, Property Advisors is better able to gauge the impact of new commercial de-velopment and the potential market demand in the City of Wyoming and Village of Lockland.
COMMERCIAL TRADE AREA OVERVIEW
Wyoming-Lockland CP
Cincinnati cityCincinnati cityCincinnati cityCincinnati cityCincinnati city
Amberley villageAmberley villageAmberley villageAmberley villageAmberley village
Arlington Heights villageArlington Heights villageArlington Heights villageArlington Heights villageArlington Heights village
Blue Ash cityBlue Ash cityBlue Ash cityBlue Ash cityBlue Ash city
Deer Park cityDeer Park cityDeer Park cityDeer Park cityDeer Park city
Dillonvale CDPDillonvale CDPDillonvale CDPDillonvale CDPDillonvale CDP
Elmwood Place villageElmwood Place villageElmwood Place villageElmwood Place villageElmwood Place village
Evendale villageEvendale villageEvendale villageEvendale villageEvendale village
Fairfax villageFairfax villageFairfax villageFairfax villageFairfax village
Finneytown CDPFinney town CDPFinneytown CDPFinneytown CDPFinneytown CDP
Forest Park cityForest Park cityForest Park cityForest Park cityForest Park city
Glendale villageGlendale villageGlendale villageGlendale villageGlendale village
Golf M anor villageGolf M anor villageGolf M anor villageGolf M anor villageGolf M anor village
Greenhills villageGreenhills villageGreenhills villageGreenhills villageGreenhills village
Groesbeck CDPGroesbeck CDPGroesbeck CDPGroesbeck CDPGroesbeck CDP
Kenwood CDPKenwood CDPKenwood CDPKenwood CDPKenwood CDP
Lincoln Heights villageLincoln Heights villageLincoln Heights villageLincoln Heights villageLincoln Heights village
M adeira cityM adeira cityM adeira cityM adeira cityM adeira cityM onfort Heights East CDPM onfort Heights East CDPM onfort Heights East CDPM onfort Heights East CDPM onfort Heights East CDP
M onfort Heights South CDPM onfort Heights South CDPM onfort Heights South CDPM onfort Heights South CDPM onfort Heights South CDP
M ount Healthy cityM ount Healthy cityM ount Healthy cityM ount Healthy cityM ount Healthy city
M ount Healthy Heights CDPM ount Healthy Heights CDPM ount Healthy Heights CDPM ount Healthy Heights CDPM ount Healthy Heights CDP
Northbrook CDPNorthbrook CDPNorthbrook CDPNorthbrook CDPNorthbrook CDP
North College Hill cityNorth College Hill cityNorth College Hill cityNorth College Hill cityNorth College Hill city
Northgate CDPNorthgate CDPNorthgate CDPNorthgate CDPNorthgate CDP
Norwood cityNorwood cityNorwood cityNorwood cityNorwood city
Pleasant Run CDPPleasant Run CDPPleasant Run CDPPleasant Run CDPPleasant Run CDP
Pleasant Run Farm CDPPleasant Run Farm CDPPleasant Run Farm CDPPleasant Run Farm CDPPleasant Run Farm CDP
Reading cityReading cityReading cityReading cityReading city
St. Bernard citySt. Bernard citySt. Bernard citySt. Bernard citySt. Bernard city
Sharonville citySharonville citySharonville citySharonville citySharonville city
Silverton citySilverton citySilverton citySilverton citySilverton city
Sp ringdale citySpringdale citySp ringdale citySp ringdale citySp ringdale city
White Oak CDPWhite Oak CDPWhite Oak CDPWhite Oak CDPWhite Oak CDP
White Oak East CDPWhite Oak East CDPWhite Oak East CDPWhite Oak East CDPWhite Oak East CDP
Woodlawn villageWoodlawn villageWoodlawn villageWoodlawn villageWoodlawn village
Wyoming cityWy oming cityWy oming cityWy oming cityWy oming city
Bu t
ler
Wa
r re n
Rd
But
ler
Wa
rren
Rd
Bu t
ler
Wa r
r en
Rd
Bu
tler
Wa
rren
Rd
Bu t
ler
Wa
rren
Rd
North Bend RdNorth Bend RdNorth Bend RdNorth Bend RdNorth Bend Rd
E Fork Ave
E Fork Ave
E Fork Ave
E Fork Ave
E Fork AveHopkins Ave
Hopkins Ave
Hopkins Ave
Hopkins Ave
Hopkins Ave
Del
ta A
veD
elta
Av e
Del
t a A
veD
elt a
Ave
Del
t a A
ve
Edw
ard
s R
dE
dwa
rds
Rd
Edw
ard
s R
dE
dw
ard
s R
dE
dwa
rds
Rd
Fleming RdFleming RdFleming RdFleming RdFleming RdSmalley RdSmalley RdSmalley Rd
Smalley RdSmalley Rd
Compton RdCompton RdCompton RdCompton RdCompton Rd Spooky H
ollow Rd
Spooky Hollow Rd
Spooky Hollow R
d
Spooky Hollow Rd
Spooky Hollow Rd
W Galbraith RdW Galbraith RdW Galbraith RdW Galbraith RdW Galbraith Rd
Blo
me
Rd
Blo
me
Rd
Blo
me
Rd
Blo
me
Rd
Blo
me
Rd
Section RdSection RdSection RdSection RdSection Rd Section RdSection RdSection RdSection RdSection Rd
Center H
ill Ave
Center H
ill Ave
Center H
ill Ave
Center H
ill Ave
Center H
ill Ave
Car
thag
e A
veC
arth
age
Ave
Car
thag
e A
veC
arth
age
Ave
Car
thag
e A
ve
Spring Grove Ave
Spring Grove Ave
Spring Grove Ave
Spring Grove Ave
Spring Grove Ave
E Mitchell Ave
E Mitchell Ave
E Mitchell Ave
E Mitchell Ave
E Mitchell AveWoolper AveWoolper AveWoolper AveWoolper AveWoolper Ave
Murray Ave
Murray AveMurray Ave
Murray Ave
Murray AveWasson RdWasson RdWasson RdWasson RdWasson Rd
Chu
rch
St
Chu
rch
St
Chu
rch
St
Chu
rch
St
Chu
rch
St
W Crescentville RdW Crescentville RdW Crescentville RdW Crescentville RdW Crescentville Rd
Crescentville RdCrescentville RdCrescentville RdCrescentville RdCrescentville RdFields Ertel RdFields Ertel RdFields Ertel RdFields Ertel RdFields Ertel Rd
W Sharon RdW Sharon RdW Sharon RdW Sharon RdW Sharon Rd
Woodford RdWoodford RdWoodford RdWoodford RdWoodford Rd
Woodridge Blvd
Woodridge Blvd
Woodridge BlvdWoodridge Blvd
Woodridge BlvdRo s
s R
dR
oss
Rd
Ros
s R
dR
oss
Rd
Ros
s R
d
Dimmick RdDimmick RdDimmick RdDimmick RdDimmick Rd
W North Bend RdW North Bend RdW North Bend RdW North Bend RdW North Bend Rd
Resor RdResor RdResor RdResor RdResor Rd
Clif
t on
Ave
Cli f
ton
Ave
Clif
t on
Ave
Clif
t on
Ave
Clif
t on
Ave Erie
Ave
Erie
Ave
Erie
Ave
Erie
Ave
Erie
Ave
Mill
Rd
Mil l
Rd
Mill
Rd
Mill
Rd
Mill
Rd
W Kemper RdW Kemper RdW Kemper Rd
W Kemper RdW Kemper Rd
Re a
din
g R
dR
ead
ing
Rd
Rea
din
g R
dR
ead i
ng
Rd
Rea
din
g R
d
Ree
d H
artm
an H
wy
Ree
d H
artm
an H
wy
Ree
d H
artm
an H
wy
Ree
d H
artm
an H
wy
Ree
d H
artm
an H
wy
Glendale Milford RdGlendale Milford RdGlendale Milford RdGlendale Milford RdGlendale Milford Rd
Summ
it Rd
Summ
it Rd
Summ
it Rd
Summ
it Rd
Summ
it Rd
Euclid AveEuclid AveEuclid AveEuclid AveEuclid Ave
Highland AveHighland AveHighland AveHighland Ave
Highland Ave
Putz PlPutz PlPutz PlPutz PlPutz Pl
Montana Ave
Montana Ave
Montana Ave
Montana Ave
Montana Ave
Dana AveDana AveDana AveDana AveDana Ave
Hopple StHopple StHopple StHopple StHopple St
Pla
infie
ld R
dP
lain
field
Rd
Pla
infie
ld R
dP
lain
field
Rd
Pla
infie
ld R
d
E Galbraith Rd
E Galbraith Rd
E Galbraith Rd
E Galbraith Rd
E Galbraith Rd
Madison Rd
Madison R
d
Madison Rd
Madison Rd
Madison Rd
Beekm
an St
Beekm
an St
Beekm
an St
Beekm
an St
Beekm
an St
Struble RdStruble RdStruble RdStruble RdStruble Rd
Win
ton
Rd
Win
ton
Rd
Win
ton
Rd
Win
ton
Rd
Win
ton
Rd
Losantiville AveLosantiville AveLosantiville AveLosantiville AveLosantiville Ave
Euclid RdEuclid RdEuclid RdEuclid RdEuclid Rd
ITA
PTA
STA

Commercial Impact Analysis & Marketplace Housing Assessment City of Wyoming and Village of Lockland
April 2008 Page 9
TRADE AREA RETAIL INVENTORY The Retail Assessment was conducted by analyzing these three Trade Areas, with a summary of the Trade Area inven-
tory listed below. Unless considered significant, retail projects under 5,000 SF and those built before 1980 were not considered in the inventory*.
* A list of the Retail inventory within the Trade Areas will be found in the Addendum of a full Assessment Report upon request.
ITA Inventory Summary: Retail
� Total Space: 150,000 SF
� Majority of space is located on
Wyoming Avenue
� Current Vacancy: 14%
Restaurant
� Total Space: 32,000 SF
� Current Vacancy: 11%
� Planned Space: none
PTA Inventory Summary: Retail
� Total Space: 2,495,000 SF
� Current Vacancy: 10%
� Majority of space is located along
Reading Road/Winton Road
Restaurant
� Total Space: 110,000 SF
� Current Vacancy: 8%
� Planned Space: none
STA Inventory Summary: Retail
� Total Space: 9,620,000 SF
� Current Vacancy: 12%
� Comprises the commercial submar-
kets of Kenwood, Blue Ash, Tri
County and Norwood.
COMMERCIAL IMPACT ANALYSIS — RETAIL MARKET ASSESSMENT, continued.

Commercial Impact Analysis & Marketplace Housing Assessment City of Wyoming and Village of Lockland
April 2008 Page 10
GREATER CINCINNATI RETAIL MARKET OVERVIEW The findings and conclusions of our supply and demand analysis within the Primary and Secondary Trade Areas are
shown in the next few pages. Beginning with a review of the Retail Market Assessment, we examined the Greater Cincin-nati Submarket Statistics found in the graph below.
Greater Cincinnati Market Retail vacancy in Greater Cincinnati was at 10% with an average lease rate of $12.29/SF per year at mid-year 2007. The retail market for the entire metropolitan area has been solid and we believe the demand sustained should keep the
region relatively healthy for the foreseeable future. Tri-County Submarket The Immediate, Primary, and Secondary Trade Areas are a part of the submarket listed above as the Tri-County submar-
ket. This submarket is inline with the overall Greater Cincinnati Market with respect to vacancy and performs slightly better than the overall market in lease rates. The Tri-County vacancy rates fall just above 10% and the net lease rates reach $13.63.
Source: CB Richard Ellis Marketview Mid-year 2007
COMMERCIAL IMPACT ANALYSIS — RETAIL MARKET ASSESSMENT, continued.

Commercial Impact Analysis & Marketplace Housing Assessment City of Wyoming and Village of Lockland
April 2008 Page 11
DETERMINANTS OF RETAIL DEMAND: Property Advisors considers key market, demographic, and sales factors when conducting a Supply and Demand Analysis
for Retail. Key factors that help to determine demand are listed below. Household Income:
� Immediate Trade Area Average household income: $64,314
� Primary Trade Area Average household income: $60,334
� Secondary Trade Area Average household income: $54,142
Household Growth:
� ITA expected growth over the next 5 years -6.13%
� PTA expected growth over the next 5 years -4.43%
� STA expected growth over the next 5 years -4.49%
Spending Habits:
� Average household income spent on Retail items 36%
� Retail dollars spent in shopping centers 85%
� Retail dollars spent in community shopping centers 54%
� Average household income spent on Food Outside of the Home 15%
Sale per Square Foot:
� Average sales per square foot for neighborhood shopping retail $275—$375
� Average sales per square foot for restaurant space $200—$350
Frictional Vacancy:
� A healthy frictional vacancy is estimated as 10% of the current vacancy that will be filled from new demand.
� Current space and planned competitive space are also considered.
Capture Rate:
� A Capture Rate, subjective to market conditions, is used to determine the estimated percentage of total de-
mand within a targeted market segment that a proposed project would be expected to attract.
COMMERCIAL IMPACT ANALYSIS — RETAIL MARKET ASSESSMENT
The supply and de-mand analysis was
conducted for all three of the trade areas and
based upon a five year model.

Commercial Impact Analysis & Marketplace Housing Assessment City of Wyoming and Village of Lockland
April 2008 Page 12
TRADE AREA OFFICE INVENTORY The Retail Assessment was conducted by analyzing these same three Trade Areas, with a summary of the Trade Area in-
ventory listed below. Unless considered significant, retail projects under 5,000 SF and those built before 1980 were not considered in the inventory*.
* A list of the Office inventory within the Trade Areas will be found in the Addendum of a full Assessment Report upon request.
ITA Inventory Summary: Office
� Total space: 115,000 SF
� Current vacancy: 10%
� The majority of the projects are lo-
cated within the Springfield Pike
corridor
PTA Inventory Summary: Office
� Total Space: 2,140,000 SF
� Current vacancy: 18%
� The majority of the projects are un-
der 10,000 SF
STA Inventory Summary: Office
� Total Space: 13,150,000 SF
� Current vacancy: 23%
� Over 300,000 SF currently under
construction
COMMERCIAL IMPACT ANALYSIS — OFFICE MARKET ASSESSMENT, continued.
Commercial Impact Analysis & Marketplace Housing Assessment City of Wyoming and Village of Lockland
April 2008 Page 13
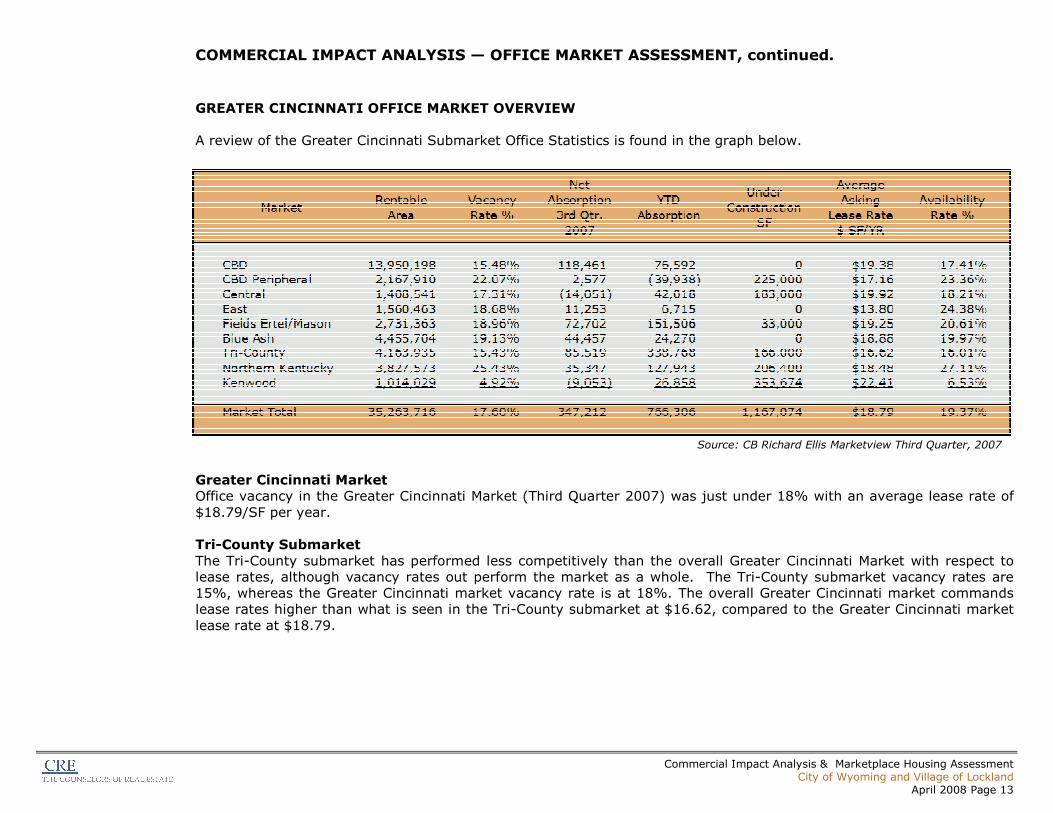
GREATER CINCINNATI OFFICE MARKET OVERVIEW A review of the Greater Cincinnati Submarket Office Statistics is found in the graph below.
Greater Cincinnati Market Office vacancy in the Greater Cincinnati Market (Third Quarter 2007) was just under 18% with an average lease rate of
$18.79/SF per year. Tri-County Submarket
The Tri-County submarket has performed less competitively than the overall Greater Cincinnati Market with respect to lease rates, although vacancy rates out perform the market as a whole. The Tri-County submarket vacancy rates are 15%, whereas the Greater Cincinnati market vacancy rate is at 18%. The overall Greater Cincinnati market commands lease rates higher than what is seen in the Tri-County submarket at $16.62, compared to the Greater Cincinnati market
lease rate at $18.79.
Source: CB Richard Ellis Marketview Third Quarter, 2007
COMMERCIAL IMPACT ANALYSIS — OFFICE MARKET ASSESSMENT, continued.

Commercial Impact Analysis & Marketplace Housing Assessment City of Wyoming and Village of Lockland
April 2008 Page 14
DETERMINANTS OF OFFICE DEMAND: Property Advisors considers key market, demographic and employment factors when conducting a Supply and Demand
Analysis for office development. Key office demand is driven by: Total Employment Growth:
The Cincinnati-Middletown MSA is forecasted to grow by approximately 50,000 jobs (2007-2012), according to the
Bureau of Labor Statistics.
Office Employment: Based on the Bureau of Labor Statistics Standard Occupation Classification (SOC) categories, the percentage of office employment in the Cincinnati-Middletown MSA is estimated at 45%.
Space per Worker:
The amount of space per office worker varies according to industry. For our analysis, the amount of space is esti-mated at 150—250 SF per employee. This estimate is based upon employment and current available office space
within Trade Areas.
Trade Area Capture Rate: The Trade Areas are estimated to capture 5% to 50% of space required by new Office workers within the Cincin-nati-Middletown MSA. This estimate is based on the total jobs within the Cincinnati-Middletown MSA currently be-ing captured by the Trade Areas.
Existing Vacant Space:
The office market assessment assumes that only a portion, 10% of the current vacant office space, will be filled from new demand.
Planned Space: The majority of planned competitive office space is assumed to be occupied.
COMMERCIAL IMPACT ANALYSIS — OFFICE MARKET ASSESSMENT

Commercial Impact Analysis & Marketplace Housing Assessment City of Wyoming and Village of Lockland
April 2008 Page 15
After considering the relevant market and demographic factors that help to determine supply and demand, a forecast of Trade Area market absorption can be found below:
SUMMARY OF COMMERCIAL DEMAND: With an assessment of the determinants of demand, 525,000 to 725,000 square feet of commercial space could be absorbed over the next five years by the City of Wyoming and Village Of Lockland, an average of 105,000-145,000
square feet per year.
In this analysis, the largest amount of demand in each product is found within the Secondary Trade Area. The lowest amount of commercial demanded is found within the Immediate area of Wyoming and Lockland.
Given the number of affluent households within the trade areas, the significant demand for commercial space is not un-expected. The lack of viable commercial space within the Immediate Trade Area, in addition to residents’ high disposable incomes, have generated “leakage” of retail dollars spent in outside communities. The City of Wyoming and Village of
Lockland have an opportunity to recapture a share of this “leakage” through sustainable commercial development oppor-tunities which exist in both of the communities. There is potential for developments outside of the City of Wyoming and Village of Lockland to also capture this same de-
mand. It is crucial for Wyoming and Lockland to collaborate in order to capture this demand before surrounding areas seize the opportunity themselves, thus contributing further to the “leakage” of expenditures spent by Wyoming and Lock-land residents.
COMMERCIAL IMPACT ANALYSIS — COMBINED RETAIL and OFFICE MARKET FINDINGS
Trade
AreaOffice Retail Restaurant
ITA Annual
Absorption40,000 - 50,000 50,000 - 70,000 15,000 - 25,000
5 Year
Total200,000 - 250,000 SF 250,000 - 350,000 SF 75,000 -125,000 SF

Commercial Impact Analysis & Marketplace Housing Assessment City of Wyoming and Village of Lockland
April 2008 Page 16
MARKETPLACE HOUSING ASSESSMENT City of Wyoming
Village of Lockland

Commercial Impact Analysis & Marketplace Housing Assessment City of Wyoming and Village of Lockland
April 2008 Page 17
Our look into the surrounding mar-ketplace begins with carefully se-lected trade areas to gauge house-
hold depth and relative housing mar-ket performance, as shown in the map at left. The tan shaded areas denote the corporate boundaries of
either cities or Census defined places (CDP). Shown in colored shades are Wyoming, Lockland, Woodlawn, Lin-
coln Heights and Finneytown. Key household demographics were also measured in drive times from
the center point, shown as irregular 8- and 15-minute Drive Areas. The core 8-minute Area under normal traffic conditions and speed limits is
shown in dark violet, while a more regional 15-minute Area is shown in violet, each from the previous
center point (CP) of Oak Avenue and Wyoming Avenue. For this Assessment, we will concen-
trate on the households within the limits of Wyoming and Lockland and then reference their demograph-
ics against the surrounding commu-nities of Woodlawn, Lincoln Heights, and Finneytown and also within the adjacent 8-minute Area.
Later, for recent housing market ac-tivity and sales performance, we will examine the recorded residential
transfers in the same areas above. The following page provides a detail of the map above within the 8-minute Drive Area.
HOUSEHOLD DEMOGRAPHIC DATA and TRENDS
Wyom ing-Lockland CP
Cincinnati cityCincinnati cityCincinnati cityCincinnati cityCincinnati city
Amberley villageAmberley villageAmberley villageAmberley villageAmberley village
Arlington Heights villageArlington Heights villageArlington Heights villageArlington Heights villageArlington Heights village
Blue Ash cityBlue Ash cityBlue Ash cityBlue Ash cityBlue Ash city
Bridgetown North CDPBridgetown North CDPBridgetown North CDPBridgetown North CDPBridgetown North CDPCheviot cityCheviot cityCheviot cityCheviot cityCheviot city
Deer Park cityDeer Park cityDeer Park cityDeer Park cityDeer Park city
Dillonvale CDPDillonvale CDPDillonvale CDPDillonvale CDPDillonvale CDP
Elmwood Place villageElmwood Place villageElmwood Place villageElmwood Place villageElmwood Place village
Evendale villageEvendale villageEvendale villageEvendale villageEvendale village
Fairfax villageFairfax villageFairfax villageFairfax villageFairfax village
Finney town CDPFinney town CDPFinney town CDPFinney town CDPFinney town CDP
Forest Park cityForest Park cityForest Park cityForest Park cityForest Park city
Glendale villageGlendale villageGlendale villageGlendale villageGlendale village
Golf M anor villageGolf M anor villageGolf M anor villageGolf M anor villageGolf M anor village
Greenhills villageGreenhills villageGreenhills villageGreenhills villageGreenhills village
Groesbeck CDPGroesbeck CDPGroesbeck CDPGroesbeck CDPGroesbeck CDP
Kenwood CDPKenwood CDPKenwood CDPKenwood CDPKenwood CDP
Lincoln Heights villageLincoln Heights villageLincoln Heights villageLincoln Heights villageLincoln Heights village
M adeira cityM adeira cityM adeira cityM adeira cityM adeira cityM onfort Heights East CDPM onfort Heights East CDPM onfort Heights East CDPM onfort Heights East CDPM onfort Heights East CDP
M onfort Heights South CDPM onfort Heights South CDPM onfort Heights South CDPM onfort Heights South CDPM onfort Heights South CDP
M ontgomery cityM ontgomery cityM ontgomery cityM ontgomery cityM ontgomery city
M ount Healthy cityM ount Healthy cityM ount Healthy cityM ount Healthy cityM ount Healthy city
M ount Healthy Heights CDPM ount Healthy Heights CDPM ount Healthy Heights CDPM ount Healthy Heights CDPM ount Healthy Heights CDP
Northbrook CDPNorthbrook CDPNorthbrook CDPNorthbrook CDPNorthbrook CDP
North College Hill cityNorth College Hill cityNorth College Hill cityNorth College Hill cityNorth College Hill city
Northgate CDPNorthgate CDPNorthgate CDPNorthgate CDPNorthgate CDP
Norwood cityNorwood cityNorwood cityNorwood cityNorwood city
Pleasant Run CDPPleasant Run CDPPleasant Run CDPPleasant Run CDPPleasant Run CDP
Pleasant Run Farm CDPPleasant Run Farm CDPPleasant Run Farm CDPPleasant Run Farm CDPPleasant Run Farm CDP
Reading cityReading cityReading cityReading cityReading city
St. Bernard citySt. Bernard citySt. Bernard citySt. Bernard citySt. Bernard city
Sharonville citySharonville citySharonville citySharonville citySharonville city
Silverton citySilverton citySilverton citySilverton citySilverton city
Springdale citySp ringdale citySpringdale citySpringdale citySpringdale city
The Village of Indian Hill cityThe Village of Indian Hill cityThe Village of Indian Hill cityThe Village of Indian Hill cityThe Village of Indian Hill city
White Oak CDPWhite Oak CDPWhite Oak CDPWhite Oak CDPWhite Oak CDP
White Oak East CDPWhite Oak East CDPWhite Oak East CDPWhite Oak East CDPWhite Oak East CDP
Woodlawn villageWoodlawn villageWoodlawn villageWoodlawn villageWoodlawn village
Wy oming cityWyoming cityWyoming cityWyoming cityWyoming city
Bu t
ler
Wa
r ren
Rd
But
ler
Wa
rren
Rd
Bu t
ler
War
ren
Rd
Bu
tler
Wa
r re n
Rd
Bu t
ler
Wa
r re n
Rd
Mai
n A
veM
a in
Ave
Mai
n A
veM
ain
Ave
Mai
n A
ve
North Bend RdNorth Bend RdNorth Bend RdNorth Bend RdNorth Bend Rd
E Fork Ave
E Fork Ave
E Fork Ave
E Fork Ave
E Fork AveHopkins Ave
Hopkins Ave
Hopkins Ave
Hopkins Ave
Hopkins Ave
Westbrook DrWestbrook DrWestbrook DrWestbrook DrWestbrook Dr
De l
ta A
veD
elta
Ave
Del
ta A
veD
elta
Ave
Del
ta A
ve
Edw
ard
s R
dE
dwa
rds
Rd
Edw
a rd
s R
dE
dw
ard
s R
dE
dwa
rds
Rd
Sn i
der R
dS
nide
r Rd
Sn
ide r
Rd
Sni
der R
dS
nide
r Rd
Colerain A
ve
Colerain A
ve
Colerain A
ve
Colerain A
ve
Colerain A
ve
Fleming RdFleming RdFleming RdFleming RdFleming RdSmalley RdSmalley RdSmalley Rd
Smalley RdSmalley Rd
Compton RdCompton RdCompton RdCompton RdCompton Rd Spooky H
ollow Rd
Spooky Hollow Rd
Spooky Hollow R
d
Spooky Hollow
Rd
Spooky Hollow Rd
W Galbraith RdW Galbraith RdW Galbraith RdW Galbraith RdW Galbraith Rd
Blo
me
Rd
Blo
me
Rd
Blo
me
Rd
Blo
me
Rd
Blo
me
Rd
Section RdSection RdSection RdSection RdSection Rd Section RdSection RdSection RdSection RdSection Rd
Che
viot
Rd
Che
viot
Rd
Che
viot
Rd
Che
viot
Rd
Che
viot
Rd C
enter Hill Ave
Center H
ill Ave
Center H
ill Ave
Center H
ill Ave
Center H
ill Ave
Car
thag
e A
veC
arth
age
Ave
Car
thag
e A
veC
arth
age
Ave
Car
thag
e A
ve
Spring Grove Ave
Spring Grove Ave
Spring Grove Ave
Spring Grove Ave
Spring Grove Ave
E Mitchell Ave
E Mitchell Ave
E Mitchell Ave
E Mitchell Ave
E Mitchell AveWoolper AveWoolper AveWoolper AveWoolper AveWoolper Ave
Murray Ave
Murray AveMurray Ave
Murray Ave
Murray AveWasson RdWasson RdWasson RdWasson RdWasson Rd
Chu
rch
St
Chu
rch
St
Chu
rch
St
Chu
rch
St
Chu
rch
St
W Crescentville RdW Crescentville RdW Crescentville RdW Crescentville RdW Crescentville Rd
Crescentville RdCrescentville RdCrescentville RdCrescentville RdCrescentville RdFields Ertel RdFields Ertel RdFields Ertel RdFields Ertel RdFields Ertel Rd
W Sharon RdW Sharon RdW Sharon RdW Sharon RdW Sharon Rd
Woodford RdWoodford RdWoodford RdWoodford RdWoodford Rd
Shawnee Run RdShawnee Run RdShawnee Run RdShawnee Run RdShawnee Run Rd
Woodridge Blvd
Woodridge Blvd
Woodridge BlvdWoodridge Blvd
Woodridge BlvdRos
s R
dR
o ss
Rd
Ros
s R
dR
oss
Rd
Ros
s R
d
Dimmick RdDimmick RdDimmick RdDimmick RdDimmick Rd
W North Bend RdW North Bend RdW North Bend RdW North Bend RdW North Bend Rd
Resor RdResor RdResor RdResor RdResor Rd
Clif
ton
Ave
Clif
t on
Ave
Clif
ton
Av e
Clif
ton
Av e
Clif
ton
Av e Erie
Ave
Erie
Ave
Erie
Ave
Erie
Ave
Erie
Ave
Rou
nd B
otto
m R
d
Rou
nd B
otto
m R
d
Rou
nd B
otto
m R
d
Rou
nd B
otto
m R
d
Rou
nd B
otto
m R
d
Mil l
Rd
Mil l
Rd
Mil l
Rd
Mil l
Rd
Mil l
Rd
W Kemper RdW Kemper RdW Kemper Rd
W Kemper RdW Kemper Rd
Rea
din
g R
dR
ead
ing
Rd
Rea
din
g R
dR
eadi
ng
Rd
Rea
din
g R
d
Ree
d H
artm
an H
wy
Ree
d H
artm
an H
wy
Ree
d H
artm
an H
wy
Ree
d H
artm
an H
wy
Ree
d H
artm
an H
wy
Sn i
der R
dS
n ide
r Rd
Sn
ide r
Rd
Sn i
der R
dS
n ide
r Rd
Glendale Milford RdGlendale Milford RdGlendale Milford RdGlendale Milford RdGlendale Milford Rd
Summ
it Rd
Summ
it Rd
Summ
it Rd
Summ
it Rd
Summ
it Rd
Euclid AveEuclid AveEuclid AveEuclid AveEuclid Ave
Highland AveHighland AveHighland AveHighland Ave
Highland Ave
Putz PlPutz PlPutz PlPutz PlPutz Pl
Montana Ave
Montana Ave
Montana Ave
Montana Ave
Montana Ave
Dana AveDana AveDana AveDana AveDana Ave
Hopple StHopple StHopple StHopple StHopple St
Pla
infie
ld R
dP
lain
field
Rd
Pla
i nfie
ld R
dP
lai n
field
Rd
Pla
i nfie
ld R
d
E Galbraith Rd
E Galbraith Rd
E Galbraith Rd
E Galbraith Rd
E Galbraith Rd
Madison Rd
Madison Rd
Madison Rd
Madison Rd
Madison Rd
Westwood Northern BlvdWestwood Northern BlvdWestwood Northern BlvdWestwood Northern BlvdWestwood Northern Blvd
Beekm
an St
Beekm
an St
Beekm
an St
Beekm
an St
Beekm
an St
Struble RdStruble RdStruble RdStruble RdStruble Rd
Win
ton
Rd
Win
ton
Rd
Win
ton
Rd
Win
ton
Rd
Win
ton
Rd
Losantiville AveLosantiville AveLosantiville AveLosantiville AveLosantiville Ave
Euclid RdEuclid RdEuclid RdEuclid RdEuclid Rd
Covedale CDPCovedale CDPCovedale CDPCovedale CDPCovedale CDP
8 min
15 min

Commercial Impact Analysis & Marketplace Housing Assessment City of Wyoming and Village of Lockland
April 2008 Page 18
Wyom ing-Lockland CP
Amberley villageAmberley villageAmberley villageAmberley villageAmberley village
Arlington Heights villageArlington Heights villageArlington Heights villageArlington Heights villageArlington Heights village
Blue Ash cityBlue Ash cityBlue Ash cityBlue Ash cityBlue Ash city
Deer Park cityDeer Park cityDeer Park cityDeer Park cityDeer Park city
Dillonvale CDPDillonvale CDPDillonvale CDPDillonvale CDPDillonvale CDP
Elmwood Place villageElmwood Place villageElmwood Place villageElmwood Place villageElmwood Place village
Evendale villageEvendale villageEvendale villageEvendale villageEvendale village
Finney town CDPFinney town CDPFinney town CDPFinney town CDPFinney town CDP
Glendale villageGlendale villageGlendale villageGlendale villageGlendale village
Golf M anor villageGolf M anor villageGolf M anor villageGolf M anor villageGolf M anor village
Greenhills villageGreenhills villageGreenhills villageGreenhills villageGreenhills village
Lincoln Heights villageLincoln Heights villageLincoln Heights villageLincoln Heights villageLincoln Heights village
M ount Healthy cityM ount Healthy cityM ount Healthy cityM ount Healthy cityM ount Healthy city
North College Hill cityNorth College Hill cityNorth College Hill cityNorth College Hill cityNorth College Hill city
Reading cityReading cityReading cityReading cityReading city
Silverton citySilverton citySilverton citySilverton citySilverton city
Woodlawn villageWoodlawn villageWoodlawn villageWoodlawn villageWoodlawn village
Wy oming cityWyoming cityWyoming cityWyoming cityWyoming city
Damon Rd
Damon Rd
Damon Rd
Damon Rd
Damon Rd
Knoll
Rd
Knoll
Rd
Knoll
Rd
Knoll
Rd
Knoll
Rd
Wa
ycro
ss R
dW
ayc
ross
Rd
Wa
ycro
ss R
dW
ayc
ross
Rd
Wa
ycro
ss R
dFleming RdFleming RdFleming RdFleming RdFleming Rd
Smalley RdSmalley RdSmalley Rd
Smalley RdSmalley Rd
Compton RdCompton RdCompton RdCompton RdCompton Rd
N W
ayne
Ave
N W
ayne
Ave
N W
ayn
e A
veN
Wa
yne
Ave
N W
ayne
Ave
Section RdSection RdSection RdSection RdSection Rd
Center H
ill Ave
Center H
ill Ave
Center H
ill Ave
Center H
ill Ave
Center H
ill Ave
Sprin
g G
rove
Ave
Sprin
g G
rove
Ave
Sprin
g G
rove
Ave
Sprin
g G
rove
Ave
Sprin
g G
rove
Ave
W Sharon Rd
Woodford RdWoodford RdWoodford RdWoodford RdWoodford Rd
Cam
argo
Rd
Cam
argo
Rd
Cam
argo
Rd
Cam
argo
Rd
Cam
argo
Rd
Sycamore RdSycamore RdSycamore RdSycamore RdSycamore Rd
W North Bend RdW North Bend RdW North Bend RdW North Bend RdW North Bend Rd
Mile
s R
dM
iles
Rd
Mi le
s R
dM
i les
Rd
Mi le
s R
dM
ill R
dM
ill R
dM
ill R
dM
ill R
dM
ill R
d
Rea
din
g R
dR
ead
ing
Rd
Rea
din
g R
dR
ead
ing
Rd
Rea
din
g R
d
Ree
d H
artm
an H
wy
Ree
d H
artm
an H
wy
Ree
d H
artm
an H
wy
Ree
d H
artm
an H
wy
Ree
d H
artm
an H
wy
Cornell RdCornell RdCornell RdCornell RdCornell Rd
Glendale Milford RdGlendale Milford RdGlendale Milford RdGlendale Milford RdGlendale Milford Rd
Springdale Rd
Springdale Rd
Springdale Rd
Springdale Rd
Springdale Rd
Cooper RdCooper RdCooper RdCooper RdCooper Rd
Hunt RdHunt RdHunt RdHunt RdHunt Rd
Dal
y R
dD
aly
Rd
Dal
y R
dD
aly
Rd
Dal
y R
d
W Galbraith RdW Galbraith RdW Galbraith RdW Galbraith RdW Galbraith Rd
An
thon
y W
ayne
Ave
An
thon
y W
ayne
Ave
Ant
hon
y W
ayne
Ave
Ant
hony
Way
ne A
ve
An
thon
y W
ayne
Ave
Summ
it Rd
Summ
it Rd
Summ
it Rd
Summ
it Rd
Summ
it Rd
Euclid AveEuclid AveEuclid AveEuclid AveEuclid Ave
Ridge Ave
Ridge Ave
Ridge A
ve
Ridge A
ve
Ridge Ave
Pfeiffer RdPfeiffer RdPfeiffer RdPfeiffer RdPfeiffer Rd
Pla
i nf ie
ld R
dP
lain
fi eld
Rd
Pla
infie
ld R
dP
lain
field
Rd
Pla
infie
ld R
d
E Sharon RdE Sharon RdE Sharon RdE Sharon RdE Sharon Rd
E Sharon RdE Sharon RdE Sharon RdE Sharon RdE Sharon Rd
Pla
infie
ld R
dP
lai n
f iel d
Rd
Pl a
infi e
ld R
dP
l ain
fi eld
Rd
Pl a
infi e
ld R
d
Losantiville AveLosantiville AveLosantiville AveLosantiville AveLosantiville Ave
Ke
nwo
od R
dK
enw
ood
Rd
Ke
nwo
od R
dK
enw
ood
Rd
Ke
nwo
od R
d
E Galbraith RdE Galbraith RdE Galbraith RdE Galbraith RdE Galbraith Rd
Blue Ash cityBlue Ash cityBlue Ash cityBlue Ash cityBlue Ash city
Madeira cityMadeira cityMadeira cityMadeira cityMadeira city
S haronville cityS haronville cityS haronville cityS haronville cityS haronville city
S pringdale city
HOUSEHOLD DEMOGRAPHIC DATA and TRENDS, continued.
8 min
15 min

Commercial Impact Analysis & Marketplace Housing Assessment City of Wyoming and Village of Lockland
April 2008 Page 19
This Assessment relies upon the updated 2007 US Census estimates collected during the initial analyses last December. Provided
by AGS, the data was then categorized into columnar household Demographic Areas of interest, as shown at left.
These tables, with the complete set provided in the full Report, offer key insights into the character, and makeup of the following char-
acteristics of the surrounding marketplace:
� Household growth & size
� Incomes by age group
� Household net worth
� Ownership and renters
� Education level
� Racial background
� Household familial status
� Housing units & style
� Year housing units built
� Occupation and job sector
� Commute mode & times
To better locate the relative concentrations of
any typical household metric or trend, we have also created color-gradient maps plotted by Census block group, with an exam-
ple on the following page. Here, the esti-mated 2007 median household incomes are
graphically plotted by block group in ranges by color. Please see the accompanying key legend.
We note that the City of Wyoming has challenged the US Census estimates in recent years. The following US Census in-formation does not reflect all of the City’s suggested population, household, and housing unit counts as requested in the Census Challenge. Although we fully consider the suggested counts from the City of Wyoming in our final conclusions
and recommendations, the following pages reflect trends and metrics identified from the greater pool of demographic in-formation provided by the Census.
HOUSEHOLD DEMOGRAPHIC DATA and TRENDS, continued.
2007 Estimates Finneytown Woodlawn Wyoming
Lincoln
Heights Lockland 8-Minute 15-Minute
Marital Status:
Age 15 + Population 10,074 2,200 5,829 2,771 2,671 37,861 233,376
Divorced 9.0% 12.3% 7.4% 13.1% 15.0% 12.2% 11.6%
Never Married 24.1% 32.6% 19.5% 39.2% 33.2% 27.8% 32.0%
Now Married 56.3% 42.0% 64.9% 26.4% 36.9% 47.1% 43.4%
Separated 3.3% 4.5% 3.1% 11.7% 6.2% 4.9% 5.0%
Widowed 7.4% 8.5% 5.1% 9.6% 8.7% 8.0% 8.1%
Educational Attainment:
Age 25 + Population 8,583 1,854 5,079 2,194 2,227 32,140 193,986
Grade K - 8 1.9% 1.7% 0.7% 4.4% 6.7% 3.1% 3.0%
Grade 9 - 12 5.6% 4.6% 2.2% 17.4% 11.9% 9.6% 9.7%
High School Graduate 27.2% 29.6% 13.0% 41.4% 45.8% 32.4% 32.2%
Some College, No Degree 17.7% 19.9% 12.4% 20.2% 17.0% 17.4% 18.1%
College Degree 47.6% 44.2% 71.7% 16.7% 18.7% 37.6% 37.0%
Household Income
Income $ 0 - $9,999 5.3% 4.5% 1.7% 21.8% 13.8% 8.1% 10.1%
Income $ 10,000 - $14,999 3.5% 4.0% 1.1% 10.4% 6.5% 4.5% 5.0%
Income $ 15,000 - $24,999 7.2% 11.0% 5.2% 21.5% 16.8% 12.4% 11.8%
Income $ 25,000 - $34,999 8.0% 11.1% 7.0% 12.0% 13.9% 12.7% 12.2%
Income $ 35,000 - $49,999 12.9% 14.3% 10.5% 7.2% 17.5% 14.2% 14.8%
Income $ 50,000 - $74,999 23.7% 18.7% 13.4% 13.1% 17.3% 18.1% 18.4%
Income $ 75,000 - $99,999 17.5% 15.5% 10.4% 7.7% 8.4% 10.9% 11.4%
Income $100,000 - $124,999 9.8% 8.1% 10.1% 3.5% 2.2% 6.1% 6.2%
Income $125,000 - $149,999 4.0% 3.4% 10.9% 0.8% 1.5% 3.9% 3.3%
Income $150,000 + 8.2% 9.5% 29.8% 2.0% 2.1% 9.1% 6.7%
Average Household Income $60,924 $72,121 $111,002 $33,347 $32,719 $57,691 $52,555
Median Household Income $63,260 $55,859 $101,982 $23,207 $33,811 $47,703 $45,591
Per Capita Income $24,046 $32,311 $42,485 $13,252 $14,652 $25,777 $23,454
Vehicles Available
0 Vehicles Available 5.4% 5.4% 4.1% 21.1% 18.7% 11.6% 13.0%
1 Vehicle Available 29.9% 40.7% 24.0% 44.0% 38.3% 36.7% 37.1%
2+ Vehicles Available 64.7% 54.0% 72.0% 34.9% 42.9% 51.7% 50.0%
Average Vehicles Per Household 1.90 1.70 2.00 1.30 1.40 1.60 1.60
Total Vehicles Available 9,666 2,090 5,739 1,923 2,148 33,428 201,696

Commercial Impact Analysis & Marketplace Housing Assessment City of Wyoming and Village of Lockland
April 2008 Page 20
HOUSEHOLD DEMOGRAPHIC DATA and TRENDS, continued.
Wyom ing-Lockland CP
Amberley villageAmberley villageAmberley villageAmberley villageAmberley village
Arlington Heights villageArlington Heights villageArlington Heights villageArlington Heights villageArlington Heights village
Blue Ash cityBlue Ash cityBlue Ash cityBlue Ash cityBlue Ash city
Deer Park cityDeer Park cityDeer Park cityDeer Park cityDeer Park city
Dillonvale CDPDillonvale CDPDillonvale CDPDillonvale CDPDillonvale CDP
Elmwood Place villageElmwood Place villageElmwood Place villageElmwood Place villageElmwood Place village
Evendale villageEvendale villageEvendale villageEvendale villageEvendale village
Finney town CDPFinney town CDPFinney town CDPFinney town CDPFinney town CDP
Forest Park cityForest Park cityForest Park cityForest Park cityForest Park city
Glendale villageGlendale villageGlendale villageGlendale villageGlendale village
Golf M anor villageGolf M anor villageGolf M anor villageGolf M anor villageGolf M anor village
Greenhills villageGreenhills villageGreenhills villageGreenhills villageGreenhills village
Groesbeck CDPGroesbeck CDPGroesbeck CDPGroesbeck CDPGroesbeck CDP
Kenwood CDPKenwood CDPKenwood CDPKenwood CDPKenwood CDP
Lincoln Heights villageLincoln Heights villageLincoln Heights villageLincoln Heights villageLincoln Heights village
M adeira cityM adeira cityM adeira cityM adeira cityM adeira cityM onfort Heights East CDPM onfort Heights East CDPM onfort Heights East CDPM onfort Heights East CDPM onfort Heights East CDP
M ontgomery cityM ontgomery cityM ontgomery cityM ontgomery cityM ontgomery city
M ount Healthy cityM ount Healthy cityM ount Healthy cityM ount Healthy cityM ount Healthy city
M ount Healthy Heights CDPM ount Healthy Heights CDPM ount Healthy Heights CDPM ount Healthy Heights CDPM ount Healthy Heights CDP
Northbrook CDPNorthbrook CDPNorthbrook CDPNorthbrook CDPNorthbrook CDP
North College Hill cityNorth College Hill cityNorth College Hill cityNorth College Hill cityNorth College Hill city
Northgate CDPNorthgate CDPNorthgate CDPNorthgate CDPNorthgate CDP
Norwood cityNorwood cityNorwood cityNorwood cityNorwood city
Pleasant Run CDPPleasant Run CDPPleasant Run CDPPleasant Run CDPPleasant Run CDP
Reading cityReading cityReading cityReading cityReading city
St. Bernard citySt. Bernard citySt. Bernard citySt. Bernard citySt. Bernard city
Sharonville citySharonville citySharonville citySharonville citySharonville city
Silverton citySilverton citySilverton citySilverton citySilverton city
Springdale citySp ringdale citySpringdale citySpringdale citySpringdale city
The Village of Indian Hill cityThe Village of Indian Hill cityThe Village of Indian Hill cityThe Village of Indian Hill cityThe Village of Indian Hill city
White Oak CDPWhite Oak CDPWhite Oak CDPWhite Oak CDPWhite Oak CDP
White Oak East CDPWhite Oak East CDPWhite Oak East CDPWhite Oak East CDPWhite Oak East CDP
Woodlawn villageWoodlawn villageWoodlawn villageWoodlawn villageWoodlawn village
Wyoming cityWyoming cityWy oming cityWy oming cityWy oming city
Knoll
Rd
Knoll
Rd
Knoll
Rd
Knoll
Rd
Knoll
Rd
North Bend RdNorth Bend RdNorth Bend RdNorth Bend RdNorth Bend Rd
E Fork Ave
E Fork Ave
E Fork Ave
E Fork Ave
E Fork AveHopkins Ave
Hopkins Ave
Hopkins Ave
Hopkins Ave
Hopkins Ave
Appleton St
Appleton St
Appleton St
Appleton St
Appleton St
Sn
ide
r R
dS
nid
er
Rd
Sn
ide
r R
dS
nid
er
Rd
Sn
ide
r R
d
Waycross R
d
Waycross R
d
Waycross R
d
Waycross R
d
Waycross R
d
Col e
rai n A
veC
ol erai n
Av e
Co le
rain A
veC
o lerain
Ave
Co le
rain A
ve
Fleming RdFleming RdFleming RdFleming RdFleming RdSmalley RdSmalley RdSmalley Rd
Smalley RdSmalley Rd
Compton RdCompton RdCompton RdCompton RdCompton Rd
Spooky Hollow
Rd
Spooky Hollow
Rd
Spooky Hollow
Rd
Spooky Hollow
Rd
Spooky Hollow
Rd
W Galbraith RdW Galbraith RdW Galbraith RdW Galbraith RdW Galbraith Rd
Blo
me
Rd
Blo
me
Rd
Bl o
me
Rd
Bl o
me
Rd
Bl o
me
Rd
Section RdSection RdSection RdSection RdSection Rd
Che
viot
Rd
Che
viot
Rd
Che
vio t
Rd
Che
vio t
Rd
Che
vio t
Rd C
enter Hill Ave
Center H
ill Ave
Center H
ill Ave
Center H
ill Ave
Center H
ill Ave
Car
tha
ge
Ave
Car
tha
ge
Ave
Car
tha
ge
Ave
Car
tha
ge
Ave
Car
tha
ge
Ave
Indian Hill RdIndian Hill RdIndian Hill RdIndian Hill RdIndian Hill Rd
Spring G
rove Ave
Spring G
rove Ave
Spring G
rove Ave
Spring G
rove Ave
Spring G
rove AveE Mitchell Ave
E Mitchell Ave
E Mitchell Ave
E Mitchell Ave
E Mitchell Ave
Fields Ertel RdFields Ertel RdFields Ertel RdFields Ertel RdFields Ertel Rd
Bo
udi n
ot
Ave
Bo
udin
ot
Ave
Bo
udin
ot
Ave
Bo
udin
ot
Ave
Bo
udin
ot
Ave
W Sharon RdW Sharon RdW Sharon RdW Sharon RdW Sharon Rd
Red
Ba
nk Rd
Red
Ba
nk Rd
Red
Ba
nk R
dR
ed B
an
k Rd
Red
Ba
nk Rd
Woodford RdWoodford RdWoodford RdWoodford RdWoodford Rd Shawnee Run Rd
Shawnee Run RdShawnee Run RdShawnee Run RdShawnee Run Rd
Hopewell LnHopewell LnHopewell LnHopewell LnHopewell Ln
W North Bend RdW North Bend RdW North Bend RdW North Bend RdW North Bend Rd
Mile
s R
dM
iles
Rd
Mi le
s R
dM
i les
Rd
Mi le
s R
dM
ill R
dM
ill R
dM
ill R
dM
ill R
dM
ill R
d
Win
ton R
dW
into
n Rd
Win
ton R
dW
inton R
dW
into
n Rd
W Kemper RdW Kemper RdW Kemper Rd
W Kemper RdW Kemper Rd
Rea
din
g R
dR
ead
ing
Rd
Rea
din
g R
dR
ead
ing
Rd
Rea
din
g R
d
Ree
d H
artm
an H
wy
Ree
d H
artm
an H
wy
Ree
d H
artm
an H
wy
Ree
d H
artm
an H
wy
Ree
d H
artm
an H
wy
Sn
ide
r R
dS
nid
er
Rd
Sn
ide
r R
dS
nid
er
Rd
Sn
ide
r R
d
Cornell Rd
Cornell RdCornell Rd
Cornell RdCornell Rd
Glendale Milford RdGlendale Milford RdGlendale Milford RdGlendale Milford RdGlendale Milford Rd
Pfeiffer RdPfeiffer RdPfeiffer RdPfeiffer RdPfeiffer Rd
Hunt RdHunt RdHunt RdHunt RdHunt Rd
Dal
y R
dD
aly
Rd
Dal
y R
dD
aly
Rd
Dal
y R
d
Ant
hony
Way
ne A
ve
Ant
hony
Way
ne A
ve
An
thon
y W
ayn
e A
ve
Ant
hon
y W
ayne
Ave
Ant
hony
Way
ne A
ve
Summ
it Rd
Summ
it Rd
Summ
it Rd
Summ
it Rd
Summ
it Rd
Euclid AveEuclid AveEuclid AveEuclid AveEuclid Ave
Vine
St
Vine
St
Vin
e S
t
Vine
St
Vine
St
Highland AveHighland AveHighland AveHighland AveHighland Ave
Duck Creek RdDuck Creek RdDuck Creek RdDuck Creek RdDuck Creek Rd
Putz PlPutz PlPutz PlPutz PlPutz Pl
Sp
ring Grove
Ave
Sp
ring Grove
Ave
Sprin
g Grove A
ve
Spring
Grove A
ve
Sp
ring Grove
Ave
Pla
infie
ld R
dP
lain
fiel d
Rd
Pla
infi e
ld R
dP
lain
fi eld
Rd
Pla
infi e
ld R
d
E Sharon RdE Sharon RdE Sharon RdE Sharon RdE Sharon Rd
E Sharon RdE Sharon RdE Sharon RdE Sharon RdE Sharon Rd
Beekm
an St
Beekm
an St
Beekm
an St
Beekm
an St
Beekm
an St
Struble RdStruble RdStruble RdStruble RdStruble Rd
Pla
infi e
ld R
dP
lain
field
Rd
Pla
infie
ld R
dP
lain
field
Rd
Pla
infie
ld R
d
Losantiville AveLosantiville AveLosantiville AveLosantiville AveLosantiville Ave
Euclid RdEuclid RdEuclid RdEuclid RdEuclid Rd
Median Household Income By US Census Block Group Dk Blue over $75,000 Blue $50,000-$75,000 Green $35,000-$50,000 Tan $25,000-$35,000 Blush under $25,000
Commercial Impact Analysis & Marketplace Housing Assessment City of Wyoming and Village of Lockland
April 2008 Page 21
Marketplace Households The general population within the City of Wyoming is 7,509 and there are 2,836 households. The Village of Lockland
boasts 3,314 residents and 1,484 households. These two communities have older built environments that have a popula-tion density near four people per acre, higher than outlying submarkets within the 8– and 15–minute drive areas. Affluence and Household Capacity
First, we note that affluence within a community is typically measured by indicators such as median age, percentage of owner occupancy, percentage of married couples, education levels and income levels.
A large population of certain age groups can determine potential demand for specific consumer products and services, and assist in modeling future residential developments. The submarket median age is 40.5 years (as noted by the 8-
minute drive time). However, in community comparison, Wyoming has the oldest median age at 42.5 years and Lock-land’s median age skews significantly younger at 37.9 years.
Married couples are an indicator of affluence because these households likely represent households with dual incomes. Wyoming shows the highest percentage of married residents at 65%, whereas Lincoln Heights is quite the opposite with
only 26% of the population being married. Lockland has a married population of nearly 37%.
The percentage of population with college degrees varies from community to community. In Lockland, 19% of the popu-
lation has a college degree, whereas Wyoming has nearly 72% of its population with college degrees, higher than most other regional submarkets. Educational level is important because it speaks to the earning potential of residents. Typi-cally, higher general education levels lead to higher household incomes within an area.
Median household income is the greatest indicator of affluence. Median household incomes within the 8- and 15-minute
drive areas are just above $45,000. Wyoming has a median income more than double, at approximately $102,000, and nearly $40,000 higher than the second-highest median household income found in Finneytown at $63,000. The differ-ence between a community’s average income and median household income indicates the spread or distribution of high and low incomes within the area. We notice a larger than average income spread in Woodlawn of nearly $20,000, indi-
cating a large difference between high and low incomes earned from residents. Lockland and Finneytown have incomes in greater balance, showing majority of residents earn income in concentrated brackets.
Per Capita income speaks to the community’s spending power. As we observe the communities’ per capita income, one notable community is Woodlawn. Although its median income is less than Finneytown, the per capita income is almost $10,000 higher, likely due to the large presence of young professionals earning higher incomes with no children at home.
HOUSEHOLD DEMOGRAPHIC DATA and TRENDS, continued.

Commercial Impact Analysis & Marketplace Housing Assessment City of Wyoming and Village of Lockland
April 2008 Page 22
Affluence and Household Capacity, continued. Census growth data from 2000 to 2007 shows the region declined in households, and therefore shows declines in Wyo-
ming and Lockland. We note that Wyoming has challenged the Census households count with positive results. However, there is evidence of an aging population and diminishing household size. This is typical of many communities that experienced growth 10 to
15 years ago and now have grown children moving away to college or other communities. A city like Wyoming is consid-ered a great place to raise a family and young families no doubt consider Wyoming for the schools and quality of life. After their children leave, many parents stay and increase the ranks of empty-nesters and smaller household sizes.
These smaller family stakeholders are key assets to any community, yet sustained community health comes from a bal-ance of downsizing households and additional growing families. In Wyoming, nearly 52% of households have lived in their home for more than five years, noted as “stability” by the
Census. This is a higher share than what is found within other regional submarkets. Typically, there is a direct correla-tion between the average household size and the share of stability rate, that the larger the household size, the higher the stability. Wyoming 2007 Census estimates show this relationship.
In contrast to stability, “turnover” represents that percentage of households that have historically moved in the last year. Turnover typically correlates with the amount of renter-occupied housing due to annual leases seen in multi-family hous-ing. Woodlawn and Lockland have the highest percentages of renter-occupied housing and also have the largest percent-
ages of turnover, indicating a stronger presence of transient households. Wyoming has low representation of transient households. Unserved Households
In Lockland, we also note a strong percentage of households living in their residence for more than five years. Lockland experiences loyalty from residents that can afford to live in homes of higher value, yet choose to live in Lockland despite
its scarcity of higher valued homes. In Lockland, some 30% of households earn more than $50,000 a year, although there is no comparable housing stock valued to match that income level. There is a clear opportunity to provide housing options to cater to the more affluent underserved households within Lockland.
In Wyoming, we also notice a number of unserved households. Much of Wyoming’s housing activity occurs in the higher priced homes. However, there are few choices for move-down couples with no children, or for young families looking to move to Wyoming in the price range of $200,000 to $300,000.
The following chart helps to estimate the number of unserved households that the City of Wyoming and Village of Lock-land could potentially serve through more diverse housing options:
HOUSEHOLD DEMOGRAPHIC DATA and TRENDS, continued.

Commercial Impact Analysis & Marketplace Housing Assessment City of Wyoming and Village of Lockland
April 2008 Page 23
HOUSEHOLD DEMOGRAPHIC DATA and TRENDS, continued.
Source: Demographics Now, 2007 City of Wyoming estimates
Unserved Households, continued.
For the total household counts in Wyoming and Lockland, we separate those households with combined incomes of $50,000 or more per year. These households are the most likely to have a
penchant for new housing above $200,000 or apartments with rents above $900. Our analysis over the past three years in the
relevant Housing Search Area of all communities studied demonstrates that 5% of all households purchase a new home priced over $200,000
each year and another 5% lease in rental units with contract rents over $900 per month. When combined, these households reflect a po-
tential 10% of qualified households that would consider a new residence of $200,000 or more each year. After subtracting the average his-
torical activity of 150 competitive units seen an-nually, we net some 140 households each year that remain unserved by current housing options within Wyoming or Lockland.
We believe the City of Wyoming and Village of Lockland can conservatively capture 20-25% of these unserved households with new or revi-
talized residential product. This creates additional housing demand of 25-35
units per year, or 125-175 units over the next five years, that could be offered by the City of Wyoming or Village of Lockland to cap-ture unserved households.
Households within Wyoming & Lockland = 4,800
Total Qualified Households = 2,900
Annual households expected to
enter market (10%) = 290
less Annual activity
=150 units 140 Unmet
Annual House-hold Demand

Commercial Impact Analysis & Marketplace Housing Assessment City of Wyoming and Village of Lockland
April 2008 Page 24
Psychographics Property Advisors uses a psychographic household profile set known as MOSAIC Market Segmentation.
Those MOSAIC segments most viable for new housing product and commercial goods are normally found in Groups A, B, H and cluster F01 Steadfast Conservatives because these households have median incomes greater than $50,000. A02 Dream Weavers are home to well-off families living an affluent, ranked second in terms of wealth, they live in
new-money subdivisions, possess high incomes, have college degrees and median household incomes near $113,000. And with a median age of 38.5 years, these well-educated late Baby Boomers strive to own the trappings of success. They drive at least one luxury vehicle such as Mercedes Benz, BMW 7 or 5 Series, or top-of-the line Audi and Lexus mod-els. They also have premium SUVs, Saabs, Volvos and Volkswagens in their multi-driver households.
A06 Small-Town Success households are white-collar, college educated, middle-aged working couples. Though the median household income is $75,000, about a third bring home more than $100,000 annually. Predominantly married,
nearly 40% have children at home. Over 90% own single detached homes with a median value of $175,000. The median age is 39, though a third of the crowd is age 50 plus. B06 Affluent Urban Professionals are mostly wealthy singles and couples owning swank condos and apartments val-
ued at twice the national average. Most residents are in their twenties and thirties, hold college degrees and have jobs as executives and white-collar professionals. 20% reside in housing with median home values about $300,000. Median household income is $74,950. They drive luxury cars such as Land Rovers, Mercedes, and Audis. The Gen X crowd pre-
fers trendier models such as the Audi TT, Mini-Cooper and even hybrids. H02 Minority Metro Communities are made up of households concentrated in inner-ring suburbs, these households earn above-average incomes from a mix of service Industry and white-collar jobs in transportation, health care, educa-
tion and public administration. Many have settled into older homes and semi-detached houses built in the 1960s. The median household income is $55,000 and median Age: 37.9 years. F01 Steadfast Conservatives boasts mature singles and couples living in midscale urban neighborhoods. Households
tend to be white, high school-educated and middle class. Many have begun to empty-nest or filled with young couples and singles. The seniority of many residents does have benefits in the workplace. They earn middle class incomes from skilled jobs in manufacturing, retail and health care. Their median income near $50,600 goes far, allowing residents to
own older homes and multiple cars and trucks at higher than average rates.
MOSAIC segmenta-tion was created by Experian and sorts
each household into 12 household
groups, each group with 3-7 clusters for a total of 62 individual market segmentation
clusters.
Segmentation data considers demograph-ics and overlays it with purchasing data from credit bureaus, insur-ance agencies, banks,
and more.
Segmentation provides insight into each
household’s lifestyle and their penchant
toward products rang-ing from housing, in-vestments, and media subscriptions, to en-
tertainment interests, leisure activities and types of vehicles they
are likely to own.
HOUSEHOLD DEMOGRAPHIC DATA and TRENDS, continued.
MOSAIC segments most prevalent within Wyoming: Group A06 Small Town Success (15%)
Group A02 Dream Weavers (43%) Group B02 Affluent Urban Professionals (22%) Group H02 Minority Metro Communities (13%)
MOSAIC segments most prevalent within Lockland: Group D04: Small-town Endeavors (25%)
Group F01: Steadfast Conservatives (29%) Group J03: Struggling City Centers (32%)

Commercial Impact Analysis & Marketplace Housing Assessment City of Wyoming and Village of Lockland
April 2008 Page 25
Market Performance Seen in Recent Home Closings We believe that housing market performance is best tracked and analyzed based upon the closings of all residential
properties within a defined Housing Search Area. For this assessment, we electronically collected all of the actual resi-dential transfers in a select Search Area around the City of Wyoming and Village of Lockland over the last three years. We then sorted and categorized each transfer by its inherent original community or legal subdivision. In this way, the homes as product and as community are grouped by like lot size, original builder and relative year built.
For this Assessment, we collected housing transfers among the five communities of interest shown on
Page 18. After “scrubbing” the database for dupli-cates and other mistakes, we tracked 1,800 hous-ing transfers as new home lots, new homes or resi-dential resales.
For the estimated 12,098 households found in this Search Area, we expect, under typical housing dy-namics, that 490-600 (4.0%-5.0%) householders to
purchase a home per year, new or resale. County records show 1,836 home transfers in the last three years for an average of 612 per year, on
par with expectations. Of 1,800 transfers, we found only 7.6% in attached home product. Other vibrant housing submarkets in
this area would have an 18%-20% share of attached for-sale product. The median price of a single-family detached home was $133,000, while the median
price of attached housing was higher at $145,000. Though the Housing Search Area reflects a median price of attached housing outperforming the median
price of detached housing, we note that this trend is reversed in Wyoming. Here, the median price of at-tached housing is actually much less than the median price of single family product. This indicates that the
scarce attached housing activity within Wyoming may be from older and smaller choices than the larger market numbers of detached homes.
The excerpt below depicts the housing
matrix created from a comprehensive data-base for the Assess-
ment; a small sample of 52 fields of sales information available, including rental sales
and foreclosures.
HOUSING MARKET PERFORMANCE (Last 3 years)
September '04-September '07 Finneytown Woodlawn Wyoming
Lincoln
Heights Lockland
Total Search
Area
Total Transfers 918 131 462 132 193 1836
Median Price $128,500 $77,900 $267,500 $56,000 $84,000 $129,950
Total Foreclosed 90 25 23 34 44 216
Median Price $89,950 58,000 148,100 $39,750 $58,450 $74,500
Total New Construction 28 0 15 6 8 57
Median Price $191,850 $0 $446,000 $171,918 $119,000 $204,200
Total Multi-Family 9 2 11 9 19 50
Median Price $196,000 $160,000 $225,500 $72,200 $98,500 $144,500
Product Type
Total Single-Family Detached 799 101 381 80 134 1495
% SFD 87.0% 77.1% 82.5% 60.6% 69.4% 81.4%
Median Price $128,500 $82,500 $283,250 $65,000 $84,950 $133,000
% Foreclosed 10.5% 24.8% 5.2% 30.0% 2.2% 10.4%
% Rentals 0.5% 0.0% 0.8% 3.8% 0.7% 0.7%
% New Construction 1.6% 0.0% 1.8% 7.5% 0.0% 1.7%
Total Single-Family Attached 86 0 54 0 0 140
% SFA 9.4% 0.0% 11.7% 0.0% 0.0% 7.6%
Median Price $137,000 0 $157,500 0 0 $145,000
% Foreclosed 2.3% 0.0% 3.7% 0.0% 0.0% 2.9%
% New Construction 15.1% 0.0% 13.0% 0.0% 0.0% 14.3%
Total Rentals 12 2 19 19 44 96
% Rentals 1.3% 1.5% 4.1% 14.4% 22.8% 5.2%
Median Price $177,950 $160,000 $226,000 $34,500 $75,600 $96,550
% Foreclosed 25.0% 0.0% 10.5% 42.1% 22.7% 24.0%
Total Land Transfers 21 28 8 33 15 105
% Land 2.3% 21.4% 1.7% 25.0% 7.8% 5.7%

Commercial Impact Analysis & Marketplace Housing Assessment City of Wyoming and Village of Lockland
April 2008 Page 26
The chart at right is a distribution of all the housing sold in the
last five years for Fin-neytown, Wyoming, Woodlawn, Lockland, and Lincoln Heights.
Recorded sales trans-fers were plotted in $5,000 increments of closing price and color-coded by City.
Finneytown had nearly
50% of the overall housing market, shown in orange
symbology, stacked above the other com-munities’ activity. We note that recent trans-
fer activity dropped
significantly after $150,000.
Village of Lockland is represented at right by the light blue
symbology stacked above the Lincoln
Heights. Their mar-ket, however, main-
tained a much smaller presence in closing prices of $50,000-
$120,000.
City of Wyoming demonstrates the wid-est range of pricing, as
well as the largest capture of high-end
housing product above $300,000, as shown by blue symbology.
HOUSING MARKETPLACE PERFORMANCE (Last 3 years), continued.
PRIMARY SEARCH AREA HOUSING MARKET
HOME SALES by COMMUNITY and $5,000 PRICE
All Homes Sold 09.01.04-09.30.07
0
5
10
15
20
25
30
35
40
45
50
55
60
65
70
75
80
50 60 70 80 90 100
110
120
130
140
150
160
170
180
190
200
210
220
230
240
250
260
270
280
290
300
310
320
330
340
350
360
370
380
390
400
Transfer Price ($000)
Transfers
Finneytown
Wyoming
Woodlawn
Lockland
Lincoln Heights

Commercial Impact Analysis & Marketplace Housing Assessment City of Wyoming and Village of Lockland
April 2008 Page 27
PRIMARY SEARCH AREA HOUSING MARKET
HOME SALES by COMMUNITY and $5,000 PRICE
All Homes Sold 09.01.04-09.30.07
0
5
10
15
20
25
30
35
40
45
50
50
60
70
80
90
100
110
120
130
140
150
160
170
180
190
200
210
220
230
240
250
260
270
280
290
300
310
320
330
340
350
360
370
380
390
400
Transfer Price ($000)
Transfers
Finneytown Trend
Lockland Trend
Wyoming Trend
Lincoln Heights Trend
Woodlawn Trend
The chart at right plots the same information as the previous chart, with the price-specific
activity within each community plotted
independently along with a smoothed
trendline of pricing.
Wyoming shows little sales activity below $100,000, then in-creases around the moderately priced
homes $150,000 to $200,000 and again
from $250,000-$320,000. Over
$380,000, we note a steep increase in Wyo-ming’s housing sales
activity.
Lockland sales activ-ity peaks at $80,000 and shows little activ-ity above $150,000, again supporting the
lack of housing choice available for more
affluent households already in their com-
munity.
HOUSING MARKETPLACE PERFORMANCE (Last 3 years), continued.

Commercial Impact Analysis & Marketplace Housing Assessment City of Wyoming and Village of Lockland
April 2008 Page 28
City of Wyoming Wyoming is unique compared to the other adjacent markets, often described as “an island” of sustained neighborhood
quality and prestige. This reputation is supported by Wyoming’s affluent population with a median household income of $102,000, educated population, large percentage of married couples and high home values. Because of Wyoming’s afflu-ent population and strong property values, the housing market in Wyoming has branded itself as a niche market. Higher-priced, single-family detached homes with stable sales activity have dominated over the years. Wyoming’s mar-
ket strength is also sustained by a high property tax base that supports their prestigious school district and protects the quality of life offered by the community. The City pride among the Wyoming residents and leadership is apparent and strong.
However, there is lower presence of households with children than we would expect from a submarket with similar demo-graphics. Feedback from Wyoming, and our demographic analysis shows the City is experiencing an aging population base, indicated by a median householder age of a late 43 years, lower number of households with children at home, and
a declining household size. This suggests that a growing number of households might consider move-down housing, housing closer to recreational and leisure activities, and/or potentially relocation out of the trade area. The Housing Assessment indicates Wyoming has a narrow range of housing product type and price, showing few housing
transfers priced between $200,000 and $275,000. This housing price gap indicates there are few moderately-priced homes available in Wyoming. A disparity of housing prices can limit options for the evolving household. Move-down householders who no longer have children in the school district may consider moving to other neighborhoods with lower
taxes, buying smaller homes, or upscale attached homes with low maintenance. Unfortunately, Wyoming is limited in these housing options, leaving move-down households with little choice, and young new families with fewer and more expensive housing choices in Wyoming.
Developing new moderately-priced smaller homes and attached product will create more diverse housing choices, attract new growing families, and offer an option for loyal move-down households. New attached housing product should be strategically incorporated within a high-profile mixed-use development. This type of housing attracts households that de-
sire such a concentration of uses, venues, and community energy found within a vibrant mixed-use development. In our next Stage, we will work alongside the City of Wyoming to explore strategic locations for redevelopment, identify several development opportunities, and determine the best mix of commercial and residential space to support the City’s eco-nomic sustainability and vitality. This next Stage will consider Wyoming’s assets and ability to:
� Develop new housing options that will align with demand for move-down housing choices
� Create quality entry-level housing that will attract new and growing households
� Engage and support the Village of Lockland and their business district
� Develop neighborhood retail options to recapture dollars now spent outside the City
� Design strategies for the Zones of Potential Change based on the new Comprehensive Plan
We begin with housing in
most any community analysis, as housing is
the granular base for the City’s economy. To cali-brate the Wyoming hous-ing stock and choice is to
frame the state of the economy now and mov-
ing forward.
After the historic 14-year housing boom, a current corrective downturn has created a “suspended”
housing market. This is not uncommon in more
affluent neighborhoods of the Cincinnati market-
place, producing a built-environment stagnation of, what we consider,
“the natural rotation of housing stock.”
We have found similar housing conditions in Madeira, Finneytown and Union Township,
Clermont County.
In two early presenta-tions with the City and
their Economic Develop-ment Committee, we
note their commitment to Wyoming’s vitality and
range of assets.
PROFESSIONAL CONCLUSIONS and RECOMMENDATIONS

Commercial Impact Analysis & Marketplace Housing Assessment City of Wyoming and Village of Lockland
April 2008 Page 29
Village of Lockland Lockland shows many characteristics of a traditional urban industrial neighborhood, now experiencing a decline of devel-
opment. They have a diverse ethnic population, with householder ages that range from 25 to 54 years old and a median age of 38 years. Like other urban or near-urban neighborhoods, their owner-occupancy is low at 43% with a strong presence of renter-occupied housing units at 39%. Owner occupancy in Lockland is stable and has stayed relatively con-stant over the years. However, rental occupancy has decreased while vacancies have increased, indicating that rental
properties in Lockland are likely in decline and could be inhibiting overall neighborhood vitality. In similar submarkets throughout the Midwest, high vacancies contribute to higher crime, declining property values and village tax base, while publically eroding the image of the community.
Yet, deteriorating housing stock also provides opportunity to renew the community by assembling and acquiring a con-centration of distressed stock for redevelopment. There are many well-intended home rehabilitation loans and govern-ment grants to provide incentives, but successful renewal must be done at an impactful scale. Scale provides the ability
to mix asset classes while spreading the associated costs of redevelopment across more real estate. Despite its apparent decline, our analysis also uncovered unserved Lockland households that could afford higher priced housing if made available. The most viable area for new housing seems to be located near the Lockland business district
adjacent to the City of Wyoming. New homes in this area could catalyze commercial activity in Lockland’s business dis-trict, and give proximate access to the existing retail and lifestyle amenities in Wyoming. To execute such renewal, Lock-land will have to take a more direct and active role to build partnerships with adjacent communities, and later, entice pri-
vate-sector developers to invest in the village. We are aware that the current resources of Lockland do not match their obvious desire to begin the next stage of their life cycle. Early discussions have been over specific sites, like the Celotex and Sterns properties. We believe that poten-
tial redevelopment for Lockland, Wyoming, and the adjacent communities begins in Lockland. Lockland’s potential is enhanced by the transportation corridors, with excellent access to Interstate 75 and the Wyoming
business district. Investment around these corridors could catapult Lockland’s growth. The combination of this transpor-tation “high ground” with low property values should catalyze redevelopment if properly planned and supported:
� Creating plans and contingencies to replace deteriorating housing stock, upgrade existing stock, and offer new
housing product will be key to attract redevelopment interest within the Business District
� Redevelopment collaboration with the City of Wyoming is vital. The shared business district should cater to the
needs of both Wyoming and Lockland residents, offering a diverse mix of retail, services, and businesses.
� A revitalized business district should consider and include community buildings, libraries, entertainment, and
neighborhood serving retail options that encourage walking and create a new vibrancy within the corridor.
Early public meetings
have voiced a consensus that together, Wyoming
and Lockland should assess their resources and form “a coherent
roadmap to better serve their residents.”
In a recent public meet-
ing, one civic leader asked aloud, “Couldn’t Lockland become the
Downtown of Wyoming, just like Madeira has
become the Downtown to Indian Hill?”
PROFESSIONAL CONCLUSIONS and RECOMMENDATIONS, continued.

Commercial Impact Analysis & Marketplace Housing Assessment City of Wyoming and Village of Lockland
April 2008 Page 30
The following is our early example of the direction the City of Wyoming and Village of Lockland should consider, to be dis-
cussed in detail in our Stage Two analysis. We identified the existing City Center Zone of Potential Change as having the greatest initial potential to catalyze future economic activity. This Zone, highlighted by the orange ellipse, is contiguous
to Lockland, provides the best access to Interstate 75, and has the best future connection to other strong employment and residential areas within the region. Wyoming’s Master Plan and collaborations to date with the Village of Lockland
portend the City’s commitment to create and sustain its com-munity for the next 20-30 years.
In this Zone, Wyoming has a higher-density street grid while Lockland has developable industrial land, available proper-
ties, and access to Interstate 75. Cultivating Lockland's rede-velopment potential will offer Wyoming residents new retail options that are walkable and extend across the City limits.
Our analysis has shown that the City of Wyoming has signifi-cant demand for new commercial space that would ideally become a component of each Zone. Our next Stage will re-view the potential Zones at a more granular level to explore
the optimal mix of residential and commercial space bal-anced by Zone and throughout the community.
For further example, we have provided details on an early pilot analysis of future development in Lockland. Adjacent to Wyoming’s business district, Lockland has available space and potential land acquisition costs would likely be more af-
fordable. As the gateway to Interstate 75, redevelopment would draw activity from the east in Reading, Evendale, and Amberley Village. Unlocking this corridor will visibly increase
both Lockland’s and Wyoming’s ability to capture current demand for new retail and commercial activity, including the prospect of embedding more affordable housing. We have discussed two critical issues with redevelopment of this Zone. The first is master-planning at scale in genuine cooperation and shared resources by the City and Village lead-ership. Actual site development by select private-sector firms would later follow the master-planning. The second is as-
semblage and control of the underlying land.
PROFESSIONAL CONCLUSIONS and RECOMMENDATIONS, continued.

Commercial Impact Analysis & Marketplace Housing Assessment City of Wyoming and Village of Lockland
April 2008 Page 31
The aerial map and graphics at left frame this example scenario.
In the proposed 19 acres of combined land highlighted to the left, there is approximately a half-mile of road corridor from the beginning of
Lockland’s business district to Wyoming’s busi-ness district. The assembled acreage could be developed to
create a renewed “lifestyle place” that is unique to Lockland and blends easily with today’s retail district in Wyoming.
This development should take an organic ap-proach, salvaging commercial buildings that are usable while also offering new and diverse op-
tions in housing, boutique neighborhood–serving retail and even small office services. Streetscape would brand the corridor with land-
scaping, and refined pedestrian “edges.” This mix would better attract younger profes-sionals and families, as well as more mature
households from the west. Commercial options should include neighbor-hood serving retail options such as eateries, sa-
lons, dry cleaners, child care, grocery and phar-macy stores. Office condominiums or smaller
leased space would draw local small businesses, banks, and other office services, increasing daytime employment within the
area. With optimal scale and access, this area could also include entertainment options such as a theater, arcade, boutique shopping, and other recreational services to cater to local residents leisure activities. When complete and stabilized, these venues would generate new employment for Lockland and Wyoming, one of the most
critical needs for community renewal and sustaining a strong local economy.
½ Mile½ Mile½ Mile
PROFESSIONAL CONCLUSIONS and RECOMMENDATIONS, continued.

Commercial Impact Analysis & Marketplace Housing Assessment City of Wyoming and Village of Lockland
April 2008 Page 32
This Marketplace Housing and Commercial Impact Assessment report was compiled for the exclusive use of:
City of Wyoming and Village of Lockland
Any disclosure of the contents of this market report without their expressed permission is not authorized. The market data and information obtained from public records and compiled from onsite reviews is not proprietary. Unless noted otherwise, any field survey information compiled in this market study was verified from a second source, usually in the
form of a personal or telephone interview with another industry professional having knowledge of the owner, builder, product, community or market trend.
Property Advisors has taken great care to gather, compile and document the information contained in this market report to their best abilities within the time and information constraints available. There is a small margin for error in each component of the study, but these errors are likely housing or demographic data undercounts that, when combined, have a negligible effect on the market trends derived and their inherent value to future development considerations within
Wyoming or Lockland. Our conclusions drawn from the Commercial Impact and Marketplace Housing Assessment, if any, are based upon Client disclosures, assembled housing data, reasonable industry and professional assumptions, and our twenty years’ experi-
ence in residential land development, residential marketing and commercial market analysis. Client must make their own assumptions and impart their own experience on the information presented in order to validate any conclusions drawn or even draw conclusions of their own.
Any errors in data accuracy, word processing and/or report formatting are not intended and Property Advisors will correct any reasonable error found upon request.
It has been a professional pleasure to provide the City of Wyoming and Village of Lockland with this focused real estate information.
Thank you.
Michael J. Dinn, CRE Partner Property Advisors, LLC
CONFIDENTIALITY and DISCLAIMERS