Embed Size (px)
Citation preview

Markets for Other People�s Money: An ExperimentalStudy of the Impact of the Competition for Funds
Marina Agranov�, Alberto Bisiny, and Andrew Schotterz
March, 2011
Abstract
In this paper we experimentally investigate the impact that competing for funds hason the risk-taking behavior of laboratory hedge fund managers. We construct a simplelaboratory market for capital among hedge funds where each fund o¤ers a contractthat shares a stylized version of various features that are commonly observed in real-world markets of this type. We �nd that commonly used hedge fund contracts leads toine¢ cient risk taking behavior on the part of investors. We then construct a numberof di¤erent contractual environments which vary the transparency of the contractso¤ered, their risk sharing component, their maximum return etc. and �nd that whileall of these treatments prove to substantially reduce risk taking among fund managers,the most e¢ cient is our transparency treatment. Finally, we �nd an "Other People�sMoney" e¤ect where fund managers tend to invest the funds of their investors in amore risky manner than their own money.
JEL Classi�cation: D86, D92
Key Words: Hedge Funds, Contracts, Experiments
Acknowledgement: Thanks to Giancarlo Spagnolo for useful comments. We wouldalso like to thank the Center for Experimental Social Science at New York Universityfor support.
�Caltech and CESS (Center for Experimental Social Science at NYU)yNYU, NBER and CESS (Center for Experimental Social Science at NYU)zNYU and CESS (Center for Experimental Social Science at NYU)
1
1 Introduction
In this paper we experimentally investigate the impact that competing for funds has on therisk-taking behavior of laboratory hedge fund managers. We construct a simple laboratorymarket for capital among hedge funds where each fund o¤ers a contract that shares a stylizedversion of various features that are commonly observed in real-world markets of this type.More precisely, the investor is not well-diversi�ed across funds, the fund investment strategyis opaque, and the managerial contract induces risk taking. In such markets managers facean option-like compensation scheme according to which they receive (most of) their com-pensation only for returns in excess of pre-speci�ed strike price (the details of this contractare described in Section 1.2).
We �nd that this standard hedge fund contract leads to ine¢ cient risk taking behavior. Inthe face of this ine¢ ciency, we then construct a number of di¤erent contractual environments(which can be thought of also as policy interventions) aimed at limiting risk taking on thepart of managers. More speci�cally, in one environment (the Transparency treatment) weimpose transparency on the fund investment strategy by forcing the manager to announce(and commit to) the risk level of its intended investment before the investor invests. Ina second environment (Risk Sharing), we modify the managerial incentive compensationscheme to allow complete risk sharing between the manager and the investor. Finally, ina third environment (Restricted Competition), we cap the strike price or promised returnwhich managers can o¤er investors to limit how much competition could unravel. All ofthese treatments prove to substantially reduce risk taking in the experimental data (withthe most e¢ cient being the Transparency treatment), as predicted at equilibrium. However,they fail to fully eliminate ine¢ cient risk taking.
In addition to the treatments described above we also run an Own Money treatment, which isidentical to the Risk Sharing treatment except that in the Own Money treatment the mangeris investing his own funds while in the Risk Sharing he is investing other people�s money thathe competed for. Interestingly, we �nd that managers tend to invest other people�s moneyin riskier assets than they would invest their own money. We interpret this di¤erence asa manifestation of what we call the Other people�s money e¤ect.1 Indeed, while managersinvested their own funds in the risky project only about 10.2% or 21.5% of the time (de-pending on the treatment), they invested other people�s money in such projects 42% of thetime in the Risk Sharing treatment. The Other peoples�money e¤ect, therefore, representsa quantitatively signi�cant behavioral ine¢ ciency induced by competition for funds in ourhedge fund laboratory.2
1After the title of the 1991 Norman Jewison movie, with Danny De Vito.2The Other people�s money e¤ect is consistent with the fact that hedge fund performance appears to be
positively linked only to measures of the overall pay-performance sensitivity of managerial incentive pay (theoverall "delta"), which include private ownership; see Agarwal-Daniel-Naik (2008). While private ownershiprequirements are included in incentive contracts to align the manager�s and the investors�objectives, theymight also have the e¤ect of limiting the Other people�s money e¤ect.
2
Our paper, by documenting the Other peoples� money e¤ect, is related to a few recentpapers that study experimentally the risk attitudes of subjects towards other people�s money.Brennan-Gonzales-Guth-Levati (2008) investigates the relation between risk preferences andother-regarding concerns when one�s own and another person�s payo¤ is risky. The main�nding of this paper is that behavior depends mostly on the riskiness of the subjects�ownpayo¤ and not so much by the riskiness of the others�payo¤. Chakravarty-Harrison-Haruvy-Rutstrom (2010) examines risk attitudes of laboratory subjects towards their own uncertainpayo¤s as well as the uncertain payo¤s of other subjects. The major �nding is that, whensubjects make a decision on behalf of an anonymous stranger, the chosen lottery (action)tends to be more risky than what the lottery they would choose for themselves, controllingfor preferences and for beliefs about the preferences of others. While the experimentalenvironments are very di¤erent, the phenomena studied in this last paper and our ownare related and are both referred to as Other peoples�money e¤ect. The main di¤erence,however, is that in the Chakrvarty et al. paper the decision makers who makes decisionsfor others are not incentivized to do so while in our paper people make decisions for othersunder a variety of di¤erent incentive contracts. We feel this distinction is important sinceone neeeds to control the incenitves of decision makers who make decions using other peoplesmoney in order to reach conclusions about their behavior.
1.1 What this paper does not do
Before we present our analysis it is important to state what we consider to be the main aimof our experiment. First, while we present a simple model of the competition for funds, ouremphasis is not on the model�s point predictions. Rather, as is true in many experiments, weare more interested in its qualitative comparative statics since it is those that have the majorpolicy implications. Second, while we couch our discussion with reference to the hedge fundmarket, our interests are broader than that since our results hold for any market where �rmscompete for funds. Finally, with respect to hedge funds, one may argue that the terms ofhedge fund contracts are not negotiated in the market but rather set historically as a "2=20contract" (2% �xed commission and an additional 20% if the hedge fund earns more than athreshold ("high water-mark") return). Our results are still highly relevant, however, sincethe question remains as to whether this historically determined contract provides incentivesfor prudent or risky investment. In other words, this contract, while a current market norm,was presumably once set by competition and the question as to whether it was set e¢ cientlyremains of relevance.
1.2 Hedge Funds
To put our experiments in their proper context let us discuss the market for hedge funds.Hedge funds are largely unregulated investment funds which, in the last twenty years havebecome increasing important in the capital markets. At its peak in the summer 2008, the
3
hedge fund industry managed around $2:5 trillion, according to Aima�s Roadmap to HedgeFunds, Inechen-Silberstein (2008).3 Hedge funds typically compete for institutional andwealthy investors, requiring a substantial minimal investment tranche to participate in thefund (thereby imposing substantial diversi�cation costs to investors). Moreover, hedge fundsare characterized by their investment strategies and by the incentive schemes their managersare compensated with.
The investment strategies and styles of hedge funds are generally opaque, and are not re-vealed to investors. In other words, fund managers compete for investors in this market bysignalling skills through past performance and through their incentive compensation scheme.Managers�compensation includes typically a small management fee (proportional to the in-vestment tranche, of the order of 1 � 2%) and a larger performance fee, of the order of15 � 25% of returns exceeding the "high-water mark" (the maximum share value in a pre-speci�ed past horizon). This incentive compensation scheme is equivalent to a call optionwith the "high-water mark" as strike price. Furthermore, the manager is subject only tolimited liability, while it is relatively standard in the industry to require that a substantialfraction of the managers�private capital be heavily invested in their own fund.4
Option-like contracts, like those common in the hedge fund industry, are designed to signalmanagerial skills,5 but also induce managers to take high risks.6 A large empirical literaturehas documented that, in fact, i) hedge funds returns contain a signi�cant excess risk-adjustedreturn due to managerial skills (or "alpha"),7 ii) hedge fund returns are signi�cantly riskierthan other investment forms (e.g., mutual funds).8 In particular, even though hedge fundreturns display a low correlation with stock market indices, they are characterized by excep-tionally large cross-sectional range and variation.9 Furthermore, the attrition rate of hedgefunds in the market is very high (over 50% in 5 years from the 90�s).10
3The �rst hedge fund was apparently founded by A.W. Jones, a sociologist and �nancial journalist, in1949. In the 1990�s, however, the industry was managing about $50 billions; see Malkiel-Saha (2005).
4See Fung-Hsieh (1999) and Goetzmann-Ingersoll-Ross (2001) for rich institutional details on the hedgefund industry.
5See, however, Foster-Young (2008) for a theoretical result suggesting lack of separation along the skilldimension in these contractual environments.
6More precisely, a rational portfolio manager facing a dynamic option-like contract will be lead to takeextreme risk while the fund is below water (its return below the "high-water" mark), while he will investmore safely when just above water. See e.g., Carpenter (2000), Goetzmann-Ingersoll-Ross (2001), andJackwerth-Hodder (2006) for the supporting portfolio choice theory; but see also Panageas-Wester�eld (2007)for di¤erent results with in�nite horizon.
7See Edwards-Caglayan (2001).8See Brown-Goetzmann-Park (2001).9See Brown-Goetzmann (2001) and, especially, Malkiel-Saha (2005).10Even after accounting for survivor (and other related) bias, hedge funds paid (geometric) average returns
2% in excess of mutual funds in the period 1996�2003; see Malkiel-Saha (2005), Table 3�4. See also Liang(2000) and Amin-Kat (2002).
4
We proceed in this paper as follows. In Section 2 we will present a simple model of amarket for capital and we prove some simple results about the equilibria of such markets.The capital markets in the model share some features of the capital markets in which hedgefunds compete. The objective of the model, however, is to capture only some stylized featuresof these markets, and hence we abstract from several institutional details which might a¤ectin a relevant manner the allocation of funds in these markets. We will then introduce, inSection 3, our experimental design, mapping the model into a simple laboratory market. InSection 4 we present the results of our experiment. Finally, in Section 5; we present ourconclusions.
2 The market for Other People�s Money
The type of markets we are interested in are the capital markets in which hedge fundscompete for funds. In such markets typically,
i) the size of the investment per investor is �xed, say $1 (million, typically);
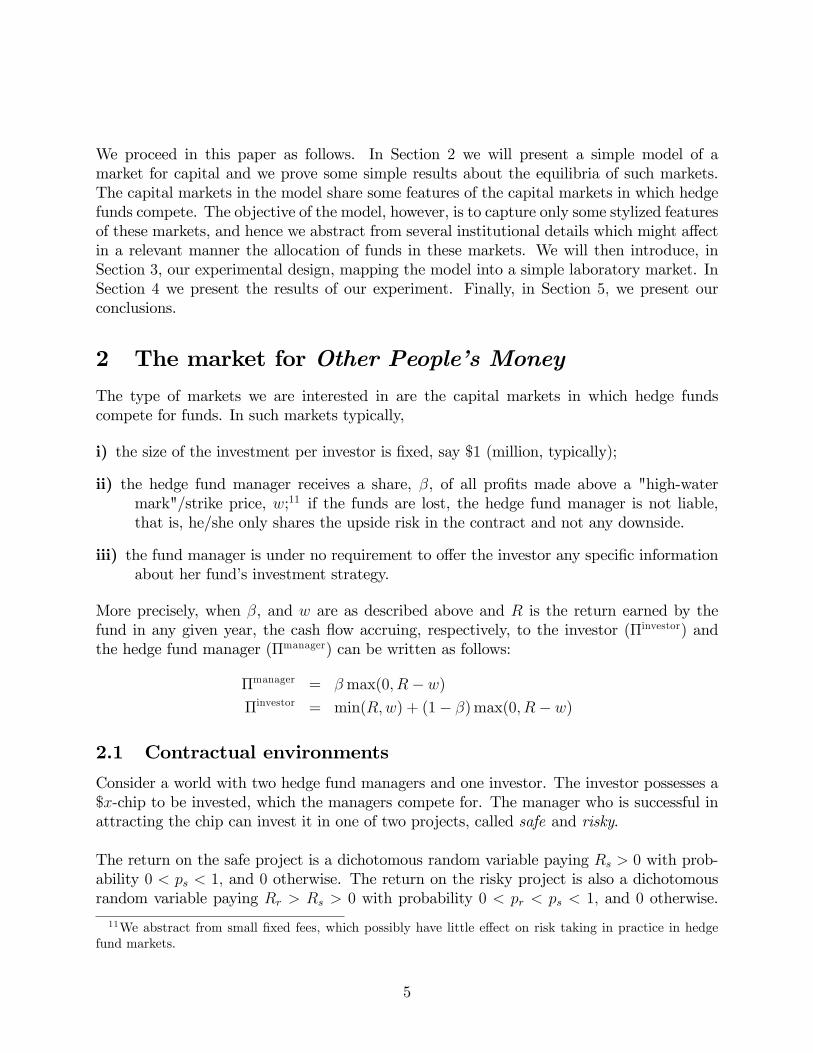
ii) the hedge fund manager receives a share, �, of all pro�ts made above a "high-watermark"/strike price, w;11 if the funds are lost, the hedge fund manager is not liable,that is, he/she only shares the upside risk in the contract and not any downside.
iii) the fund manager is under no requirement to o¤er the investor any speci�c informationabout her fund�s investment strategy.
More precisely, when �, and w are as described above and R is the return earned by thefund in any given year, the cash �ow accruing, respectively, to the investor (�investor) andthe hedge fund manager (�manager) can be written as follows:
�manager = �max(0; R� w)�investor = min(R;w) + (1� �)max(0; R� w)
2.1 Contractual environments
Consider a world with two hedge fund managers and one investor. The investor possesses a$x-chip to be invested, which the managers compete for. The manager who is successful inattracting the chip can invest it in one of two projects, called safe and risky.
The return on the safe project is a dichotomous random variable paying Rs > 0 with prob-ability 0 < ps < 1; and 0 otherwise. The return on the risky project is also a dichotomousrandom variable paying Rr > Rs > 0 with probability 0 < pr < ps < 1; and 0 otherwise.
11We abstract from small �xed fees, which possibly have little e¤ect on risk taking in practice in hedgefund markets.
5
Note that the risky project, has a higher return when successful with respect to the safeasset; but the probability of success is higher for the safe asset. We assume however thatthe safe payo¤ has a higher expected return,
psRs > prRr:
This assumption is called for, because we want to study the case in which investing in therisky asset is a dominated choice, absent the moral hazard implicit in the hedge fund man-ager�s intermediation of funds.
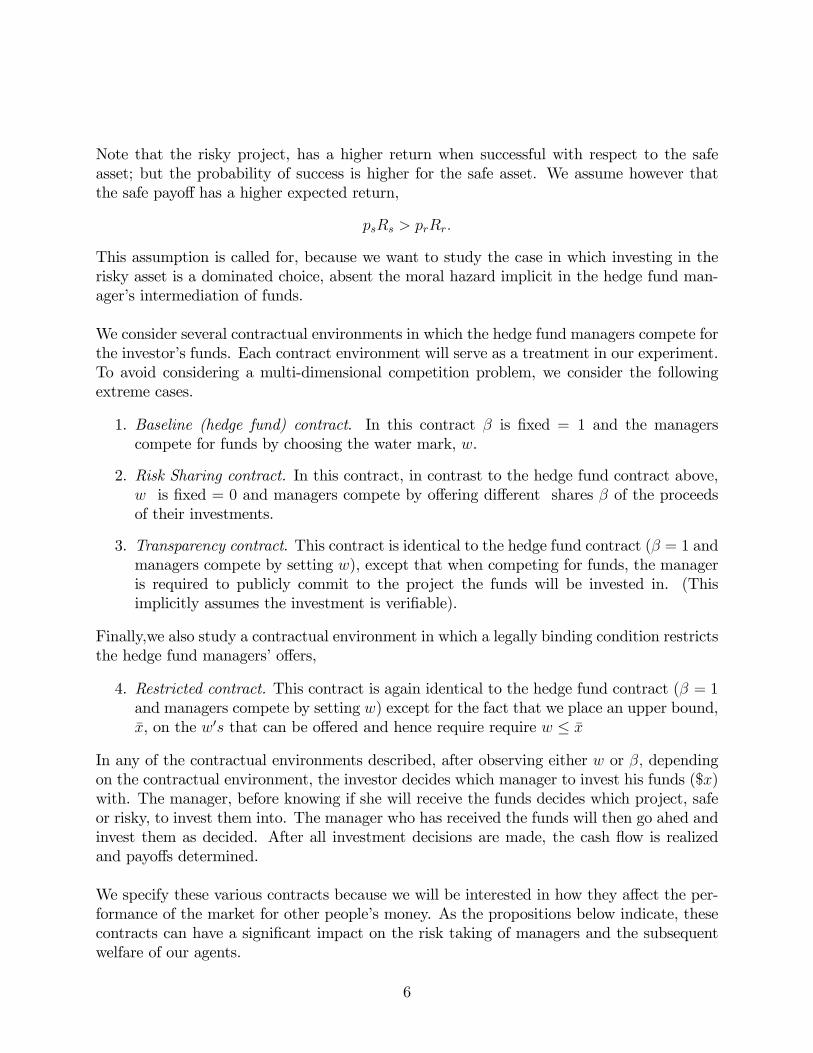
We consider several contractual environments in which the hedge fund managers compete forthe investor�s funds. Each contract environment will serve as a treatment in our experiment.To avoid considering a multi-dimensional competition problem, we consider the followingextreme cases.
1. Baseline (hedge fund) contract. In this contract � is �xed = 1 and the managerscompete for funds by choosing the water mark, w.
2. Risk Sharing contract. In this contract, in contrast to the hedge fund contract above,w is �xed = 0 and managers compete by o¤ering di¤erent shares � of the proceedsof their investments.
3. Transparency contract. This contract is identical to the hedge fund contract (� = 1 andmanagers compete by setting w), except that when competing for funds, the manageris required to publicly commit to the project the funds will be invested in. (Thisimplicitly assumes the investment is veri�able).
Finally,we also study a contractual environment in which a legally binding condition restrictsthe hedge fund managers�o¤ers,
4. Restricted contract. This contract is again identical to the hedge fund contract (� = 1and managers compete by setting w) except for the fact that we place an upper bound,�x, on the w0s that can be o¤ered and hence require require w � �x
In any of the contractual environments described, after observing either w or �; dependingon the contractual environment, the investor decides which manager to invest his funds ($x)with. The manager, before knowing if she will receive the funds decides which project, safeor risky, to invest them into. The manager who has received the funds will then go ahed andinvest them as decided. After all investment decisions are made, the cash �ow is realizedand payo¤s determined.
We specify these various contracts because we will be interested in how they a¤ect the per-formance of the market for other people�s money. As the propositions below indicate, thesecontracts can have a signi�cant impact on the risk taking of managers and the subsequentwelfare of our agents.
6

2.2 Equilibria
We now study equilibria in the di¤erent contractual environments.12 We concentrate �rston the basic hedge fund contract, our baseline.
Result 1: In the Baseline contract, there exist a cuto¤ w� such that, if w � w� each man-ager has an incentive to invest the funds in the risky project (strictly so, if w > w�).
In fact, w� is such that each manager is indi¤erent with respect to her investment, and itsatis�es
w� =psRs � prRrps � pr
> 0
Result 2: In the Baseline contract, if one manager o¤ers w1 and another manager o¤ersw2 such that w1 � w� � w2 and w2
w1> ps
pr, then the investor will give his chip to the manager
who o¤ered w2. Likewise, in the transparency contract, if one manager o¤ers (w1,safe) whilethe other manager o¤ers (w2,risky) and w2
w1> ps
pr, then the investor will give his chip to the
manager who chose the risky project.
These results state that if one manager chooses the safe project, the other manager has anincentive to o¤er a high enough w and choose the risky project. That is, there exists a riskpremium (ps
pr) such that a rational investor will be willing to leave the safe project for the
risky one. In the transparency contract an investor is able to observe the contract in whichhis funds will be invested. Thus, an investor demands a compensation of at least w2 � w1 � psprfor high risk. In the baseline contract, if w1 � w� � w2 then the investor can infer that amanager that o¤ered w1 will invest in the safe project and a manager that o¤ered w2 willinvest in the risky project (see result 1). Since ps
prw� < Rr a deviation on the part of a
manager to the risky project is always feasible. This is the case under a regularity conditionbounding the relative return of the safe project, a condition satis�ed by the parametrizationof the game we take to the lab.
It is now straightforward to show, by a Bertrand competition argument, that
Proposition 1: In the Baseline contract, at equilibrium, both hedge fund managers o¤erw = Rr and invest the funds in the risky project.13
Proposition 2: In the Transparency contract, at equilibrium, both hedge fund managerso¤er w = Rs and invest the funds in the safe project.
12See Matutes-Vives (2000) for a model of bank competition which resembles, along several dimensions,our laboratory hedge fund market.13This result holds true more generally, when managers in hedge fund markets compete by choosing both
the share, �; of all pro�ts made above a "high-water mark"/strike price, w, and the "high-water mark"/strikeprice, w itself; see Appendix 1.
7
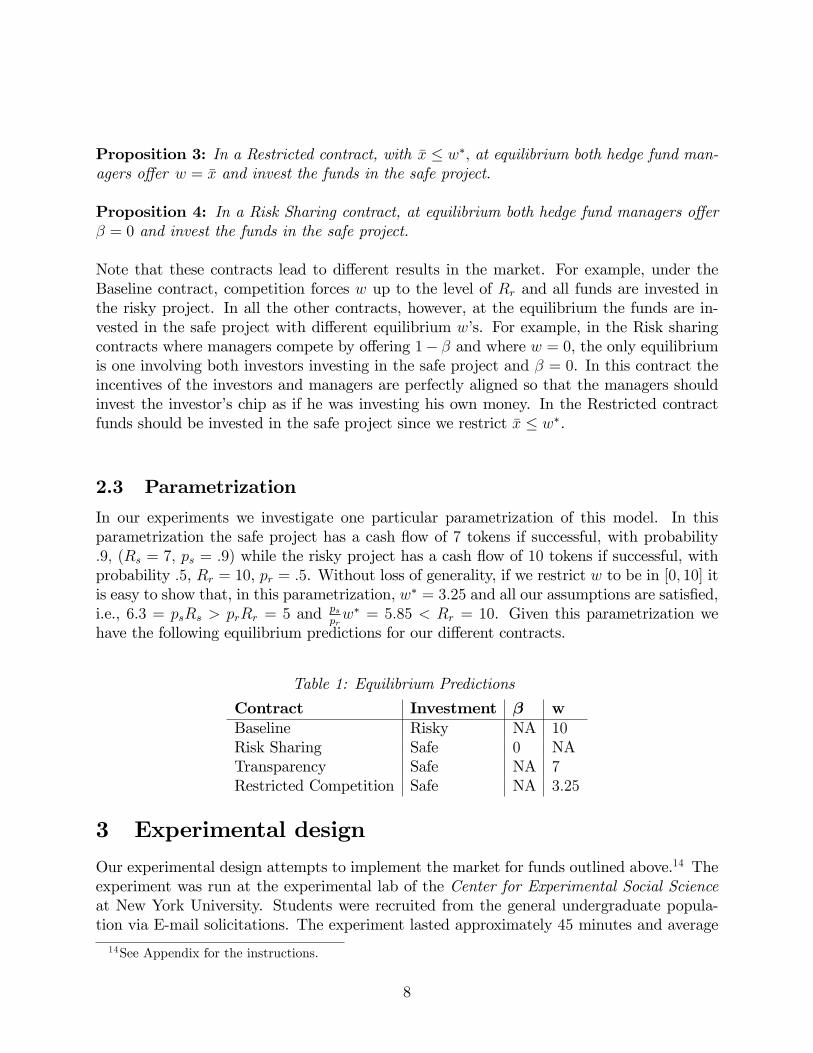
Proposition 3: In a Restricted contract, with �x � w�; at equilibrium both hedge fund man-agers o¤er w = �x and invest the funds in the safe project.
Proposition 4: In a Risk Sharing contract, at equilibrium both hedge fund managers o¤er� = 0 and invest the funds in the safe project.
Note that these contracts lead to di¤erent results in the market. For example, under theBaseline contract, competition forces w up to the level of Rr and all funds are invested inthe risky project. In all the other contracts, however, at the equilibrium the funds are in-vested in the safe project with di¤erent equilibrium w�s. For example, in the Risk sharingcontracts where managers compete by o¤ering 1� � and where w = 0, the only equilibriumis one involving both investors investing in the safe project and � = 0. In this contract theincentives of the investors and managers are perfectly aligned so that the managers shouldinvest the investor�s chip as if he was investing his own money. In the Restricted contractfunds should be invested in the safe project since we restrict �x � w�.
2.3 Parametrization
In our experiments we investigate one particular parametrization of this model. In thisparametrization the safe project has a cash �ow of 7 tokens if successful, with probability:9; (Rs = 7; ps = :9) while the risky project has a cash �ow of 10 tokens if successful, withprobability :5, Rr = 10, pr = :5. Without loss of generality, if we restrict w to be in [0; 10] itis easy to show that, in this parametrization, w� = 3:25 and all our assumptions are satis�ed,i.e., 6:3 = psRs > prRr = 5 and ps
prw� = 5:85 < Rr = 10. Given this parametrization we
have the following equilibrium predictions for our di¤erent contracts.
Table 1: Equilibrium Predictions
Contract Investment � wBaseline Risky NA 10Risk Sharing Safe 0 NATransparency Safe NA 7Restricted Competition Safe NA 3:25
3 Experimental design
Our experimental design attempts to implement the market for funds outlined above.14 Theexperiment was run at the experimental lab of the Center for Experimental Social Scienceat New York University. Students were recruited from the general undergraduate popula-tion via E-mail solicitations. The experiment lasted approximately 45 minutes and average
14See Appendix for the instructions.
8
earnings were $20. Each di¤erent contractual environment represents a treatment in theexperiment.
The Baseline treatment is the hedge fund contract environment, which we introduce �rst.When subjects arrived at the lab they were divided into groups of three with two managersand one investor in each group. The experiment consisted of 20 identical decision rounds.In each round the investor was endowed with one "investment chip". Each round startedby each manager simultaneously selecting a promised w 2 [0; 10]. The managers also choosewhich project, safe or risky, they intend to invest in. The w�s are announced to the investorin the market, but not the investment decision, which is kept private. After both managerschoose their w�s, the investor decides who to invest his chip with. The selected manager thenhas the right to make the investment that she decided on. The other manager can make noinvestment in this round. We ran our market with only one investor in order to maximizecompetition and with only two managers in an e¤ort to minimize the number of subjectsneeded (and hence the amount of money required).
After the investment decisions were made the chosen project was played out and payo¤sdetermined. A successful investment in the risky project paid 10�w tokens to the managerand w to the investor. A successful investment in the safe project paid max f0; 7� wg tokensto the manager and min f7; wg tokens to the investor (the manager is not liable for any losesimposed on the investor).
After each round, both managers observe the w chosen by the other and which managerreceived the chip. In case the manager received the chip, she was also informed as to whichproject the chip was invested in, the resulting cash �ow, and whether or not she was ableto pay the investor in this round. The investor was told whether or not he received hispayment and his pro�t in this round, but not which project the chip was invested in. Theexperiment then moved into the next round where subjects were randomly matched intonew groups of 3 while retaining their role in the experiment, so that if a subject was aninvestor (manager) in round 1 she retained that role over the entire 20 rounds. The identityof subjects were anonymous so subjects could not identify their roles. This eliminated thepossibility of managers creating a reputation.
In addition to the Baseline treatment, we ran several other treatments each of which repli-cated one of the di¤erent contractual environments described above. The �rst such treatmentis the Restricted treatment, for which we pick �x = 3: This treatment was run to check ourhypothesis that it is competition, and the heightened promises of returns it encourages, thatlead to risky behavior on the part of investors. Obviously, since 3 < 3:25 = w�; in thistreatment we would expect all funds to be invested in the safe project. Otherwise, ourhypothesis that risk taking is an artifact of market competition pushing promised returnsabove w� = 3:25 would be easily disproved. In this treatment all procedures were identicalto those of the hedge fund contract except for the restriction on w.
9
Our Transparency treatment is identical to the baseline hedge fund contract except for thefact that in the �rst move of the game the managers not only choose w, but also commit ona project to invest in. In other words, they choose a pair (w, Project) where Project2 fsafe,riskyg and each pair chosen by the managers is shown to the investor. The investor thenchooses a manager to give his chip to and the rest of the round is played out as in the HedgeFund treatment.
Our fourth treatment is the Risk Sharing treatment. In this treatment w = 0 and managerso¤er a share 1�� to the investor indicating what fraction of the returns investors will receiveif the project succeeds. If � = 0 then all the proceeds of the investments go to the investor,while if � = 1 then the manager keeps all the proceeds for himself. This treatment is con-ducted using private information (when making their choice investors observe only the sharesboth managers propose) in an e¤ort to isolate the impact of the contract on behavioral andnot confound it with transparency considerations.
In all four treatments discussed above when the experiment was over we surprised the sub-jects by informing them that we wanted them to engage in one more decision. In this decisionwe gave each of them a chip and asked them to invest it for themselves in either the riskyor the safe project. The chip was worth 10 times the value of the chip used in the previ-ous 20 rounds so this decision was a more valuable one and should indicate how subjectswould invest when investing their own money rather than that of others. This investmentopportunity was given to both subjects who played the role of investors and managers in theexperiment. We will refer to this part of the experiment asOwn Money (big stakes) treatment.
The Own Money (big stakes) treatment is similar to the "surprise quiz" round used by Merloand Schotter (1999). In this treatment subjects play for large stakes and do so only onceafter their multi-round participation in the experiment. The idea is that this one large-stakesdecision should be a su¢ cient statistics for all they have learned during their participationin the experiment.15
Finally, we ran an an additional Own Money treatment which we call the Own Money (smallstakes) treatment. In this treatment, all subjects participating in the experiment performedthe role of managers. In each round (20 rounds in total) the manager was endowed withhis/her own chip and faced the same two investment projects: safe and risky. The task ofthe manager was to choose how to invest his/her own chip. After the investment decisionswere made the chosen project was played out, payo¤s determined and shown to the subjects.As before, a successful investment in the risky project paid 10 tokens and a successful in-vestment in the safe project paid 7 tokens.
15In this sense it is preferable to repeating the Own Money (small stakes) treatment 20 times since in thattreatment repetition may lead to boredom and false diversi�cation.
10
The Own Money (small stakes) treatment is designed to replicate as close as possible themain features of the Risk Sharing treatment with one modi�cation: managers are invest-ing their own money ("investment chip") as opposed to the other people�s money (the chipreceived from the investor). Indeed, similar to the other treatments, in the Own Money(small stakes) treatment the game is repeated (20 decision rounds), the stakes are of thesame magnitude and, �nally, subjects have no prior experience with the game being played.
Given the projects available, at equilibrium, managers invest their own funds in the safeproject. This is the case also, at equilibrium, for the Risk Sharing treatment, in which man-agers invest funds received from the investor, because the preferences of the manager andthe investor are completely aligned. Any di¤erence we might observe in manager�s behaviorwhen they invest their own money and investors�money, will be interpreted as a manifesta-tion of the Other peoples�money e¤ect described in the Introduction.
Our complete experimental design is summarized in Table 2.
Table 2: Experimental Design
Treatment Competition Information Number of subjectsBaseline unrestricted only w 33Restricted Competition w � 3 only w 30Risk Sharing unrestricted only 1� � 45Transparency unrestricted (w,Project) 39Own Money (small stakes) none NA 23Own Money (big stakes) none NA 147
4 Results
Depending on the contractual environment, competition for funds might lead the market tounravel, inducing investment in a risky project when a safe project dominates in terms ofexpected returns. This is the case at equilibrium in the Baseline (hedge fund) contractualenvironment. The �rst fundamental question of the paper, therefore is,
1. Does the outcome in the lab experiment �t the equilibrium prediction in the Baselinetreatment where all funds are invested in the risky project and w = 10?
On the other hand, all the other contractual environments we study experimentally predictthat, at the equilibrium, managers invest in the safe project o¤ering w�s that vary withthe contract used. The competitive mechanism leading to this outcome is however di¤erentin the di¤erent contractual environments. A natural question we ask, therefore, is if thisprediction is borne out in the experimental data?
11
2. Does the market in the Restricted, Transparency, and Risk Sharing treatments lead toinvestment in the safe project? Does competition in these treatments manifest itselfas predicted by equilibrium?
The other fundamental question we address in the paper regards the existence of an Otherpeople�s money e¤ect.
3. Do managers in the Own Money treatments tend to invest their own chip in a safermanner than they invested investor�s money in the Risk Sharing treatment? Is therea Other people�s money e¤ect?
After establishing the e¤ects of the competition on the risk taking behavior of managers, weshall turn to investors. Our main question in this respect is
4. Do investors choose the manager to invest with rationally? Do they anticipate the rela-tionship between the return they are o¤ered and the managers�investment strategy?
4.1 Does the market unravel in the Baseline treatment?
In the Baseline (hedge fund) contract environment, at equilibrium, managers are expectedto o¤er the highest return w = 10 and invest in the risky project. The key element in thisresult is that competition for funds will force w above 3:25 at which point investing in therisky project becomes rational for the manager. In contrast, in the Restricted treatment,where w � 3, no funds should be invested in the risky project. Hence, our theory impliesthat it is competition that is responsible for risky investment since it succeeds in pushing wabove the critical threshold. If funds were invested in the risky project equally in these twotreatments, then the obvious conclusion would be that it is not competition that leads torisky behavior but, perhaps, some type of risk seeking that arises especially when managersare investing other peoples�money. The cleanest way to identify such market unraveling inthe Baseline treatment is to compare the outcome in this treatment and in the Restricted
12
treatment.
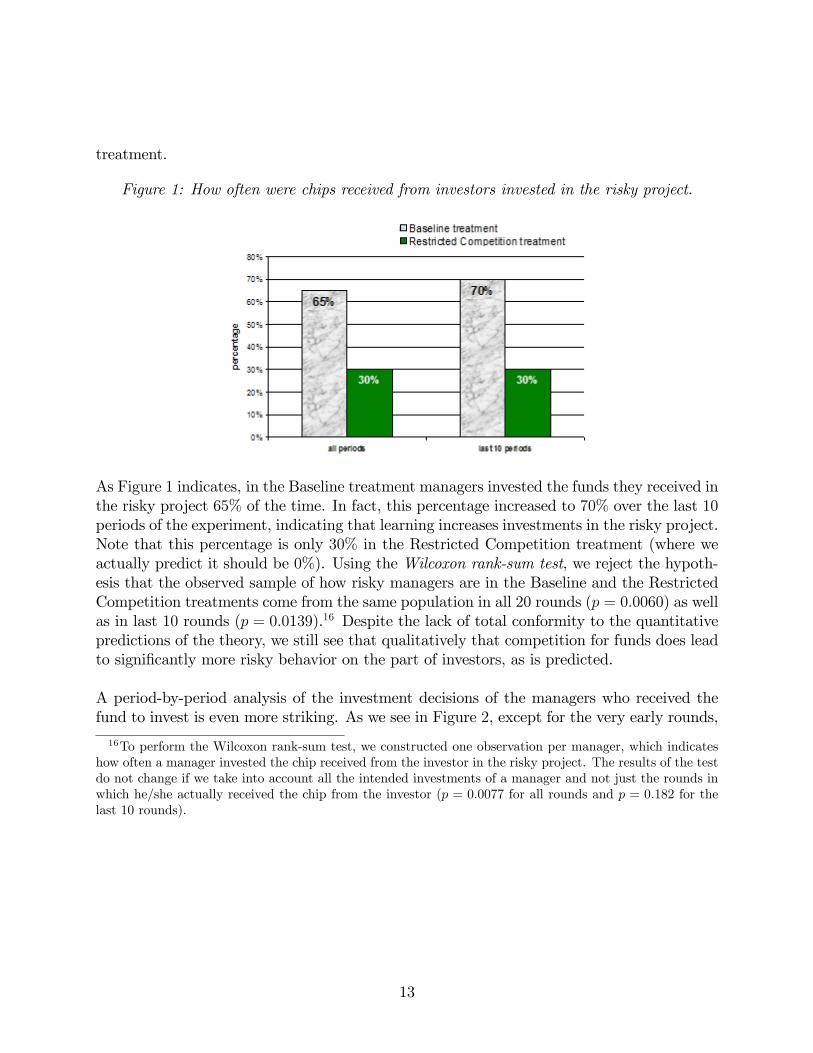
Figure 1: How often were chips received from investors invested in the risky project.
As Figure 1 indicates, in the Baseline treatment managers invested the funds they received inthe risky project 65% of the time. In fact, this percentage increased to 70% over the last 10periods of the experiment, indicating that learning increases investments in the risky project.Note that this percentage is only 30% in the Restricted Competition treatment (where weactually predict it should be 0%). Using the Wilcoxon rank-sum test, we reject the hypoth-esis that the observed sample of how risky managers are in the Baseline and the RestrictedCompetition treatments come from the same population in all 20 rounds (p = 0:0060) as wellas in last 10 rounds (p = 0:0139).16 Despite the lack of total conformity to the quantitativepredictions of the theory, we still see that qualitatively that competition for funds does leadto signi�cantly more risky behavior on the part of investors, as is predicted.
A period-by-period analysis of the investment decisions of the managers who received thefund to invest is even more striking. As we see in Figure 2, except for the very early rounds,
16To perform the Wilcoxon rank-sum test, we constructed one observation per manager, which indicateshow often a manager invested the chip received from the investor in the risky project. The results of the testdo not change if we take into account all the intended investments of a manager and not just the rounds inwhich he/she actually received the chip from the investor (p = 0:0077 for all rounds and p = 0:182 for thelast 10 rounds).
13
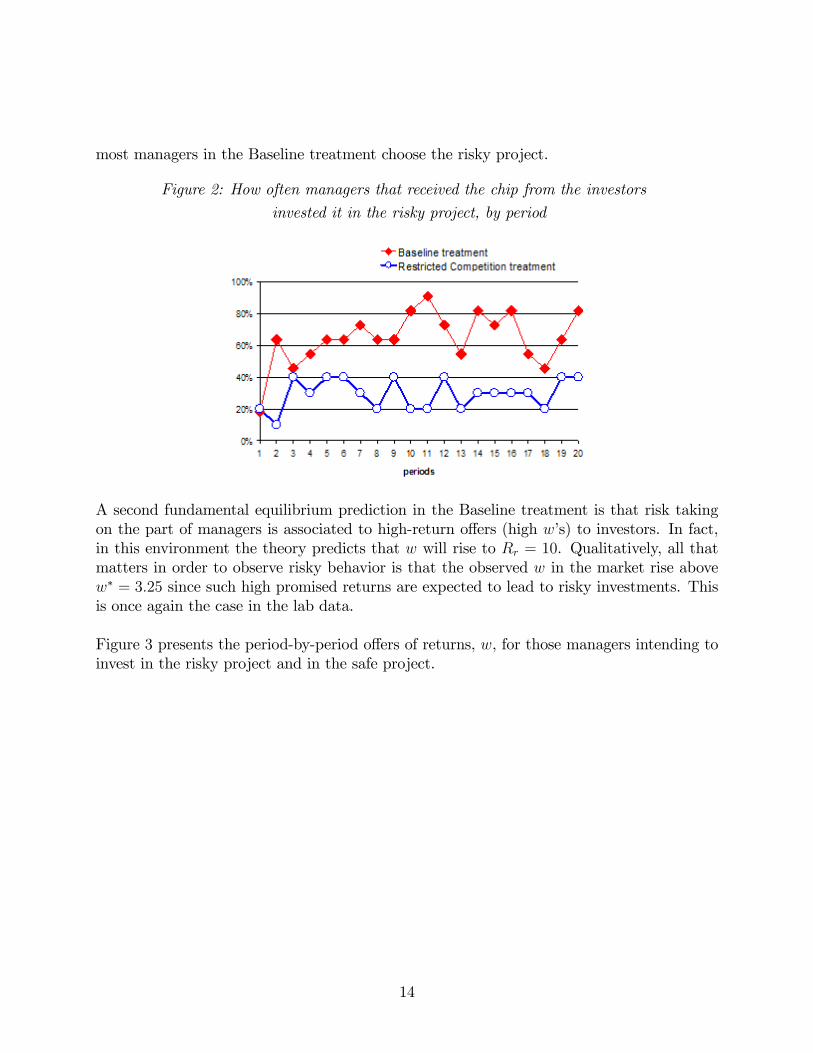
most managers in the Baseline treatment choose the risky project.
Figure 2: How often managers that received the chip from the investors
invested it in the risky project, by period
A second fundamental equilibrium prediction in the Baseline treatment is that risk takingon the part of managers is associated to high-return o¤ers (high w�s) to investors. In fact,in this environment the theory predicts that w will rise to Rr = 10. Qualitatively, all thatmatters in order to observe risky behavior is that the observed w in the market rise abovew� = 3:25 since such high promised returns are expected to lead to risky investments. Thisis once again the case in the lab data.
Figure 3 presents the period-by-period o¤ers of returns, w, for those managers intending toinvest in the risky project and in the safe project.
14

Figure 3: Period-by-period o¤ers of returns (w) in the Baseline treatment.
Note that managers promised consistently, on average, more than 3:25. In the �rst 5 periods,we observe only 6:4% (7 out of 105) of o¤ers w < 3:25. In the remaining 15 rounds thisnumber drops to less than 3%. Moreover, managers intending to invest in the risky projecto¤er on average higher returns than those intending to invest in the safe project: managersthat chose the risky project o¤er, on average, a return of 5:26 (5:43 in the last 10 rounds)and those that chose safe project o¤er, on average, 4:60 (4:84 in the last 10 rounds).
It should be clear from our discussion that while our subjects in the Baseline treatment didnot push the promised return up to their limit of 10, as predicted, they did consistently pushit above the threshold where risky behavior became rational. Of particular interest is thefact that for those managers intending to invest in the risky project, there seemed to be agreat resistance to o¤ering an w much above 7. Over all 20 rounds there are relatively fewsubjects who o¤ered a w higher than 7. Even amongst those managers who attracted thechip we observe rarely a w above 7 (6 out of 220 cases, less than 3%). This may be true fora number of reasons. For example, in the Baseline treatment there is a residual 30% to 35%of subjects who invested in the safe project. For those subjects promising more than 7 was alosing proposition and rarely done. Hence, a manager intending to invest in the risky projectmay have believed that it was not necessary to o¤er more than 7 since there was a goodchance that he would be facing a safe investor who he believed would never o¤er more than 7.
In summary, on a qualitative level we �nd that, as predicted, competition in the Base-line treatment greatly increases the fraction of funds invested in the risky project and leadconsistently to promised returns above w� = 3:25.
15

4.2 Do Transparency and Risk Sharing contracts lead to safe in-vestments?
From the equilibrium predictions of our theory we would expect that Transparency or RiskSharing contracts would eliminate risky investment. This would be the case for di¤erentreasons, however. In the case of Risk Sharing, since w = 0; the incentives of the managerand the investor are aligned. Since the safe project has a higher expected return, it isin the interest of the manager to invest in it so all funds should be invested in the safeproject. In the Transparency case it is competition that insures safe investment since theonly equilibrium is one where both �rms promise to invest safe and o¤er w = 7 and, at thatreturn, there exists no promised return that can induce the investor to want his chip investedin the risky project. As a result, we would expect less risky investment in the Risk Sharingand Transparency treatments than in the Baseline treatment.
Figure 4: How often the chip received from investors was invested in the risky project.
Figure 4 indicates that these expectations are substantiated by our data. As we can see,while subjects invested in the risky project 65% of the time over the 20 periods of the Baselinetreatment, the did so only 41% and 17% of the time in the Risk Sharing and Transparencytreatments respectively. The dramatic impact of transparency on the hedge fund contractis noteworthy since it indicates that investors in the experiment prefer to have their fundsinvested in the safe project and that the excessive risk taking in the Baseline treatmentmight be ascribed to investors inability to control how their funds are being invested.
Our Result 2 implies that if one manager proposes to invest in the safe project while the otherproposes to invest in the risky project, as long as the promised return on the risky projectis more than ps
prtimes the promised return on the safe project (1:8 in our parameterization),
the investor should prefer to invest his money in the risky project. Perhaps one of thereasons why we see so much investment in the safe project in the Transparency treatment is
16
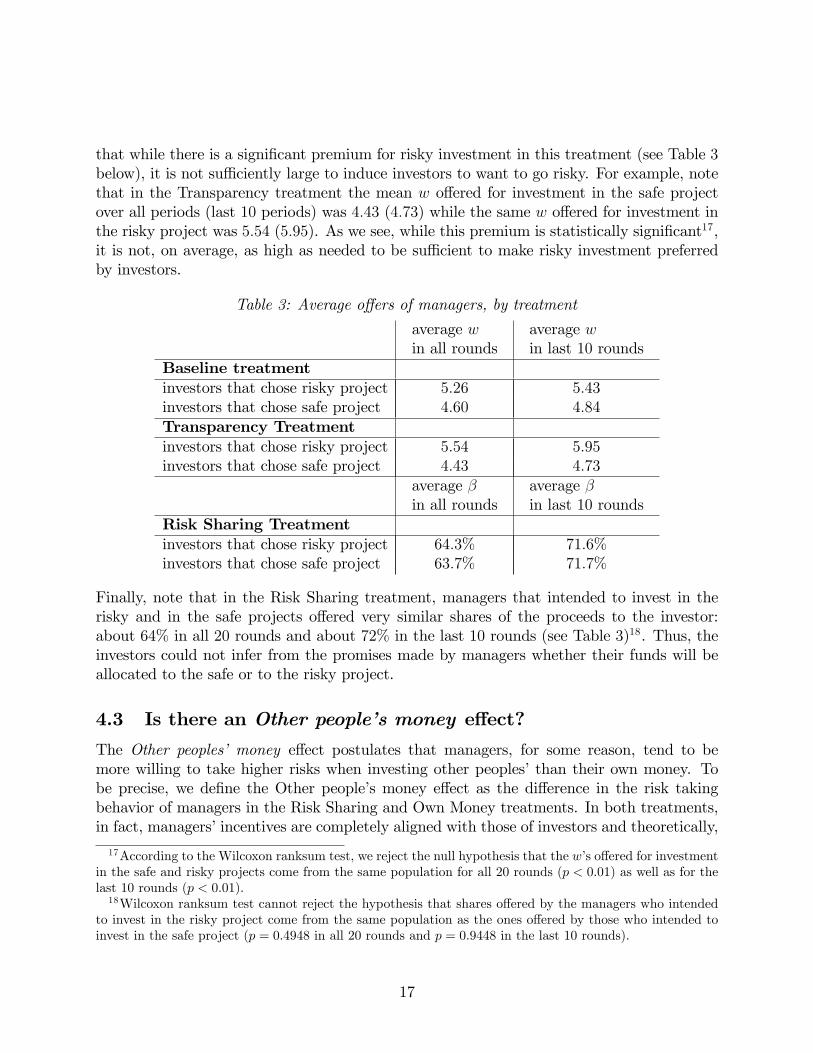
that while there is a signi�cant premium for risky investment in this treatment (see Table 3below), it is not su¢ ciently large to induce investors to want to go risky. For example, notethat in the Transparency treatment the mean w o¤ered for investment in the safe projectover all periods (last 10 periods) was 4:43 (4:73) while the same w o¤ered for investment inthe risky project was 5:54 (5:95). As we see, while this premium is statistically signi�cant17,it is not, on average, as high as needed to be su¢ cient to make risky investment preferredby investors.
Table 3: Average o¤ers of managers, by treatment
average win all rounds
average win last 10 rounds
Baseline treatmentinvestors that chose risky project 5:26 5:43investors that chose safe project 4:60 4:84Transparency Treatmentinvestors that chose risky project 5:54 5:95investors that chose safe project 4:43 4:73
average �in all rounds
average �in last 10 rounds
Risk Sharing Treatmentinvestors that chose risky project 64:3% 71:6%investors that chose safe project 63:7% 71:7%
Finally, note that in the Risk Sharing treatment, managers that intended to invest in therisky and in the safe projects o¤ered very similar shares of the proceeds to the investor:about 64% in all 20 rounds and about 72% in the last 10 rounds (see Table 3)18. Thus, theinvestors could not infer from the promises made by managers whether their funds will beallocated to the safe or to the risky project.
4.3 Is there an Other people�s money e¤ect?
The Other peoples� money e¤ect postulates that managers, for some reason, tend to bemore willing to take higher risks when investing other peoples�than their own money. Tobe precise, we de�ne the Other people�s money e¤ect as the di¤erence in the risk takingbehavior of managers in the Risk Sharing and Own Money treatments. In both treatments,in fact, managers�incentives are completely aligned with those of investors and theoretically,
17According to the Wilcoxon ranksum test, we reject the null hypothesis that the w�s o¤ered for investmentin the safe and risky projects come from the same population for all 20 rounds (p < 0:01) as well as for thelast 10 rounds (p < 0:01).18Wilcoxon ranksum test cannot reject the hypothesis that shares o¤ered by the managers who intended
to invest in the risky project come from the same population as the ones o¤ered by those who intended toinvest in the safe project (p = 0:4948 in all 20 rounds and p = 0:9448 in the last 10 rounds).
17
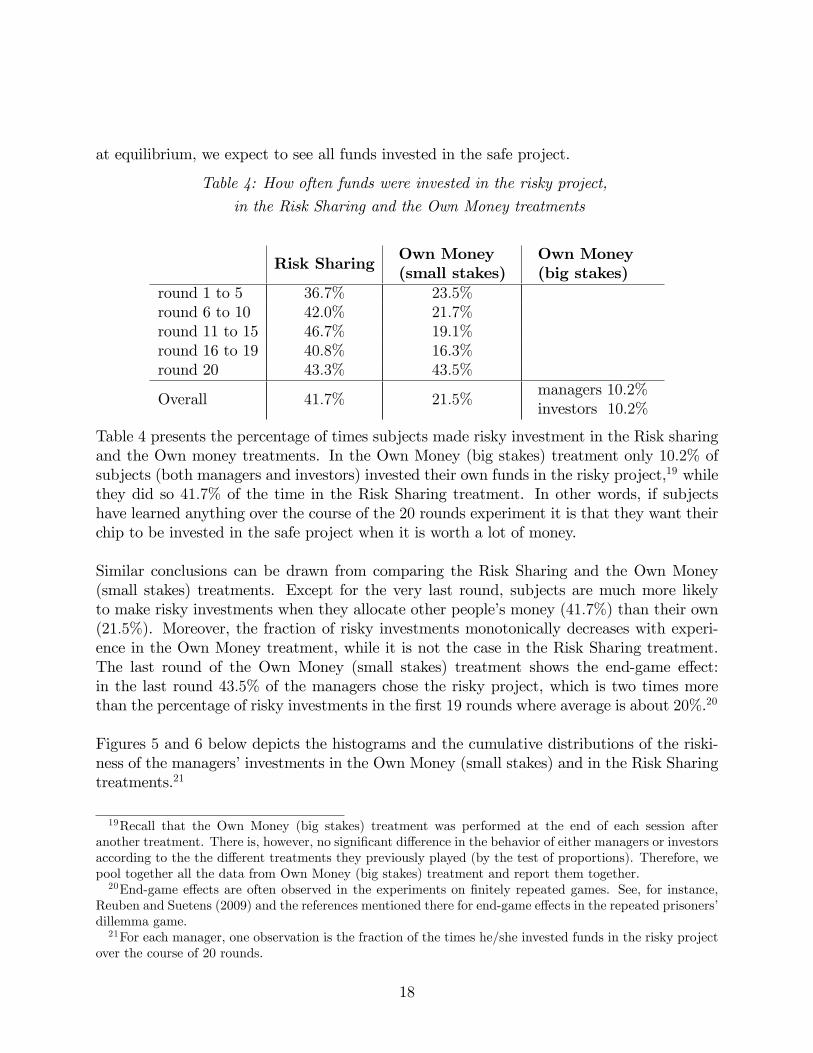
at equilibrium, we expect to see all funds invested in the safe project.
Table 4: How often funds were invested in the risky project,
in the Risk Sharing and the Own Money treatments
Risk SharingOwn Money(small stakes)
Own Money(big stakes)
round 1 to 5 36:7% 23:5%round 6 to 10 42:0% 21:7%round 11 to 15 46:7% 19:1%round 16 to 19 40:8% 16:3%round 20 43:3% 43:5%
Overall 41:7% 21:5%managers 10:2%investors 10:2%
Table 4 presents the percentage of times subjects made risky investment in the Risk sharingand the Own money treatments. In the Own Money (big stakes) treatment only 10:2% ofsubjects (both managers and investors) invested their own funds in the risky project,19 whilethey did so 41:7% of the time in the Risk Sharing treatment. In other words, if subjectshave learned anything over the course of the 20 rounds experiment it is that they want theirchip to be invested in the safe project when it is worth a lot of money.
Similar conclusions can be drawn from comparing the Risk Sharing and the Own Money(small stakes) treatments. Except for the very last round, subjects are much more likelyto make risky investments when they allocate other people�s money (41:7%) than their own(21:5%). Moreover, the fraction of risky investments monotonically decreases with experi-ence in the Own Money treatment, while it is not the case in the Risk Sharing treatment.The last round of the Own Money (small stakes) treatment shows the end-game e¤ect:in the last round 43:5% of the managers chose the risky project, which is two times morethan the percentage of risky investments in the �rst 19 rounds where average is about 20%.20
Figures 5 and 6 below depicts the histograms and the cumulative distributions of the riski-ness of the managers�investments in the Own Money (small stakes) and in the Risk Sharingtreatments.21
19Recall that the Own Money (big stakes) treatment was performed at the end of each session afteranother treatment. There is, however, no signi�cant di¤erence in the behavior of either managers or investorsaccording to the the di¤erent treatments they previously played (by the test of proportions). Therefore, wepool together all the data from Own Money (big stakes) treatment and report them together.20End-game e¤ects are often observed in the experiments on �nitely repeated games. See, for instance,
Reuben and Suetens (2009) and the references mentioned there for end-game e¤ects in the repeated prisoners�dillemma game.21For each manager, one observation is the fraction of the times he/she invested funds in the risky project
over the course of 20 rounds.
18
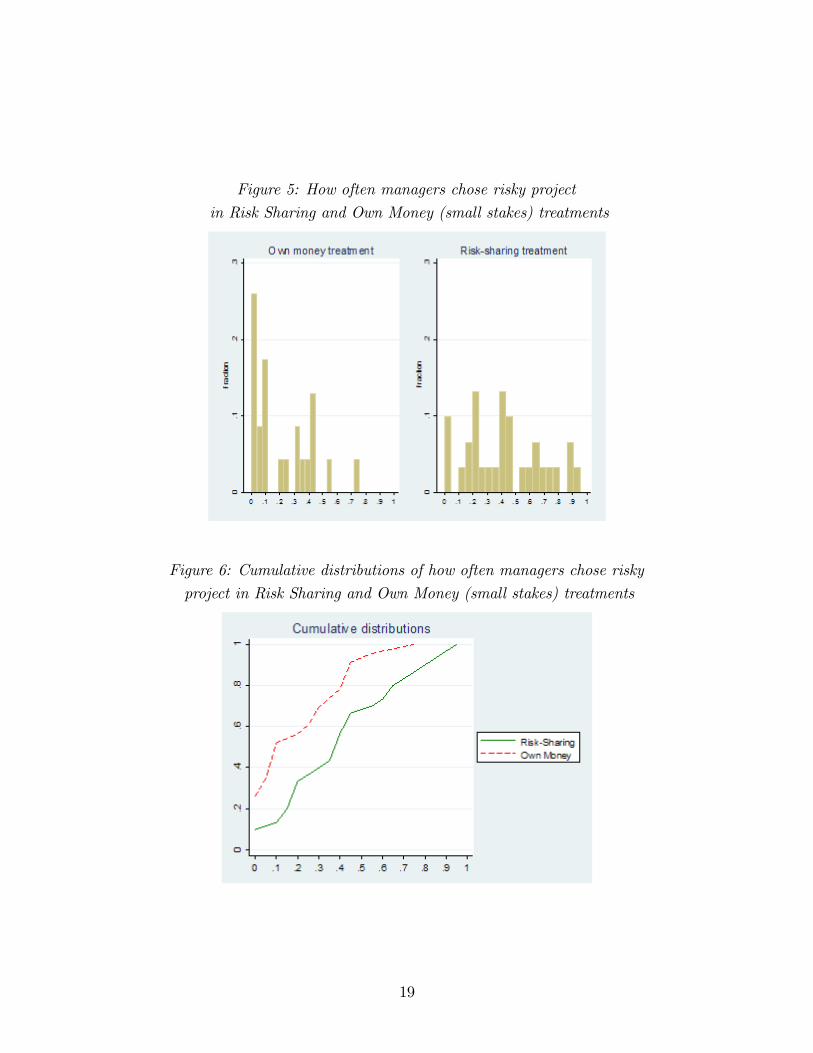
Figure 5: How often managers chose risky project
in Risk Sharing and Own Money (small stakes) treatments
Figure 6: Cumulative distributions of how often managers chose risky
project in Risk Sharing and Own Money (small stakes) treatments
19
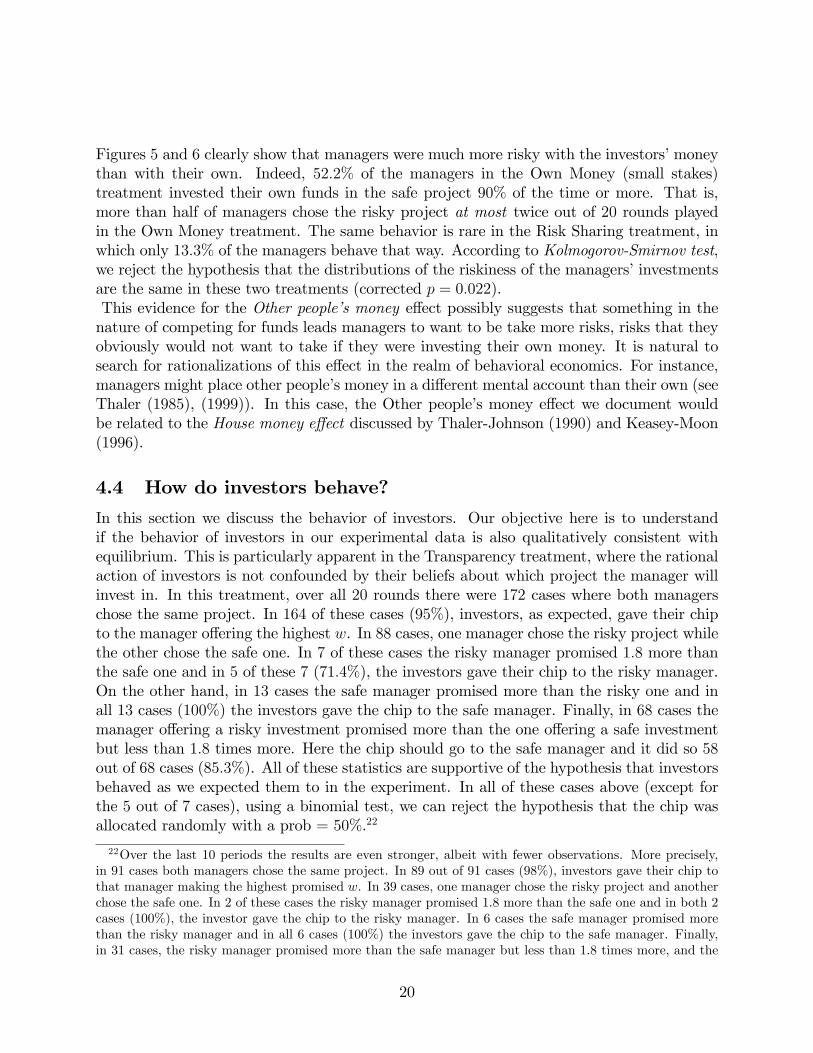
Figures 5 and 6 clearly show that managers were much more risky with the investors�moneythan with their own. Indeed, 52:2% of the managers in the Own Money (small stakes)treatment invested their own funds in the safe project 90% of the time or more. That is,more than half of managers chose the risky project at most twice out of 20 rounds playedin the Own Money treatment. The same behavior is rare in the Risk Sharing treatment, inwhich only 13:3% of the managers behave that way. According to Kolmogorov-Smirnov test,we reject the hypothesis that the distributions of the riskiness of the managers�investmentsare the same in these two treatments (corrected p = 0:022).This evidence for the Other people�s money e¤ect possibly suggests that something in thenature of competing for funds leads managers to want to be take more risks, risks that theyobviously would not want to take if they were investing their own money. It is natural tosearch for rationalizations of this e¤ect in the realm of behavioral economics. For instance,managers might place other people�s money in a di¤erent mental account than their own (seeThaler (1985), (1999)). In this case, the Other people�s money e¤ect we document wouldbe related to the House money e¤ect discussed by Thaler-Johnson (1990) and Keasey-Moon(1996).
4.4 How do investors behave?
In this section we discuss the behavior of investors. Our objective here is to understandif the behavior of investors in our experimental data is also qualitatively consistent withequilibrium. This is particularly apparent in the Transparency treatment, where the rationalaction of investors is not confounded by their beliefs about which project the manager willinvest in. In this treatment, over all 20 rounds there were 172 cases where both managerschose the same project. In 164 of these cases (95%), investors, as expected, gave their chipto the manager o¤ering the highest w. In 88 cases, one manager chose the risky project whilethe other chose the safe one. In 7 of these cases the risky manager promised 1:8 more thanthe safe one and in 5 of these 7 (71:4%), the investors gave their chip to the risky manager.On the other hand, in 13 cases the safe manager promised more than the risky one and inall 13 cases (100%) the investors gave the chip to the safe manager. Finally, in 68 cases themanager o¤ering a risky investment promised more than the one o¤ering a safe investmentbut less than 1:8 times more. Here the chip should go to the safe manager and it did so 58out of 68 cases (85:3%). All of these statistics are supportive of the hypothesis that investorsbehaved as we expected them to in the experiment. In all of these cases above (except forthe 5 out of 7 cases), using a binomial test, we can reject the hypothesis that the chip wasallocated randomly with a prob = 50%.22
22Over the last 10 periods the results are even stronger, albeit with fewer observations. More precisely,in 91 cases both managers chose the same project. In 89 out of 91 cases (98%), investors gave their chip tothat manager making the highest promised w. In 39 cases, one manager chose the risky project and anotherchose the safe one. In 2 of these cases the risky manager promised 1:8 more than the safe one and in both 2cases (100%), the investor gave the chip to the risky manager. In 6 cases the safe manager promised morethan the risky manager and in all 6 cases (100%) the investors gave the chip to the safe manager. Finally,in 31 cases, the risky manager promised more than the safe manager but less than 1:8 times more, and the
20

5 Conclusions
This paper has investigated the impact of competition on the risk taking behavior of labora-tory hedge fund managers who operate under the standard hedge fund option-like compen-sation contracts. We �nd that the competition for funds does indeed lead to an equilibriumwhere funds are invested in an ine¢ cient risky manner. This problem can be mitigated byeither changing the contract type, restricting the watermark used in the hedge fund contractor by forcing managers to reveal the projects in which funds will be invested. While theseinterventions are successful to a limited degree, they fail to completely eliminate the riskybehavior of managers due to their documented inclination to invest the money of others inriskier assets than their own.
References
[1] Agarval, Vikas, Naveen D. Daniel, and Narayan Y. Naik, 2008. "Role of managerial In-centives and Discretion in Hedge Fund Performance, forthcoming in Journal of Finance.
[2] Amin, Gaurav S. and Harry M. Kat, 2002. "Welcome to the Dark Side: Hedge FundAttrition and Survivorship Bias Over the Period 1994-2001," ISMA Centre DiscussionPapers In Finance 2002-02.
[3] Brennan, Geo¤rey, Luis Gonzales, Werner Guth, and M. Vittoria Levati, 2008. "Atti-tudes toward Private and Collective Risk in Individual and Strategic Choice Situations,"Journal of Economic Behavior and Organization, 67, 253-62.
[4] Brown, Stephen J. and William N. Goetzmann, 2001. "Hedge Funds with Style," YaleInternational Center for Finance, Working Paper No. 0029.
[5] Brown, Stephen J., William N. Goetzmann, and James Park, 2001."Careers and Sur-vival: Competition and Risk in the Hedge Fund and CTA Industry," Journal of Finance,56(5), 1869-86.
[6] Carpenter, Jennifer, 2000. "Does Option Compensation Increase managerial Risk Ap-petite?, Journal of Finance, 55(5), 2311-31.
[7] Chakravarty, Sunjoy, Glenn W. Harrison, Ernan E. Haruvy, and E. Elisabet Rutstrom,2010. "Are You Risk Averse Over Other People�s Money?" mimeo.
[8] Edwards, Franklin R. and Mustafa O. Caglayan, 2001. "Hedge Fund Performance andmanager Skill," mimeo, Graduate School of Business, Columbia University.
chip went to the safe manager in 27 out of 31 cases (87:1%). Again, all of these facts are supportive of thehypothesis that investors behaved in a rational manner in our experiment.
21

[9] Foster, Dean P. and H. Peyton Young, 2008. "The Hedge Fund Game: Incentives,Excess Returns, and Piggy-Backing," Economic Series Working Papers 378, Universityof Oxford.
[10] Fung, William and David A. Hsieh, 1999. "A Primer on Hedge Funds," Journal ofEmpirical Finance, 6, 309-31.
[11] Goetzmann, William N., Jonathan Ingersoll Jr., and Stephen A. Ross, 2003. "HighWater Marks and Hedge Fund Management Contracts," Journal of Finance, 58(4),1685-718.
[12] Inechen, Alexander and Kurt Silberstein, 2008. "Aima�s Roadmap to Hedge Funds,"The Alternative Investment Management Association Limited.
[13] Jackwerth, Jens C. and James E. Hodder, 2006. "Incentive Contracts and Hedge FundManagement," MPRA Paper No 11632.
[14] Liang, Bing, 200. "Hedge Funds: The Living and the Dead," Journal of Finance andQuantitative Analysis, 35(3), 309-26.
[15] Malkiel, Burton G. and Atanu Saha, 2005. "Hedge Funds: Risk and Return," FinancialAnalysist Journal, 61(6), 80-8.
[16] Matutes, Carmen and Xavier Vives, (2000). "Imperfect Competition, Risk Taking, andRegulation in Banking," European Economic Review, 44, 1-34.
[17] Merlo, Antonio and Schotter, Andrew, 1999. "A Surprise-Quiz View of Learning inEconomic Experiments," Games and Economic Behavior, 28(1), 25-54.
[18] Panageas, Stavros and Mark M. Wester�eld, 2009. "High-Water Marks: High RiskAppetites? Convex Compensation, Long Horizons, and Portfolio Choice," Journal ofFinance, 64(1), 1-36.
[19] Reuben, Ernesto and Sigrid Suetens, 2009. "Revisiting Strategic versus Non-StrategicCooperation," CentER discussion paper 2009-22.
[20] Thaler, Richard H., 1985. "Mental Accounting and Consumer Choice," Marketing Sci-ence, 4(3), 199-214.
[21] Thaler, Richard H., 1999. "Mental Accounting Matters," Journal of Behavioral DecisionMaking, 12, 183-206.
[22] Thaler, Richard H. and Eric J. Johnson, 1990. "Gambling with the House Money andTrying to Break Even: The E¤ects of Prior Outcomes on Risky Choices," ManagementScience, 36(6), 643-660.
22
6 Appendix 1: A Note on Hedge Fund Contracts
As we described in Section 2, a typical hedge fund contract speci�es a pair (w; �) whichrepresents a watermark w and a share � of pro�ts above watermark that managers keeps forhimself. We will show below that,if � � �� > 023 there exists an equilibrium in which all the funds are invested in the risky
project.
We will show that we can sustain an equilibrium in which both managers propose contractwith w = Rr, � 2 [��; 1] and invest in the risky project.
First, similarly to the Result 1, if w > w� then a manager will prefer to invest in the riskyproject because
�managerw;�;safe < �managerw;�;risky , ps�(Rs � w) < pr�(Rr � w)
, w > w� =psRs � prRrps � pr
Thus, when an investor gives his funds to a manager that promised w = Rr, his funds willbe invested in the risky project.
To sustain the equilibrium proposed above, the only deviation that we need to rule out is theone in which one of the managers proposes w = w� and �0 2 [��; 1]. If this proposal attractsthe investor, then it is clearly bene�cial for the manager because it gives him/her positiveexpected pro�ts, as opposed to the zero pro�ts which is what he/she earns following strategyw = Rr and � 2 [��; 1]. However, this deviation will attract the investor only if �investorw=Rr ,� <�investorw=w�,�0. Thus, to rule out this deviation we need to make sure that �
investorw=Rr ,� � �investorw=w�,�0.
But:
pr �Rr � ps � [w� + (1� �0)(Rs � w�)], �0 � �� = psRs � prRrps(Rs � w�)
Thus if �� < �� then for any �0 2 [��; 1], there exists an equilibrium in which all the fundsreceived from an investor are allocated to the risky project.We interpret therefore the assumption that � = 1, which we adopted in the paper, as a
simpli�cation of the analysis.
7 Appendix 2: Instructions for the Baseline Treatment
This is an experiment in decision-making. If you follow the instructions and make gooddecisions, you can earn a substantial amount of money, which will be paid to you at the endof the session. The currency in this experiment is called tokens. All payo¤s are denominated
23In fact, in the hedge fund markets, managers typically keep 15�25% of returns exceeding the watermarks.Thus, we will focus on the situation in which this share � is bounded away from zero.
23
in this currency. The experiment consists of 20 identical decision rounds. At the end ofthe experiment, we will sum up the tokens you earned in all 20 rounds and this amount willbe converted into US dollars using a conversion rate of 10 tokens = $1. In addition, you willreceive a participation fee.
Before the beginning of the experiment you will be randomly assigned roles: 23of the par-
ticipants will be assigned a role of investors and 13of participants will be assigned a role of
lenders. The role of an investor will be to invest an "investment chip" if one given to himby the lender, while the role of the lender will be to decide whom to given his investmentchip to. Roles stay �xed until the end of the experiment. That is, if at the beginning of theexperiment you were assigned the role of an investor (lender) you will keep this role for all20 rounds.
In each round, participants will be randomly matched into the groups of 3 people. Each groupconsists of two investors and one lender. Once the round is over, you will be re-matchedwith other participants for the next round. However, there will always be two investors andone lender in every group. The investors will receive a participation fee of $10 and lenderswill receive a participation fee of $5.
Decision of the investors in each period.
Each period starts with the lender being given one chip which he/she will lend to one ofthe investors in their group. This chip has no value other than providing the right to geta return if it is invested, i.e. it cannot be converted to tokens. Investors are the ones whodecide how a chip received from the lender is invested and how many tokens the lender willreceive if the investment is successful.
There are two investment projects: Project 1 and Project 2, which di¤er in the returns andthe probability of defaulting:
� Project 1 pays back 10 tokens with probability 50% and 0 tokens with probability50%.
� Project 2 pays back 7 tokens with probability 90% and 0 tokens with probability10%.
In other words, Project 1 has a return of 10 tokens and 50% probability of defaulting.Project 2 has return of 7 tokens and 10% probability of defaulting.
Each period starts with the investors making two decisions. First, each Investor chooseshow many tokens he is willing to pay to the lender that lends him his/her chip in case theinvestment is successful. Second, each investor chooses a Project in which the chip receivedfrom the lender will be invested. The number of tokens that the investor can pay the lender
24

for a chip can be any number between 0 and 10 tokens with one digit after decimal, i.e.numbers like 3:2, 4:6, 5:9, 8:6 etc... This number represents how many tokens an investorwill pay the lender that lends him his/her chip in case the project in which this chip wasinvested was successful. If the project in which the chip was invested defaulted, then boththe investor and the lender get zero tokens. Each investor makes his/her choice withoutknowing what the other investor from his group chose.
Decision of lenders in each period.
After both investors make their choices, the lender observes how many tokens each investorpromises to pay to the lender that gives him his chip. The lender�s task is to choose whichinvestor he/she is willing to lend his chip to. Notice that lenders do not observe whichproject the investor chose to invest in (project 1 or 2); they observe only the promises of theinvestors in their own group. The screen for the lenders will look like this
Investor A promised to pay back x tokens
Investor B promised to pay back y tokens
It is important to note that in each round, the lender is matched with di¤erent investors.Therefore, it is impossible to track the same investor between periods. For instance, aninvestor who appears as Investor A in one round is not the same person as investor whoappears as Investor A in the next round.
How the pro�ts of the investors and the lender are determined.
In any period, an investor that did not receive a chip from the lender will receive zero tokensin that period.
If the investor who did receive a chip and promised to pay back x tokens, then
� if the project in which the chip was invested defaulted, both the investor and the lenderget 0 tokens in that period
� if the chip was invested in Project 1 and did not default, then the investor gets 10� xtokens in that period and the lender gets x tokens as promised.
� if the chip was invested in Project 2, did not default and x � 7, then the investor gets7� x tokens in that period and the lender gets x tokens as promised.
� if the chip was invested in Project 2, did not default and x > 7, then the investor gets0 tokens in that period and the lender gets 7, which is less than what investor promisedto him.
25

Quiz.
Question 1
Say an investor that received a chip from the lender promised to pay back 7:3 tokens, in-vested this chip in Project 1 and Project 1 did not default. What is the pro�t of the lenderin this period? What is the pro�t of the investor that received the chip in this period? Whatis the pro�t of the other investor from the same group? What is the pro�t is each subjectin a group if Project 1 defaulted?
Question 2
Say investor that received the chip from the lender promised to pay him back 4:9 tokens,invested this chip in Project 2, which did not default. What is the pro�t of the lender inthis period? What is the pro�t of the investor that received the chip? What is the pro�t ofthe other investor from the same group?
Investor�s feedback.
At the end of each period investors observe the following information: how many tokenshe/she promised to pay back to a lender that lends him/her chip; how many tokens theother investor promised to pay back to lender; whether or not the investor received the chipfrom the lender; in case the investor received the chip from the lender, which project wasthe chip invested in and whether the project was successful or not; whether the investor wasable to repay the lender what he promised and pro�ts of the investor in tokens. You will notbe told what project the other investor decided to invest in.
Lender�s feedback.
At the end of each period the lender observes the following information: how many tokenseach investor promised to repay to a lender that gives him his chip; which investor he/shechose to lend the chip to and whether this investor was able to repay the promised return ornot. The lenders are also informed about how many tokens they received in this period.
To summarize:
� At the beginning of the experiment, subjects are assigned roles of investors and lenders,which they keep for the whole duration of the experiment.
� In each period subjects are divided into the groups of 3 people: two investors and onelender.
� Each period starts with the decision of investors as to how many tokens they promise
26

to repay to a lender that gives him/her an investment chip and which project, 1 or 2,the chip received from the lender will be invested in.
� The lenders observe the promised returns and choose one investor in their group tolend chip to
� The chip received by an investor is then invested in the project of his/her choice asdetermined at the beginning of the period
� Payo¤s are realized and all lenders and investors observe how many tokens they receivein this period
� At the end of the experiment all tokens earned in these 20 periods will be summed upand their sum converted to US dollars at a rate of 10 tokens = $1. In addition, youwill receive a participation fee.
Last part of the experiment.
In this part of the experiment we will ask you all to act as an investor for one period andmake one investment decision with an investment chip which we will give you. Please choosewhether you want to invest in Project 1 or Project 2:
� Project 1 pays back 10 tokens with probability 50% and 0 tokens with probability 50%
� Project 2 pays back 7 tokens with probability 90% and 0 tokens with probability 10%
After you made your decision, we will roll a 10-sided dice to determine whether the projectyou invested in defaulted or paid back. If you invested in Project 1 and dice lands on 0, 1,2, 3 or 4 then Project 1 defaults and you get 0 tokens. If it lands on any number strictlyabove 4 (that is, 5, 6, 7, 8 or 9) then you get 10 tokens. If you invested in Project 2 and dicelands on 0 then Project 2 defaults and you get 0 tokens. If it lands on any other number (1,2, 3, 4, 5, 6, 7, 8 or 9) then you will get 7 tokens.
Amount of tokens you earn in this part will be converted into US dollars, using the conversionrate 1 token = $1, and added to your total payment.
Please circle the Project in which you want to invest your investment chip:
Project 1 Project 2
27