Embed Size (px)
Citation preview
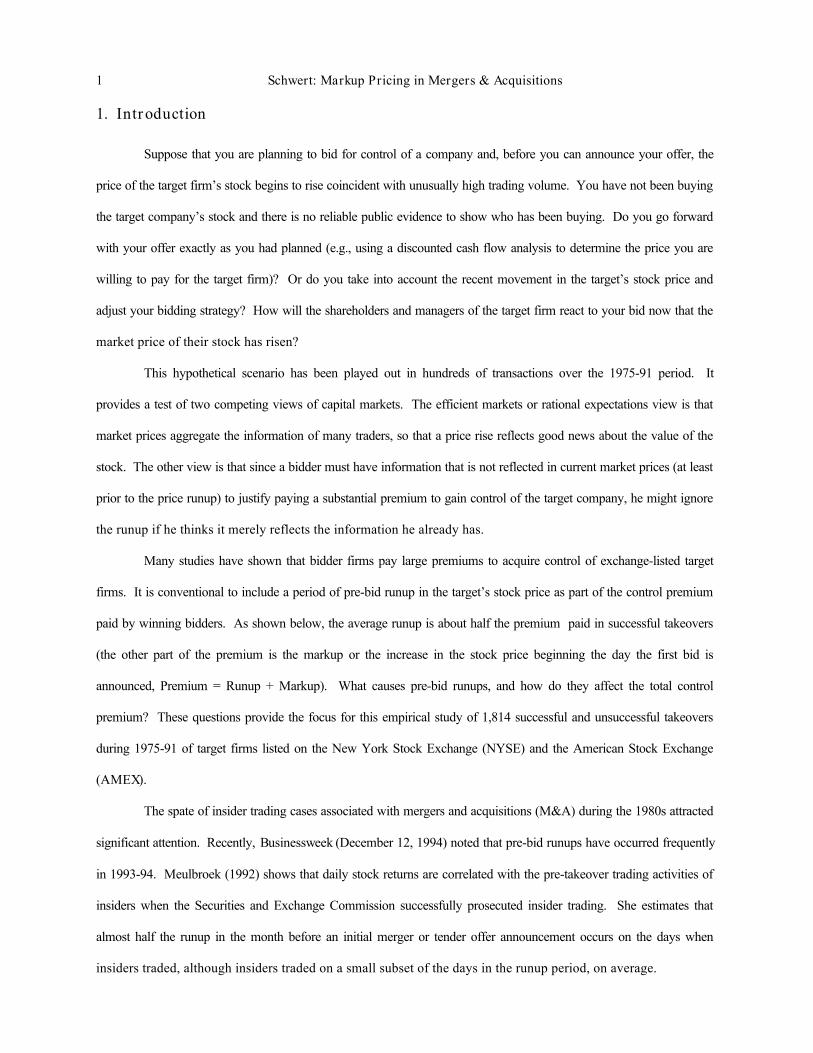
Markup Pricing in Mergers and Acquisitions
G. William Schwert*
William E. Simon Graduate School of Business AdministrationUniversity of Rochester, Rochester, NY 14627, USA
National Bureau of Economic Research, Cambridge, MA 02138, USA
Abstract
This paper studies the relation between the premiums in takeover bids involving exchange-listed target firmsfrom 1975-91 and the pre-announcement stock price runups. The evidence shows that the pre-bid runup and the post-announcement increase in the target’s stock price (the Amarkup@) are generally uncorrelated. With little substitutionbetween the runup and the markup, the runup is an added cost to the bidder. This finding has important implications forassessing the costs of insider trading. It also raises interesting questions about the role of information from publiccapital markets in private takeover negotiations.
Key words: Auctions, Insider trading, Takeovers, Premiums
JEL Classifications: G14, G34, G38
The Bradley Policy Research Center, William E. Simon Graduate School of Business Administration,University of Rochester, provided support for this research. I received helpful comments from Yacine A Vt-Sahalia,Michael Barclay, Michael Bradley, Jim Brickley, Linda DeAngelo, Ken French, David Hirshleifer, Michael Jensen,Eugene Kandel, Steven Kaplan, Lisa Meulbroek, Richard Ruback, Ralph Walkling, Jerold Zimmerman, and from ananonymous referee. I also benefited from the comments of participants at the 1994 American Finance Associationmeetings, the 1994 Harvard Finance and Control Conference, and seminars at the Universities of Chicago, Michigan,Ohio State, Rochester, and Virginia Tech. Discussions with Brad Cornell, Dan Fischel, Gregg Jarrell, and MarkWolfson were also helpful. This paper is part of the NBER =s research program in Asset Pricing. Any opinionsexpressed are those of the author and not those of the National Bureau of Economic Research.
1996 G. William Schwert. All rights reserved.
1 Schwert: Markup Pricing in Mergers & Acquisitions
1. Introduction
Suppose that you are planning to bid for control of a company and, before you can announce your offer, the
price of the target firm’s stock begins to rise coincident with unusually high trading volume. You have not been buying
the target company’s stock and there is no reliable public evidence to show who has been buying. Do you go forward
with your offer exactly as you had planned (e.g., using a discounted cash flow analysis to determine the price you are
willing to pay for the target firm)? Or do you take into account the recent movement in the target’s stock price and
adjust your bidding strategy? How will the shareholders and managers of the target firm react to your bid now that the
market price of their stock has risen?
This hypothetical scenario has been played out in hundreds of transactions over the 1975-91 period. It
provides a test of two competing views of capital markets. The efficient markets or rational expectations view is that
market prices aggregate the information of many traders, so that a price rise reflects good news about the value of the
stock. The other view is that since a bidder must have information that is not reflected in current market prices (at least
prior to the price runup) to justify paying a substantial premium to gain control of the target company, he might ignore
the runup if he thinks it merely reflects the information he already has.
Many studies have shown that bidder firms pay large premiums to acquire control of exchange-listed target
firms. It is conventional to include a period of pre-bid runup in the target’s stock price as part of the control premium
paid by winning bidders. As shown below, the average runup is about half the premium paid in successful takeovers
(the other part of the premium is the markup or the increase in the stock price beginning the day the first bid is
announced, Premium = Runup + Markup). What causes pre-bid runups, and how do they affect the total control
premium? These questions provide the focus for this empirical study of 1,814 successful and unsuccessful takeovers
during 1975-91 of target firms listed on the New York Stock Exchange (NYSE) and the American Stock Exchange
(AMEX).
The spate of insider trading cases associated with mergers and acquisitions (M&A) during the 1980s attracted
significant attention. Recently, Businessweek (December 12, 1994) noted that pre-bid runups have occurred frequently
in 1993-94. Meulbroek (1992) shows that daily stock returns are correlated with the pre-takeover trading activities of
insiders when the Securities and Exchange Commission successfully prosecuted insider trading. She estimates that
almost half the runup in the month before an initial merger or tender offer announcement occurs on the days when
insiders traded, although insiders traded on a small subset of the days in the runup period, on average.

2 Schwert: Markup Pricing in Mergers & Acquisitions
Jarrell and Poulsen (1989) study 172 successful cash tender offers in the 1981-85 period. They conclude that
there are several sources of legitimate information available to market participants that allow investors to anticipate
takeover announcements, including announcements of 13D filings when investors acquire more than 5% of the target
firm’s stock. They find weak evidence that pre-bid runups substitute for post-bid markups in their sample, so that
premiums are higher when runups are large.
The question of whether insider trading damages bidders by raising the price paid to acquire a target firm has
been highly contentious. There are many lawsuits against investment banks and others who might have leaked private
information that led to insider trading. For example, Anheuser-Busch sued Paul Thayer and A. G. Edwards because it
felt that leaks of information by Thayer (a director of Anheuser-Busch) caused it to pay too much in acquiring Campbell
Taggart in 1982.1 Litton sued Lehman Brothers because insider trading by Dennis Levine allegedly caused Litton to pay
too much when it acquired Itek in 1983. 2 Maxus sued Kidder Peabody, Ivan Boesky, and Martin Siegel because the
price it paid to acquire Natomas in 1983 was allegedly inflated by Boesky’s insider trading. 3 FMC Corporation sued
Goldman Sachs, Boesky, and others because the price it paid stockholders in its 1986 recapitalization plan was allegedly
inflated by the insider trading activities of Boesky.4
The tests below show little evidence of substitution between pre-bid runups and post-bid markups, so that
control premiums paid to acquire target firms are higher, all else equal, when there has been a large runup in the target’s
stock price before the first bid is announced. To the extent that insider trading causes the pre-bid runup, and the bidder
and target firms cannot detect the cause of the runup, the bidder will pay more for the target firm.
This paper examines the theoretical and empirical relations between pre-bid runups and post-bid markups
conditional on various types of information that were available in the market prior to merger or tender offer bids from
1975-91. Section 2 reviews the literature on auctions and develops the hypotheses to be tested. Section 3 describes the
sample of mergers and acquisitions used in the tests. Section 4 analyzes several regression tests that relate pre-bid
runups to post-bid markups. Section 5 analyzes alternate specifications for some statistical tests. Section 6 contains
concluding remarks.
1 Anheuser-Busch Cos. v. Paul Thayer, et al. , No. CA3-85-0794-R (N.D. Tex. 1988). See Cornell and Sirri (1992) for an
analysis of this case.2 Litton Industries v. Lehman Brothers Kuhn Loeb, No. 86-6447 (S.D.N.Y. 1990).
3 Maxus v. Kidder Peabody, et al., No. 87-15583-M (298 D. Tex. 1987).
3 Schwert: Markup Pricing in Mergers & Acquisitions
2. Auctions, private information, and insider trading
To understand the effects of pre-bid runups on M&A negotiations, it is useful to think of the timeline of events
shown in fig. 1.
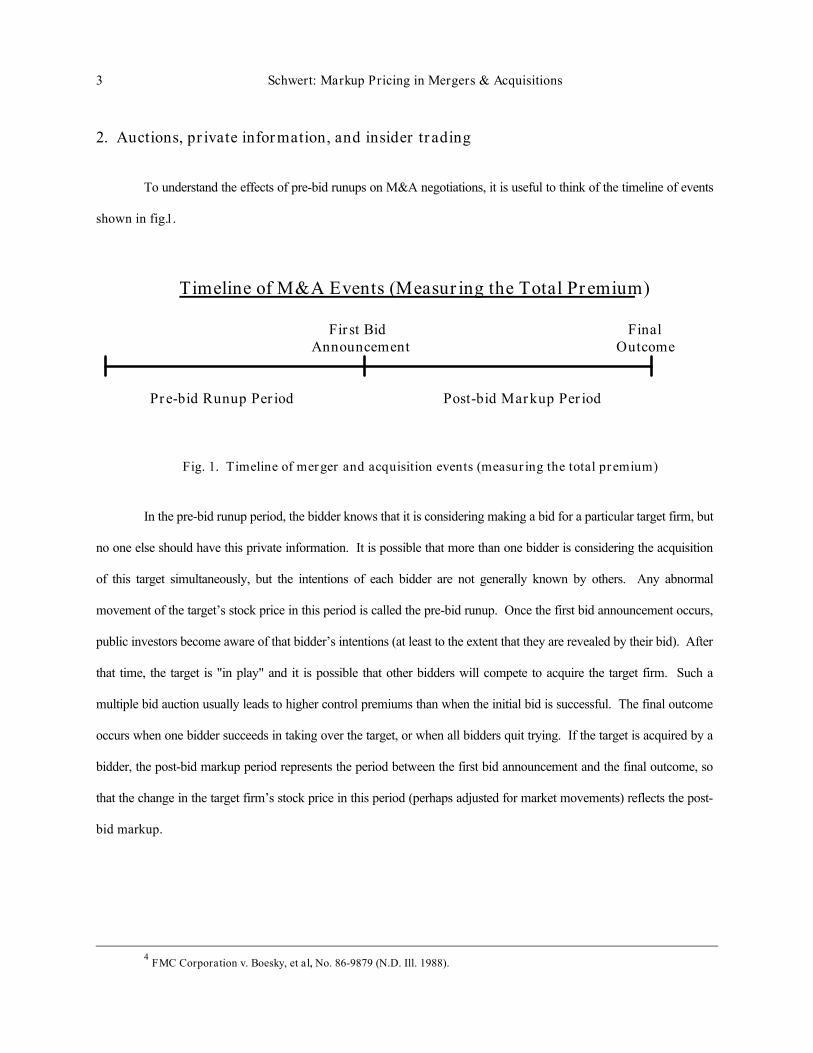
Timeline of M&A Events (Measuring the Total Premium)
First Bid FinalAnnouncement Outcome
Pre-bid Runup Period Post-bid Markup Period
Fig. 1. Timeline of merger and acquisition events (measuring the total premium)
In the pre-bid runup period, the bidder knows that it is considering making a bid for a particular target firm, but
no one else should have this private information. It is possible that more than one bidder is considering the acquisition
of this target simultaneously, but the intentions of each bidder are not generally known by others. Any abnormal
movement of the target’s stock price in this period is called the pre-bid runup. Once the first bid announcement occurs,
public investors become aware of that bidder’s intentions (at least to the extent that they are revealed by their bid). After
that time, the target is "in play" and it is possible that other bidders will compete to acquire the target firm. Such a
multiple bid auction usually leads to higher control premiums than when the initial bid is successful. The final outcome
occurs when one bidder succeeds in taking over the target, or when all bidders quit trying. If the target is acquired by a
bidder, the post-bid markup period represents the period between the first bid announcement and the final outcome, so
that the change in the target firm’s stock price in this period (perhaps adjusted for market movements) reflects the post-
bid markup.
4 FMC Corporation v. Boesky, et al., No. 86-9879 (N.D. Ill. 1988).
4 Schwert: Markup Pricing in Mergers & Acquisitions
2.1. Competitive bidding strategies
There are at least two competing hypotheses about the effects of early revelation of information in a merger or
tender offer situation. If the bidder and target (managers and stockholders) are in a two-party bargaining situation,
negotiation will lead to a consummated deal if the reservation price of the target is below the valuation of the target by
the bidder. These valuations by the bidder and the target depend on the information each party has at the time of the
negotiation. To the extent that both parties have more information than is reflected in the open market price for the
target firm’s stock (and they think that there are no other traders with valuable private information), both the bidder and
the target will ignore stock price movements that occur prior to and during the negotiation in setting the final deal price.
As a result, the post-bid markup (measured from the announcement date through the time when all uncertainty about the
consummation of the deal has been resolved) will be lower by the amount of the pre-bid runup. This is the substitution
hypothesis -- each dollar of pre-bid runup offsets the post-bid markup one-for-one.
On the other hand, if the bidder or the target is uncertain about whether movements in the market price of the
target’s shares reflect valuable private information of other traders, runups during the negotiations could well cause both
the bidder and the target to revise their valuations of the target’s stock. For example, if the negotiating parties suspect
that another bidder might be acquiring target shares in the open market, both the bidder and the target (management and
stockholders) will probably revise their valuations of the target stock upwards. Walkling and Edmister (1985), Bradley,
Desai, and Kim (1988), and Comment and Schwert (1995) show that the premiums paid in contested M&A transactions
(auctions) are significantly higher than when multiple bidders do not appear. The final deal price increases because of
the pre-bid runup. If the markup is unaffected, each dollar of pre-bid runup is added into the final deal price one-for-
one. This is the markup pricing hypothesis.
The markup pricing hypothesis reflects rational behavior of bidders and targets when they have incomplete
information. Another explanation for a lack of substitution between the runup and the markup is based on irrational
behavior by bidders. Roll (1986) calls this the "hubris hypothesis," with bidders interested in winning a takeover contest
irrespective of cost. One way to distinguish between the markup pricing and hubris hypotheses is to study the stock
returns to the bidder firm. If the bidder firm offers too much for the target firm, given the information available to the
stock market at the time of the bid, the bidder’s stock price should drop.

5 Schwert: Markup Pricing in Mergers & Acquisitions
2.2. Relation to the literature on auctions
An analogy to conventional open outcry English auctions is apt. 5 If the item being auctioned is marketable, as
with the common stock of a publicly traded target firm, part of the value any bidder would place on the item is based on
its potential resale value (this is called a common value auction). Of course, every bidder might also have unique
reasons for wanting to own a particular item, and this valuation might be larger than the resale value (this is called a
private value auction). In general, an auction will reflect a mixture of common and private values (this is called a
correlated values auction). The typical situation in which competing bidders can observe the bids of others causes
complicated interactions among bidders’ strategies. To the extent that another bidder might have better information
about the resale value of the target firm, his bid should alter the perceptions of competing bidders about resale value. In
effect, each bidder learns by observing the current market price. This is the spirit of the self-fulfilling rational
expectations (efficient markets) models of asset prices developed by Grossman (1976, 1977).
The presence of people who trade on the information of either the bidder or the target without the knowledge of
the negotiating parties is like having a shill in the audience at an open outcry auction. Based on unusual price and
volume behavior in the secondary market for the target’s stock, the bidder and target might falsely conclude that a
legitimate competing bidder exists, and hence revise their valuations upward. Of course, if participants know the
probability that shills (insider trading) will affect the auction process, they will adjust their behavior to avoid overpaying.
This is one reason that shills (people with inside information) have incentives to disguise their behavior.6
2.3. Relation to the efficient markets literature
The semi-strong form of the efficient markets hypothesis posits that the market price of common stock reflects
all publicly available information [Fama (1970)]. Private information, such as the intention to bid for control of a target
firm, is not generally reflected in the market price of the target stock until an event occurs that causes many traders to
infer that private information. An example of such an event would be pre-bid purchases of the target’s stock by the
bidder to establish a "toehold" position, which would lead to the filing of a 13D statement with the Securities and
5 See section X of McAfee and McMillan (1987) for a discussion of the correlated values auction model where bidders’
valuations are affiliated. Milgrom (1989) provides an excellent survey of the economics literature on auctions, and Ashenfelter (1989)provides many interesting insights into the workings of auction markets for high quality wine and art.
6 The theoretical literature on auctions usually does not deal with situations in which fraud or manipulation affect auctions inways that are not foreseen by auction participants. One recent exception is Rothkopf and Harstad (1995).
6 Schwert: Markup Pricing in Mergers & Acquisitions
Exchange Commission (S.E.C.) after the bidder buys more than 5% of the target’s stock. Unusual patterns of price and
trading volume often attract attention from securities traders (and the stock exchanges and the S.E.C.), and of course
public statements such as press releases and S.E.C. filings provide direct information about potential bids.
One implication of the efficient markets hypothesis is that it should not be possible to earn systematic abnormal
profits by buying stock in companies that are potential targets (without access to private or inside information). There is
much evidence to support the efficient markets hypothesis in the context of mergers and tender offers. For example,
measured from the date of the first announced bid, there is no evidence that investors can earn average abnormal returns
from purchasing the stock of target firms. Not surprisingly, the stock prices of targets that are successfully taken over
rise above the market price on the day after the first bid, on average, and prices fall if the targets are not successfully
taken over, on average. But it is not possible to know which bids will succeed or fail at the time of the first bid, so it is
not possible to profit.7
If future price changes are unpredictable, there should be no correlation between past price movements (such
as pre-bid runups) and subsequent returns to target shareholders. Otherwise, it would be profitable to buy shares of
stocks whose prices have risen recently (perhaps with unusual volume behavior). Pound and Zeckhauser (1990) find
that there are no abnormal profits available from buying the shares of companies written about in the Wall Street
Journal "Heard on the Street" column as potential takeover targets (where most of the stories identify unusual price and
volume behavior as one source of the rumor). Thus, from the perspective of target shareholders, it would not be
surprising to find that pre-bid runups and post-bid markups are unrelated.
2.4. Inferring information about insider trading
How likely is it that the market can infer the existence of insider trading? In the United States, which has
severe punishments associated with insider trading, people who obtain inside information and trade on it have strong
incentives to disguise their behavior. There are many mechanisms used by regulators to detect insider trading. For
example, the New York Stock Exchange monitors trading of all of its listed stocks and uses statistical screens to identify
unusual patterns of price or volume. Unusual price and volume behavior triggers a call to the affected company to ask
whether there is material information that could explain the trading. In extreme cases, the S.E.C. is notified and begins
7 Dodd and Ruback (1977), Dodd (1980), and Bradley, Desai and Kim (1983) are early papers that document these facts. Also
see the survey paper by Jensen and Ruback (1983). Section 3 shows updated statistics that confirm earlier findings.
7 Schwert: Markup Pricing in Mergers & Acquisitions
its own investigation. Faced with the knowledge of these enforcement mechanisms, sophisticated traders who have
inside information try to avoid easily detectable trading patterns by spreading their trading over many accounts and
brokerage firms, and by spreading their trading over time [Boesky(1985)].
Even if there were no legal costs associated with insider trading, insiders have strong economic incentives to
disguise their behavior so that other traders cannot easily infer the information they possess from their trading behavior.
For example, an insider who submits many buy orders in a short period is likely to attract attention from "tape watchers"
who trade based on current market movements. To maximize the value of the private information he possesses, an
insider must delay the revelation of that information to other traders as long as possible (until he has bought as many
target shares as he wants). Barclay and Warner (1993) study trading patterns in the shares of 105 tender offer targets
from 1981-84 during the 30 trading days before formal offers. They find that most of the pre-offer price appreciation
occurs in intermediate-sized trades (500 to 9,900 shares), rather than larger or smaller trades. They call this behavior
"stealth trading." Of course, once the insider accumulates his desired position, he benefits from speedy revelation of his
private information (which is one reason insiders might share information with others whom they know will trade on
inside information).
Another cost of too-obvious insider trading is that planned bids can be canceled. A bidder who sees the target
price run up unexpectedly might decide to postpone or cancel a planned bid while trying to learn the cause of the runup.
Diamond Shamrock canceled its planned bid for Natomas after Ivan Boesky’s insider trading caused Natomas’ stock
price to rise by more than 20% during February 1983. Shortly after the decision to cancel the offer, Natomas’ stock
price plummeted, in large part due to selling pressure from Boesky (who had been tipped by Martin Siegel, Diamond’s
investment banker).8 If insider trading results in a canceled offer, the profitability of the inside information is negated by
the insider’s trading behavior.
While the highly publicized cases involving Dennis Levine, Boesky, and Siegel have focused attention on
insider trading associated with M&A transactions in recent years, these cases were discovered several years after the
insider trading took place. Moreover, they were discovered through a very indirect sequence of circumstances [Stewart
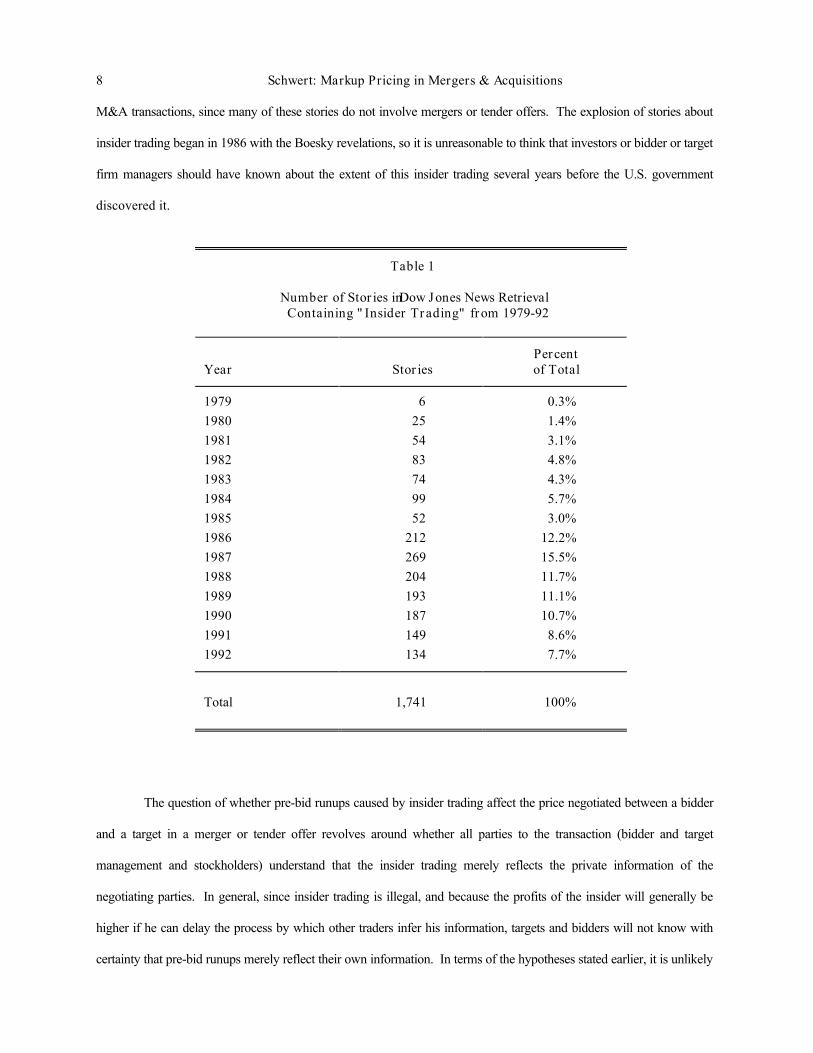
(1991)]. Table 1 shows the number of stories on Dow Jones News Retrieval (DJNR) containing the words "insider
trading" for the years 1979-92. This is a noisy measure of the public’s awareness of insider trading associated with
8 Maxus v. Kidder Peabody, Boesky, Siegel, et al ., Second Amended Original Petition by Plaintiff, No. 87-15583-M (298 D.
Tex. 1987).
8 Schwert: Markup Pricing in Mergers & Acquisitions
M&A transactions, since many of these stories do not involve mergers or tender offers. The explosion of stories about
insider trading began in 1986 with the Boesky revelations, so it is unreasonable to think that investors or bidder or target
firm managers should have known about the extent of this insider trading several years before the U.S. government
discovered it.
Table 1
Number of Stories in Dow Jones News RetrievalContaining "Insider Trading" from 1979-92
Year StoriesPercentof Total
1979 6 0.3%1980 25 1.4%1981 54 3.1%1982 83 4.8%1983 74 4.3%1984 99 5.7%1985 52 3.0%1986 212 12.2%1987 269 15.5%1988 204 11.7%1989 193 11.1%1990 187 10.7%1991 149 8.6%1992 134 7.7%
Total 1,741 100%
The question of whether pre-bid runups caused by insider trading affect the price negotiated between a bidder
and a target in a merger or tender offer revolves around whether all parties to the transaction (bidder and target
management and stockholders) understand that the insider trading merely reflects the private information of the
negotiating parties. In general, since insider trading is illegal, and because the profits of the insider will generally be
higher if he can delay the process by which other traders infer his information, targets and bidders will not know with
certainty that pre-bid runups merely reflect their own information. In terms of the hypotheses stated earlier, it is unlikely
9 Schwert: Markup Pricing in Mergers & Acquisitions
that the substitution hypothesis (pre-bid runups substitute for post-bid markups) is a good description of the world.
3. Mergers and tender offers, 1975-91
To study the relation between pre-bid runups and post-bid markups, I use Robert Comment’s proprietary
database containing information about all mergers and tender offers for NYSE- and AMEX-listed target firms from
1975-91. These announcements were obtained through various keyword searches of the Dow Jones News Retrieval
database, by inspection of the Wall Street Journal Index, and from Commerce Clearing House’s Capital Changes
Reporter. Information about poison pills also comes from Corporate Control Alert. Security return and volume data
and market indexes are from the Center for Research in Security Prices (CRSP).
There are 1,814 successful and unsuccessful takeovers from 1975-91 with enough return data available to be
included in this study. A successful takeover is one in which a bidder obtains control of the target firm by acquiring a
majority of target’s shares, eventually leading to delisting of the target firm’s stock (so partial and cleanup offers are
excluded). An unsuccessful takeover occurs when the bidder’s offer to acquire target shares does not lead to a change in
control and there are no competing bids within the next 365 days.
For each of the target firms, I calculate the market model regression [eq. ( 1)] for the 253 trading days (about
one year) ending 127 trading days (about six months) before the first public announcement of a tender offer or merger:
Rit = αi + βi Rmt + εit, t = -379, . . . , -127, (1)
where Rit is the continuously compounded return to the stock of target firm i and R mt is the continuously compounded
return to the CRSP value-weighted portfolio of NYSE- and AMEX-listed stocks for day t. Firms are included if they
have at least 100 daily returns available to estimate the parameters of ( 1). Estimates of (1) are used to estimate
abnormal returns, εit, for the runup and markup periods (t > -127).
10 Schwert: Markup Pricing in Mergers & Acquisitions
-126
-105 -84
-63
-42
-21 0 21 42 63 84 105
126
147
168
189
210
231
252
Event Date Relative to First Bid
-10%
0%
10%
20%
30%
40%C
umul
ativ
e A
vera
ge A
bnor
mal
Ret
urns
Successful DealsUnsuccessful DealsAll Deals
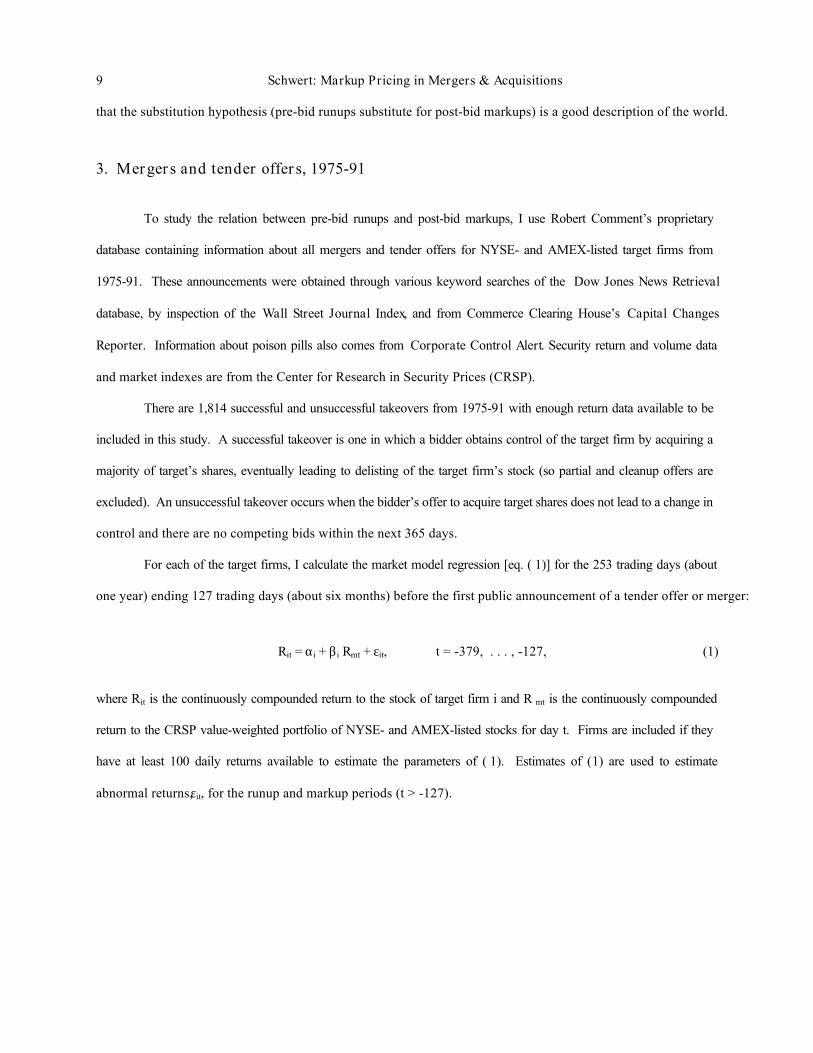
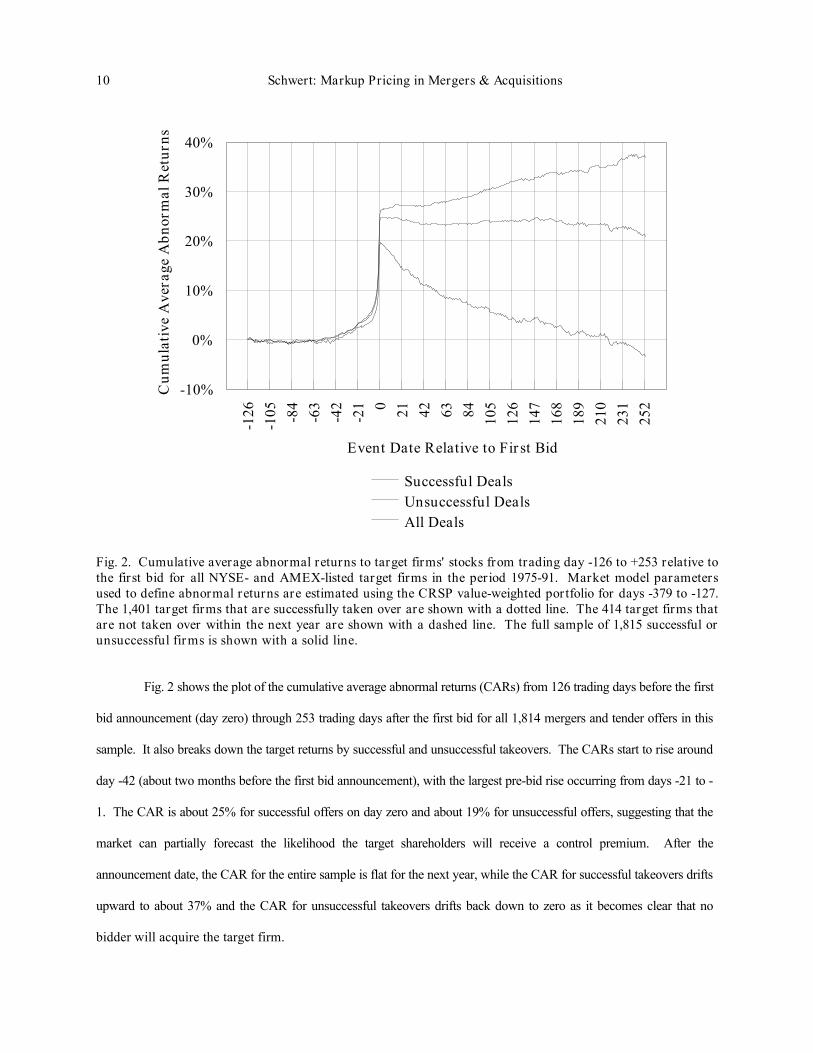
Fig. 2. Cumulative average abnormal returns to target firms' stocks from trading day -126 to +253 relative tothe first bid for all NYSE- and AMEX-listed target firms in the period 1975-91. Market model parametersused to define abnormal returns are estimated using the CRSP value-weighted portfolio for days -379 to -127.The 1,401 target firms that are successfully taken over are shown with a dotted line. The 414 target firms thatare not taken over within the next year are shown with a dashed line. The full sample of 1,815 successful orunsuccessful firms is shown with a solid line.
Fig. 2 shows the plot of the cumulative average abnormal returns (CARs) from 126 trading days before the first
bid announcement (day zero) through 253 trading days after the first bid for all 1,814 mergers and tender offers in this
sample. It also breaks down the target returns by successful and unsuccessful takeovers. The CARs start to rise around
day -42 (about two months before the first bid announcement), with the largest pre-bid rise occurring from days -21 to -
1. The CAR is about 25% for successful offers on day zero and about 19% for unsuccessful offers, suggesting that the
market can partially forecast the likelihood the target shareholders will receive a control premium. After the
announcement date, the CAR for the entire sample is flat for the next year, while the CAR for successful takeovers drifts
upward to about 37% and the CAR for unsuccessful takeovers drifts back down to zero as it becomes clear that no
bidder will acquire the target firm.
11 Schwert: Markup Pricing in Mergers & Acquisitions
Based on the evidence in fig. 2, the runup used in the regression tests below is the cumulative abnormal return
to the target stock over the 42-day runup period (roughly two months) before the first bid,
-1Runupi = ∑ εit, (2)
t = -42
and the markup is the cumulative abnormal return from the date of the first bid announcement through delisting or 126
trading days (roughly six months) after the first bid, whichever comes first,
Min[126, delisting]Markupi = ∑ εit. (3)
t = 0
The total premium paid by the successful bidder (Premium i), adjusted for market movements, is the sum of Runup i and
Markupi.
I focus on the sample of cases for which the length of time between the first bid and delisting is no more than a
year. Some deals take a long time to complete because regulatory hurdles have to be overcome. The noise added to the
stock returns of these target firms due to the delay is the primary reason for ignoring these cases. I also exclude cases in
which the size of the target firm is so small (less than $10 million market value of equity) or the price of the target stock
is so low (less than $2 per share) that the measured stock returns could be unreliable; low-priced stocks are likely to be
more affected by market microstructure effects, such as large proportional bid-ask spreads [Ball, Kothari, and Shanken
(1995)]. After excluding these exceptional cases, there are 1,523 target firms remaining. This is called the "main
sample" hereafter.
3.1. Average runups and markups and sample characteristics
Table 2 shows the average runups and markups for the total sample and the main sample. It also shows average runups
and markups for (and the proportion of the target firms in) subsamples with the following deal characteristics: 1)
whether or not the deal was ultimately successful (Success), 2) whether or not there was pre-bid news implying that a
bid might be forthcoming (News), 3) whether or not the target firm has a poison pill in place (Pill), 4) whether
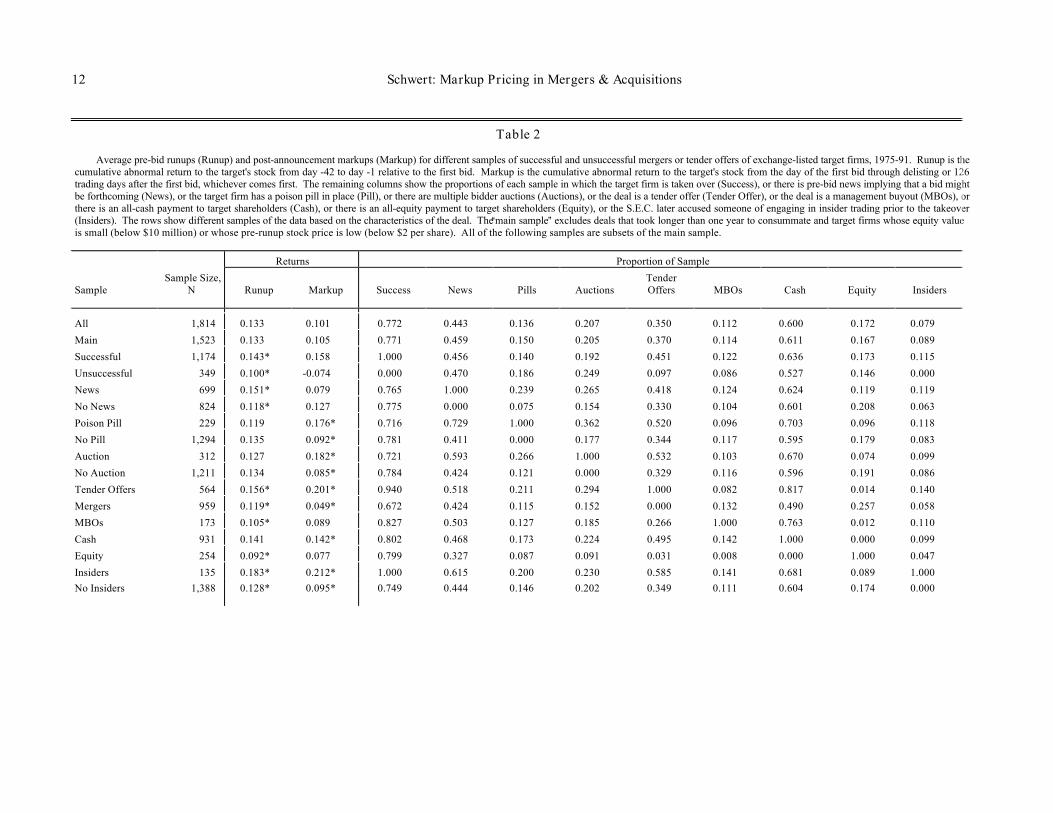
12 Schwert: Markup Pricing in Mergers & Acquisitions
Table 2
Average pre-bid runups (Runup) and post-announcement markups (Markup) for different samples of successful and unsuccessful mergers or tender offers of exchange-listed target firms, 1975-91. Runup is thecumulative abnormal return to the target's stock from day -42 to day -1 relative to the first bid. Markup is the cumulative abnormal return to the target's stock from the day of the first bid through delisting or 126trading days after the first bid, whichever comes first. The remaining columns show the proportions of each sample in which the target firm is taken over (Success), or there is pre-bid news implying that a bid mightbe forthcoming (News), or the target firm has a poison pill in place (Pill), or there are multiple bidder auctions (Auctions), or the deal is a tender offer (Tender Offer), or the deal is a management buyout (MBOs), orthere is an all-cash payment to target shareholders (Cash), or there is an all-equity payment to target shareholders (Equity), or the S.E.C. later accused someone of engaging in insider trading prior to the takeover(Insiders). The rows show different samples of the data based on the characteristics of the deal. The Amain sample@ excludes deals that took longer than one year to consummate and target firms whose equity valueis small (below $10 million) or whose pre-runup stock price is low (below $2 per share). All of the following samples are subsets of the main sample.
Returns Proportion of Sample
SampleSample Size,
N Runup Markup Success News Pills AuctionsTenderOffers MBOs Cash Equity Insiders
All 1,814 0.133 0.101 0.772 0.443 0.136 0.207 0.350 0.112 0.600 0.172 0.079
Main 1,523 0.133 0.105 0.771 0.459 0.150 0.205 0.370 0.114 0.611 0.167 0.089
Successful 1,174 0.143* 0.158 1.000 0.456 0.140 0.192 0.451 0.122 0.636 0.173 0.115
Unsuccessful 349 0.100* -0.074 0.000 0.470 0.186 0.249 0.097 0.086 0.527 0.146 0.000
News 699 0.151* 0.079 0.765 1.000 0.239 0.265 0.418 0.124 0.624 0.119 0.119
No News 824 0.118* 0.127 0.775 0.000 0.075 0.154 0.330 0.104 0.601 0.208 0.063
Poison Pill 229 0.119 0.176* 0.716 0.729 1.000 0.362 0.520 0.096 0.703 0.096 0.118
No Pill 1,294 0.135 0.092* 0.781 0.411 0.000 0.177 0.344 0.117 0.595 0.179 0.083
Auction 312 0.127 0.182* 0.721 0.593 0.266 1.000 0.532 0.103 0.670 0.074 0.099
No Auction 1,211 0.134 0.085* 0.784 0.424 0.121 0.000 0.329 0.116 0.596 0.191 0.086
Tender Offers 564 0.156* 0.201* 0.940 0.518 0.211 0.294 1.000 0.082 0.817 0.014 0.140
Mergers 959 0.119* 0.049* 0.672 0.424 0.115 0.152 0.000 0.132 0.490 0.257 0.058
MBOs 173 0.105* 0.089 0.827 0.503 0.127 0.185 0.266 1.000 0.763 0.012 0.110
Cash 931 0.141 0.142* 0.802 0.468 0.173 0.224 0.495 0.142 1.000 0.000 0.099
Equity 254 0.092* 0.077 0.799 0.327 0.087 0.091 0.031 0.008 0.000 1.000 0.047
Insiders 135 0.183* 0.212* 1.000 0.615 0.200 0.230 0.585 0.141 0.681 0.089 1.000No Insiders 1,388 0.128* 0.095* 0.749 0.444 0.146 0.202 0.349 0.111 0.604 0.174 0.000
13 Schwert: Markup Pricing in Mergers & Acquisitions
Table 2 (continued)
Returns Proportion of Sample
SampleSample Size,
N Runup Markup Success News Pills AuctionsTenderOffers MBOs Cash Equity Insiders
By Year of the First Bid:
1975 25 0.087 0.133 0.800 0.160 0.000 0.080 0.360 0.040 0.520 0.320 0.000
1976 43 0.157 0.156 0.907 0.209 0.000 0.140 0.372 0.000 0.558 0.256 0.023
1977 68 0.229* 0.128 0.853 0.206 0.000 0.162 0.294 0.044 0.574 0.250 0.015
1978 87 0.199* -0.021* 0.759 0.253 0.000 0.172 0.356 0.034 0.586 0.149 0.034
1979 92 0.222* 0.036* 0.717 0.304 0.000 0.207 0.337 0.033 0.543 0.141 0.022
1980 92 0.167 0.073 0.783 0.337 0.000 0.152 0.272 0.054 0.554 0.207 0.054
1981 79 0.117 0.182* 0.823 0.392 0.000 0.215 0.354 0.063 0.557 0.203 0.228
1982 81 0.145 0.175* 0.889 0.481 0.000 0.136 0.309 0.185 0.580 0.160 0.173
1983 84 0.119 0.084 0.893 0.524 0.000 0.167 0.238 0.190 0.583 0.226 0.131
1984 101 0.123 0.065 0.832 0.455 0.010 0.188 0.416 0.218 0.683 0.129 0.109
1985 123 0.119 0.082 0.821 0.528 0.073 0.211 0.382 0.179 0.602 0.138 0.228
1986 160 0.103* 0.106 0.725 0.475 0.194 0.219 0.450 0.119 0.675 0.119 0.063
1987 129 0.086* 0.108 0.767 0.535 0.264 0.256 0.442 0.163 0.605 0.155 0.062
1988 165 0.129 0.210 0.709 0.636 0.430 0.345 0.479 0.145 0.697 0.091 0.042
1989 114 0.086 0.040 0.605 0.667 0.395 0.237 0.377 0.088 0.667 0.140 0.053
1990 50 0.076 0.069 0.700 0.500 0.540 0.100 0.280 0.060 0.600 0.260 0.180
1991 30 0.138 0.237 0.667 0.500 0.367 0.033 0.167 0.033 0.433 0.400 0.033
Note: Average runups and markups that are different from the main sample mean at the 5% significance level are marked with an asterisk *.
14 Schwert: Markup Pricing in Mergers & Acquisitions
or not there were multiple bidders (Auctions), 5) whether or not the deal was a tender offer (Tender Offers), 6) whether
or not the deal was a management buyout (MBO), 7) whether payment to the target shareholders was only in the form of
cash (Cash) or equity (Equity), and 8) whether or not the S.E.C. later prosecuted insiders for illegal trading (Insiders). 9
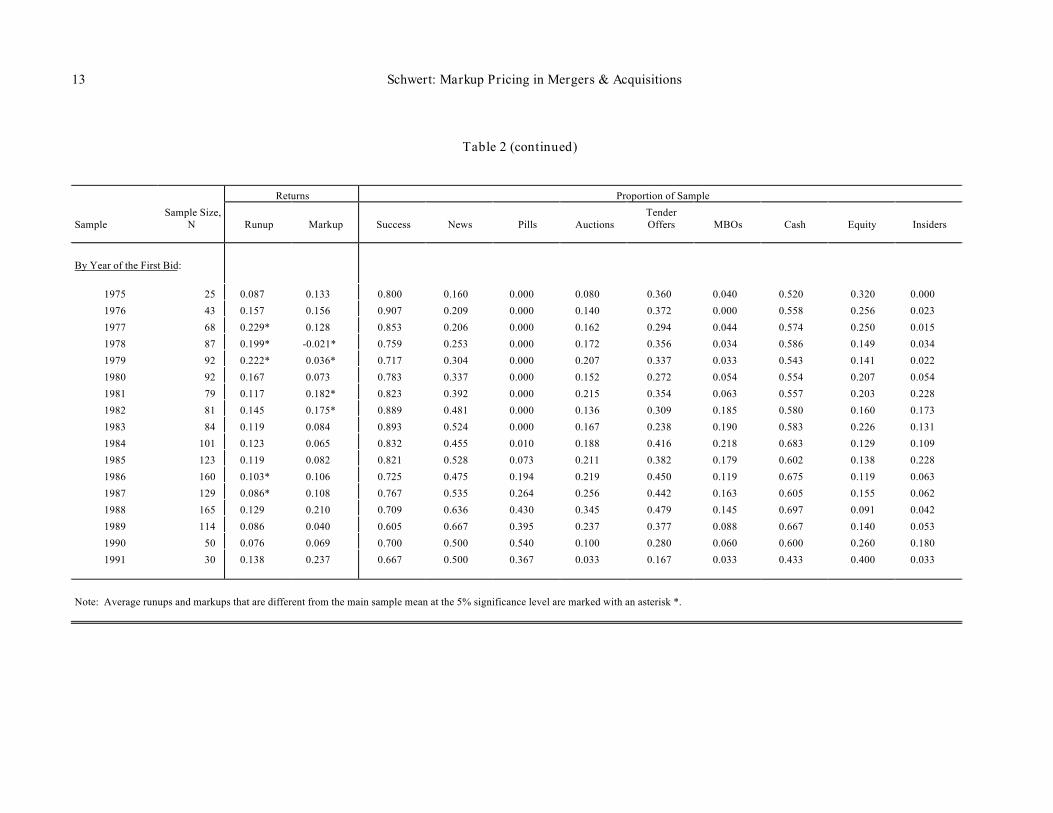
Table 2 also shows runups and markups for samples based on the year in which the first takeover bid occurs, as well as
the proportions of target firms in the yearly subsamples with the various deal characteristics.
Runups are large for all of these samples. The average for the main sample is 13.3%, and it is a little higher
when the takeover attempt was successful (14.3%), when there was foreshadowing news (15.1%), in tender offers
(15.6%), and when the S.E.C. later accused insiders of trading illegally (18.3%). Average runups are lower when the
takeover attempt was later unsuccessful (10.0%), when there was no foreshadowing news (11.8%), in mergers (11.9%),
when there is an MBO (10.5%), when equity is the only form of payment made to target shareholders (9.2%), and when
the S.E.C. did not prosecute anyone for insider trading (12.8%).
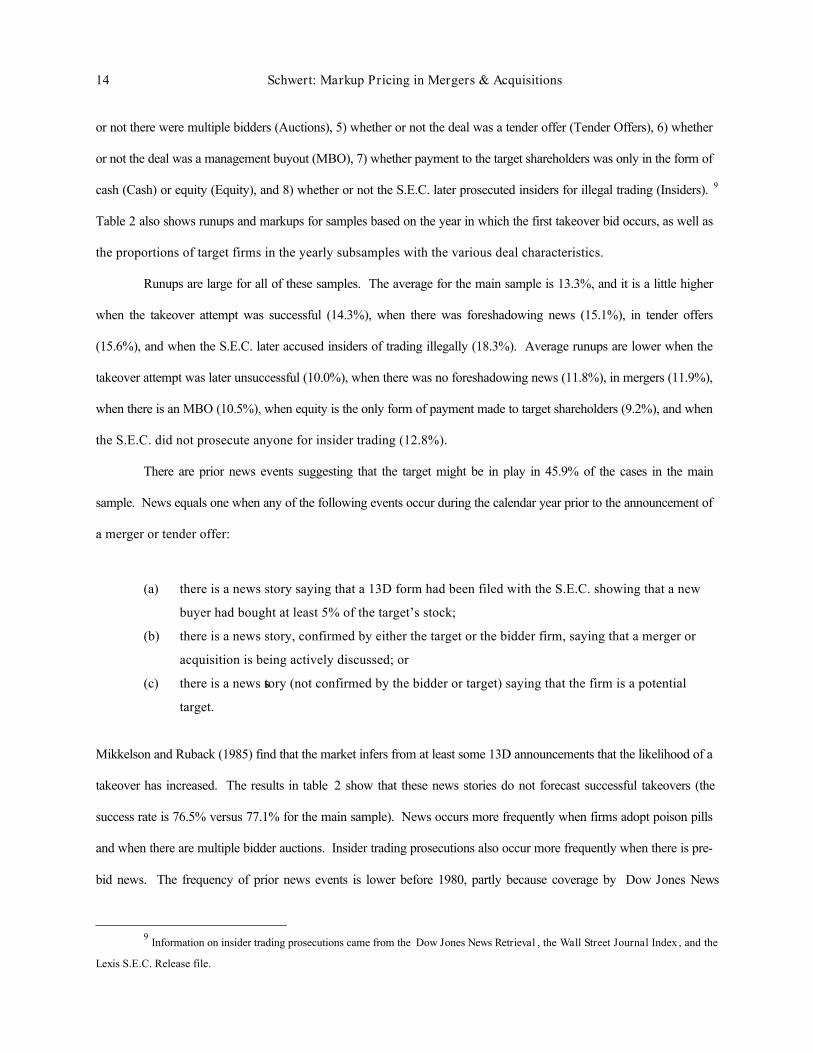
There are prior news events suggesting that the target might be in play in 45.9% of the cases in the main
sample. News equals one when any of the following events occur during the calendar year prior to the announcement of
a merger or tender offer:
(a) there is a news story saying that a 13D form had been filed with the S.E.C. showing that a new
buyer had bought at least 5% of the target’s stock;
(b) there is a news story, confirmed by either the target or the bidder firm, saying that a merger or
acquisition is being actively discussed; or
(c) there is a news story (not confirmed by the bidder or target) saying that the firm is a potential
target.
Mikkelson and Ruback (1985) find that the market infers from at least some 13D announcements that the likelihood of a
takeover has increased. The results in table 2 show that these news stories do not forecast successful takeovers (the
success rate is 76.5% versus 77.1% for the main sample). News occurs more frequently when firms adopt poison pills
and when there are multiple bidder auctions. Insider trading prosecutions also occur more frequently when there is pre-
bid news. The frequency of prior news events is lower before 1980, partly because coverage by Dow Jones News
9 Information on insider trading prosecutions came from the Dow Jones News Retrieval , the Wall Street Journal Index , and the
Lexis S.E.C. Release file.
15 Schwert: Markup Pricing in Mergers & Acquisitions
Retrieval begins in mid-1979, and other sources of this information have less coverage.
Auctions occur in 20.5% of the cases in the main sample. They are more frequent when there is a tender offer
(29.4%). The frequency of multiple bidder auctions increased in the late 1980s, rising to 34.5% of the takeovers in
1988. As the number of takeovers fell in 1990-91, the frequency of auctions also fell.
Tender offers represent 37.0 % of the main sample. They are more frequent when there is a subsequent insider
trading prosecution (58.5%). They are less frequent (only 26.6%) when the winning bidder involves the incumbent
management of the target firm (an MBO). The years 1984-89 had a higher rate of tender offers than the other parts of
the period (from 37.7% to 47.9%). Management buyouts (MBOs) represent 11.4% of the main sample. All-cash deals
represent 61.1% and all-equity deals represent 16.7% of the main sample.
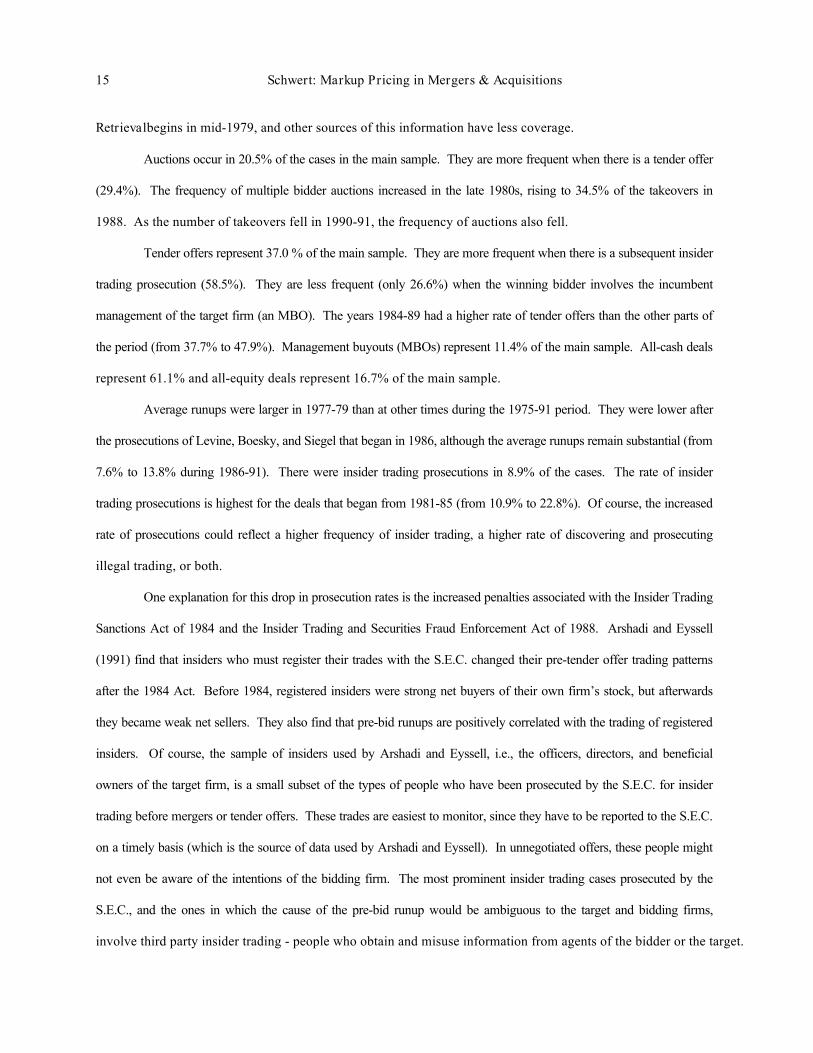
Average runups were larger in 1977-79 than at other times during the 1975-91 period. They were lower after
the prosecutions of Levine, Boesky, and Siegel that began in 1986, although the average runups remain substantial (from
7.6% to 13.8% during 1986-91). There were insider trading prosecutions in 8.9% of the cases. The rate of insider
trading prosecutions is highest for the deals that began from 1981-85 (from 10.9% to 22.8%). Of course, the increased
rate of prosecutions could reflect a higher frequency of insider trading, a higher rate of discovering and prosecuting
illegal trading, or both.
One explanation for this drop in prosecution rates is the increased penalties associated with the Insider Trading
Sanctions Act of 1984 and the Insider Trading and Securities Fraud Enforcement Act of 1988. Arshadi and Eyssell
(1991) find that insiders who must register their trades with the S.E.C. changed their pre-tender offer trading patterns
after the 1984 Act. Before 1984, registered insiders were strong net buyers of their own firm’s stock, but afterwards
they became weak net sellers. They also find that pre-bid runups are positively correlated with the trading of registered
insiders. Of course, the sample of insiders used by Arshadi and Eyssell, i.e., the officers, directors, and beneficial
owners of the target firm, is a small subset of the types of people who have been prosecuted by the S.E.C. for insider
trading before mergers or tender offers. These trades are easiest to monitor, since they have to be reported to the S.E.C.
on a timely basis (which is the source of data used by Arshadi and Eyssell). In unnegotiated offers, these people might
not even be aware of the intentions of the bidding firm. The most prominent insider trading cases prosecuted by the
S.E.C., and the ones in which the cause of the pre-bid runup would be ambiguous to the target and bidding firms,
involve third party insider trading - people who obtain and misuse information from agents of the bidder or the target.
16 Schwert: Markup Pricing in Mergers & Acquisitions
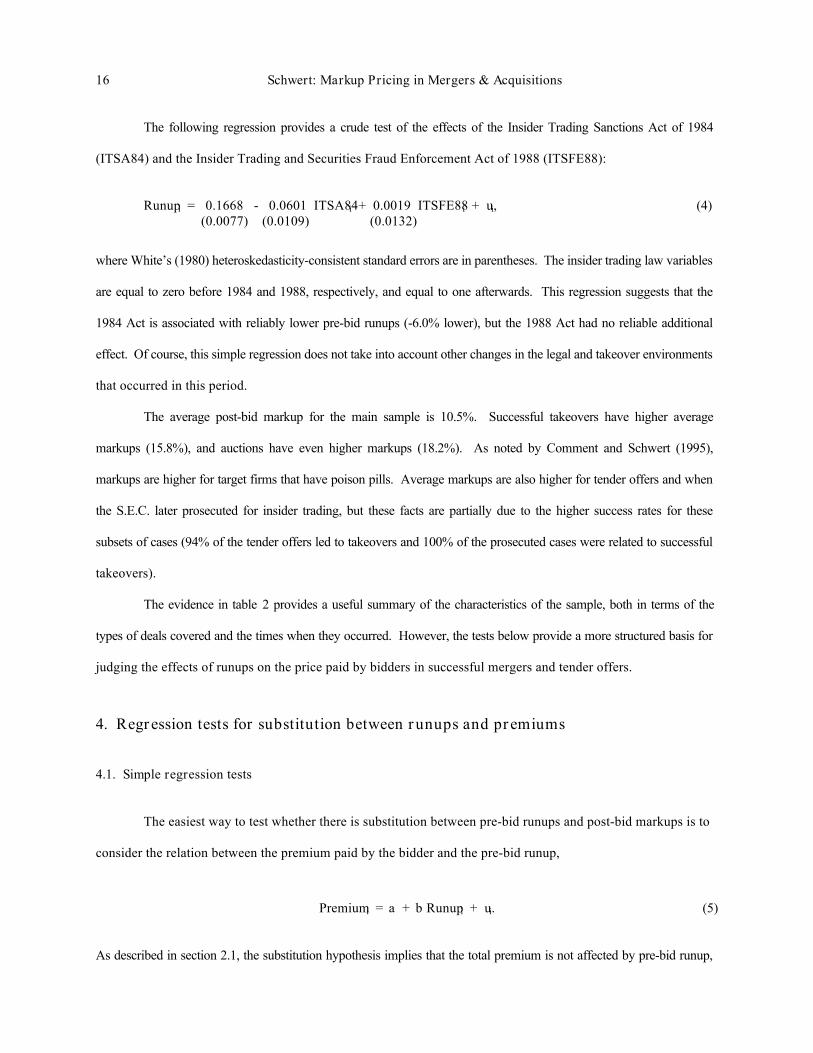
The following regression provides a crude test of the effects of the Insider Trading Sanctions Act of 1984
(ITSA84) and the Insider Trading and Securities Fraud Enforcement Act of 1988 (ITSFE88):
Runupi = 0.1668 - 0.0601 ITSA84i + 0.0019 ITSFE88i + ui, (4) (0.0077) (0.0109) (0.0132)
where White’s (1980) heteroskedasticity-consistent standard errors are in parentheses. The insider trading law variables
are equal to zero before 1984 and 1988, respectively, and equal to one afterwards. This regression suggests that the
1984 Act is associated with reliably lower pre-bid runups (-6.0% lower), but the 1988 Act had no reliable additional
effect. Of course, this simple regression does not take into account other changes in the legal and takeover environments
that occurred in this period.
The average post-bid markup for the main sample is 10.5%. Successful takeovers have higher average
markups (15.8%), and auctions have even higher markups (18.2%). As noted by Comment and Schwert (1995),
markups are higher for target firms that have poison pills. Average markups are also higher for tender offers and when
the S.E.C. later prosecuted for insider trading, but these facts are partially due to the higher success rates for these
subsets of cases (94% of the tender offers led to takeovers and 100% of the prosecuted cases were related to successful
takeovers).
The evidence in table 2 provides a useful summary of the characteristics of the sample, both in terms of the
types of deals covered and the times when they occurred. However, the tests below provide a more structured basis for
judging the effects of runups on the price paid by bidders in successful mergers and tender offers.
4. Regression tests for substitution between runups and premiums
4.1. Simple regression tests
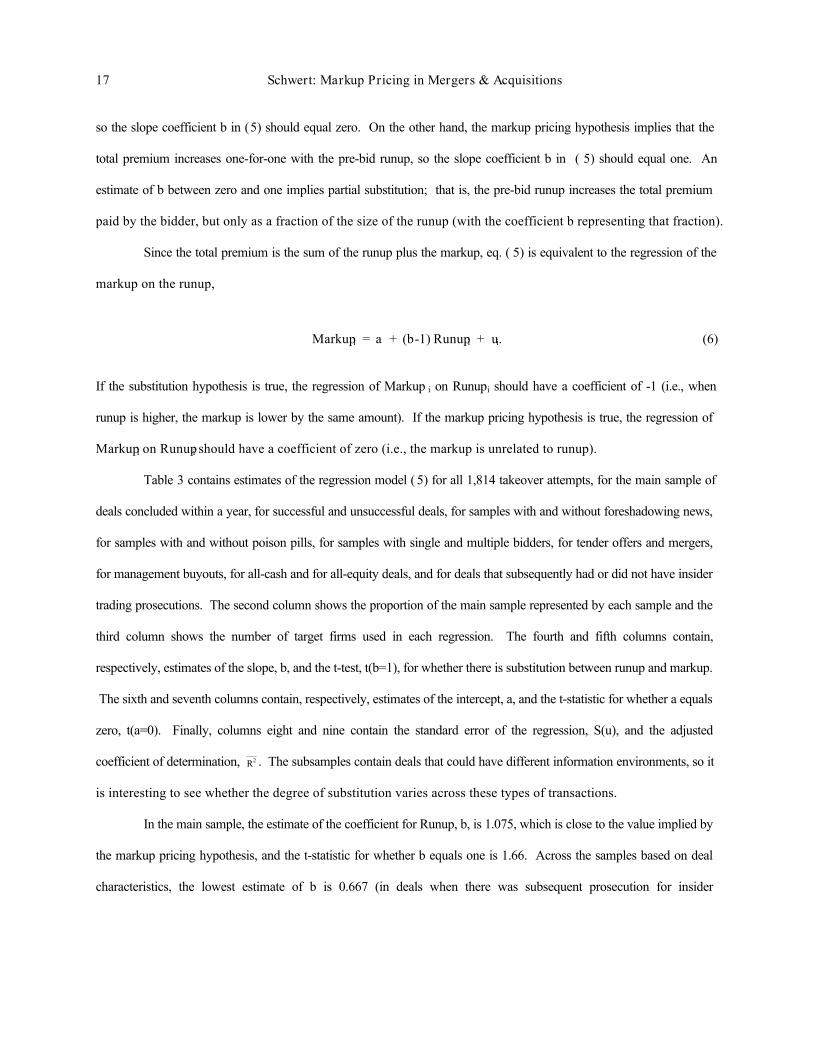
The easiest way to test whether there is substitution between pre-bid runups and post-bid markups is to
consider the relation between the premium paid by the bidder and the pre-bid runup,
Premiumi = a + b Runupi + ui. (5)
As described in section 2.1, the substitution hypothesis implies that the total premium is not affected by pre-bid runup,
17 Schwert: Markup Pricing in Mergers & Acquisitions
so the slope coefficient b in (5) should equal zero. On the other hand, the markup pricing hypothesis implies that the
total premium increases one-for-one with the pre-bid runup, so the slope coefficient b in ( 5) should equal one. An
estimate of b between zero and one implies partial substitution; that is, the pre-bid runup increases the total premium
paid by the bidder, but only as a fraction of the size of the runup (with the coefficient b representing that fraction).
Since the total premium is the sum of the runup plus the markup, eq. ( 5) is equivalent to the regression of the
markup on the runup,
Markupi = a + (b-1) Runupi + ui. (6)
If the substitution hypothesis is true, the regression of Markup i on Runupi should have a coefficient of -1 (i.e., when
runup is higher, the markup is lower by the same amount). If the markup pricing hypothesis is true, the regression of
Markupi on Runupi should have a coefficient of zero (i.e., the markup is unrelated to runup).
Table 3 contains estimates of the regression model ( 5) for all 1,814 takeover attempts, for the main sample of
deals concluded within a year, for successful and unsuccessful deals, for samples with and without foreshadowing news,
for samples with and without poison pills, for samples with single and multiple bidders, for tender offers and mergers,
for management buyouts, for all-cash and for all-equity deals, and for deals that subsequently had or did not have insider
trading prosecutions. The second column shows the proportion of the main sample represented by each sample and the
third column shows the number of target firms used in each regression. The fourth and fifth columns contain,
respectively, estimates of the slope, b, and the t-test, t(b=1), for whether there is substitution between runup and markup.
The sixth and seventh columns contain, respectively, estimates of the intercept, a, and the t-statistic for whether a equals
zero, t(a=0). Finally, columns eight and nine contain the standard error of the regression, S(u), and the adjusted
coefficient of determination, R2 . The subsamples contain deals that could have different information environments, so it
is interesting to see whether the degree of substitution varies across these types of transactions.
In the main sample, the estimate of the coefficient for Runup, b, is 1.075, which is close to the value implied by
the markup pricing hypothesis, and the t-statistic for whether b equals one is 1.66. Across the samples based on deal
characteristics, the lowest estimate of b is 0.667 (in deals when there was subsequent prosecution for insider
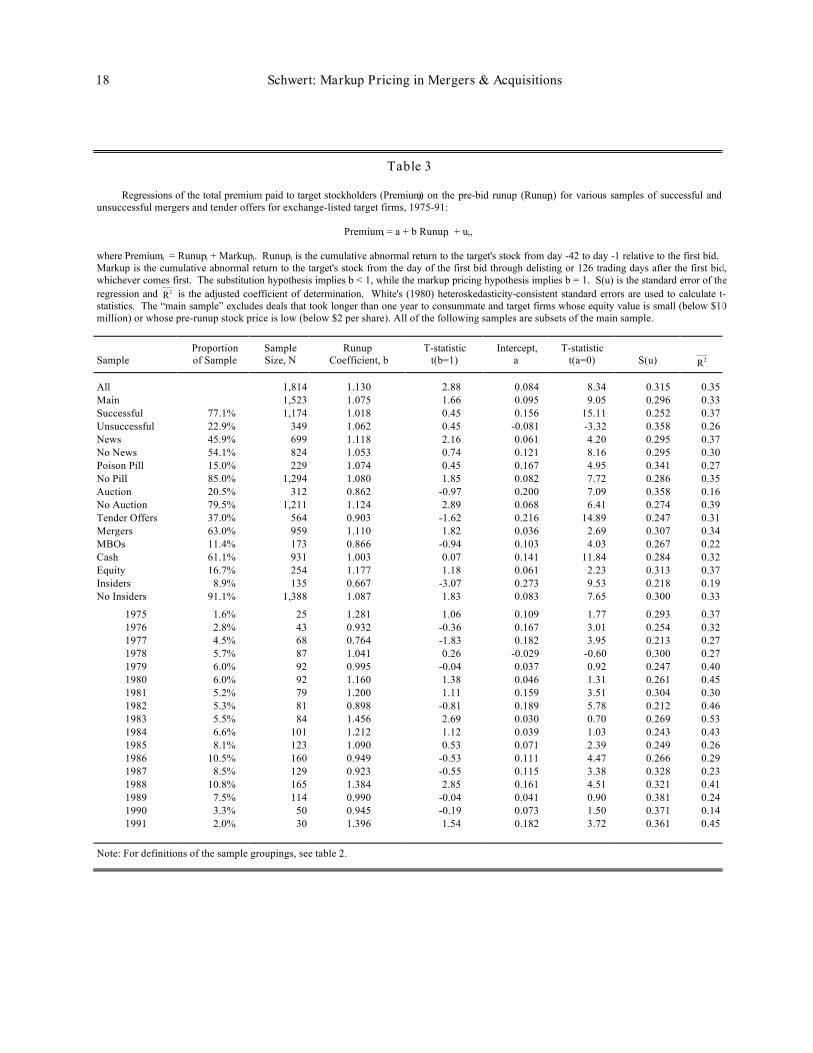
18 Schwert: Markup Pricing in Mergers & Acquisitions
Table 3
Regressions of the total premium paid to target stockholders (Premiumi) on the pre-bid runup (Runupi) for various samples of successful andunsuccessful mergers and tender offers for exchange-listed target firms, 1975-91:
Premiumi = a + b Runupi + ui,
where Premiumi = Runupi + Markupi. Runupi is the cumulative abnormal return to the target's stock from day -42 to day -1 relative to the first bid. Markup is the cumulative abnormal return to the target's stock from the day of the first bid through delisting or 126 trading days after the first bid,whichever comes first. The substitution hypothesis implies b < 1, while the markup pricing hypothesis implies b = 1. S(u) is the standard error of theregression and R2 is the adjusted coefficient of determination. White's (1980) heteroskedasticity-consistent standard errors are used to calculate t-statistics. The “main sample” excludes deals that took longer than one year to consummate and target firms whose equity value is small (below $10million) or whose pre-runup stock price is low (below $2 per share). All of the following samples are subsets of the main sample.
SampleProportionof Sample
SampleSize, N
RunupCoefficient, b
T-statistict(b=1)
Intercept,a
T-statistict(a=0) S(u) R2
All 1,814 1.130 2.88 0.084 8.34 0.315 0.35Main 1,523 1.075 1.66 0.095 9.05 0.296 0.33Successful 77.1% 1,174 1.018 0.45 0.156 15.11 0.252 0.37Unsuccessful 22.9% 349 1.062 0.45 -0.081 -3.32 0.358 0.26News 45.9% 699 1.118 2.16 0.061 4.20 0.295 0.37No News 54.1% 824 1.053 0.74 0.121 8.16 0.295 0.30Poison Pill 15.0% 229 1.074 0.45 0.167 4.95 0.341 0.27No Pill 85.0% 1,294 1.080 1.85 0.082 7.72 0.286 0.35Auction 20.5% 312 0.862 -0.97 0.200 7.09 0.358 0.16No Auction 79.5% 1,211 1.124 2.89 0.068 6.41 0.274 0.39Tender Offers 37.0% 564 0.903 -1.62 0.216 14.89 0.247 0.31Mergers 63.0% 959 1.110 1.82 0.036 2.69 0.307 0.34MBOs 11.4% 173 0.866 -0.94 0.103 4.03 0.267 0.22Cash 61.1% 931 1.003 0.07 0.141 11.84 0.284 0.32Equity 16.7% 254 1.177 1.18 0.061 2.23 0.313 0.37Insiders 8.9% 135 0.667 -3.07 0.273 9.53 0.218 0.19No Insiders 91.1% 1,388 1.087 1.83 0.083 7.65 0.300 0.33
1975 1.6% 25 1.281 1.06 0.109 1.77 0.293 0.371976 2.8% 43 0.932 -0.36 0.167 3.01 0.254 0.321977 4.5% 68 0.764 -1.83 0.182 3.95 0.213 0.271978 5.7% 87 1.041 0.26 -0.029 -0.60 0.300 0.271979 6.0% 92 0.995 -0.04 0.037 0.92 0.247 0.401980 6.0% 92 1.160 1.38 0.046 1.31 0.261 0.451981 5.2% 79 1.200 1.11 0.159 3.51 0.304 0.301982 5.3% 81 0.898 -0.81 0.189 5.78 0.212 0.461983 5.5% 84 1.456 2.69 0.030 0.70 0.269 0.531984 6.6% 101 1.212 1.12 0.039 1.03 0.243 0.431985 8.1% 123 1.090 0.53 0.071 2.39 0.249 0.261986 10.5% 160 0.949 -0.53 0.111 4.47 0.266 0.291987 8.5% 129 0.923 -0.55 0.115 3.38 0.328 0.231988 10.8% 165 1.384 2.85 0.161 4.51 0.321 0.411989 7.5% 114 0.990 -0.04 0.041 0.90 0.381 0.241990 3.3% 50 0.945 -0.19 0.073 1.50 0.371 0.141991 2.0% 30 1.396 1.54 0.182 3.72 0.361 0.45
Note: For definitions of the sample groupings, see table 2.

19 Schwert: Markup Pricing in Mergers & Acquisitions
trading). The t-statistic for whether this estimate is different from one is -3.07. This is the only case in which the t-
statistic testing for substitution is lower than -2.0. It seems that insiders are not completely able to hide their activity
from bidders and targets, since there is partial substitution of runup for markup. Nevertheless, even the smallest
estimates of the substitution coefficient imply that at least 67% of the pre-bid runup is added to the total price paid by the
bidder in acquiring a target stock.
The intercept in eq. (5) estimates the average post-bid markup paid in mergers and acquisitions when there is
no pre-bid runup. Note that when slope coefficient b is less than one, the intercept a is larger than the average markup
in table 2 (in insider trading cases, for example, a = 0.273 and the average markup in table 2 is 0.212). This difference
measures the effect of pre-bid runup on lowering the average post-bid markup -- another way of seeing that the effect of
substitution is not large.
Table 3 also shows estimates of the regression model ( 5) for samples based on the year when the first bid
occurs. Most of the estimates of the coefficient for Runup i, b, are close to one (the range of these estimates is from 0.76
to 1.46). None of the t-statistics for substitution is below -2.0, and two are larger than 2.0 (1983 and 1988), implying
that markups are higher than average in cases with large runups. Overall, there is little reason to think that there is
variation in the amount of substitution over the 1975-91 period.
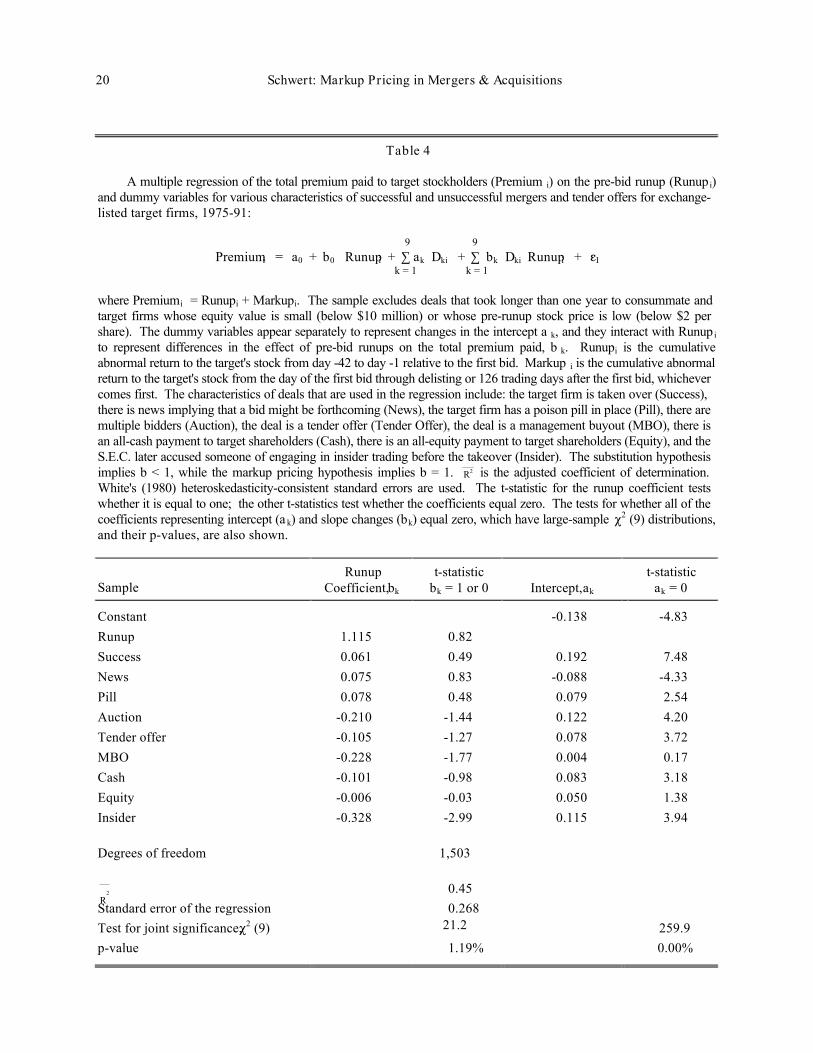
4.2. Multiple regression models for substitution
Table 4 combines the effects of these different samples into a multiple regression. Since several characteristics
of successful deals are correlated (e.g., cash deals and tender offers), it is not possible to disentangle the separate effects
of these characteristics from the simple regressions in table 3. Instead, the multiple regression,
9 9Premiumi = a0 + b0 Runupi + ∑ ak Dki + ∑ bk Dki Runupi + ui, (7)
k = 1 k = 1
in which the dummy variables Dki equal one if the kth characteristic (Success, News, Pill, Auction, Tender Offer, MBO,
Cash, Equity, or Insider) applies to case i and zero otherwise, allow the intercept a and the slope b to vary with the
characteristics of the deal.
20 Schwert: Markup Pricing in Mergers & Acquisitions
Table 4
A multiple regression of the total premium paid to target stockholders (Premium i) on the pre-bid runup (Runup i)and dummy variables for various characteristics of successful and unsuccessful mergers and tender offers for exchange-listed target firms, 1975-91:
9 9Premiumi = a0 + b0 Runupi + ∑ ak Dki + ∑ bk Dki Runupi + gI
k = 1 k = 1
where Premiumi = Runupi + Markupi. The sample excludes deals that took longer than one year to consummate andtarget firms whose equity value is small (below $10 million) or whose pre-runup stock price is low (below $2 pershare). The dummy variables appear separately to represent changes in the intercept a k, and they interact with Runup i
to represent differences in the effect of pre-bid runups on the total premium paid, b k. Runupi is the cumulativeabnormal return to the target's stock from day -42 to day -1 relative to the first bid. Markup i is the cumulative abnormalreturn to the target's stock from the day of the first bid through delisting or 126 trading days after the first bid, whichevercomes first. The characteristics of deals that are used in the regression include: the target firm is taken over (Success), there is news implying that a bid might be forthcoming (News), the target firm has a poison pill in place (Pill), there aremultiple bidders (Auction), the deal is a tender offer (Tender Offer), the deal is a management buyout (MBO), there isan all-cash payment to target shareholders (Cash), there is an all-equity payment to target shareholders (Equity), and theS.E.C. later accused someone of engaging in insider trading before the takeover (Insider). The substitution hypothesisimplies b < 1, while the markup pricing hypothesis implies b = 1. R2 is the adjusted coefficient of determination. White's (1980) heteroskedasticity-consistent standard errors are used. The t-statistic for the runup coefficient testswhether it is equal to one; the other t-statistics test whether the coefficients equal zero. The tests for whether all of thecoefficients representing intercept (a k) and slope changes (bk) equal zero, which have large-sample P2 (9) distributions,and their p-values, are also shown.
SampleRunup
Coefficient, bk
t-statisticbk = 1 or 0 Intercept, ak
t-statisticak = 0
Constant -0.138 -4.83Runup 1.115 0.82Success 0.061 0.49 0.192 7.48News 0.075 0.83 -0.088 -4.33Pill 0.078 0.48 0.079 2.54Auction -0.210 -1.44 0.122 4.20Tender offer -0.105 -1.27 0.078 3.72MBO -0.228 -1.77 0.004 0.17Cash -0.101 -0.98 0.083 3.18Equity -0.006 -0.03 0.050 1.38Insider -0.328 -2.99 0.115 3.94
Degrees of freedom 1,503
R2 0.45
Standard error of the regression 0.268 Test for joint significance, P2 (9) 21.2 259.9p-value 1.19% 0.00%
21 Schwert: Markup Pricing in Mergers & Acquisitions
In table 4, the runup coefficient estimate is 1.115 and the t-statistic for whether this estimate is different from
one is 0.82. Most of the slope change coefficients (b k) for the deal characteristics are small, and only the insider trading
coefficient (-0.328) is reliably less than zero (t-statistic of -2.99). The large-sample joint test for whether all nine slope
change coefficients equal zero equals 21.2, which has a p-value of 1.2% compared to a χ2 distribution with nine degrees
of freedom. To estimate the sensitivity of the total price paid to the pre-bid runup for a deal with some of these nine
characteristics, the base case slope coefficient, b 0 = 1.115, is added to the appropriate slope change estimates. For
example, for a cash tender offer that is not an auction or an MBO, and with no subsequent insider trading prosecution,
the estimated slope coefficient is 1.115 - 0.105 - 0.101 = 0.909.
Consistent with the evidence in table 4, the estimates of the markup paid if the runup equals zero (i.e., the
intercepts) are reliably higher when the deal is successful (coefficient = 0.192, t-statistic = 7.48), when the target firm
has a poison pill (coefficient = 0.079, t-statistic = 2.54), when there is a multiple bidder auction (coefficient = 0.122, t-
statistic = 4.20), when there is a tender offer (coefficient = 0.078, t-statistic = 3.72), when cash is used to pay target
shareholders (coefficient = 0.083, t-statistic = 3.18), and when there is insider trading that is later prosecuted (coefficient
= 0.115, t-statistic = 3.94). The large- sample joint test for whether all nine intercept-change coefficients equal zero
equals 259.9, which has a p-value less than 0.01% compared to a χ2 distribution with nine degrees of freedom.
The estimates in table 4 confirm the results from table 3. There is some substitution between pre-bid runups
and post-bid markups for cases in which the S.E.C. subsequently prosecutes insider trading. Overall, however, the
extent of substitution is small. The effects of different types of deal characteristics on the size of the average markup,
given the size of the runup, is much larger and more reliable.
4.3. Differential substitution during the runup period
To this point, the runup period has been fixed at 42 trading days. Using shorter and longer runup and markup
periods has no substantial effect on the results. To explore this more systematically, I consider nine nonoverlapping
runup periods [(-1, -1), (-2, -5), (-6, -10), (-11, -21), (-22, -42), (-43, -63), (-64, -84), (-85, -105), and (-106, -126)]
and 11 markup periods [(0,0), (1,1), (2,5), (6,10), (11,21), (22,42), (43,63), (64,84), (85,105), (106,126), and (0,126)].
Table 5 contains estimates of multiple regressions of the abnormal returns for the main
22 Schwert: Markup Pricing in Mergers & Acquisitions
Table 5
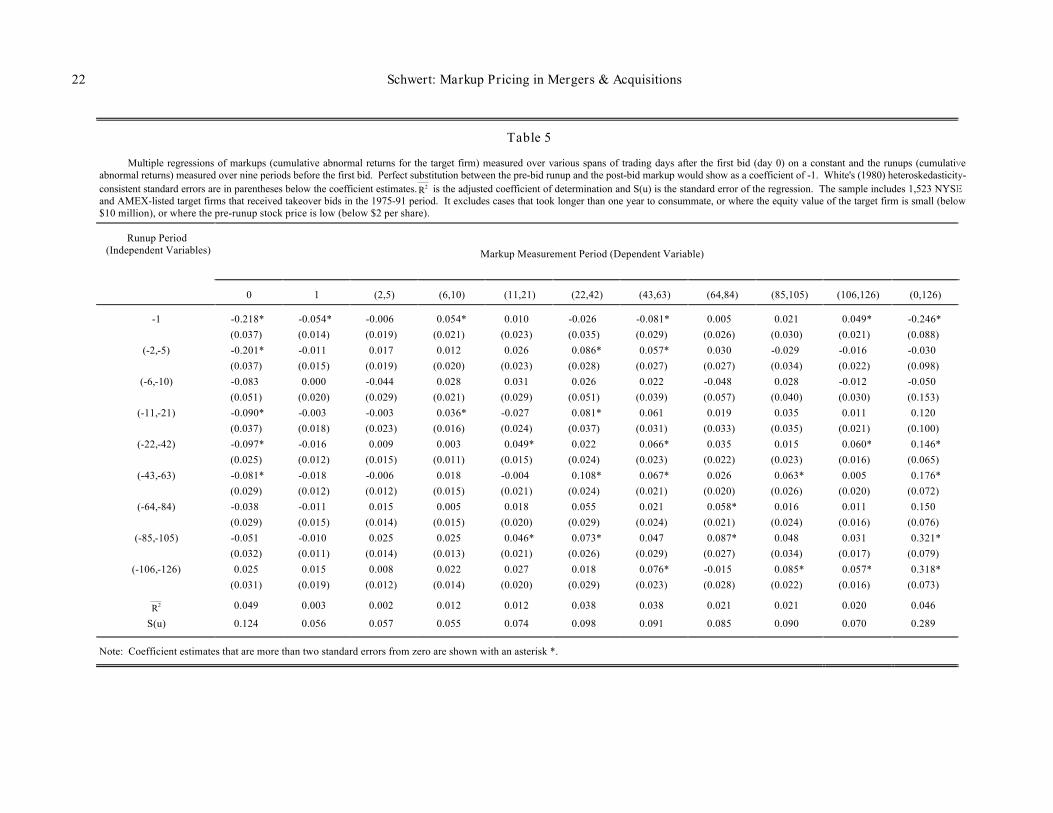
Multiple regressions of markups (cumulative abnormal returns for the target firm) measured over various spans of trading days after the first bid (day 0) on a constant and the runups (cumulativeabnormal returns) measured over nine periods before the first bid. Perfect substitution between the pre-bid runup and the post-bid markup would show as a coefficient of -1. White's (1980) heteroskedasticity-consistent standard errors are in parentheses below the coefficient estimates. R2 is the adjusted coefficient of determination and S(u) is the standard error of the regression. The sample includes 1,523 NYSEand AMEX-listed target firms that received takeover bids in the 1975-91 period. It excludes cases that took longer than one year to consummate, or where the equity value of the target firm is small (below$10 million), or where the pre-runup stock price is low (below $2 per share).
Runup Period(Independent Variables) Markup Measurement Period (Dependent Variable)
0 1 (2,5) (6,10) (11,21) (22,42) (43,63) (64,84) (85,105) (106,126) (0,126)
-1 -0.218* -0.054* -0.006 0.054* 0.010 -0.026 -0.081* 0.005 0.021 0.049* -0.246*(0.037) (0.014) (0.019) (0.021) (0.023) (0.035) (0.029) (0.026) (0.030) (0.021) (0.088)
(-2,-5) -0.201* -0.011 0.017 0.012 0.026 0.086* 0.057* 0.030 -0.029 -0.016 -0.030(0.037) (0.015) (0.019) (0.020) (0.023) (0.028) (0.027) (0.027) (0.034) (0.022) (0.098)
(-6,-10) -0.083 0.000 -0.044 0.028 0.031 0.026 0.022 -0.048 0.028 -0.012 -0.050(0.051) (0.020) (0.029) (0.021) (0.029) (0.051) (0.039) (0.057) (0.040) (0.030) (0.153)
(-11,-21) -0.090* -0.003 -0.003 0.036* -0.027 0.081* 0.061 0.019 0.035 0.011 0.120(0.037) (0.018) (0.023) (0.016) (0.024) (0.037) (0.031) (0.033) (0.035) (0.021) (0.100)
(-22,-42) -0.097* -0.016 0.009 0.003 0.049* 0.022 0.066* 0.035 0.015 0.060* 0.146*(0.025) (0.012) (0.015) (0.011) (0.015) (0.024) (0.023) (0.022) (0.023) (0.016) (0.065)
(-43,-63) -0.081* -0.018 -0.006 0.018 -0.004 0.108* 0.067* 0.026 0.063* 0.005 0.176*(0.029) (0.012) (0.012) (0.015) (0.021) (0.024) (0.021) (0.020) (0.026) (0.020) (0.072)
(-64,-84) -0.038 -0.011 0.015 0.005 0.018 0.055 0.021 0.058* 0.016 0.011 0.150(0.029) (0.015) (0.014) (0.015) (0.020) (0.029) (0.024) (0.021) (0.024) (0.016) (0.076)
(-85,-105) -0.051 -0.010 0.025 0.025 0.046* 0.073* 0.047 0.087* 0.048 0.031 0.321*(0.032) (0.011) (0.014) (0.013) (0.021) (0.026) (0.029) (0.027) (0.034) (0.017) (0.079)
(-106,-126) 0.025 0.015 0.008 0.022 0.027 0.018 0.076* -0.015 0.085* 0.057* 0.318*(0.031) (0.019) (0.012) (0.014) (0.020) (0.029) (0.023) (0.028) (0.022) (0.016) (0.073)
R2 0.049 0.003 0.002 0.012 0.012 0.038 0.038 0.021 0.021 0.020 0.046
S(u) 0.124 0.056 0.057 0.055 0.074 0.098 0.091 0.085 0.090 0.070 0.289
Note: Coefficient estimates that are more than two standard errors from zero are shown with an asterisk *.
23 Schwert: Markup Pricing in Mergers & Acquisitions
sample for each of the 11 markup periods on the nine runup returns,
9 Markupij = aj + ∑ bjk Runupik + ui, j = 1, . . . , 11 (8)
k = 1
where the coefficients bjk should equal zero if the markup pricing hypothesis is true and they should equal -1 if the
substitution hypothesis is true. The coefficient estimates that are more than two standard errors from zero are shown
with an asterisk.
There is evidence of partial substitution using the announcement-day markup return (day zero), since the
coefficient estimates are negative for several runup periods. The largest of these estimates are for the runup periods
covering the week before the first bid. Day -1 has a coefficient of -0.218 and days -2 through -5 have a coefficient of -
0.201, implying that the markup return on the announcement day is lower by about 20% of the runup that occurred in the
prior week. When looking at longer markup periods, such as the (0,126) period used elsewhere in this paper, the
evidence for partial substitution for the day -1 runup remains reliably different from zero (coefficient of -0.246 with a
standard error of 0.088). However, the estimates of the runup coefficients for earlier periods are generally positive, and
some are reliably greater than zero. The small negative coefficients for the announcement day are offset by small
positive coefficients at longer lags. Thus, the strongest evidence in favor of the substitution hypothesis shows that the
markup is reduced by only about one-fifth to one-quarter of the runup in the week before the first bid. There is no
reliable evidence of substitution in other runup periods.
4.4. Effects of abnormal trading volume
Besides price runups, it is also common to see unusually high levels of share trading volume before
announcements of merger and acquisition activity. Pound and Zeckhauser (1990, table 5) show that takeover rumors
published in the "Heard on the Street" column of the Wall Street Journal often mention unusual price and volume
behavior for the stock in question. Meulbroek (1992, table XIII) shows that trading volume is unusually high on days
when insiders trade before takeovers. She also shows that trading volume is unusually high during the 20 trading days
before takeover bids, even after netting out the trades of insiders who were prosecuted for insider trading. Of course,
one reason for unusually high volume could be the accumulation of a toehold position by the bidder.
24 Schwert: Markup Pricing in Mergers & Acquisitions
Information about trading volume (with price) prior to a formal merger or tender offer bid might help bidders
judge whether their information had leaked to the market. To check this possibility, I use data from CRSP to estimate a
model for daily share trading volume for the 1,506 target firms for which adequate share trading volume data are
available for the 254 trading days ending 127 days before the first bid announcement. The volume model is:
qit = µ + ρ qit-1 + γ0 qmt + γ1 qmt-1 + νit, t = -379, . . . , -127, (9)
where qit is the growth rate of share trading volume for firm i on day t (the first difference of the natural logarithm of
volume) and qmt is the growth rate of share trading volume for the exchange on which this firm is traded (either NYSE
or AMEX) on day t. This model expresses the growth rate in share trading volume as a function of the previous growth
rate and the current and lagged growth rates of market trading volume. The average estimates of the parameters of this
model are in table 6, along with the average t-statistics.
The average estimate of the coefficient of lagged share volume, ρ, implies a tendency for unusual movements in
share volume to be partially reversed. If this coefficient were zero, changes in log share volume would be entirely
permanent (i.e., log share volume would follow a random walk, ignoring the other parameters in the model). When this
coefficient is negative, changes in log share volume are partly transitory. The average coefficient estimate of -0.413,
with an average t-statistic of -7.19, is consistent with log share volume having both permanent and transitory
components.
The average estimates of the market share volume growth coefficients, γ0 and γ1, imply positive comovement of
trading volume across stocks. The long-run effect of a 1% increase in market trading volume is
(γ0 + γ1) / ( 1 - ρ), which averages 0.800 across these 1,506 firms.
.
25 Schwert: Markup Pricing in Mergers & Acquisitions
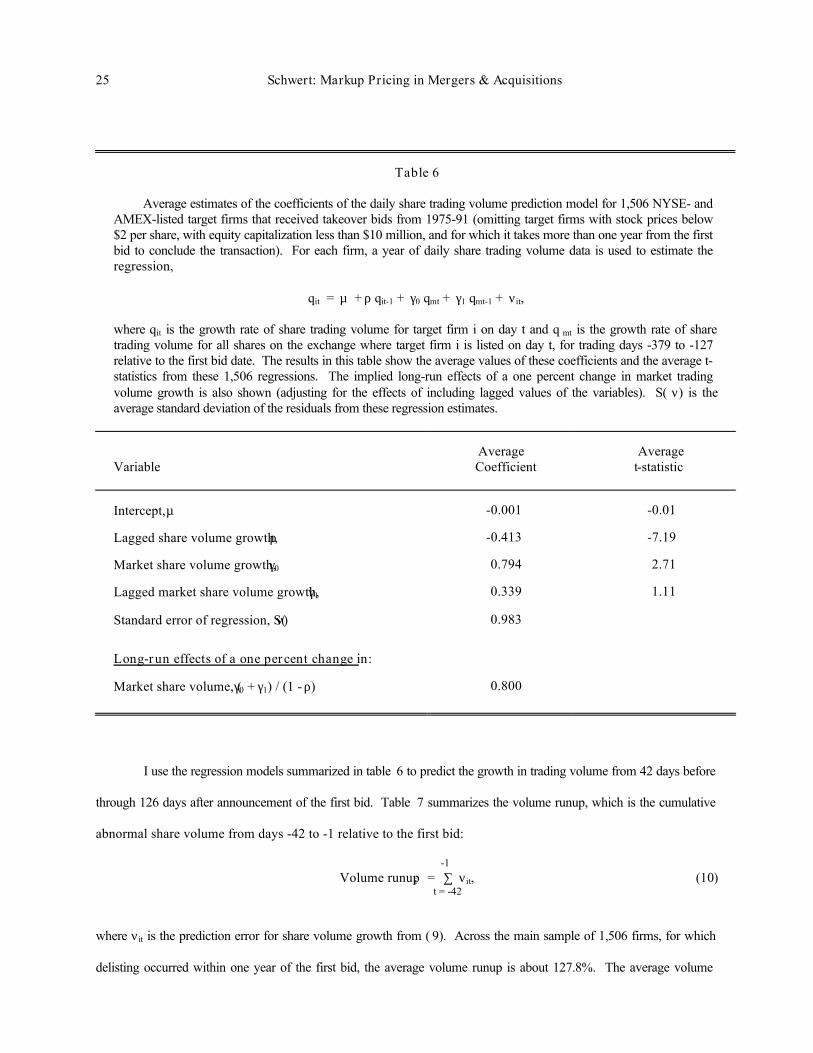
Table 6
Average estimates of the coefficients of the daily share trading volume prediction model for 1,506 NYSE- andAMEX-listed target firms that received takeover bids from 1975-91 (omitting target firms with stock prices below$2 per share, with equity capitalization less than $10 million, and for which it takes more than one year from the firstbid to conclude the transaction). For each firm, a year of daily share trading volume data is used to estimate theregression,
qit = µ + ρ qit-1 + γ0 qmt + γ1 qmt-1 + νit,
where qit is the growth rate of share trading volume for target firm i on day t and q mt is the growth rate of sharetrading volume for all shares on the exchange where target firm i is listed on day t, for trading days -379 to -127relative to the first bid date. The results in this table show the average values of these coefficients and the average t-statistics from these 1,506 regressions. The implied long-run effects of a one percent change in market tradingvolume growth is also shown (adjusting for the effects of including lagged values of the variables). S( ν) is theaverage standard deviation of the residuals from these regression estimates.
VariableAverage
Coefficient Average t-statistic
Intercept, µ -0.001 -0.01
Lagged share volume growth, ρ -0.413 -7.19
Market share volume growth, γ0 0.794 2.71
Lagged market share volume growth, γ1 0.339 1.11
Standard error of regression, S(ν) 0.983
Long-run effects of a one percent change in:
Market share volume, (γ0 + γ1) / (1 - ρ) 0.800
I use the regression models summarized in table 6 to predict the growth in trading volume from 42 days before
through 126 days after announcement of the first bid. Table 7 summarizes the volume runup, which is the cumulative
abnormal share volume from days -42 to -1 relative to the first bid:
-1Volume runupi = ∑ νit, (10)
t = -42
where νit is the prediction error for share volume growth from ( 9). Across the main sample of 1,506 firms, for which
delisting occurred within one year of the first bid, the average volume runup is about 127.8%. The average volume

26 Schwert: Markup Pricing in Mergers & Acquisitions
runup is lower for deals that are unsuccessful, for deals in which the target firm has a poison pill, and for deals that
subsequently turned into auctions. The average volume runup is higher before tender offers and especially for deals in
which the S.E.C. subsequently prosecuted insider trading.
Table 7
Cumulative average abnormal share trading volume growth for days -42 to -1 relative to the announcement of thefirst bid for 1,506 NYSE- and AMEX-listed target firms that received takeover bids from 1975-91. For each firm, ayear of daily share trading volume data is used to estimate a regression model (see table 6) to predict daily sharevolume, ending 126 trading days before the date of the first bid.
Sample Sample Size, NAverage
Volume Runup
Main 1,506 1.278Successful 1,170 1.361Unsuccessful 336 0.990News 691 1.360No news 815 1.209Poison pill 228 0.974No pill 1,278 1.332Auction 307 1.064No auction 1,199 1.333Tender offers 562 1.548Mergers 944 1.117MBOs 171 1.440Cash 923 1.303Equity 251 1.097Insider trading 135 2.155No insider trading 1,371 1.192
Table 8 shows estimates of a regression model that includes dummy variables for all of the deal characteristics
examined previously. Based on this regression, the average pre-bid volume runup is significant even when none of the
other deal characteristics are positive. The estimate of the intercept is 1.114, with a t-statistic of 5.06. The poison pill
coefficient is -0.439 (t-statistic of -2.21) and the auction coefficient is -0.332 (t-statistic of -1.96). Finally, when the
S.E.C. later prosecuted insider trading, abnormal volume is higher by 83.8% with a t-statistic of 3.47. This raises the
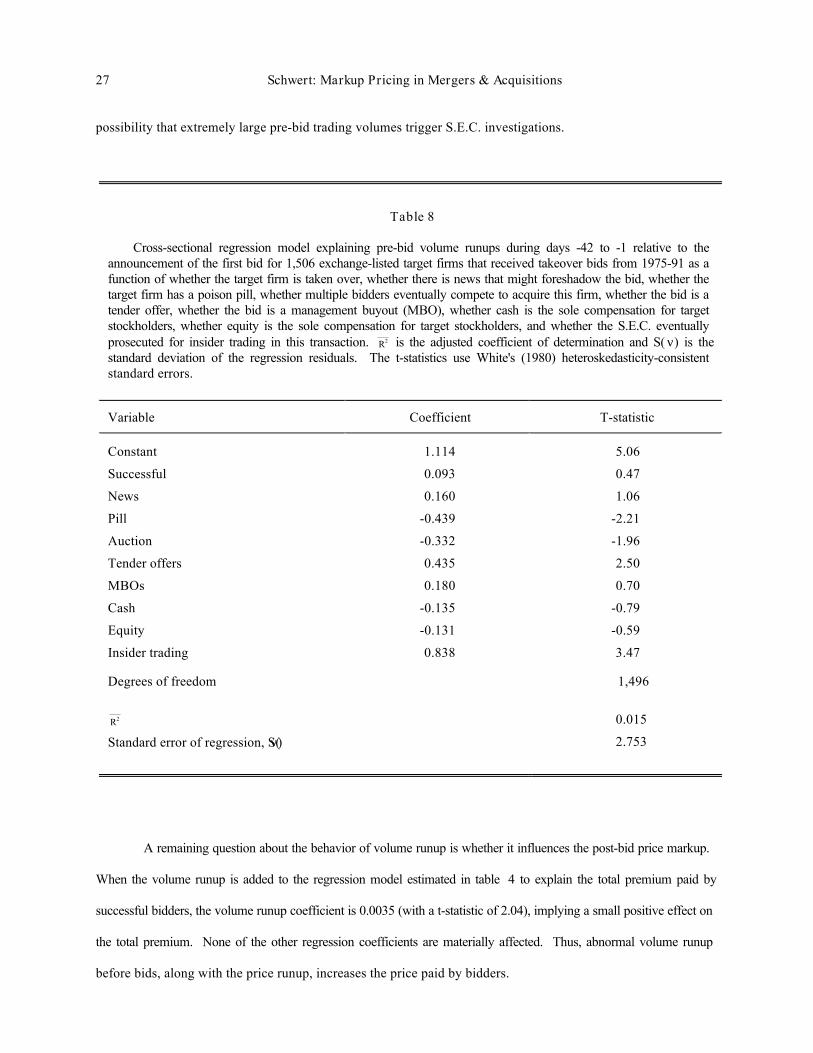
27 Schwert: Markup Pricing in Mergers & Acquisitions
possibility that extremely large pre-bid trading volumes trigger S.E.C. investigations.
Table 8
Cross-sectional regression model explaining pre-bid volume runups during days -42 to -1 relative to theannouncement of the first bid for 1,506 exchange-listed target firms that received takeover bids from 1975-91 as afunction of whether the target firm is taken over, whether there is news that might foreshadow the bid, whether thetarget firm has a poison pill, whether multiple bidders eventually compete to acquire this firm, whether the bid is atender offer, whether the bid is a management buyout (MBO), whether cash is the sole compensation for targetstockholders, whether equity is the sole compensation for target stockholders, and whether the S.E.C. eventuallyprosecuted for insider trading in this transaction. R2 is the adjusted coefficient of determination and S( ν) is thestandard deviation of the regression residuals. The t-statistics use White's (1980) heteroskedasticity-consistentstandard errors.
Variable Coefficient T-statistic
Constant 1.114 5.06
Successful 0.093 0.47
News 0.160 1.06
Pill -0.439 -2.21
Auction -0.332 -1.96
Tender offers 0.435 2.50
MBOs 0.180 0.70
Cash -0.135 -0.79
Equity -0.131 -0.59
Insider trading 0.838 3.47
Degrees of freedom 1,496
R2 0.015
Standard error of regression, S(ν) 2.753
A remaining question about the behavior of volume runup is whether it influences the post-bid price markup.
When the volume runup is added to the regression model estimated in table 4 to explain the total premium paid by
successful bidders, the volume runup coefficient is 0.0035 (with a t-statistic of 2.04), implying a small positive effect on
the total premium. None of the other regression coefficients are materially affected. Thus, abnormal volume runup
before bids, along with the price runup, increases the price paid by bidders.
28 Schwert: Markup Pricing in Mergers & Acquisitions
4.5. Effects of runup in the bidder’s stock price
Besides the runup in the target’s stock price, market participants can also observe the runup in the bidder’s
stock price before the date of the first bid. To the extent that information about a pending bid leaks to the market, it
should be reflected in the bidder’s stock price as well as the target’s (if there are significant value implications for the
bidder). There is a problem with measuring the runups and markups in bidders’ stock prices over long intervals because
exchange-listed bidder firms tend to have experienced unusual stock price rises prior to their decision to make takeover
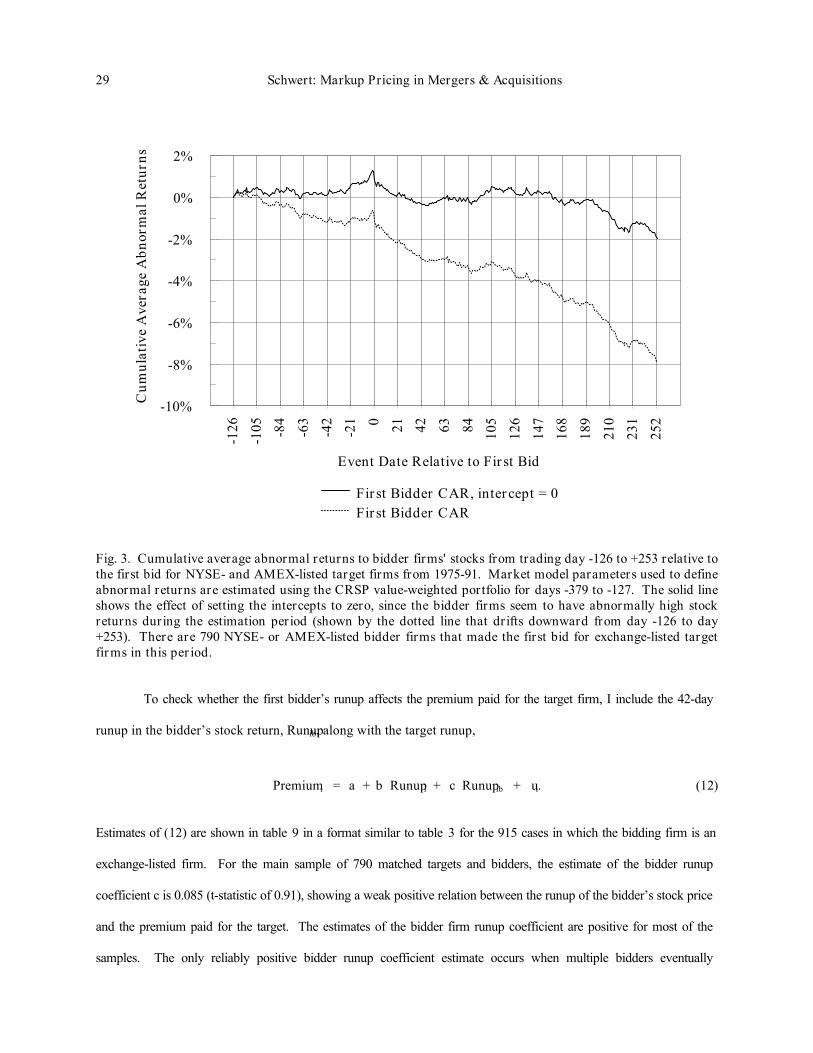
bids [Asquith(1983)]. The dotted line in fig. 3 shows the plot of the cumulative average abnormal returns from 126
trading days before the first bid announcement (day zero) through 253 trading days after the first bid for the 790
exchange-listed bidders in the main sample. The CAR for the bidders drifts downward through most of this 18-month
period. The average market model intercept is 0.018% per day for the bidders (compared with -0.007% for the target
firms) and the average beta coefficient is 0.991 for the bidders (compared with 0.767 for the target firms). Since the
CAR for the target firms is flat for the periods (-126, -42) and (1, 253), I conclude that the market model estimated over
the interval (-379, -127) provides a reasonable benchmark for calculating abnormal stock returns. In contrast, the
negative drift for the bidder firms in fig. 3, with the evidence that the average intercept for bidders is unusually high,
leads me to conclude that the market model for days (-379, -127) is not a good benchmark for normal returns to bidders.
As a crude correction, I calculate abnormal returns to bidder firms by constraining each bidder’s market model intercept
to equal zero. Thus, the abnormal return for bidder i is:
εit = Rit - βi Rmt, t = -126, . . . , 253. (11)
The solid line in fig. 3 shows the CAR for bidder firms using this method of estimating abnormal returns. This
correction seems to solve most of the problems with the usual method of calculating abnormal returns, since there is no
longer a pronounced downward drift in the bidders’ CAR. In fact, the corrected bidder CAR rises from day -42 to the
day of the first bid (day zero), and then falls for at least the next 21 trading days back to a level of about zero. The
bidders’ CAR remains flat from day 21 to day 189 (from about one to nine months after the first bid), but then there is a
drop of about 2% from days 189 to 231 (months ten and eleven). I use the corrected abnormal returns from eq. ( 11) in
the subsequent regression tests.
29 Schwert: Markup Pricing in Mergers & Acquisitions
-126
-105 -84
-63
-42
-21 0 21 42 63 84 105
126
147
168
189
210
231
252
Event Date Relative to First Bid
-10%
-8%
-6%
-4%
-2%
0%
2%C
umul
ativ
e A
vera
ge A
bnor
mal
Ret
urns
First Bidder CAR, intercept = 0First Bidder CAR
Fig. 3. Cumulative average abnormal returns to bidder firms' stocks from trading day -126 to +253 relative tothe first bid for NYSE- and AMEX-listed target firms from 1975-91. Market model parameters used to defineabnormal returns are estimated using the CRSP value-weighted portfolio for days -379 to -127. The solid lineshows the effect of setting the intercepts to zero, since the bidder firms seem to have abnormally high stockreturns during the estimation period (shown by the dotted line that drifts downward from day -126 to day+253). There are 790 NYSE- or AMEX-listed bidder firms that made the first bid for exchange-listed targetfirms in this period.
To check whether the first bidder’s runup affects the premium paid for the target firm, I include the 42-day
runup in the bidder’s stock return, Runupib, along with the target runup,
Premiumi = a + b Runupi + c Runupib + ui. (12)
Estimates of (12) are shown in table 9 in a format similar to table 3 for the 915 cases in which the bidding firm is an
exchange-listed firm. For the main sample of 790 matched targets and bidders, the estimate of the bidder runup
coefficient c is 0.085 (t-statistic of 0.91), showing a weak positive relation between the runup of the bidder’s stock price
and the premium paid for the target. The estimates of the bidder firm runup coefficient are positive for most of the
samples. The only reliably positive bidder runup coefficient estimate occurs when multiple bidders eventually
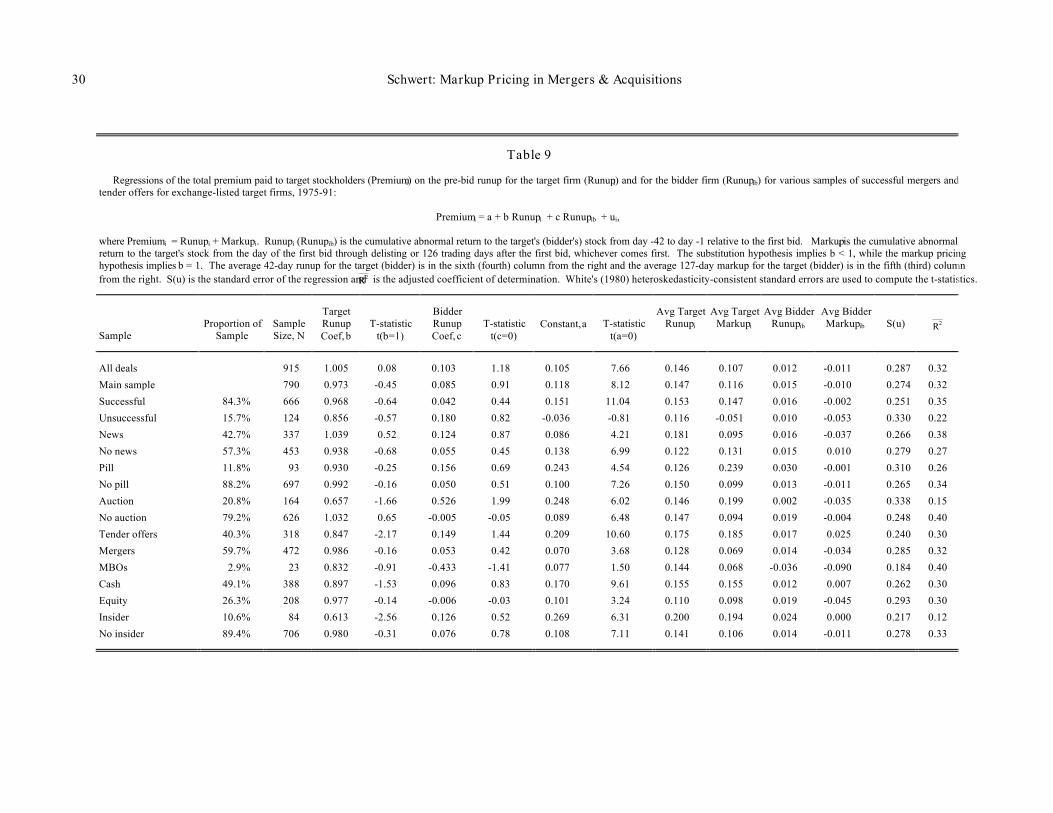
30 Schwert: Markup Pricing in Mergers & Acquisitions
Table 9
Regressions of the total premium paid to target stockholders (Premiumi) on the pre-bid runup for the target firm (Runupi) and for the bidder firm (Runupib) for various samples of successful mergers andtender offers for exchange-listed target firms, 1975-91:
Premiumi = a + b Runupi + c Runupib + ui,
where Premiumi = Runupi + Markupi. Runupi (Runupib) is the cumulative abnormal return to the target's (bidder's) stock from day -42 to day -1 relative to the first bid. Markupi is the cumulative abnormalreturn to the target's stock from the day of the first bid through delisting or 126 trading days after the first bid, whichever comes first. The substitution hypothesis implies b < 1, while the markup pricinghypothesis implies b = 1. The average 42-day runup for the target (bidder) is in the sixth (fourth) column from the right and the average 127-day markup for the target (bidder) is in the fifth (third) columnfrom the right. S(u) is the standard error of the regression and R2 is the adjusted coefficient of determination. White's (1980) heteroskedasticity-consistent standard errors are used to compute the t-statistics.
SampleProportion of
SampleSampleSize, N
TargetRunupCoef, b
T-statistict(b=1)
BidderRunupCoef, c
T-statistict(c=0)
Constant, a T-statistict(a=0)
Avg TargetRunupi
Avg TargetMarkupi
Avg BidderRunupib
Avg BidderMarkupib S(u) R2
All deals 915 1.005 0.08 0.103 1.18 0.105 7.66 0.146 0.107 0.012 -0.011 0.287 0.32
Main sample 790 0.973 -0.45 0.085 0.91 0.118 8.12 0.147 0.116 0.015 -0.010 0.274 0.32
Successful 84.3% 666 0.968 -0.64 0.042 0.44 0.151 11.04 0.153 0.147 0.016 -0.002 0.251 0.35
Unsuccessful 15.7% 124 0.856 -0.57 0.180 0.82 -0.036 -0.81 0.116 -0.051 0.010 -0.053 0.330 0.22
News 42.7% 337 1.039 0.52 0.124 0.87 0.086 4.21 0.181 0.095 0.016 -0.037 0.266 0.38
No news 57.3% 453 0.938 -0.68 0.055 0.45 0.138 6.99 0.122 0.131 0.015 0.010 0.279 0.27
Pill 11.8% 93 0.930 -0.25 0.156 0.69 0.243 4.54 0.126 0.239 0.030 -0.001 0.310 0.26
No pill 88.2% 697 0.992 -0.16 0.050 0.51 0.100 7.26 0.150 0.099 0.013 -0.011 0.265 0.34
Auction 20.8% 164 0.657 -1.66 0.526 1.99 0.248 6.02 0.146 0.199 0.002 -0.035 0.338 0.15
No auction 79.2% 626 1.032 0.65 -0.005 -0.05 0.089 6.48 0.147 0.094 0.019 -0.004 0.248 0.40
Tender offers 40.3% 318 0.847 -2.17 0.149 1.44 0.209 10.60 0.175 0.185 0.017 0.025 0.240 0.30
Mergers 59.7% 472 0.986 -0.16 0.053 0.42 0.070 3.68 0.128 0.069 0.014 -0.034 0.285 0.32
MBOs 2.9% 23 0.832 -0.91 -0.433 -1.41 0.077 1.50 0.144 0.068 -0.036 -0.090 0.184 0.40
Cash 49.1% 388 0.897 -1.53 0.096 0.83 0.170 9.61 0.155 0.155 0.012 0.007 0.262 0.30
Equity 26.3% 208 0.977 -0.14 -0.006 -0.03 0.101 3.24 0.110 0.098 0.019 -0.045 0.293 0.30
Insider 10.6% 84 0.613 -2.56 0.126 0.52 0.269 6.31 0.200 0.194 0.024 0.000 0.217 0.12
No insider 89.4% 706 0.980 -0.31 0.076 0.78 0.108 7.11 0.141 0.106 0.014 -0.011 0.278 0.33

31 Schwert: Markup Pricing in Mergers & Acquisitions
compete (0.526, with a t-statistic of 1.99).
Table 9 also shows the average runup and markup (measured from the date of the first bid through 126 trading
days after the first bid) for bidders and targets for each sample. Compared with the target runups, the bidder runups are
small, but most are positive. The largest positive bidder runups occur when the target firm has a poison pill (3.0%) and
when the S.E.C. subsequently prosecutes insider trading (2.4%). Unlike the pattern with target firms, for which the
average runup and markup are similar, the markups for bidder firms are generally negative. The average for the main
sample is -1.0%. The most negative bidder markups are for unsuccessful takeovers (-5.3%), for cases with
foreshadowing news (-3.7%), for auctions (-3.5%), for mergers (-3.4%), and for all-equity deals (-4.5%). To the extent
that deal characteristics such as auctions are unanticipated at the time of the first bid, the bidder markups reflect negative
information that was not known during the runup period.
In general, the results in table 9 do not show much relation between the behavior of the bidder’s stock price
during the runup period and the target’s stock price during the markup period. Of course, to the extent that the
implications of the transaction for the value of the bidder firm are small in proportion to its capitalization, this test would
have low power. Also, it is plausible that some investors might infer information about the probability that a given firm
is likely to become a target, without learning who the bidder might be.
4.6. Effects of target runup on the bidder’s stock price
As mentioned in section 2.1, Roll’s (1986) hubris hypothesis predicts that bidder managers will sometimes
pursue takeover success even when the price is too high. To the extent that pre-bid runup in the target’s stock price
reflects the bidder’s own information, bidders who do not adjust their bidding strategy to substitute a lower markup
could suffer from a form of hubris (Michael Bradley calls this the “Punxsutawney Phil effect” -- the bidder is afraid of
his own shadow). To test for hubris, table 10 shows regressions of the premium (runup plus markup) for the first
bidders on the runup for the bidders and the runup for the target stock,
Premiumib = a + b Runupib + c Runupi + ui. (13)
Estimates of b greater than one (less than one) imply a positive (negative) relation between the bidder’s runup and
markup. Estimates of c should be less than zero if a large runup in the target’s stock price is related to a drop in the
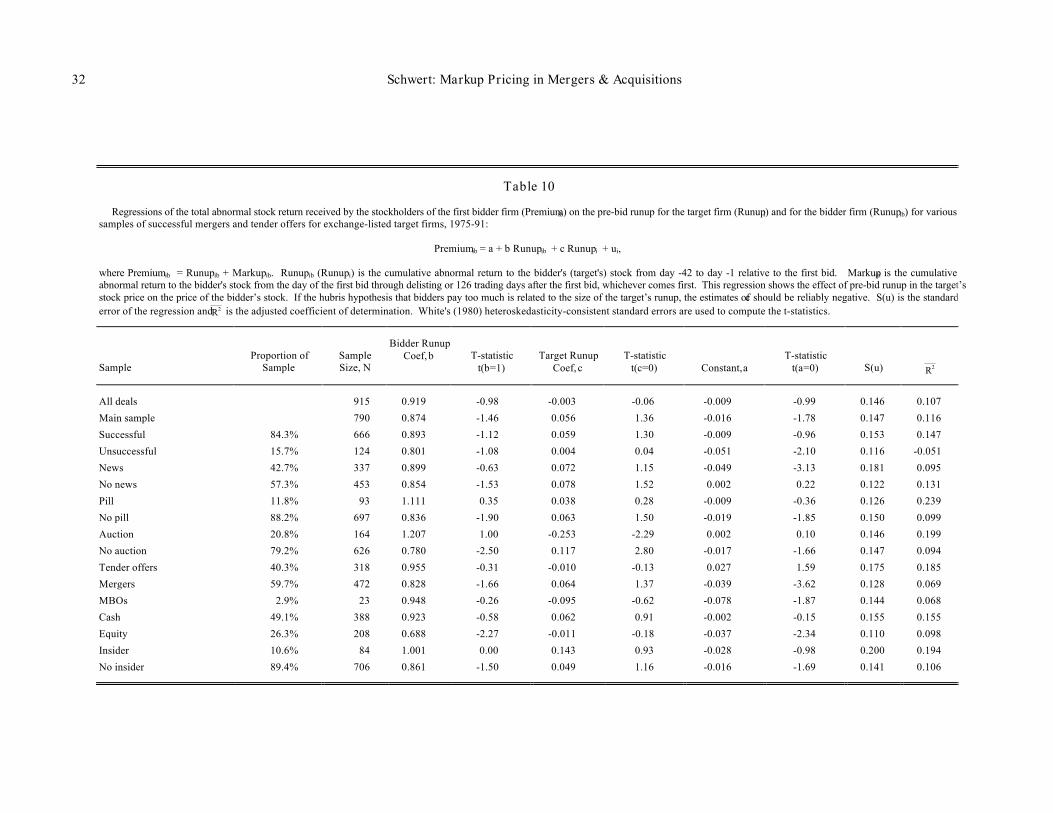
32 Schwert: Markup Pricing in Mergers & Acquisitions
Table 10
Regressions of the total abnormal stock return received by the stockholders of the first bidder firm (Premiumib) on the pre-bid runup for the target firm (Runupi) and for the bidder firm (Runupib) for varioussamples of successful mergers and tender offers for exchange-listed target firms, 1975-91:
Premiumib = a + b Runupib + c Runupi + ui,
where Premiumib = Runupib + Markupib. Runupib (Runupi) is the cumulative abnormal return to the bidder's (target's) stock from day -42 to day -1 relative to the first bid. Markupib is the cumulativeabnormal return to the bidder's stock from the day of the first bid through delisting or 126 trading days after the first bid, whichever comes first. This regression shows the effect of pre-bid runup in the target’sstock price on the price of the bidder’s stock. If the hubris hypothesis that bidders pay too much is related to the size of the target’s runup, the estimates of c should be reliably negative. S(u) is the standarderror of the regression and R2 is the adjusted coefficient of determination. White's (1980) heteroskedasticity-consistent standard errors are used to compute the t-statistics.
SampleProportion of
SampleSampleSize, N
Bidder RunupCoef, b T-statistic
t(b=1)Target Runup
Coef, cT-statistic
t(c=0) Constant, aT-statistic
t(a=0) S(u) R2
All deals 915 0.919 -0.98 -0.003 -0.06 -0.009 -0.99 0.146 0.107
Main sample 790 0.874 -1.46 0.056 1.36 -0.016 -1.78 0.147 0.116
Successful 84.3% 666 0.893 -1.12 0.059 1.30 -0.009 -0.96 0.153 0.147
Unsuccessful 15.7% 124 0.801 -1.08 0.004 0.04 -0.051 -2.10 0.116 -0.051
News 42.7% 337 0.899 -0.63 0.072 1.15 -0.049 -3.13 0.181 0.095
No news 57.3% 453 0.854 -1.53 0.078 1.52 0.002 0.22 0.122 0.131
Pill 11.8% 93 1.111 0.35 0.038 0.28 -0.009 -0.36 0.126 0.239
No pill 88.2% 697 0.836 -1.90 0.063 1.50 -0.019 -1.85 0.150 0.099
Auction 20.8% 164 1.207 1.00 -0.253 -2.29 0.002 0.10 0.146 0.199
No auction 79.2% 626 0.780 -2.50 0.117 2.80 -0.017 -1.66 0.147 0.094
Tender offers 40.3% 318 0.955 -0.31 -0.010 -0.13 0.027 1.59 0.175 0.185
Mergers 59.7% 472 0.828 -1.66 0.064 1.37 -0.039 -3.62 0.128 0.069
MBOs 2.9% 23 0.948 -0.26 -0.095 -0.62 -0.078 -1.87 0.144 0.068
Cash 49.1% 388 0.923 -0.58 0.062 0.91 -0.002 -0.15 0.155 0.155
Equity 26.3% 208 0.688 -2.27 -0.011 -0.18 -0.037 -2.34 0.110 0.098
Insider 10.6% 84 1.001 0.00 0.143 0.93 -0.028 -0.98 0.200 0.194
No insider 89.4% 706 0.861 -1.50 0.049 1.16 -0.016 -1.69 0.141 0.106
33 Schwert: Markup Pricing in Mergers & Acquisitions
bidder’s stock price after his bid is announced. The only subset for which this is true is the auction subsample, with a
target runup coefficient estimate of -0.253 (t-statistic of -2.29). When there is no auction, the estimate of c is 0.117 (t-
statistic of 2.80). Thus, the relation between the bidder’s markup and the target’s runup is conditioned on whether
additional bidders arise. There is little evidence to support the hubris hypothesis, in the sense that the stock market
punishes bidders who pay too much because of large target runups.
5. Specification analysis
5.1. Runup as an artifact of the size of the premium
One interpretation of the pre-bid runup is that it is the change in the probability of a takeover times the
premium that will be paid if a takeover occurs:
Runupi = ∆Probi • Premiumi. (14)
Suppose that the premium for target firms is determined exogenously and known to the market in advance, so that the
only uncertainty concerns whether a successful takeover will occur. In this scenario, the size of the premium determines
the size of the runup, and the regressions in tables 3 and 4 will reflect reverse causality.
As a specific example, suppose that a combination of legitimate and illegitimate sources of information causes
every deal to be anticipated with Prob i = 2 before the first bid. Then, from (14), every runup would be half as large as
the premium. The coefficient of runup in (5) will be (1/Prob), or two, however, and the post-bid markup will be
perfectly correlated with the pre-bid runup. However, the markup pricing hypothesis implies that the regression
coefficient on runup equals one and that the runup and the post-bid markup are uncorrelated. Appendix A shows that
with weaker assumptions about the probability of a takeover before the first bid (e.g., that it is random, but uncorrelated
with the size of the premium), the coefficient of runup in ( 5) will have a probability limit that is lower than [1/E(Prob i)]
but greater than one (i.e., runups and markups will be positively correlated).
5.2. The runup index
If the size of the premium was known a priori, the probability of a successful takeover, Prob i, could be
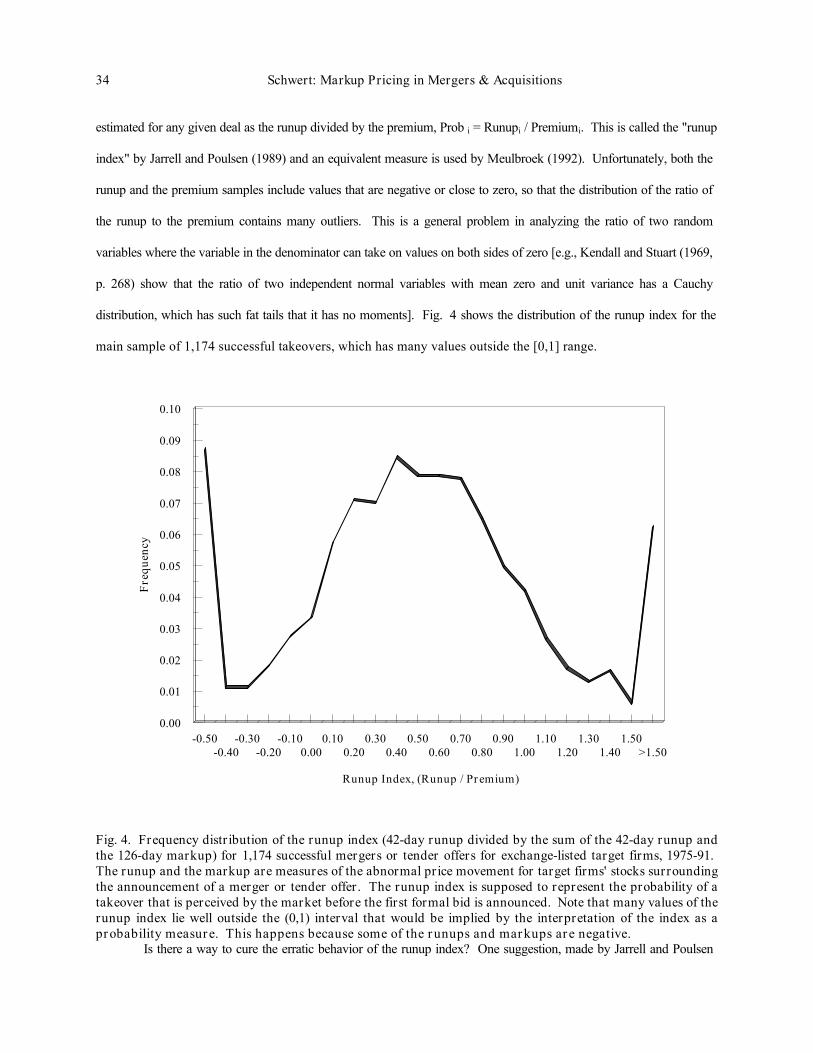
34 Schwert: Markup Pricing in Mergers & Acquisitions
estimated for any given deal as the runup divided by the premium, Prob i = Runupi / Premiumi. This is called the "runup
index" by Jarrell and Poulsen (1989) and an equivalent measure is used by Meulbroek (1992). Unfortunately, both the
runup and the premium samples include values that are negative or close to zero, so that the distribution of the ratio of
the runup to the premium contains many outliers. This is a general problem in analyzing the ratio of two random
variables where the variable in the denominator can take on values on both sides of zero [e.g., Kendall and Stuart (1969,
p. 268) show that the ratio of two independent normal variables with mean zero and unit variance has a Cauchy
distribution, which has such fat tails that it has no moments]. Fig. 4 shows the distribution of the runup index for the
main sample of 1,174 successful takeovers, which has many values outside the [0,1] range.
-0.50-0.40
-0.30-0.20
-0.100.00
0.100.20
0.300.40
0.500.60
0.700.80
0.901.00
1.101.20
1.301.40
1.50>1.50
Runup Index, (Runup / Premium)
0.00
0.01
0.02
0.03
0.04
0.05
0.06
0.07
0.08
0.09
0.10
Fre
quen
cy
Fig. 4. Frequency distribution of the runup index (42-day runup divided by the sum of the 42-day runup andthe 126-day markup) for 1,174 successful mergers or tender offers for exchange-listed target firms, 1975-91. The runup and the markup are measures of the abnormal price movement for target firms' stocks surroundingthe announcement of a merger or tender offer. The runup index is supposed to represent the probability of atakeover that is perceived by the market before the first formal bid is announced. Note that many values of therunup index lie well outside the (0,1) interval that would be implied by the interpretation of the index as aprobability measure. This happens because some of the runups and markups are negative.
Is there a way to cure the erratic behavior of the runup index? One suggestion, made by Jarrell and Poulsen
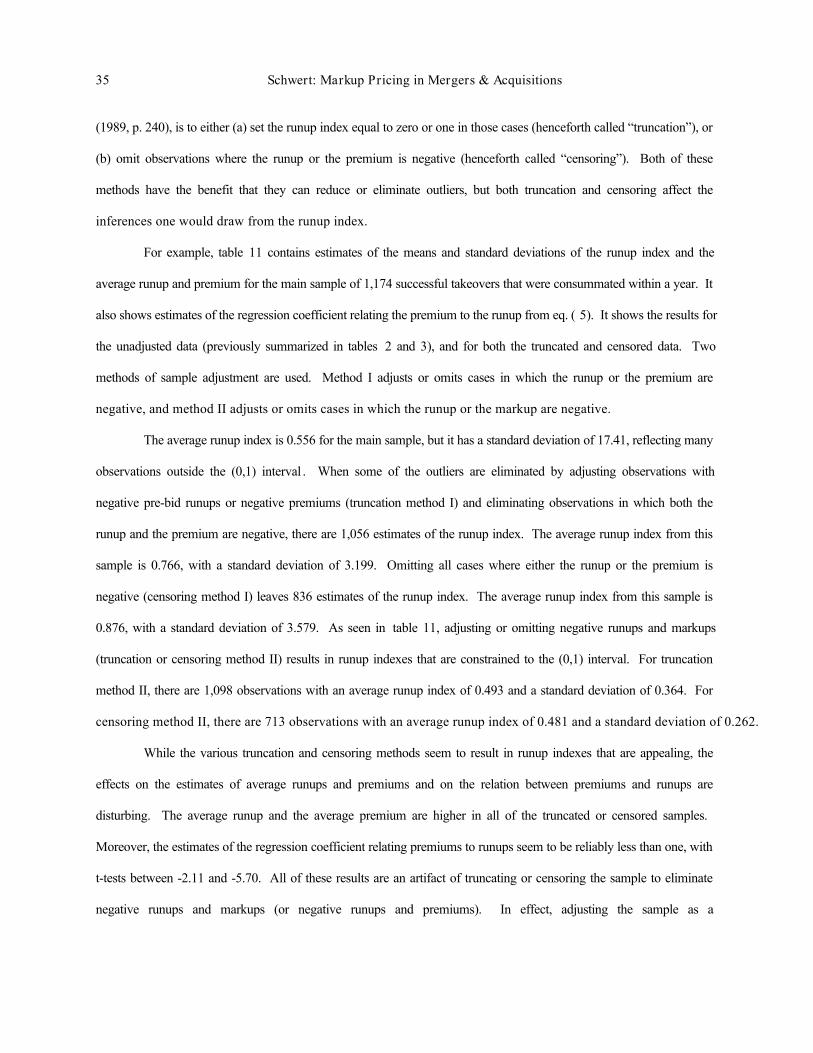
35 Schwert: Markup Pricing in Mergers & Acquisitions
(1989, p. 240), is to either (a) set the runup index equal to zero or one in those cases (henceforth called “truncation”), or
(b) omit observations where the runup or the premium is negative (henceforth called “censoring”). Both of these
methods have the benefit that they can reduce or eliminate outliers, but both truncation and censoring affect the
inferences one would draw from the runup index.
For example, table 11 contains estimates of the means and standard deviations of the runup index and the
average runup and premium for the main sample of 1,174 successful takeovers that were consummated within a year. It
also shows estimates of the regression coefficient relating the premium to the runup from eq. ( 5). It shows the results for
the unadjusted data (previously summarized in tables 2 and 3), and for both the truncated and censored data. Two
methods of sample adjustment are used. Method I adjusts or omits cases in which the runup or the premium are
negative, and method II adjusts or omits cases in which the runup or the markup are negative.
The average runup index is 0.556 for the main sample, but it has a standard deviation of 17.41, reflecting many
observations outside the (0,1) interval . When some of the outliers are eliminated by adjusting observations with
negative pre-bid runups or negative premiums (truncation method I) and eliminating observations in which both the
runup and the premium are negative, there are 1,056 estimates of the runup index. The average runup index from this
sample is 0.766, with a standard deviation of 3.199. Omitting all cases where either the runup or the premium is
negative (censoring method I) leaves 836 estimates of the runup index. The average runup index from this sample is
0.876, with a standard deviation of 3.579. As seen in table 11, adjusting or omitting negative runups and markups
(truncation or censoring method II) results in runup indexes that are constrained to the (0,1) interval. For truncation
method II, there are 1,098 observations with an average runup index of 0.493 and a standard deviation of 0.364. For
censoring method II, there are 713 observations with an average runup index of 0.481 and a standard deviation of 0.262.
While the various truncation and censoring methods seem to result in runup indexes that are appealing, the
effects on the estimates of average runups and premiums and on the relation between premiums and runups are
disturbing. The average runup and the average premium are higher in all of the truncated or censored samples.
Moreover, the estimates of the regression coefficient relating premiums to runups seem to be reliably less than one, with
t-tests between -2.11 and -5.70. All of these results are an artifact of truncating or censoring the sample to eliminate
negative runups and markups (or negative runups and premiums). In effect, adjusting the sample as a
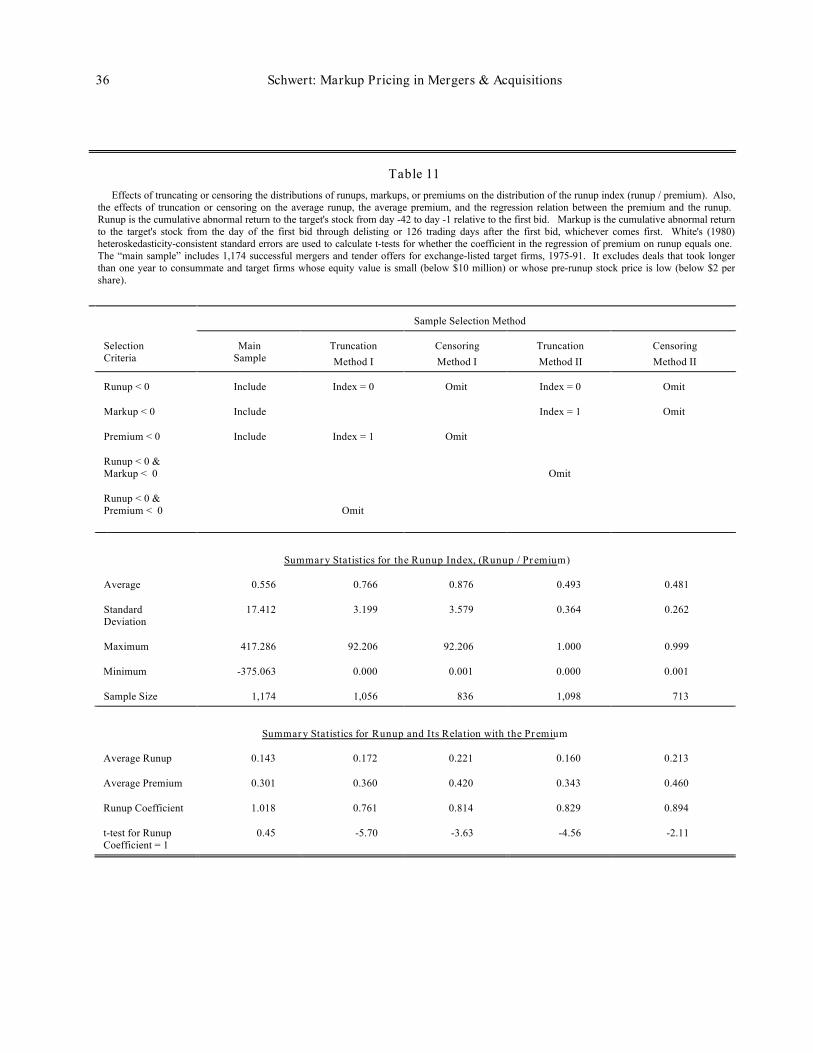
36 Schwert: Markup Pricing in Mergers & Acquisitions
Table 11 Effects of truncating or censoring the distributions of runups, markups, or premiums on the distribution of the runup index (runup / premium). Also,the effects of truncation or censoring on the average runup, the average premium, and the regression relation between the premium and the runup. Runup is the cumulative abnormal return to the target's stock from day -42 to day -1 relative to the first bid. Markup is the cumulative abnormal returnto the target's stock from the day of the first bid through delisting or 126 trading days after the first bid, whichever comes first. White's (1980)heteroskedasticity-consistent standard errors are used to calculate t-tests for whether the coefficient in the regression of premium on runup equals one. The “main sample” includes 1,174 successful mergers and tender offers for exchange-listed target firms, 1975-91. It excludes deals that took longerthan one year to consummate and target firms whose equity value is small (below $10 million) or whose pre-runup stock price is low (below $2 pershare).
Sample Selection Method
SelectionCriteria
MainSample
TruncationMethod I
CensoringMethod I
TruncationMethod II
CensoringMethod II
Runup < 0 Include Index = 0 Omit Index = 0 Omit
Markup < 0 Include Index = 1 Omit
Premium < 0 Include Index = 1 Omit
Runup < 0 &Markup < 0 Omit
Runup < 0 &Premium < 0 Omit
Summary Statistics for the Runup Index, (Runup / Premium)
Average 0.556 0.766 0.876 0.493 0.481
StandardDeviation
17.412 3.199 3.579 0.364 0.262
Maximum 417.286 92.206 92.206 1.000 0.999
Minimum -375.063 0.000 0.001 0.000 0.001
Sample Size 1,174 1,056 836 1,098 713
Summary Statistics for Runup and Its Relation with the Premium
Average Runup 0.143 0.172 0.221 0.160 0.213
Average Premium 0.301 0.360 0.420 0.343 0.460
Runup Coefficient 1.018 0.761 0.814 0.829 0.894
t-test for RunupCoefficient = 1
0.45 -5.70 -3.63 -4.56 -2.11
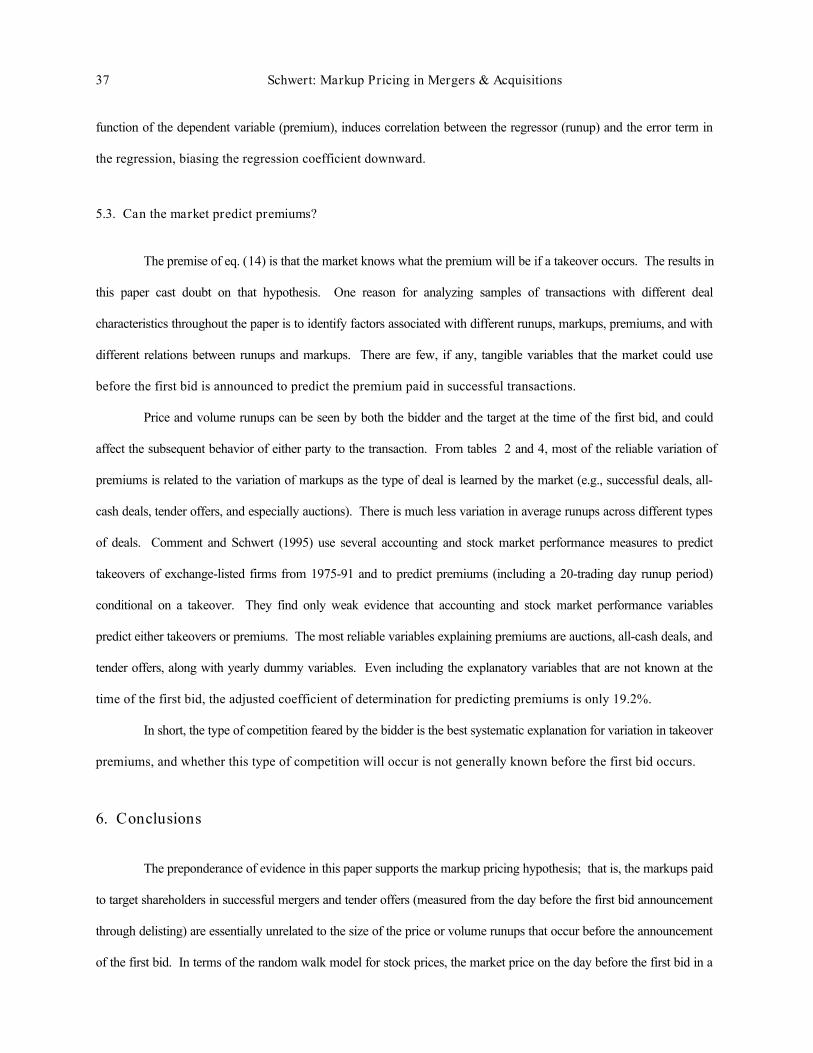
37 Schwert: Markup Pricing in Mergers & Acquisitions
function of the dependent variable (premium), induces correlation between the regressor (runup) and the error term in
the regression, biasing the regression coefficient downward.
5.3. Can the market predict premiums?
The premise of eq. (14) is that the market knows what the premium will be if a takeover occurs. The results in
this paper cast doubt on that hypothesis. One reason for analyzing samples of transactions with different deal
characteristics throughout the paper is to identify factors associated with different runups, markups, premiums, and with
different relations between runups and markups. There are few, if any, tangible variables that the market could use
before the first bid is announced to predict the premium paid in successful transactions.
Price and volume runups can be seen by both the bidder and the target at the time of the first bid, and could
affect the subsequent behavior of either party to the transaction. From tables 2 and 4, most of the reliable variation of
premiums is related to the variation of markups as the type of deal is learned by the market (e.g., successful deals, all-
cash deals, tender offers, and especially auctions). There is much less variation in average runups across different types
of deals. Comment and Schwert (1995) use several accounting and stock market performance measures to predict
takeovers of exchange-listed firms from 1975-91 and to predict premiums (including a 20-trading day runup period)
conditional on a takeover. They find only weak evidence that accounting and stock market performance variables
predict either takeovers or premiums. The most reliable variables explaining premiums are auctions, all-cash deals, and
tender offers, along with yearly dummy variables. Even including the explanatory variables that are not known at the
time of the first bid, the adjusted coefficient of determination for predicting premiums is only 19.2%.
In short, the type of competition feared by the bidder is the best systematic explanation for variation in takeover
premiums, and whether this type of competition will occur is not generally known before the first bid occurs.
6. Conclusions
The preponderance of evidence in this paper supports the markup pricing hypothesis; that is, the markups paid
to target shareholders in successful mergers and tender offers (measured from the day before the first bid announcement
through delisting) are essentially unrelated to the size of the price or volume runups that occur before the announcement
of the first bid. In terms of the random walk model for stock prices, the market price on the day before the first bid in a
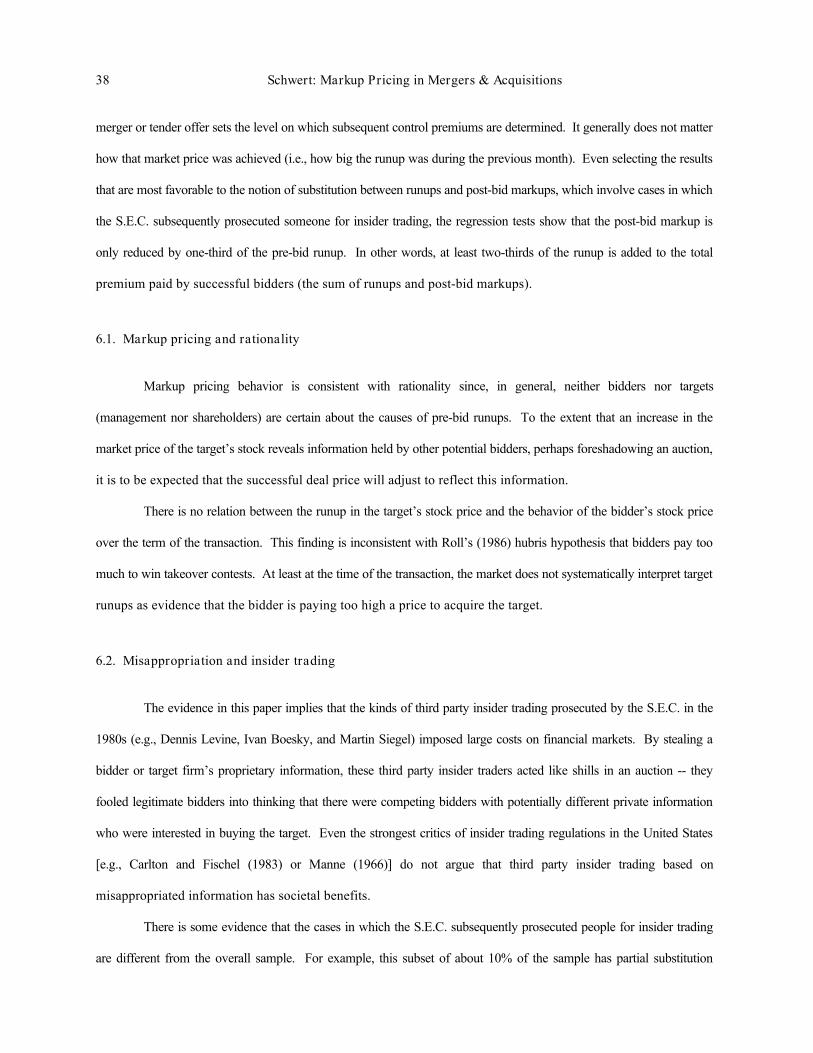
38 Schwert: Markup Pricing in Mergers & Acquisitions
merger or tender offer sets the level on which subsequent control premiums are determined. It generally does not matter
how that market price was achieved (i.e., how big the runup was during the previous month). Even selecting the results
that are most favorable to the notion of substitution between runups and post-bid markups, which involve cases in which
the S.E.C. subsequently prosecuted someone for insider trading, the regression tests show that the post-bid markup is
only reduced by one-third of the pre-bid runup. In other words, at least two-thirds of the runup is added to the total
premium paid by successful bidders (the sum of runups and post-bid markups).
6.1. Markup pricing and rationality
Markup pricing behavior is consistent with rationality since, in general, neither bidders nor targets
(management nor shareholders) are certain about the causes of pre-bid runups. To the extent that an increase in the
market price of the target’s stock reveals information held by other potential bidders, perhaps foreshadowing an auction,
it is to be expected that the successful deal price will adjust to reflect this information.
There is no relation between the runup in the target’s stock price and the behavior of the bidder’s stock price
over the term of the transaction. This finding is inconsistent with Roll’s (1986) hubris hypothesis that bidders pay too
much to win takeover contests. At least at the time of the transaction, the market does not systematically interpret target
runups as evidence that the bidder is paying too high a price to acquire the target.
6.2. Misappropriation and insider trading
The evidence in this paper implies that the kinds of third party insider trading prosecuted by the S.E.C. in the
1980s (e.g., Dennis Levine, Ivan Boesky, and Martin Siegel) imposed large costs on financial markets. By stealing a
bidder or target firm’s proprietary information, these third party insider traders acted like shills in an auction -- they
fooled legitimate bidders into thinking that there were competing bidders with potentially different private information
who were interested in buying the target. Even the strongest critics of insider trading regulations in the United States
[e.g., Carlton and Fischel (1983) or Manne (1966)] do not argue that third party insider trading based on
misappropriated information has societal benefits.
There is some evidence that the cases in which the S.E.C. subsequently prosecuted people for insider trading
are different from the overall sample. For example, this subset of about 10% of the sample has partial substitution
39 Schwert: Markup Pricing in Mergers & Acquisitions
between the pre-bid runup and the post-bid markup, and the pre-bid price and volume runups are unusually large for
these cases. Since the prosecutions are generally announced long after the deal is consummated, it seems that the market
can partially infer the existence of this insider trading before the S.E.C. becomes involved. This is consistent with the
results of Meulbroek (1992), who finds that much of the price movement during runup periods occurs on days when
insiders are trading. One interpretation is that insider trading occurs in a larger fraction of the cases, but the S.E.C. only
prosecutes when the effects on price and volume in the runup period are largest. To the extent that the market, and the
bidder and target management and stockholders, correctly infer that the runup is due to leakage of the bidder’s private
information, the costs of misappropriated information are lower.
The question of the appropriate remedy for insider trading based on misappropriated information is interesting
[see, for example, Hauch (1987) and Warren (1987)]. If bidders end up paying a higher premium to all target
shareholders than they would otherwise, the costs borne by the bidder are generally much larger than the profits realized
by the people trading on inside information. The history of the civil litigation to date suggests that it is difficult to
identify defendants with sufficient resources and sufficient guilt to warrant protracted litigation.
6.3. What determines the outcome of takeover negotiations?
The results in this paper raise a general question about the role played by the market in affecting the outcome of
takeover negotiations. In particular, if the market price of the target stock rises, how does that affect the bargaining
strategies of the bidder and the target? Tracking the history of offers and counteroffers as the market price of the target
firm changes would be an interesting way to examine this question. It would also be interesting to study the changes, if
any, in the valuations of the target firm by investment bankers representing both the bidder and the target as the market
price of the target firm changes. DeAngelo (1990) and Kaplan and Ruback (1995) study the valuation analyses
performed by investment bankers as part of the fairness opinions justifying the terms of negotiated takeovers, but I am
not aware of anyone who has studied a time series of valuations concerning a specific transaction during a period when
the target’s stock price rose substantially.
Grossman and Hart (1980) argue that target firms should acquire a toehold position before commencing a
tender offer so that the bidder can acquire some target shares at non-premium prices. On the other hand, many bidders
do not acquire any target shares before commencing an offer, presumably because they fear that such pre-bid

40 Schwert: Markup Pricing in Mergers & Acquisitions
accumulations will raise the eventual cost of a successful takeover. The essence of the argument between these positions
is whether any pre-bid runup caused by the bidder’s accumulation of target shares raises the eventual price that must be
paid for the target firm. The evidence in this paper suggests that, all else equal, the runup is an added cost to the bidder.
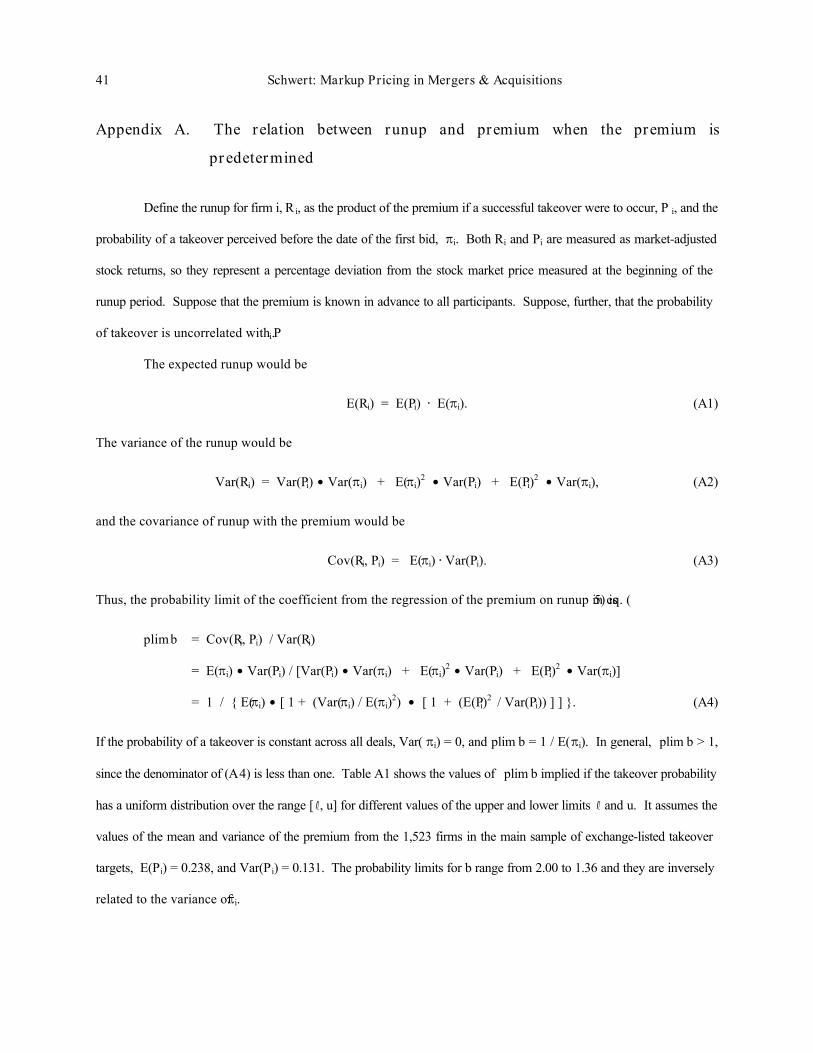
41 Schwert: Markup Pricing in Mergers & Acquisitions
Appendix A. The relation between runup and premium when the premium is
predetermined
Define the runup for firm i, R i, as the product of the premium if a successful takeover were to occur, P i, and the
probability of a takeover perceived before the date of the first bid, Bi. Both Ri and Pi are measured as market-adjusted
stock returns, so they represent a percentage deviation from the stock market price measured at the beginning of the
runup period. Suppose that the premium is known in advance to all participants. Suppose, further, that the probability
of takeover is uncorrelated with Pi.
The expected runup would be
E(Ri) = E(Pi) @ E(Bi). (A1)
The variance of the runup would be
Var(Ri) = Var(Pi) $ Var(Bi) + E(Bi)2 $ Var(Pi) + E(Pi)2 $ Var(Bi), (A2)
and the covariance of runup with the premium would be
Cov(Ri, Pi) = E(Bi) @ Var(Pi). (A3)
Thus, the probability limit of the coefficient from the regression of the premium on runup in eq. (5) is
plim b = Cov(Ri, Pi) / Var(Ri)
= E(Bi) $ Var(Pi) / [Var(Pi) $ Var(Bi) + E(Bi)2 $ Var(Pi) + E(Pi)2 $ Var(Bi)]
= 1 / { E(Bi) $ [ 1 + (Var(Bi) / E(Bi)2) $ [ 1 + (E(Pi)2 / Var(Pi)) ] ] }. (A4)
If the probability of a takeover is constant across all deals, Var( Bi) = 0, and plim b = 1 / E(Bi). In general, plim b > 1,
since the denominator of (A4) is less than one. Table A1 shows the values of plim b implied if the takeover probability
has a uniform distribution over the range [ R, u] for different values of the upper and lower limits R and u. It assumes the
values of the mean and variance of the premium from the 1,523 firms in the main sample of exchange-listed takeover
targets, E(Pi) = 0.238, and Var(Pi) = 0.131. The probability limits for b range from 2.00 to 1.36 and they are inversely
related to the variance of Bi.
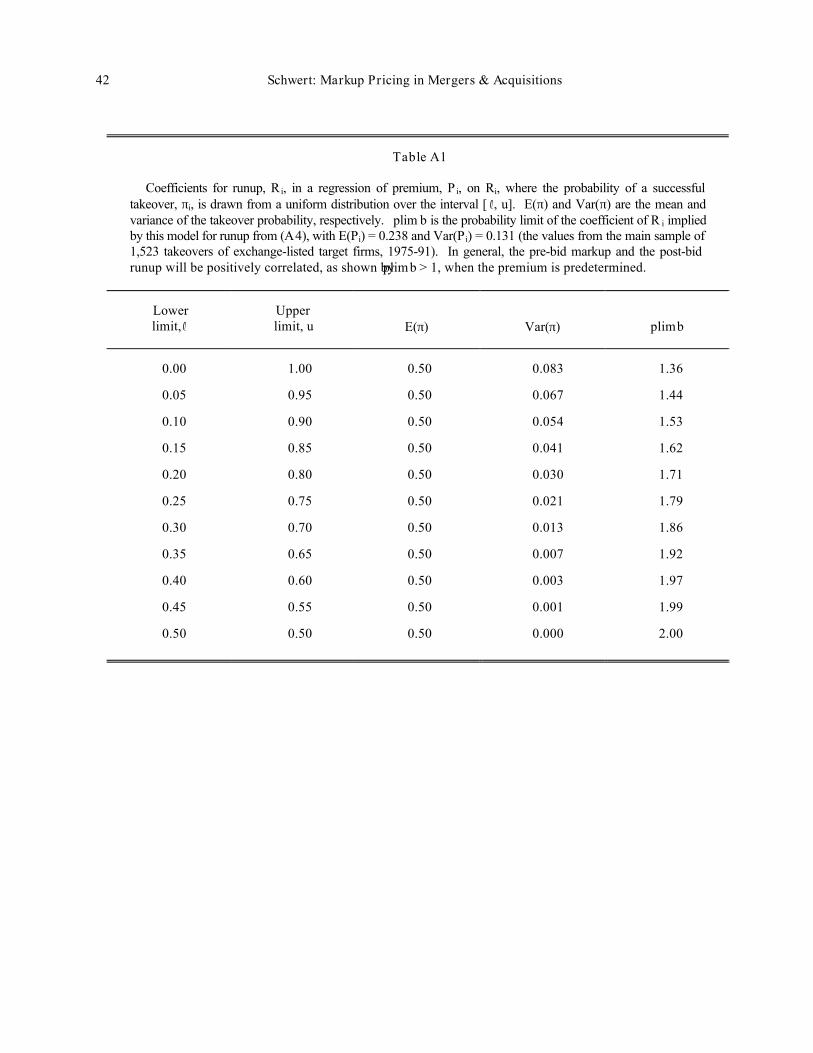
42 Schwert: Markup Pricing in Mergers & Acquisitions
Table A1
Coefficients for runup, R i, in a regression of premium, P i, on Ri, where the probability of a successfultakeover, πi, is drawn from a uniform distribution over the interval [ R, u]. E(π) and Var(π) are the mean andvariance of the takeover probability, respectively. plim b is the probability limit of the coefficient of R i impliedby this model for runup from (A4), with E(Pi) = 0.238 and Var(Pi) = 0.131 (the values from the main sample of1,523 takeovers of exchange-listed target firms, 1975-91). In general, the pre-bid markup and the post-bidrunup will be positively correlated, as shown by plim b > 1, when the premium is predetermined.
Lowerlimit, R
Upperlimit, u E(π) Var(π) plim b
0.00 1.00 0.50 0.083 1.36
0.05 0.95 0.50 0.067 1.44
0.10 0.90 0.50 0.054 1.53
0.15 0.85 0.50 0.041 1.62
0.20 0.80 0.50 0.030 1.71
0.25 0.75 0.50 0.021 1.79
0.30 0.70 0.50 0.013 1.86
0.35 0.65 0.50 0.007 1.92
0.40 0.60 0.50 0.003 1.97
0.45 0.55 0.50 0.001 1.99
0.50 0.50 0.50 0.000 2.00
43 Schwert: Markup Pricing in Mergers & Acquisitions
References
Arshadi, N. and T. H. Eyssell, 1991, Regulatory deterrence and registered insider trading: The case of tender offers,
Financial Management 20, 30-39.
Ashenfelter, Orley, 1989, How auctions work for wine and art, Journal of Economic Perspectives 3, 23-36.
Asquith, Paul, 1983, Merger bids, uncertainty, and stockholder returns, Journal of Financial Economics 11, 51-83.
Ball, Ray, S. P. Kothari, and Jay Shanken, 1995, Problems in measuring portfolio performance: An application to
contrarian investment strategies, Journal of Financial Economics 38, 79-107.
Barclay, Michael J. and Jerold B. Warner, 1993, Stealth trading and volatility: Which trades move prices?, Journal of
Financial Economics 34, 281-305.
Boesky, Ivan F., 1985, Merger mania (Holt, Rinehart and Winston, New York, NY).
Bradley, Michael, Anand Desai, and E. Han Kim, 1983, The rationale behind interfirm tender offers: Information or
synergy?, Journal of Financial Economics 11, 183-206.
Bradley, Michael, Anand Desai, and E. Han Kim, 1988, Synergistic gains from corporate acquisitions and their division
between the stockholders of target and acquiring firms, Journal of Financial Economics 21, 3-40.
Carlton, Dennis and Daniel Fischel, 1983, The regulation of insider trading, Stanford Law Review 35, 857-895.
Comment, Robert and G. William Schwert, 1995, Poison or placebo? Evidence on the deterrence and wealth effects of
modern antitakeover measures, Journal of Financial Economics 39, 3-43.
Cornell, Bradford and E. R. Sirri, 1992, The reaction of investors and stock prices to insider trading, Journal of Finance
47, 1031-1060.
DeAngelo, Linda, 1990, Equity valuation and corporate control, The Accounting Review 65, 93-112.
Dodd, Peter, 1980, Merger proposals, management discretion, and stockholder wealth, Journal of Financial Economics
8, 105-137.
Dodd, Peter and Richard S. Ruback, 1977, Tender offers and stockholder returns: An empirical analysis, Journal of
Financial Economics 5, 351-374.
Fama, Eugene F., 1970, Efficient capital markets: A review of theory and empirical work, Journal of Finance 25, 383-
417.
Grossman, Sanford J., 1976, On the efficiency of competitive stock markets where trades have diverse information,
Journal of Finance 31, 573-586.
Grossman, Sanford J., 1977, The existence of futures markets, noisy rational expectations and information externalities,
Review of Economic Studies 44, 431-449.
Grossman, Sanford J. and Oliver D. Hart, 1980, Takeover bids, the free-rider problem, and the theory of the corporation,
Bell Journal of Economics 11, 42-64.
Hauch, Jeanne M., 1987, Note: Insider trading by intermediaries: A contract remedy for acquirers’ increased cost of
takeovers, Yale Law Journal 97, 115-134.
Jarrell, Gregg A. and Annette B. Poulsen, 1989, Stock trading before the announcement of tender offers: Insider trading
or market anticipation?, Journal of Law, Economics, and Organization 5, 225-248.
44 Schwert: Markup Pricing in Mergers & Acquisitions
Jensen, Michael C. and Richard S. Ruback, 1983, The market for corporate control: The scientific evidence, Journal of
Financial Economics 11, 5-50.
Kaplan, Steven N. and Richard S. Ruback, 1995, The valuation of cash flow forecasts, Journal of Finance 50, 1059-
1093.
Manne, Henry, 1966, Insider trading and the stock market (Free Press, New York, NY).
McAfee, R. Preston and John McMillan, 1987, Auctions and bidding, Journal of Economic Literature 25, 699-738.
Meulbroek, Lisa K., 1992, An empirical analysis of illegal insider trading, Journal of Finance 47, 1661-1699.
Mikkelson, Wayne H. and Richard S. Ruback, 1985, An empirical analysis of the interfirm equity investment process,
Journal of Financial Economics 14, 523-553.
Milgrom, Paul, 1989, Auctions and bidding: A primer, Journal of Economic Perspectives 3, 3-22.
Pound, John and Richard Zeckhauser, 1990, Clearly heard on the street: The effect of takeover rumors on stock prices,
Journal of Business 63, 291-308.
Roll, Richard, 1986, The hubris hypothesis of corporate takeovers, Journal of Business 59, 197-216.
Rothkopf, Michael H. and Ronald M. Harstad, 1995, Two models of bid-taker cheating in Vickrey auctions, Journal of
Business 68, 257-267.
Stewart, James B., 1991, Den of thieves (Simon & Schuster, New York, NY).
Walkling, Ralph A. and Robert O. Edmister, 1985, Determinants of tender offer premiums, Financial Analysts Journal
41, 27-37.
White, Halbert, 1980, A heteroskedasticity-consistent covariance matrix estimator and a direct test for
heteroskedasticity, Econometrica 48, 817-838.
Warren, Manning Gilbert, 1987, Who’s suing who? A commentary on investment bankers and the misappropriation
theory, Maryland Law Review 46, 1222.