Embed Size (px)
Citation preview
MARTIN COUNTY, FLORIDA AND INCORPORATED AREAS
REVISED: March 16, 2015
Federal Emergency Management Agency FLOOD INSURANCE STUDY NUMBER
12085CV000B
Community Name Community Number
JUPITER ISLAND, TOWN OF 120162
MARTIN COUNTY
(UNINCORPORATED AREAS) 120161
OCEAN BREEZE, TOWN OF 120163
SEWALL’S POINT, TOWN OF 120164
STUART, CITY OF 120165
MARTIN COUNTY
i
NOTICE TO
FLOOD INSURANCE STUDY USERS
Communities participating in the National Flood Insurance Program have established repositories of flood
hazard data for floodplain management and flood insurance purposes. This Flood Insurance Study (FIS) may
not contain all data available within the repository. It is advisable to contact the community repository for any
additional data.
The Federal Emergency Management Agency (FEMA) may revise and republish part or all of this FIS report
at any time. In addition, part of this FIS may be revised by the Letter of Map Revision process, which does
not involve republication or redistribution of the FIS. It is, therefore, the responsibility of the user to consult
with community officials and to check the Community Map Repository to obtain the most current FIS
components.
Initial Countywide FIS Effective Date: October 4, 2002
First Revised Countywide FIS Effective Date: March 16, 2015
ii
TABLE OF CONTENTS
1.0 INTRODUCTION 1
1.1 Purpose of Study 1
1.2 Authority and Acknowledgments 1
1.3 Coordination 2
2.0 AREA STUDIED 3
2.1 Scope of Study 3
2.2 Community Description 4
2.3 Principal Flood Problems 5
2.4 Flood Protection Measures 9
3.0 ENGINEERING METHODS 10
3.1 Hydrologic Analyses 10
3.2 Hydraulic Analyses 14
3.3 Coastal Hydrologic Analyses 19
3.4 Coastal Hydraulic Analyses 20
3.5 Vertical Datum 31
4.0 FLOODPLAIN MANAGEMENT APPLICATIONS 32
4.1 Floodplain Boundaries 32
4.2 Floodways 33
5.0 INSURANCE APPLICATIONS 39
6.0 FLOOD INSURANCE RATE MAP 39
7.0 OTHER STUDIES 40
8.0 LOCATION OF DATA 40
9.0 REFERENCES AND BIBLIOGRAPHY 42
iii
TABLE OF CONTENTS - continued
FIGURES
Figure 1 – HHD Failure Rate (Events per Year) for Various Lake Okeechobee Lake Levels 17 Figure 2 – Transect Location Map 26 Figure 3 – Transect Location Map (Lake Okeechobee) 27 Figure 4 – Transect Schematic 28 Figure 5 – Floodway Schematic 34
TABLES
Table 1 – Detailed Study Streams 3
Table 2 – Summary of Discharges 12
Table 3 – Manning’s “n” Values 16 Table 4 – Allocated Failure Rate (Events per Year) for each Breach Simulation 18
Table 5 – Parameter Values for Surge Elevation in Martin County 22
Table 6 – Parameter Values for Surge Elevation in Lake Okeechobee 23
Table 7 – Summary of Stillwater Elevations 24 Table 8 – Transect Descriptions 29
Table 9 – Transect Data 31
Table 10 – Floodway Data Table 35 Table 11 – Community Map History 41
EXHIBITS
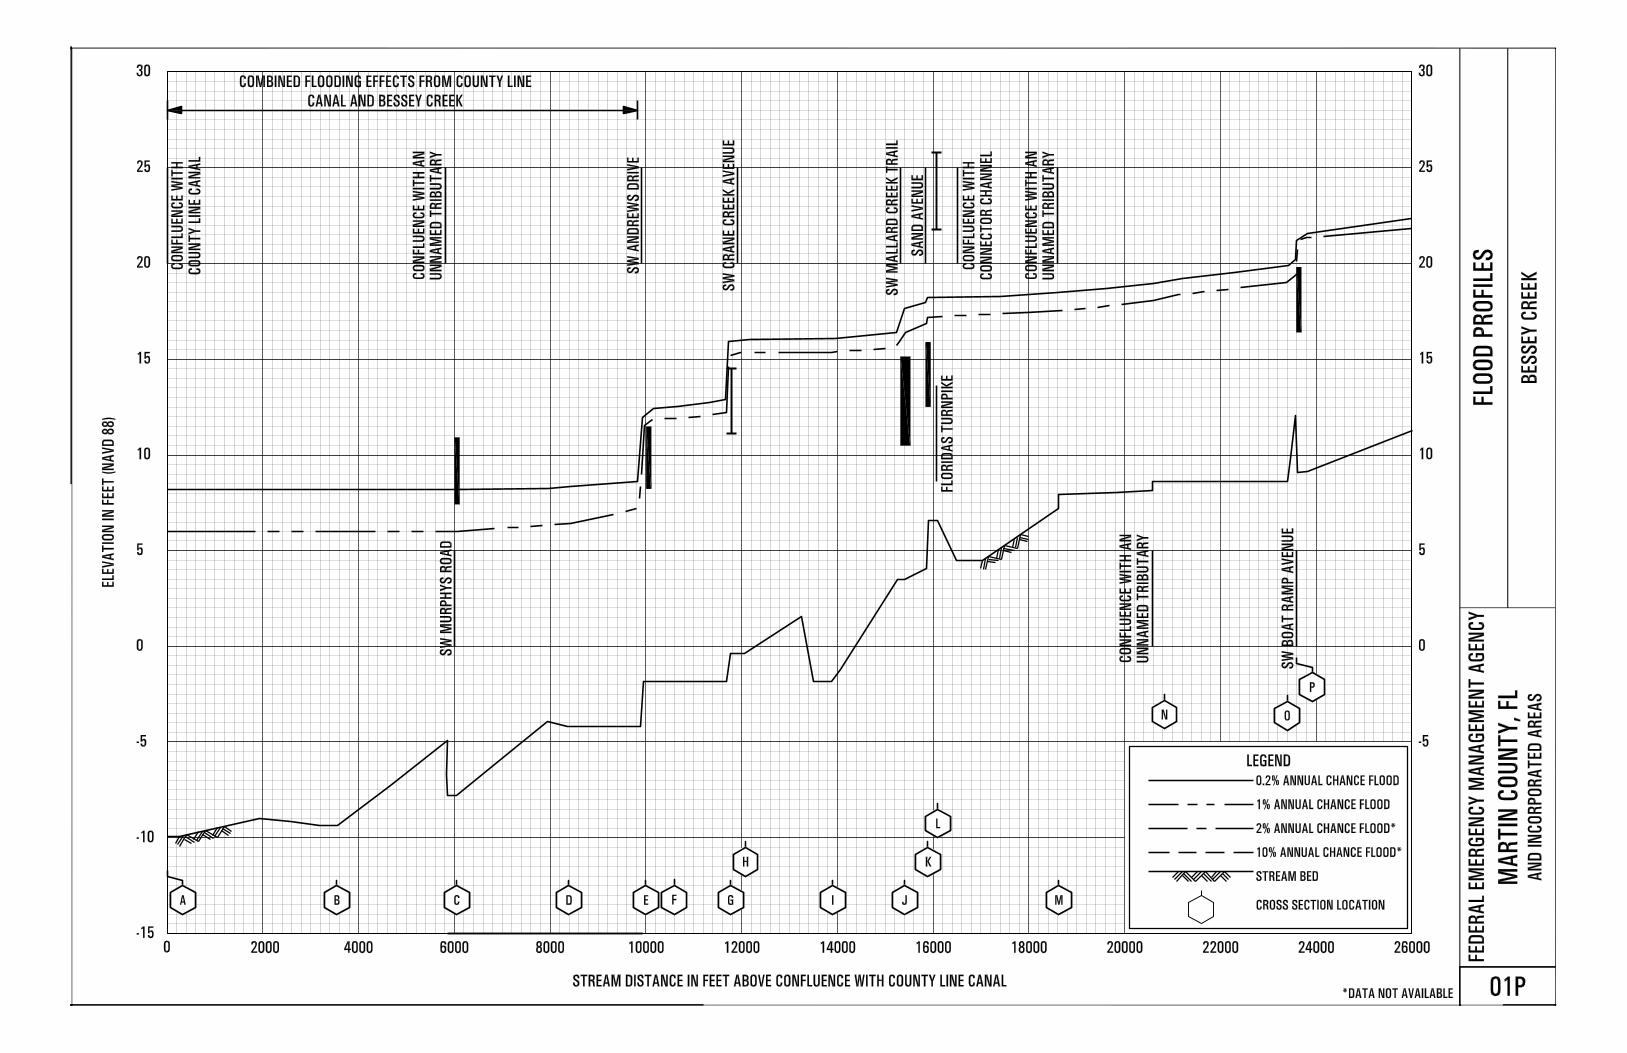
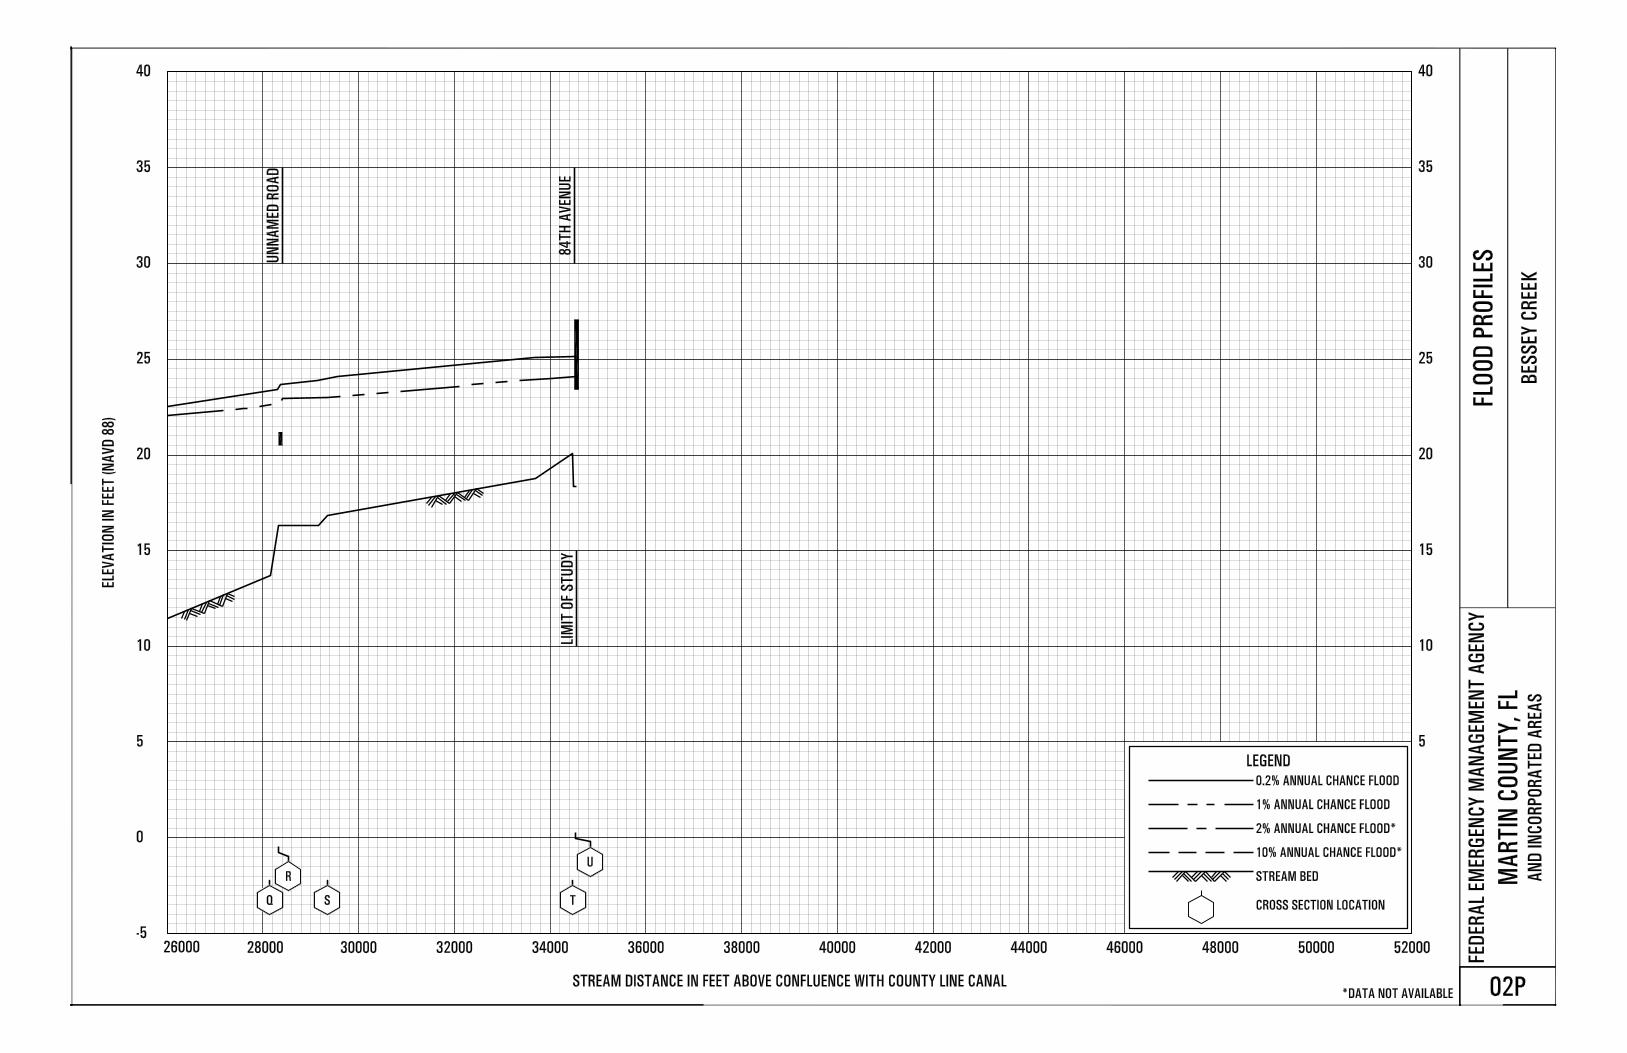
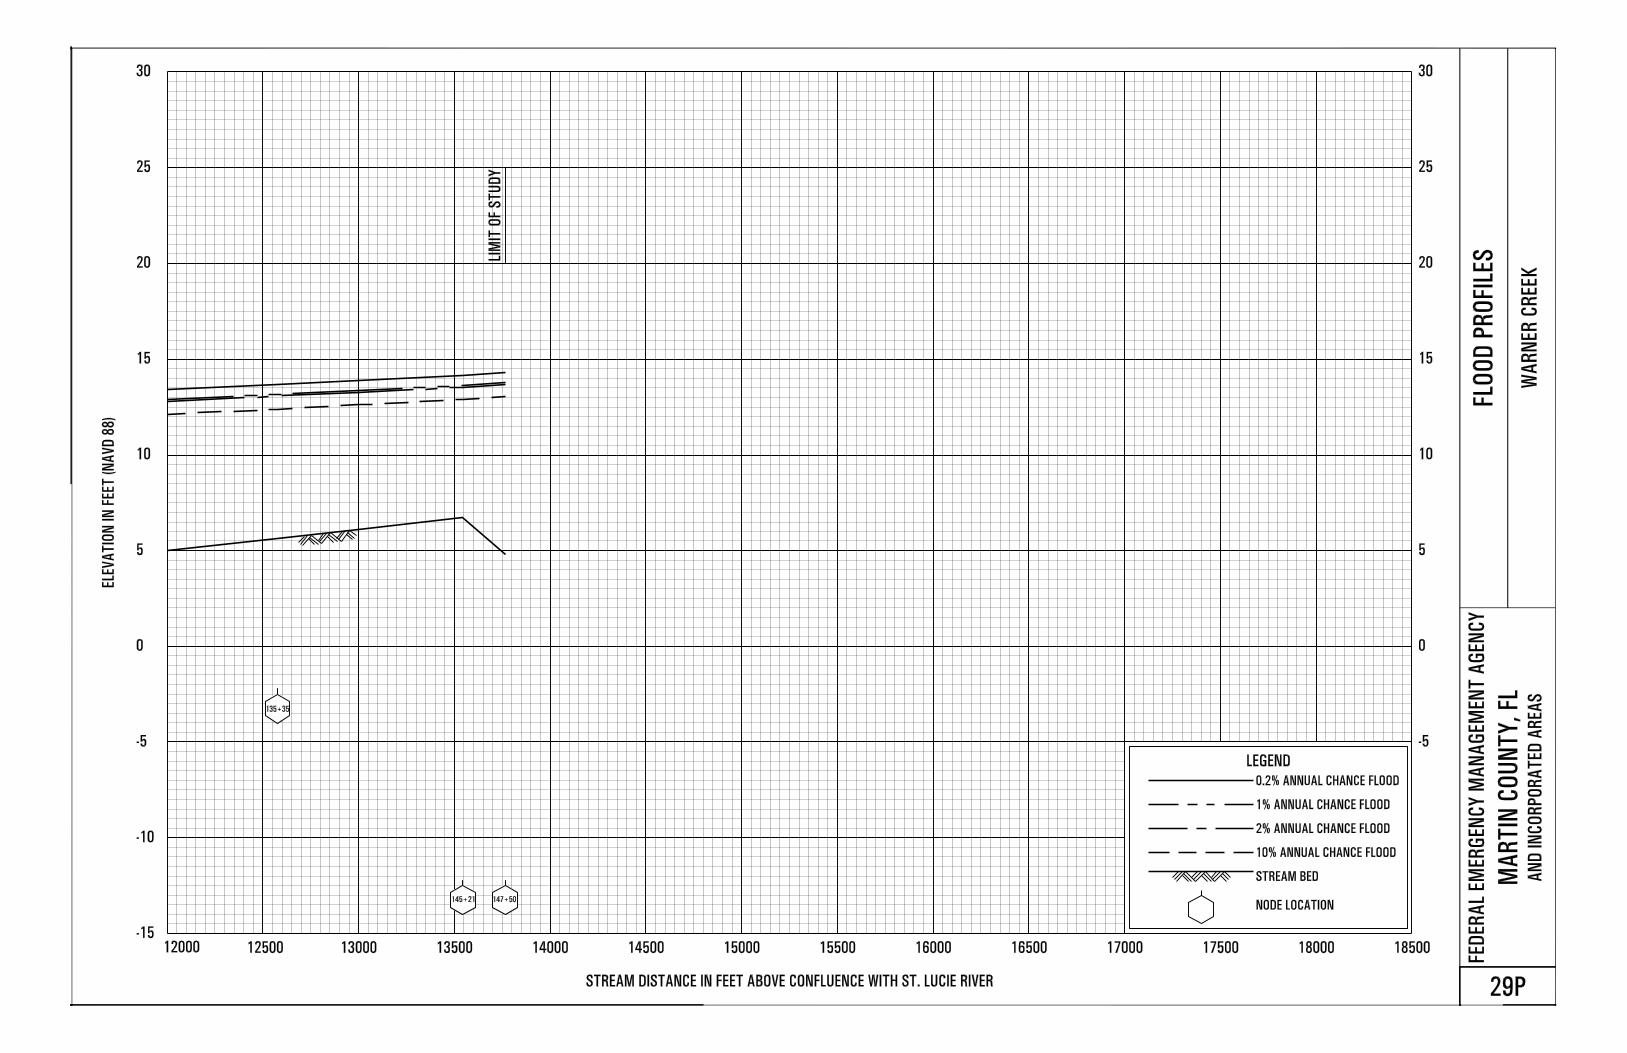
Exhibit 1 - Flood Profiles
Bessey Creek Panels 01P-02P
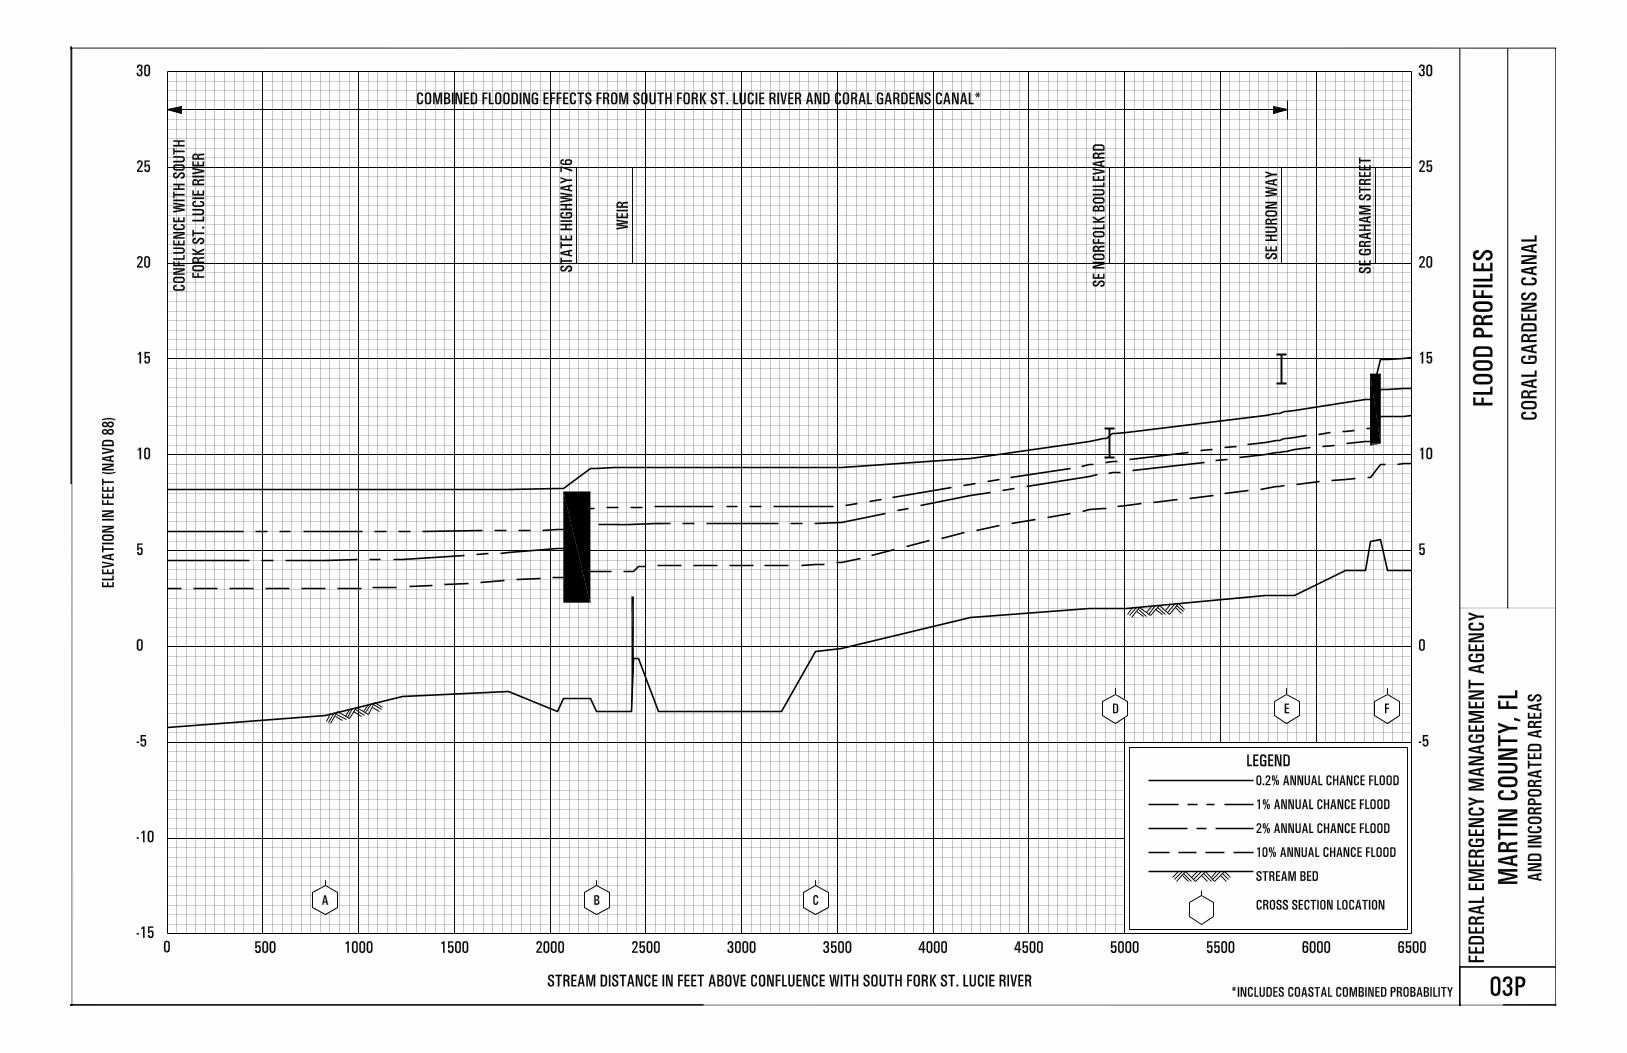
Coral Gardens Canal Panels 03P-04P
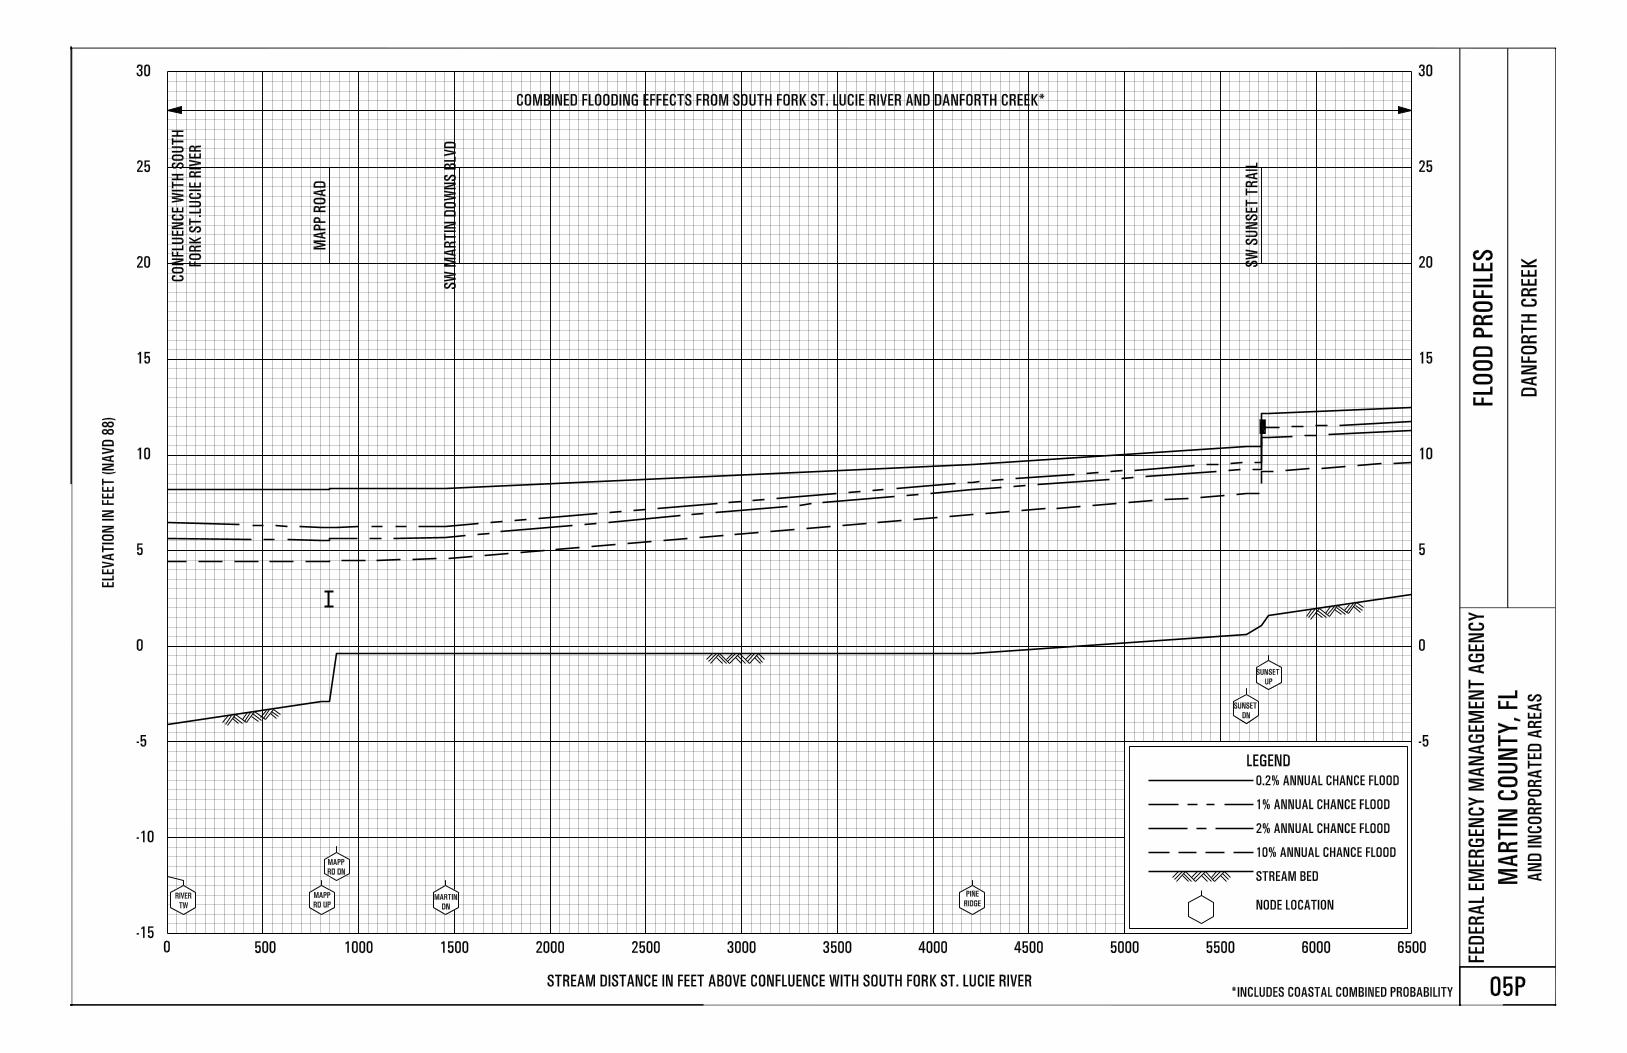
Danforth Creek Panels 05P-09P
East Fork Creek Panels 10P-11P
Fern Creek Panels 12P-13P
Loxahatchee River Panel 14P
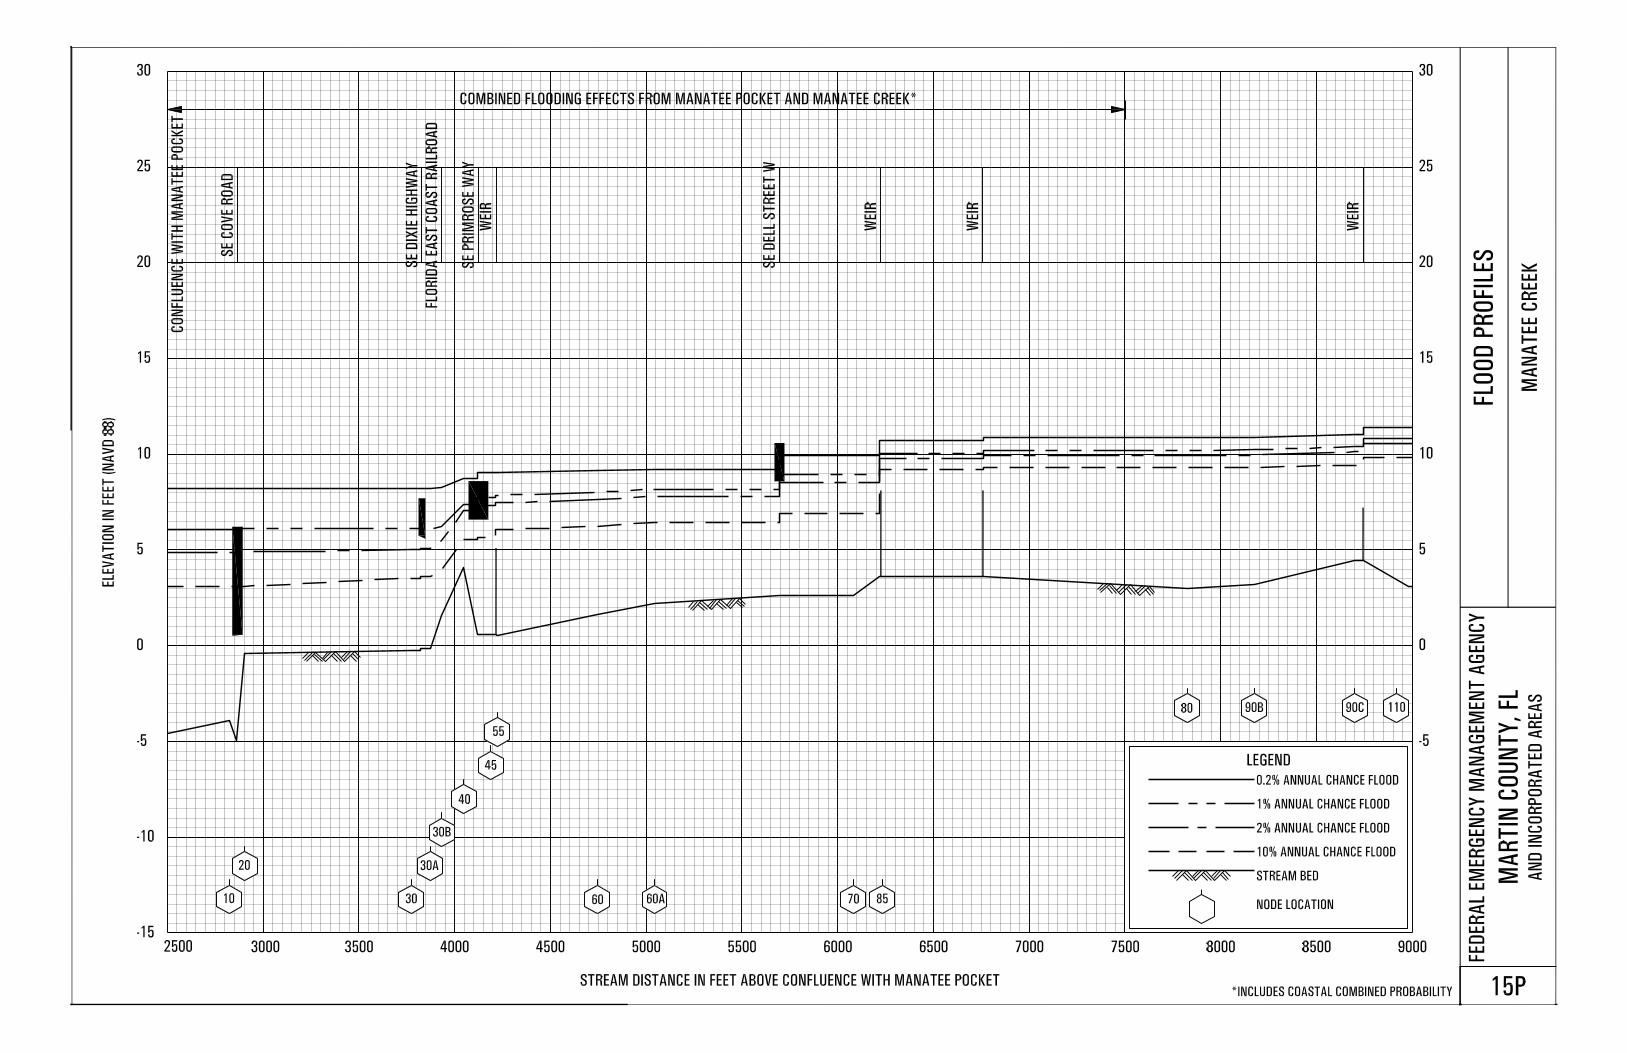
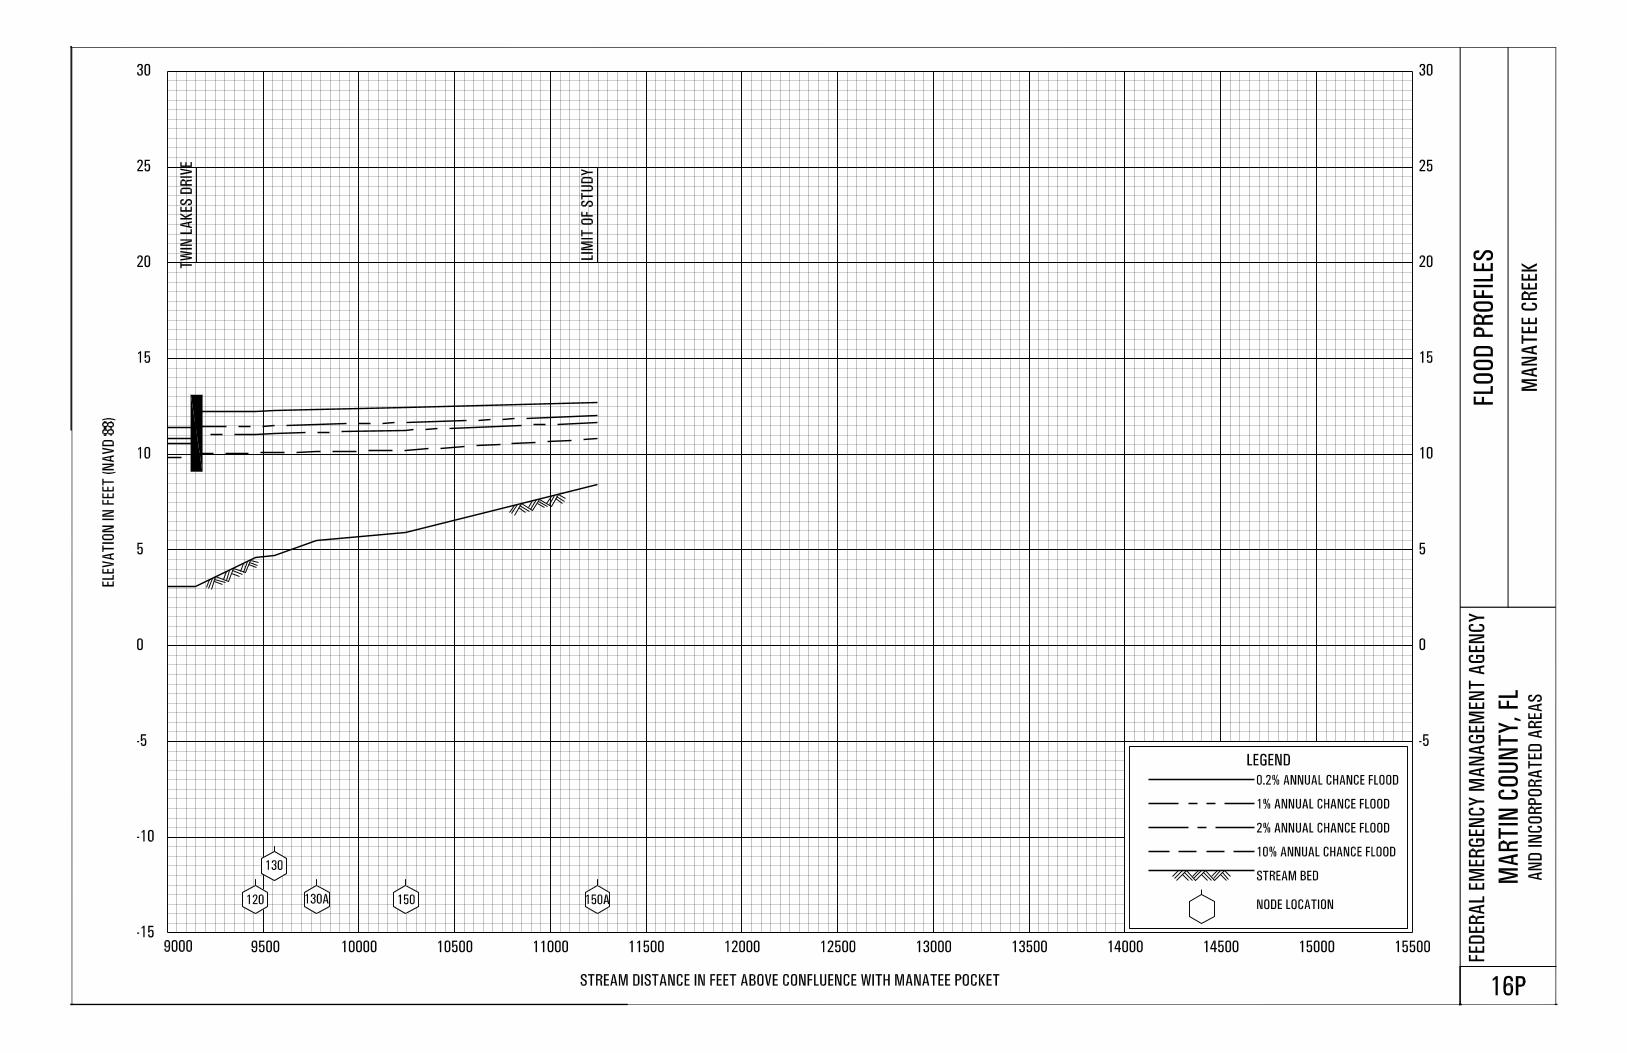
Manatee Creek Panels 15P-16P
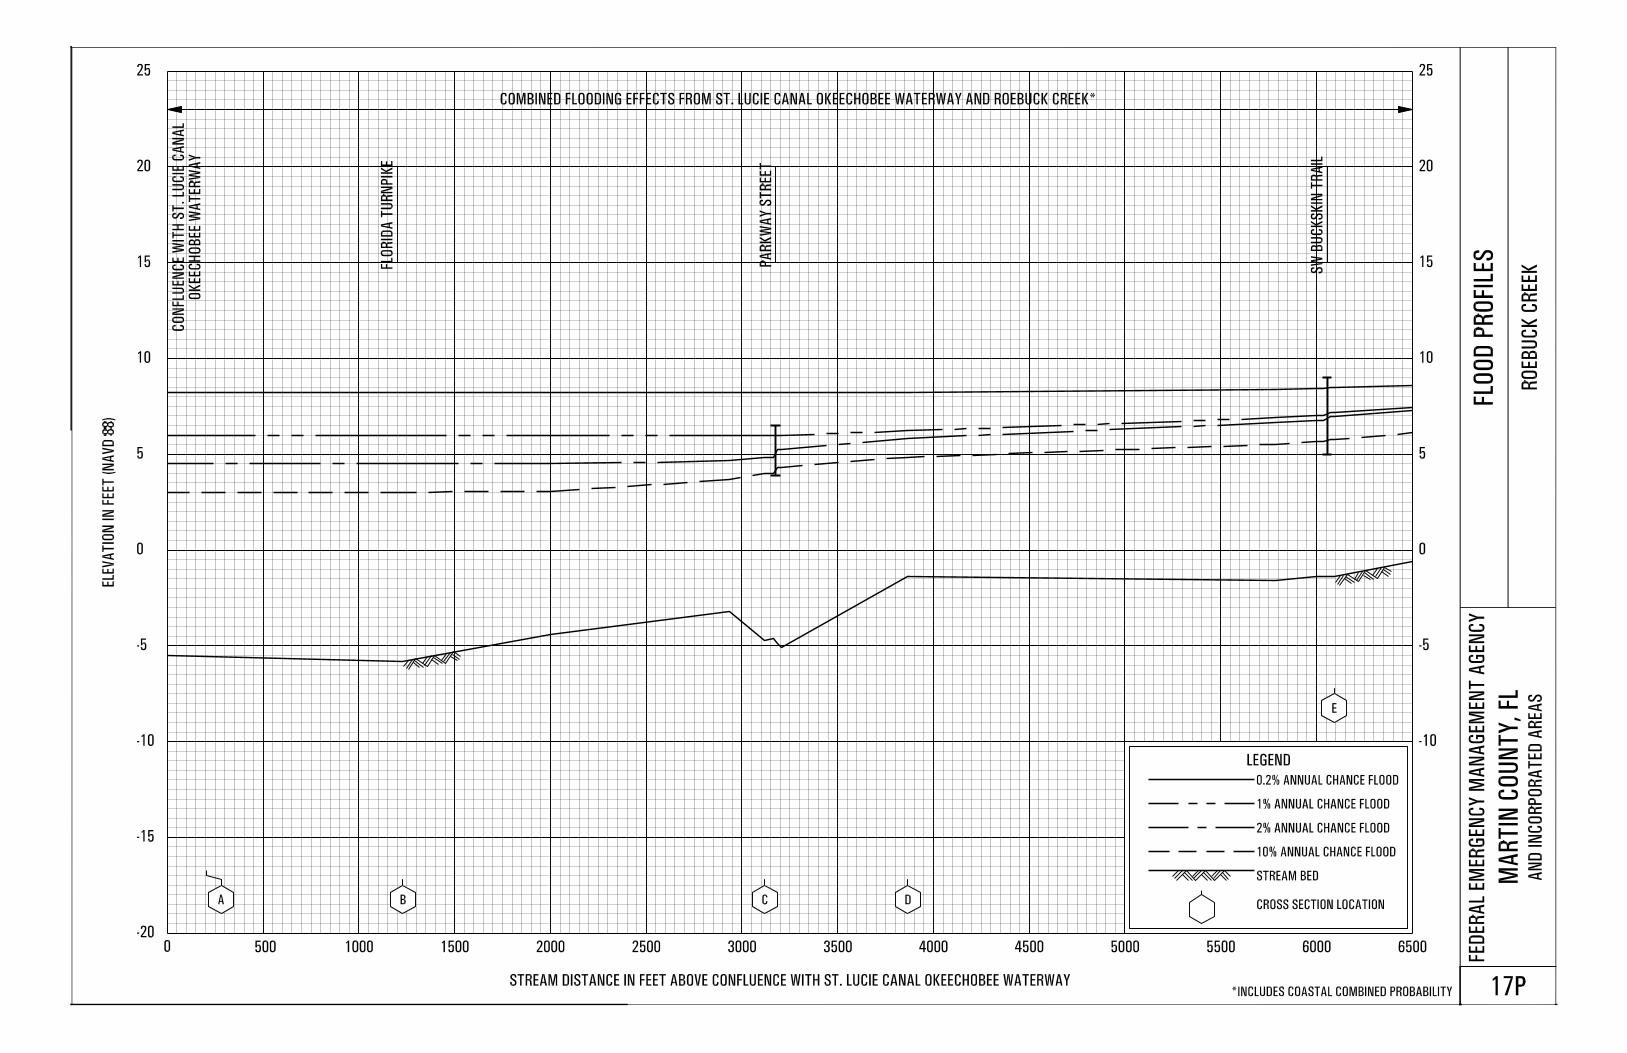
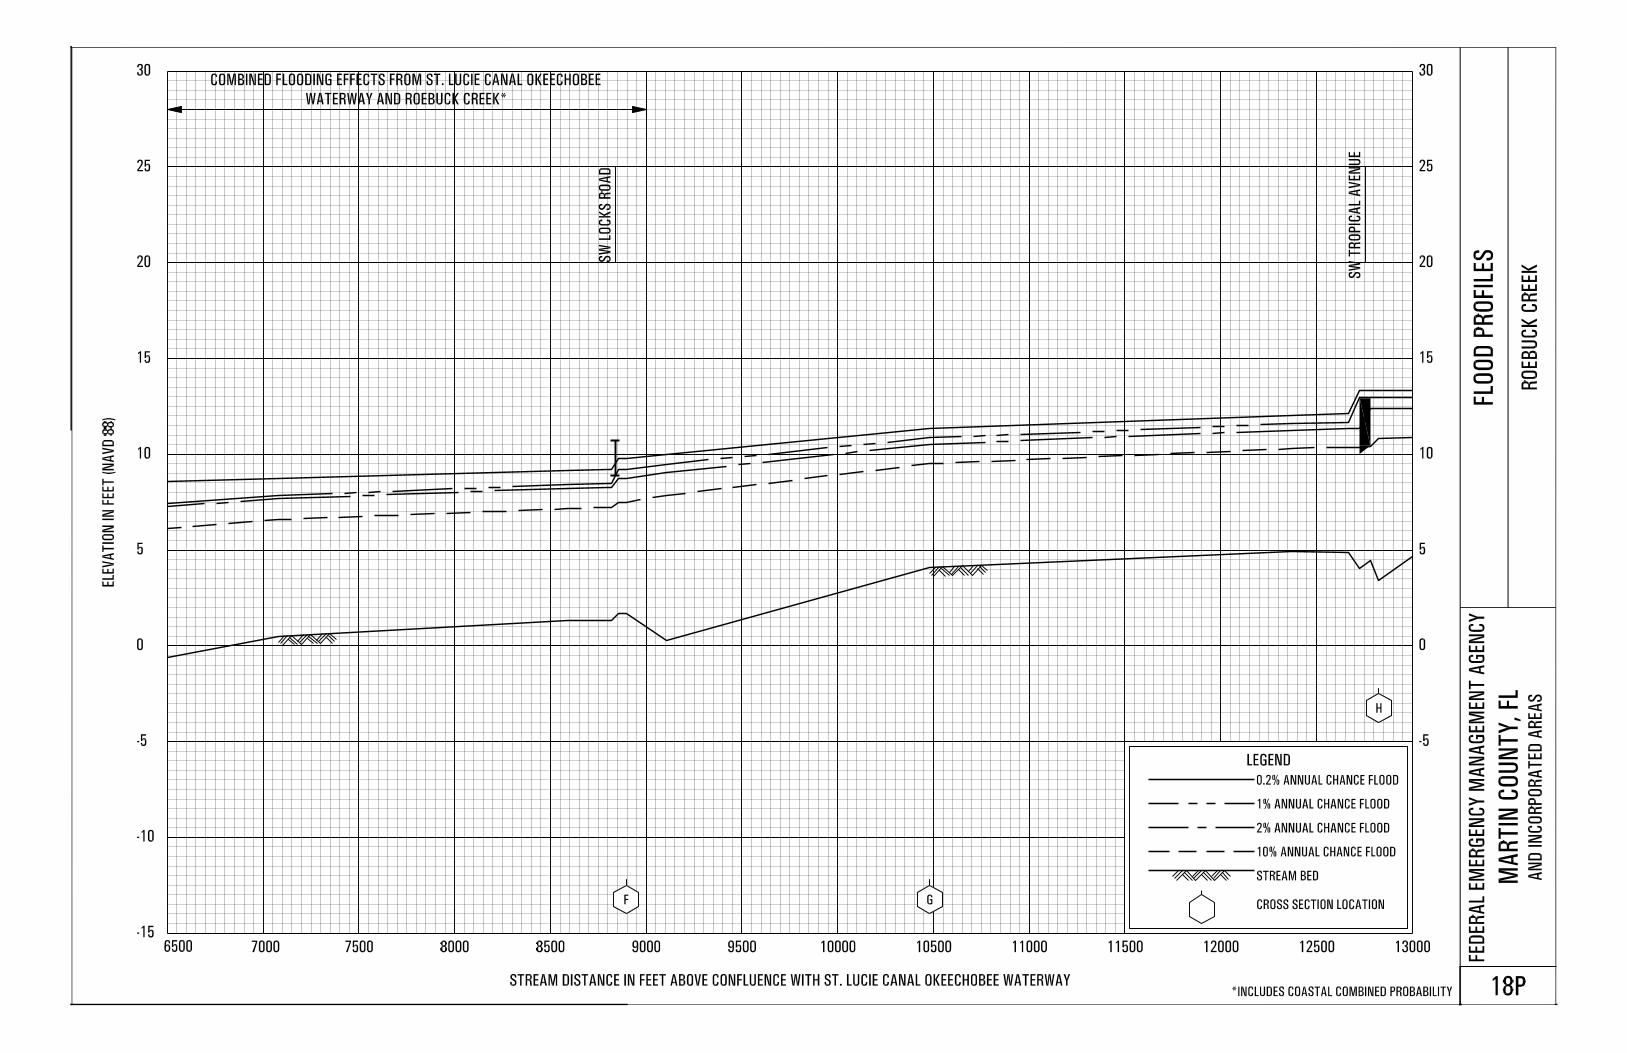
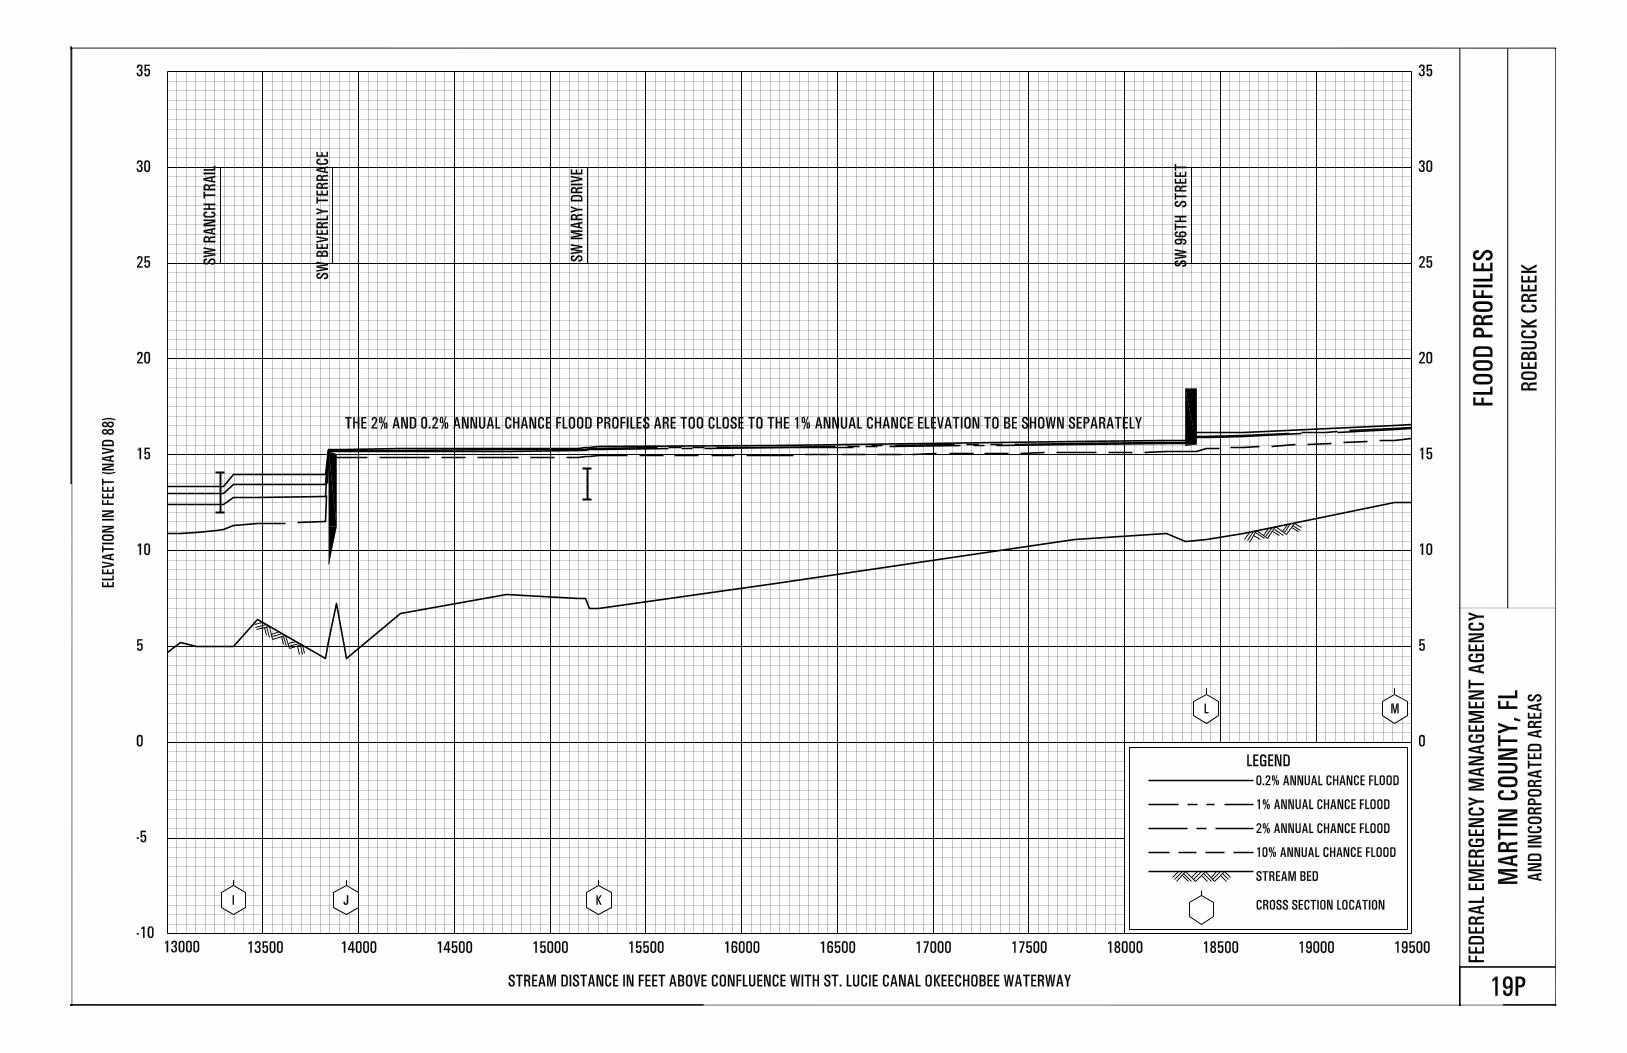
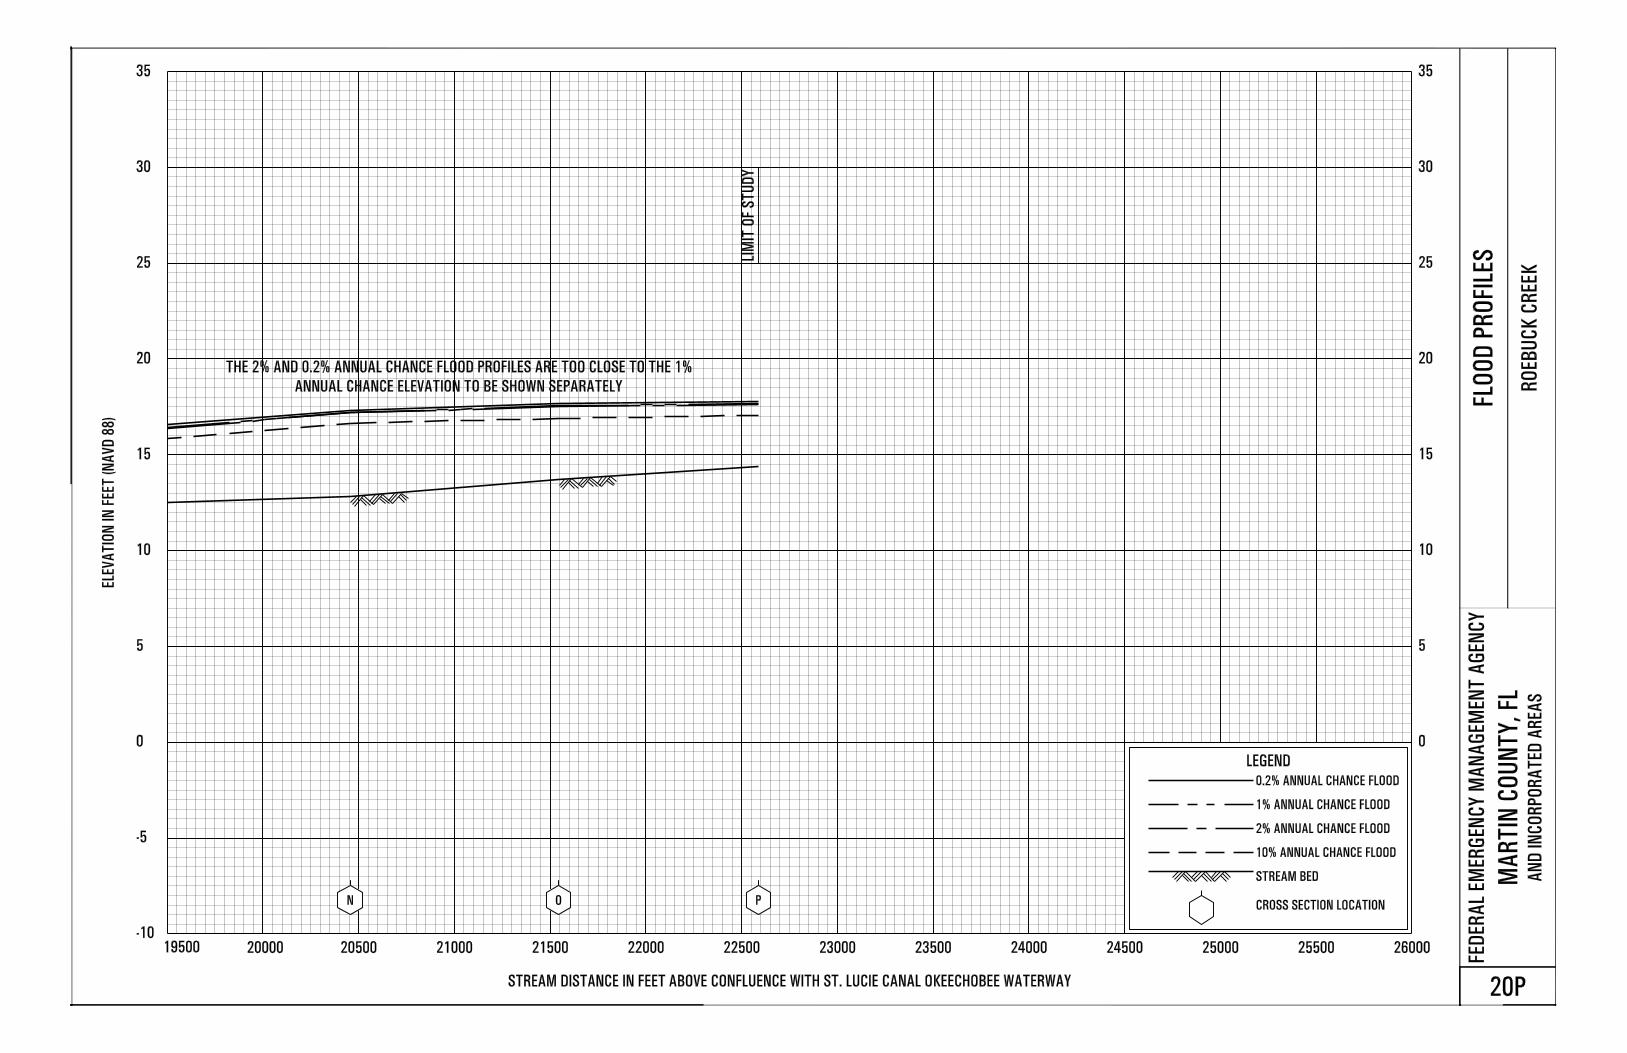
Roebuck Creek Panels 17P-20P
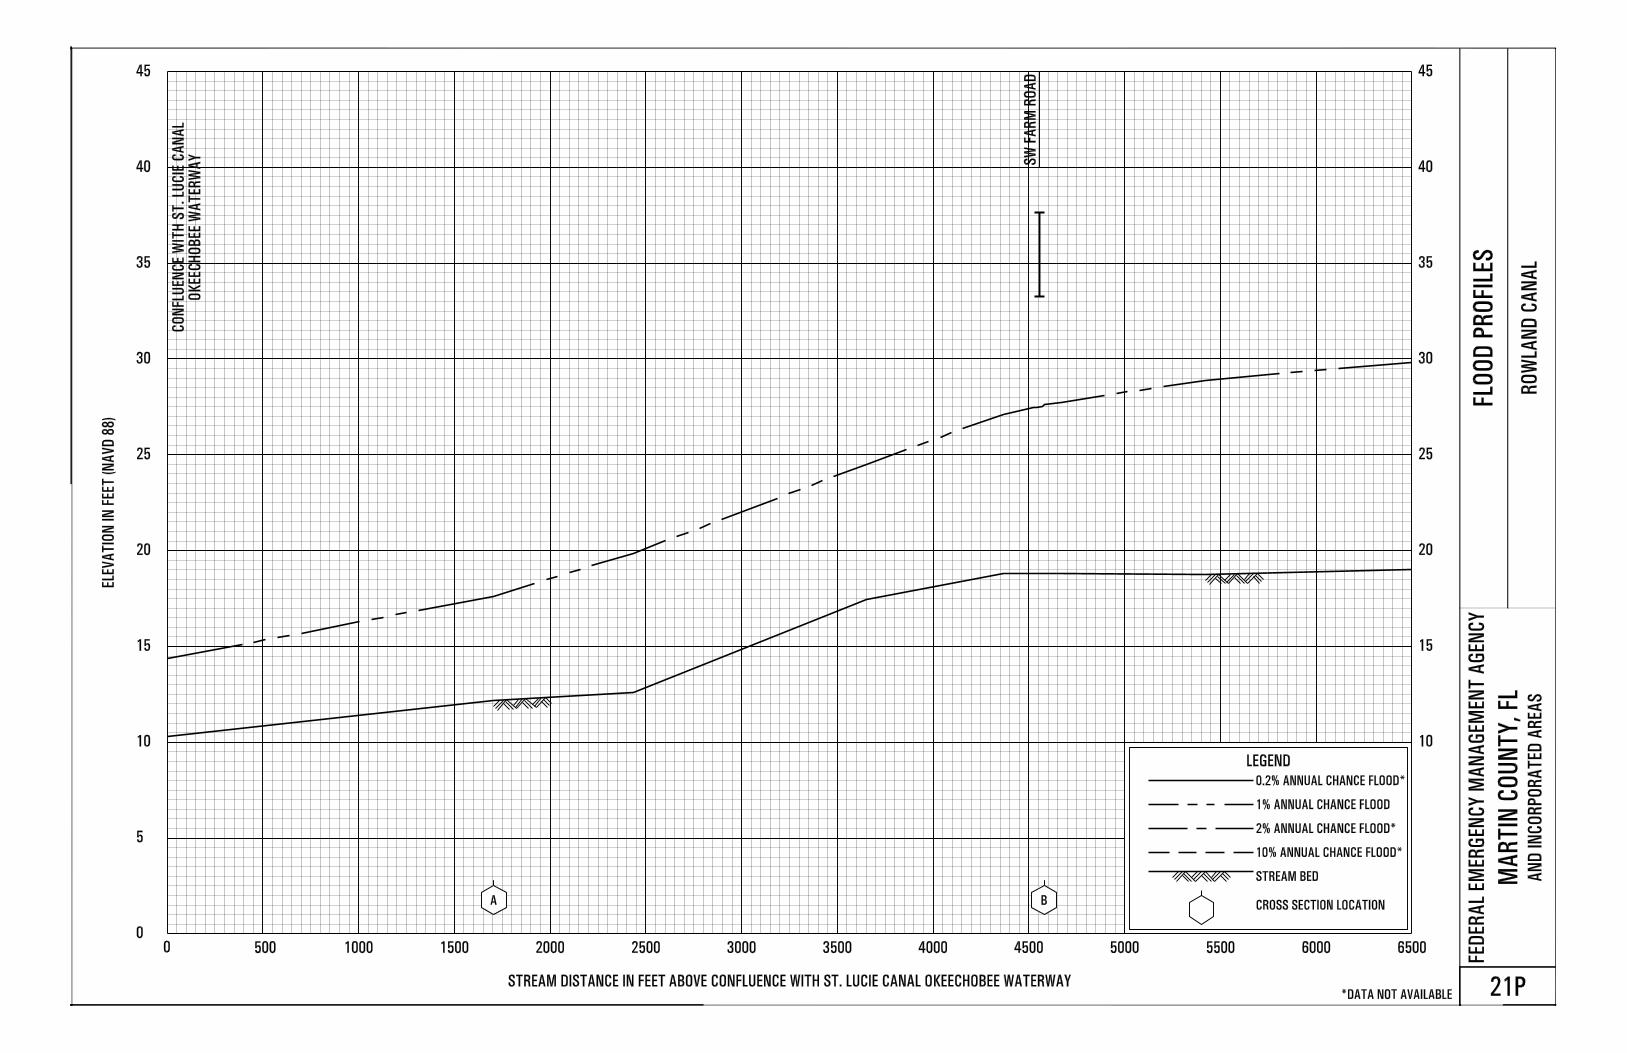
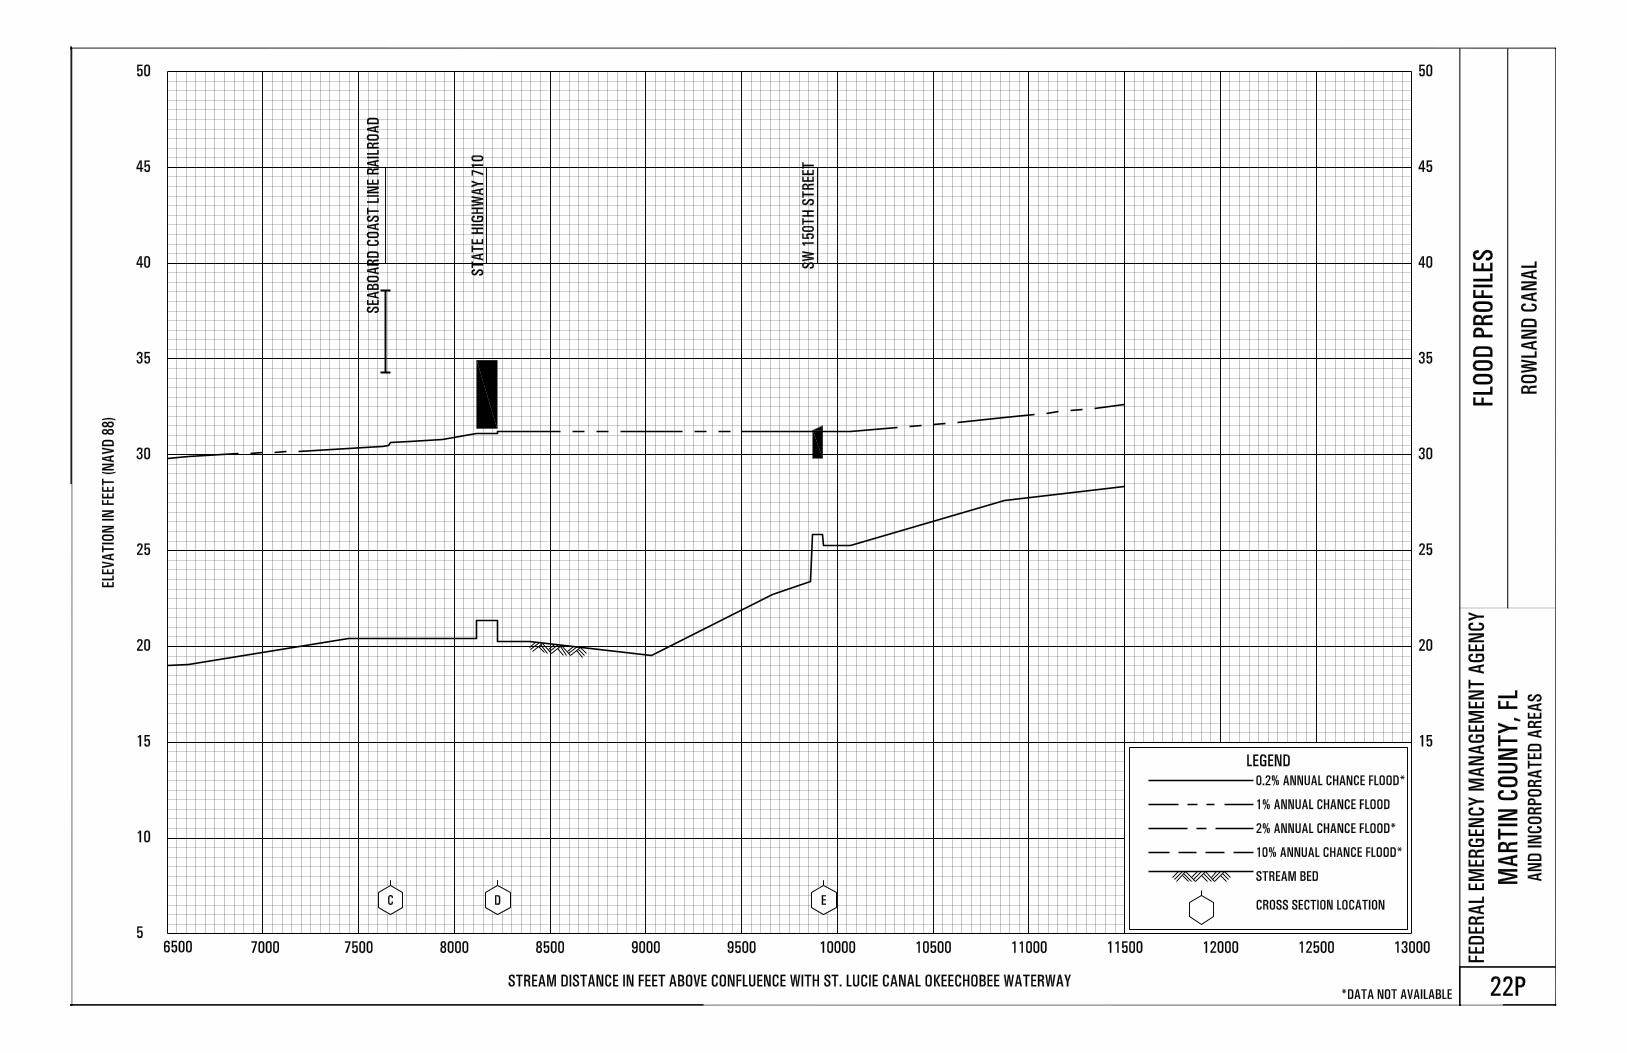
Rowland Canal Panels 21P-23P
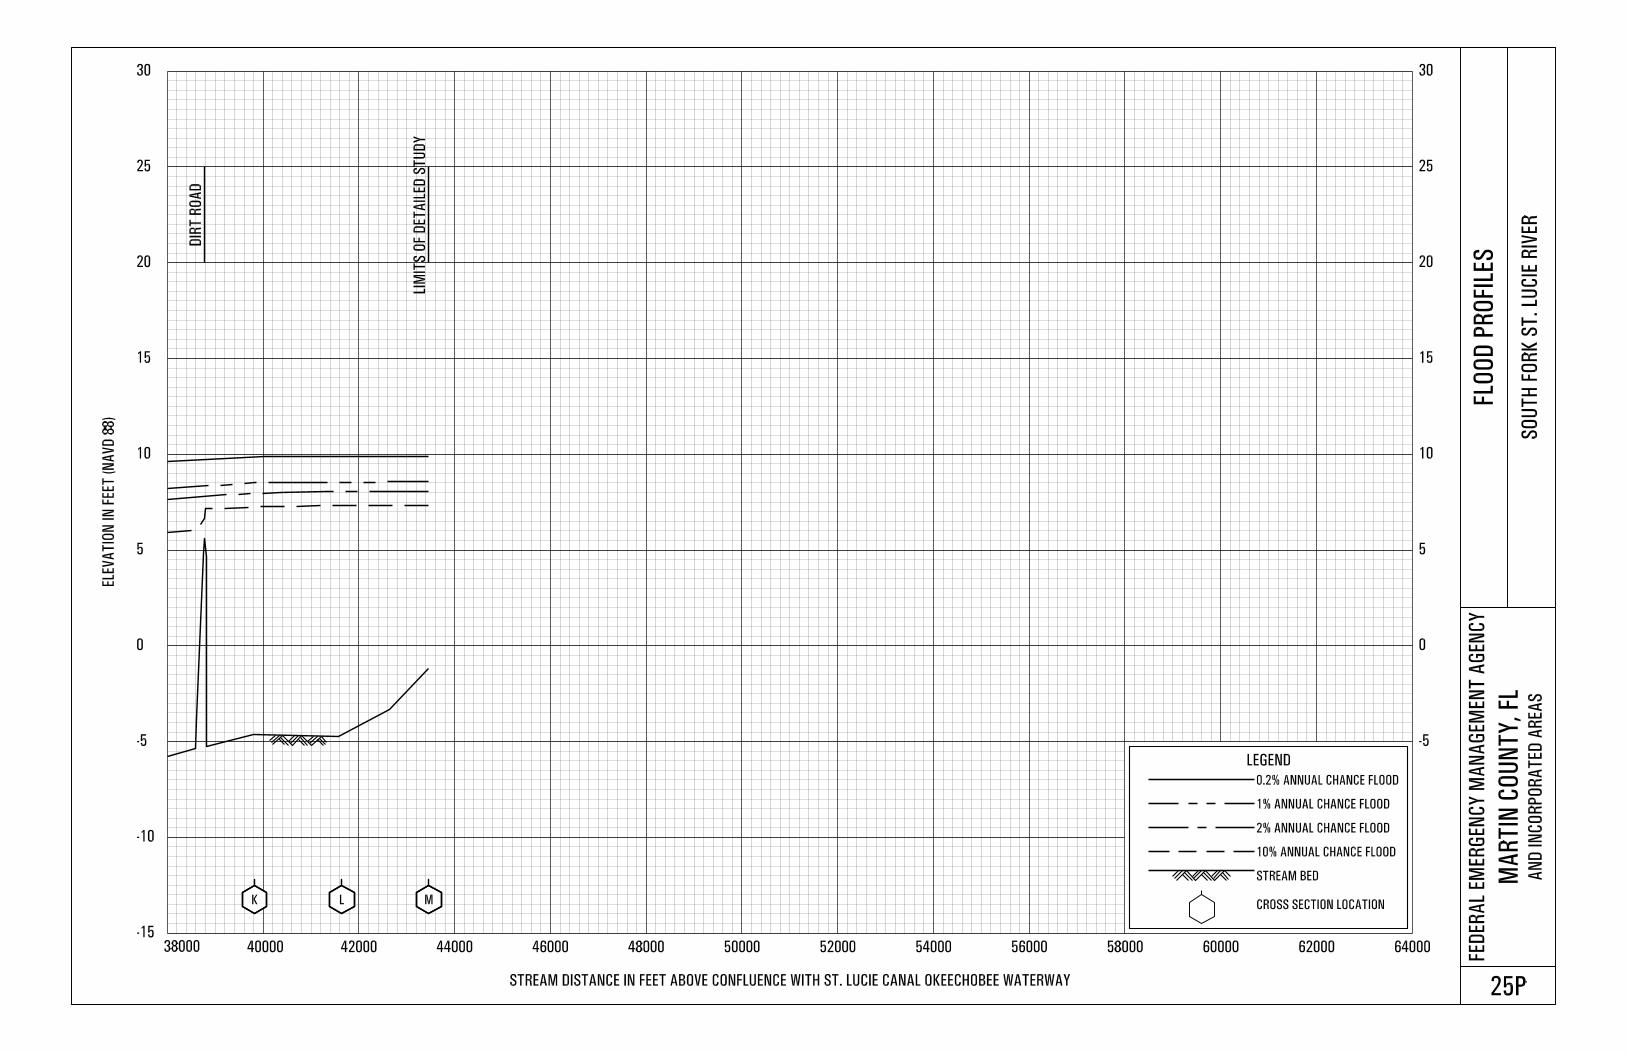
South Fork St. Lucie River Panels 24P-25P
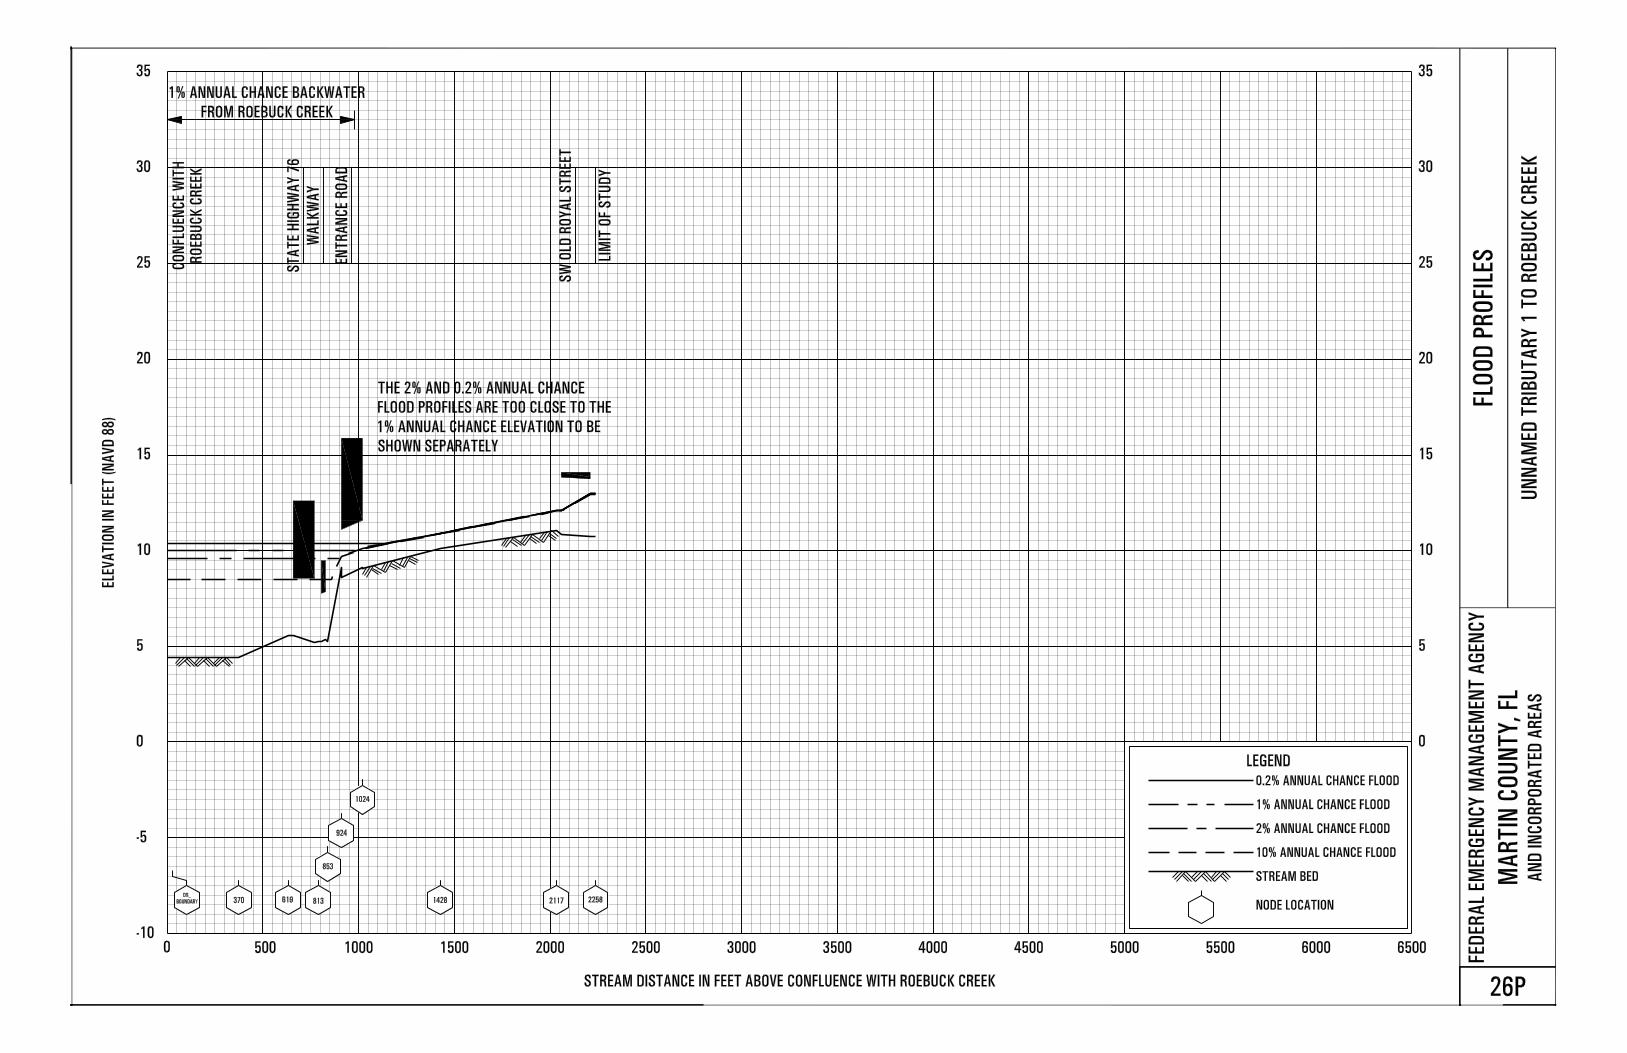
Unnamed Tributary 1 to Roebuck Creek Panel 26P
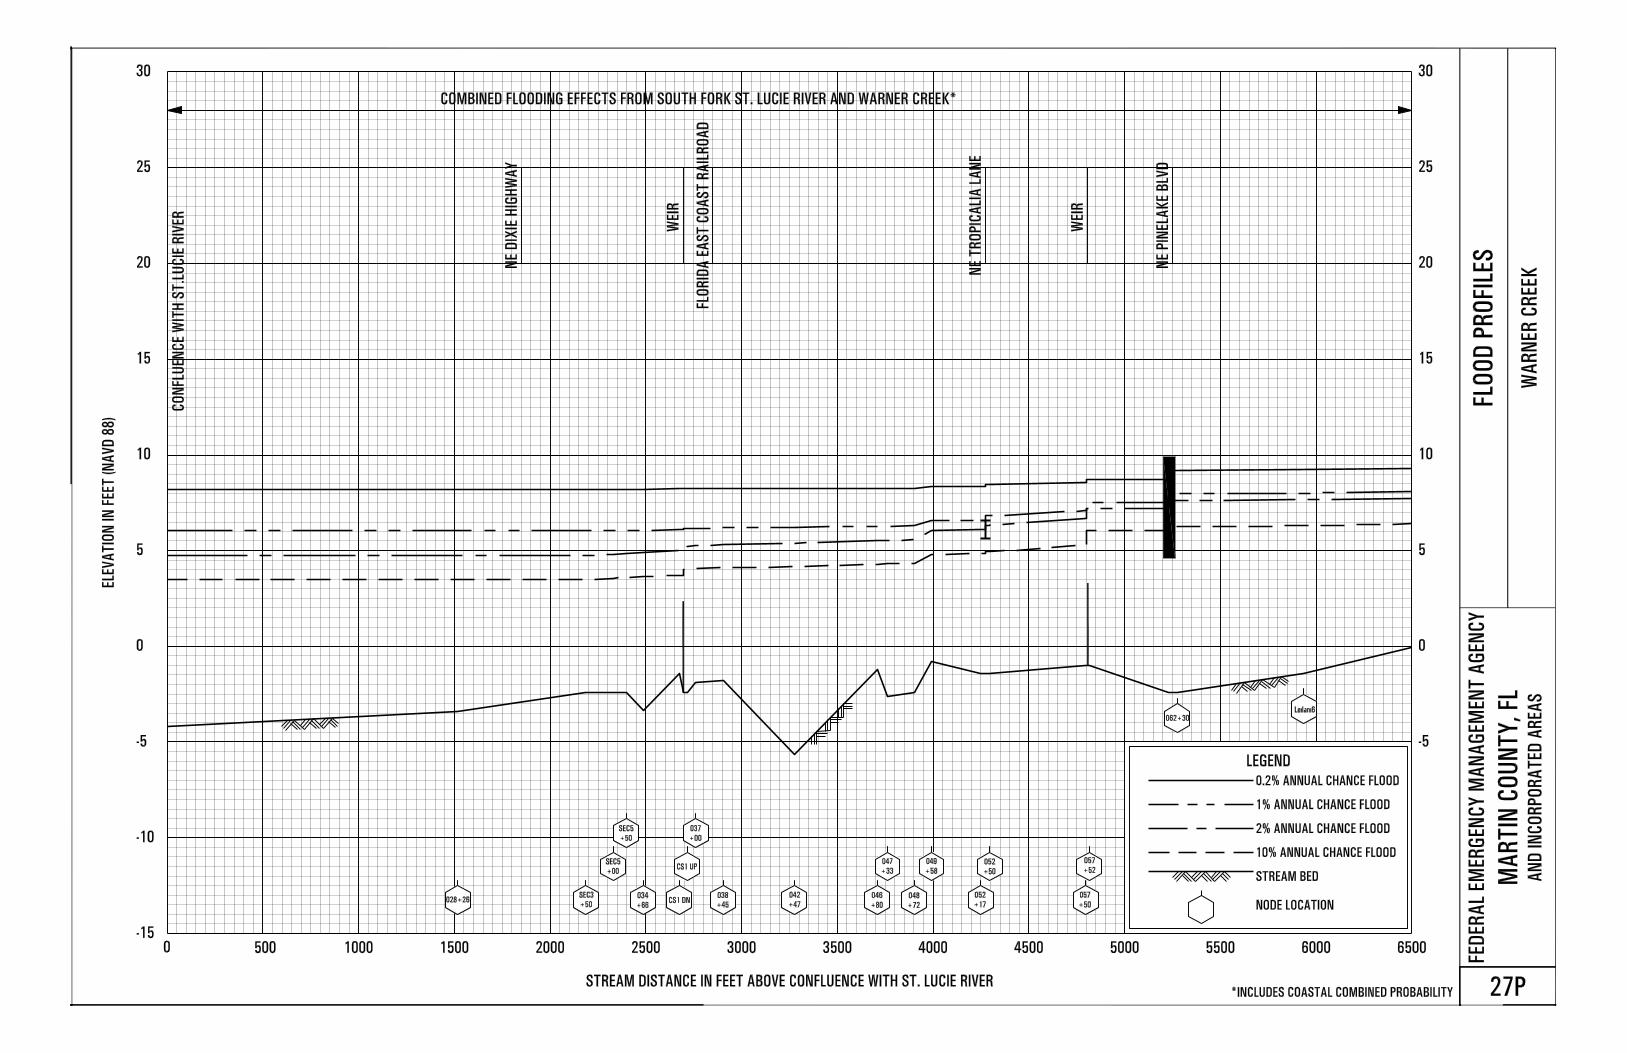
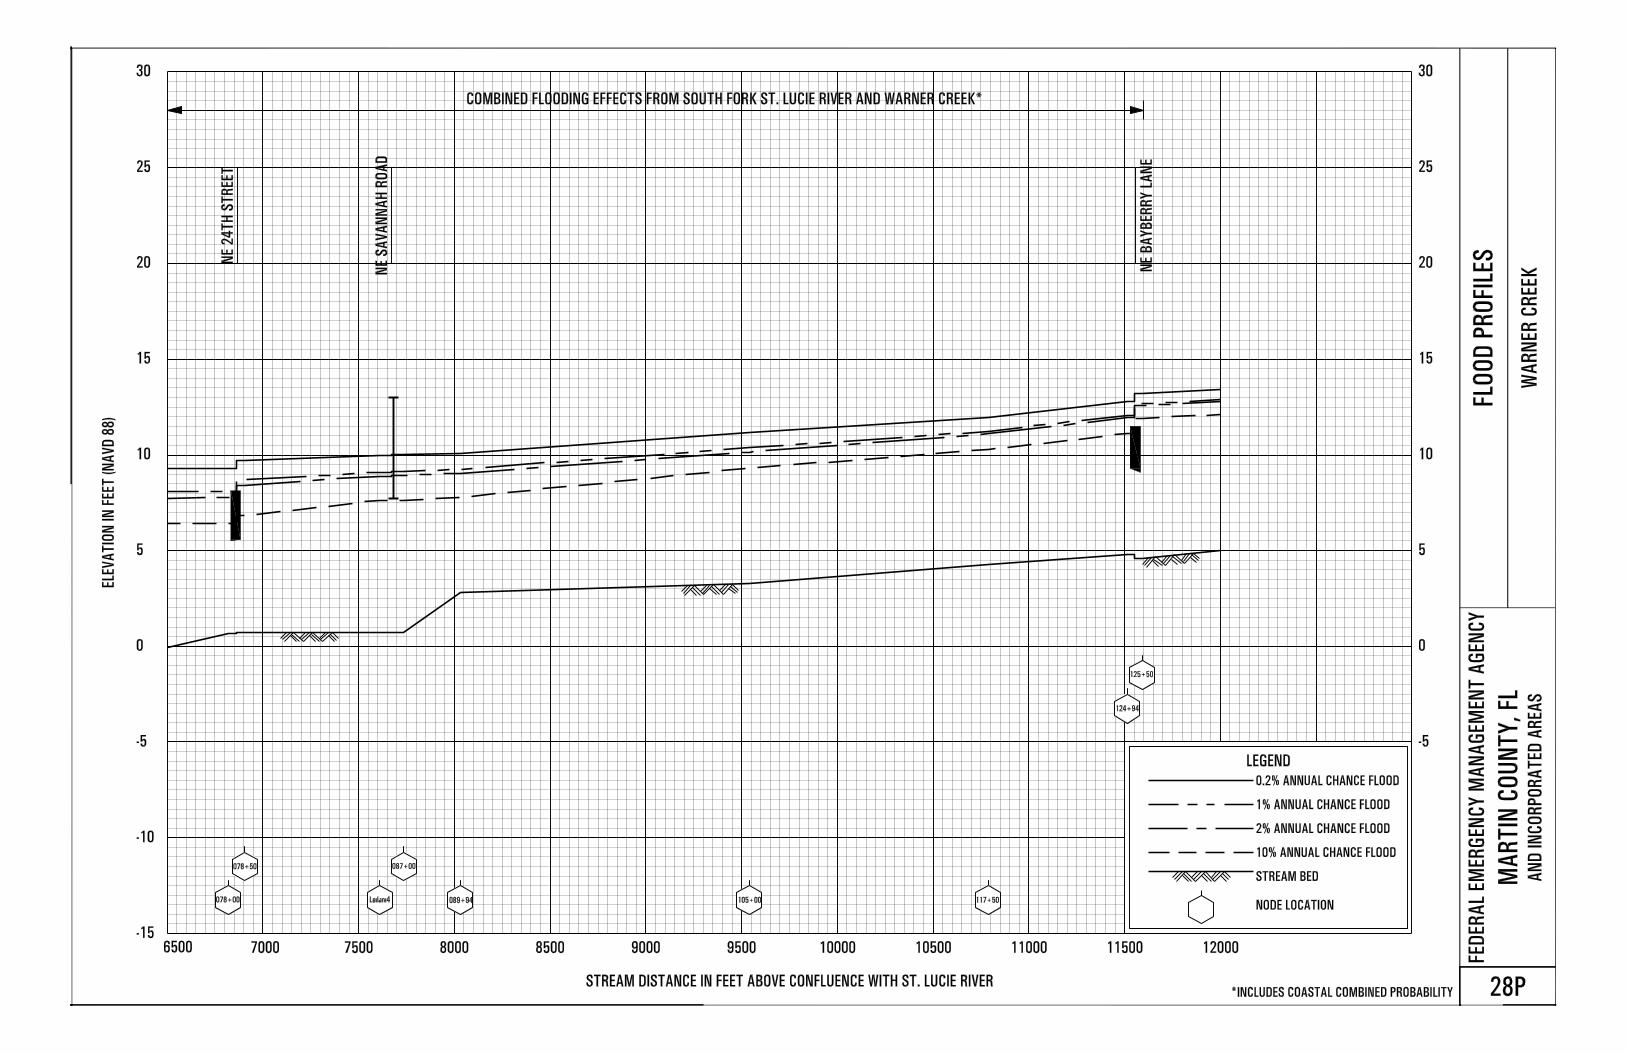
Warner Creek Panels 27P-29P
Exhibit 2 (published separately) – Flood Insurance Rate Map Index
Flood Insurance Rate Map
1
FLOOD INSURANCE STUDY
MARTIN COUNTY, FLORIDA AND INCORPORATED AREAS
1.0 INTRODUCTION
1.1 Purpose of Study
This Flood Insurance Study (FIS) revises and updates a previous FIS/Flood Insurance Rate
Map (FIRM) for, the geographic area of Martin County, Florida, including: the City of Stuart, the Towns of Jupiter Island, Ocean Breeze, and Sewall's Point; and the
unincorporated areas of Martin County (hereinafter referred to collectively as Martin
County). This FIS aids in the administration of the National Flood Insurance Act of 1968 and the Flood Disaster Protection Act of 1973. This study has developed flood risk data for
various areas of the county that will be used to establish actuarial flood insurance rates.
This information will also be used by Martin County to update existing floodplain
regulations as part of the regular Phase of the National Flood Insurance Program (NFIP), and by local and regional planners to further promote sound land use and floodplain
development. Minimum floodplain management requirements for participation in the
NFIP are set forth in the Code of Federal Regulations at 44 CFR, 60.3.
In some states or communities, floodplain management criteria or regulations may exist
that are more restrictive or comprehensive than the minimum Federal requirements. In such cases, the more restrictive criteria take precedence and the State (or other
jurisdictional agency) will be able to explain them.
The Digital Flood Insurance Rate Map (DFIRM) and FIS Report for this countywide study have been produced in digital format. Flood hazard information was converted to meet the
Federal Emergency Management Agency (FEMA) DFIRM database specifications and
geographic information standards. This information is provided in a digital format so that it can be incorporated into a local Geographic Information System (GIS) and be accessed
more easily by the community.
1.2 Authority and Acknowledgments
The sources of authority for this FIS are the National Flood Insurance Act of 1968 and the Flood Disaster Protection Act of 1973.
This FIS was prepared to update the October 4 2002 initial countywide FIS. Information on
the authority and acknowledgments for each jurisdiction included in this countywide FIS, as compiled from their previously printed FIS reports, is shown below.
Jupiter Island, Town of: the analyses for the FIS Supplement – Wave Height Analyses dated July 5, 1983, were prepared by Tetra Tech, Inc., for the
Federal Emergency Management Agency (FEMA), under
Contract No. H-4510. Dames and Moore subsequently mapped the wave crest information for FEMA under Contract No. C-0542.
Martin County
(Unincorporated Areas): the hydrologic and hydraulic analyses for the FIS report dated December 15, 1980, were prepared by Tetra Tech, Inc., for the
2
Federal Insurance Administration (FIA) under Contract No.
H-4510. That work was completed in June 1979. The analyses for the Supplement - Wave Height Analyses dated July 5, 1983, were
prepared by Tetra Tech, Inc., for FEMA.
Ocean Breeze, Town of: the analyses for the Supplement – Wave Height Analyses dated June 15, 1983, were prepared by Tetra Tech, Inc., for FEMA.
Sewall's Point, Town of: the hydrologic and hydraulic analyses for the FIS report dated October 3, 1983, were taken from the unincorporated areas of
Martin County FIS (Reference 1).
Stuart, City of: the hydrologic and hydraulic coastal analyses for the St. Lucie
River were prepared by Dewberry and Davis for the Federal
Emergency Management Agency (FEMA). That work was
completed in November 1996. Hydrologic and hydraulic coastal analyses for the North Fork St. Lucie River and the South Fork St.
Lucie River came from the contiguous Unincorporated Areas of
Martin County, Florida (Reference 1).
For the October 2002 countywide FIS, hydrologic and hydraulic and coastal analyses were
prepared by Taylor Engineering, Inc., for FEMA, under Contract No. EMA-96-CO- 0022. Schnars, P.A., and Morgan & Eklund, Inc., performed riverine and beach/near shore
surveying, respectively, under contract to Taylor Engineering (Reference 2). This work
was completed in August 1997.
For this revised countywide FIS, the hydrologic and hydraulic analyses and coastal
redelineation were performed by Watershed IV Alliance, for the FEMA, under Contract
No. EMA-2002-CO-0011A, Task Order 023. This work was completed in October 2012. Through a join U.S Army Corps of Engineers (USACE) and FEMA effort, Herbert Hoover
Dike (HHD) Dike breach analyses and downstream floodplain mapping were performed
by Taylor Engineering Inc. (under USACE contract W912EP-06-D-0012) and Watershed
IV Alliance (under FEMA Contract EMA-2002-CO-011A, Task Order 018). This work was completed in September 2012.
Base map files were provided from a variety of sources including U.S. Geological Survey,
South Florida Water Management District, NOAA, Martin County Information Technology Services, Florida Department of Environmental Protection and U.S. Fish and
Wildlife Service. All files were provided in digital format using source material at a scale
of 1:24,000 or better. The coordinate system used for the production of the FIRM is State Plane Florida East referenced to the North American Datum 1983 (NAD 83) and GRS
1980 spheroid. Corner coordinates shown on the FIRM are in latitude and longitude.
1.3 Coordination
An initial Consultation Coordination Officer (CCO) meeting (also occasionally referred to as the Scoping meeting) is held with representatives of the communities, FEMA, and the
study contractors to explain the nature and purpose of the FIS and to identify the streams to
be studied by detailed methods. A final CCO (often referred to as the Preliminary DFIRM Community Coordination, or PDCC, meeting) is held with representatives of the
communities, FEMA, and the study contractors to review the results of the study.
3
For this revision of the countywide FIS, the initial CCO meeting was held on August 13,
2008, and attended by personnel of the Town of Jupiter Island, Town of Sewall’s Point, City of Stuart, Town of Ocean Breeze, Martin County, FEMA, and South Florida Water
Management District (SFWMD). Letters were sent to various State, Federal, and private
agencies informing them of the forthcoming insurance study and requesting any pertinent
information available.
The final CCO meeting was held on September 19, 2013 to review and accept the results of
this FIS. Those who attended this meeting included representatives of FEMA, Martin
County, City of Stuart, Town of Jupiter Island, Town of Sewall’s Point and the study contractor. All problems raised at that meeting have been addressed in this study.
The dates of the historical initial and final CCO meetings held for the communities within
the boundaries of Martin County are shown in the following tabulation:
Community Name Initial CCO Date Final CCO Date
Martin County
(Unincorporated Areas) August 20, 1979 July 24, 1980
Stuart, City of * July 27, 1977
Martin County
And Incorporated Areas September 20, 1995 July 17, 2001
* Data not available
2.0 AREA STUDIED
2.1 Scope of Study
This Flood Insurance Study covers the geographic area of Martin County, Florida.
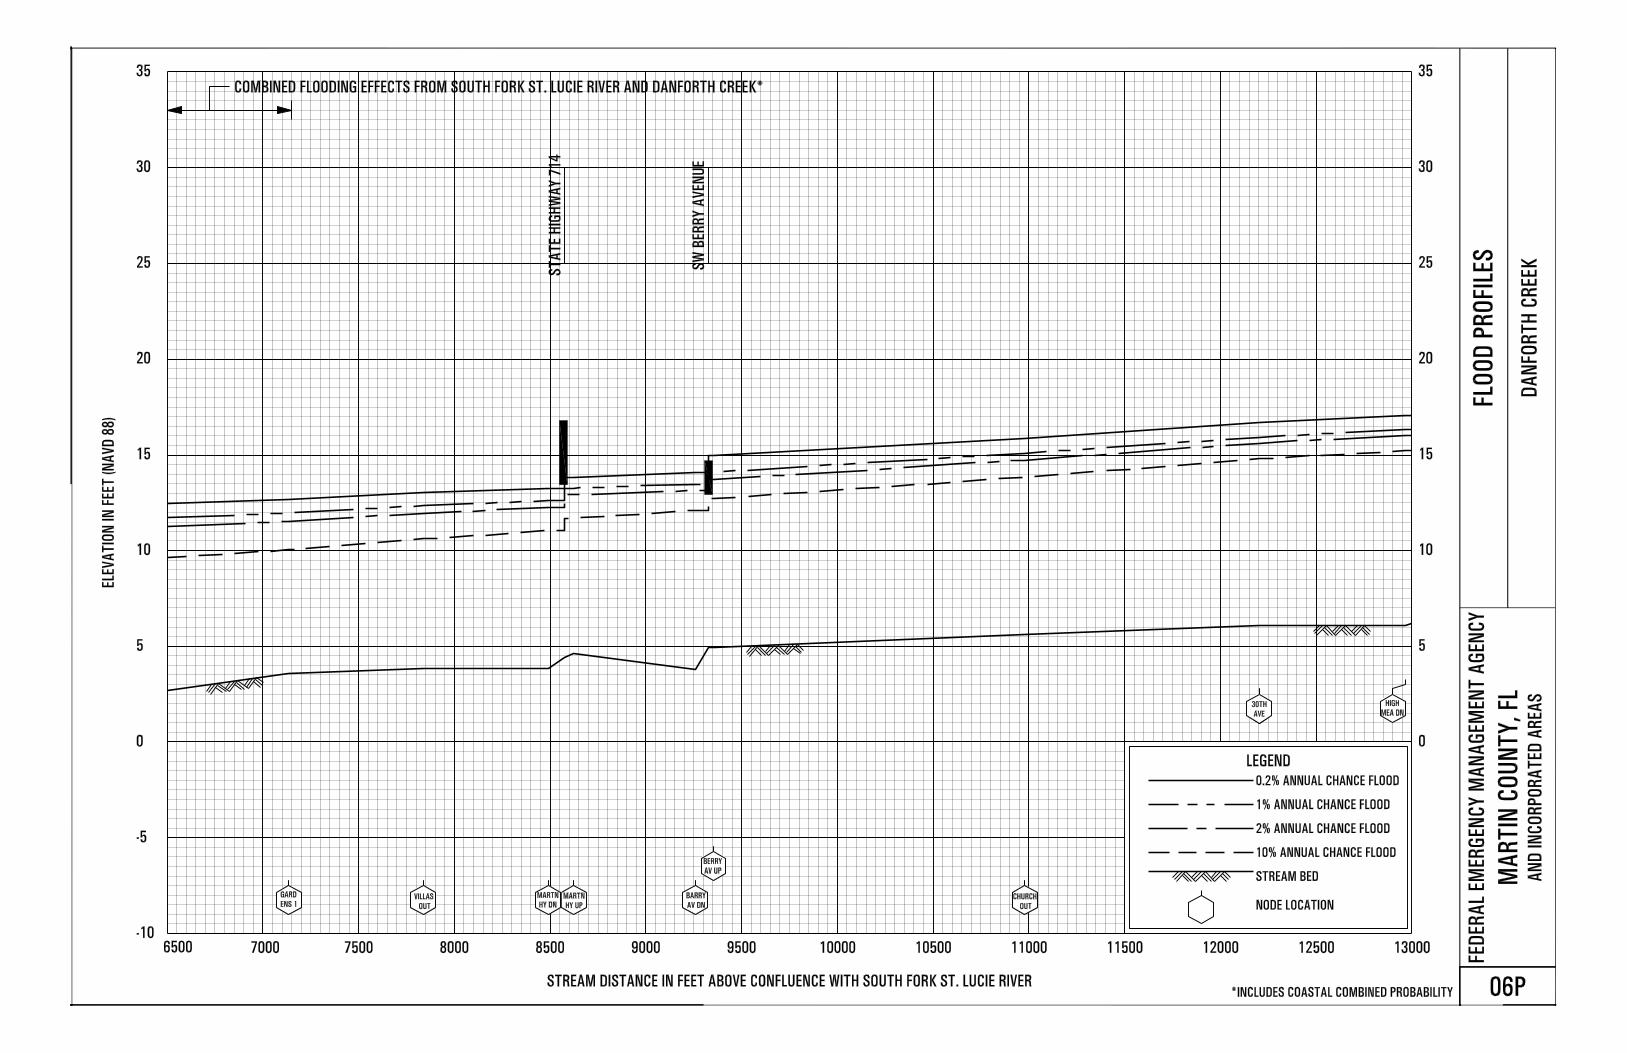
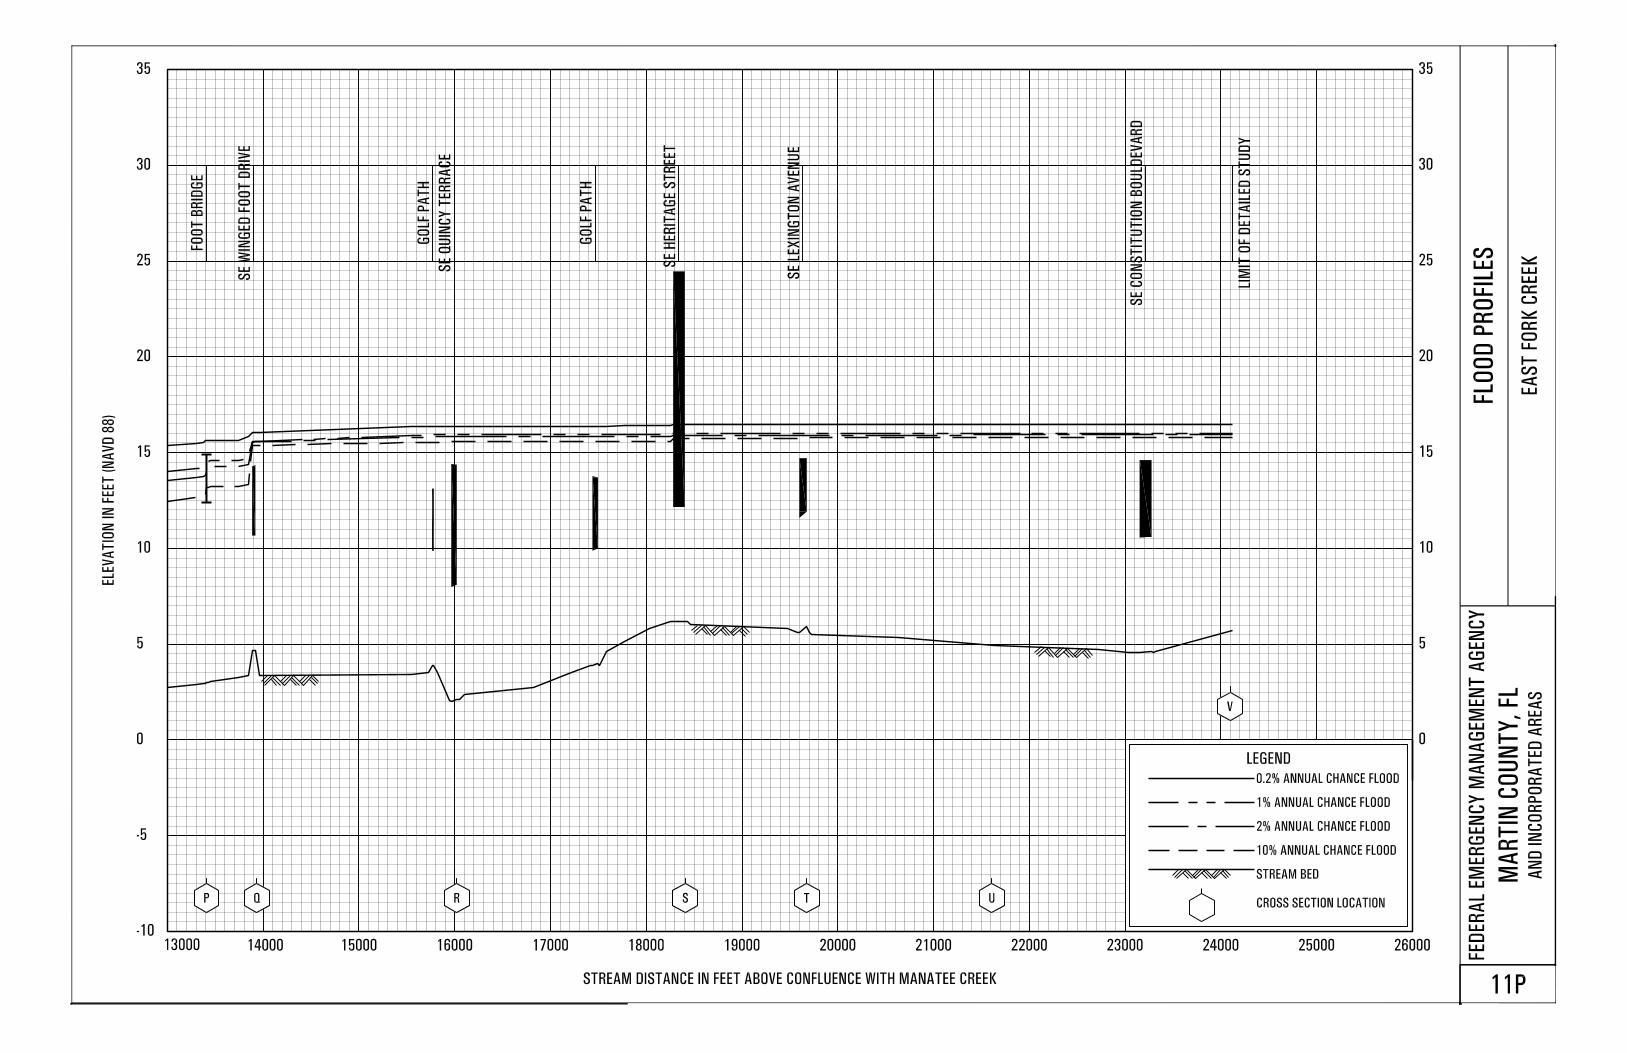
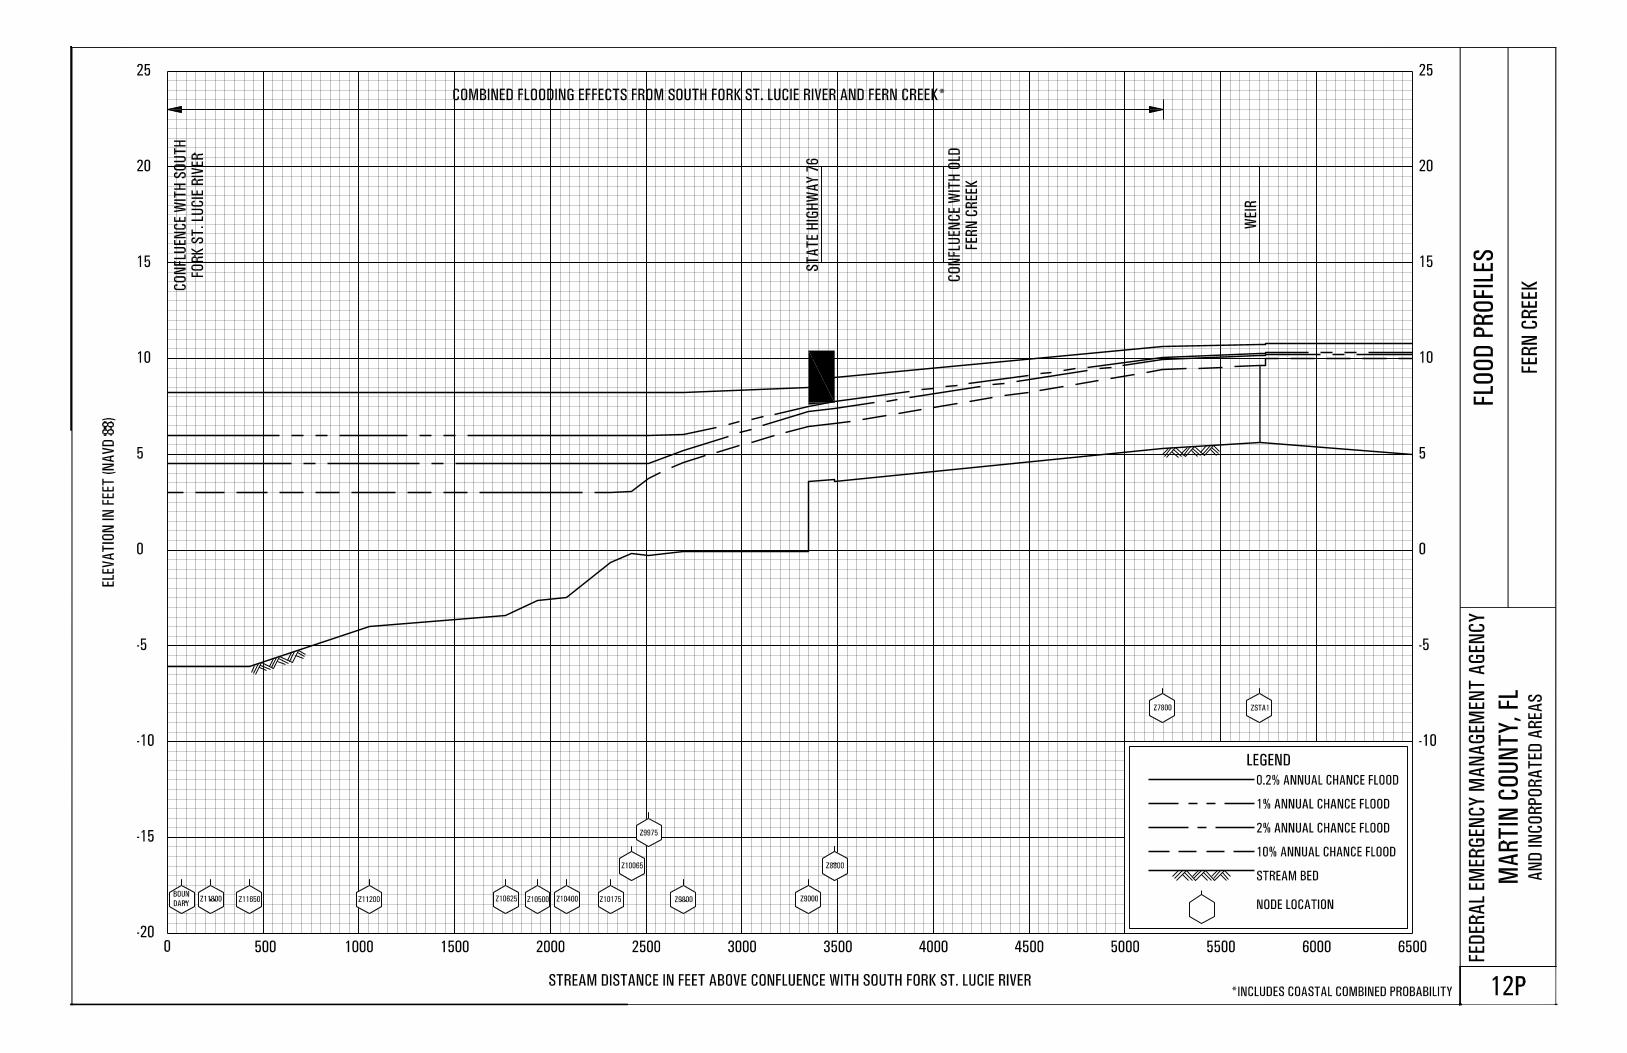
The following streams were studied by detailed methods for this restudy: Coral Gardens Canal (also referred to as Unnamed Tributary to South Fork St. Lucie River), Danforth Creek, a portion of East Fork Creek, Fern Creek, Manatee Creek, Roebuck Creek, Rowland Canal, Unnamed Tributary 1 to Roebuck Creek and Warner Creek. Detailed study streams are shown in Table 1, “Detailed Study Streams.”
Table 1 – Detailed Study Streams
Stream Reach Limits
Coral Gardens
Canal From confluence with South Fork St. Lucie River to downstream face of Willoughby Boulevard
Danforth Creek From confluence with South Fork St. Lucie River to approximately 1 mile upstream of SW 48
th Avenue/SR 76A
East Fork Creek From 100 feet upstream of Mariner Sands Drive to approximately
950 feet upstream of SE Constitution Boulevard
Fern Creek From confluence with South Fork St. Lucie River to downstream face of SE Salerno Road
Manatee Creek From approximately 550 feet downstream of Cove Road to the downstream face of U.S Route 1
4
Table 1 – Detailed Study Streams (continued)
Stream Reach Limits
Roebuck Creek From confluence with St. Lucie Canal Okeechobee Waterway to
approximately 0.8 mile upstream of State Route 76
Rowland Canal From confluence with St. Lucie Canal Waterway to 0.6 miles upstream of SW 150
th Street
Unnamed
Tributary 1 to
Roebuck Creek
From confluence with Roebuck Creek to SW Old Royal Drive
Warner Creek From confluence with St. Lucie River to downstream face of NE
Jensen Beach Boulevard
Floodplain boundaries of some streams that have been previously studied by detailed
methods were redelineated based on more detailed and up-to-date topographic data.
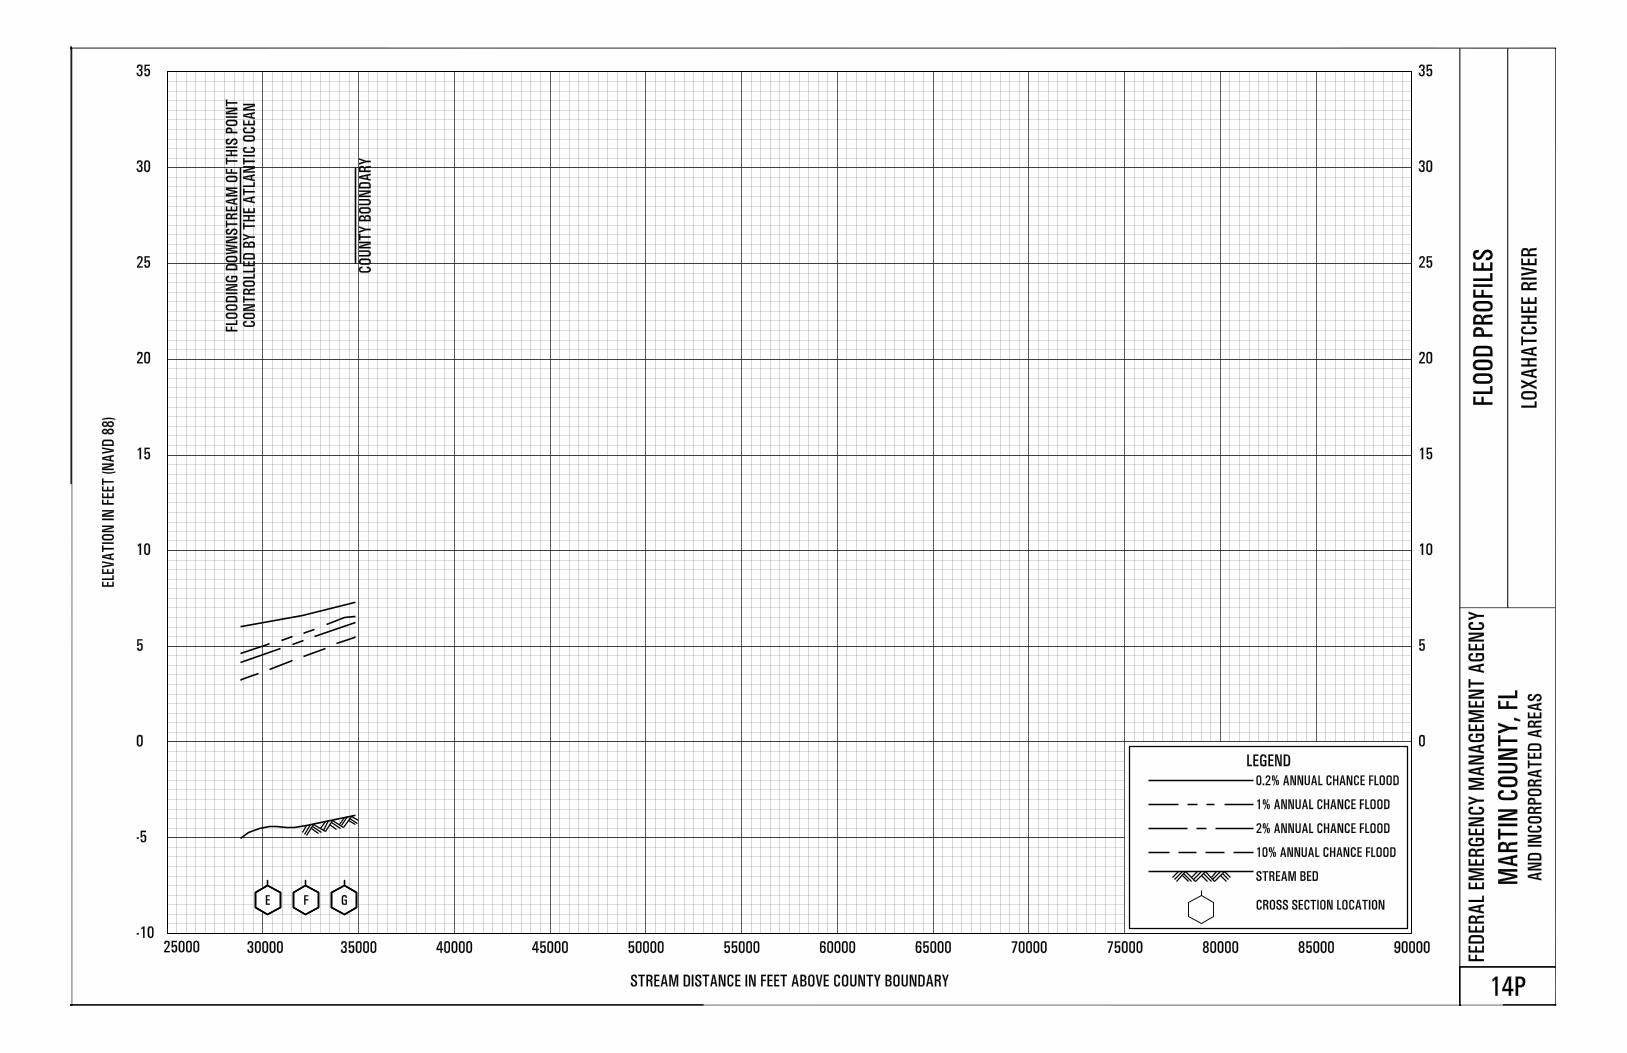
Redelineated streams include Bessey Creek, Loxahatachee River, South Fork St. Lucie
River, and a portion of East Fork Creek.
All coastal areas were redelineated based on the base flood elevations from the October
2002 FIS report. Computations for flood levels along the rivers subject to either coastal surges or rainfall were independently performed. Coastal surge elevations were combined
statistically with riverine (rainfall) flood levels to obtain base flood levels for each return
period.
2.2 Community Description
Martin County, located in the southern portion of Florida's east coast, is bordered by St.
Lucie County on the north; Okeechobee County on the west; Palm Beach County on the
south; and the Atlantic Ocean on the east. The City of Stuart, the county seat, is located approximately 100 miles north of Miami and 120 miles southeast of Orlando. The land area
of Martin County comprises approximately 555 square miles with 22 miles of Atlantic
Ocean shoreline. Along the eastern side of the county, a continuous line of shallow estuaries separate the county's mainland from its barrier islands. These estuaries include
the Indian River and a series of narrow lagoons including Great Pocket, Peck Lake, Hobe
Sound, and Jupiter Sound interconnected by the Intracoastal Waterway. St. Lucie Inlet, located in the northeast quadrant of Martin County, serves as the county's only inlet
through the barrier islands. Nearby inlets in adjacent counties include Fort Pierce Inlet to
the north and Jupiter Inlet to the south. These three inlets serve as the major passages
through which Atlantic Ocean tides and hurricane surges propagate into the county's estuaries. Much of the county's western boundaries lie in Lake Okeechobee which covers
96 square miles of the county's area.
Incorporated areas located within Martin County include the City of Stuart, Town of Ocean
Breeze, Town of Sewall's Point, and Town of Jupiter Island, all located in the eastern
portion of the county. Other communities include Hobe Sound, Hutchinson Island, North River Shores, Palm City, Rio, South County, Port Salerno, Jensen Beach, and Tropical
Farms in the eastern portion of the county and Indiantown and Port Mayaca in the central
and western portions. The county's eastern third supports most of the county's population
and the highest concentration of residential and commercial land use. Residential development is heavy along the coastline and interior waterways including the St. Lucie
5
River, South Fork St. Lucie River, North Fork St. Lucie River, Indian River, and the
Intracoastal Waterway. The county's inland area consists primarily of pasture and agriculture, including citrus groves, with an extensive network of irrigation canals. The
U.S Census Bureau’s 2010 estimate a population of 146,318 for Martin County (Reference
3). Several major transportation routes serve the county including Interstate Route 95;
Florida's Turnpike; U.S. Route 1; State Routes A1A, 7, 10, and 76; the Intracoastal Waterway; and the Florida East Coast Railway.
Martin County has a subtropical climate, with long, warm, and humid summers and short, mild winters. The average annual temperature is 74 degrees Fahrenheit (Reference 4).
According to the National Oceanic and Atmospheric Administration (NOAA) records for
the Martin County Municipal Airport, located in the eastern portion of the county, the average annual precipitation is 57 inches (Reference 5). Over half of this rainfall occurs
during the hurricane season. Based on 1936-1984 data, the seasonal distribution of rainfall
ranges from a high of 27.4 inches (June - September) to a low of 10.9 inches
(December-March).
Low lying, mildly sloping terrain with extensive swamps generally characterizes the
terrain of Martin County. Ground elevations on two ridges crossing the central and western portions of the county exceed 29 feet North American Vertical Datum of 1988 (NAVD88),
but generally elevations range from 0 to approximately 19 feet NAVD88 (Reference 6).
Much of the terrain is covered with somewhat poorly drained soil formations with a high water table. The predominant soils associated with this flat terrain include Pineda and
Riviera Fine Sand, Waveland and Immokalee Fine Sand, Wabasso Sand, Oldsmar Fine
Sand, and Nettles Sand (Reference 7). The predominant hydrologic soil groups are D and
B.
Most of the major waterways lie in the eastern portion of the county. These include the St.
Lucie River, South Fork St. Lucie River, North Fork St. Lucie River, Indian River, Loxahatchee River, North Fork Loxahatchee River, and the Intracoastal Waterway. The St.
Lucie River drains a major portion of the middle of the county including much of the City
of Stuart. Influenced by coastal surge flooding, the St. Lucie River flows into the Indian
River (Intracoastal Waterway) near St. Lucie Inlet. Smaller streams in the eastern portion of the county include Roebuck Creek, Manatee Creek, East Fork Creek (a Manatee Creek
tributary), Bessey Creek, and Danforth Creek (interconnected with Bessey Creek).
2.3 Principal Flood Problems
Flooding in Martin County results from tidal surge associated with a northeaster, hurricane,
or tropical storm activity and from overflow of streams and swamps associated with
rainfall runoff. Major rainfall events occur from hurricanes, tropical storms, and thundershowers associated with frontal systems. Some of the worst area floods were the
result of high intensity rainfall during hurricanes or tropical storms.
Having a relatively short time of concentration, the smaller streams tend to reach peak
flood flow concurrently with elevated tailwater conditions associated with the coastal
storm surge. This greatly increases the likelihood of inundation (observed on several
occasions) of low lying areas along the coast. Areas along the Indian River are particularly vulnerable to this flooding. In the eastern portion of the county, most of the flood-prone
areas feature poorly drained soil, a high water table, and flat terrain. These characteristics
contribute significantly to flooding problems. Furthermore, the flat slopes and heavily
6
vegetated floodplains promote backwater effects and aggravate the flood problems by
preventing the rapid drainage of floodwaters.
High quality, long-term stream gauge data are limited for most study reaches within Martin
County. Also, only limited surveyed and verifiable high water marks (HWMs) were
available at the time of this revised study. From an October 1995 rainfall event, a surveyed high water mark of 7.65 feet NAVD (9.05 feet NGVD) was recorded on a house adjacent to
the South Fork St. Lucie River. Anecdotal evidence of flooding in Bessey Creek during the
October 1995 storm was provided by local residents. Additionally, Martin County collected high water marks along Danforth Creek and Bessey Creek from the August 2012
Tropical Storm Issac event.
The coastal areas of Martin County are subject to flooding from tidal surges associated
with hurricanes and northeasters. Waves, associated with wind-generated surges, can
exacerbate flooding, erode shorelines, and produce high forces which can further damage
structures, particularly along the open coastline. Interior areas are also subject to surge flooding and wave damage due to the close proximity of three ocean inlets. Brief
descriptions of major storms in the Martin County area follow.
Hurricane of September 6-20, 1928
Originating near the Cape Verde Islands, this major hurricane moved inland on September 16. Its center entered the Florida coast near the City of Palm Beach, and crossed the Lake
Okeechobee region with little diminution in intensity. The minimum barometric pressure
at West Palm Beach, 928.9 millibars (27.43 inches), was one of the lowest ever recorded in
the United States during a hurricane. In the Lake Okeechobee region, the great loss of life and the damage to property were caused by the overflowing of the lake along the
southwestern shore.
The total number of deaths in Florida numbered 1,836 and the injured numbered 1,870.
Nearly all loss of life occurred in the Lake Okeechobee area; 1,700 people lost their lives in
Palm Beach County. Twenty-six dead and 1,437 injured were reported in the West Palm
Beach area (from the Town of Jupiter to the City of Delray Beach). Tides of 9.8 feet at Palm Beach and 8 feet at West Palm Beach (Lake Worth) were reported. Property damage,
greatest at Lake Worth and the beaches, was estimated at $25 million. There was
considerable erosion on Jupiter Island, and other wave damage was reported along the entire length of Indian River.
Hurricane of August 31-September 7, 1933
This major hurricane, which was first detected northeast of Puerto Rico, entered the east
coast of Florida on September 4. Its center passed over Jupiter Met where the barometric
pressure fell to 947.5 millibars (27.98 inches). Maximum winds were estimated to be 1 10 knots. There was considerable property damage in Florida, mostly in the area between
Jupiter and the City of Fort Pierce. Severe waterfront damage was reported at Stuart in
Martin County.
Flood of 1947
This flood is generally considered to be the most severe flood recorded in southern Florida,
and was exceptional in duration as well as intensity. Heavy rainfall, including
high-intensity rainfall from two hurricanes, occurred over a 5-month period. This
amounted to more than the average rainfall in some parts of the county. Many parts of the
7
county were flooded for month. While there was extensive damage to dairy pastures and
other development, no reliable estimate of damage in Martin County is available. A recurrence of the 1947 flood would cause much more significant damage because of the
subsequent increase in development.
Hurricane of August 23-31, 1949
By the time this tropical storm passed north of the Bahama Islands on August 26, it had
developed into a full fledged hurricane. Its center entered the east coast of Florida over the Palm Beach-Delray Beach area, with the lowest barometric pressure of 954.0 millibars
(28.17 inches) and winds estimated at 113 knots. As the hurricane moved inland, its center
passed over the northern part of Lake Okeechobee. This was the worst hurricane in that area since the disastrous hurricane of September 1928. However, the levees held and no
flooding occurred. Damage in Florida was estimated at $45 million. Tides of 1 1.3 feet at
Fort Pierce, 8.5 feet at Stuart (St. Lucie River), and 6.9 feet at West Palm Beach (Lake
Worth) were reported. Stuart sustained severe damage. Over 500 persons were made homeless. The hurricane of August 23-31, 1949, resulted in storm surge elevations of 8.5
feet NGVD in the St. Lucie River (Reference 1).
Flood of 1953
This flood was similar to the 1947 flood, with a heavy 5-month rainfall which included a tropical storm in October. The June through October rainfall was approximately 48 inches.
Damage was greater than for the 1947 flood because of greater development. The heaviest
damage occurred in the beef cattle industry, with considerable damage to improved
pastureland, causing loss of weight to cattle, and requiring supplemental feeding. Truck crop farms and dairy pasture also sustained extensive damage. There was significant
damage to the Town or Indiantown; however, it was small compared to agricultural losses
in the county.
September 1960 (Tropical Storm Florence)
Tropical Storm Florence was the main cause of flooding in Martin County in 1960. September 21 through 25, rainfall averaged 10 to 11 inches over the county. For a 5-day
rainfall, that would be a frequency of occurrence of approximately once in 15 years.
However, on the basis of several months duration, the total rainfall was not comparatively as high and the overall frequency of the 1960 flooding was approximately once in 5 years.
The most severely damaged section of the county was the Allapattah Marsh area north of St.
Lucie Canal, where dike systems failed on several ranches. On September 17, 1960, 5.2 inches of rain fell in 24 hours. September 1960 totaled 24.9 inches.
October 1964 (Hurricane Isabell)
Hurricane Isabell entered the coast of Florida near Everglades and proceeded northeasterly
until it exited from the Jupiter area. A minimum pressure of 28.88 inches and winds
reaching 90 miles per hour occurred. Tidal damage was minor. Streets in low-lying portions of the Hobe Sound area were reportedly covered with water resulting from
torrents of rain. On October 1, 1964, 7.0 inches of rain fell in 24 hours while 15.2 inches
fell for the month.
8
August 17 - August 21, 1976 (Tropical Storm Dottie)
Tropical Storm Dottie originated in the Gulf of Mexico and traveled east before making
landfall in southwest Florida near Flamingo. The storm then crossed over the Florida
peninsula, commenced a more northerly direction and moved over the Atlantic Ocean near
Martin County. Minor beach erosion and flooding resulted. Damage estimates in southeast Florida associated with this storm were minimal.
August 25 - September 7, 1979 (Hurricane David)
Hurricane David made landfall on September 3, 1979, in Martin County and skirted the
entire east coast of Florida. Significant structural damage to residential and commercial properties resulted from Hurricane David. There was also significant beach erosion and
coastal flooding damage in Martin County. Storm-related damages in Florida were
approximately $80 million (Reference 8).
August 7 - August 21, 1981 (Tropical Storm Dennis)
Dennis crossed over the Florida Keys and made landfall as a Tropical Storm in southwest Florida near Flamingo. The storm then moved north up the Florida Peninsula and was
located at approximately 100 miles to the west of Jupiter Island at its closest proximity.
Only minor flooding from rainfall was reported. Beach erosion and residential and commercial structure damage was minimal. Storm related damages in southeast Florida
were approximately $25 million.
September 25 - October 1, 1984 (Tropical Storm Isidore)
Isidore made landfall as a Tropical Storm in Jupiter, passing near Hobe Sound and Stuart,
on September 27, 1984. Coastal flooding and beach erosion as well as some structural damage to residential and commercial structures was reported. Property damage is
estimated to be $1 million in southeast Florida.
July 31 - August 6, 1995 (Hurricane Erin)
Hurricane Erin made landfall to the north of Martin County near Vero Beach, Florida, on
August 2, 1995. The storm then crossed over the Florida Peninsula and made landfall again near Pensacola, Florida (Reference 9). Coastal erosion was limited to dune retreat and
minor flooding. Damages to residential and commercial properties in southeast Florida
exceeded $200 million.
October 1995 Rainfall Event
On October 18, 1995, 16.1 inches of rain fell in a 24 hour period. This intensity exceeds the 1-percent-annual chance event (Reference 9). The monthly total for October 1995 was 24.5
inches.
September 7 - September 17, 1999 (Hurricane Floyd)
Hurricane Floyd passed approximately 120 miles to the east of Martin County on September 14, 1999, as a Category 4 hurricane (Reference 10). The storm paralleled nearly
the entire east coast of Florida for approximately 150 miles. Minimal storm surge
(approximately 2 feet) and maximum winds of 50 mph (sustained winds of approximately
9
40 mph) in Martin County resulted in beach erosion and minor damage to residential and
commercial structures.
August 19, 2008 (Tropical Storm Fay)
Tropical Storm Fay impacted Martin County and adjacent communities on August 19, 2008. The National Weather Service official storm rainfall totals for various locations
throughout Martin County ranged from 9 inches in Hobe Sound to greater than 15 inches in
North Stuart. Tropical storm rainfall exceeding 24 inches was measured by the National Weather Service near Martin County. The excessive rainfall over a short duration
overwhelmed many drainage systems. As a result widespread flooding occurred on roads
and private property while the drainage systems recovered. This condition was exacerbated by high ground water tables and standing water in low-lying areas before the storm due to
by higher than average rainfall totals along the coastline during the summer months The
major affected areas were Jensen Beach, Golden Gate/Port Salerno Area, Hobe Sound
Area, Old Palm City, Palm City Farms, and Indiantown area. Flooding was also reported in Warner Creek, Haney Creek, and the Coral Gardens Canal drainage basins (Reference 11).
August 25 – August 30 (Tropical Storm Issac)
Tropical Storm Issac impacted Martin County by producing sustained wind of 20 to 25
miles per hour with gusts to 35 to 40 miles per hours and by dumping rainfall varying from 3 to 7 inches in a 24-hour period within the county boundary. Martin County officials
surveyed high water marks along various places within the county especially in Danforth
and Bessey Creek watersheds. A high water mark of 16.1’ NAVD88 was measured at
Leighton Farms Road along Danforth Creek (Reference 12).
2.4 Flood Protection Measures
Flood protection measures within Martin County include the Herbert Hoover Dike system and its associated flood gates which were designed and constructed in the 1950s to provide
protection from hurricane surge and high water-surface levels on Lake Okeechobee. The
Herbert Hoover Dike and floodgate system is operated and maintained by the USACE. The
adjacent western Martin County areas are generally protected from high frequency event flooding by the Herbert Hoover Dike. Presently, the Herbert Hoover Dike cannot be
certified by the USACE as being capable of providing flood protection during prolonged
periods of high lake levels of Lake Okeechobee, or during the 1-percent-annual-chance flood event. The overall stability of the Herbert Hoover Dike system is currently being
evaluated by the USACE to determine the extent of possible structural repairs and
rehabilitation necessary to provide more adequate flood protection. The dike system affecting Martin County has been evaluated by the USACE (References 13, 14 and 15).
Based on the evaluation completed to date, the USACE has determined that, until the
structural repairs and rehabilitation of the Herbert Hoover Dike are completed, the adjacent
low-lying floodplains and communities along the eastern reaches of the dike may be subject to flood inundation from Lake Okeechobee as a result of structural failure and
breaching of the dike due to piping and seepage. Through a separate study, jointly funded
by the USACE and FEMA (Reference 16 and 17), the affected areas subject to this potential flood hazard have been identified as described in Section 3.2. The resulting
1-percent-annual-chance-flood zones have been delineated and labeled on the FIRM for
Martin County as part of this study.
In addition to the Herbert Hoover Dike, there are other flood control canals, locks, and
pump stations near Lake Okeechobee, and in numerous other locations within Martin

10
County which are operated and maintained by the SFWMD. Along the shorelines of the
Atlantic coast and inland rivers and sounds, there are numerous individual seawalls and bulkheads that provide protection for private property but do not provide a
one-percent-annual chance flood protection capacity. A federally sponsored (USACE) and
maintained beach nourishment project is located along a 5-mile reach on Hutchinson
Island along the Atlantic Ocean coastal shoreline from the northern county limits to just south of the Stuart Beach Public Park. The beach nourishment project is co-sponsored by
the State of Florida and Martin County, but is not designed to provide protection during the
1-percent-annual-chance flood.
Other non-structural floodplain management measures within the county are exercised.
These include county zoning ordinances, building codes designed to reduce flood damage, and hurricane advisories and emergency plans. Flooding problems in the Danforth Creek,
Fern Creek, Manatee Creek and Warner Creek basin have led the county to implement
structural and non-structural channel modifications to mitigate flooding problems.
Available information concerning these flood protection measures were evaluated and incorporated into this countywide FIS, where appropriate.
3.0 ENGINEERING METHODS
For the flooding sources studied in detail in the community, standard hydrologic and hydraulic study methods were used to determine the flood hazard data required for this study. Flood events of
a magnitude that is expected to be equaled or exceeded once on the average during any 10-, 50-,
100-, or 500-year period (recurrence interval) have been selected as having special significance for
floodplain management and for flood insurance rates. These events, commonly termed the 10-, 50-, 100-, and 500-year floods, have a 10-, 2-, 1-, and 0.2-percent chance, respectively, of being equaled
or exceeded during any year. Although the recurrence interval represents the long-term average
period between floods of a specific magnitude, rare floods could occur at short intervals or even within the same year. The risk of experiencing a rare flood increases when periods greater than 1
year are considered. For example, the risk of having a flood that equals or exceeds the 100-year
flood (1-percent chance of annual exceedence) in any 50-year period is approximately 40-percent (4 in 10), and for any 90-year period, the risk increases to approximately 60-percent (6 in 10). The
analyses reported herein reflect flooding potentials based on conditions existing in the community
at the time of completion of this study. Maps and flood elevations will be amended periodically to
reflect future changes.
3.1 Hydrologic Analyses
Hydrologic analyses were carried out to establish the peak discharge-frequency
relationships for each flooding source studied by detailed methods affecting the
community.
October 4, 2002 FIS Countywide Study Stream gage records for the Loxahatchee River were statistically analyzed utilizing the
standard log-Pearson Type III distribution as recommended by the U.S .Water Resources
Council (Reference 18). Stream gage information for the Loxahatchee River was obtained from gage No. 227700 on the river near Jupiter; the gage has been in operation since 1971.
The USACE HEC-1 computer program was used to estimate the desired discharge
frequency relationships for Bessey Creek, South Fork St. Lucie River and East Fork Creek

11
(Reference 19). This methodology was appropriate for the characteristic drainage basin
conditions. Furthermore, the limited history of stream gauge records for these streams precluded effective statistical analysis. The HEC-1 modeling incorporated the SCS unit
hydrograph and kinematic wave routing methods. Parameters supplied to the model of
each stream included subbasin runoff curve numbers, lag times, stream cross sections, and
Manning's “n” roughness factors. Curve numbers were calculated using the SCS curve number methods based on Florida DOT aerial photographs at a scale of 1:25,000, and GIS
soils and land use coverages (References 20-22). Lag times were calculated using the
empirical SCS curve number formula (Reference 23). Calibration of the HEC-1 models for each study area was not performed due to a lack of sufficient stream gauge data. Existing
HEC-1 model setups were used with some modifications for the Bessey Creek basin
(Reference 24). The HEC-1 models were used to estimate peak discharges for the 10-, 2-, 1- and 0.2-percent-annual-chance exceedance floods for South Fork St. Lucie River,
Loxahatchee River and East Fork Creek. For Bessey Creek, the HEC-1 model was used to
estimate peak discharges for the 1- and 0.2-percent-annual-chance exceedance flood
events. For each storm events, total storm rainfall amounts were based on the TP-40 rainfall frequency atlas for a 24-hour storm duration (Reference 25).
This Countywide Restudy Analysis
For this countywide restudy, hydrologic analyses for Bessey Creek, Loxahatchee River,
South Fork St. Lucie River and the downstream portion of East Fork Creek were adopted
from the October 2002 FIS study. Also detailed hydrologic calculations for Danforth Creek, Manatee Creek, and Roebuck Creek were revised using the Integrated Channel and Pond
Routing (ICPR) program (Reference 26). New studies were performed for Fern Creek,
Unnamed Tributary 1 to Roebuck Creek, and Warner Creek using ICPR program. Martin
County provided ICPR models for Danforth Creek, Fern Creek, Manatee Creek, Roebuck Creek and Warner Creek. Martin County’s engineering consultant, CAPTEC Engineering
Inc, created ICPR models for these five streams as part of County’s stormwater
management plan for each of these streams (References 27-31). These stormwater management plans included construction of flood control structures and other basin wide
drainage improvements. As of September 2012, Martin County had substantially finished
the construction of the flood control structures within the watersheds of these five streams.
ICPR model is a one dimensional hydro-dynamic model simulates hydrology and hydraulics and estimates the flow and stages for the simulated duration at model nodes
along the stream. For each of the five streams, CAPTEC Engineering Inc. developed a
ICPR model that incorporated the flood control improvements. All ICPR models were reviewed and approved by SFWMD during the permitting phase for the construction of the
flood control improvements. The ICPR models applied SCS methodology to simulate the
hydrology for each stream.
Total rainfall depths were derived by interpolating available data from the SFWMD for 10-,
2-, 1- and 0.2-percent-annual-chance exceedance 24-hr storms. These depths correspond to
7.1, 10.4, 11.8, and 15.1 inches, respectively (Reference 32). For Danforth Creek, Manatee
Creek, Roebuck Creek and Unnamed Tributary 1 to Roebuck Creek, the ICPR model applied a 24-hour design storm duration to estimate stream flows for the 10-, 2-, 1- and
0.2-percent-annual-chance exceedance storm events.
For Fern Creek and Warner Creek, the model considered a 72 hour design storm event (based on SFWMD’s permit manual)to estimate flows for the 10-, 2-, 1- and
0.2-percent-annual-chance exceedance storm events (Reference 33). For internal boundary
conditions, the ICPR models for Fern Creek and Warner Creek uses the permitted flows
12
from a 72-hour storm event for a few basins that represent housing sub-divisions.
Therefore, the Fern Creek and Warner Creek models peak flows are based on a 72-hour storm event. Total rainfall depths derived by interpolating available data from the SFWMD
for 10-, 2-, 1- and 0.2-percent-annual-chance exceedance 72-hour storms were 9, 12, 14,
and 18.1 inches, respectively (Reference 33). Minor adjustments were made to these ICPR
models to reflect the latest rainfall depths and unit hydrograph’s peak factor of 284. For each stream, the ICPR model provided peak flows for the 10-, 2-, 1- and
0.2-percent-annual-chance exceedance 24-hour storm events.
For Coral Gardens Canal, East Fork Creek and Rowland Canal, frequency-discharges were developed using the USACE HEC-HMS computer program (Reference 34). The basins for
each stream were divided into sub-areas, and synthetic unit hydrographs were developed
for each sub-area using SCS methodology. Curve Numbers (CN) and time of concentrations (Tc) were calculated using the SCS method based on topography, soil, and
land cover data (Reference 35-36). Rainfall losses for all basins were based on SCS CN
loss rates. Where applicable, HEC-HMS models incorporated storage areas within each
basin to attenuate the flow from different rainfall events. Storage areas were delineated based on the terrain and aerials. The stage-storage volume relationships for these storage
areas were obtained by analyzing the terrain and using engineering judgment.
The HEC-HMS model considered the Delmarva Unit Hydrograph precipitation and SCS Florida Modified Type II distribution. Hydrograph routing in the main channel was
computed using the Muskingum-Cunge method. Eight point cross-sections were used for
each subbasin reach and were based on available surveyed cross section data. For Coral Gardens Canal and East Fork Creek, the HEC-HMS model provided peak flows for the 10-,
2-, 1- and 0.2-percent-annual-chance exceedance 24-hour storm events. For Rowland
Canal, the HEC-HMS model provided peak flows for the 1-percent-annual-chance
exceedance 24-hour storm event only.
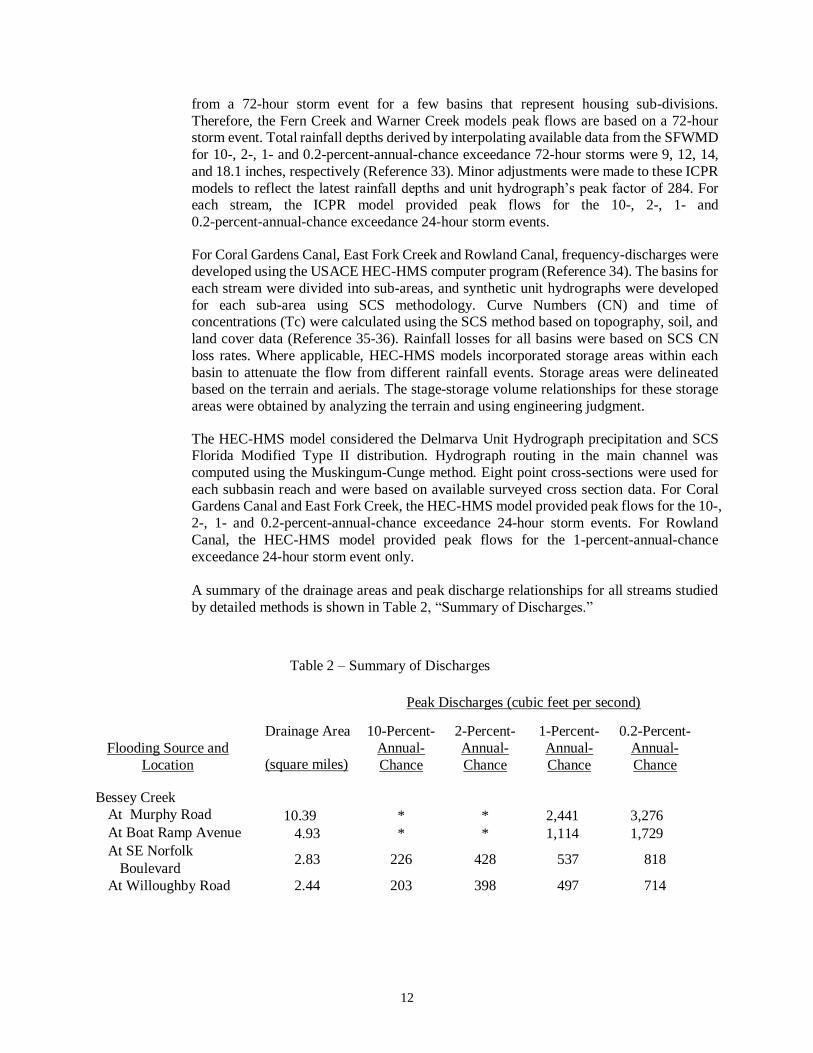
A summary of the drainage areas and peak discharge relationships for all streams studied
by detailed methods is shown in Table 2, “Summary of Discharges.”
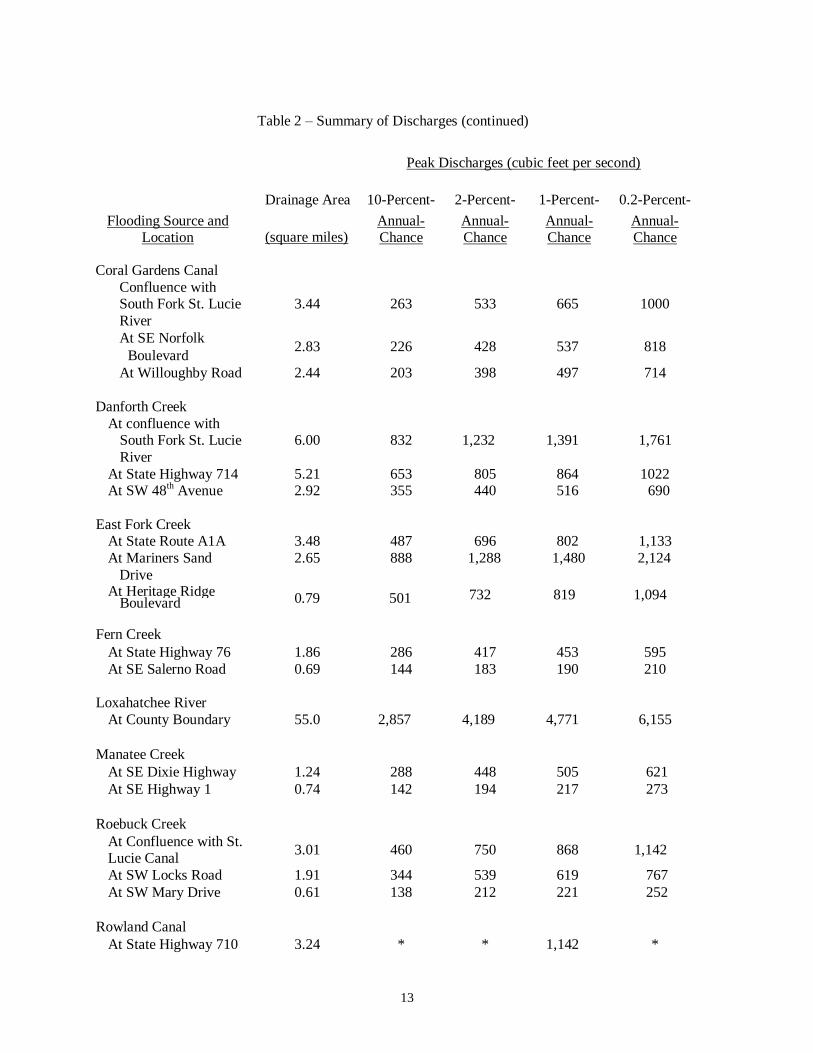
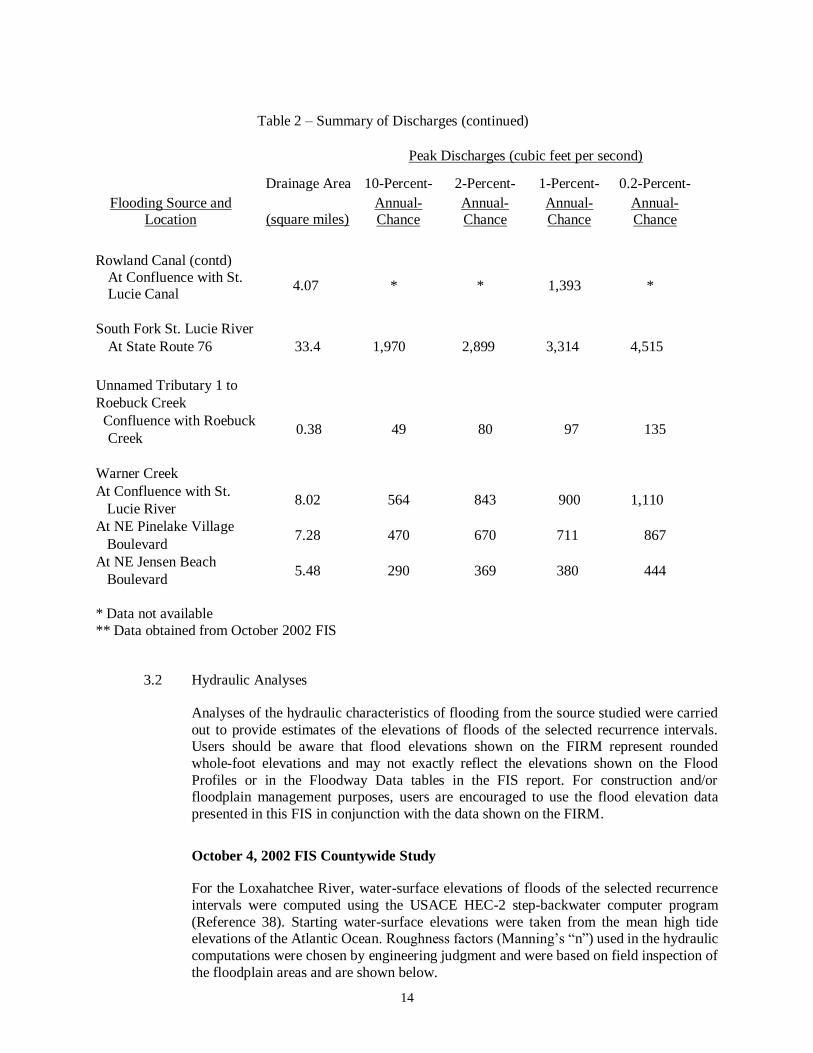
Table 2 – Summary of Discharges
Peak Discharges (cubic feet per second)
Drainage Area 10-Percent- 2-Percent- 1-Percent- 0.2-Percent-
Flooding Source and
Location (square miles) Annual-
Chance
Annual-
Chance
Annual-
Chance
Annual-
Chance
Bessey Creek
At Murphy Road 10.39 * * 2,441 3,276
At Boat Ramp Avenue 4.93 * * 1,114 1,729
At SE Norfolk
Boulevard 2.83 226 428 537 818
At Willoughby Road 2.44 203 398 497 714
13
Table 2 – Summary of Discharges (continued)
Peak Discharges (cubic feet per second)
Drainage Area 10-Percent- 2-Percent- 1-Percent- 0.2-Percent-
Flooding Source and Location (square miles)
Annual- Chance
Annual- Chance
Annual- Chance
Annual- Chance
Coral Gardens Canal
Confluence with South Fork St. Lucie
River
3.44 263 533 665 1000
At SE Norfolk
Boulevard 2.83 226 428 537 818
At Willoughby Road 2.44 203 398 497 714
Danforth Creek
At confluence with South Fork St. Lucie
River
6.00 832 1,232 1,391 1,761
At State Highway 714 5.21 653 805 864 1022 At SW 48
th Avenue 2.92 355 440 516 690
East Fork Creek At State Route A1A 3.48 487 696 802 1,133
At Mariners Sand
Drive
2.65 888 1,288 1,480 2,124
At Heritage Ridge Boulevard 0.79 501 732 819 1,094
Fern Creek
At State Highway 76 1.86 286 417 453 595
At SE Salerno Road 0.69 144 183 190 210
Loxahatchee River
At County Boundary 55.0 2,857 4,189 4,771 6,155
Manatee Creek
At SE Dixie Highway 1.24 288 448 505 621 At SE Highway 1 0.74 142 194 217 273
Roebuck Creek
At Confluence with St. Lucie Canal
3.01 460 750 868 1,142
At SW Locks Road 1.91 344 539 619 767
At SW Mary Drive 0.61 138 212 221 252
Rowland Canal
At State Highway 710 3.24 * * 1,142 *
14
Table 2 – Summary of Discharges (continued)
Peak Discharges (cubic feet per second)
Drainage Area 10-Percent- 2-Percent- 1-Percent- 0.2-Percent-
Flooding Source and Location (square miles)
Annual- Chance
Annual- Chance
Annual- Chance
Annual- Chance
Rowland Canal (contd)
At Confluence with St. Lucie Canal
4.07 * * 1,393 *
South Fork St. Lucie River
At State Route 76 33.4 1,970 2,899 3,314 4,515
Unnamed Tributary 1 to
Roebuck Creek
Confluence with Roebuck
Creek 0.38 49 80 97 135
Warner Creek
At Confluence with St.
Lucie River 8.02 564 843 900 1,110
At NE Pinelake Village
Boulevard 7.28 470 670 711 867
At NE Jensen Beach
Boulevard 5.48 290 369 380 444
* Data not available
** Data obtained from October 2002 FIS
3.2 Hydraulic Analyses
Analyses of the hydraulic characteristics of flooding from the source studied were carried
out to provide estimates of the elevations of floods of the selected recurrence intervals. Users should be aware that flood elevations shown on the FIRM represent rounded
whole-foot elevations and may not exactly reflect the elevations shown on the Flood
Profiles or in the Floodway Data tables in the FIS report. For construction and/or floodplain management purposes, users are encouraged to use the flood elevation data
presented in this FIS in conjunction with the data shown on the FIRM.
October 4, 2002 FIS Countywide Study
For the Loxahatchee River, water-surface elevations of floods of the selected recurrence
intervals were computed using the USACE HEC-2 step-backwater computer program
(Reference 38). Starting water-surface elevations were taken from the mean high tide elevations of the Atlantic Ocean. Roughness factors (Manning’s “n”) used in the hydraulic
computations were chosen by engineering judgment and were based on field inspection of
the floodplain areas and are shown below.

15
Cross sections were obtained from field surveys supplemented with the 1:2,400 scale aerial
photographs with 1 foot contour intervals covering the Bessey and Danforth Creek basin and the South Fork St. Lucie River basin and the 1:24,000 scale USGS topographic maps
(References 37 and 38). Surveys were tied into U.S. Coast and Geodetic Survey and FDOT
benchmarks. Cross section and bridge data for crossings over Bessey and Danforth Creeks
(not included in the existing model setup) were taken from FDOT bridge plans supplemented by field survey (Reference 39). Also based on field surveys, cross section
and bridge data for the South Fork St. Lucie River were provided by the SFWMD
(Reference 40).
Water-surface elevations of floods of the selected recurrence intervals were computed
using the USACE UNET and HEC-2 water-surface profile computer programs
(References 41-43). An unsteady, channel network (split-flow) hydraulic model based on the one-dimensional equations of motion, UNET was applied to two streams, Bessey
Creek and Danforth Creek, comprising an interconnected system. For this system, an
existing model setup, with necessary modifications, was applied to compute the peak
water-surface elevations associated with the 1- and 0.2-percent-annual-chance exceedance storm events (Reference 44). Based on the one-dimensional energy equation and standard
step computation method, HEC-2 was applied to four streams, East Fork Creek, Manatee
Creek, Roebuck Creek, and South Fork St. Lucie River. Mean high tide elevations were used as starting water-surface elevations for Roebuck Creek, East Fork Creek, and
Manatee Creek. The FDEP provided these values (Reference 45). The fiction-slope
method was used as the starting water surface elevation for South Fork St. Lucie River. For Bessey and Danforth Creek, the starting water-surface elevations established for the
existing model setups were used (References 24, 46, 47).
This Countywide Restudy Analysis
For this countywide restudy, hydraulic analyses for Bessey Creek, Loxahatchee River,
South Fork St. Lucie River and portion of East Fork Creek (from the confluence with
Manatee Creek to Mariner Sands Drive) were adopted from the October 2002 FIS study. For Coral Gardens Canal, East Fork Creek from Mariner Sands Drive to 950 feet upstream
of SE Constitution Boulevard, Roebuck Creek, and Rowland Canal water-surface
elevations from the selected recurrence intervals were computed using the USACE
HEC-RAS step-backwater computer program (Reference 48). For starting water surface elevations, backwater computations began at normal depth for all streams except East Fork
Creek. For East Fork Creek, starting water surface elevations at a point 100 feet upstream
of Mariner Sands Drive were obtained from the October 2002 FIS study. The HEC-HMS models provided the 10-, 2-, 1- and 0.2-percent-annual-chance exceedance storm peak
flows for Coral Gardens Canal, and East Fork Creek. For Roebuck Creek, the peak flows
for the 10-, 2-, 1- and 0.2-percent-annual-chance exceedance storm peak flows were obtained from Martin County’s ICPR model. For Rowland Canal, only the
1-percent-annual-chance exceedance peak flow was used in the HEC-RAS model. Flood
profiles were drawn showing computed water-surface elevations of floods of the selected
recurrence intervals.
Cross section geometries were obtained from a combination of digital terrain data provided
by Martin County and field surveys. For most detailed study streams, all bridges and
culverts were either field surveyed to obtain elevation data and structural geometry or were obtained from as-built drawings. Selected cross sections were field surveyed along the
streams to determine channel geometries between bridges and culverts. For the Roebuck
Creek HEC-RAS model, the channel and structure data was copied from the October 2,
16
2002 FIS study HEC-2 model. All channel data was supplemented with available LiDAR
data for overbank topography. LiDAR data was unavailable for the entire length of Rowland Canal, a portion of Danforth Creek upstream of the Florida Turnpike and a
portion of Roebuck Creek upstream of SW96th Street. For the areas without LiDAR data,
Martin County provided limited spot elevation datasets.
The Rowland Canal HEC-RAS model was developed using spot elevation data and surveyed channel data. Only the 1-percent-annual-chance exceedance storm event
elevations was simulated in the HEC-RAS model.
As stated in section 3.1, Martin County provided one-dimensional hydrodynamic ICPR models representing flood control improvements in Danforth Creek, Fern Creek, Manatee
Creek and Warner Creek. These ICPR models were reviewed and approved by Martin
County and SFWMD.
Locations of selected cross sections and nodes used in the hydraulic analyses are shown on
the Flood Profiles and on the Flood Insurance Rate Map.
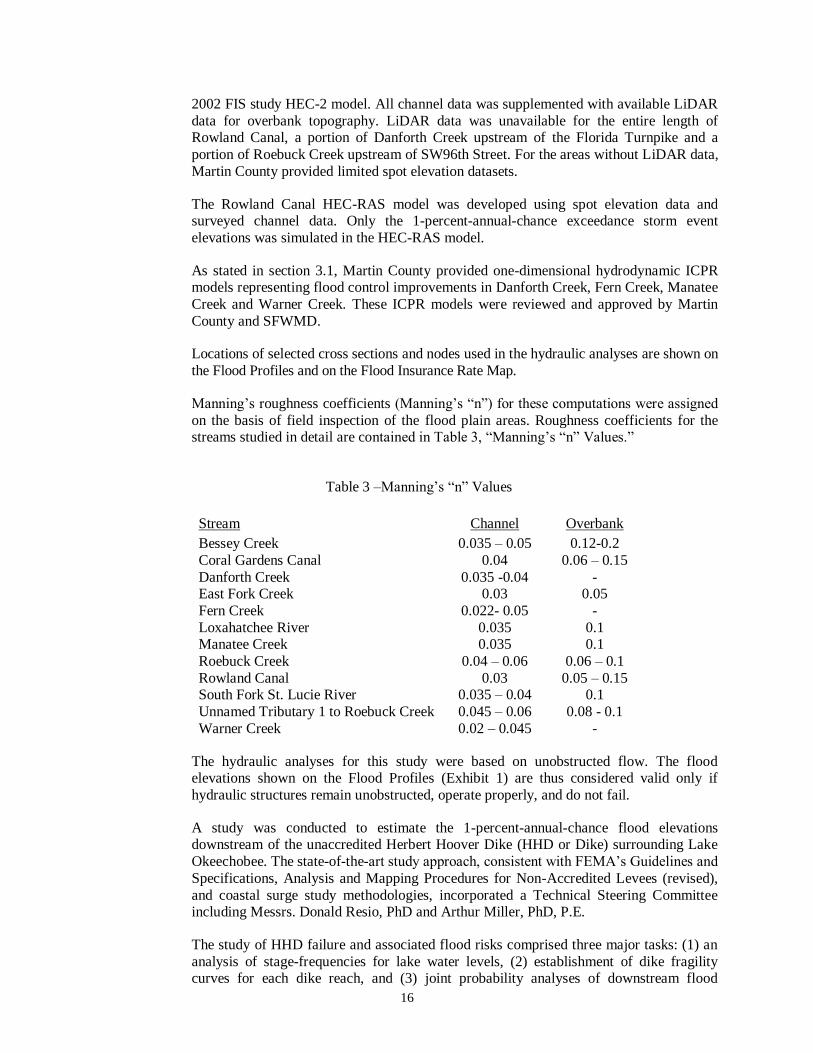
Manning’s roughness coefficients (Manning’s “n”) for these computations were assigned
on the basis of field inspection of the flood plain areas. Roughness coefficients for the streams studied in detail are contained in Table 3, “Manning’s “n” Values.”
Table 3 –Manning’s “n” Values
Stream Channel Overbank
Bessey Creek 0.035 – 0.05 0.12-0.2
Coral Gardens Canal 0.04 0.06 – 0.15
Danforth Creek 0.035 -0.04 - East Fork Creek 0.03 0.05
Fern Creek 0.022- 0.05 -
Loxahatchee River 0.035 0.1 Manatee Creek 0.035 0.1
Roebuck Creek 0.04 – 0.06 0.06 – 0.1
Rowland Canal 0.03 0.05 – 0.15 South Fork St. Lucie River 0.035 – 0.04 0.1
Unnamed Tributary 1 to Roebuck Creek 0.045 – 0.06 0.08 - 0.1
Warner Creek 0.02 – 0.045 -
The hydraulic analyses for this study were based on unobstructed flow. The flood elevations shown on the Flood Profiles (Exhibit 1) are thus considered valid only if
hydraulic structures remain unobstructed, operate properly, and do not fail.
A study was conducted to estimate the 1-percent-annual-chance flood elevations downstream of the unaccredited Herbert Hoover Dike (HHD or Dike) surrounding Lake
Okeechobee. The state-of-the-art study approach, consistent with FEMA’s Guidelines and
Specifications, Analysis and Mapping Procedures for Non-Accredited Levees (revised),
and coastal surge study methodologies, incorporated a Technical Steering Committee including Messrs. Donald Resio, PhD and Arthur Miller, PhD, P.E.
The study of HHD failure and associated flood risks comprised three major tasks: (1) an
analysis of stage-frequencies for lake water levels, (2) establishment of dike fragility curves for each dike reach, and (3) joint probability analyses of downstream flood
17
inundations created by various dike breach scenarios (11 breach locations and 8 lake water
levels). For a given water level behind the dike, task 1 established the frequency of occurrence of the water level, and task 2 established the associated dike failure probability.
Considering these probabilities, along with the results of the model simulations for various
lake level breaches, task 3 established the joint probability of HHD failure (failure rate at
each breach location) and corresponding probability of downstream flood elevations associated with dike breaching. The 1999 USACE Herbert Hoover Dike Major
Rehabilitation Evaluation Report, called the MRR, provided the critical lake
stage-frequency curve and dike fragility curves representing each reach (breach location) around HHD (Reference 16). A 2011 USACE study performed by Taylor Engineering
provided the advanced, two-dimensional hydrodynamic dam breach model (MIKE
modeling system) to simulate breaches and the associated downstream flooding caused by seepage/piping and slope stability (Reference 17). (This study did not address alternative
mechanisms of failure such as overtopping.) Because the USACE’s main study goal was
part of emergency planning, rather than mitigation and flood insurance rate map
production, this study included additional activities aimed at estimating 1-percent-annual- chance flood elevations, including additional hydrodynamic simulations and statistical
analyses.
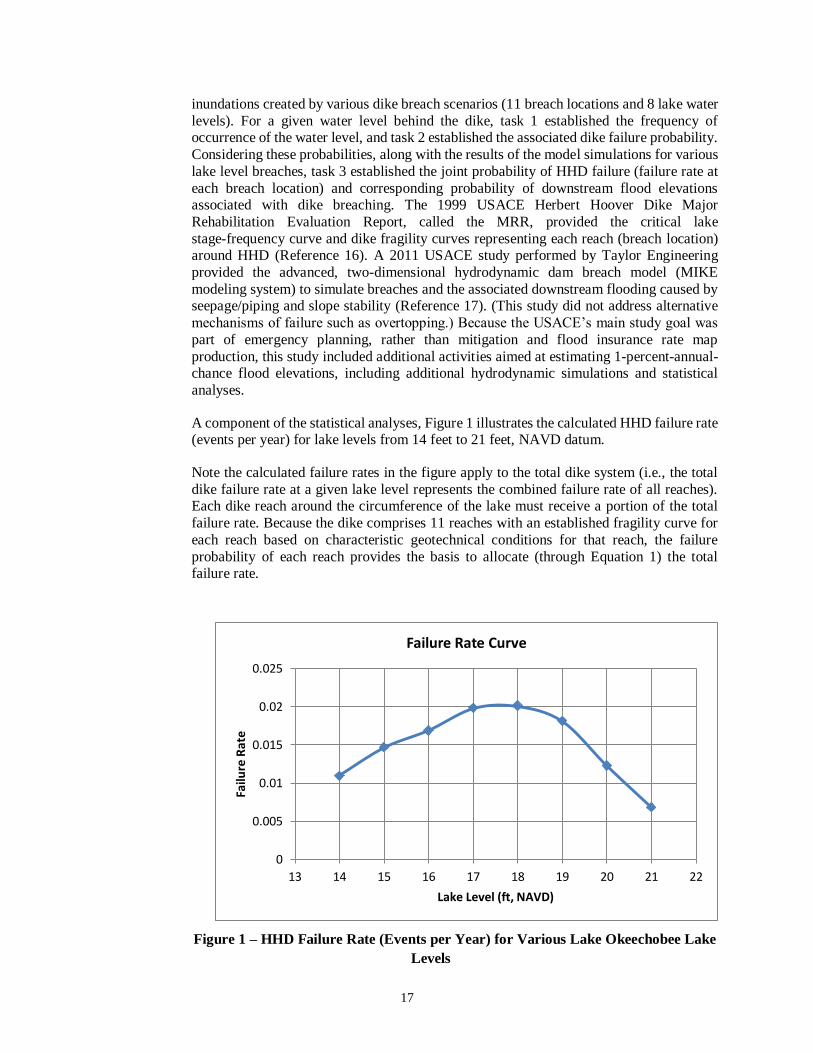
A component of the statistical analyses, Figure 1 illustrates the calculated HHD failure rate (events per year) for lake levels from 14 feet to 21 feet, NAVD datum.
Note the calculated failure rates in the figure apply to the total dike system (i.e., the total
dike failure rate at a given lake level represents the combined failure rate of all reaches). Each dike reach around the circumference of the lake must receive a portion of the total
failure rate. Because the dike comprises 11 reaches with an established fragility curve for
each reach based on characteristic geotechnical conditions for that reach, the failure
probability of each reach provides the basis to allocate (through Equation 1) the total failure rate.
Figure 1 – HHD Failure Rate (Events per Year) for Various Lake Okeechobee Lake
Levels
0
0.005
0.01
0.015
0.02
0.025
13 14 15 16 17 18 19 20 21 22
Failu
re R
ate
Lake Level (ft, NAVD)
Failure Rate Curve
18
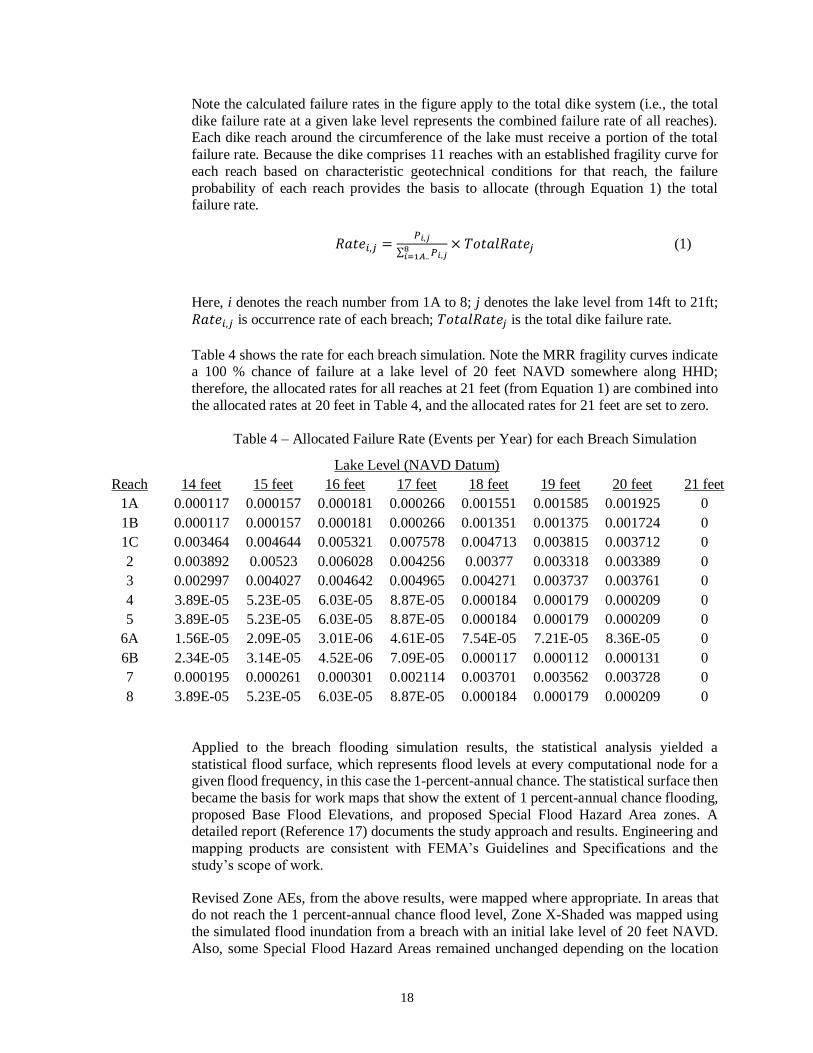
Note the calculated failure rates in the figure apply to the total dike system (i.e., the total
dike failure rate at a given lake level represents the combined failure rate of all reaches). Each dike reach around the circumference of the lake must receive a portion of the total
failure rate. Because the dike comprises 11 reaches with an established fragility curve for
each reach based on characteristic geotechnical conditions for that reach, the failure
probability of each reach provides the basis to allocate (through Equation 1) the total failure rate.
∑
(1)
Here, i denotes the reach number from 1A to 8; j denotes the lake level from 14ft to 21ft;
is occurrence rate of each breach; is the total dike failure rate.
Table 4 shows the rate for each breach simulation. Note the MRR fragility curves indicate a 100 % chance of failure at a lake level of 20 feet NAVD somewhere along HHD;
therefore, the allocated rates for all reaches at 21 feet (from Equation 1) are combined into
the allocated rates at 20 feet in Table 4, and the allocated rates for 21 feet are set to zero.
Table 4 – Allocated Failure Rate (Events per Year) for each Breach Simulation
Lake Level (NAVD Datum)
Reach 14 feet 15 feet 16 feet 17 feet 18 feet 19 feet 20 feet 21 feet
1A 0.000117 0.000157 0.000181 0.000266 0.001551 0.001585 0.001925 0
1B 0.000117 0.000157 0.000181 0.000266 0.001351 0.001375 0.001724 0
1C 0.003464 0.004644 0.005321 0.007578 0.004713 0.003815 0.003712 0
2 0.003892 0.00523 0.006028 0.004256 0.00377 0.003318 0.003389 0
3 0.002997 0.004027 0.004642 0.004965 0.004271 0.003737 0.003761 0
4 3.89E-05 5.23E-05 6.03E-05 8.87E-05 0.000184 0.000179 0.000209 0
5 3.89E-05 5.23E-05 6.03E-05 8.87E-05 0.000184 0.000179 0.000209 0
6A 1.56E-05 2.09E-05 3.01E-06 4.61E-05 7.54E-05 7.21E-05 8.36E-05 0
6B 2.34E-05 3.14E-05 4.52E-06 7.09E-05 0.000117 0.000112 0.000131 0
7 0.000195 0.000261 0.000301 0.002114 0.003701 0.003562 0.003728 0
8 3.89E-05 5.23E-05 6.03E-05 8.87E-05 0.000184 0.000179 0.000209 0
Applied to the breach flooding simulation results, the statistical analysis yielded a
statistical flood surface, which represents flood levels at every computational node for a given flood frequency, in this case the 1-percent-annual chance. The statistical surface then
became the basis for work maps that show the extent of 1 percent-annual chance flooding,
proposed Base Flood Elevations, and proposed Special Flood Hazard Area zones. A detailed report (Reference 17) documents the study approach and results. Engineering and
mapping products are consistent with FEMA’s Guidelines and Specifications and the
study’s scope of work.
Revised Zone AEs, from the above results, were mapped where appropriate. In areas that do not reach the 1 percent-annual chance flood level, Zone X-Shaded was mapped using
the simulated flood inundation from a breach with an initial lake level of 20 feet NAVD.
Also, some Special Flood Hazard Areas remained unchanged depending on the location
19
and flooding source, and Zone A’s were mapped where the 1-percent-annual chance flood
level was not determined due to lack of modeling data (breach location limitations).
The study also included coordination with stakeholders, specifically the USACE, South
Florida Water Management District, and local communities. Leveraging existing studies
and reports, including the USACE’s HHD breach model and MRR, also proved critical to
the cost-effective and timely completion of this scope of work. The USACE authorized the use of its HHD hydrodynamic breach model in May 2011 as the foundation for this study
and provided other supporting insight, information, and clarification about the MRR data,
Lake Okeechobee water levels and regulation, and ongoing HHD improvements.
3.3 Coastal Hydrologic Analyses
Coastal hydrologic analyses, the determination of storm surge elevations, were carried out
during the 1983 Flood Insurance Study (Reference 1) to establish the peak elevation-frequency relationship for floods of the selected recurrence intervals for each
flooding source studied in detail affecting the county. These same storm surge elevations
have been used for all subsequent studies.
October 4, 2002 FIS Countywide Study
Stillwater elevations for hurricane surges with 10-, 2-, 1-, and 0.2-percent-annual return periods were determined by Tetra Tech, Inc., for the Atlantic Ocean at the open coast,
Indian River, St. Lucie River, North and South Forks St. Lucie River, Intracoastal
Waterway, Hobe and Jupiter Sounds, North and Northwest Forks Loxahatchee River, and Lake Okeechobee, were determined by the joint probability method (Reference 1). The
storm populations were described by probability distributions of five parameters which
influence surge heights. These were central pressure depression (which measures the
intensity of the storm), radius to maximum winds, forward speed of the storm, shoreline crossing point, and crossing angle. These characteristics were described statistically based
upon an analysis of observed storms in the vicinity of Martin County; primary sources of
data for this were the National Climatic Center, Cry, Ho, Schwerdt, and Goodyear, the National Hurricane Research project, and the Monthly Weather Review (References
49-52). Digitized storm information for all storms from 1886 through 1977 was used to
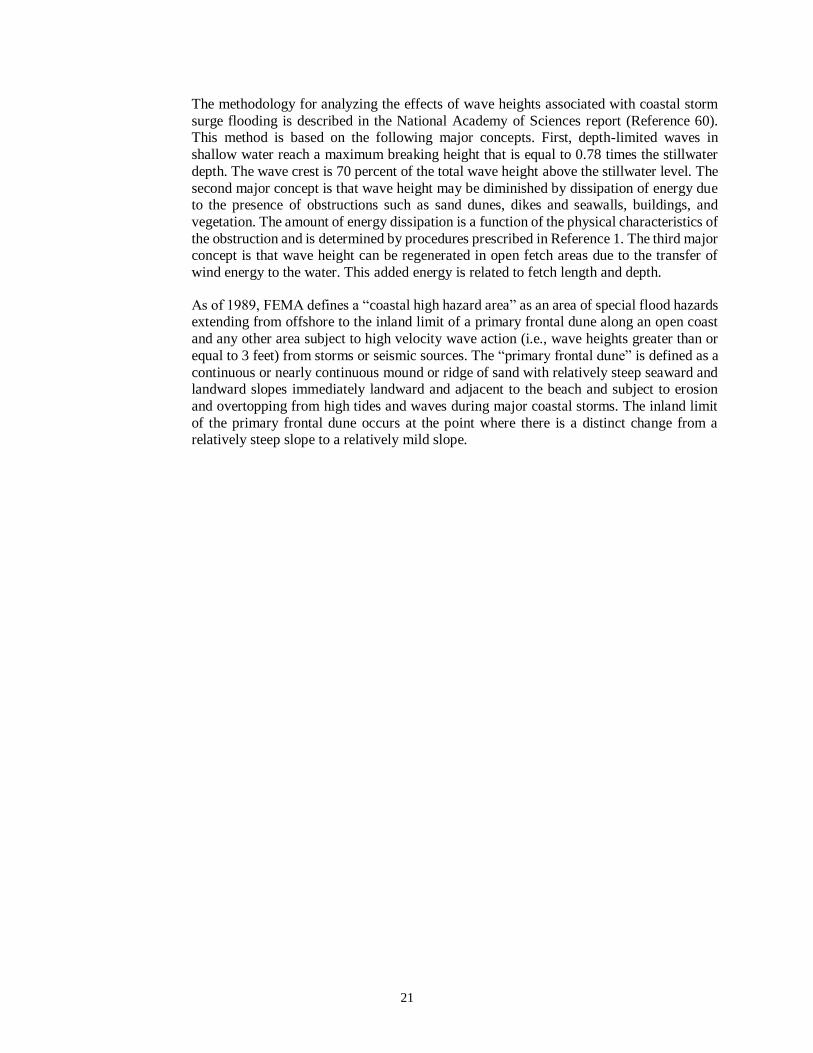
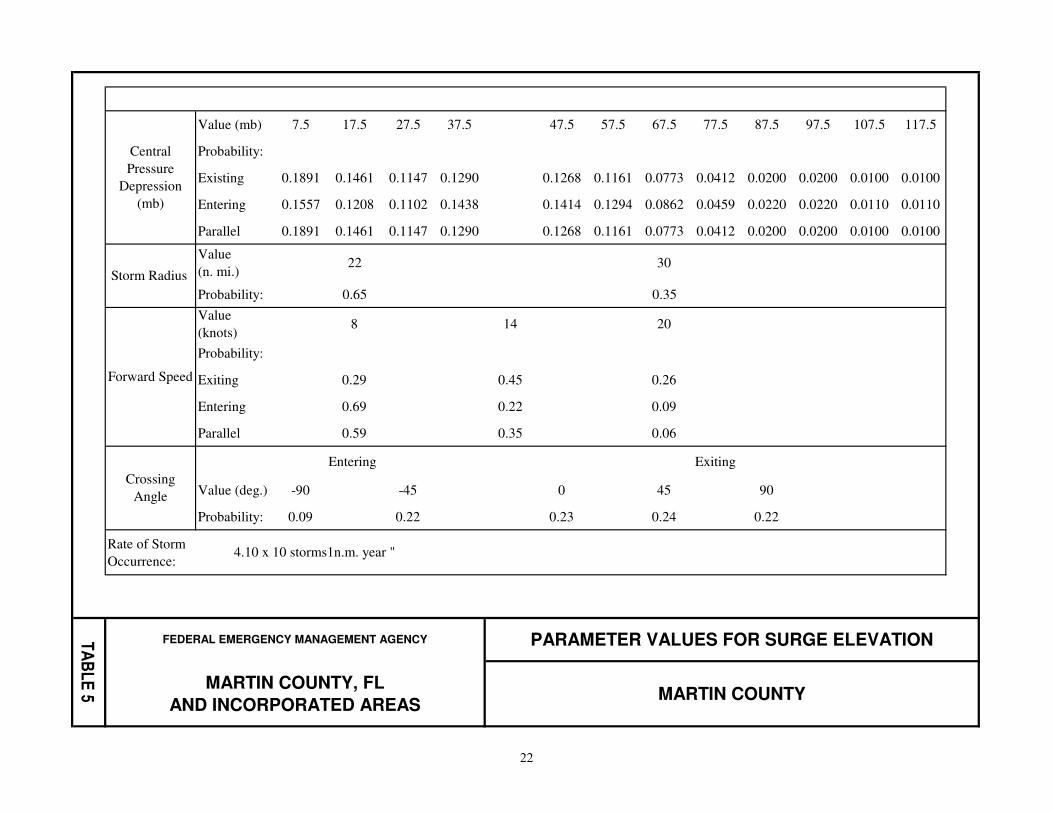
correlate statistics (Reference 53). Summaries of the parameters used for the Martin County coastal area and Lake Okeechobee are presented in Tables 5 and 6, respectively,
“Parameter Values for Surge Elevation.”
For areas subject to hurricane-surge flooding, the Flood Insurance Agency (FIA) standard coastal surge model was used to simulate the coastal surge generated by any chosen storm
(that is, any combination of the five storm parameters defined previously). Performing
surge simulations for a large number of storms, each of known total probability, permits one to establish the frequency distribution of surge height as a function of coastal location.
These distributions incorporate the large-scale surge behavior but do not include an
analysis of the added effects associated with much finer scale wave phenomena such as wave height, setup, and runup. As the final step in the calculations, the astronomical tide
for the region is statistically combined with the computed storm surge to yield recurrence
intervals of total water level (Reference 54).
The storm surge model utilized a grid pattern approximating the geographical features of
the study area and the adjoining areas to simulate flooding effects of hurricanes. Surges
20
were computed utilizing grids of 5 nautical miles, 5,000 feet, and 1,000 feet, depending on
the resolution required.
Underwater depth data and land heights for the model grid systems were obtained from
NOAA nautical charts and USGS topographic maps (References 38, 55-58).
For areas subject to flooding directly from Lake Okeechobee (inside Herbert Hoover Dike),
the FIA standard coastal surge model was used.
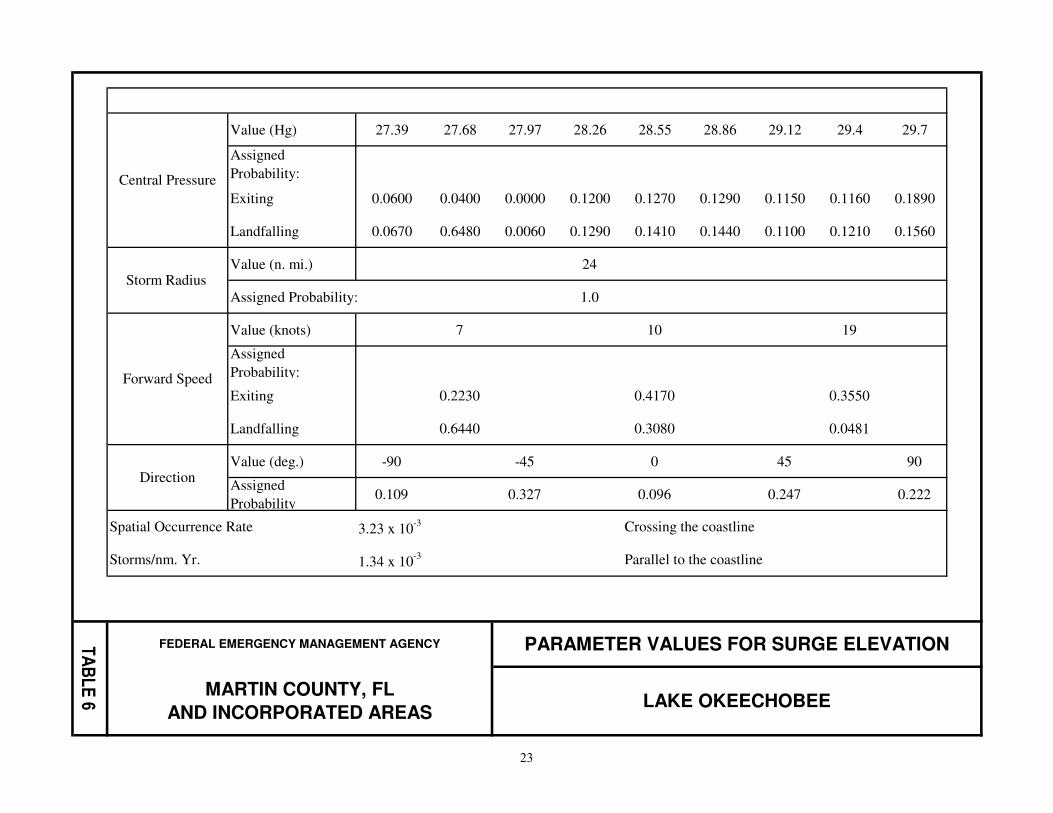
The stillwater elevations for the 10-, 2-, 1-, and 0.2-percent-annual chance floods for all
flooding sources subject to tidal surge have been determined and are summarized in Tables
5 and 6, “Parameter Values for Surge Elevation,” for Martin County and Lake Okeechobee, and in Table 7, “Summary of Stillwater Elevations.” The analyses reported herein reflect
the stillwater elevations due to tidal and wind setup effects.
This Countywide Restudy
The redelineation of the flood hazard zones from the October 2002 FIS includes adjusting the vertical datum from NGVD to NAVD datum. Vertical datum conversion (NGVD to NAVD) is -1.4 feet. Redelineation methods follow FEMA’s Guidelines and Specifications for Mapping Partners (Reference 59).
For areas outside of Herbert Hoover Dike, additional analyses described in Section 3.2
established the one-percent-annual-chance flood elevations.
We have included Tables 5 and 6 from the October 2002 FIS report and have adjusted elevations in Table 7 from the October 2002 FIS report to reflect elevations in NAVD datum.
3.4 Coastal Hydraulic Analyses
Coastal hydraulic analyses, as defined herein, consider the flooding effects of wind
generated waves on the stillwater levels described in Section 3.3 (coastal hydrologic analyses). Hydraulic analyses, considering storm characteristics and the shoreline and
bathymetric characteristics of the flooding sources studied, were carried out from earlier
studies to provide estimates of the elevations of the floods of the selected recurrence intervals along each of the shorelines. Users of the FIRM should also be aware that coastal
flood elevations are provided in the Summary of Stillwater Elevations table in this report.
If the elevation on the FIRM is higher than the elevation shown in this table, a wave height,
wave runup and/or wave setup component likely exists, in which case, the higher elevation should be used for construction and/or floodplain management purposes.
Data for the 1983 FIS Supplement-Wave Height Analysis were used for the 2002 and this
county-wide study. This data provided flood hazard mapping for all open coast and interior bays and estuaries. Unfortunately, the interior data for WHAFIS models and transect
locations were unavailable. Therefore, this study only presents the open coast transects
developed in the 2002 study.
October 4, 2002 FIS Countywide Study
As part of the October 2002 FIS study, stillwater surge elevations were revised to include
near shore wave setup. Based on the revised stillwater elevations, the coastal flood hazard
analyses included wave hindcasting, beach erosion, wave runup, wave height, and flood hazard mapping along the entire Martin County coastline. These tasks are described below.
21
The methodology for analyzing the effects of wave heights associated with coastal storm
surge flooding is described in the National Academy of Sciences report (Reference 60). This method is based on the following major concepts. First, depth-limited waves in
shallow water reach a maximum breaking height that is equal to 0.78 times the stillwater
depth. The wave crest is 70 percent of the total wave height above the stillwater level. The
second major concept is that wave height may be diminished by dissipation of energy due to the presence of obstructions such as sand dunes, dikes and seawalls, buildings, and
vegetation. The amount of energy dissipation is a function of the physical characteristics of
the obstruction and is determined by procedures prescribed in Reference 1. The third major concept is that wave height can be regenerated in open fetch areas due to the transfer of
wind energy to the water. This added energy is related to fetch length and depth.
As of 1989, FEMA defines a “coastal high hazard area” as an area of special flood hazards extending from offshore to the inland limit of a primary frontal dune along an open coast
and any other area subject to high velocity wave action (i.e., wave heights greater than or
equal to 3 feet) from storms or seismic sources. The “primary frontal dune” is defined as a
continuous or nearly continuous mound or ridge of sand with relatively steep seaward and landward slopes immediately landward and adjacent to the beach and subject to erosion
and overtopping from high tides and waves during major coastal storms. The inland limit
of the primary frontal dune occurs at the point where there is a distinct change from a relatively steep slope to a relatively mild slope.
Value (mb) 7.5 17.5 27.5 37.5 47.5 57.5 67.5 77.5 87.5 97.5 107.5 117.5
Probability:
Existing 0.1891 0.1461 0.1147 0.1290 0.1268 0.1161 0.0773 0.0412 0.0200 0.0200 0.0100 0.0100
Entering 0.1557 0.1208 0.1102 0.1438 0.1414 0.1294 0.0862 0.0459 0.0220 0.0220 0.0110 0.0110
Parallel 0.1891 0.1461 0.1147 0.1290 0.1268 0.1161 0.0773 0.0412 0.0200 0.0200 0.0100 0.0100
Value
(n. mi.)22 30
Probability: 0.65 0.35
Value
(knots)8 14 20
Probability:
Exiting 0.29 0.45 0.26
Entering 0.69 0.22 0.09
Parallel 0.59 0.35 0.06
Entering Exiting
Value (deg.) -90 -45 0 45 90
Probability: 0.09 0.22 0.23 0.24 0.22
Rate of Storm
Occurrence:
Central
Pressure
Depression
(mb)
Storm Radius
Forward Speed
TA
BL
E 5
PARAMETER VALUES FOR SURGE ELEVATION
MARTIN COUNTY MARTIN COUNTY, FL
AND INCORPORATED AREAS
FEDERAL EMERGENCY MANAGEMENT AGENCY
4.10 x 10 storms1n.m. year "
Crossing
Angle
22
Value (Hg) 27.39 27.68 27.97 28.26 28.55 28.86 29.12 29.4 29.7
Assigned
Probability:
Exiting 0.0600 0.0400 0.0000 0.1200 0.1270 0.1290 0.1150 0.1160 0.1890
Landfalling 0.0670 0.6480 0.0060 0.1290 0.1410 0.1440 0.1100 0.1210 0.1560
Value (n. mi.) 24
Assigned Probability: 1.0
Value (knots) 7 10 19
Assigned
Probability:
Exiting 0.2230 0.4170 0.3550
Landfalling 0.6440 0.3080 0.0481
Value (deg.) -90 -45 0 45 90
Assigned
Probability 0.109 0.327 0.096 0.247 0.222
3.23 x 10⁻³
1.34 x 10⁻³
TA
BL
E 6
FEDERAL EMERGENCY MANAGEMENT AGENCY
MARTIN COUNTY, FL
AND INCORPORATED AREAS
PARAMETER VALUES FOR SURGE ELEVATION
LAKE OKEECHOBEE
Direction
Central Pressure
Storm Radius
Forward Speed
Spatial Occurrence Rate
Storms/nm. Yr.
Crossing the coastline
Parallel to the coastline
23
24
Table 7 – Summary of Stillwater Elevations
ELEVATION (feet NAVD*)
FLOODING SOURCE AND LOCATION 10-Percent- 2-Percent- 1-Percent- 0.2-Percent-
Annual-
Chance
Annual-
Chance
Annual-
Chance
Annual-
Chance
ATLANTIC OCEAN
Open coast, including Intracoastal Waterway
from Great Pocket to Bridge Road 3.0 4.8 7.2 7.4
St. Lucie Inlet and Great Pocket 2.8 4.7 5.8 7.7
South Jupiter Narrows (north of Bridge Road) 3.0 4.8 5.6 7.4
Hobe Sound (south of Bridge Road) 2.2-2.5 ** 4.8-5.1 **
Jupiter Sound 2.1-2.2 ** 4.5-4.8 **
Northwest Fork Loxahatchee River 2.0-3.3 4.0-4.2 4.6 6.1
North Fork Loxahatchee River 2.1 4.0 4.5 6.0
INDIAN RIVER
North of Jensen Beach Bridge, and east side, from Jensen Beach Bridge to south of Baker
Point
1.9 4.9 6.0 8.0
East side, from south of Baker Point to St. Lucie
Inlet 2.8 4.7 5.9 7.7
West side, from Jensen Beach Bridge to Sewall's
Point 2.7 5.5 6.6 8.7
Entire shoreline within Sewall's Point 2.9 4.9 6.2 8.2
ST. LUCIE RIVER
Entire shoreline within Sewall's Point 2.9 4.9 6.2 8.2
Mouth to Ocean Boulevard, including Manatee
Pocket 3.1 4.9 6.1 8.2
Ocean Boulevard to U.S. Route 1 3.0 4.5 6.0 8.2
North and South Forks St. Lucie 3.0 4.5 6.0 8.2
LAKE OKEECHOBEE
Okeechobee County limits to north of Chancey
Bay 20.0 22.4 23.3 24.6
Chancey Bay Area 19.6 21.9 22.7 23.9
Confluence of St. Lucie Canal 19.3 21.3 22.1 23.3
Confluence of St. Lucie Canal to Palm Beach County limits
19.2 21.3 21.9 23.3
*North American Vertical Datum of 1988
**Data not available
25
For the City of Stuart, the October 2002 FIS includes a technical wave height analysis as
specified in FEMA's “Guidelines and Specifications for Wave Elevation Determination and V Zone Mapping” (Reference 61). The October 2002 FIS updates the 1980 and 1996
FIS on the basis of FEMA's updated determinations of “coastal high hazard area” and
“primary frontal dune,” field investigation, and development of topography and aerial
photography.
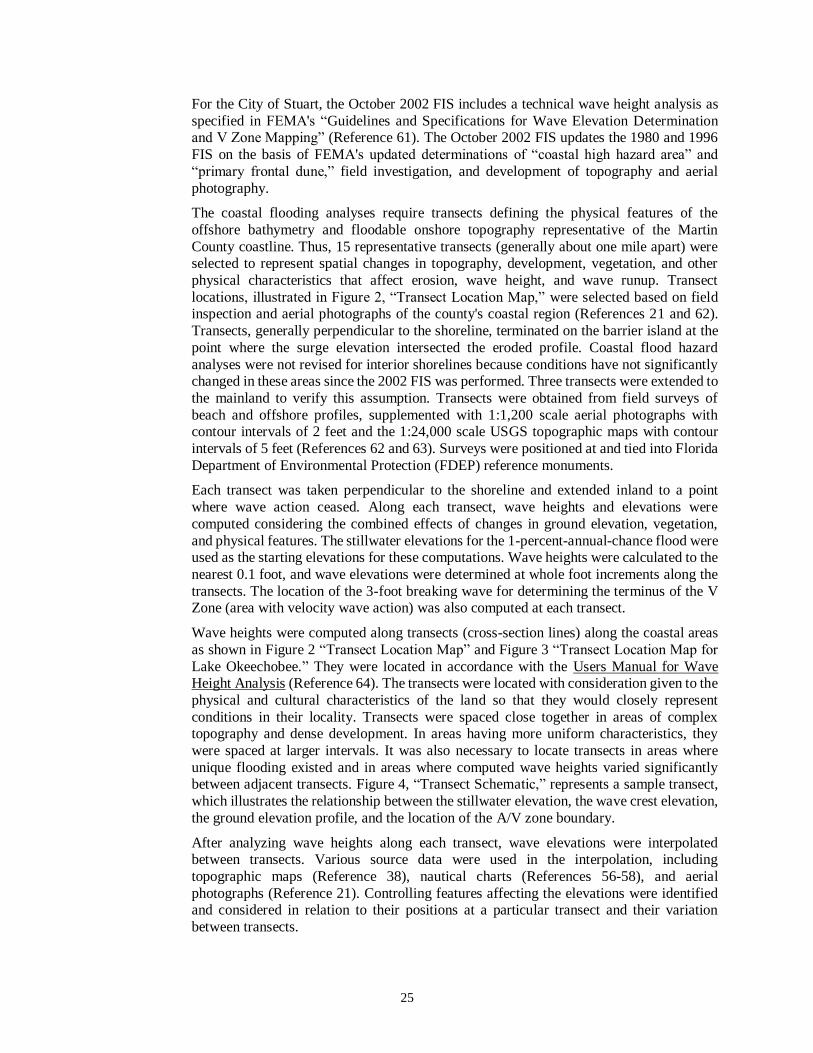
The coastal flooding analyses require transects defining the physical features of the
offshore bathymetry and floodable onshore topography representative of the Martin
County coastline. Thus, 15 representative transects (generally about one mile apart) were selected to represent spatial changes in topography, development, vegetation, and other
physical characteristics that affect erosion, wave height, and wave runup. Transect
locations, illustrated in Figure 2, “Transect Location Map,” were selected based on field inspection and aerial photographs of the county's coastal region (References 21 and 62).
Transects, generally perpendicular to the shoreline, terminated on the barrier island at the
point where the surge elevation intersected the eroded profile. Coastal flood hazard
analyses were not revised for interior shorelines because conditions have not significantly changed in these areas since the 2002 FIS was performed. Three transects were extended to
the mainland to verify this assumption. Transects were obtained from field surveys of
beach and offshore profiles, supplemented with 1:1,200 scale aerial photographs with contour intervals of 2 feet and the 1:24,000 scale USGS topographic maps with contour
intervals of 5 feet (References 62 and 63). Surveys were positioned at and tied into Florida
Department of Environmental Protection (FDEP) reference monuments.
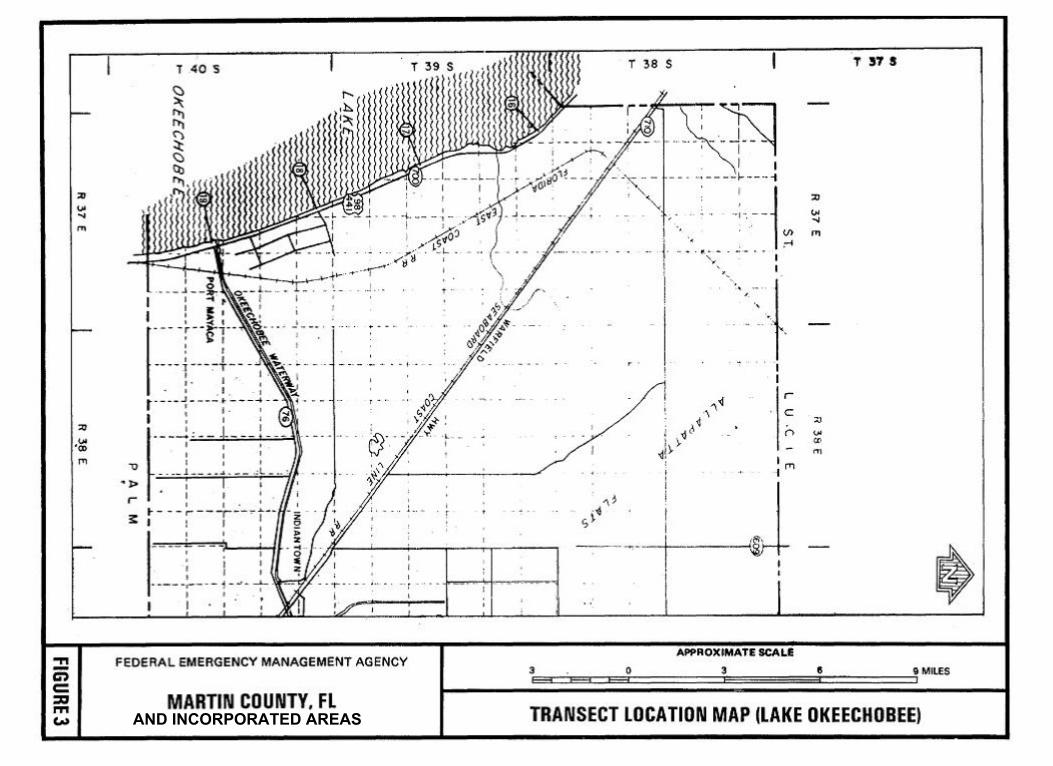
Each transect was taken perpendicular to the shoreline and extended inland to a point
where wave action ceased. Along each transect, wave heights and elevations were
computed considering the combined effects of changes in ground elevation, vegetation,
and physical features. The stillwater elevations for the 1-percent-annual-chance flood were used as the starting elevations for these computations. Wave heights were calculated to the
nearest 0.1 foot, and wave elevations were determined at whole foot increments along the
transects. The location of the 3-foot breaking wave for determining the terminus of the V Zone (area with velocity wave action) was also computed at each transect.
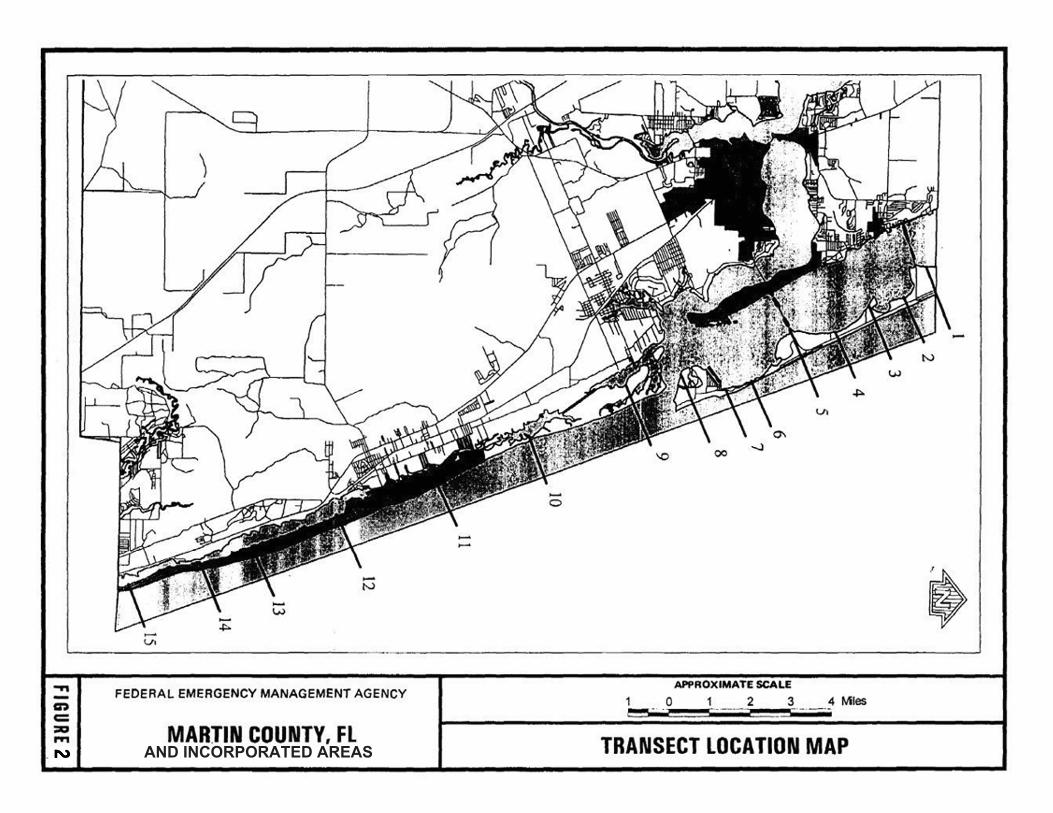
Wave heights were computed along transects (cross-section lines) along the coastal areas
as shown in Figure 2 “Transect Location Map” and Figure 3 “Transect Location Map for
Lake Okeechobee.” They were located in accordance with the Users Manual for Wave Height Analysis (Reference 64). The transects were located with consideration given to the
physical and cultural characteristics of the land so that they would closely represent
conditions in their locality. Transects were spaced close together in areas of complex topography and dense development. In areas having more uniform characteristics, they
were spaced at larger intervals. It was also necessary to locate transects in areas where
unique flooding existed and in areas where computed wave heights varied significantly between adjacent transects. Figure 4, “Transect Schematic,” represents a sample transect,
which illustrates the relationship between the stillwater elevation, the wave crest elevation,
the ground elevation profile, and the location of the A/V zone boundary.
After analyzing wave heights along each transect, wave elevations were interpolated between transects. Various source data were used in the interpolation, including
topographic maps (Reference 38), nautical charts (References 56-58), and aerial
photographs (Reference 21). Controlling features affecting the elevations were identified and considered in relation to their positions at a particular transect and their variation
between transects.
AND INCORPORATED AREAS
AND INCORPORATED AREAS
28
Figure 4 – Transect Schematic
Beach erosion was computed along each transect to determine the vertical and horizontal
limits of the eroded escarpment corresponding to the 1-percent-annual chance flood event using the stillwater elevations. As detailed in FEMA's Guidelines and Specifications for
Wave Elevation Determination and V Zone Mapping, transects with frontal dune
reservoirs exceeding 540 square feet are considered to experience dune retreat while those with reservoirs 20 less than 540 square feet are considered to experience dune removal
(References 61 and 65). Limited shore protection structures were identified within the
study area; however, they were excluded from this study because appropriate design
information was unavailable.
Based on the eroded profiles and the stillwater elevations, the wave envelope was
computed for each transect. The wave envelope represents the maximum vertical and
landward limit of wave activity and includes the wave crest and wave runup/wave setup elevations. The wave model WHAFIS provided the maximum expected wave crest
elevation along each transect (Reference 65). This methodology accounted for fetch length,
submerged bathymetry, and type and extent of land cover along each transect. Density, types and physical dimension of rigid and flexible vegetation, buildings, and other
structures (e.g., height, stem diameters, horizontal spacing, etc.) were considered based on
aerial photographs and field inspection.
FEMA's RUNUP model, based on wave runup/wave setup methodologies, then provided the maximum vertical limit of wave activity at the landward terminus of each transect
(Reference 65). Representative deep water wave height and period combinations
accompanying 1-percent-annual chance flooding events were obtained from available USACE Wave Information Studies (WIS) wave hindcast data. The hindcast wave climate
for the nearest location was examined statistically in terms of extreme value theory to
determine representative wave height-period combinations. The runup model was applied with wave heights ranging from the significant wave height to the wave height with an
exceedance probability of 95% and corresponding wave periods to estimate maximum
runup along each eroded transect.
Table 8 “Transect Descriptions,” includes a description of each transect location, 1-percent-annual chance stillwater elevation, and maximum 1-percent-annual chance wave
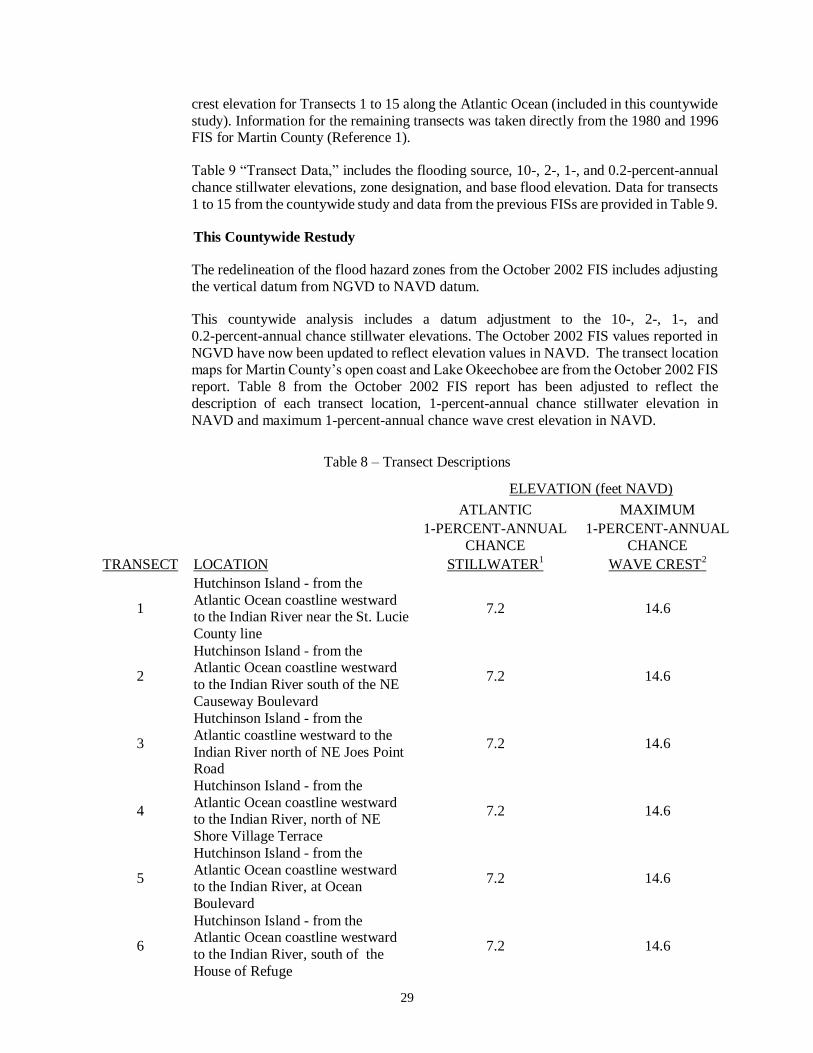
29
crest elevation for Transects 1 to 15 along the Atlantic Ocean (included in this countywide
study). Information for the remaining transects was taken directly from the 1980 and 1996 FIS for Martin County (Reference 1).
Table 9 “Transect Data,” includes the flooding source, 10-, 2-, 1-, and 0.2-percent-annual
chance stillwater elevations, zone designation, and base flood elevation. Data for transects
1 to 15 from the countywide study and data from the previous FISs are provided in Table 9.
This Countywide Restudy
The redelineation of the flood hazard zones from the October 2002 FIS includes adjusting
the vertical datum from NGVD to NAVD datum.
This countywide analysis includes a datum adjustment to the 10-, 2-, 1-, and
0.2-percent-annual chance stillwater elevations. The October 2002 FIS values reported in
NGVD have now been updated to reflect elevation values in NAVD. The transect location maps for Martin County’s open coast and Lake Okeechobee are from the October 2002 FIS
report. Table 8 from the October 2002 FIS report has been adjusted to reflect the
description of each transect location, 1-percent-annual chance stillwater elevation in
NAVD and maximum 1-percent-annual chance wave crest elevation in NAVD.
Table 8 – Transect Descriptions
ELEVATION (feet NAVD)
ATLANTIC MAXIMUM
1-PERCENT-ANNUAL
CHANCE
1-PERCENT-ANNUAL
CHANCE
TRANSECT LOCATION STILLWATER1 WAVE CREST
2
1
Hutchinson Island - from the
Atlantic Ocean coastline westward to the Indian River near the St. Lucie
County line
7.2 14.6
2
Hutchinson Island - from the Atlantic Ocean coastline westward
to the Indian River south of the NE
Causeway Boulevard
7.2 14.6
3
Hutchinson Island - from the
Atlantic coastline westward to the
Indian River north of NE Joes Point Road
7.2 14.6
4
Hutchinson Island - from the
Atlantic Ocean coastline westward to the Indian River, north of NE
Shore Village Terrace
7.2 14.6
5
Hutchinson Island - from the
Atlantic Ocean coastline westward to the Indian River, at Ocean
Boulevard
7.2 14.6
6
Hutchinson Island - from the Atlantic Ocean coastline westward
to the Indian River, south of the
House of Refuge
7.2 14.6

30
Table 8 – Transect Descriptions
ELEVATION (feet NAVD)
ATLANTIC MAXIMUM
1-PERCENT-ANNUAL
CHANCE
1-PERCENT-ANNUAL
CHANCE
TRANSECT LOCATION STILLWATER1 WAVE CREST
2
7
Hutchinson Island - From the
Atlantic Ocean coastline westward to the Indian River, North of SE
South Marina Way
7.2 14.6
8
Hutchinson Island - from the
Atlantic Ocean coastline westward to the Indian River, north of St.
Lucie Inlet
7.2 14.6
9
Jupiter Island - from the Atlantic
Ocean coastline westward to
the Indian River, south of St. Lucie Inlet
7.2 14.6
10
Jupiter Island - from the Atlantic Ocean coastline westward to the
Indian River, ending at SE Gomez
Avenue
7.2 14.6
11
Jupiter Island - from the Atlantic
Ocean coastline westward to the
Indian River, north of SE Marlin
Circle
7.2 14.6
12
Jupiter Island - from the Atlantic Ocean coastline westward to the
Indian River, just north of SE Reed
Place
7.2 14.6
13
Jupiter Island - from the Atlantic
Ocean coastline westward to the
Indian River, ending west of
Intracoastal Waterway
7.2 14.6
14
Jupiter Island - from the Atlantic
Ocean coastline westward to the Indian River, ending west of
Intracoastal Waterway
7.2 14.6
15
Jupiter Island - from the Atlantic
Ocean coastline westward to the Indian River, at SE Jupiter Inlet Way
7.2 14.6
1 Includes wave setup of 1.6 feet
2 Because of map scale limitations, the maximum wave elevation may not be shown on the FIRM

31
Table 9 – Transect Data
FLOODING SOURCE
BASE ELEVATION (feet NAVD)
10-PERCENT
ANNUAL CHANCE
2-PERCENT
ANNUAL CHANCE
1-PERCENT
ANNUAL CHANCE
0.2-PERCENT
ANNUAL CHANCE ZONE
FLOOD
ELEVATION (feet NAVD)
ATLANTIC
OCEAN Transects 1-15 3.0 4.8 7.2
1 7.4 VE 12-10
AE 8-5
LAKE OKEECHOBEE
Transect 1
20.0
22.4
23.3
24.6
VE
AE
31-29
17
Transects 2 – 3
19.6
21.9
22.7
23.9
VE AE
29-31 17
Transect 4 19.3 21.3 22.1 23.3 VE 29-27
AE 22 1 Includes wave setup of 1.6 feet
3.5 Vertical Datum
All FIS reports and FIRMs are referenced to a specific vertical datum. The vertical datum provides a starting point against which flood, ground, and structure elevations can be
referenced and compared. Until recently, the standard vertical datum in use for newly created or revised FIS reports and FIRMs was the National Geodetic Vertical Datum of
1929 (NGVD29). With the completion of the North American Vertical Datum of 1988
(NAVD88), many FIS reports and FIRMs are now prepared using NAVD as the referenced
vertical datum.
Some of the data used in this revision were taken from the prior effective FIS reports and
FIRM’s and adjusted to NAVD. The datum conversion factor from NGVD to NAVD in
Martin County is -1.4 feet.
Flood elevations shown in this FIS report and on the FIRM are referenced to the NAVD 88.
Structure and ground elevations in the country must, therefore, be referenced to the same
vertical datum. It is important to note that adjacent communities may be referenced to NGVD 29. This may result in differences in base flood elevations across the corporate
limits between the communities.
For more information regarding conversion between the NGVD 29 and NAVD 88, see the
FEMA publication entitled Converting the National Flood Insurance Program to the North American Vertical Datum of 1988, visit the National Geodetic Survey website at
www.ngs.noaa.gov, or contact the National Geodetic Survey at the following address:
NGS Information Services
32
NOAA, N/NGS12
National Geodetic Survey SSMC-3, #9202 1315 East-West Highway
Silver Spring, Maryland 20910-3282
(301)713-3242
Temporary vertical monuments are often established during the preparation of a flood hazard analysis for the purpose of establishing local vertical control. Although these
monuments are not shown on the FIRM, they may be found in the Technical Support Data
Notebook associated with the FIS report and FIRM for this community. Interested individuals may contact FEMA to access these data.
To obtain current elevation, description, and/or location information for benchmarks
shown on this map, please contact the Information Services Branch of the NGS at (301)713-3242, or visit their website at www.ngs.noaa.gov.
4.0 FLOODPLAIN MANAGEMENT APPLICATIONS
The NFIP encourages State and local governments to adopt sound floodplain management
programs. Therefore, each FIS provides 1-percent-annual-chance flood elevations and delineations of the 1- and 0.2-percent-annual-chance floodplain boundaries and 1-percent-annual-chance
floodway to assist communities in developing floodplain management measures. This information
is presented on the FIRM and in many components of the FIS report, including Flood Profiles,
Floodway Data table and Summary of Stillwater Elevations Table. Users should reference the data presented in the FIS report as well as additional information that may be available at the local map
repository before making flood elevation and/or floodplain boundary determinations.
4.1 Floodplain Boundaries
To provide a national standard without regional discrimination, the 1-percent-annual-chance flood has been adopted by FEMA as the base flood for floodplain
management purposes. The 0.2-percent-annual-chance flood is employed to indicate
additional areas of flood risk in the community. For each stream studied in detail, the 1- and 0.2-percent-annual-chance floodplain boundaries have been delineated using the flood
elevations determined at each cross section. Between cross sections, the boundaries were
interpolated using points and breaklines at a scale of 1:3000 with a contour interval of 0.5 feet.
The 1- and 0.2-percent-annual-chance floodplain boundaries are shown on the FIRM
(Exhibit 2). On this map, the 1-percent-annual-chance floodplain boundary corresponds to the boundary of the areas of special flood hazards (Zones A, AE, AO, VE); and the
0.2-percent-annual-chance floodplain boundary corresponds to the boundary of areas of
moderate flood hazards. In cases where the 1- and 0.2-percent-annual-chance floodplain
boundaries are close together, only the 1-percent-annual-chance floodplain boundary has been shown. Small areas within the floodplain boundaries may lie above the flood
elevations but cannot be shown due to limitations of the map scale and/or lack of detailed
topographic data.
For the streams studied by approximate methods, only the 1-percent-annual-chance
floodplain boundary is shown on the FIRM (Exhibit 2).

33
4.2 Floodways
Encroachment on floodplains, such as structures and fill, reduces flood-carrying capacity, increases flood heights and velocities, and increases flood hazards in areas beyond the
encroachment itself. One aspect of floodplain management involves balancing the
economic gain from floodplain development against the resulting increase in flood hazard.
For purposes of the NFIP, a floodway is used as a tool to assist local communities in this aspect of floodplain management. Under this concept, the area of the
1-percent-annual-chance floodplain is divided into a floodway and a floodway fringe. The
floodway is the channel of a stream, plus any adjacent floodplain areas, that must be kept free of encroachment so that the 1-percent-annual-chance flood can be carried without
substantial increases in flood heights. Minimum Federal standards limit such increases to
1.0 foot, provided that hazardous velocities are not produced. The floodways in this study are presented to local agencies as minimum standards that can be adopted directly or that
can be used as a basis for additional floodway studies.
The floodways presented in this study were computed for Coral Gardens Canal and
Roebuck Creek and Manatee Creek on the basis of equal-conveyance reduction from each side of the floodplain. For Coral Gardens Canal and Roebuck Creek, floodway widths were
computed at cross-sections. Between cross-sections, the floodway boundaries were
interpolated. For Manatee Creek, the ICPR model reports some hydraulic parameters at links, and some others at nodes. Base peak flows and base peak velocities are reported at
links, whereas the base water surface elevations, surcharges and floodway widths are
reported at nodes. Since the 1-percent-annual-chance flood is contained within the banks for almost the entire length of Manatee Creek, the floodway widths have been mapped at
top of banks. Manatee Creek has two storm water treatment ponds along it main channel.
Since these ponds contain the 1-percent-annual-chance flood within its banks, the
floodway was mapped along the top of the banks. Since the 2007 LIDAR data does not reflect the topography of these ponds and hence top of the banks were mapped based on the
2012 aerials (Reference 66). The results of the floodway computations are tabulated for
selected cross sections and nodes and provided in Table 10, “Floodway Data.” In cases where the floodway and 1-percent-annual-chance floodplain boundaries are either close
together or collinear, only the floodway boundary has been shown on the FIRM. Portions
of the floodway for Loxahatchee River extend beyond the county boundary.
Near the mouths of streams studied in detail, floodway computations are made without regard to flood elevations on the receiving water body. Therefore, “Without Floodway”
elevations presented in Table 6 for certain downstream cross-sections are lower than
regulatory flood elevations in that area, which must take into account the 1-percent-annual-chance flooding due to backwater from other sources.
Encroachment into areas subject to inundation by floodwaters having hazardous velocities
aggravates the risk of flood damage and heightens potential flood hazards by further increasing velocities. A listing of stream velocities at selected cross-sections is provided in
Table 10, “Floodway Data.” To reduce the risk of property damage in areas where the
stream velocities are high, the community may wish to restrict development in areas
outside the floodway.
The area between the floodway and the 1-percent-annual-chance floodplain boundaries is
termed the floodway fringe. The floodway fringe encompasses the portion of the
floodplain that could be completely obstructed without increasing the water-surface elevation of the 1-percent-annual-chance flood more than 1 foot at any point. Typical
relationships between the floodway and the floodway fringe and their significance to

34
floodplain development are shown in Figure 5, “Floodway Schematic.”
Figure 5 – Floodway Schematic
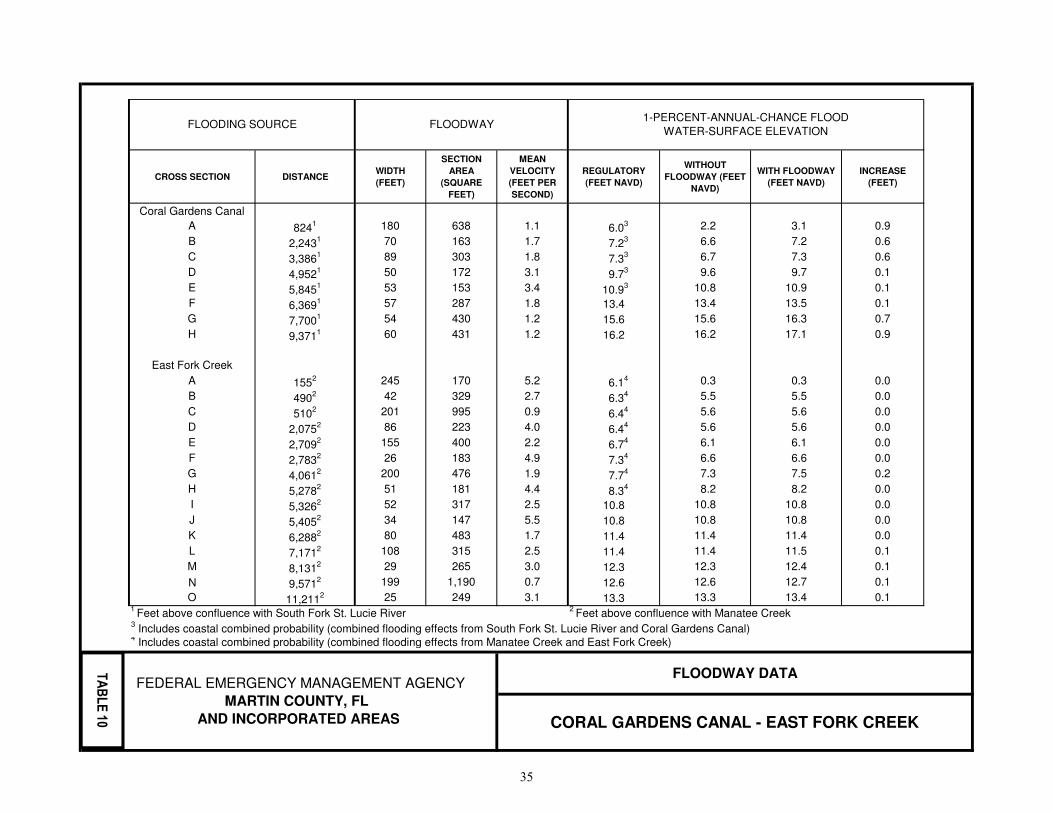
CROSS SECTION DISTANCEWIDTH
(FEET)
SECTION
AREA
(SQUARE
FEET)
MEAN
VELOCITY
(FEET PER
SECOND)
REGULATORY
(FEET NAVD)
WITHOUT
FLOODWAY (FEET
NAVD)
WITH FLOODWAY
(FEET NAVD)
INCREASE
(FEET)
Coral Gardens Canal
A 8241 180 638 1.1 6.0
3 2.2 3.1 0.9
B 2,2431 70 163 1.7 7.2
3 6.6 7.2 0.6
C 3,3861 89 303 1.8 7.3
3 6.7 7.3 0.6
D 4,9521 50 172 3.1 9.7
3 9.6 9.7 0.1
E 5,8451 53 153 3.4 10.9
3 10.8 10.9 0.1
F 6,3691 57 287 1.8 13.4 13.4 13.5 0.1
G 7,7001 54 430 1.2 15.6 15.6 16.3 0.7
H 9,3711 60 431 1.2 16.2 16.2 17.1 0.9
East Fork Creek
A 1552 245 170 5.2 6.1
4 0.3 0.3 0.0
B 4902 42 329 2.7 6.3
4 5.5 5.5 0.0
C 5102 201 995 0.9 6.4
4 5.6 5.6 0.0
D 2,0752 86 223 4.0 6.4
4 5.6 5.6 0.0
E 2,7092 155 400 2.2 6.7
4 6.1 6.1 0.0
F 2,7832 26 183 4.9 7.3
4 6.6 6.6 0.0
G 4,0612 200 476 1.9 7.7
4 7.3 7.5 0.2
H 5,2782 51 181 4.4 8.3
4 8.2 8.2 0.0
I 5,3262 52 317 2.5 10.8 10.8 10.8 0.0
J 5,4052 34 147 5.5 10.8 10.8 10.8 0.0
K 6,2882 80 483 1.7 11.4 11.4 11.4 0.0
L 7,1712 108 315 2.5 11.4 11.4 11.5 0.1
M 8,1312 29 265 3.0 12.3 12.3 12.4 0.1
N 9,5712 199 1,190 0.7 12.6 12.6 12.7 0.1
O 11,2112 25 249 3.1 13.3 13.3 13.4 0.1
1 Feet above confluence with South Fork St. Lucie River
2 Feet above confluence with Manatee Creek
3 Includes coastal combined probability (combined flooding effects from South Fork St. Lucie River and Coral Gardens Canal)
4 Includes coastal combined probability (combined flooding effects from Manatee Creek and East Fork Creek)
FLOODING SOURCE FLOODWAY1-PERCENT-ANNUAL-CHANCE FLOOD
WATER-SURFACE ELEVATION
FEDERAL EMERGENCY MANAGEMENT AGENCY
MARTIN COUNTY, FL
AND INCORPORATED AREAS
FLOODWAY DATA
CORAL GARDENS CANAL - EAST FORK CREEK
TA
BL
E 2
TA
BL
E 2
TA
BL
E 2
TA
BL
E 1
0
35
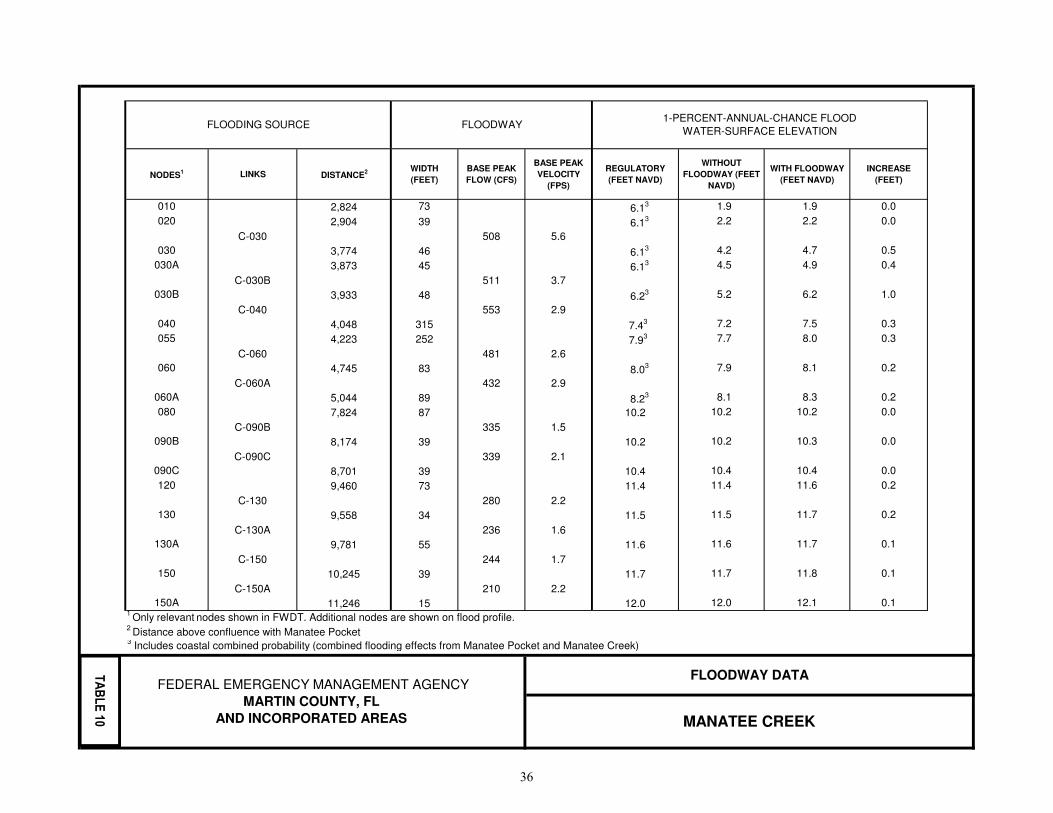
NODES1 LINKS DISTANCE
2 WIDTH
(FEET)
BASE PEAK
FLOW (CFS)
BASE PEAK
VELOCITY
(FPS)
REGULATORY
(FEET NAVD)
WITHOUT
FLOODWAY (FEET
NAVD)
WITH FLOODWAY
(FEET NAVD)
INCREASE
(FEET)
010 2,824 73 6.13 1.9 1.9 0.0
020 2,904 39 6.13 2.2 2.2 0.0
C-030 508 5.6
030 3,774 46 6.13 4.2 4.7 0.5
030A 3,873 45 6.13 4.5 4.9 0.4
C-030B 511 3.7
030B 3,933 48 6.23 5.2 6.2 1.0
C-040 553 2.9
040 4,048 315 7.43 7.2 7.5 0.3
055 4,223 252 7.93 7.7 8.0 0.3
C-060 481 2.6
060 4,745 83 8.03 7.9 8.1 0.2
C-060A 432 2.9
060A 5,044 89 8.23 8.1 8.3 0.2
080 7,824 87 10.2 10.2 10.2 0.0
C-090B 335 1.5
090B 8,174 39 10.2 10.2 10.3 0.0
C-090C 339 2.1
090C 8,701 39 10.4 10.4 10.4 0.0
120 9,460 73 11.4 11.4 11.6 0.2
C-130 280 2.2
130 9,558 34 11.5 11.5 11.7 0.2
C-130A 236 1.6
130A 9,781 55 11.6 11.6 11.7 0.1
C-150 244 1.7
150 10,245 39 11.7 11.7 11.8 0.1
C-150A 210 2.2
150A 11,246 15 12.0 12.0 12.1 0.11 Only relevant
nodes shown in FWDT. Additional nodes are shown on flood profile.
2 Distance above confluence with Manatee Pocket
3 Includes coastal combined probability (combined flooding effects from Manatee Pocket and Manatee Creek)
FLOODWAY1-PERCENT-ANNUAL-CHANCE FLOOD
WATER-SURFACE ELEVATION
FEDERAL EMERGENCY MANAGEMENT AGENCY
MARTIN COUNTY, FL
AND INCORPORATED AREAS
FLOODWAY DATA
MANATEE CREEK
FLOODING SOURCE
TA
BL
E 2
TA
BL
E 2
TA
BL
E 2
TA
BL
E 1
0
36
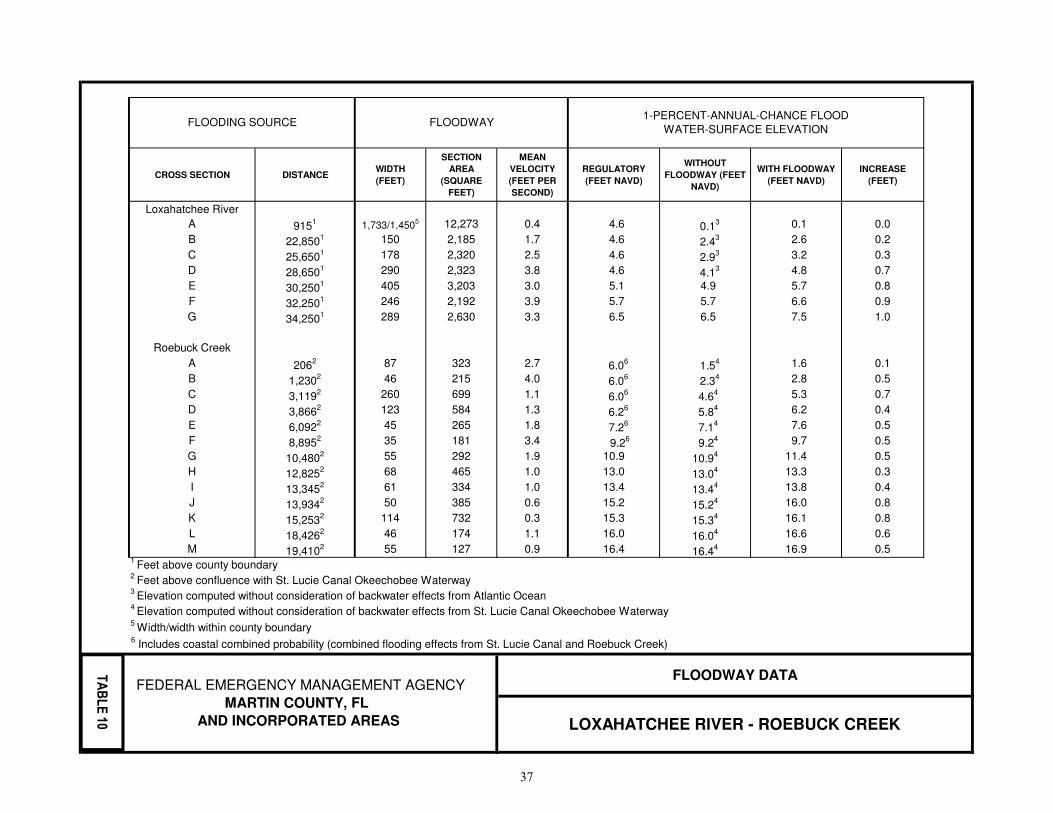
CROSS SECTION DISTANCEWIDTH
(FEET)
SECTION
AREA
(SQUARE
FEET)
MEAN
VELOCITY
(FEET PER
SECOND)
REGULATORY
(FEET NAVD)
WITHOUT
FLOODWAY (FEET
NAVD)
WITH FLOODWAY
(FEET NAVD)
INCREASE
(FEET)
Loxahatchee River
A 9151 1,733/1,450
5 12,273 0.4 4.6 0.13 0.1 0.0
B 22,8501 150 2,185 1.7 4.6 2.4
3 2.6 0.2
C 25,6501 178 2,320 2.5 4.6 2.9
3 3.2 0.3
D 28,6501 290 2,323 3.8 4.6 4.1
3 4.8 0.7
E 30,2501 405 3,203 3.0 5.1 4.9 5.7 0.8
F 32,2501 246 2,192 3.9 5.7 5.7 6.6 0.9
G 34,2501 289 2,630 3.3 6.5 6.5 7.5 1.0
Roebuck Creek
A 2062 87 323 2.7 6.0
6 1.5
4 1.6 0.1
B 1,2302 46 215 4.0 6.0
6 2.3
4 2.8 0.5
C 3,1192 260 699 1.1 6.0
6 4.6
4 5.3 0.7
D 3,8662 123 584 1.3 6.2
6 5.8
4 6.2 0.4
E 6,0922 45 265 1.8 7.2
6 7.1
4 7.6 0.5
F 8,8952 35 181 3.4 9.2
6 9.2
4 9.7 0.5
G 10,4802 55 292 1.9 10.9 10.9
4 11.4 0.5
H 12,8252 68 465 1.0 13.0 13.0
4 13.3 0.3
I 13,3452 61 334 1.0 13.4 13.4
4 13.8 0.4
J 13,9342 50 385 0.6 15.2 15.2
4 16.0 0.8
K 15,2532 114 732 0.3 15.3 15.3
4 16.1 0.8
L 18,4262 46 174 1.1 16.0 16.0
4 16.6 0.6
M 19,4102 55 127 0.9 16.4 16.4
4 16.9 0.51
Feet above county boundary2
Feet above confluence with St. Lucie Canal Okeechobee Waterway3
Elevation computed without consideration of backwater effects from Atlantic Ocean4
Elevation computed without consideration of backwater effects from St. Lucie Canal Okeechobee Waterway5
Width/width within county boundary6 Includes coastal combined probability (combined flooding effects from St. Lucie Canal and Roebuck Creek)
FLOODING SOURCE FLOODWAY1-PERCENT-ANNUAL-CHANCE FLOOD
WATER-SURFACE ELEVATION
FEDERAL EMERGENCY MANAGEMENT AGENCY
MARTIN COUNTY, FL
AND INCORPORATED AREAS
FLOODWAY DATA
LOXAHATCHEE RIVER - ROEBUCK CREEK
TA
BL
E 2
TA
BL
E 2
TA
BL
E 2
TA
BL
E 1
0
37
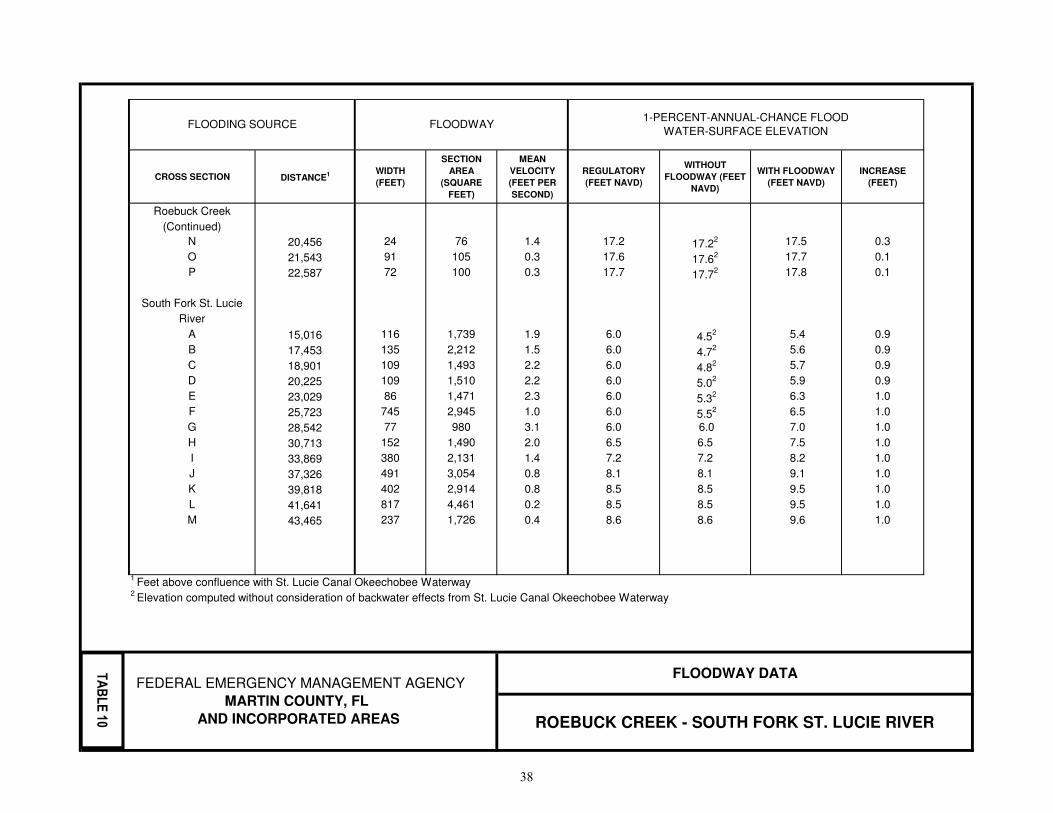
CROSS SECTION DISTANCE1 WIDTH
(FEET)
SECTION
AREA
(SQUARE
FEET)
MEAN
VELOCITY
(FEET PER
SECOND)
REGULATORY
(FEET NAVD)
WITHOUT
FLOODWAY (FEET
NAVD)
WITH FLOODWAY
(FEET NAVD)
INCREASE
(FEET)
Roebuck Creek
(Continued)
N 20,456 24 76 1.4 17.2 17.22 17.5 0.3
O 21,543 91 105 0.3 17.6 17.62 17.7 0.1
P 22,587 72 100 0.3 17.7 17.72 17.8 0.1
South Fork St. Lucie
River
A 15,016 116 1,739 1.9 6.0 4.52 5.4 0.9
B 17,453 135 2,212 1.5 6.0 4.72 5.6 0.9
C 18,901 109 1,493 2.2 6.0 4.82 5.7 0.9
D 20,225 109 1,510 2.2 6.0 5.02 5.9 0.9
E 23,029 86 1,471 2.3 6.0 5.32 6.3 1.0
F 25,723 745 2,945 1.0 6.0 5.52 6.5 1.0
G 28,542 77 980 3.1 6.0 6.0 7.0 1.0
H 30,713 152 1,490 2.0 6.5 6.5 7.5 1.0
I 33,869 380 2,131 1.4 7.2 7.2 8.2 1.0
J 37,326 491 3,054 0.8 8.1 8.1 9.1 1.0
K 39,818 402 2,914 0.8 8.5 8.5 9.5 1.0
L 41,641 817 4,461 0.2 8.5 8.5 9.5 1.0
M 43,465 237 1,726 0.4 8.6 8.6 9.6 1.0
1 Feet above confluence with St. Lucie Canal Okeechobee Waterway
2 Elevation computed without consideration of backwater effects from St. Lucie Canal Okeechobee Waterway
FLOODING SOURCE FLOODWAY1-PERCENT-ANNUAL-CHANCE FLOOD
WATER-SURFACE ELEVATION
FEDERAL EMERGENCY MANAGEMENT AGENCY
MARTIN COUNTY, FL
AND INCORPORATED AREAS
FLOODWAY DATA
ROEBUCK CREEK - SOUTH FORK ST. LUCIE RIVER
TA
BL
E 2
TA
BL
E 2
TA
BL
E 2
TA
BL
E 1
0
38

39
5.0 INSURANCE APPLICATIONS
For flood insurance rating purposes, flood insurance zone designations are assigned to a community based on the results of the engineering analyses. These zones are as follows:
Zone A
Zone A is the flood insurance risk zone that corresponds to the 1-percent-annual-chance
floodplains that are determined in the FIS by approximate methods. Because detailed hydraulic
analyses are not performed for such areas, no BFEs or base flood depths are shown within this zone.
Zone AE
Zone AE is the flood insurance risk zone that corresponds to the 1-percent-annual-chance
floodplains that are determined in the FIS by detailed methods. In most instances, whole-foot BFEs derived from the detailed hydraulic analyses are shown at selected intervals within this zone.
Zone AH
Zone AH is the flood insurance risk zone that corresponds to the areas of 1-percent-annual-chance
shallow flooding (usually areas of ponding) where average depths are between 1 and 3 feet.
Whole-foot BFEs derived from the detailed hydraulic analyses are shown at selected intervals within this zone.
Zone VE
Zone VE is the flood insurance risk zone that corresponds to the 1-percent-annual-chance coastal
floodplains that have additional hazards associated with storm waves. Whole-foot BFEs derived
from the detailed hydraulic analyses are shown at selected intervals within this zone.
Zone X
Zone X is the flood insurance risk zone that corresponds to areas outside the
0.2-percent-annual-chance floodplain, areas within the 0.2-percent-annual-chance floodplain,
areas of 1-percent-annual-chance flooding where average depths are less than 1 foot, areas of
1-percent-annual-chance flooding where the contributing drainage area is less than 1 square mile, and areas protected from the 1-percent-annual-chance flood by levees. No BFEs or base flood
depths are shown within this zone.
6.0 FLOOD INSURANCE RATE MAP
The FIRM is designed for flood insurance and floodplain management applications.
For flood insurance applications, the map designates flood insurance risk zones as described in Section 5.0 and, in the 1-percent-annual-chance floodplains that were studied by detailed methods,
shows selected whole-foot BFEs or average depths. Insurance agents use the zones and BFEs in
conjunction with information on structures and their contents to assign premium rates for flood insurance policies.
40
For floodplain management applications, the map shows by tints, screens, and symbols, the 1- and
0.2-percent-annual-chance floodplains, floodways, and the locations of selected cross sections used in the hydraulic analyses and floodway computations.
The current FIRM presents flooding information for the entire geographic area of Martin County.
This countywide FIRM also includes flood-hazard information that was historically presented separately on Floodway Maps (FBFMs), where applicable. Historical data relating to the maps
prepared for each community, prior to the initial FIRM, are presented in Table 11, “Community
Map History.”
7.0 OTHER STUDIES
The Flood Insurance Study for the unincorporated areas of Okeechobee, Palm Beach, and St. Lucie Counties is in agreement with this study (Reference 67-69).
Information pertaining to revised and unrevised flood hazards for each jurisdiction within Martin
County has been compiled into this FIS. Therefore, this FIS report supersedes or is compatible with
all previously printed FIS reports, FIRMs, and FBFMs for all jurisdictions within Martin County and should be considered authoritative for the purposes of the NFIP.
8.0 LOCATION OF DATA
Information concerning the pertinent data used in the preparation of this study can be obtained by
contacting Federal Insurance and Mitigation Division, FEMA Region IV, Koger-Center – Rutgers Building, 3003 Chamblee Tucker Road, Atlanta, Georgia 30341.
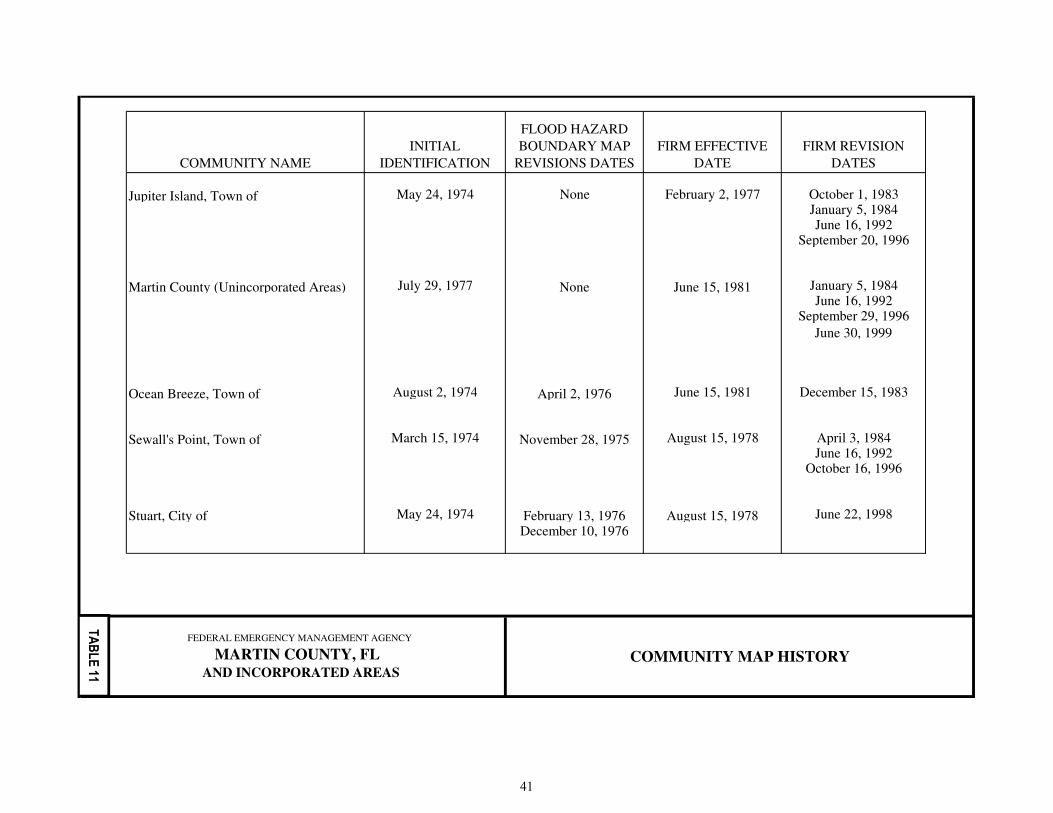
COMMUNITY NAME
INITIAL
IDENTIFICATION
FLOOD HAZARD
BOUNDARY MAP
REVISIONS DATES
FIRM EFFECTIVE
DATE
FIRM REVISION
DATES
Jupiter Island, Town of May 24, 1974 None February 2, 1977 October 1, 1983January 5, 1984June 16, 1992
September 20, 1996
Martin County (Unincorporated Areas) July 29, 1977 None June 15, 1981 January 5, 1984June 16, 1992
September 29, 1996
June 30, 1999
Ocean Breeze, Town of August 2, 1974 April 2, 1976 June 15, 1981 December 15, 1983
Sewall's Point, Town of March 15, 1974 November 28, 1975 August 15, 1978 April 3, 1984June 16, 1992
October 16, 1996
Stuart, City of May 24, 1974 February 13, 1976 August 15, 1978 June 22, 1998
December 10, 1976
FEDERAL EMERGENCY MANAGEMENT AGENCY
MARTIN COUNTY, FL
AND INCORPORATED AREAS
COMMUNITY MAP HISTORY
TA
BL
E
TA
BL
E
TA
BL
E
TA
BL
E 1
1
41
42
9.0 REFERENCES AND BIBLIOGRAPHY
1. Federal Emergency Management Agency, Federal Insurance Administration, Flood
Insurance Study. Martin County, Florida (Unincorporated Areas), Washington, D.C.,
December 15, 1980 (FIS Report), July 5, 1983 (Supplement- Wave Height Analysis), September 26, 1996 (Flood Insurance Rate Map)
2. Federal Emergency Management Agency, Flood Insurance Study Report. Martin County, Florida And Unincorporated Areas, October 4, 2002
3. United States Census Bureau, 2010 Population estimates for Martin County, website link,
http://quickfacts.census.gov/qfd/states/12/12085.html
4. Martin County Information Services Department, County statistics, Worldwide Web
Homepage.
5. St. Johns River and South Florida Water Management Districts, Indian River Lagoon Joint
Reconnaissance Report, Submitted to the Florida Department of Environmental Regulation [now the Florida Department of Environmental Protection] and OCRM/NOAA,
November 1987.
6. Florida Division of Emergency Management, LiDAR Data Collection, 2007.
7. McCollurn, S. H. and Cruz, O. E., Soil Survey of Martin County Area Florida, U.S.
Department of Agriculture, Soil Conservation Service, Stuart, Florida, 1981.
8. Barnes, Jay, Florida' s Hurricane History, 1998.
9. Federal Emergency Management Agency, Internet Site,
http://www.fema.gov/library/arch.htrn, November 1999.
10. USA Today, Internet Site, http://www.usatoday.com/weather/hurricane, November, 1999.
11. Martin County Engineering Department, Tropical Storm Fay Flooded Area Report,
November 2008.
12. Martin County Engineering Department, Personal Communication with Michael O’Brien,
August 13, 2012.
13. URS Greiner Woodward-Clyde, Inc., Independent Technical Review, Deterministic
Analysis. Herbert Hoover Dike, Tampa, Florida, August 24, 1998.
14. U.S. Army Corps of Engineers, Jacksonville District, Herbert Hoover Dike, Major
Rehabilitation Evaluation Report, Appendix I, Hydrology and Hydraulics Analysis, March
1999.
15. U.S. Army Corps of Engineers, Jacksonville District, Herbert Hoover Dike, Major
Rehabilitation Evaluation Report, Appendix H, Geotechnical Evaluation, Volumes I and II,
March 1999.
43
16. U.S Army Corps of Engineers – Jacksonville District, Herbert Hoover Dike Dam Break
Analysis – Dam Break and Flood Routing Model Simulations for Reaches 1 -8 and Modeling Uncertainties and Sensitivities, Okeechobee, Martin, Palm Beach, Hendy and
Glades Counties, Florida, prepared by Taylor Engineering Inc., Jacksonville, Florida,
February 2011.
17. Federal Emergency Management Agency, Flood Hazard Mapping for Herbert Hoover
Dike and Lake Okeechobee Pilot Study Draft Report, prepared by Taylor Engineering Inc.,
AECOM Inc., Members of Watershed IV Alliance, September 2012.
18. U.S. Water Resources Council, Hydrology Committee, “Guidelines for Determining Flood
Flow Frequency,” Bulletin 17A, June 1977.
19. U.S. Army Corps of Engineers, Hydrologic Engineering Center, HEC-1 Flood Hydrograph
Package, (Version 4.0.1 E), Davis, California, May 1991.
20. U.S. Soil Conservation Service, Urban Hydrology for Small Watersheds (Technical
Release No. 59, Littleton, Colorado: Water Resources Publications, 1986.
21. Florida Department of Transportation, Aerial Photographs, Martin County, Tallahassee,
Florida, 1992 and 1996.
22. Martin County Information Services Department, GIS coverages, Worldwide Web
Homepage.
23. P.B. Bedient and W.C. Huber, Hydrology and Flood Plain Analysis, New York: Addison- Wesley, 1988.
24. J. Needle, Basin Study of the Bessey and Danforth Creek System - Report 1, Upper District Planning Division, South Florida Water Management District, West Palm Beach, Florida,
February 1992.
25. D.M. Hershfield, U. S. Department of Commerce, Weather Bureau, Technical Paper No. 40, Rainfall Frequency Atlas of the United States, Washington, D.C., 1961.
26. Streamline Technologies Inc., Integrated Channel and Pond Routing Program, Version 3.10 Service Pack 8, Winter Springs, FL
27. Martin County Engineering Department, Danforth Creek Stormwater Quality Retrofit – Final Engineering Report, prepared by Captec Engineering Inc., Stuart, FL, February 2011.
28. Martin County Engineering Department, Fisherman’s Cove Coral Gardens Basin – Final
Engineering Report, prepared by Captec Engineering Inc., Stuart, FL, December 2002.
29. Martin County Engineering Department, Manatee Creek Storm Water Quality Retrofit,
prepared by Captec Engineering Inc., Stuart, FL, April 2009.
30. Martin County Engineering Department, Tropical Farms Water Quality Retrofit -
Stormwater Management System, prepared by Captec Engineering Inc., Stuart, FL, March 2008.
44
31. Martin County Engineering Department, Warner Creek Water Quality Retrofit-
Stormwater Management System, prepared by Captec Engineering Inc., Stuart, FL, January 2009.
32. Pathak Chandra S., Frequency Analysis of Daily Rainfall Maxima for Central and South
Florida, South Florida Water Management District Technical Publication EMA#390, January 2001.
33. South Florida Water Management District, Basis of Review for Environmental Resource Permit Applications within the South Florida Water Management District, August 2000.
34. U.S Army Corps of Engineers, Hydrologic Engineering Center, Hydrologic Modeling System (HEC-HMS) Version 3.4, Davis, California, August 2009
35. U.S Department of Agriculture - Natural Resources Conservation Service, Soil Survey
Geographic (SSURGO) database for Martin County, Florida, 2012
36. South Florida Water Management District, Land cover and Land use within South Florida
Water Management District GIS dataset, 2004.
37. Abrams Aerial Survey Corporation, lV=200 feet aerial contours for the South Fork St.
Lucie River, prepared for the South Florida Water Management District, March 2,1983.
38. U.S. Department of the Interior, Geological Survey, 7.5-Minute Series Topographic Maps,
Scale 1:24,000, Contour Interval 5 Feet: Okeechobee 4 NW, 1953, photorevised 1970;
Okeechobee 4 NE, 1953, photorevised 1970; Indiantown NW, Florida, 1953, photorevised 1970; Palm City, Florida, 1 948, photorevised 1970; St. Lucie Inlet, Florida, 1948,
photorevised 1970; Okeechobee SE, Florida, 1971; Okeechobee 4 SW, Florida, 1953,
photorevised 1970; Okeechobee 4 SE, Florida, 1953, photorevised 1970; Indiantown, Florida, 1 953, photorevised 1970; Indiantown SE, Florida, 1953, photorevised 1970;
Gomez, Florida, 1948, photorevised 1967; Hobe Sound, Florida, 1948, photorevised 1967;
Port Mayaca, Florida, 1971; West Palm Beach 2 NW, Florida, 1970; West Palm Beach 2
NE, Florida, 1970; Rood, Florida, 1 948, photorevised 1 973; Jupiter, Florida, 1948, photorevised 1967.
39. Florida Department of Transportation and Florida State Turnpike Authority, Bridge Plans - S.W. Murphy Road over Bessey Creek, Martin Downs Boulevard over Danforth Creek,
and Florida Turnpike over Bessey Creek, December 1977 and August 31,1995.
40. GCY, Inc., South Fork St. Lucie River special purpose surveys, Prepared by the South
Florida Water Management District, October 6, 1995.
41. U.S. Army Corps of Engineers, Hydrologic Engineering Center, HEC-2 Water Surface Profiles, Users Manual, Davis, California, September 1990.
42. U.S. Army Corps of Engineers, Hydrologic Engineering Center, HEC-2 Water Surface Profiles. Generalized Computer Program (Version 4.6.2), Davis, California, May 1991.
43. Barkau, R. L., U.S. Army Corps of Engineers, Hydrologic Engineering Center, UNET: One Dimensional Unsteady Flow Through a Full Network of Open Channels-User's
Manual, Davis, California, 1 995.
45
44. Howard L. Searcy, Flood Routing Model Development for Bessey and Danforth Creek
Basin, Martin County, Florida - Final Report submitted to Martin County Engineering Department, July 1996.
45. Doug Thompson, Florida Department of Environmental Protection, personal
communication, November 25, 1996.
46. Howard L. Searcy Engineers, Flood Routing Model Development for Bessey and Danforth
Creek Basin, Martin County, Florida - Report 2, 1996.
47. Howard L. Searcy, Flood Routing Model Development for Bessey and Danforth Creek
Basin - Report 3, submitted to Martin County Engineering Department, Martin County, Florida, April 1996.
48. U.S Army Corps of Engineers, Hydrologic Engineering Center - River Analysis System
(HEC-RAS) Version 4.1, Davis, California, January 2010.
49. U.S. Department of Commerce, National Oceanic and Atmospheric Administration,
National Climatic Center, Tropical Cyclone Deck 993, 1975.
50. U.S. Department of Commerce, Weather Bureau, Technical Paper 55, Tropical Cyclones
of the North Atlantic Ocean. 1871-1963, G.W. Cry, 1965.
51. U.S. Department of Commerce, National Oceanic and Atmospheric Administration,
National Weather Service, Technical Report NWS- 1 5, Some Climatological
Characteristics of Hurricanes and Tropical Storms, Gulf and East Coasts of the United States, P. Ho, R.W. Schwerdt and H.V. Goodyear, May 1975.
52. U.S. Department of Commerce, National Hurricane Research Project, Report No. 5, Survey of Meteorological Factors Pertinent to Reduction of Loss of Life and Property in
Hurricane Situations, March 1957.
53. U.S. Department of Commerce, National Weather Service, Monthly Weather Review, Abstracts of Previous Year Hurricane Season, 1964 to 1977.
54. Tetra Tech, Inc., Coastal Flooding Handbook, Parts I and II, published for the U.S. Department of Housing and Urban Development, May 1977.
55. U. S. Department of Commerce, National Oceanic and Atmospheric Administration, National Ocean Survey, Nautical Charts, Scales 1:40,000 and 1:80,000, Chart 11428
(August 1977).
56. U.S. Department of Commerce, National Oceanic and Atmospheric Administration, National Ocean Survey, Nautical Charts, Scales 1:40,000, Chart 11467 (September 1977).
57. U.S. Department of Commerce, National Oceanic and Atmospheric Administration, National Ocean Survey, Nautical Charts, Scales 1:40,000 and 1 :20,000, Chart 11472 (July
1977).
58. U.S. Department of Commerce, National Oceanic and Atmospheric Administration,
National Ocean Survey, Nautical Charts, Scales 1:80,000, Chart 11474 (August 1975).
46
59. Federal Emergency Management Agency, Atlantic Ocean and Gulf of Mexico Coastal
Guidelines Update, October 2006.
60. National Academy of Sciences, Methodology for Calculating Wave Action Effects
Associated with Storm Surges, 1977.
61. Federal Emergency Management Agency, Guidelines and Specifications for Study
Contractors, Washington, D.C., January 1995.
62. Florida Department of Environmental Protection, coastal construction control line 1:1,200
scale aerial photographs with 2 feet contours, State Topographic Office, Florida Department of Transportation, Tallahassee, Florida, July 9, 1985.
63. U.S. Coast & Geodetic Survey, 7.5 Minute Series Topographic Quadrangle Maps, Scale
1:24,000, Contour Interval 5 feet, Eden, FL, photorevised 1983; Gomez, FL, photorevised 1983; Hobe Sound, FL, photorevised 1983; Indiantown, FL, photorevised 1983; Jupiter,
FL, photorevised 1983; Palm City, FL, photorevised 1983; and St. Lucie Inlet,
photorevised 1983.
64. Federal Emergency Management Agency, Users Manual for Wave Height Analysis,
revised February 1981.
65. Federal Emergency Management Agency, Federal Insurance Administration, Guidelines
and Specifications for Wave Elevation Determination and V Zone Mapping, Washington,
D.C., March 1995.
66. Martin County Engineering Department, 2012 Aerials for Martin County on
geoweb.martin.fl.us
67. Federal Emergency Agency, Flood Insurance Study, Okeechobee County, Florida
(Unincorporated Areas), February 4, 1981, FIRM; August 4, 1980, FIS, Washington D.C
68. Federal Emergency Management Agency, Flood Insurance Study, Palm Beach County,
Florida (Unincorporated Areas), June 2, 1992, FIRM; April 15, 1982 FIS, Washington D.C
69. Federal Emergency Management Agency, Flood Insurance Study, St. Lucie County and
Incorporated Areas, Florida, June 30, 1999, FIRM, August 19, 1991, FIS. Washington
D.C.