Embed Size (px)
Citation preview

Martin L. Lee, PhD

Lecture overview Organizing statistical tests
Some statistical definitions
Levels of measurement
Importance of descriptive statistics
A Statistical Flow Chart (based on Green & D’Oliviera, 1999).

Designing a research project Empirical Questions (what do we want to know?
e.g. HIV/STD sexual risk reduction for women in substance abuse programs, Tross, 2008)
Statistical Considerations (analyzing the data)
World Theory
DataEmpiricalHypotheses
Abstraction
Derivation
Interpretation
SystematicObservation &Experimentation
Revision
After: Hastie, R. & Stasser, G. (2000). Computer simulation methods for social psychology. In Reiss, H. T. & Judd, C. M. (Eds.). Handbook of research methods in social and personality
psychology. Cambridge, UK: Cambridge University Press.

**Statistical definitions 101** Descriptive statistics – procedures to summarize,
organize and simplify data Inferential statistics – techniques to study samples and
make generalizations about the population Sampling error – discrepancy between a sample
statistic and the population parameter Bayesian methods – prior knowledge is the basis for
inference Research process: (i) identify research questions, (ii)
design study, (iii) collect data from sample, (iv) use descriptive stats, (v) use inferential stats, (vi) discuss results

Preliminaries to statistical analysis (or getting to know your data)The importance of inspecting samples of data
Descriptive Statistics:
Mean (Central Tendency)
Standard Deviation (Variability).
Minimum/Maximum Scores (indicates range).
Skewness and Kurtosis (indicators of shape of distribution).
Graphical Aids to Understanding Data:
Scatterplots.
Boxplots (handy for detecting extreme cases).
Q-Q (Quantile-Quantile) Plots.
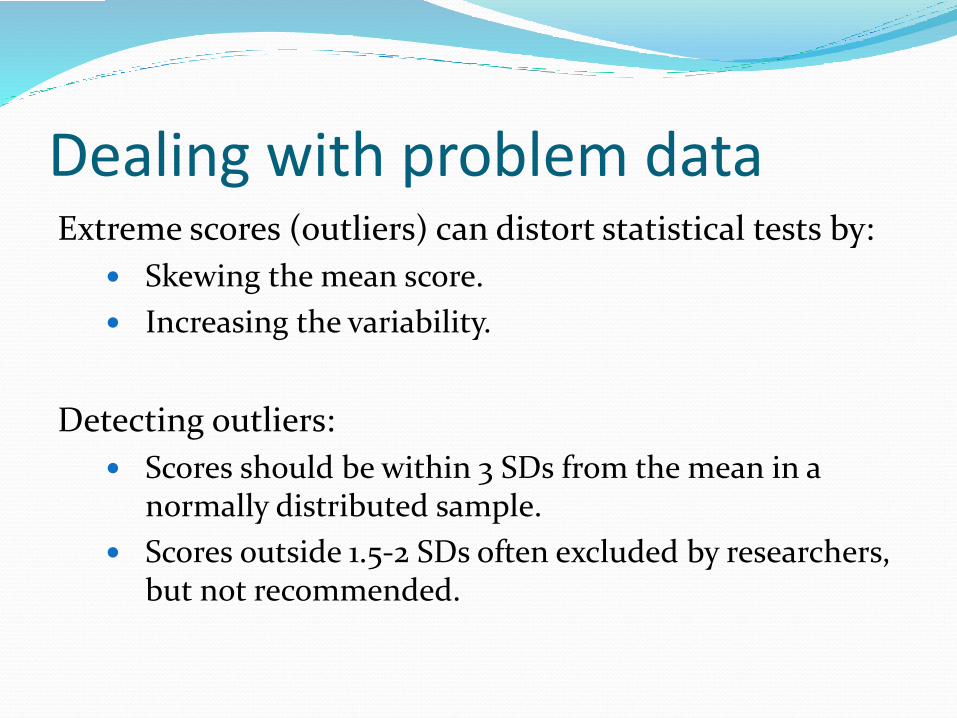
Dealing with problem dataExtreme scores (outliers) can distort statistical tests by:
Skewing the mean score.
Increasing the variability.
Detecting outliers:
Scores should be within 3 SDs from the mean in a normally distributed sample.
Scores outside 1.5-2 SDs often excluded by researchers, but not recommended.

Organizing statistical tests1. Organizing by type of research question
Major division:
1) Relationships between variables
Examples: correlation; regression (relationship between program effect and patient characteristics)
2) Differences between variables:
i.e. Testing for differences between groups or treatments
Examples: t-test; Analysis of Variance (ANOVA).

Organizing statistical tests2. Organizing by type of test
Major division: Parametric vs non-parametric tests
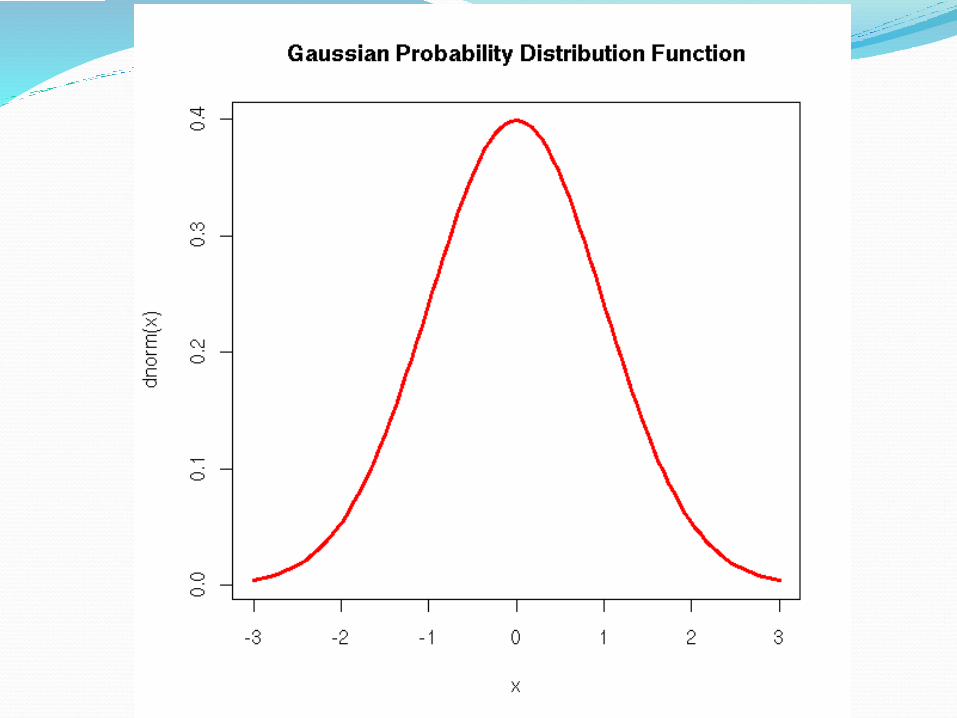
Parametric tests are based on assumptions about the distribution of measures in the population. A normal(Gaussian) distribution is usually assumed.
Parametric tests are powerful but can be abused: e.g. when data don’t meet the underlying assumptions of tests.

Organizing statistical tests2. Organizing by type of test
Non-parametric tests do not make assumptions about population distributions (also called distribution-free tests).
Lower in power and less flexible than parametric tests, but particularly useful for very small sample size
Recommendation:
Use parametric tests whenever possible.
Most are quite robust and limitations well documented.
Use transformations (e.g. logs) to normalize data distributions.

Organizing statistical tests3. Organising by type of research design used
Major division: Experimental vs survey design
In Experimental research, the experimenter manipulates IVs, i.e. intervention (smoking cessation program vs. control) and records effects on DVs, i.e. outcome (smoke-free days). IVs are stimulus variables and DVs are response variables.
Survey research is concerned either with relationships between variables or whether IVs predict variation in DVs at a point in time, e.g. relationship between PTSD, depression, and substance abuse in adolescents (Kilpatrick, 2003)

Organizing statistical tests 3. Organising by type of research design used
Hypothesis testing and the Experimental/Survey distinction
Experimental Research is (mostly) directly hypothesis driven.
Survey Research may or may not be driven by explicit hypotheses, but often includes estimates of prevalence and correlation
In practice, studies may involve a mixture of both types of research…

**Definitions 101**Independent (IV) vs dependent (DV) variablesIndependent Variables (IVs) are: Experimental treatments (e.g. drug vs. placebo) or Properties of groups of participants (e.g. gender, occupation).
Dependent Variables (DVs) are response or outcome measures.
An underlying causal model:
IVs assumed either to cause or predict variation in DVs. IVs are assumed to cause variation when IV is an explicit
manipulation (e.g. drug causes memory deficit).
IVs assumed to predict when not under direct experimental control (e.g. gender differences in hazard perception.)
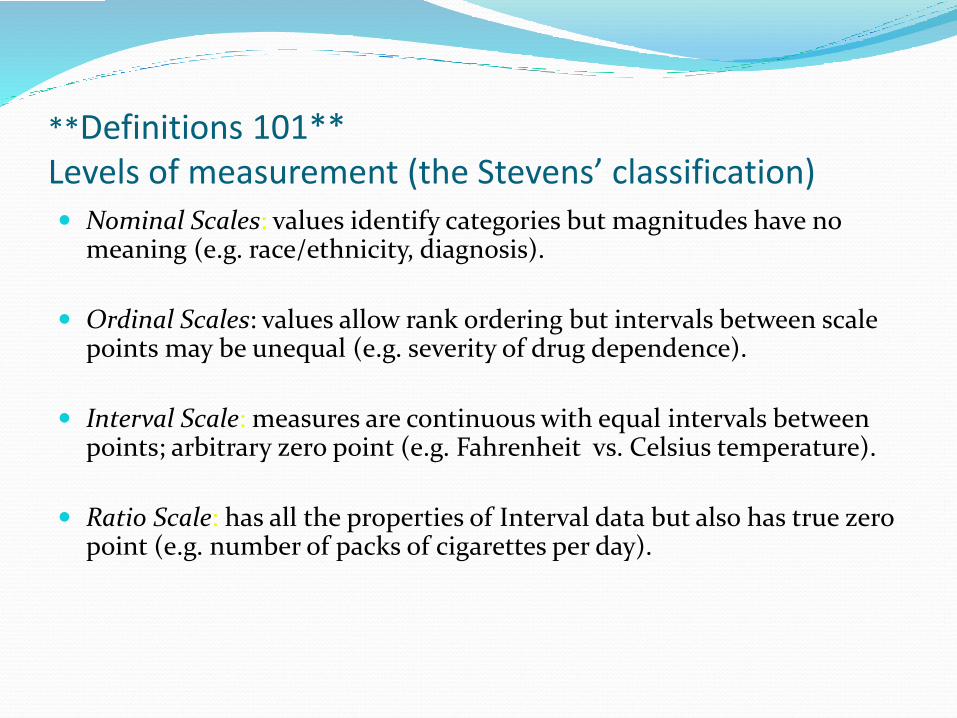
**Definitions 101**Levels of measurement (the Stevens’ classification) Nominal Scales: values identify categories but magnitudes have no
meaning (e.g. race/ethnicity, diagnosis).
Ordinal Scales: values allow rank ordering but intervals between scale points may be unequal (e.g. severity of drug dependence).
Interval Scale: measures are continuous with equal intervals between points; arbitrary zero point (e.g. Fahrenheit vs. Celsius temperature).
Ratio Scale: has all the properties of Interval data but also has true zero point (e.g. number of packs of cigarettes per day).

Tests based on nominal data

Tests based on ordinal data

Tests based on Interval/Ratio data
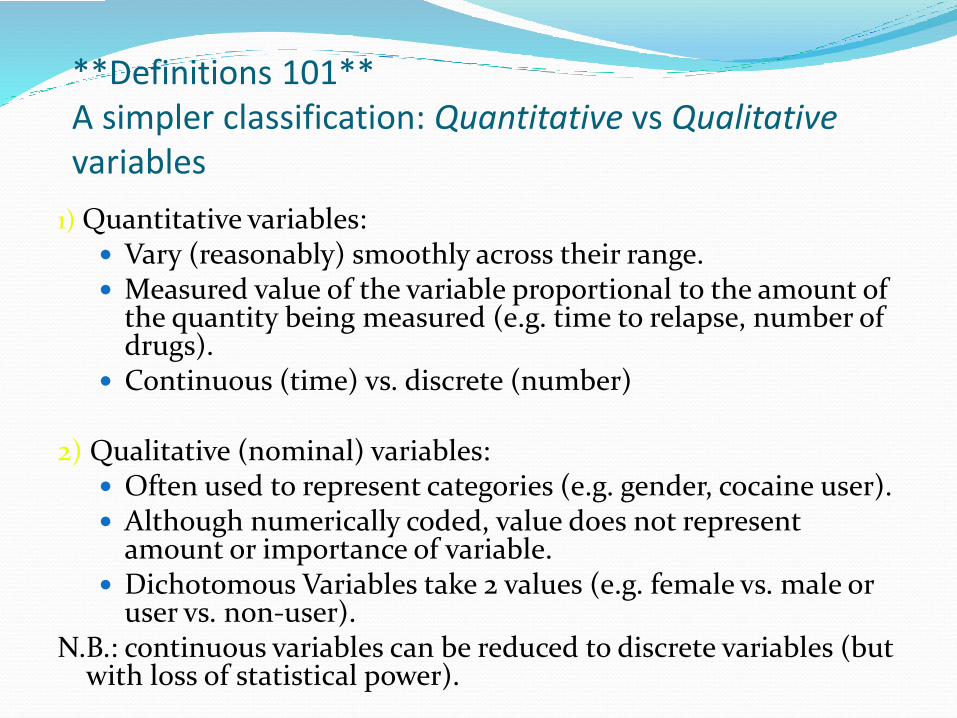
**Definitions 101**A simpler classification: Quantitative vs Qualitativevariables
1) Quantitative variables: Vary (reasonably) smoothly across their range. Measured value of the variable proportional to the amount of
the quantity being measured (e.g. time to relapse, number of drugs).
Continuous (time) vs. discrete (number)
2) Qualitative (nominal) variables: Often used to represent categories (e.g. gender, cocaine user). Although numerically coded, value does not represent
amount or importance of variable. Dichotomous Variables take 2 values (e.g. female vs. male or
user vs. non-user).N.B.: continuous variables can be reduced to discrete variables (but
with loss of statistical power).
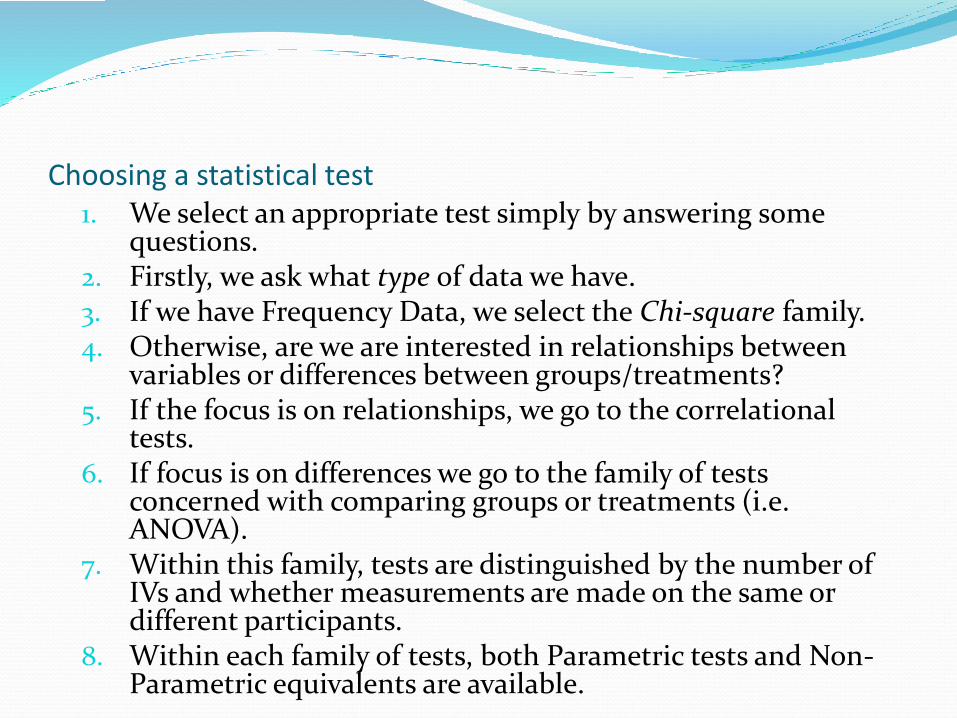
Choosing a statistical test1. We select an appropriate test simply by answering some
questions. 2. Firstly, we ask what type of data we have.3. If we have Frequency Data, we select the Chi-square family.4. Otherwise, are we are interested in relationships between
variables or differences between groups/treatments?5. If the focus is on relationships, we go to the correlational
tests.6. If focus is on differences we go to the family of tests
concerned with comparing groups or treatments (i.e. ANOVA).
7. Within this family, tests are distinguished by the number of IVs and whether measurements are made on the same or different participants.
8. Within each family of tests, both Parametric tests and Non-Parametric equivalents are available.
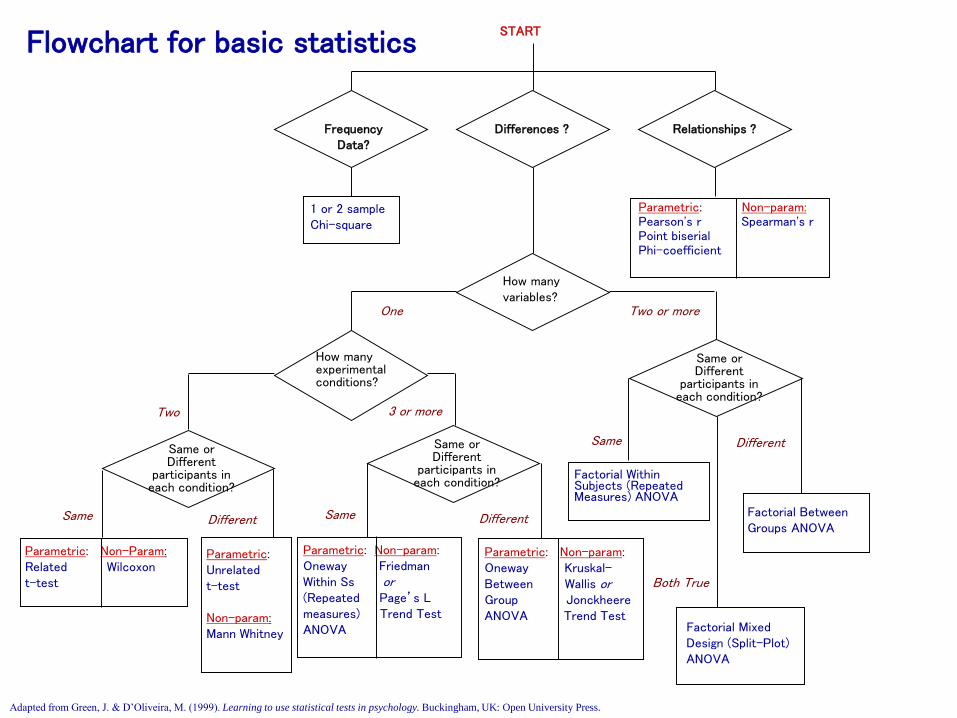
Adapted from Green, J. & D’Oliveira, M. (1999). Learning to use statistical tests in psychology. Buckingham, UK: Open University Press.
Differences ?FrequencyData?
Relationships ?
1 or 2 sample Chi-square
How many variables?
START
Same orDifferent
participants in each condition?
Two or more
Parametric: Unrelated t-test
Non-param:Mann Whitney
Different
How many experimental conditions?
One
Factorial Within Subjects (Repeated Measures) ANOVA
Same
Factorial Mixed Design (Split-Plot) ANOVA
Both True
Different
Factorial Between Groups ANOVA
3 or more
Same orDifferent
participants in each condition?
Two
Same orDifferent
participants in each condition?
Parametric: Non-param:Oneway FriedmanWithin Ss or(Repeated Page’s Lmeasures) Trend TestANOVA
Same Different
Parametric: Non-param:Oneway Kruskal-Between Wallis orGroup JonckheereANOVA Trend Test
Parametric: Non-Param:Related Wilcoxont-test
Same
Parametric: Non-param:Pearson's r Spearman's rPoint biserialPhi-coefficient
Flowchart for basic statistics

**Definitions 101**Type I error vs Type II error
Type I error:
Falsely rejecting the Null Hypothesis (bad).
Erroneously concluding that a treatment has an effect
Depends on alpha level (i.e. p<0.05)
Type 2 error:
Falsely accepting the Null Hypothesis (not so bad).
Missing a significant effect of a treatment
Likely that the missed result was of low power

Statistical tests: the bigger picture**Univariate vs Multivariate Statistics** Univariate tests employ a single DV and IV (intervention vs.
outcome)
Multivariate tests employ one or more DVs
Univariate models employ a single DV/IV (simple linear regression)
Multivariate models employ multiple IVs (multiple linear regression [adolescent multiple drug abuse vs. 19 predictors, Hay, 1999]; multiple logistic regression [length of homelessness vs. drug/alcohol abuse, Kipke, 1997]) and, possibly, multiple DVs (multivariate multiple regression)
.

Missing Data Missing completely at random (MCAR): could be
ignored, e.g. multiple versions of a questionnaire
Missing at random (MAR): missingness depends on an identifiable characteristic, e.g. students graduate from school and are unable to respond because of graduation
Non-ignorable nonresponse (NINR): most difficult to handle

Representing Multivariate Data Graphically
A Small Sample Scatterplot
X Y
f
A Large Sample Multivariate Normal Distribution:
Sample drawn from normally distributed population: scores cluster round the multivariate mean (centroid).
A 3D View: X and Y axes form a plane, with frequency on vertical (Z) axis.
**Definitions 101**Latent vs observed variablesLatent Variables
Variables which are not directly measured but are computed from direct measurements (usually a linear combination of variables).
In tests such as Factor Analysis (FA) and Principle Components Analysis (PCA), latent variables are assumed to account for correlations between variables.
Latent Variables are computed for two main reasons: 1) Data Reduction: summarising a complex data set using a
reduced number of Latent Variables 2) Because they are assumed to represent some underlying
psychological construct (e.g. personality variables such as rebelliousness, depression, and risk taking; or attitude)
**Definitions 101**Covariates Covariates (sometimes called “nuisance variables”). “The effect of extraneous variables which may influence a DV but
are not under direct experimental control” This effect can be minimised by:
i) Random assignment of Ps to conditions (effects of interfering variables should cancel out if sample sizes large enough).
ii) Matching Ps in different conditions on potential confounding variables (e.g. age or race).
iii) directly measuring potential covariates and entering them into analysis
Examples: Comparing poor vs. good responders to treatment with
education as covariate. Heavy vs light smokers with personality as covariate

Statistical tests: The bigger pictureMajority of tests based on the General Linear Model (GLM).
The simplest form of GLM is: Y = b X + e.DV (Y) = weighting factor (b) x IV (X) plus constant (e).
The GLM can be used as an general organizing principle for tests. Statistical tests based on the GLM vary in terms of:
1) The number of IVs and DVs.2) The level of measurement of the DVs and IVs (i.e. continuous or
categorical).3) The type of variable: single quantities (scalars) in univariate
tests; vectors or matrices in multivariate tests; latent variables.4) The role of variables: are they DVs, IVs, or covariates?
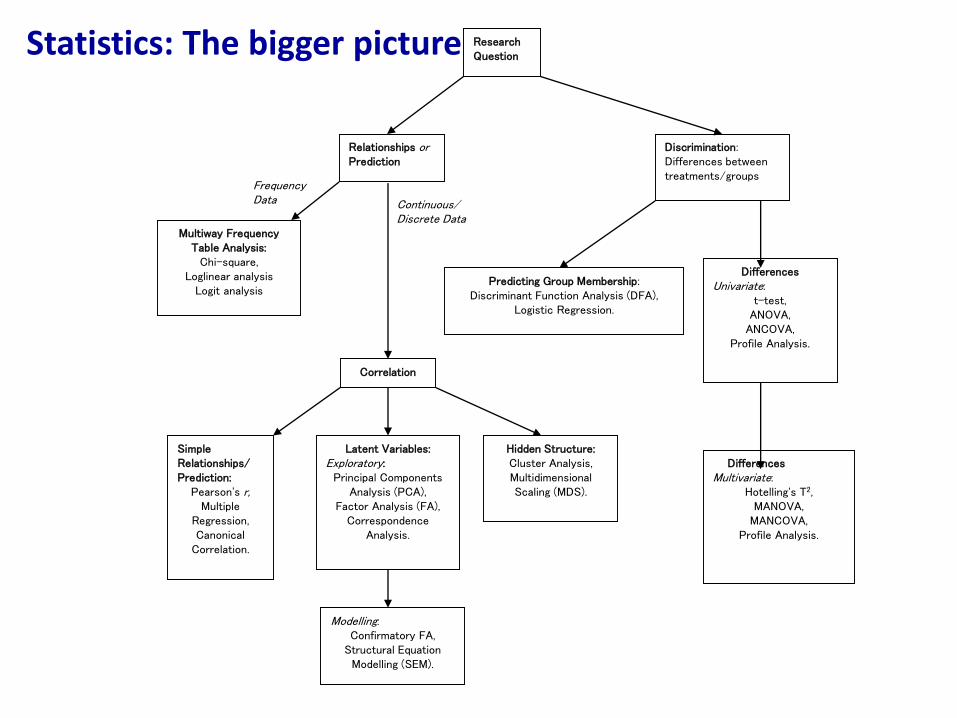
ResearchQuestion
Relationships orPrediction
SimpleRelationships/Prediction:
Pearson's r,Multiple
Regression,Canonical
Correlation.
Modelling:Confirmatory FA,
Structural Equation Modelling (SEM).
Latent Variables:Exploratory:
Principal Components Analysis (PCA),
Factor Analysis (FA),Correspondence
Analysis.
Discrimination:Differences between treatments/groups
Hidden Structure:Cluster Analysis,Multidimensional Scaling (MDS).
Predicting Group Membership:Discriminant Function Analysis (DFA),
Logistic Regression.
DifferencesUnivariate:
t-test,ANOVA,
ANCOVA,Profile Analysis.
DifferencesMultivariate:
Hotelling's T2,MANOVA,
MANCOVA,Profile Analysis.
Multiway Frequency Table Analysis:
Chi-square,Loglinear analysis
Logit analysis
FrequencyData
Correlation
Continuous/Discrete Data
Statistics: The bigger picture

References Colgan, P. W. (1978). Quantitative ethology. New York, NY: Wiley.
Howell, D. C. (1997). Statistical methods for psychology. Belmont, CA: Duxbury Press.
Green, P. E. (1978). Analyzing multivariate data. Hinsdale, IL: The Dryden Press.
Keppel, G. (1973). Design and analysis: a researcher's handbook. Englewood Cliffs, NJ: Prentice-Hall.
Kirk, R. E. (1982). Experimental design: Procedures for the behavioral sciences. Belmont, CA: Brooks/Cole.
Norušis, M. J. & SPSS Inc. (1988). SPSS-X Advanced statistics guide. Chicago, IL: SPSS Inc.
Siegel, S. & Castellan, N. J. (1988). Nonparametric statistics for the behavioral sciences. NY: McGraw-Hill.

References (cont.) Tabachnick, B. G. & Fidell, L. S. (1996). Using multivariate statistics. New York:
HarperCollins.
Various Authors: Sage University Papers: Quantitative applications in the social sciences. Beverly Hills, CA: Sage Press.
Web Resources:
StatSoft, Inc. (1999). Electronic Statistics Textbook. Tulsa, OK: StatSoft. http://www.statsoft.com/textbook/stathome.html.
David Howell's Statistics web-pages at:
http://www.uvm.edu/~dhowell/StatPages/StatHomePage.html.