Embed Size (px)
Citation preview

MARVL system analysis
Phil Carter
State Forests of NSW
1998

MARVL system analysis 2
Table of contentsTable of contents 2Introduction 3Overview of forest inventory 3Overview of the MARVL process 4The MARVL system 6Components of the MARVL system 6
Inventory specification 6Data collection and entry 9Data import (and export) 13Analysis 13View Designer 16Report Designer 19Function Set Designer 21Strategy Designer 23User-variable Designer 23Dictionary Designer 23The MARVL database 23Linking MARVL and GIS 24
References 27Appendix 1. List of standard formulas used by MARVL 28
Notation 28Appendix 2. List of standard function forms. 30
Stem breakage 30Height/age relationships 30Height/DBHOB relationships 31Taper functions 32Volume functions 34
Appendix 3. MARVL variables 36Log level variables 36Piece level variables 37Tree level variables 37Plot level variables 38
Appendix 4 Example report section definitions 39Appendix 5. MARVL database schema 42

MARVL system analysis 3
Introduction
MARVL is a forest inventory method designed to provide detailed information on thepotential yield and log size distribution likely to result from felling a stand of trees. Themethod was first described by Deadman and Goulding (1978). The acronym MARVL isderived from “Method for Assessment of Recoverable Volume by Log Types”.
The purposes of this document are to:
briefly describe the forest inventory process
identify the role of MARVL in forest inventory process, and,
describe in detail the MARVL method in relation to the forest inventory process.
Much of the MARVL method is based on standard forest mensuration techniques. What isemphasised in this report are operations which are unusual, are poorly documented, or areunique to MARVL.
Overview of forest inventory
Husch et al. (1982) define forest inventory as:
“...the procedure for obtaining information on the quantity and quality of the forestresource and many of the characteristics of the land area on which the trees aregrowing.”
Husch et al. give the following checklist of items which may need to be considered in theplanning of a forest inventory:
1. Purpose of the inventory2. Background information
Past surveys, maps, reports etc3. Description of the area
Location, size, terrain, accessibility4. Information required for the final report
Tables, graphs, maps, narrative report5. Inventory design
Estimation of area, determination of timber quantity, size and shape ofsampling units, sampling method, precision
6. Procedures for aerial photograph interpretation7. Procedures for field work
Location and establishment of sampling units, current stand information,recording of observations, data conversion and editing
8. Compilation and calculation procedures Instructions for reduction of field measurements
9. Final report10. Maintenance
Storage and retrieval of data
MARVL system analysis 4
Item 8 in this list is directly provided for by MARVL; MARVL has indirect bearing onitems 4, 5, 7, 9 and 10.
Overview of the MARVL method
MARVL was developed in New Zealand in response to perceived deficiencies in theexisting plantation inventory procedure. Deadman and Goulding (1978) listed the principaldeficiencies as:
1. an inability to provide detailed product breakdown, particularly when it was necessary todifferentiate the merchantability of individual stands for diverse markets,
2. the inability of current inventory to provide detailed information at the stand level.
MARVL differs from other inventory systems in that it separates the field assessment ofsize and quality of stems from the actual cross-cutting. When the stand is cruised, noattempt is made to divide the stem into logs or estimate merchantable limits at any point onthe tree. (Lawrence, 1986).
Use of MARVL involves 3 basic steps (NZFRI, 1995):
1. inventory design,
2. sampling of stand(s) to assess tree size, structure and quality,
3. analysis of the sample data to determine potential product yield.
At step 1, MARVL supports the use of fixed area plots (“bounded” plots in MARVLliterature), horizontal point and horizontal line samples, which may be used in simple orstratified designs. There is a “double sampling” option at the plot level.
Step 2 is referred to in MARVL literature as “cruising”. Standard tree size indices (such asDBHOB, height) are measured in this step. There is the facility for the inclusion of“user-defined” variables. In addition, each tree is described by structural and quality codes.
Step 3 is accomplished with the Analyse module of MARVL. This module enables the userto produce 1 or more reports, using 1 or more views as input, with 1 or more cuttingstrategies, to 1 or more projection dates.
Reports may be either standard, or custom. A “view” is a named list of plots (NZFRI,1995). A group of views is called a “plan”. Inventory data may be projected to a specifieddate if suitable growth models are available. A “cutting strategy” is a list of rules whichdefine products in terms of permissible quality codes, minimum/maximum dimensions,value and acceptable species.

MARVL system analysis 5
Figure 1. MARVL system flow chart
Mensuration theory
Inventory requirements
Base information
4.0Analysis module
1.0 Inventory
specification
2.0 Data collection
and entry
3.0Data import
MARVL database
5.0Data export
ReportsText
SpreadsheetDatabase
MDI file
Data transfer
View Designer
Report Designer
Function Set Designer
Strategy Designer
User variable Designer
Dictionary Designer
MDI file

MARVL system analysis 6
The MARVL system
The MARVL system is described in detail in this section. Processes and the flow of data inthe MARVL system is illustrated in Figure 1. This diagram shows only the basic outline ofMARVL; many interactions between the components have been omitted from this diagramfor the sake of clarity. These interactions are explained in the following text.
Components of the MARVL system
Inventory specification
Process 1.0 of Figure 1 (which corresponds to item 5 of the Husch et al. (1982) list) isdiscussed in this section.
Sampling issues
The issue of inventory design is, to a certain extent, external to MARVL. MARVLunderstands a limited number of inventory design types, inventory designs outside thissubset can’t be processed. The issue of whether a particular design is more suitable for aparticular job than some other design will not be solved by MARVL.
MARVL samples may be either fixed area plots, horizontal point or horizontal linesamples, in either a simple or stratified design. Fixed area plots within the same stratummust be of the same area.
Double, or 2-phase, sampling relies on a close correlation between some easily-measuredvariable, the “auxiliary variate”, and a variable of interest that is not so easy to measure.The first phase involves measuring the auxiliary variate, (basal area, for instance) on alarge sample. The second phase involves measuring the variable of interest, volume forexample, (and the auxiliary variate if the second phase sample is not drawn from the firstphase sample) on a smaller sample. (Cochran, 1977; De Vries, 1986).
MARVL application of double sampling is explained as follows: Fully-measured plots aretermed “primary plots”. “Secondary plots” are measured for basal area only. Statistics, suchas volume, are adjusted by the ratio of basal area per hectare over the entire sample(secondary plots plus primary plots) to the basal area per hectare of the fully measuredplots (primary plots only). Because tree volume is a function of basal area and height, basalarea can be expected to be a good predictor of volume if average tree size is reasonablyuniform within a stratum (NZFRI, 1995).
Use of the terms of “primary” and “secondary” samples in the context of double samplingdoes not accord with terms used in standard texts. This is confusing. The first phase of this2-phase sample is primary plus secondary plots. The second phase is the sample of primaryplots.
Decisions about what variables need to be measured to achieve the aims of the inventoryare an essential part of inventory design. MARVL provides a set of default inventoryvariables, which are adequate for simple inventories. For more complex jobs, user definedvariables may be added. These variables are discussed in following sections.

MARVL system analysis 7
Default variables
MARVL has a set of default variables at both the plot and tree level. These are listed inTable 1.
Table 1. MARVL default variables
Level Variable
Plot Unique plot keyUser who last modified the dataDate and time the data were changedPlot numberInventory nameDictionary nameYear plot was plantedYear plot was measuredMonth plot was measuredNumber of trees in the plot (live and dead)SlopePlot type (fixed area, horizontal point or line)Plot area (if fixed area)Plot length (if horizontal line)BAF (if horizontal point or line)Live basal areaLive stockingMean top diameterGIS link keyDescription of plot
Tree Unique plot keyTree numberStocking represented by this treeDBHHeightLive/deadSpeciesCollapsed stem description
The meaning of most of these variables will be apparent; comments on some of the lessobvious variables follow.
The distinction between unique plot key and plot number should be remembered. Theunique key is generated by MARVL to ensure that all plots in the database are uniquelyidentified. The plot number is the plot identifier assigned by the inventory designer. 2separate inventories could both have a plot number 1, their identity in the database ismaintained with the unique key.

MARVL system analysis 8
Year plot was planted can be safely ignored for regrowth forest; a default value can beentered here. This field is useful for plantations.
Mean top diameter is defined as the root mean square (RMS) of the 100 largest DBH livetrees per hectare. Mean top height is obtained by solving the height/diameter function for atree of mean top diameter (NZFRI, 1995).
GIS link key is yet another unique identifier for the plot, used in conjunction with template,notification or query files (see section titled “Linking MARVL and GIS”).
Stocking represented by this tree is generated by MARVL, and is the frequency used inconversion of the plot data to a per hectare basis. Its value is set by the system. It is notnormally accessible to the user, it may be modified by growth models to account formortality. (Lawrence, pers. comm.)
User defined variables
Default plot and tree level variables may be supplemented by user defined variables, ofwhich there are 3 types (NZFRI, 1995):
1. tree user variables, associated with trees in a plot,
2. plot user variables, associated with each plot,
3. plot extra variables.
Tree and plot user variables may be either numeric, or “ordinal”. Interval or ratio variablesare handled by numeric user variables. Ordinal variables would be better called“categorical” variables, because, in practice, they may be either nominal or ordinal (seeHusch et al. (1982) for a discussion of scales of measurement.)
Minima, maxima, measurement units, and display formats may be specified for numericvariables.
A lists of legal values may be specified for each ordinal variable.
Plot extra variables are, in effect, user defined default variables. While the definitions forboth plot user variables and plot extra variables are stored in the same table, the values ofplot extra variables are stored in the plot table itself. (Values for plot user variables arestored in a separate table.) Plot extra variables may be of the string type, plot user variablesmay not. Plot extra variables may not be used in a cutting strategy, whereas (beginningwith MARVL V3.3) plot user variables may be (Mein, pers. comm.). NZFRI (1995)recommends that the creation of plot extra variables not be undertaken lightly.

MARVL system analysis 9
Data collection and entry
An expanded version of process 2.0 of Figure 1, data collection and entry, is shown inFigure 2. This process is a sub-item of item 8, with elements of item 7 of the Husch et al.(1982) list. In brief summary, this process involves:
creation of a template data interchange file (process 2.1)field data collection (process2.21)data entry (process 2.22)
The end result of this process is an interchange file which contains the data for the entireinventory. The process described above, is relevant to a manual system, where inventorydata are hand written on plot sheets. If electronic field data capture is used, field datacollection and data entry are collapsed into a single step (process 2.3).
Aspects of process 2.0, including tree description methods, are discussed in this section.
Field measurement
The field measurement process of an inventory is normally described in a documentspecific to each inventory. This document should state what is to be measured, and giveprecise instructions as to how each variable is to be measured, and how it is to be recorded.
Data entry
The method by which collected data are transferred to (and from) the MARVL database isoutlined in this section. The method is described in detail in NZFRI (1997).
The MARVL data capture program MARVLDE3 is used to collect MARVL inventorydata, either on a PC in the office, entering data from hand written plot sheets, or in thefield, entering data directly into a DOS-based portable data recorder (PDR). A series ofmenus and data entry screens (forms) allows the user to:
1. enter data at the inventory, stratum and plot level,
2. edit existing data,
3. transfer data from one computer to another, typically to or from a PDR.

MARVL system analysis 10
Figure 2. MARVL data collection and entry
1.0Inventory
Specification
2.21Field
Measurement
2.22Data entry
Completed MDI file
2.3Field
measurement and data
entry
MARVL database
2.1Create MDI file
MARVL database
2.1Create MDI file
MDI fileMDI file

MARVL system analysis 11
MARVLDE3 can be configured for different screens, default file locations, file transfersettings and range checks (among others). Range checking is particularly important for dataquality. 2 levels of range check are available. The first level merely requests confirmationof suspicious values from the operator. Values outside second level ranges are not acceptedby the program.
Data entry, editing and transfer is based on files known as MARVL Data Interchange(MDI) files. MDI files are used to:
1. store inputs from a data capture program, for transfer to the MARVL database,
2. transfer data from 1 MARVL installation to another (different database, site orcompany).
The “data” referred to here includes such objects as views, dictionaries, cutting strategies,function sets, species code lists and user defined variables, as well as measured plot andtree data.
An MDI file must exist before any data can be physically entered. At a minimum, this filemust contain a quality code dictionary, 1 or more function sets (see note below) and aspecies code list, and optionally, may contain other objects noted above. This file is createdusing the Export utility of the View Designer.
Function sets may be assigned to individual strata; this assignment is made during dataentry. If more than 1 function set is required, they will need to be present in the MDI file.
When transferring data, the MDI file may contain 1 or more entire inventories (with theirassociated dictionaries, function sets and user-defined variables). 1 or more plans (withtheir associated views), or individual objects such as cutting strategies. These files are alsocreated using the Export utility of the View designer.
The MARVL system requires that all data for an inventory be present in a single MDI filefor import. This is easy enough to manage for a small inventory, but for larger inventories,or inventories where there is more than 1 crew entering data, there is currently no formalmethod for merging individual MDI files. This problem can be circumvented by editingMDI files using a text editor, but care is needed when using this method because of thecomplex format of MDI files. Another work-around is to use the View Designer (seebelow), which can be used to import multiple data sets from a single field inventory intothe MARVL database as separate inventories (Pont, pers. comm.).
The contents of MDI files are loaded into the MARVL database using an Import utility, afunction of the View Designer. Both the View designer and the MARVL database aredescribed in later sections.

MARVL system analysis 12
Tree description codes
Each tree in a MARVL inventory is completely described by a series of codes. Thedescription method is discussed in this section.
There are 2 types of description code: structural codes and quality codes.
Structural codes describe the morphology of the tree, and are listed in Table 2.
Table 2. MARVL structural codes
Code Meaning
* Broken or dead top> Diameter reduction< Fork (or reduction and forced cut)% Forced cut+ Merchantable branch
“Quality” is a classification of all or part of a tree stem in terms of those factors which havebeen found to have a significant impact on log value. Deadman and Goulding (1978) notedthat the product yield of a [radiata pine]stand [in New Zealand] is influenced by both thecharacteristics of the stand and by the method of cross-cutting the stems. Gordon andLawrence (1995) noted that the main external stem features which affect log quality [inNew Zealand] are pruning, branch size and sweep, other features that may be importantinclude fluting/buttressing, out-of round, nodal length, nodal swelling and wood damage.
Quality classification is fundamental to the MARVL method, and is implemented bydefining 1 or more “quality codes”. Quality codes are specified in a “quality codedictionary”, which serves 2 purposes (NZFRI, 1995):
1. it tells MARVL which letters of the alphabet will be used as quality codes,
2. it provides the user with an opportunity to document the exact meaning of each code,and to describe the intended area of application of the dictionary.
In the formulation of a quality code dictionary, it is necessary to assign a single letter of thealphabet to a log quality class, and to fully describe that quality class. Any letters may beassigned to any quality class. Parts of the tree coded with letters not found in the qualitycode dictionary are discarded as waste.
Robust quality codes are fundamental to MARVL. Quality codes should be kept asindependent as possible from particular log product specifications, to fully exploit theability of MARVL to re-analyse inventory data to a different set of log productspecifications. In particular, length or diameter constraints must not be included in thedefinition of quality codes (Gordon and Lawrence, 1995).
A number of New Zealand authors recommend the use of a decision tree to implementquality codes.

MARVL system analysis 13
Data import (and export)
Completed MDI files are transferred to the MARVL database using an Import facility(process 3.0 in Figure 1). This facility is part of the View Designer, and is described in afollowing section.
Analysis
The Analyse module is the heart of MARVL. The analysis module uses data from thedatabase to produce reports. This process is described in Figure 3, and represents item 8 inthe Husch et al. (1982) list.
An analysis may be done on a single view, or a plan, which is a named group of views. Oneor more projection dates may be selected; a date of 0/0 processes the data as measured. Oneor more cutting strategies may be selected. One or more reports may be selected. Theanalysis module produces 1 report for each combination of projection data, cutting strategy.The optimisation program is run for each requested report; the process can betime-consuming if many reports are requested.
Analyses may be run interactively, or by using a batch file. Batched analyses, perhaps runovernight, may be the answer for large and/or complex jobs.
The optimisation process is described in the next section. The reporting process and cuttingstrategies are described in following sections.

MARVL system analysis 14
Figure 3. MARVL Analyse module
MARVL databaseInventory dataView definitionCutting strategyReport definition
Text report
4.0Analysis
Spread sheet
Data base
Projection date

MARVL system analysis 15
Optimisation
As noted previously, what distinguishes MARVL from other inventory systems is theseparation of the field assessment of size and quality of stems from the actual cross-cutting.What this means in terms of the MARVL system is that, in the analysis phase, each tree isconverted into logs using the constraints specified by the cutting strategy. The process is(NZFRI, 1995):
1. Each tree is cut at a uniform stump height.
2. Depending on the breakage function used, the tree may be considered to have broken onfalling. If this is the case, the part of the tree above the predicted break point is discarded aswaste.
3. The tree is trimmed by making cuts at all forks (structural code =“<“) and forced cuts(structural code=“%”). The results of this trimming are termed “pieces”.
4. Each of the pieces that remains is analysed using the cutting strategy to find thecombination of log types and lengths that gives the greatest total value, while satisfying allof the size and quality constraints of the log types. This step is called “optimisation”.
The optimisation step is based on a dynamic programming method originally conceived byPnevmaticos and Mann (1972) (Deadman and Goulding, 1978). The method actually usedin MARVL 3 is described in detail in NZFRI (1995); major points are repeated here.
MARVL attempts to cut logs at a limited number of (equally-spaced) points along thestem. It further assumes that any log that may be cut will fit exactly between two of thesepositions. The distance between adjacent stem positions under this model is called the“round-off” length, because all log lengths and stem heights (relative to the stump) arerounded-off to multiples of this length.
It is important, in selecting a round-off length, to balance precision and systemperformance. Very small round-off lengths increase running time. An analysis that uses around-off length of 0.25m would take about 4 times as long to run as an analysis that uses1.0m. If you wish to cut 3m and 4m logs and use a round-off length of 0.7m, MARVLwould actually cut 2.8m and 4.2m logs, these being the nearest multiples of the round-offlengths.
Random log lengths are far slower to analyse than fixed lengths, because, at every positionalong a stem, MARVL has to consider every possible log length that could be cut there. Anoption here may be to represent the random lengths as a few fixed lengths.
You may supply a value for the cost of making a saw cut. The main reason for doing this isto encourage cutting of a long log in preference to 2 short logs of the same value.
Stem diameters and volumes are calculated with stored or programmed taper and volumefunctions. Functions to be used are specified by the user.

MARVL system analysis 16
View Designer
MARVL analyses are based on 1 or more “views”; a view is a named list of plots. Viewsare managed with the “View Designer”.
The View Designer performs several functions:
data import/exportview definitionview validationview managementpilot survey (estimation of required number of samples)configuration
Data import/export
The data import/export facility is primarily used for importing data into the MARVLdatabase from an MDI file. Typically, all the data from a single inventory will be in theMDI file, and this will be imported into the database when data entry is complete. Dataexport is also managed with MDI files.
Other data import functions include:
import MQF (GIS query) file (see “Linking MARVL and GIS” below)import SQL query (using standard SQL commands)import a database file
Other export functions are;
export inventory template file (with GIS-located points)export MicroMARVL file (export V2 files)
View definition
As noted above, a “view” in MARVL is a named list of plots. The plots in a view maycomprise all or some of the plots from an entire inventory, or some or all of the plots frommore than 1 inventory. For analysis convenience, a group of views may be gathered into a“plan”, a named list of views.
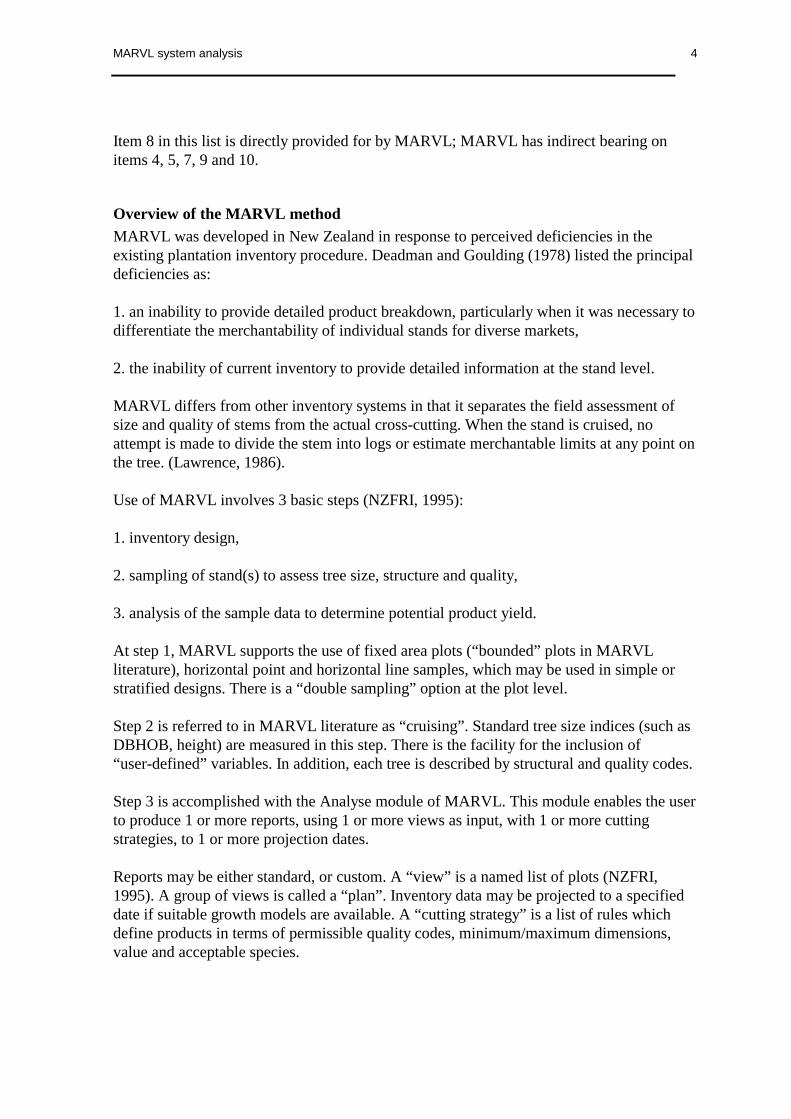
Views are presented in the View Designer as a series of plot, group and stratum lines. Thegroup referred to here is a growth group, a group of plots measured on the same date, andwhich are grown forward together. A sample section of a typical view is shown in Table 3.In Table 3, stratum lines are indicated with “===”; group lines are indicated with “---”and plot lines are indicated with the word “Plot”.
MARVL system analysis 17
Table 3. Typical MARVL View Designer window
=== 100.00 Coastal Species--- 7/1997 Plot14017 Strategic Inventory Bounded 39 Plot14017 Strategic Inventory Bounded 32--- 6/1997 Plot14017 Strategic Inventory Bounded 39
Stratum, group and plot lines may be customised to meet user requirements. This isdiscussed in “Configuration”, below.
View validation
All views must be validated to ensure that they are capable of analysis (NZFRI, 1995).Validation rules confirm that:
within a growth group,the number of plots is within the limits set by PlotsInGroup1,PLEs for basal area and stocking are within limits set by GroupPLEBA andGroupPLESPH,there are no duplicate plots,
within a stratum,all secondary plots have the same type and same size,there is at least 1 primary plot, and that all primary plots have the same type andsize,there are no duplicate plots,the function set name is valid,the area is within limits set by StratumAreaRange,
within a view,there are no plots duplicated between strata (except for height only plots, whichmay be shared to create a common height regression).
View management
At the base level, all the plots from a single inventory (referred to as a design inventory inMARVL literature) form a default view. New views are created by copying the requiredparts from 1 or more views, and pasting them to a new view. Parts may be copied frommore than 1 inventory. New views must be validated before they can be analysed.
Views may be saved or deleted.
Pilot survey
The Pilot Survey facility may be used to estimate the required number of samples. PLEcalculations are based on data from a subsample of plots.
1 Values for PlotsInGroup, GroupPLEBA, GroupPLESPH and StratumAreaRange are set in the configurationfile, MARVL.INI.

MARVL system analysis 18
Configuration
Plot, group and stratum lines may be customised to meet user requirements. Fields to bedisplayed, and the order in which they are displayed, are selected in a dialog box.Information fields, and formatting fields available for customising are shown in Table 4.
Table 4. Customising field available in the View Designer
Line type Variables Formatting
Stratum Area ---Function set ===
commaspace‘Stratum’
Group BA CI/PLE ---BA Mean ===DBH Mean commaDouble sampling ratio spaceEstablished year tabMeasure date ‘Group’No of primary plotsNo of secondary plotsStocking CI/PLEStocking Mean
Plot Area ---BA ===BAF commaDatabase plot key spaceDBH Mean tabDesign inventory ‘Plot’Dictionary nameEstablished yearHeights in regressionHeights in regression (Ab)Horizontal line lengthLast modified (by user)Last modified (date)Mean top diameterMeasured datePlot numberPlot typePlot type (Ab)Primary/secondaryPrimary/secondary (Ab)StockingTrees (count)
Note: “Ab” in Table 4 stands for “abbreviated’.

MARVL system analysis 19
Report Designer
Results of inventories processed by MARVL are obtained as reports. Reports may beoutput in the form of text files or in spreadsheet or database form. The Report Designer isused to create new reports, or to modify existing reports.
Report Characteristics
A MARVL report consists of one or more “sections”. All reports are specified in their own“Report Definition File”, which have the extension RPD, and which contain the followinginformation:
report description,output file name, with append/overwrite option,output format, may be text, worksheet, or database,list of included sections, with codes to describe the level (plot, stratum orpopulation) and to show/not show titles and totals.
Report sections
Report sections may be either “built-in”, which can’t be modified, or “custom”, which canbe modified (NZFRI, 1995). Built-in report sections are listed in Table 5.
Table 5. MARVL built-in report sections
Name Description
LogGroup Allows log types to be grouped together to calculate statisticsLogTrace Lists each log produced by the buckerStrategy Population level only. Prints the strategy used to produce this set
of resultsDictionary Population level only. Prints the dictionaries needed by the
strategyFunctions Stratum level only. Prints the function set used to produce this set
of resultsInventoryDescription Population level only. Prints the description field from the
inventory table, and some other useful informationPlotDescription Plot level only. Description of the plot including plot type, area
and numberStratumDescription Stratum level only. Stratum area, number of primary and
secondary plots and the double sampling ratio
Custom report sections are defined in a file titled REPORT.INI. This file may contain 1 ormore section definitions. A text editor may be used to add new section definitions to thisfile, or to modify existing report sections.
Custom report sections are defined with a report definition language, that is described indetail in NZFRI (1995); a summary of this information is provided here.
MARVL system analysis 20
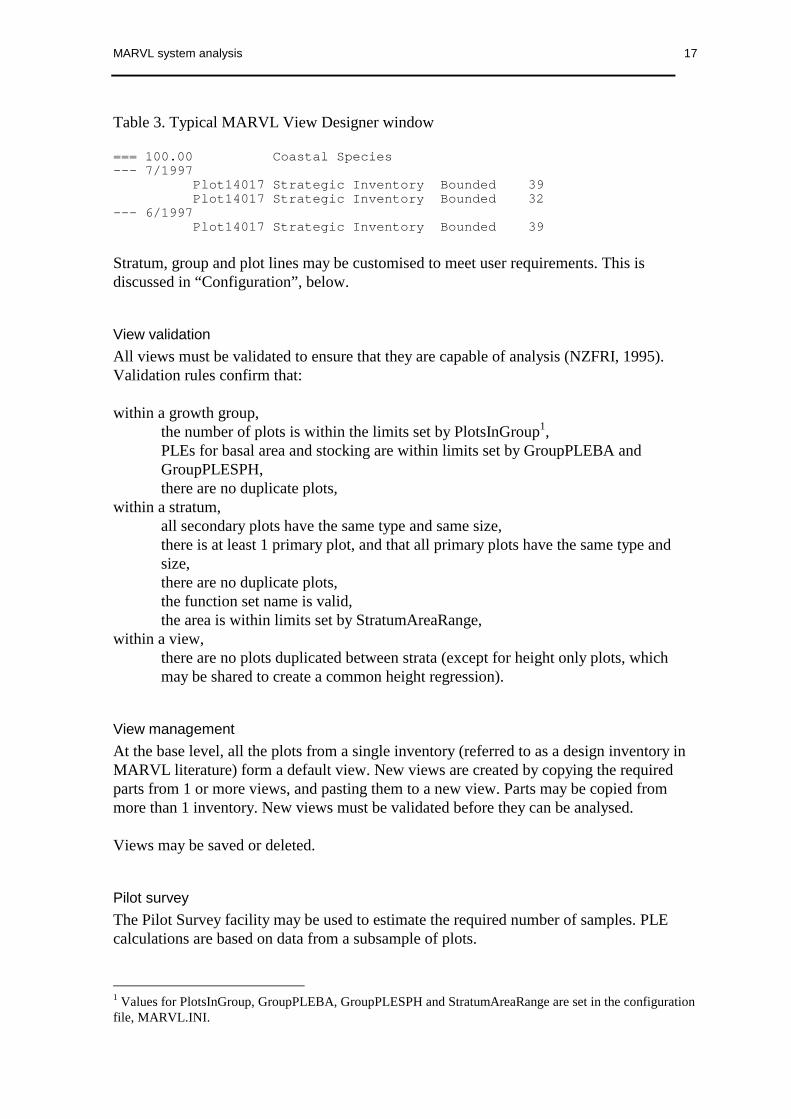
Lists of allowable report analysis variables (just called “variables”) are given in NZFRI(1995). There are 4 variable lists, for logs, pieces, trees and plots. (See Appendix 3 forcomplete lists.) For any 1 report section, variables may be selected from only 1 list.Generally, variables form the column headings of the new report section (but see below formodifications). Class variables form the row headings, these must also be selected from thelists of allowable variables. Class widths, a start-point and a number of classes may bespecified for class variables. Variables may be grouped using “By variables” (allowablevariables also listed). A given variable may not be available for use in all categories(analysis, class or by variable). Statistics such as errors may be included for some analysisvariables. User-defined variables may be used in reports definitions, subject to somerestrictions.
Samples of custom report section definitions are shown in Appendix 4.
MARVL reports may be though of, somewhat arbitrarily, as belonging to 1 of 2 categories,standard reports or custom reports. MARVL is supplied with 5 reports already installed,these are the standard reports. Standard reports are very general in nature, so will cover awide range of possible output requirements. Custom reports are all other possible reports.
Standard reports
Standard reports may be composed of both built-in and custom report sections; customsections of standard reports may be modified as required. Care is need when modifyingreport section definitions; any single section definition may be used in more than 1 report.If modifications to a standard report are required, the best approach may be to copy theentire definition to a new report definition file, and edit the new file, and/or theREPORT.INI file, as required.
Standard MARVL reports include:
standard population reportstandard population and stratum reportstandard population, stratum and plot reportLog traceYield table
Standard population reports, standard population and stratum reports and standardpopulation, stratum and plot reports contains the following report sections:

MARVL system analysis 21
InventoryDescriptionStrategyDictionaryFunctionsStandingResourceStandardResourceLiveStandingTreesCutoverResidueExtractableStemsProductAnalysisCuttingWasteLogGroup
The difference between these 3 reports is the level at which results are reported.
The Log trace report is intended for diagnostic or investigative use, it contains a singlebuilt-in section only, LogTrace. This report writes the results of the optimisation processfor each tree in the selected view to the selected output form.
The Yield table report contains a single custom section, YieldTable. A yield table presentsanticipated yields from a stand at various points in time (Vanclay, 1994). Because there arecurrently no native forest growth models that are compatible with MARVL, yield tables fornative forests can’t be produced with MARVL as yet.
Custom reports
As noted above, a custom report consists of 1 or more custom report sections, with theoption of 1 or more built-in sections.
Custom report sections may be created from scratch by the user, using a text editor tomodify the REPORT.INI file, creating a new report section using the report definitionlanguage described above. Existing report sections may be modified by the same method.
Function Set Designer
Functions to be used in the calculations for a given inventory are selected by the user withthe Function Set Designer. A Function Set is a named list of functions.
MARVL has been built around the use of functions for:
stem breakage,growth models,growth adjustments,height/age relationships,height/DBHOB relationships,taper and volume.

MARVL system analysis 22
The use of a taper and volume function and either a height/age or a height/DBHOBrelationship - supplied by the user or fitted by MARVL - is mandatory. The use of otherfunctions is optional.
Breakage models predict the height at which a tree stem will break on felling. That part ofthe tree above the break point is classed as waste. There is a “no breakage” option, which isthe option currently used for regrowth forests in NSW.
Growth models may be used to project inventory data in time. Growth models are currentlyall one-offs, each has a unique functional form, and coefficients are built into the modelform (Mein, pers. comm.).
Growth adjustment tables specify the proportion of annual growth that has occurred on amonthly basis. (NZ growth models for softwood species are based on monthly timeincrements; Lawrence, pers. comm.)
Height/age and height/DBHOB relationships are used to estimate a height for unmeasuredtrees, so that taper and volume functions, which use height as an independent variable, canbe applied. Height/age functions tend to be one-offs, there are some models that sharefunctional forms (Mein, pers. comm.). Height/age relationships are of no relevance toregrowth forest where age is not known, but may be relevant to native species plantations.
Height/DBHOB relationships may be specified as a function, or as a conversion tablespecified by the user. If a function is specified, a function is fitted to the measured data foreach stratum in the inventory.
Taper and volume functions are used to predict stem diameters and volumes. Taper andvolume functions must be “compatible”, that is, total volume estimates, based onintegration of a taper equation, should be identical to those given by a tree volume equation(Demaerschalk, 1972). The reason for the requirement of compatibility is so that volumeestimated by summing volume estimates of parts of the stem exactly equals the estimatedvolume of the entire stem.
In a mixed-species forest, there are often groups of species, which have similarcharacteristics, but which are different from other groups. Similar species may be groupedusing “function groups” (NZFRI, 1995).
MARVL software comes with numerous functions already installed. Most of these areapplicable only to exotic species in New Zealand. Currently, the only functions ofrelevance to regrowth forests in NSW are taper and volume functions for blackbutt,flooded gum, and “coastal species” (blackbutt plus flooded gum), based on taper modelsdeveloped by Muhairwe (1995).
MARVL recognises a couple of standard forms of each function; functions forms forbreakage, height/DBHOB, taper and volume are listed in Appendix 2. If relationships inone of these forms are known, coefficients can be entered into a text file in standard form,and installed in the software using a translate utility. If relationships are not in standardform, they must be programmed.

MARVL system analysis 23
MARVL assigns functions sets at the stratum level, it is possible to use different functionsets for different strata within the 1 inventory. This assignment is made in the data entryphase.
Strategy Designer
A “cutting strategy” is a list of product types, each of which is specified by requiredlengths, minimum and maximum small- and large-end diameters, permitted quality codes,value, acceptable species (Anon, 1990). Beginning with V3.3 of MARVL, user variablesmay be used in a cutting strategy. Cutting strategies are created or modified with theStrategy Designer.
A cutting strategy is based on a quality code dictionary, but, unlike a plot, a cutting strategycan refer to more than 1 dictionary, so that plots cruised to different sets of quality codescan be analysed as a single inventory (NZFRI, 1995).
It is important to understand that the “value” specified in a cutting strategy does not need tobe an actual dollar amount. It may be an actual market value, an internal transfer price, oran artificial price. If an artificial price is used, its magnitude should accurately reflectrelative value to the user (NZFRI, 1995).
Any number of cutting strategies may be applied to a single inventory.
User-variable Designer
The significance of user defined variables was discussed in as earlier section. Plot and treeuser variables are created or modified with the User-variable Designer.
Plot extra variables are created by modifying the database structure itself (NZFRI, 1995).
Dictionary Designer
Quality code dictionaries are created or modified with the Dictionary Designer. Qualitycodes and the Dictionary are discussed in a previous section “Tree description codes”.
The MARVL database
Plot and inventory data are stored in a database to provide safe access to the data bymultiple users, and to formalise the relationships between the data entities that MARVLuses (NZFRI, 1995). Data are transferred into the MARVL database from MDI files usingan import utility, as described elsewhere.
MARVL was developed and tuned to run best with Borland Paradox database software, butother database software may be used. Borland SQL Links for Windows is a set of driverssupported by MARVL that will directly connect to Oracle, SQL Server, Sybase, Interbaseor Informix. MARVL can use other database products that have an ODBC driver, but witha reduction in performance.
MARVL system analysis 24
The MARVL database may be installed either locally, or on a network server, so it isavailable to multiple users. MARVL runs fastest when using its database on a local harddisk.
The database schema is shown in Appendix 5.
Other important files
There are a number of files crucial to the running of MARVL that are not stored as part ofthe MARVL database. These are:
Configuration files. System-wide defaults are stored in a file called MARVL.INI. Settingsfor each user are stored in a separate file , MARVLUSR.INI. Individual user preferenceswill overrride system settings (NZFRI, 1995). The data entry program, MARVLDE3, alsohas its own configuration file, MARVLDE3.INI.
Reports. Each report is defined in a file with the extension RPD. Report sections aredefined in a file called REPORT.INI.
Data interchange. Files with the extension MDI are used to import/export data.
Templates. Plot points generated by GIS are stored in a file with an MDF extension.
Notifications. Notification of plot locations (to GIS) are stored in files with an extensionMNF.
Query files. Plots selected with GIS are stored in a file with the extension MQF.
The creation and use of template, notification and query files is explained in the followingsection.
Linking MARVL and GIS
MARVL may be linked to GIS by a variable called GIS Link Key. This key is known toboth MARVL and the GIS. There are 2 ways to assign a GIS Link Key (NZFRI, 1995):
1. Unique values can be generated by the GIS, MARVL is informed of these values by aTemplate (MDF) file. The MDF file is read by the view designer, which produces atemplate inventory file (an MDI file) with empty plots, ready for filling in.
2. Unique values can be generated by MARVL. MARVL informs the GIS of these valuesby a Notification (MNF) file.

MARVL system analysis 25
If plots are linked to a GIS as described above, is possible to:
1. select plots on the GIS,
2. use the View Designer to create new views based on this selection,
3. use the View Designer to assign function sets, validate and save the view,
4. use the Analyse module to analyse the new views.
The GIS selection is communicated to MARVL with a Query (MQF) file. Arc/Info macrosto maintain and execute this link have been described by Hock (1996)
Th flow of information betwen MARVL and GIS is shown schematically in Figure 4.

MARVL system analysis 26
Figure 4. Flow of information between MARVL and GIS.
GIS
Template file
Notification file
Query file
MDI file
MARVL database

MARVL system analysis 27
References
Anon (1990). MicroMARVL - versatile plantation inventory. NZ Forest Research Institute,What's new in Forest Research? Number 191
Cochran, William G. (1977). Sampling techniques. John Wiley and Sons.
De Vries, Pieter G. (1986). Sampling theory for forest inventory. Springer-Verlag.
Deadman, M.W. and C.J. Goulding (1978). “A method for assessment of recoverablevolume by log types.” New Zealand Journal of Forestry Science 9: 225-239.
Demaerschalk, J.P. (1972). “Converting volume equations to compatible taper equations.”Forest Science 18: 241-245.
Gordon, A.D. and M.E. Lawrence (1995). External stem quality assessment - MARVL. InD. Hammond Ed. 1995 Forestry Handbook. New Zealand Institute of Forestry. 190-191.
Hock, Barbara (1996). Linking MARVL and the geographic information system Arc/Info.NZ Forest Research Institute, Unpublished Project Record Number 4996
Husch, Bertram, Charles I. Miller and Thomas W. Beers (1982). Forest Mensuration.Wiley.
Lawrence, M.E. (1986). The MARVL pre-harvest inventory procedure. Proceedings,“Harvesting whole trees with processing and log allocation in the forest to conventionaland energy products” conference, Rotorua, Forest Research Institute, Rotorua, NewZealand.
Muhairwe, Charles K. (1995). Taper study for Eucalyptus species particularly blackbutt.State Forests of NSW, Unpublished report
NZFRI (1995). Guide to using MARVL V3. New Zealand Forest Research InstituteLimited, NZ FRI Software Series Number ?
NZFRI (1997). Guide to using MARVL data capture 3. New Zealand Forest ResearchInstitute, Number ?
Pnevmaticos, S.M. and S.H. Mann (1972). “Dynamic programming in tree bucking.”Forest Products Journal 22: 26-30.
Vanclay, Jerome K. (1994). Modelling forest growth and yield. Applications to mixedtropical forests. CAB International.

MARVL system analysis 28
Appendix 1. List of standard formulas used by MARVL
Notation
Symbols used in this section are listed below.
i number of trees in a plot, i = 1 to nDBi DBHOB of ith treeDi DOB, ith treedi DUB, ith treebi double bark thickness, Di - di
Hi height of ith treehi level above ground of a point on the stem, ith treeli distance from the top of the tree ith tree, Hi - hi
R li / Hi
gi basal area of ith treewi frequency of ith treeX per hectare characteristicxi any characteristic of ith treeA plot area, ha (fixed area plots)L plot length (horizontal line plots)F basal area factor (horizontal point or line sample)N Plot stocking density (stems/ha)G Plot basal area (m2/ha)K π / 40 000T0 Year of planting (plantation)T1 Year of measurement
Per hectare estimates
In general, the value of any per hectare stand characteristic, X, is estimated as follows:
$X w xi ii
n
==∑
1
where w Ai =1/ (fixed area plot)
w F gi i= / (horizontal point sample)
wF
D LiBi
=1000 (horizontal line samples
Stocking density
$N wii
=∑

MARVL system analysis 29
Plot basal area
$G w gi ii
=∑
In the case of point samples, this formula simplifies to:
$G F n=
Per tree estimates of the characteristic X are found by:
$$
$x
X
N
w x
w
i ii
ii
=
=∑∑

MARVL system analysis 30
Appendix 2. List of standard function forms.
Stem breakage
Source: BREAKTAB.TXT, symbols are defined in Appendix 1
Equation 1
h b b H b H b s b s b s Hbi i i p p p i= + + + + +1 2 32
4 52
6
Equation 2
( ) ( )h H b b ebi i
b Hb
i= + − −
−1 11 1 2
3
Height/age relationships
Function types:
1 (approximate height/age curve)
2 (no growth)
3 (percentage growth)
4 (explicit height/age curve)
5 - 22 (normal height/age curve)
All currently installed models are of the form:
( )( )[ ]H a b T Ti
c= − − −1 1 0exp

MARVL system analysis 31
Height/DBHOB relationships
Source: HTDBHTAB.TXT, symbols defined in Appendix 1.
Pettersen 1:
( )D
H bhDBi
i
Bi−
= +0 4. α β
Pettersen 2:
( )1 1
0 4H bh D
i Bi−= +
. α β
Logarithmic:
lnHDi
Bi
= +
α β
1

MARVL system analysis 32
Taper functions
Source: TAPERTAB.TXT, symbols defined in Appendix 1.Taper function 01:
[ ]dV
K Hb R b R b R b R b R b R b Ri
i
ii i i i i i
bib2
11
22
33
44
55
6 87 9=
+ + + + + +
where d DUBat length l from tree tipi i=
Taper function 07:
d D Bi i i= − (sectional measurement)
Taper function 08:
( )D D b Rb
D HRi Bi c i
b
H
Bi i
b ibi
b2 2 312
4
5=
+
( )where bb
D H
bh
H
bh
Hc
Bi i
bi
b
i
b
Hib
= −
−
−
1 1 13
4
51
2
/
[ ]d D b b R b Ri i i ib2 2
7 8 910= + +
Taper function 09:
[ ]DD H
H bhb R b R b Ri
Bi i
ic i
bib
ib2
2
2 41 3 5=
−
+ +
where bbh
Hb
bh
Hb
bh
H
bh
Hci i
b
i
b
i
b
= −
− −
− −
−
1 1 1 1
2
2 4
3 5 1
/
[ ]d D b b R b Ri i i ib2 2
7 8 910= + +
Taper function 10:
[ ]D D b R b Ri Bi c ib
ib2 2
21 3= +
where b bbh
H
bh
Hci
b
i
b
= − −
−
1 1 12
3 1
/

MARVL system analysis 33
d D b bD
Di ii
Bi
2 27 8
2
= +
Taper function 11:
( )[ ]DD H
H bhb b Ri
Bi i
ii
b DBi2
2
1 23=
−
+
[ ]d D b b Ri i i2 2
7 8= +
Taper function 13:2-segment model. Quadratic (upper) and hyperbolic (lower) functions, with a variable jointpoint. (Equation?)
Taper function 14:
d b D bh
HBib D i
i
bh
Hb
h
Hb
h
Hb
H
hb D b H b
D
HBi
i
i
i
i
i
i
i
iBi i
Bi
i
= −
+
+
+
+ + +
1 32
4 5
2
6
3
7 8 9 10
1
Taper function 15:
( )D b D b ei Bib b hi2
1 24 3
0 25
= + − .
[ ] ( )where b D b D eBi Bib b bh
22
15 3
0 25
= − −/.
d b b Di i2
7 82= +

MARVL system analysis 34
Volume functions
Source: VOLUMTAB.TXT, symbols defined in Appendix 1.
Volume table 01:
V DH
H bhe bi Bi
b i
i
b
b=−
+1
2
3
2
4
Volume table 02:
V b b DH
bD
b H bD H
i i Bii Bi
iBi i= + + + +2
23
2
4 510000 10000 10000
Volume table 03:
( ) ( ) ( )log log logV b D b H bD
bi Bi iBi= + + +1 2 3
2
410000
Volume table 04:
V b D Hi Bib b= 1
2 3
Volume table 05:
V b DH
H bhbi Bi
i
i
=−
+
1
22
2 1000/
Volume table 06:
( )V b D Hi Bi i= 12 0 9
10000.
/
Volume table 07:
( )V tional volumesi =∑ sec
Volume tables 08 - 11
Integral of taper function types 08 - 11
Volume table 12:
[ ] [ ]V b H b D H b H b D H H bhi i Bi i i Bi i= + + + −1 22
32
42 2 /

MARVL system analysis 35
Volume tables 13, 14, 15
Integral of taper function types 13, 14, 15
MARVL system analysis 36
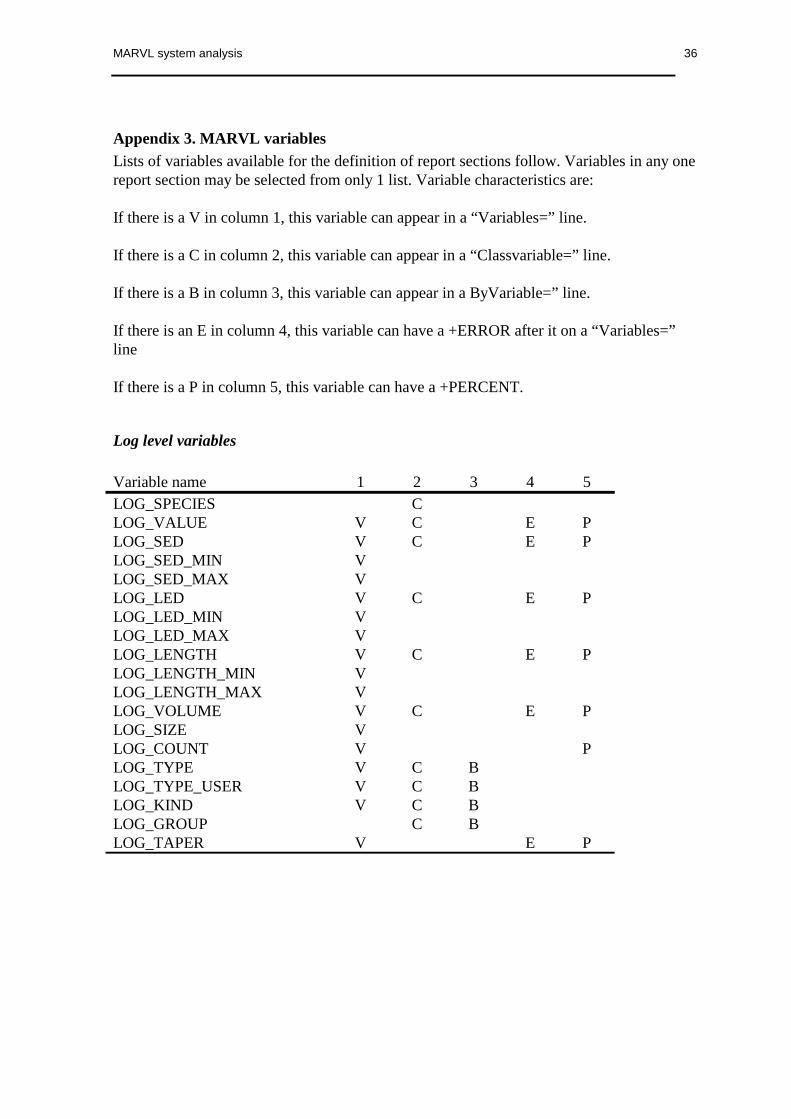
Appendix 3. MARVL variables
Lists of variables available for the definition of report sections follow. Variables in any onereport section may be selected from only 1 list. Variable characteristics are:
If there is a V in column 1, this variable can appear in a “Variables=” line.
If there is a C in column 2, this variable can appear in a “Classvariable=” line.
If there is a B in column 3, this variable can appear in a ByVariable=” line.
If there is an E in column 4, this variable can have a +ERROR after it on a “Variables=”line
If there is a P in column 5, this variable can have a +PERCENT.
Log level variables
Variable name 1 2 3 4 5
LOG_SPECIES CLOG_VALUE V C E PLOG_SED V C E PLOG_SED_MIN VLOG_SED_MAX VLOG_LED V C E PLOG_LED_MIN VLOG_LED_MAX VLOG_LENGTH V C E PLOG_LENGTH_MIN VLOG_LENGTH_MAX VLOG_VOLUME V C E PLOG_SIZE VLOG_COUNT V PLOG_TYPE V C BLOG_TYPE_USER V C BLOG_KIND V C BLOG_GROUP C BLOG_TAPER V E P
MARVL system analysis 37
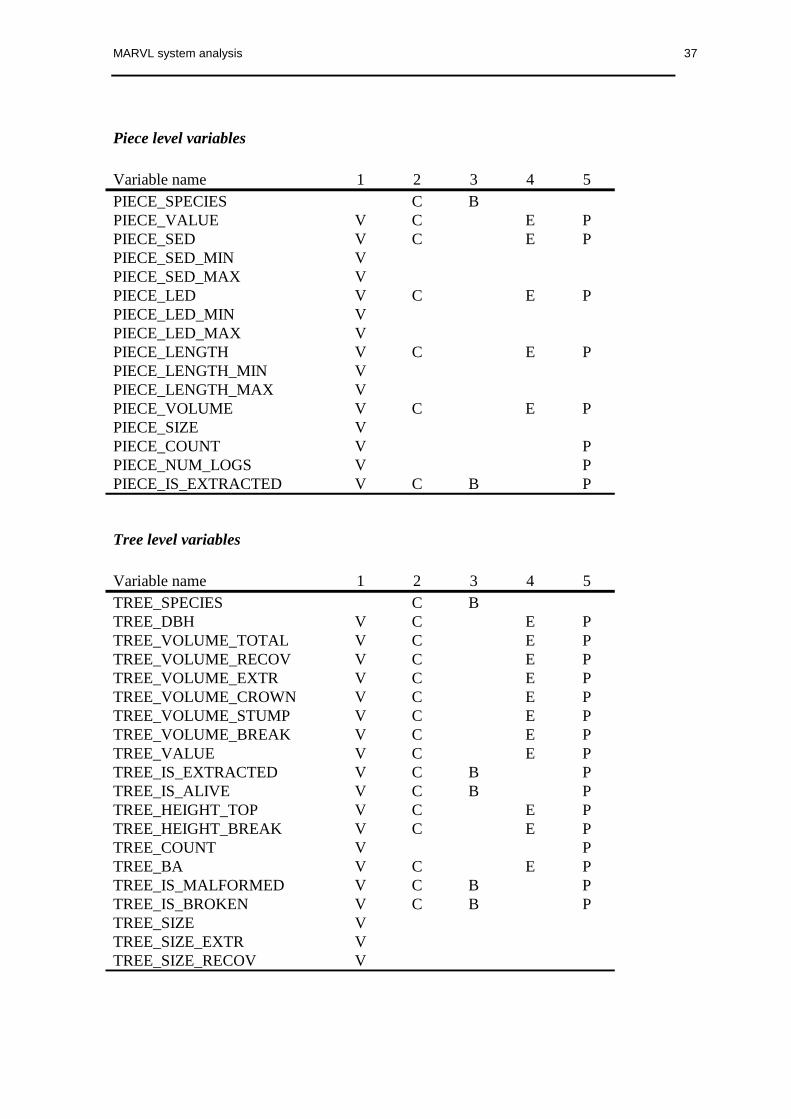
Piece level variables
Variable name 1 2 3 4 5
PIECE_SPECIES C BPIECE_VALUE V C E PPIECE_SED V C E PPIECE_SED_MIN VPIECE_SED_MAX VPIECE_LED V C E PPIECE_LED_MIN VPIECE_LED_MAX VPIECE_LENGTH V C E PPIECE_LENGTH_MIN VPIECE_LENGTH_MAX VPIECE_VOLUME V C E PPIECE_SIZE VPIECE_COUNT V PPIECE_NUM_LOGS V PPIECE_IS_EXTRACTED V C B P
Tree level variables
Variable name 1 2 3 4 5
TREE_SPECIES C BTREE_DBH V C E PTREE_VOLUME_TOTAL V C E PTREE_VOLUME_RECOV V C E PTREE_VOLUME_EXTR V C E PTREE_VOLUME_CROWN V C E PTREE_VOLUME_STUMP V C E PTREE_VOLUME_BREAK V C E PTREE_VALUE V C E PTREE_IS_EXTRACTED V C B PTREE_IS_ALIVE V C B PTREE_HEIGHT_TOP V C E PTREE_HEIGHT_BREAK V C E PTREE_COUNT V PTREE_BA V C E PTREE_IS_MALFORMED V C B PTREE_IS_BROKEN V C B PTREE_SIZE VTREE_SIZE_EXTR VTREE_SIZE_RECOV V

MARVL system analysis 38
Plot level variables
Variable name 1 2 3 4 5
PLOT_MEAN_DBH V E PPLOT_DBH_MEAN_TOP V E PPLOT_HEIGHT_MEAN_TOP V E PPLOT_HEIGHT_MEAN V E PPLOT_VOLUME_TOTAL V E PPLOT_VOLUME_RECOV V E PPLOT_VOLUME_EXTR V E PPLOT_VOLUME_CROWN V E PPLOT_VOLUME_STUMP V E PPLOT_VOLUME_BREAK V E PPLOT_BA V E PPLOT_SPH V E P

MARVL system analysis 39
Appendix 4 Example report section definitions[StandingResource]Name=Standing ResourceClassVariable=TREE_IS_ALIVEVariables=TREE_VOLUME_TOTAL +ERROR TREE_COUNT +PERCENT TREE_BA +ERROR+PERCENT TREE_DBHLevels=PLOT STRATUM POPULATION
[StandardResource]Variables=PLOT_HEIGHT_LIVE PLOT_DBH_MEAN_TOP PLOT_HEIGHT_MEAN_TOPShowTitles=TRUEShowTotals=FALSELevels=POPULATION
[VolumeAnalysis]Name=Volume AnalysisVariables=TREE_VOLUME_TOTAL +ERROR TREE_VOLUME_RECOV +ERROR TREE_COUNTTREE_SIZEClassVariable=TREE_IS_EXTRACTEDLevels=PLOT STRATUM POPULATIONShowTotals=FALSEShowTitles=TRUE
[LiveStandingTrees]Name=Live Standing TreesVariables=TREE_VOLUME_TOTAL +ERROR TREE_COUNT TREE_SIZEClassVariable=TREE_IS_RECOVEREDLevels=PLOT STRATUM POPULATIONShowTotals=TRUEShowTitles=TRUE
[CutoverResidue]Name=Cutover ResidueVariables=LOG_VOLUME +ERRORClassVariable=LOG_KINDShowTotals=FALSEShowTitles=TRUEFirstClass=0NumberOfClasses=2Levels=PLOT STRATUM POPULATION
[ExtractableStems]Name=Extractable Stems (stump and breakage removed)Variables=TREE_VOLUME_EXTR +ERROR TREE_COUNT TREE_SIZE_EXTRClassVariable=TREE_IS_RECOVEREDLevels=PLOT STRATUM POPULATIONShowTotals=TRUEShowTitles=TRUE
[CuttingWaste]Variables=LOG_VOLUME_EXTR +ERRORClassVariable=LOG_KINDShowTotals=FALSEShowTitles=FALSEFirstClass=2NumberOfClasses=1Levels=PLOT STRATUM POPULATION

MARVL system analysis 40
[ProductAnalysis]Name=Product AnalysisVariables=LOG_VOLUME +ERROR +PERCENT LOG_VALUE +PERCENT LOG_COUNTLOG_SIZEClassVariable=LOG_TYPE_USERLevels=STRATUM POPULATIONShowTotals=TRUEShowTitles=TRUE
[StockTable]Name=Stock TableVariables=LOG_COUNT LOG_VOLUME +ERROR +PERCENT LOG_VALUEByVariable=LOG_TYPE_USERClassVariable=LOG_SEDLevels=POPULATIONShowTitles=TRUENumberOfClasses=25ClassWidth=40FirstClass=0
[StandTable]Name=Stand TableVariables=TREE_COUNT TREE_IS_MALFORMED TREE_IS_EXTRACTED TREE_HEIGHT_TOPTREE_HEIGHT_BREAK TREE_VOLUME_TOTAL TREE_VOLUME_RECOVClassVariable=TREE_DBHLevels=POPULATIONShowTitles=TRUENumberOfClasses=25ClassWidth=40FirstClass=0
[LengthDist]Name=Log Length DistributionVariables=LOG_VOLUME LOG_VALUE LOG_COUNT LOG_SEDByVariable=LOG_TYPEClassVariable=LOG_LENGTHLevels=PLOT STRATUM POPULATIONShowTitles=TRUENumberOfClasses=40ClassWidth=0.25FirstClass=1
[PieceVolume]Name=Piece Volume DistributionVariables=PIECE_COUNT PIECE_SED PIECE_LED PIECE_LENGTHByVariable=PIECE_IS_EXTRACTEDClassVariable=PIECE_VOLUMEShowTitles=TRUELevels=PLOT STRATUM POPULATION
[YieldTable]Name=Yield TableVariables=LOG_VOLUME +ERROR +PERCENT LOG_VALUE +PERCENT LOG_COUNTClassVariable=LOG_TYPEShowTitles=TRUELevels=PLOT STRATUM POPULATION
[LogTrace]Name=Log TraceShowTitles=TRUELevels=PLOT STRATUM POPULATION

MARVL system analysis 41
[StratumDescription]Levels=STRATUM POPULATION
[CentreDiameterUnderBark]Levels=POPULATION
[DominanceDistribution]Name=Dominance distributionVariables=TREE_COUNTClassVariable=TREE_DBHNumberOfClasses=40ClassWidth=50FirstClass=200ByVariable="Dominance"

MARVL system analysis 42
Appendix 5. MARVL database schema
------ Import ------Extra : Extra data for MicroMARVL v2.x importInventry * Text(20) Inventory NameStratum * Int(10) Stratum NumberPlotNum * Int(5) Plot Number within Forest/Cpt/Stand/MeasEstabYr Int(4) Established Year: when plot was plantedMeasYear Int(4) Year plot was measuredMeasMnth Int(2) Month plot was measuredSpecies Text(5) Tree SpeciesGISLink Long(10) Connection to unique Plot ID in GIS
ExtrDict : Extra Data: Inventory --> Dictionary linkInventry * Text(20) Inventory NameDictnary Text(20) Dictionary name
ExtrFunc : Extra Data: Inventory --> Function Set linkInventry * Text(20) Inventory NameStratum * Int(10) Stratum NumberFuncName Text(20) Function Set Name
------ Misc ------Forest : Valid Forest codesForest * Text(4) Forest NameLongName Text(30) Long nameOwner Text(40) Owner of forestRegion Text(2) Location of forest
Species : List of all legal tree species codesSpecies * Text(5) Tree SpeciesBotanic Text(25) Botanical nameCommon Text(25) Common name
------ Function ------Function : Set of volume, taper, breakage, growth, heightequationsFuncName * Text(20) Function Set NameLastUser Text(10) Name of user who last modified thisDateUser Timestamp Date & Time this was last changedIsLocked Int(1) Function Set cannot be changedGmodType Text(1) Growth model typeGmodNum Int(4) Growth model numberHmodType Text(1) Height model typeHmodNum Int(4) Height model numberAdjust Int(4) Monthly Growth adjustment tableHtType Text(1) Height/Diameter type L=log P=Pett1 Q=Pett2T=TableHtTable Int(4) Height/Diameter Curve table (HtType='T')Descript Memo Description of Function Set
FunGroup : Groups of table / model numbers in a function setFuncName * Text(20) Function Set NameFuncGrp * Text(20) Function Group NameVolume Int(4) Tree Volume table numberTaper Int(4) Tree Taper table numberBreakage Int(4) Tree breakage table number

MARVL system analysis 43
FunSpecy : Which species belong to which function groupFuncName * Text(20) Function Set NameFuncGrp * Text(20) Function Group NameSpecies * Text(5) Tree Species
------ Strategy ------Strategy : Cutting Strategy definitionCutStrat * Text(20) Cutting Strategy nameLastUser Text(10) Name of user who last modified thisDateUser Timestamp Date & Time this was last changedIsLocked Int(1) Strategy cannot be changedRoundLen Real(4,1) Round off lengthStumpHt Real(4,1) Stump height (metres)CutCost Real(9,7) Cost of making a cutDescript Memo Description of Strategy
LogType : Log type's value and acceptable end diametersCutStrat * Text(20) Cutting Strategy nameLogType * Text(20) Log Type nameLogKind * Int(2) Stump, Waste, Above-Break, User-DefinedDollars Real(8,2) Log dollar valueMinSED Real(4,0) Minimum small end diameterMaxSED Real(4,0) Maximum small end diameterMaxLED Real(4,0) Maximum large end diameterDescript Memo Description of Log Type
LogDict : Valid quality codes for each log type in a cuttingstrategyCutStrat * Text(20) Cutting Strategy nameLogType * Text(20) Log Type nameDictnary * Text(20) Dictionary nameQCodes Text(26) Valid qualitiesMinLeng Real(4,1) Minimum length of MinQCodeMinQCode Text(26) Must have at least MinLeng of thesequalities (composite log types)
LogLeng : Valid length ranges for Log Types in a cutting strategyCutStrat * Text(20) Cutting Strategy nameLogType * Text(20) Log Type nameMinLeng * Real(4,1) Minimum log type lengthMaxLeng * Real(4,1) Maximum log type length
LogSpecy : Log type's allowed speciesCutStrat * Text(20) Cutting Strategy nameLogType * Text(20) Log Type nameSpecies * Text(5) Tree Species
LogGroup : LogGroup: definitionCutStrat * Text(20) Cutting Strategy nameLogGroup * Text(20) Log Group nameAvgSED Real(4,0) Minimum average small end diameterMinSED Real(4,0) Minimum allowable log type diameterSpecCut Int(1) Cut to SED spec during analysis
LogGrpTy : The log types in a log groupCutStrat * Text(20) Cutting Strategy nameLogGroup * Text(20) Log Group nameLogType * Text(20) Log Type name

MARVL system analysis 44
------ Plan ------LPlan : Group of ViewsLPlan * Text(20) Groups a set of inventoriesLastUser Text(10) Name of user who last modified thisDateUser Timestamp Date & Time this was last changedIsLocked Int(1) True if this plan cannot be changedDescript Memo Description of Plan
LPlanInv : List of Views in the PlanLPlan * Text(20) Groups a set of inventoriesInventry * Text(20) Inventory Name
------ View ------Inventry : View / Inventory definitionInventry * Text(20) Inventory NameLastUser Text(10) Name of user who last modified thisDateUser Timestamp Date & Time this was last changedIsLocked Int(1) True if this view is lockedIsDesign Int(1) True if this is a design inventoryIsValid Int(1) True if this view can be analysedDescript Memo Description of View
StrPlot : Link view strata to plot keysInventry * Text(20) Inventory NameStratum * Int(10) Stratum NumberPlotKey * Long(10) Unique plot keyUsHeight Int(1) True if height trees from this plot areadded to regressionPlotUse Int(1) 0 = unused, 1 = Primary, 2 = Secondary plot
Stratum : Stratifies plots in a ViewInventry * Text(20) Inventory NameStratum * Int(10) Stratum NumberArea Real(6,2) Stratum areaFuncName Text(20) Function Set Name
------ Plot ------Plot : Plot dataPlotKey * Long(10) Unique plot keyLastUser Text(10) Name of user who last modified thisDateUser Timestamp Date & Time this was last changedPlotNum Int(5) Plot Number within Forest/Cpt/Stand/MeasInventry Text(20) Inventory NameDictnary Text(20) Dictionary nameEstYear Int(4) Year plot was plantedMeasYear Int(4) Year plot was measuredMeasMnth Int(2) Month plot was measuredTreeCoun Int(3) Number of trees in plot (live and dead)Slope Int(2) Slope valuePlotType Int(1) bounded, angle gauge, count, horiz-line,LISArea Real(7,5) Plot areaLength Real(6,2) Plot lengthBaf Real(5,2) Basal Area factorBArea Real(5,1) Live Basal areaStocking Real(5,0) Live StockingMTopDBH Real(4,0) Mean top diameterGISLink Long(10) Connection to unique Plot ID in GISDescript Memo Description of Plot
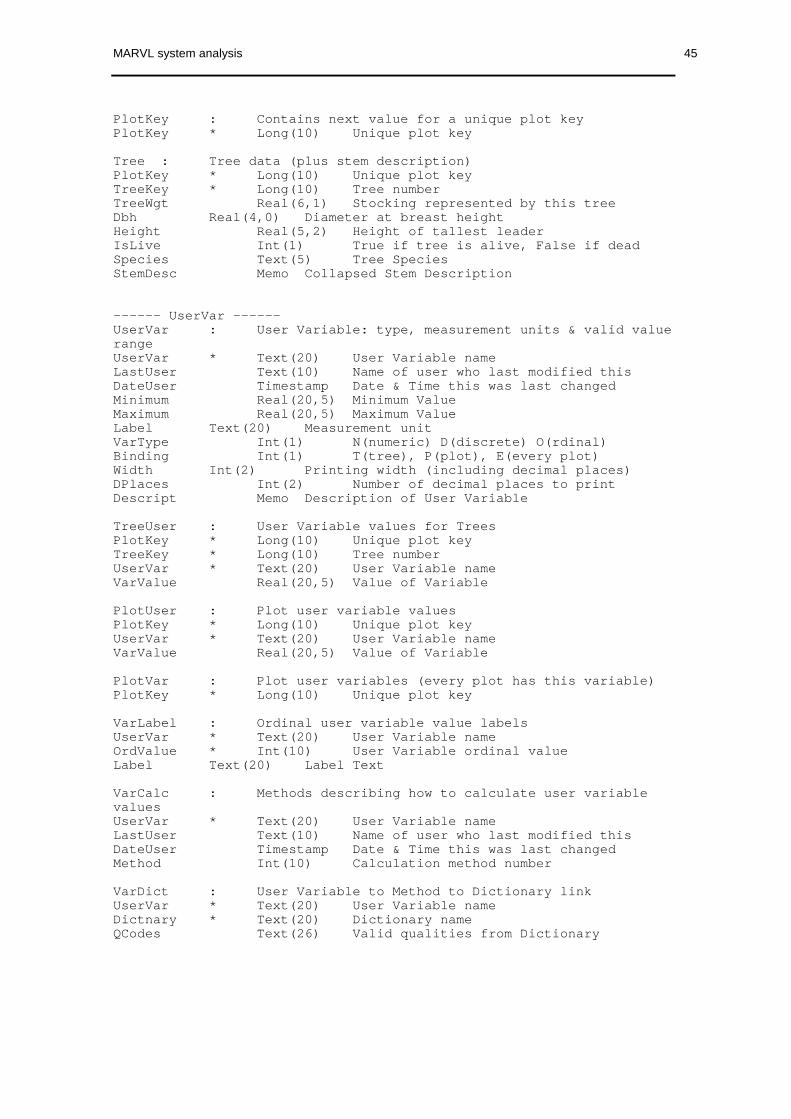
MARVL system analysis 45
PlotKey : Contains next value for a unique plot keyPlotKey * Long(10) Unique plot key
Tree : Tree data (plus stem description)PlotKey * Long(10) Unique plot keyTreeKey * Long(10) Tree numberTreeWgt Real(6,1) Stocking represented by this treeDbh Real(4,0) Diameter at breast heightHeight Real(5,2) Height of tallest leaderIsLive Int(1) True if tree is alive, False if deadSpecies Text(5) Tree SpeciesStemDesc Memo Collapsed Stem Description
------ UserVar ------UserVar : User Variable: type, measurement units & valid valuerangeUserVar * Text(20) User Variable nameLastUser Text(10) Name of user who last modified thisDateUser Timestamp Date & Time this was last changedMinimum Real(20,5) Minimum ValueMaximum Real(20,5) Maximum ValueLabel Text(20) Measurement unitVarType Int(1) N(numeric) D(discrete) O(rdinal)Binding Int(1) T(tree), P(plot), E(every plot)Width Int(2) Printing width (including decimal places)DPlaces Int(2) Number of decimal places to printDescript Memo Description of User Variable
TreeUser : User Variable values for TreesPlotKey * Long(10) Unique plot keyTreeKey * Long(10) Tree numberUserVar * Text(20) User Variable nameVarValue Real(20,5) Value of Variable
PlotUser : Plot user variable valuesPlotKey * Long(10) Unique plot keyUserVar * Text(20) User Variable nameVarValue Real(20,5) Value of Variable
PlotVar : Plot user variables (every plot has this variable)PlotKey * Long(10) Unique plot key
VarLabel : Ordinal user variable value labelsUserVar * Text(20) User Variable nameOrdValue * Int(10) User Variable ordinal valueLabel Text(20) Label Text
VarCalc : Methods describing how to calculate user variablevaluesUserVar * Text(20) User Variable nameLastUser Text(10) Name of user who last modified thisDateUser Timestamp Date & Time this was last changedMethod Int(10) Calculation method number
VarDict : User Variable to Method to Dictionary linkUserVar * Text(20) User Variable nameDictnary * Text(20) Dictionary nameQCodes Text(26) Valid qualities from Dictionary

MARVL system analysis 46
------ Dictnary ------Dictnary : Quality Code Dictionary definitionDictnary * Text(20) Dictionary nameLastUser Text(10) Name of user who last modified thisDateUser Timestamp Date & Time this was last changedIsLocked Int(1) Dictionary cannot be changedDescript Memo Description of Dictionary
Dictcode : List of valid codes and descriptions in a DictionaryDictnary * Text(20) Dictionary nameQCode * Text(1) Quality CodeDescript Memo Description of Quality Code