Embed Size (px)
Citation preview

Confidential
Maryland Insurance Administration
Valuation Report on CareFirst, Inc.
February 11, 2003

Confidential
1
25069531.doc
Disclaimer
THIS REPORT IS INTENDED TO BE USED ONLY BY STEVEN B. LARSEN, INSURANCE
COMMISSIONER FOR THE MARYLAND INSURANCE ADMINISTRATION. IT IS NOT INTENDED
TO BE USED AND MAY NOT BE RELIED UPON BY ANY OTHER PARTY FOR ANY REASON,
WHATSOEVER.
A VALUATION IS A COMPLEX PROCESS AND IS NOT NECESSARILY SUSCEPTIBLE TO A
PARTIAL ANALYSIS OR SUMMARY DESCRIPTION. IN PERFORMING ITS VALUATION,
BLACKSTONE HAS CONSIDERED THE RESULTS OF ALL OF ITS ANALYSES AS A WHOLE AND
DID NOT NECESSARILY ATTRIBUTE ANY PARTICULAR WEIGHT TO ANY ANALYSIS OR
FACTOR CONSIDERED. FURTHERMORE, SELECTING ANY PORTION OF BLACKSTONE’S
ANALYSES, WITHOUT CONSIDERING ALL ANALYSES, WOULD CREATE AN INCOMPLETE
VIEW OF THE PROCESS UNDERLYING THIS VALUATION. BLACKSTONE MAY HAVE
DEEMED VARIOUS ASSUMPTIONS MORE OR LESS PROBABLE THAN OTHER ASSUMPTIONS,
SO THE RANGES OF VALUATIONS RESULTING FROM ANY PARTICULAR ANALYSIS
DESCRIBED ABOVE SHOULD NOT BE TAKEN TO BE BLACKSTONE’S VIEW OF THE ACTUAL
VALUE OF CAREFIRST.

Confidential
2
25069531.doc
Valuation Report on CareFirst, Inc.
TRANSACTION OVERVIEW
The Blackstone Group L.P. (“Blackstone”) has been serving as a valuation advisor to the Maryland Insurance Administration (“MIA”) in connection with the MIA’s examination of the conversion and subsequent acquisition of CareFirst, Inc. and its subsidiaries (“CareFirst”) by WellPoint Health Networks Inc. (“WellPoint”) (the “Transaction”).
■ CareFirst is a holding company for three affiliated Blue Cross Blue Shield companies: CareFirst of Maryland, Inc. (“CFMI”), Group Hospitalization & Medical Services, Inc. (“GHMSI,” d/b/a CareFirst Blue Cross Blue Shield of the National Capital Area), and Blue Cross Blue Shield of Delaware (“BCBSD”).
■ Beginning in 2000, CareFirst engaged Donaldson, Lufkin & Jenrette (later acquired by CSFB) to assist in analyzing its strategic alternatives. This process resulted in an auction of CareFirst in which two buyers, WellPoint and Trigon, participated.
■ On November 20, 2001, CareFirst and WellPoint announced that they had entered into a definitive agreement under which WellPoint would acquire CareFirst in a sponsored conversion valued at $1.3 billion in a combination of cash and WellPoint stock.(1)
■ As part of the Transaction, CareFirst, a non-stock, non-profit health service company domiciled in the State of Maryland (the “State”), intends to convert from a non-stock, non-profit health services company to a for-profit stock company. Simultaneous with the conversion, CareFirst intends to be acquired by, and become a wholly owned subsidiary of, WellPoint. Certain tax exempt entities (the “Foundations”)(2) will receive 100% of CareFirst’s common stock after the conversion and will receive 100% of the Transaction consideration after the acquisition by WellPoint.
■ The MIA is currently examining the Transaction in order to determine, among other things, whether the fair value of public assets of CareFirst will be distributed to the State as required by Section 6.5-301(b) and (d) of the State Government Article, Annotated Code of Maryland (the “Code”) as a result of the Transaction.
■ Blackstone issued a preliminary report on August 16, 2002 that valued CareFirst at $1.35 billion – $2.25 billion. Blackstone orally narrowed that range in testimony at public hearings on December 16, 2002 by stating the following: “effectively the midpoint is probably the point at which we have the highest degree of comfort in terms of the appropriate value of CareFirst, as we drift away from that midpoint, so our comfort level with the valuation of CareFirst decreases.”
(1) On April 25, 2002, Maryland Governor Parris Glendening signed a bill requiring that the State’s share of the $1.3 billion purchase price be in cash rather than in a combination
of cash and WellPoint stock. (2) Maryland has created the Maryland Health Care Trust for this purpose. Other jurisdictions have not yet created such vehicles to receive and administer any Transaction
consideration.
Confidential
3
25069531.doc
Valuation Report on CareFirst, Inc.
TRANSACTION OVERVIEW (CONT’D)
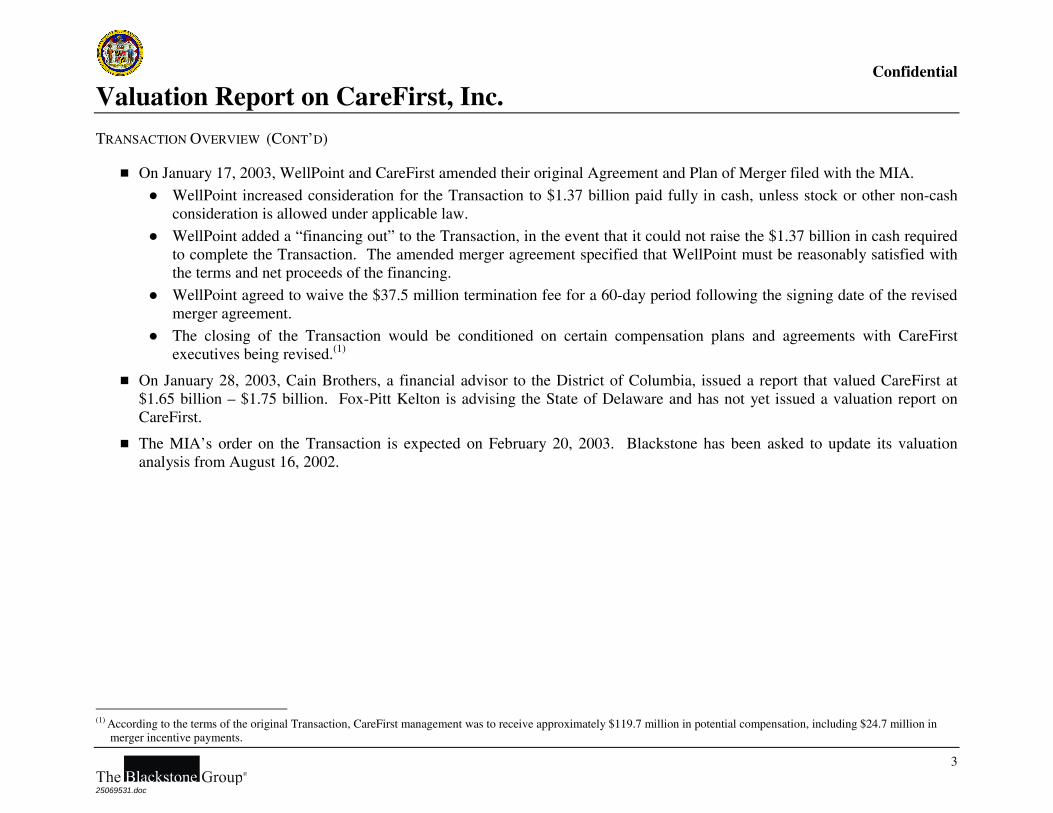
■ On January 17, 2003, WellPoint and CareFirst amended their original Agreement and Plan of Merger filed with the MIA.
● WellPoint increased consideration for the Transaction to $1.37 billion paid fully in cash, unless stock or other non-cash consideration is allowed under applicable law.
● WellPoint added a “financing out” to the Transaction, in the event that it could not raise the $1.37 billion in cash required to complete the Transaction. The amended merger agreement specified that WellPoint must be reasonably satisfied with the terms and net proceeds of the financing.
● WellPoint agreed to waive the $37.5 million termination fee for a 60-day period following the signing date of the revised merger agreement.
● The closing of the Transaction would be conditioned on certain compensation plans and agreements with CareFirst executives being revised.(1)
■ On January 28, 2003, Cain Brothers, a financial advisor to the District of Columbia, issued a report that valued CareFirst at $1.65 billion – $1.75 billion. Fox-Pitt Kelton is advising the State of Delaware and has not yet issued a valuation report on CareFirst.
■ The MIA’s order on the Transaction is expected on February 20, 2003. Blackstone has been asked to update its valuation analysis from August 16, 2002.
(1) According to the terms of the original Transaction, CareFirst management was to receive approximately $119.7 million in potential compensation, including $24.7 million in
merger incentive payments.

Confidential
4
25069531.doc
Valuation Report on CareFirst, Inc.
SCOPE OF BLACKSTONE’S WORK
As part of its valuation of CareFirst in accordance with Section 6.5-301(d) of the State Government Article, Annotated Code of Maryland, Blackstone has done the following:
Documents Reviewed
■ Reviewed CareFirst’s audited historical financial statements for the years ended December 31, 1997 – 2001.
■ Reviewed CareFirst’s preliminary 2002 results and financial projections for 2003, prepared and furnished to us by CareFirst, as well as certain other internally prepared financial and operating information about CareFirst.
■ Reviewed CareFirst management projections for 2003 – 2007.
■ Reviewed certain analyses of CareFirst’s business prepared and furnished to Blackstone by WellPoint management including an estimate of potential synergies in a Transaction.
■ Reviewed presentations and reports prepared by CareFirst for rating agencies for the years 1998, 1999, 2000, and 2001.
■ Reviewed minutes from meetings of CareFirst’s Board of Directors, Strategic Planning Committee (the “SPC”) and Compensation Committee for the years 1998, 1999, 2000, and 2001.
■ Reviewed presentations made by The Bear Stearns Companies, Inc. to the SPC dated December 8, 1997, June 25, 1998, and September 23, 1998, which discussed industry trends and strategic alternatives for CareFirst.
■ Reviewed presentations made by Andersen Consulting (Accenture) to CareFirst’s Board of Directors dated October 28, 1999, and November 23, 1999.
■ Reviewed presentations made by Credit Suisse First Boston (“CSFB”) to the SPC dated June 1, 2000, July 2000, July 27, 2000, October 26, 2000, January 22, 2001, February 22, 2001, March 23, 2001, April 26, 2001, July 25, 2001, September 25, 2001 and November 20, 2001.
■ Reviewed presentations made by CSFB to CareFirst’s Board of Directors dated July 27, 2000, December 4, 2000, February 22, 2001, April 29, 2001, and November 20, 2001.
■ Reviewed the snapshot analyses prepared by Ellin & Tucker, Chartered (“E&T”) (i) dated July 7, 2000, which analyzed the relative contribution of CFMI and GHMSI to CareFirst as of January 16, 1998; and (ii) dated March 5, 2001 (draft), which analyzed the relative contribution of CFMI / GHMSI and BCBSD to CareFirst as of March 22, 2000.

Confidential
5
25069531.doc
Valuation Report on CareFirst, Inc.
SCOPE OF BLACKSTONE’S WORK (CONT’D)
Documents Reviewed (Cont’d) ■ Reviewed the opinion from CareFirst’s counsel, Piper, Marbury, Rudnick & Wolfe LLP (“Piper Marbury”), dated January 17,
2001 describing the fiduciary obligations of Board members in the matter of potential strategic initiatives. ■ Reviewed memorandum from Frederic W. Cook & Co., Inc. dated April 12, 2001, which analyzed the merger incentive amount
to be received by CareFirst’s CEO. ■ Reviewed the executive compensation analysis performed by Hay Group, Inc. (the “Hay Group”) dated July 30, 2001. ■ Reviewed the opinion of CSFB to CareFirst’s Board of Directors dated November 20, 2001, as to the fairness, from a financial
point of view, to the holders of CareFirst common stock immediately prior to WellPoint’s acquisition of CareFirst of the aggregate consideration to be received in exchange for all outstanding shares of CareFirst’s common stock, pursuant to the terms of the Agreement and Plan of Merger, dated as of November 20, 2001.
■ Reviewed the presentation made by Banc of America Securities LLC (“BAS”), WellPoint’s financial advisor, to the Board of Directors of WellPoint dated November 19, 2001, as to the value of CareFirst.
■ Reviewed pre-filed written testimony from CareFirst’s public hearings dated March 6, 2002, relating to the public hearing that was held on March 11, 13, and 14, 2002.
■ Reviewed transcripts from the public hearings on March 11, 13, and 14, 2002; April 29 and 30, 2002; December 16, 17, and 18, 2002; January 28, 29, 30, and 31, 2003; and February 3, 4, and 5, 2003.
■ Reviewed pre-filed written testimony from public hearings on March 7, 2002, December 16, 2002, and January 21 and 29, 2003.
■ Reviewed the Agreement and Plan of Merger between WellPoint and CareFirst, filed November 20, 2001. ■ Reviewed the Amended and Restated Agreement and Plan of Merger between WellPoint and CareFirst, filed January 17, 2003. ■ Reviewed the valuation report of Cain Brothers to the Government of the District of Columbia, dated January 23, 2003. ■ Reviewed certain other publicly available and internal information concerning the business, financial condition, and operations
of CareFirst that we believe to be relevant to our inquiry.
Meetings ■ Attended public hearings in Baltimore, MD on April 29 – 30, 2002, December 16 – 18, 2002, and January 28, 2003. ■ Held discussions with both the advisors and the members of management of CareFirst and WellPoint concerning CareFirst, its
business, operating environment, financial condition, prospects, and strategic objectives.

Confidential
6
25069531.doc
Valuation Report on CareFirst, Inc.
SCOPE OF BLACKSTONE’S WORK (CONT’D)
Meetings (Cont’d)
■ Met with Stuart Smith and Michael Muntner of CSFB and David Wolf (Executive Vice President, Medical Systems and Corporate Development) of CareFirst on June 12, 2002 to discuss the transaction process and CSFB’s fairness opinion dated November 20, 2001.
■ Met with Gregory L. Sorenson, Richard M. Schapiro, Kevin V. Dreyer, Vince Lambert, and Matthew Miller of BAS on June 18, 2002 to discuss the transaction process and BAS’ valuation of CareFirst dated November 19, 2001.
■ Met with David Wolf, G. Mark Chaney (Executive Vice President and CFO), John Piccioto (Executive Vice President, General Counsel, and Corporate Secretary) and Sandy Beard (Director, New Business Development) of CareFirst on July 10, 2002 at CareFirst’s headquarters in Owings Mills, MD to discuss CareFirst’s business and financial condition and the transaction process.
■ Met with Carl F. Miller and Chris Rosenthal of E&T on July 11, 2002 to discuss the methodologies utilized in their snapshot analysis for the CFMI / GHMSI affiliation dated July 7, 2000.
■ Met with David Colby (Executive Vice President and CFO), Tom Geiser (Executive Vice President and General Counsel), Carol Burt (Senior Vice President, Finance and Treasury), Bob Glaser (Vice President, Corporate Development), Robert Kelly (Vice President, Legal), and Jason Rhoades (Director, Corporate Development) of WellPoint on July 12, 2002 at their headquarters in Thousand Oaks, CA to discuss CareFirst’s business and financial results, the transaction rationale and potential synergies, the transaction process, and CareFirst’s valuation.
■ Met with William Jews (President and CEO), David Wolf, G. Mark Chaney, and Douglas Thompson (Manager, New Business Development) of CareFirst, as well as David M. Funk Esq. (Managing Partner) of Funk & Bolton on July 29, 2002 at CareFirst’s headquarters to discuss CareFirst’s strategic vision and financial results, and the transaction process.
■ Met with WellPoint management on December 10, 2002, to discuss WellPoint’s recent financial performance and the Transaction.

Confidential
7
25069531.doc
Valuation Report on CareFirst, Inc.
SCOPE OF BLACKSTONE’S WORK (CONT’D)
Other
■ Analyzed the market performance of other conversions and initial public offerings in the health and life insurance industries.
■ Reviewed the financial terms of selected recently completed mergers and acquisitions in the managed care industry.
■ Analyzed the operating and trading statistics of selected publicly traded managed care companies.
■ Considered the pro forma financial effect of the merger on WellPoint.
■ Conducted numerous conference calls with CareFirst management and WellPoint management from January 15, 2003 through February 10, 2003.
■ Held certain discussions with the Maryland Insurance Department from January 15, 2003 through February 5, 2003.
■ Reviewed such other information, performed such other studies and analyses, and took into account such other matters as we deemed appropriate.

Confidential
8
25069531.doc
Valuation Report on CareFirst, Inc.
SCOPE OF BLACKSTONE’S WORK (CONT’D)
Blackstone has not:
■ Independently verified the accuracy and completeness of financial and other information that is available from public sources and information provided to us by CareFirst, WellPoint, or their respective representatives or otherwise reviewed by us.
■ Made an independent appraisal of CareFirst’s or WellPoint’s surplus or assets or expressed any opinion as to either the value of such surplus or such assets or the value of the projected income and cash flow expected to be derived therefrom.
■ Performed due diligence on CareFirst’s physical properties, sales, marketing, distribution or service organizations, product markets or investment portfolio.
■ Performed due diligence on WellPoint’s business or financial condition, or the value of its stock.
■ Analyzed the relative distribution of proceeds among Maryland, Washington, D.C., Delaware and northern Virginia.
■ Considered either the relative merits of the Transaction as compared to any other business plan or opportunity that might be available to CareFirst or the effect of any other arrangement in which CareFirst might engage.
■ Expressed any Opinion, including as to the following:
● The fair value of CareFirst
● The fair value of the public assets of CareFirst that serve healthcare needs in Maryland
● Whether the terms of the Transaction fairly distribute the value of the public assets
● The fair market value of any shares of WellPoint common stock to be issued in connection with the Transaction or the price at which WellPoint common stock will trade

Confidential
9
25069531.doc
Valuation Report on CareFirst, Inc.
VALUATION SUMMARY
The revised ranges for the valuation methodologies that Blackstone analyzed are indicated below and described on the following pages. Based on these analyses and Blackstone’s judgment, the valuation range for CareFirst would be $1.45 – $1.65 billion.
$1.65
$1.95
$1.53
$1.81
$1.62$1.31
$1.50
$1.25
$1.52
$1.45
$1.00 $1.20 $1.40 $1.60 $1.80 $2.00 $2.20
Blackstone Valuation Range
Discounted Cash Flow Analysisplus 50% of WellPoint Synergies /
Adjustments
Discounted Cash Flow Analysis
Comparable PrecedentTransaction Analysis
Comparable Publicly TradedCompany Analysis
Valuation Range ($ in billions)
(1)
(2)
Wellpoint Offer
$1.37
(1) Represents fully seasoned trading value plus a control premium of 20% – 30%. (2) Combines the stand-alone DCF value of CareFirst (based on the CareFirst Case) with 50% of the value of any improvements (based on the difference between the WellPoint
Case and the CareFirst Case).

Confidential
10
25069531.doc
Valuation Report on CareFirst, Inc.
ILLUSTRATIVE PRICING MATRIX
For discussion purposes only, set forth below are the multiples implied by an acquisition of CareFirst at a transaction value of $1.35 billion – $1.85 billion, relative to the most comparable precedent transactions.
($ in millions)
Current
Transaction Value
Blackstone Valuation Range
Most Comparable Transaction Multiples(1)(2)
Purchase Price $1,350 $1,370 $1,450 $1,550 $1,650 $1,750 $1,850 Low Mean High TEV /
Adj. Membership (1.45)(3) $931 $945 $1,000 $1,069 $1,138 $1,207 $1,276 $389 $1,760 $3,464 2002E Revenue ($4,279) 0.3x 0.3x 0.3x 0.4x 0.4x 0.4x 0.4x 0.4x 1.0x 1.4x 2002E EBITDA ($179) 7.6 7.7 8.1 8.7 9.2 9.8 10.4 9.0 12.5 17.3 2002E EBIT ($134) 10.1 10.2 10.8 11.6 12.3 13.1 13.8 10.6 14.4 19.0
Equity Value /
2002E Net Income ($83)(4) 16.3x 16.5x 17.5x 18.7x 19.9x 21.1x 22.3x 20.5x 21.3x 22.1x 2003E Net Income ($86)(4) 15.6 15.9 16.8 17.9 19.1 20.2 21.4 17.4 18.3 19.2
Equity Value /
2002E Net Income (Market-Adjusted)(5) 16.3x 16.5x 17.5x 18.7x 19.9x 21.1x 22.3x 17.3x 17.9x 18.4x 2003E Net Income (Market-Adjusted)(5) 15.6 15.9 16.8 17.9 19.1 20.2 21.4 15.0 15.4 15.8
(1) Includes Anthem’s acquisition of Trigon, WellPoint’s acquisition of RightCHOICE, and WellPoint’s acquisition of Cerulean. (2) Equity value to projected net income multiples were not available for the WellPoint / Cerulean transaction; hence, ranges for these metrics include only two data points. (3) Adjusted Member = Commercial + Medicare + 0.75 Medicaid + 0.20 (Medicare Supplement + Government + ASO). Excludes specialty members. (4) Assumes CareFirst pays an effective tax rate of 38.0%. (5) Adjusted for change in the managed care index from the transaction announcement date to February 5, 2003.

Confidential
11
25069531.doc
Valuation Report on CareFirst, Inc.
SELECTED COMPARABLE PUBLICLY TRADED COMPANIES – OPERATIONAL STATISTICS
Set forth below are operating statistics for selected managed care companies. CareFirst’s medical loss ratio and SG&A ratios are above the mean of other companies in the sector.
EBITDA / Total Revenue EBIT / Total Revenue Operating Income /
Total Revenue Net Income /
Total Revenue
Medical Loss Ratio
SG&A / Total
Revenue Company LTM 2002E 2003E LTM 2002E 2003E LTM 2002E 2003E LTM 2002E 2003E LTM LTM
BCBS Managed Care Companies
Anthem, Inc. 7.9% 7.9% 7.7% 7.0% 7.0% 6.8% 4.7% 4.7% 5.3% 4.2% 4.2% 4.0% 82.4% 19.3%
Cobalt Corporation 3.8 4.4 5.0 2.9 3.5 4.1 2.1 2.5 2.9 2.7 3.1 2.5 85.0 21.5
WellPoint Health Networks Inc. 7.9 7.6 7.5 7.4 7.2 7.1 5.9 5.6 5.6 3.9 3.9 3.9 81.4 16.7
WellChoice Inc. 4.9 5.9 6.1 4.3 5.2 5.5 3.1 3.7 4.5 2.4 2.9 3.2 86.1 17.6
Regional Non-BCBS Managed Care Companies
Coventry Health Care, Inc. 5.4 7.3 7.6 4.9 6.7 7.0 5.0 5.6 6.0 3.7 4.1 4.3 84.0 12.2
Health Net, Inc. 5.2 5.2 5.5 4.5 4.5 4.9 3.8 3.8 4.2 2.6 2.7 2.8 84.2 13.1
Humana Inc. 3.4 3.4 4.1 2.4 2.4 3.0 1.6 1.6 2.1 1.4 1.4 1.9 83.6 15.6
Mid Atlantic Medical Services, Inc. 5.7 5.9 6.2 5.2 5.4 5.7 4.6 4.7 5.1 3.5 3.6 3.9 86.2 11.0
Oxford Health 11.5 11.5 11.6 11.1 11.1 11.1 9.1 9.1 9.3 6.4 6.4 6.4 79.3 11.8
Maximum 11.5% 11.5% 11.6% 11.1% 11.1% 11.1% 9.1% 9.1% 9.3% 6.4% 6.4% 6.4% 86.2% 21.5%
Mean 6.2 6.6 6.8 5.5 5.9 6.1 4.4 4.6 5.0 3.4 3.6 3.7 83.6 15.4
Minimum 3.4 3.4 4.1 2.4 2.4 3.0 1.6 1.6 2.1 1.4 1.4 1.9 79.3 11.0
Memo: CareFirst(1) 4.2% 4.2% 3.9% 3.1% 3.1% 2.8% 1.5% 1.5% 1.6% 1.9% 1.9% 1.8% 87.0% 16.5%
EBITDA = Earnings before Interest, Taxes, Depreciation and Amortization. EBIT = Earnings before Interest and Taxes. Medical Loss Ratio = Cost of Care / Total Premium Revenue. (1) CareFirst’s net income statistics reflect a 38% tax rate.
Confidential
12
25069531.doc
Valuation Report on CareFirst, Inc.
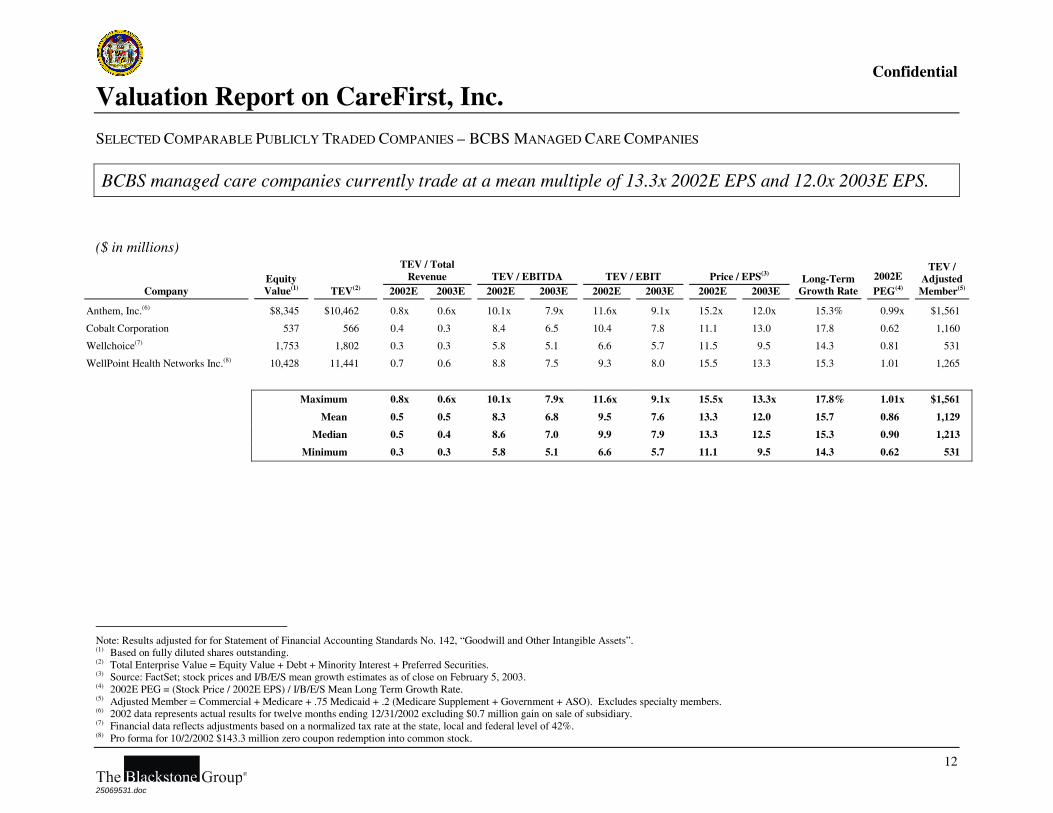
SELECTED COMPARABLE PUBLICLY TRADED COMPANIES – BCBS MANAGED CARE COMPANIES
BCBS managed care companies currently trade at a mean multiple of 13.3x 2002E EPS and 12.0x 2003E EPS.
($ in millions)
TEV / Total
Revenue TEV / EBITDA TEV / EBIT Price / EPS(3) Company
Equity Value(1) TEV(2) 2002E 2003E 2002E 2003E 2002E 2003E 2002E 2003E
Long-Term Growth Rate
2002E PEG(4)
TEV / Adjusted
Member(5)
Anthem, Inc.(6) $8,345 $10,462 0.8x 0.6x 10.1x 7.9x 11.6x 9.1x 15.2x 12.0x 15.3% 0.99x $1,561
Cobalt Corporation 537 566 0.4 0.3 8.4 6.5 10.4 7.8 11.1 13.0 17.8 0.62 1,160
Wellchoice(7) 1,753 1,802 0.3 0.3 5.8 5.1 6.6 5.7 11.5 9.5 14.3 0.81 531
WellPoint Health Networks Inc.(8) 10,428 11,441 0.7 0.6 8.8 7.5 9.3 8.0 15.5 13.3 15.3 1.01 1,265
Maximum 0.8x 0.6x 10.1x 7.9x 11.6x 9.1x 15.5x 13.3x 17.8% 1.01x $1,561
Mean 0.5 0.5 8.3 6.8 9.5 7.6 13.3 12.0 15.7 0.86 1,129
Median 0.5 0.4 8.6 7.0 9.9 7.9 13.3 12.5 15.3 0.90 1,213
Minimum 0.3 0.3 5.8 5.1 6.6 5.7 11.1 9.5 14.3 0.62 531
Note: Results adjusted for for Statement of Financial Accounting Standards No. 142, “Goodwill and Other Intangible Assets”. (1) Based on fully diluted shares outstanding. (2) Total Enterprise Value = Equity Value + Debt + Minority Interest + Preferred Securities. (3) Source: FactSet; stock prices and I/B/E/S mean growth estimates as of close on February 5, 2003. (4) 2002E PEG = (Stock Price / 2002E EPS) / I/B/E/S Mean Long Term Growth Rate. (5) Adjusted Member = Commercial + Medicare + .75 Medicaid + .2 (Medicare Supplement + Government + ASO). Excludes specialty members. (6) 2002 data represents actual results for twelve months ending 12/31/2002 excluding $0.7 million gain on sale of subsidiary. (7) Financial data reflects adjustments based on a normalized tax rate at the state, local and federal level of 42%. (8) Pro forma for 10/2/2002 $143.3 million zero coupon redemption into common stock.

Confidential
13
25069531.doc
Valuation Report on CareFirst, Inc.
SELECTED COMPARABLE PUBLICLY TRADED COMPANIES – REGIONAL NON-BCBS MANAGED CARE COMPANIES
Regional non-BCBS managed care companies are currently trading at a mean multiple of 11.5x 2002E EPS and 9.5x 2003E EPS. However, MAMSI, one of CareFirst’s closest competitors, currently trades at a premium valuation to the group (16.1x 2002E EPS and 13.6x 2003E EPS).
($ in millions)
TEV / Total Revenue TEV / EBITDA TEV / EBIT Price / EPS(3)
Company Equity Value(1) TEV(2) 2002E 2003E 2002E 2003E 2002E 2003E 2002E 2003E
Long-Term Growth Rate
2002E PEG(4)
TEV / Adjusted
Member(5)
Coventry Health Care, Inc. $1,578 $1,753 0.5x 0.4x 6.8x 5.9x 7.3x 6.3x 10.7x 9.2x 15.9% 0.67x $1,142
Health Net, Inc. 3,145 3,544 0.4 0.3 6.7 5.8 7.8 6.6 11.6 10.3 14.0 0.83 1,072
Humana Inc. (6) 1,474 2,079 0.2 0.2 5.4 4.3 7.9 5.8 9.7 6.4 13.4 0.73 554
Mid Atlantic Medical Services, Inc. (7) 1,324 1,328 0.6 0.5 9.8 8.2 10.7 9.0 16.1 13.6 13.8 1.16 677
Oxford Health Plans, Inc. (8) 2,885 3,017 0.6 0.6 5.4 4.7 5.6 5.0 9.3 8.0 13.9 0.67 1,956
Maximum 0.6x 0.6x 9.8x 8.2x 10.7x 9.0x 16.1x 13.6x 15.9% 1.16x $1,956
Mean 0.4 0.4 6.8 5.8 7.9 6.5 11.5 9.5 14.2 0.81 1,080
Median 0.5 0.4 6.7 5.8 7.8 6.3 10.7 9.2 13.9 0.73 1,072
Minimum 0.2 0.2 5.4 4.3 5.6 5.0 9.3 6.4 13.4 0.67 554
Note: Results adjusted for Statement of Financial Accounting Standards No. 142, “Goodwill and Other Intangible Assets.” (1) Based on fully diluted shares outstanding. (2) Total Enterprise Value = Equity Value + Debt + Minority Interest + Preferred Securities. (3) Source: FactSet; stock prices and I/B/E/S mean growth estimates as of close on February 5, 2003. (4) 2002E PEG = (Stock Price / 2002E EPS) / I/B/E/S Mean Long Term Growth Rate. (5) Adjusted Member = Commercial + Medicare + .75 Medicaid + .2 (Medicare Supplement + Government + ASO). Excludes specialty members. (6) 2002 data represents actual results for twelve months ending 12/31/2002 excluding restructuring charge of $35.9 million. (7) Fully diluted shares outstanding excludes 9.2 million shares maintained in a stock compensation trust used to fund obligations arising from various stock option plans. (8) 2002 data represents actual results for twelve months ending 12/31/2002 excluding $151.3 million litigation charge for estimated settlement.

Confidential
14
25069531.doc
Valuation Report on CareFirst, Inc.
HISTORIC P/E MULTIPLE
Since 1995, BCBS companies(1) have generally traded at a premium multiple to regional non-BCBS managed care companies(2) (average multiple of 15.6x vs. 14.2x). BCBS companies are currently trading below their long-term average P/E multiple.
0
5
10
15
20
25
1/1/95 9/1/95 5/1/96 1/1/97 9/1/97 5/1/98 1/1/99 9/1/99 5/1/00 1/1/01 9/1/01 5/1/02 1/1/03
Pri
ce t
o IB
ES
Mea
n E
PS
Est
- N
ext
12 M
os
BCBS Managed Care Index Regional Non-BCBS Managed Care Index
BCBS Avg. Non-BCBS Avg.
(1) Includes RightCHOICE, WellPoint, Anthem, Trigon, Cobalt and WellChoice. (2) Includes Coventry, Health Net, Humana, MAMSI and Oxford Health.

Confidential
15
25069531.doc
Valuation Report on CareFirst, Inc.
ANALYSIS OF PREMIUM FOR A CHANGE OF CONTROL
Based on premiums in precedent insurance transactions (including health, life and reinsurance), Blackstone believes that an appropriate premium for a change of control is 20% – 30%.
Premium(1)
Date Acquiror / Target 1 Day 1 Week 2 Weeks
4/29/02 Anthem / Trigon 24.7% 32.0% 38.8% 10/18/01 WellPoint / RightCHOICE 46.3 46.2 32.8 4/4/01 AIG / American General Corp.(2) 20.3 17.9 20.9 3/12/01 Prudential Plc / American General Corp. 29.5 26.9 30.1 5/1/00 ING Groep NV / Reliastar Financial Corp. 22.7 88.6 87.4 5/26/99 ACE Ltd. / Capital Re Corp. 29.0 29.0 28.2 3/8/99 Fortis AG / American Bankers Insurance Group Inc. 18.6 13.8 11.4 2/18/99 Aegon NV / TransAmerica Corp. 35.4 43.8 44.4 2/16/99 XL Capital Ltd. / NAC Re Corp. 11.1 6.2 17.0 7/27/98 Swiss Reinsurance Co. / Life Re Corp. 6.7 12.1 13.2 9/12/97 American General Corp. / Western National Corp. 9.6 7.4 10.6 6/3/97 Humana / Physician Corp. of America 12.0 12.0 19.1 5/8/97 Foundation Health Systems, Inc. / Physicians Health Services Inc. 8.6 27.2 52.9 2/27/97 CIGNA / Healthsource Inc. 31.8 35.9 47.5 2/24/97 ReliaStar Financial Corp. / Security Connecticut Corp. 25.3 27.5 24.5 2/13/97 Americal General Corp. / USLIFE Corp. 21.0 22.8 22.8 8/5/96 PacifiCare Health Systems, Inc. / FHP International Corp. 28.0 36.6 42.7 4/1/96 Aetna Life and Casualty Company / U.S. Healthcare Inc. 24.3 21.3 18.3 2/1/96 United HealthCare Corporation / Healthwise of America Inc. 8.3 9.1 18.6
High 46.3% 88.6% 87.4% Mean 21.7 27.2 30.6 Median 22.7 26.9 24.5 Low 6.7 6.2 10.6
(1) Represents announced deal price per share relative to the target’s stock price one day, one week and two weeks prior to the announcement of the transaction. (2) Represents offer price premium over American General’s stock price one day, one week, and two weeks prior to Prudential Plc’s original offer. AIG’s offer represented a
premium of 24.6% over American General’s stock price the day prior to AIG’s offer.

Confidential
16
25069531.doc
Valuation Report on CareFirst, Inc.
IMPLIED VALUATION BASED ON COMPARABLE PUBLICLY TRADED COMPANY ANALYSIS
Based on the comparable publicly traded companies, Blackstone believes that CareFirst’s fully seasoned trading value would be $1.05 billion – $1.2 billion. Including a 20.0% – 30.0% control premium and the benefit of NOL / AMT tax credits, Carefirst would be valued at $1.31 billion – $1.62 billion.
($ in millions)
Multiple Description CareFirst
Metric Blackstone
Multiple Range Implied Equity Value
TEV / 2002E EBITDA $178.7 6.5x – 8.0x $1,162 – $1,430 TEV / 2002E EBIT 133.7 8.5 – 10.0 1,136 – 1,337 Price / 2002E Net Income 82.9 12.0 – 14.0 995 – 1,161 TEV / 2003E EBITDA 189.4 5.5 – 7.0 1,042 – 1,326 TEV / 2003E EBIT 139.4 6.5 – 8.0 906 – 1,115 Price / 2003E Net Income 86.4 10.5 – 12.5 907 – 1,080 Reference Range $1,050 – $1,200 Assumed Control Premium 20% – 30% Reference Range with Control Premium $1,260 – $1,560 NOL / AMT Tax Credits(1) 50 – 60 Blackstone Reference Range $1,310 – $1,620
Note: TEV = Equity Value + Debt + Minority Interest + Preferred Securities. As of December 31, 2002, CareFirst had no debt outstanding. (1) Data provided by CareFirst management. Valuation based on discounted cash flow analysis.

Confidential
17
25069531.doc
Valuation Report on CareFirst, Inc.
SELECTED PRECEDENT TRANSACTION ANALYSIS
Blackstone examined comparable precedent transactions that have occurred since January 1, 1996 involving a U.S.-based target with exposure to the managed care industry. However, the Trigon, RightCHOICE, and Cerulean transactions represent the most comparable transactions given that they are the most recent acquisitions of BCBS plans.
TEV/LTM Absolute P/E Market
Adjusted P/E Ann. Date Acquiror / Target
Equity Value(1) TEV
Adj. Member(2) Revenue EBITDA EBIT
CFY P/E(3)
NFY P/E(3)
CFY P/E(4)
NFY P/E(4)
6/18/02 UnitedHealth Group / AmeriChoice Corporation(5) $590.0 $590.0 NA 0.8x NA NA NA NA NA NA
4/29/02 Anthem / Trigon (6) 3,980.8 4,294.0 $3,463.8 1.4 17.3x 19.0x 22.1x 19.2x 17.3x 15.0x
10/18/01 WellPoint / RightCHOICE (7) 1,345.1 1,354.2 1,418.2 1.2 12.3 14.9 23.2 20.1 20.9 18.2
10/18/01 WellPoint / RightCHOICE – Adjusted(8) 1,345.1 1,354.2 1,426.5 1.2 11.4 13.6 20.5 17.4 18.4 15.8
11/29/00 WellPoint / Cerulean(9) 700.0 700.0 388.9 0.4 9.0 10.6 NA NA NA NA
1/28/99 Anthem / Blue Cross and Blue Shield of New Hampshire(10) 120.0 120.0 331.5 0.2 NA NA NA NA NA NA
9/14/99 Blue Cross and Blue Shield of Texas / NYLCare Texas 500.0 500.0 907.4 NA NA NA NA NA NA NA
7/13/99 Anthem / Blue Cross & Blue Shield of Maine(11) 120.0 120.0 315.8 0.3 NA NA NA NA NA NA
3/12/99 Anthem / Blue Cross and Blue Shield of Colorado(12) 165.0 165.0 308.4 0.3 NA NA NA NA NA NA
6/3/97 Humana / Physician Corp. of America 275.0 407.0 461.4 0.3 NM NM 11.9 8.0 5.3 4.5
5/8/97 Foundation Health Systems, Inc. / Physicians Health Services Inc. 278.6 278.6 655.6 0.6 NM NM NM NM NA NA
2/27/97 CIGNA Corporation / Healthsource Inc.(13) 1,427.6 1,689.9 1,166.7 1.0 18.3 30.2 34.0 23.9 20.2 15.6
6/5/97 Humana Inc. / ChoiceCare Foundation 250.0 250.0 1,219.7 0.9 NM NM NA NA NA NA
8/5/96 PacifiCare Health Systems, Inc. / FHP International Corp.(14) 1,505.8 2,347.2 1,234.0 0.6 12.3 15.5 19.8 NA 12.4 NA
4/1/96 Aetna Life and Casualty Company / U.S. Healthcare Inc. 8,941.7 8,941.7 4,211.9 2.5 13.7 14.4 21.2 17.8 12.4 11.4
2/1/96 United HealthCare Corporation / Healthwise of America Inc.(15) 276.2 293.7 2,112.9 1.5 14.9 15.7 26.0 22.0 13.1 12.2
1/8/96 WellPoint / Massachusetts Mutual Life Insurance Co. (16) 380.0 380.0 316.7 0.5 NA NA NA NA NA NA
Maximum $4,211.9 2.5x 18.3x 30.2x 34.0x 23.9x 20.9x 18.2x
Mean(17) 1,246.2 0.9 13.6 16.7 22.3 18.3 15.0 13.2
Minimum 308.4 0.2 9.0 10.6 11.9 8.0 5.3 4.5
Mean for Most Comparable $1,759.7 1.0x 12.6x 14.4x 21.3x 18.3x 17.9x 15.4x

Confidential
18
25069531.doc
Valuation Report on CareFirst, Inc.
SELECTED PRECEDENT TRANSACTION ANALYSIS – FOOTNOTES
(1) Based on fully diluted shares outstanding.
(2) Adjusted Member = Commercial + Medicare + 0.75 Medicaid + 0.20 (Medicare Supplement + Government + ASO). Excludes specialty members.
(3) Source: FactSet.
(4) Adjusted for change in the managed care index from transaction announcement date to February 5, 2003.
(5) Pro forma results for the twelve months ended December 31, 2001. LTM EBIT and EBITDA detail not available due to AmeriChoice Corporation’s acquisitions of Aetna U.S. Healthcare, Inc. (NJ) and HRM Health Plan (PA), Inc.
(6) Excludes $3.2 million software write-off, $1.6 million in goodwill amortization expense, and $3.5 million gain on sale of business unit for the twelve months ended December 31, 2001. Assumes normalized investment returns (including realized gains and losses) based on average of 2000 and 2001 results.
(7) Based on results publicly available on the date of the acquisition. Excludes $2.0 million of reorganization expense, $3.0 million in goodwill amortization expense, and $0.7 million gain on sale of office building for the twelve months ended December 31, 2000. Results for the six months ended June 30, 2001 and June 29, 2000 exclude amortization expense of $1.0 million and $1.5 million, respectively, and $0.7 million gain on sale of building for the six months ended June 29, 2000.
(8) Based on third-quarter results released on October 4, 2001, less than one week post-announcement. Wall Street research analysts used these third-quarter results to analyze the transaction.
(9) Excludes $7.4 million in year 2000 readiness costs and $7.6 million in transaction expenses for the twelve months ended December 31, 1999. Also, excludes $1.1 million in legal expenses for the nine months ended September 30, 1999 and $7.8 million in transaction expenses and $3.6 million in year 2000 readiness costs for the nine months ended September 30, 2000.
(10) Source: Best’s Insurance News (1/28/99).
(11) LTM results based on the twelve months ended December 31, 1998.
(12) LTM results based on the twelve months ended December 31, 1998. Source: National Underwriter Life & Health-Financial Services (11/29/99).
(13) Excludes pretax nonrecurring charge of $12.9 million for the nine months ended September 30, 1996.
(14) Excludes $75.1 million restructuring charge and amortization expense of $31.5 million for the twelve months ended June 30, 1995. Excludes $45.0 million reserve charge and $9.7 million restructuring charge for the nine months ended March 31, 1996.
(15) Excludes $1.1 million in start-up costs for the nine months ended September 30, 1995.
(16) LTM results based on the twelve months ended December 31, 1994.
(17) Mean includes adjusted WellPoint / RightCHOICE transaction multiples.

Confidential
19
25069531.doc
Valuation Report on CareFirst, Inc. IMPLIED VALUATION RANGE BASED ON COMPARABLE PRECEDENT TRANSACTION ANALYSIS
Based on the comparable precedent transactions, with particular emphasis on the acquisitions of Trigon, RightCHOICE and Cerulean, and including the benefit of NOL / AMT tax credits, CareFirst would be valued at $1.50 billion – $1.81 billion.
($ in millions)
Multiple Description CareFirst Metric Blackstone
Multiple Range Implied Equity Value TEV /
2002E EBITDA $178.7 10.0x – 12.5x $1,787 – $2,234
2002E EBIT 133.7 12.0 – 14.5 1,604 – 1,939 Equity Value /
CFY Net Income $82.9 19.0x – 22.0x $1,575 – $1,824
NFY Net Income 86.4 16.0 – 19.0 1,383 – 1,642 Equity Value /
CFY Net Income (Market-Adjusted)(1) $82.9 17.0x – 18.5x $1,409 – $1,534
NFY Net Income (Market-Adjusted)(1) 86.4 15.0 – 16.0 1,296 – 1,383
Reference Range $1,450 – $1,750
NOL / AMT Tax Credits(2) 50 – 60
Blackstone Reference Range $1,500 – $1,810
Note: TEV = Equity Value + Debt + Minority Interest + Preferred Securities. As of December 31, CareFirst had no debt outstanding. (1) Adjusted for change in managed care index from the transaction announcement date to February 5, 2003. (2) Data provided by CareFirst management. Valuation based on discounted cash flow analysis.

Confidential
20
25069531.doc
Valuation Report on CareFirst, Inc.
DISCOUNTED CASH FLOW ANALYSIS – CAREFIRST STAND-ALONE PROJECTIONS(1)
Set forth below are projections, as provided by CareFirst management for CareFirst’s cash flows for 2003 – 2007.
($ in millions)
2003 2004 2005 2006 2007(2)
CareFirst EBIT $139.4 $161.1 $185.1 $212.6 $243.1
Taxes @ 38.0% 53.0 61.2 70.3 80.8 92.4
After-Tax EBIT $86.4 $99.9 $114.8 $131.8 $150.7
Plus: Depreciation 50.0 55.0 60.0 65.0 70.0
Less: Capital Expenditures (65.0) (75.0) (80.0) (85.0) (90.0)
Plus: NOL / AMT tax benefit 15.4 13.3 14.5 14.6 14.8
Less: Decrease / (Increase) in Working Capital(1) (36.9) (35.7) (43.2) (50.4) (58.0)
Unlevered Free Cash Flow $50.0 $57.5 $66.1 $76.0 $87.5
(1) Reflects increase in required cash to meet RBC / BCSA capital requirements and comply with dividend restrictions. CareFirst indicated that it would have approximately $50
million of cash available for dividends in year 1. Assumes cash available for dividends grows at the rate of net income growth (i.e., 15%) (2) 2007 financial data developed through guidance from CareFirst management of 15% growth in net income.

Confidential
21
25069531.doc
Valuation Report on CareFirst, Inc.
DISCOUNTED CASH FLOW ANALYSIS – CAREFIRST STAND-ALONE SENSITIVITY
Based on projections provided by CareFirst management, a discount rate of 10.5% – 12.5%, and a terminal multiple of 11x – 13x forward net income, CareFirst’s DCF value is approximately $1.37 billion – $1.70 billion. However, assuming only a 10%(1) projected annual earnings growth rate for 2004 – 2007 (vs. 15% per CareFirst management), CareFirst’s DCF value is $1.12 billion – $1.39 billion. Based on these results, Blackstone’s reference range is $1.25 billion – $1.53 billion.
($ in millions)
Management Case (15% Growth) Terminal Net Income Multiple
11.0x 12.0x 13.0x
10.5% $1,474 $1,584 $1,695
11.5% 1,419 1,525 1,632 Discount
Rate 12.5% 1,368 1,470 1,572
Downside Case (10% Growth) Terminal Net Income Multiple
11.0x 12.0x 13.0x
10.5% $1,209 $1,297 $1,386
11.5% 1,165 1,250 1,335 Discount
Rate 12.5% 1,123 1,205 1,287
(1) Blackstone has analyzed a case in which CareFirst management’s estimate of 15% net income growth rate has been reduced. CareFirst’s compounded annual growth rate in net
income from continuing operations for the period 1997 – 2002E is 10% (excluding non-recurring charges). In addition, CareFirst’s year-over-year growth in net income from continuing operations for 2002 over 2001 was 23% (excluding non-recurring charges).

Confidential
22
25069531.doc
Valuation Report on CareFirst, Inc.
DESCRIPTION OF TRANSACTION SYNERGIES / ADJUSTMENTS
WellPoint provided Blackstone with a forecast for CareFirst based on how it planned to run the business (the “WellPoint Case”), which included the costs of the transaction. Blackstone has compared the WellPoint Case to CareFirst’s stand-alone management case (the “CareFirst Case”). Set forth below is a summary of the differences between the WellPoint Case and the CareFirst Case. We have called these differences synergies and other adjustments.
WellPoint Difference in Base Projections WellPoint has adjusted CareFirst management’s 15% net income growth rate to a 10% growth rate for the years 2004 – 2007.
WellPoint cites the following reasons for their reduction in CareFirst net income growth from 15% to 10%: lower earnings estimates for 2003 and lower quality of earnings in 2002, lower membership growth and having the majority of 2003 membership growth occur in non-risk products that are unprofitable, and general skepticism about CareFirst’s ability to pass on premium tax increases to consumers without negatively impacting market share. Furthermore, WellPoint cites a historical growth rate of approximately 10% as the most accurate indication of CareFirst’s growth going forward.
Additionally, WellPoint incorporates adjustments for premium taxes it believes are not specifically taken into account in CareFirst management projections.(1)
WellPoint Management Synergies However, WellPoint believes that by operating CareFirst’s business the “WellPoint Way,” it would be
able to extract more earnings and cash flow out of CareFirst’s assets.
Specifically, WellPoint targeted an improvement in the medical loss ratio of 1.1% and an improvement in the SG&A margin of 1.0% over the projection period (relative to the lower base results).
Such business improvements would result from, among other things, (i) tighter financial controls; (ii) better underwriting discipline; (iii) improved customer focus; and (iv) the selling of additional supplemental insurance products to CareFirst’s customer base.
The lowered base forecast in combination with the management improvements result in a small net effect on CareFirst management’s forecast – specifically, increasing post-2003 net income growth from 15% to approximately 16% (before factoring in specifically identified synergies – see the following page).
(1) CareFirst has noted that it has incorporated the effect of such incremental premium taxes explicitly in its 2003 forecast for Maryland and Virginia. CareFirst has also noted that
it expects the costs of additional premium taxes in Delaware and Washington, D.C. will be offset entirely by rate increases – due to its belief that rates will be “approved as filed” in these regulatory environments.

Confidential
23
25069531.doc
Valuation Report on CareFirst, Inc.
DESCRIPTION OF TRANSACTION SYNERGIES / ADJUSTMENTS (CONT’D)
Specifically Identified Synergies Represents WellPoint’s view as to specifically identified categories of synergies that would result from combining WellPoint’s business with CareFirst. These target amounts were determined based on WellPoint’s previous transaction experience.
Set forth below is a schedule, provided by WellPoint, detailing the expected synergies by category ($ in millions):(1)
2004 2005 2006 2007
Corporate Duplication / Shared Services $9 $11 $11 $12
Operating Efficiencies 4 8 14 18
BCBS Delaware 2 3 5 5
Facilities 0 3 5 5
Information Technology 0 5 15 30
Total G&A Savings $15 $30 $50 $70
(1) Based on WellPoint estimates as of August 13, 2002. WellPoint did not have new estimates for these synergies as of February 5, 2003; however, WellPoint did estimate these
synergies to be realized one year later than originally expected as a result of a longer than anticipated timeline to close the Transaction.

Confidential
24
25069531.doc
Valuation Report on CareFirst, Inc.
DESCRIPTION OF TRANSACTION SYNERGIES / ADJUSTMENTS (CONT’D)
One-time Transaction Costs Includes WellPoint and CareFirst professional fees ($22 million), insurance cost ($5 million), equity
offering costs ($26 million), approval process costs ($25 million), severance costs ($3 million), executive change of control costs ($50 million) and other transaction costs ($0.5 million). Based on WellPoint estimates.
Integration Expenses Includes information systems conversion costs ($22 million per year for three years), human resource integration ($1 million in 2004), a stay bonus for information systems employees ($7 million in 2004), integration consulting costs ($1 million in 2004), WellPoint internal integration expenses ($1 million in 2004), non-executive severance costs ($2 million in 2005 and 2006) and other integration expenses ($0.5 million in 2004). Based on WellPoint estimates.
Depreciation Savings Reduced depreciation expense as a result of foregone capital expenditures.
CapEx Savings Reduced capital expenditures by WellPoint and CareFirst on a combined basis to reflect avoidance of duplicative capital spending (e.g., systems development, HIPAA compliance).
Integration CapEx Capital expenditures that WellPoint believes is required to achieve targeted operating synergies. Includes $15 million for new systems build-out (over 2 years), $12 million for third-party software
(over 4 years) and $15 million for facilities (in 2004).
Working Capital Represents the difference between WellPoint’s estimate for changes in working capital and CareFirst’s estimates. Both WellPoint and CareFirst expect required cash (for RBC and BCBSA reserves) to grow over the forecast period; however, CareFirst projects other working capital accounts to be neutral.

Confidential
25
25069531.doc
Valuation Report on CareFirst, Inc.
TRANSACTION SYNERGIES / ADJUSTMENTS
Set forth below is a summary of the transaction synergies / adjustments.
($ in millions)
2003 2004 2005 2006 2007
WellPoint Difference in Base Projections(1) $0.0 ($21.1) ($32.1) ($46.4) ($63.4)
WellPoint Management Synergies(2) 0.0 5.8 24.7 48.1 75.6
Specifically Identified Synergies(3) 0.0 15.0 30.0 50.0 70.0
One-Time Transaction Costs(4) 0.0 (130.8) 0.0 0.0 0.0
Integration Expenses(4) 0.0 (32.4) (23.2) (23.2) 0.0
Depreciation Savings(4) 0.0 0.4 3.9 9.0 13.6
EBIT Contribution 0.0 (163.2) 3.4 37.5 95.8
Taxes @ 38.0% 0.0 (62.0) 1.3 14.3 36.4
After-Tax EBIT Contribution 0.0 (101.2) 2.1 23.3 59.4
Depreciation(4) 0.0 (0.4) (3.9) (9.0) (13.6)
CapEx Savings(4) 0.0 25.0 26.7 28.3 30.0
Integration CapEx(4) 0.0 (23.1) (9.0) (3.0) (7.0)
Change in Net Working Capital(5) 0.0 6.4 9.9 23.2 36.0
Unlevered Free Cash Flow $0.0 ($93.3) $25.8 $62.8 $104.8
Note: Analysis assumes a closing date for the transaction of late 2003. (1) Includes the effects of lowering CareFirst growth rate from 15% to 10% and additional premium taxes as a public company. (2) Includes the effects of a lower MLR and improvement in G&A expenses. (3) Based on WellPoint estimates as of August 13, 2002. WellPoint did not have new estimates for these synergies as of February 5, 2003. (4) Based upon WellPoint guidance. (5) Represents difference between WellPoint’s working capital assumption and CareFirst’s working capital assumption.

Confidential
26
25069531.doc
Valuation Report on CareFirst, Inc.
DISCOUNTED CASH FLOW ANALYSIS – TRANSACTION SYNERGIES / ADJUSTMENTS SENSITIVITY
Based on a discounted cash flow analysis, 100% of the transaction synergies / adjustments would be worth approximately $0.54 billion – $0.85 billion.
($ in millions) Perpetuity Growth Rate
0.0% 1.0% 2.0%
10.5% $688 $762 $853
11.5% 606 665 737 Discount
Rate
12.5% 538 586 644

Confidential
27
25069531.doc
Valuation Report on CareFirst, Inc.
DISCOUNTED CASH FLOW ANALYSIS INCLUDING TRANSACTION SYNERGIES / ADJUSTMENTS
Based on the DCF analyses and including 50% of transaction synergies / adjustments, CareFirst’s value is $1.52 billion – $1.95 billion.
($ in billions)
Stand-Alone DCF Range $1.25 – $1.53
Value of 50% of Transaction Synergies / Adjustments DCF Range(1) $0.27 – $0.43
DCF Value Including 50% of Transaction Synergies and Costs $1.52 – $1.95
(1) Based on a value for 100% of the synergies of $0.54 billion – $0.85 billion.

Confidential
28
25069531.doc
Valuation Report on CareFirst, Inc.
MERGER CONSEQUENCES SENSITIVITY(1)
A 100% cash acquisition of CareFirst would likely be significantly accretive to WellPoint’s EPS at substantial premiums to the current purchase price and assuming low levels of synergy. However, given WellPoint’s target debt / capitalization ratio of approximately 30%, it would likely need to issue a significant amount of equity, thus rendering a transaction less accretive. The chart below sensitizes the accretion / dilution to WellPoint assuming various purchase prices and EBIT contribution levels (including estimated synergies) and assuming both an all cash transaction and an all cash transaction with a subsequent equity offering.
($ in millions)
2004 Accretion / (Dilution)
Equity Purchase Price (100% Cash) 2005 Accretion / (Dilution)
Equity Purchase Price (100% Cash) $1,370 $1,450 $1,550 $1,650 $1,750 $1,370 $1,450 $1,550 $1,650 $1,750
$130 2.2% 1.9% 1.4% 1.0% 0.6% $180 4.8% 4.5% 4.1% 3.8% 3.4% EBIT 150 3.6 3.2 2.8 2.4 1.9 200 6.0 5.7 5.3 5.0 4.6
Contribution (2) 170 5.0 4.6 4.2 3.7 3.3 220 7.2 6.9 6.5 6.1 5.8 190 6.3 6.0 5.5 5.1 4.7 240 8.4 8.1 7.7 7.3 7.0
Debt / Cap. (3) 40.5% 41.3% 42.2% 43.0% 43.9% 40.5% 41.3% 42.2% 43.0% 43.9% Target Debt / Cap(4) 30.0 30.0 30.0 30.0 30.0 30.0 30.0 30.0 30.0 30.0 Equity Required (4) $661 $717 $787 $857 $927 $661 $717 $787 $857 $927
Equity Purchase Price (Cash / Stock) (5) Equity Purchase Price (Cash / Stock) (5) $1,370 $1,450 $1,550 $1,650 $1,750 $1,370 $1,450 $1,550 $1,650 $1,750
$130 (1.2%) (1.7%) (2.5%) (3.2%) (3.9%) $180 0.9% 0.4% (0.4%) (1.1%) (1.8%) EBIT 150 0.1 (0.5) (1.2) (1.9) (2.7) 200 2.1 1.5 0.7 (0.0) (0.7)
Contribution (2) 170 1.4 0.8 0.1 (0.7) (1.4) 220 3.2 2.6 1.8 1.1 0.4 190 2.7 2.1 1.3 0.6 (0.1) 240 4.3 3.7 2.9 2.2 1.5
(1) Assumes a 6.38% pre-tax cost of debt for WellPoint. Based on I/B/E/S EPS estimates for WellPoint of $5.88 in 2004 and 15% growth in 2005 (EPS of $6.76), and 153.7 million shares
outstanding. (2) CareFirst is forecasting $161.1 million and $185.1 million in stand-alone EBIT for 2004 and 2005, respectively. EBIT synergies (excluding one-time transaction costs and integration
expenses) are estimated to be approximately $0.0 million in 2004 and $26.5 million in 2005. This would imply a total EBIT contribution of $161.1 million in 2004 and $211.6 million in 2005.
(3) Based on balance sheet as of 9/30/2002. For analytical purposes, we have assumed a transaction closing date of 12/31/2003. At 12/31/2003, WellPoint may have less debt on its balance sheet due to its positive free cash flow.
(4) WellPoint has committed to rating agencies that it would maintain an approximate debt-to-capitalization ratio of 30%. Equity required represents the size of an equity offering required to maintain such a ratio.
(5) Assumes WellPoint stock price of $67.85 as of 2/5/2003.