Embed Size (px)
Citation preview
Department of the Environment
Maryland State Capital Funding Programs Point Source Nutrient Reduction
Chesapeake Bay Restoration
Jag Khuman, Director
Maryland Water Quality Financing Administration (MWQFA)
Environmental Management of Enclosed Coastal Seas
(EMECS-9) Conference
August 29, 2011
Presentation Overview
Nutrient (Nitrogen & Phosphorus)
Reduction From Wastewater Treatment
Plants (WWTP) discharging to Surface
Waters (Point Sources) in the Chesapeake
Bay Watershed
1. Bay Restoration Fund (WWTP & Septic)
2. Water Quality Revolving Loan Fund
Maryland Capital Funding Programs for Point Source Nutrient Reduction Administered by MDE
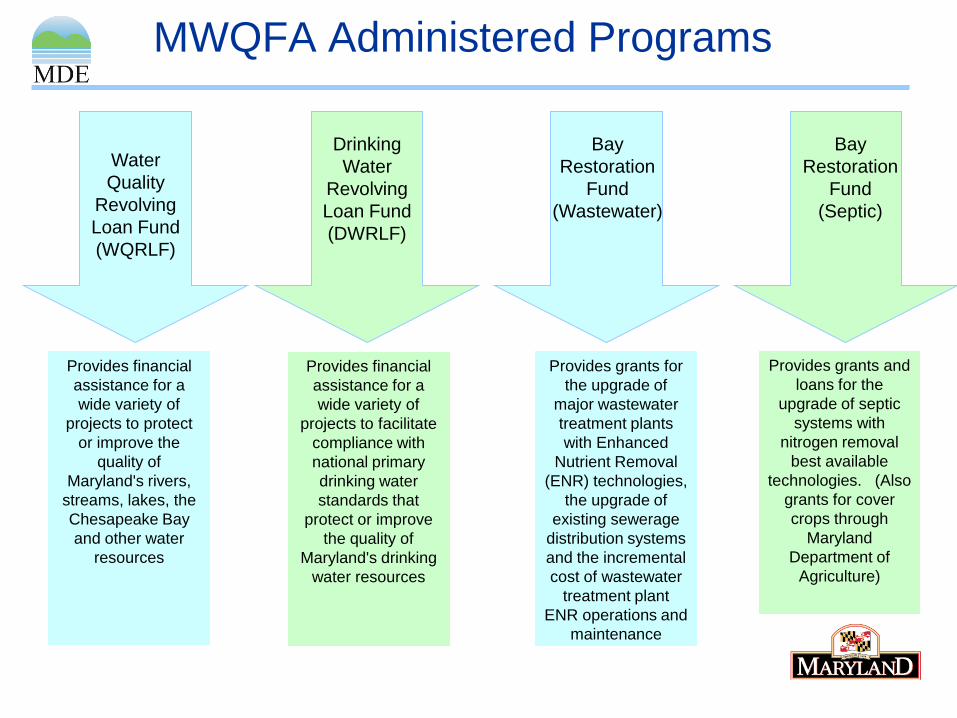
MWQFA Administered Programs
Water
Quality
Revolving
Loan Fund
(WQRLF)
Drinking
Water
Revolving
Loan Fund
(DWRLF)
Bay
Restoration
Fund
(Wastewater)
Provides financial
assistance for a
wide variety of
projects to protect
or improve the
quality of
Maryland's rivers,
streams, lakes, the
Chesapeake Bay
and other water
resources
Provides financial
assistance for a
wide variety of
projects to facilitate
compliance with
national primary
drinking water
standards that
protect or improve
the quality of
Maryland's drinking
water resources
Provides grants for
the upgrade of
major wastewater
treatment plants
with Enhanced
Nutrient Removal
(ENR) technologies,
the upgrade of
existing sewerage
distribution systems
and the incremental
cost of wastewater
treatment plant
ENR operations and
maintenance
Provides grants and
loans for the
upgrade of septic
systems with
nitrogen removal
best available
technologies. (Also
grants for cover
crops through
Maryland
Department of
Agriculture)
Bay
Restoration
Fund
(Septic)
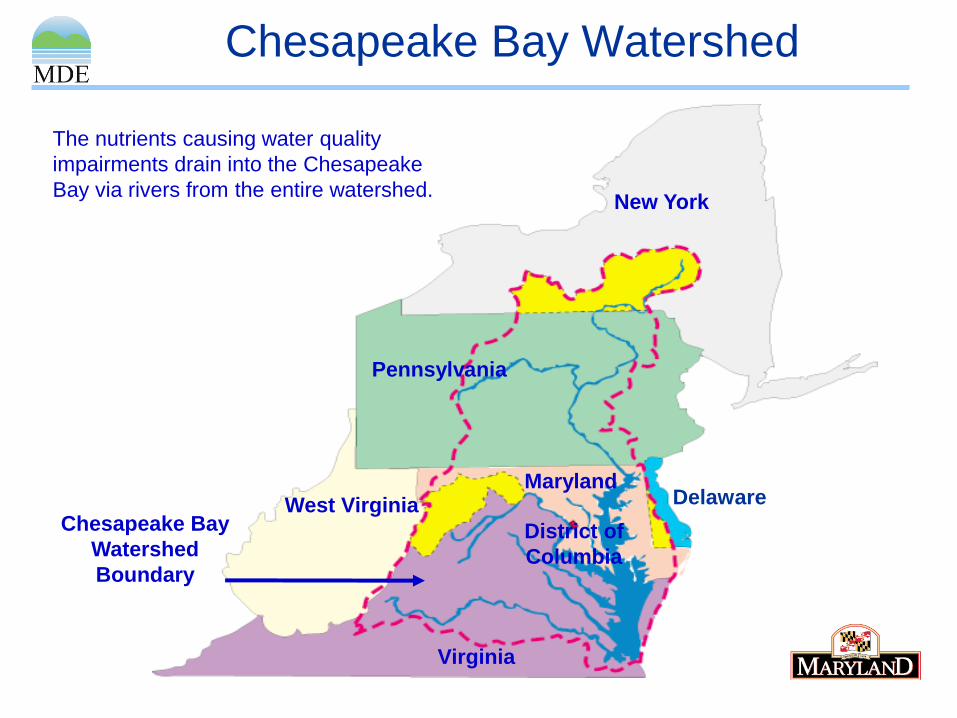
The nutrients causing water quality
impairments drain into the Chesapeake
Bay via rivers from the entire watershed.
MarylandDelaware
New York
District of
Columbia
Virginia
West Virginia
Pennsylvania
Chesapeake Bay Watershed
Chesapeake Bay
Watershed
Boundary
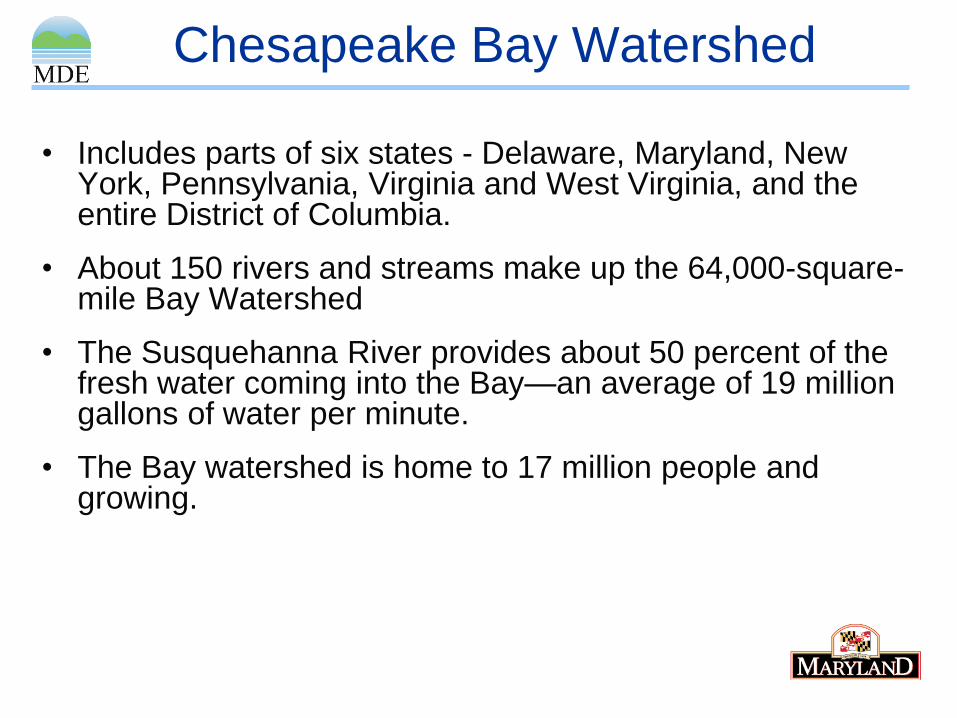
• Includes parts of six states - Delaware, Maryland, New York, Pennsylvania, Virginia and West Virginia, and the entire District of Columbia.
• About 150 rivers and streams make up the 64,000-square-mile Bay Watershed
• The Susquehanna River provides about 50 percent of the fresh water coming into the Bay—an average of 19 million gallons of water per minute.
• The Bay watershed is home to 17 million people and growing.
Chesapeake Bay Watershed
Sources of Nutrients to the Chesapeake Bay are:
• Fertilizer from farms, lawns, golf courses etc.
• Sewage treatment plants, industrial wastewater
facilities, septic systems and animal manure
• Stormwater runoff
• Air pollution from vehicles, coal burning power
plants and industries
Sources of Nutrients
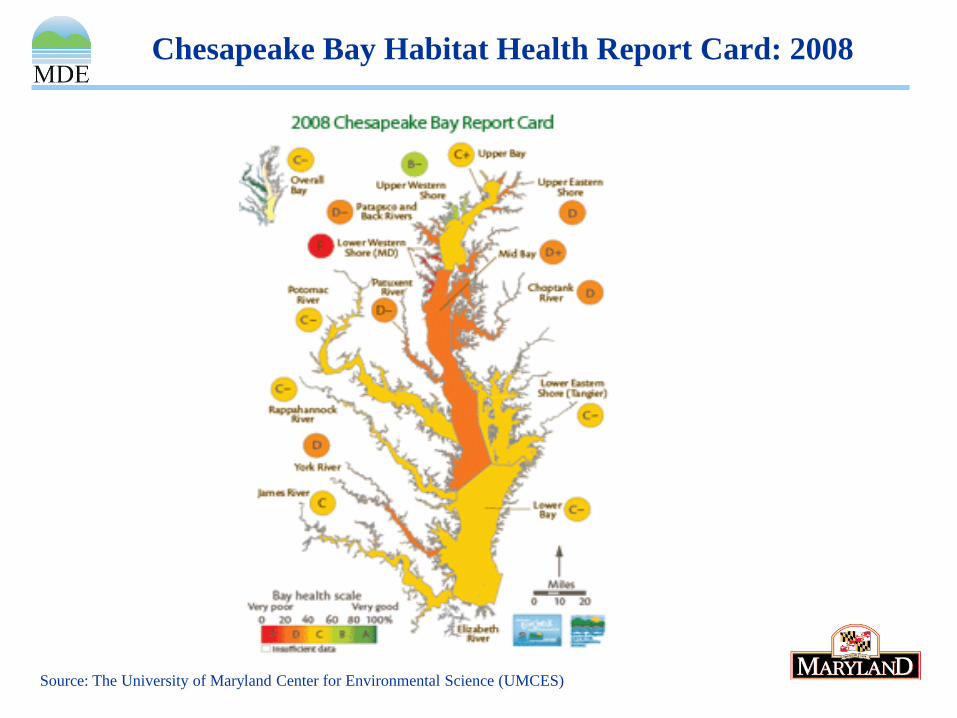
Chesapeake Bay Habitat Health Report Card: 2008
Source: The University of Maryland Center for Environmental Science (UMCES)
TMDL: Total Maximum Daily Loading
• US EPA is enforcing the Federal Clean
Water Act by establishing Bay-wide
TMDLs.
• River and stream segments to have max.
pollution loading limits.
EPA – Bay TMDL
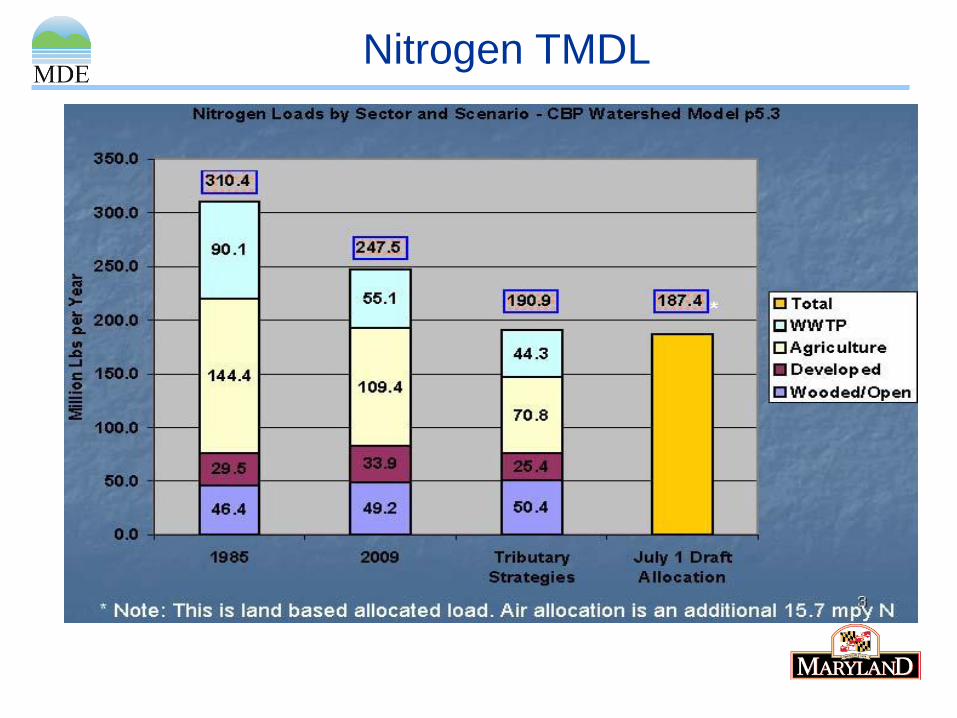
Nitrogen TMDL
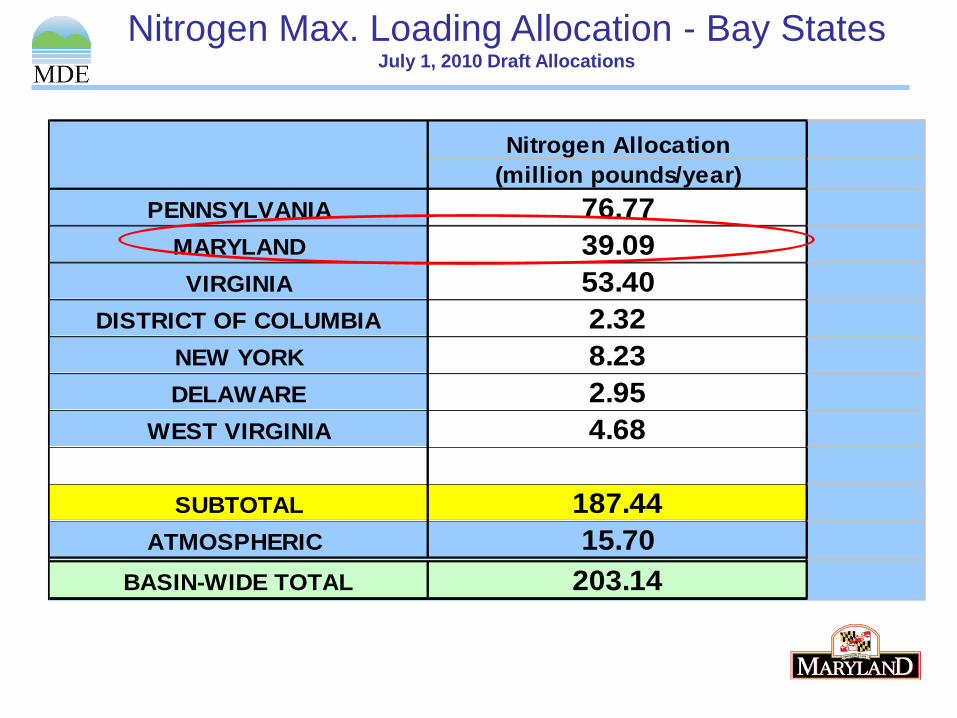
Nitrogen Max. Loading Allocation - Bay StatesJuly 1, 2010 Draft Allocations
Nitrogen Allocation
(million pounds/year)
PENNSYLVANIA 76.77
MARYLAND 39.09
VIRGINIA 53.40
DISTRICT OF COLUMBIA 2.32
NEW YORK 8.23
DELAWARE 2.95
WEST VIRGINIA 4.68
SUBTOTAL 187.44
ATMOSPHERIC 15.70
BASIN-WIDE TOTAL 203.14
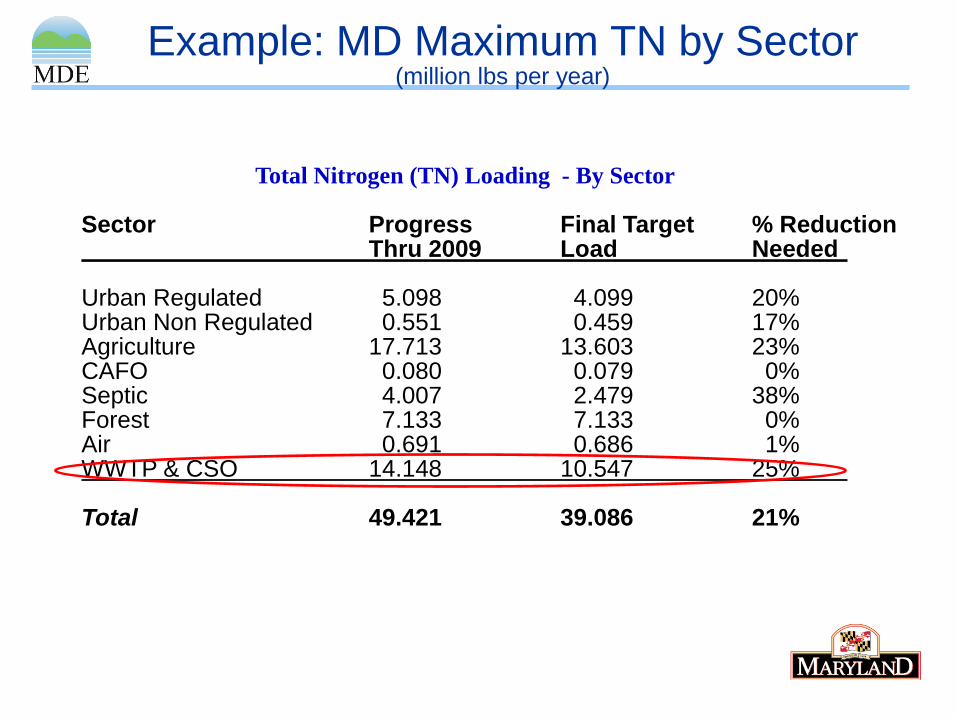
Example: MD Maximum TN by Sector(million lbs per year)
Total Nitrogen (TN) Loading - By Sector
Sector Progress Final Target % Reduction Thru 2009 Load Needed
Urban Regulated 5.098 4.099 20% Urban Non Regulated 0.551 0.459 17% Agriculture 17.713 13.603 23% CAFO 0.080 0.079 0% Septic 4.007 2.479 38% Forest 7.133 7.133 0% Air 0.691 0.686 1% WWTP & CSO 14.148 10.547 25%
Total 49.421 39.086 21%
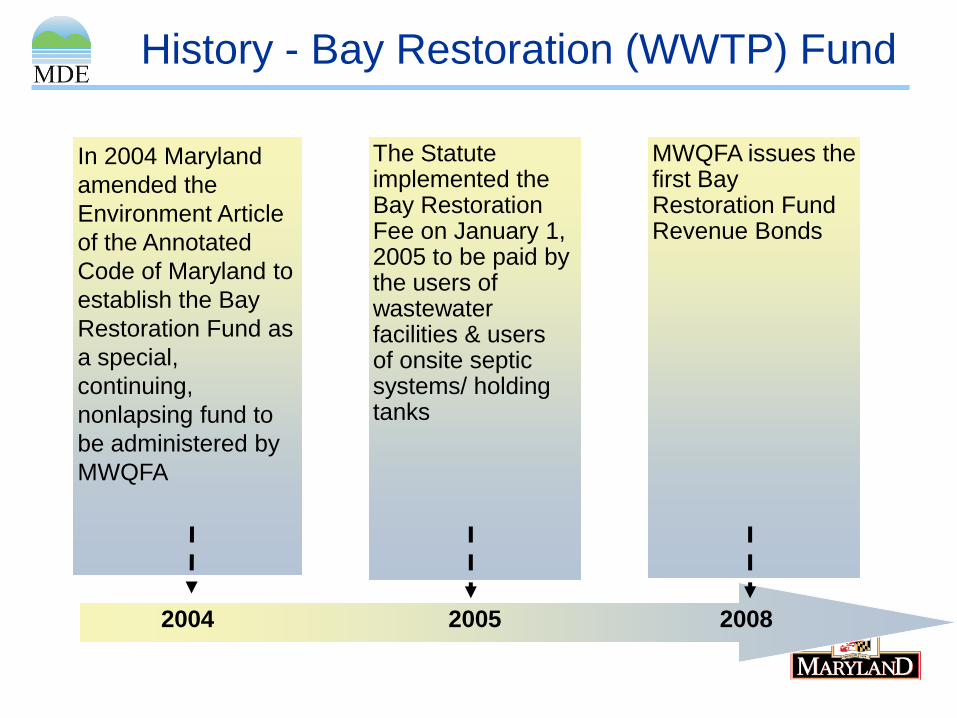
History - Bay Restoration (WWTP) Fund
2004 2005
In 2004 Maryland
amended the
Environment Article
of the Annotated
Code of Maryland to
establish the Bay
Restoration Fund as
a special,
continuing,
nonlapsing fund to
be administered by
MWQFA
The Statute implemented the Bay Restoration Fee on January 1, 2005 to be paid by the users of wastewater facilities & users of onsite septic systems/ holding tanks
MWQFA issues the first Bay Restoration Fund Revenue Bonds
2008
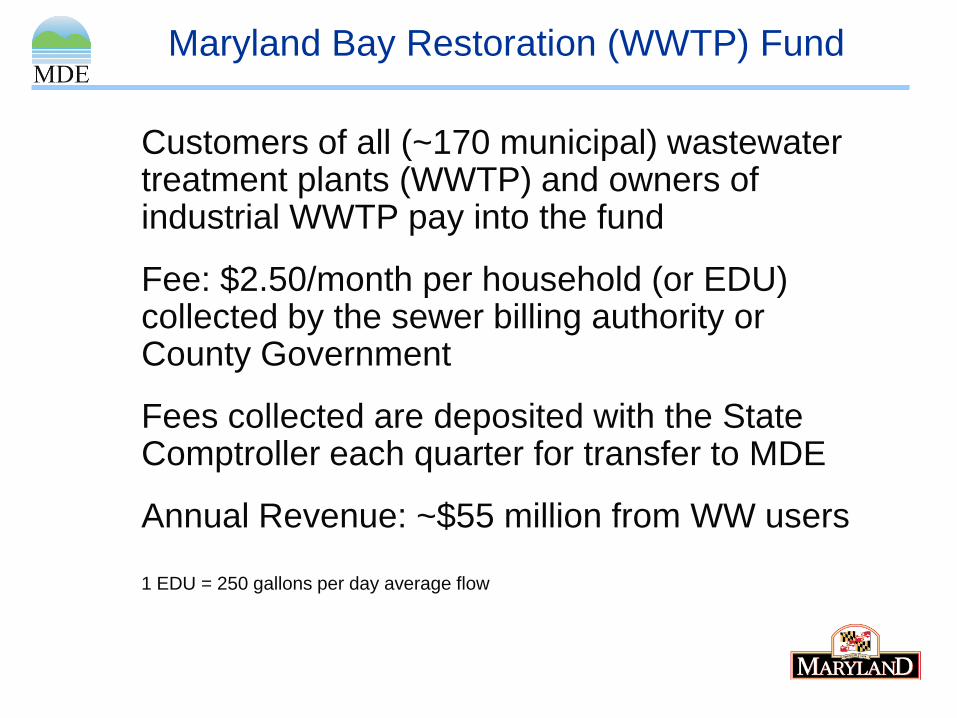
Customers of all (~170 municipal) wastewater treatment plants (WWTP) and owners of industrial WWTP pay into the fund
Fee: $2.50/month per household (or EDU) collected by the sewer billing authority or County Government
Fees collected are deposited with the State Comptroller each quarter for transfer to MDE
Annual Revenue: ~$55 million from WW users
1 EDU = 250 gallons per day average flow
Maryland Bay Restoration (WWTP) Fund
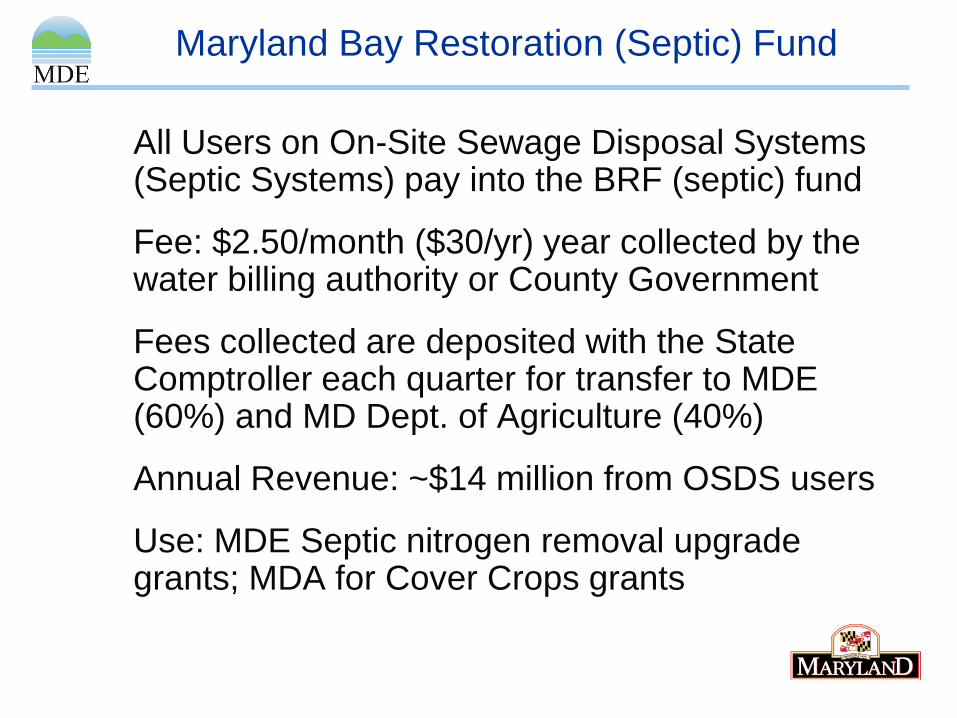
All Users on On-Site Sewage Disposal Systems (Septic Systems) pay into the BRF (septic) fund
Fee: $2.50/month ($30/yr) year collected by the water billing authority or County Government
Fees collected are deposited with the State Comptroller each quarter for transfer to MDE (60%) and MD Dept. of Agriculture (40%)
Annual Revenue: ~$14 million from OSDS users
Use: MDE Septic nitrogen removal upgrade grants; MDA for Cover Crops grants
Maryland Bay Restoration (Septic) Fund
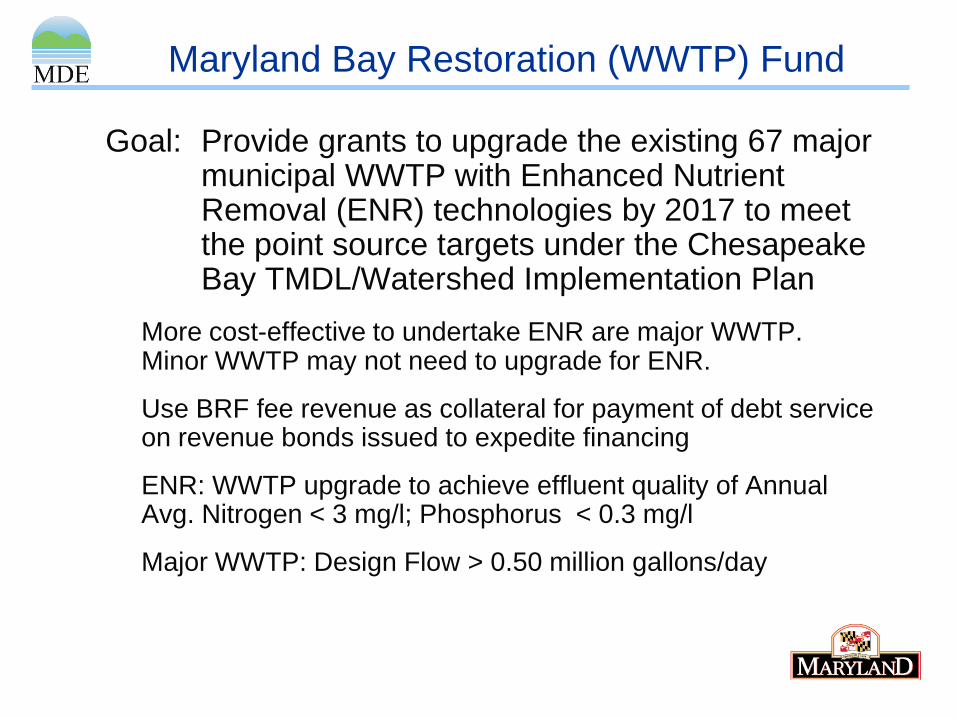
Goal: Provide grants to upgrade the existing 67 major municipal WWTP with Enhanced Nutrient Removal (ENR) technologies by 2017 to meet the point source targets under the Chesapeake Bay TMDL/Watershed Implementation Plan
More cost-effective to undertake ENR are major WWTP. Minor WWTP may not need to upgrade for ENR.
Use BRF fee revenue as collateral for payment of debt service on revenue bonds issued to expedite financing
ENR: WWTP upgrade to achieve effluent quality of Annual Avg. Nitrogen < 3 mg/l; Phosphorus < 0.3 mg/l
Major WWTP: Design Flow > 0.50 million gallons/day
Maryland Bay Restoration (WWTP) Fund
Maryland Major Wastewater Facilities
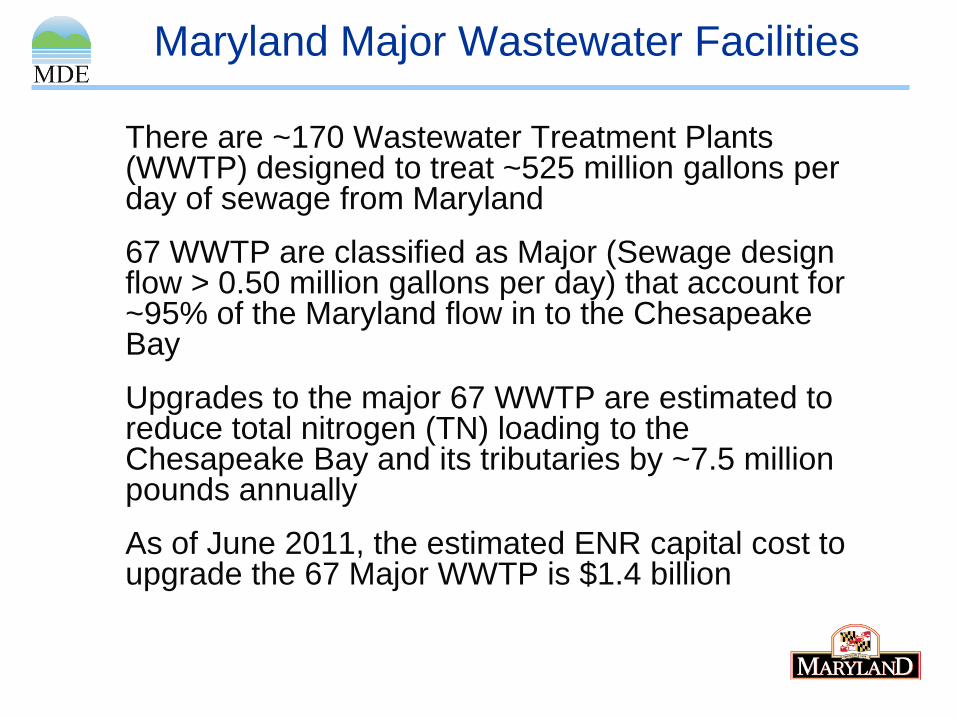
There are ~170 Wastewater Treatment Plants (WWTP) designed to treat ~525 million gallons per day of sewage from Maryland
67 WWTP are classified as Major (Sewage design flow > 0.50 million gallons per day) that account for ~95% of the Maryland flow in to the Chesapeake Bay
Upgrades to the major 67 WWTP are estimated to reduce total nitrogen (TN) loading to the Chesapeake Bay and its tributaries by ~7.5 million pounds annually
As of June 2011, the estimated ENR capital cost to upgrade the 67 Major WWTP is $1.4 billion
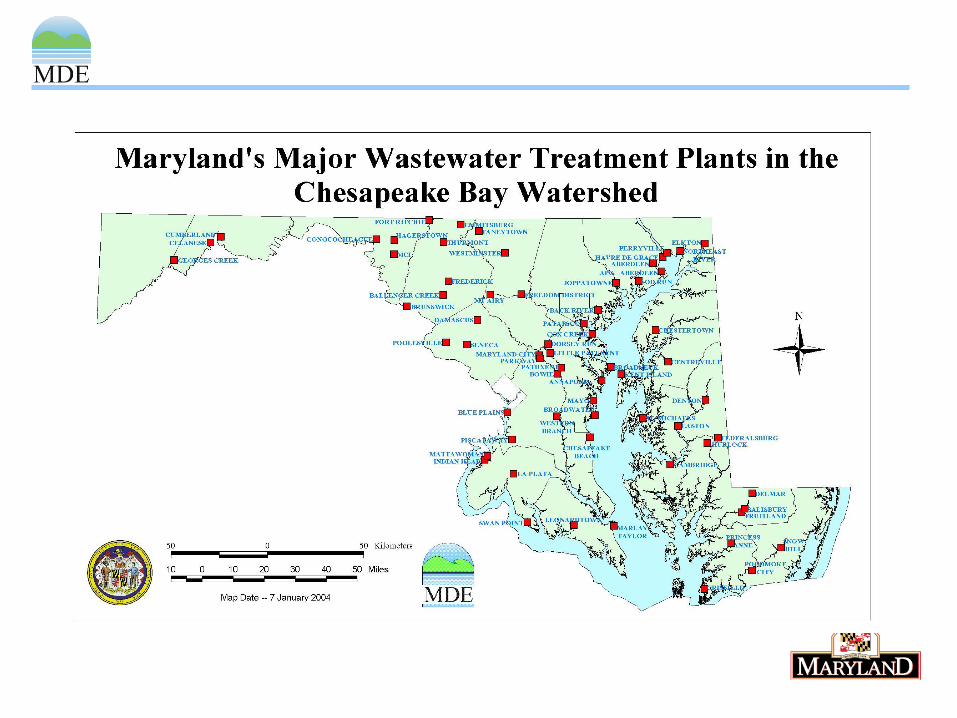
Maryland Communities Served
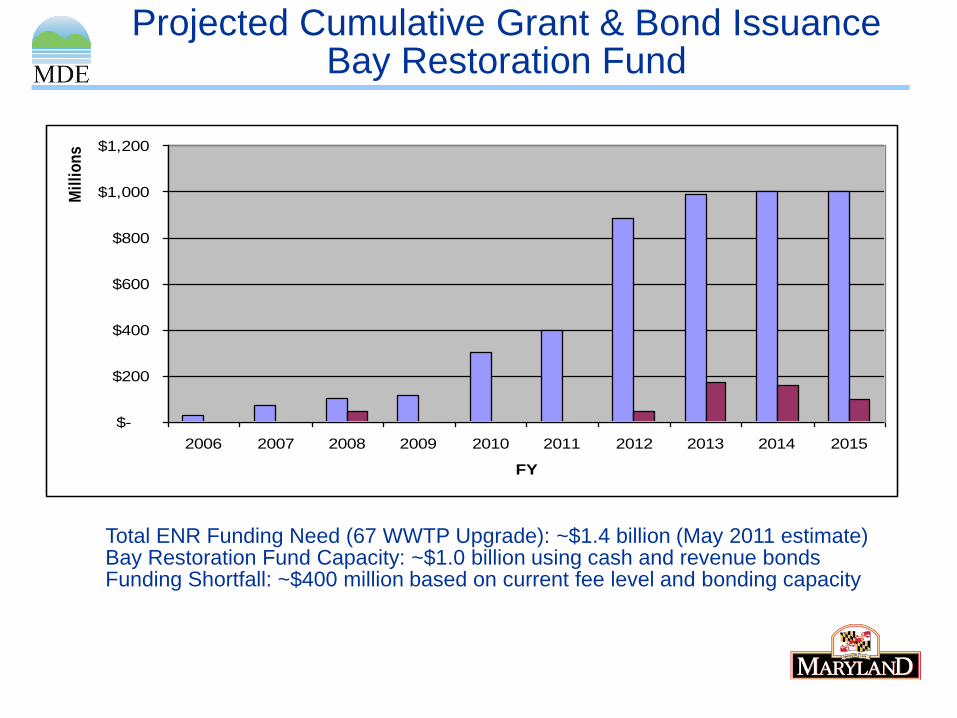
Projected Cumulative Grant & Bond IssuanceBay Restoration Fund
Total ENR Funding Need (67 WWTP Upgrade): ~$1.4 billion (May 2011 estimate) Bay Restoration Fund Capacity: ~$1.0 billion using cash and revenue bondsFunding Shortfall: ~$400 million based on current fee level and bonding capacity
$-
$200
$400
$600
$800
$1,000
$1,200
2006 2007 2008 2009 2010 2011 2012 2013 2014 2015
Mil
lio
ns
FY
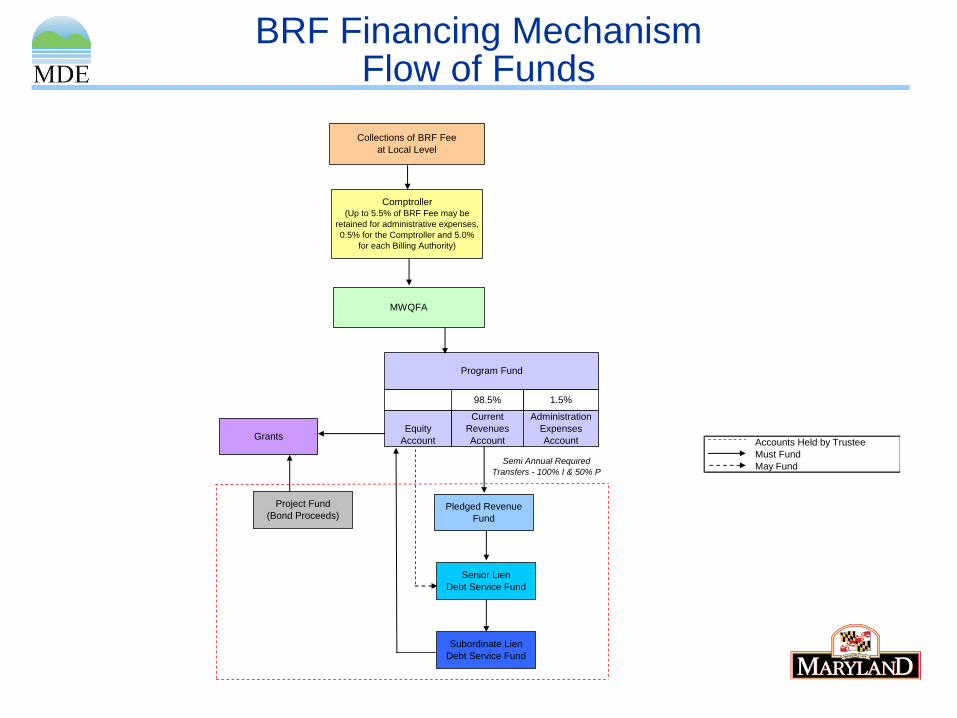
BRF Financing MechanismFlow of Funds
Accounts Held by Trustee
Must Fund
May Fund
Program Fund
Senior Lien
Debt Service Fund
Subordinate Lien
Debt Service Fund
Comptroller(Up to 5.5% of BRF Fee may be
retained for administrative expenses,
0.5% for the Comptroller and 5.0%
for each Billing Authority)
Semi Annual Required
Transfers - 100% I & 50% P
Collections of BRF Fee
at Local Level
MWQFA
1.5%98.5%
Equity
Account
Current
Revenues
AccountGrants
Project Fund
(Bond Proceeds)
Administration
Expenses
Account
Pledged Revenue
Fund
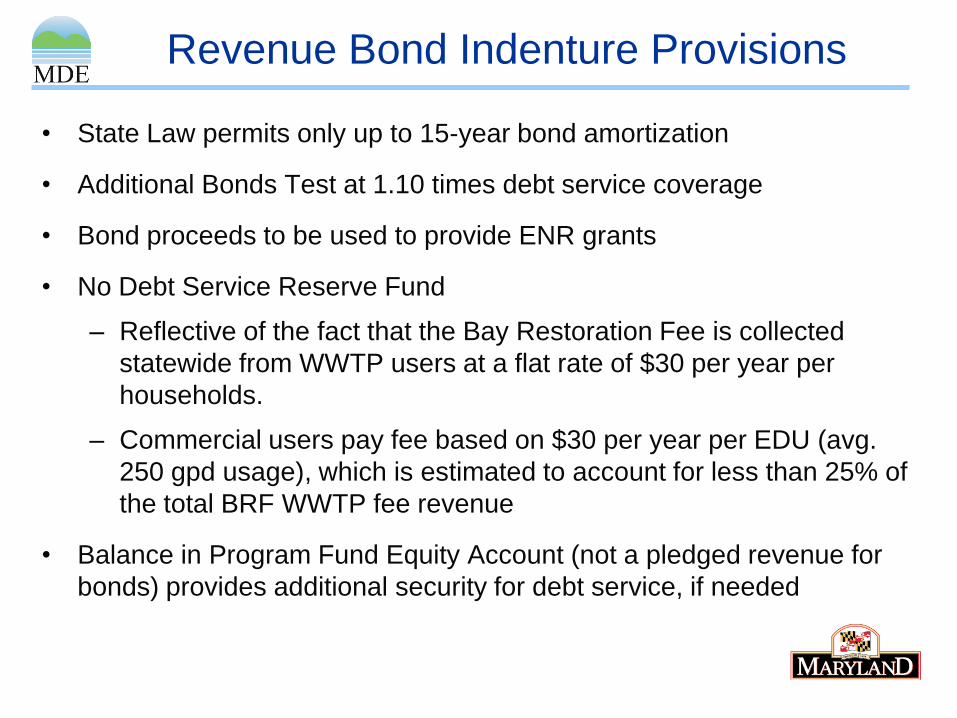
Revenue Bond Indenture Provisions
• State Law permits only up to 15-year bond amortization
• Additional Bonds Test at 1.10 times debt service coverage
• Bond proceeds to be used to provide ENR grants
• No Debt Service Reserve Fund
– Reflective of the fact that the Bay Restoration Fee is collected
statewide from WWTP users at a flat rate of $30 per year per
households.
– Commercial users pay fee based on $30 per year per EDU (avg.
250 gpd usage), which is estimated to account for less than 25% of
the total BRF WWTP fee revenue
• Balance in Program Fund Equity Account (not a pledged revenue for
bonds) provides additional security for debt service, if needed
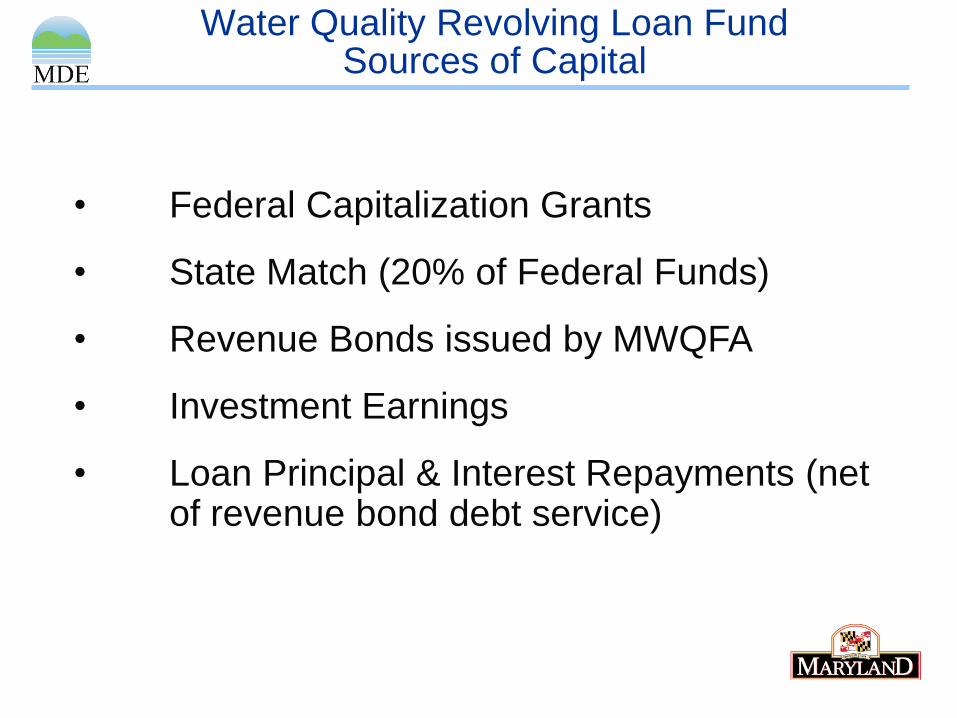
Water Quality Revolving Loan FundSources of Capital
• Federal Capitalization Grants
• State Match (20% of Federal Funds)
• Revenue Bonds issued by MWQFA
• Investment Earnings
• Loan Principal & Interest Repayments (net of revenue bond debt service)
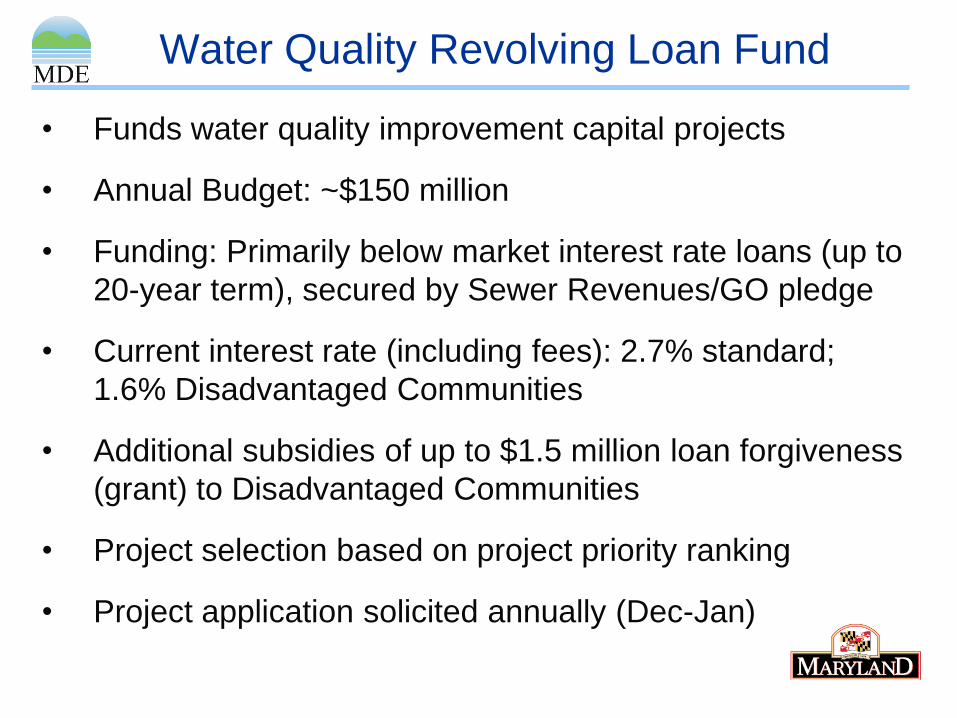
• Funds water quality improvement capital projects
• Annual Budget: ~$150 million
• Funding: Primarily below market interest rate loans (up to
20-year term), secured by Sewer Revenues/GO pledge
• Current interest rate (including fees): 2.7% standard;
1.6% Disadvantaged Communities
• Additional subsidies of up to $1.5 million loan forgiveness
(grant) to Disadvantaged Communities
• Project selection based on project priority ranking
• Project application solicited annually (Dec-Jan)
Water Quality Revolving Loan Fund
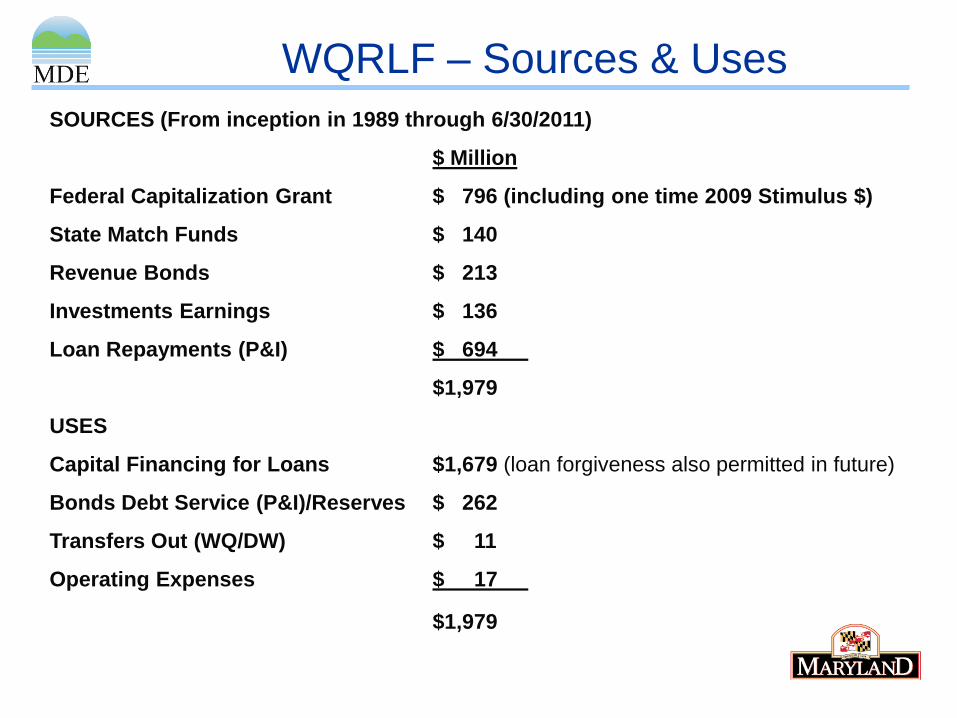
WQRLF – Sources & Uses
SOURCES (From inception in 1989 through 6/30/2011)
$ Million
Federal Capitalization Grant $ 796 (including one time 2009 Stimulus $)
State Match Funds $ 140
Revenue Bonds $ 213
Investments Earnings $ 136
Loan Repayments (P&I) $ 694
$1,979
USES
Capital Financing for Loans $1,679 (loan forgiveness also permitted in future)
Bonds Debt Service (P&I)/Reserves $ 262
Transfers Out (WQ/DW) $ 11
Operating Expenses $ 17
$1,979
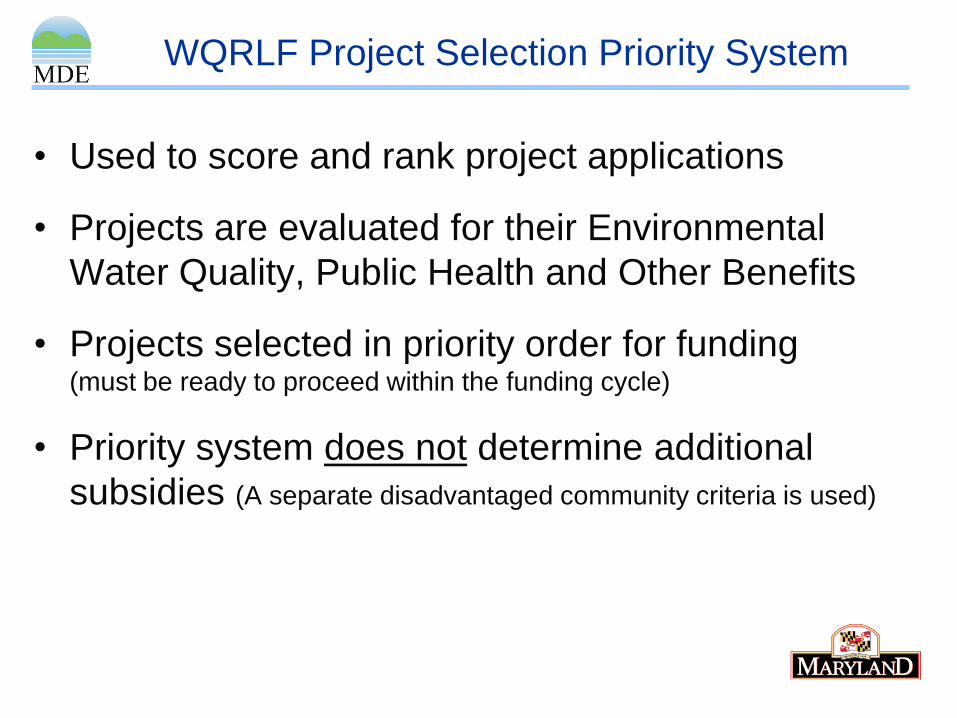
WQRLF Project Selection Priority System
• Used to score and rank project applications
• Projects are evaluated for their Environmental
Water Quality, Public Health and Other Benefits
• Projects selected in priority order for funding (must be ready to proceed within the funding cycle)
• Priority system does not determine additional
subsidies (A separate disadvantaged community criteria is used)
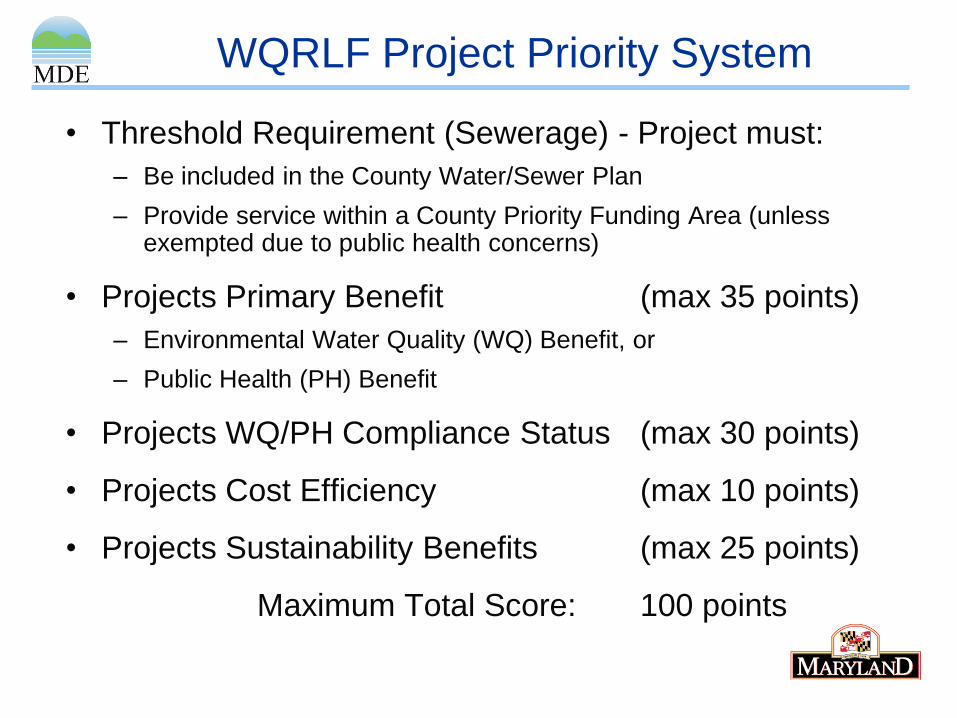
• Threshold Requirement (Sewerage) - Project must:
– Be included in the County Water/Sewer Plan
– Provide service within a County Priority Funding Area (unless exempted due to public health concerns)
• Projects Primary Benefit (max 35 points)
– Environmental Water Quality (WQ) Benefit, or
– Public Health (PH) Benefit
• Projects WQ/PH Compliance Status (max 30 points)
• Projects Cost Efficiency (max 10 points)
• Projects Sustainability Benefits (max 25 points)
Maximum Total Score: 100 points
WQRLF Project Priority System
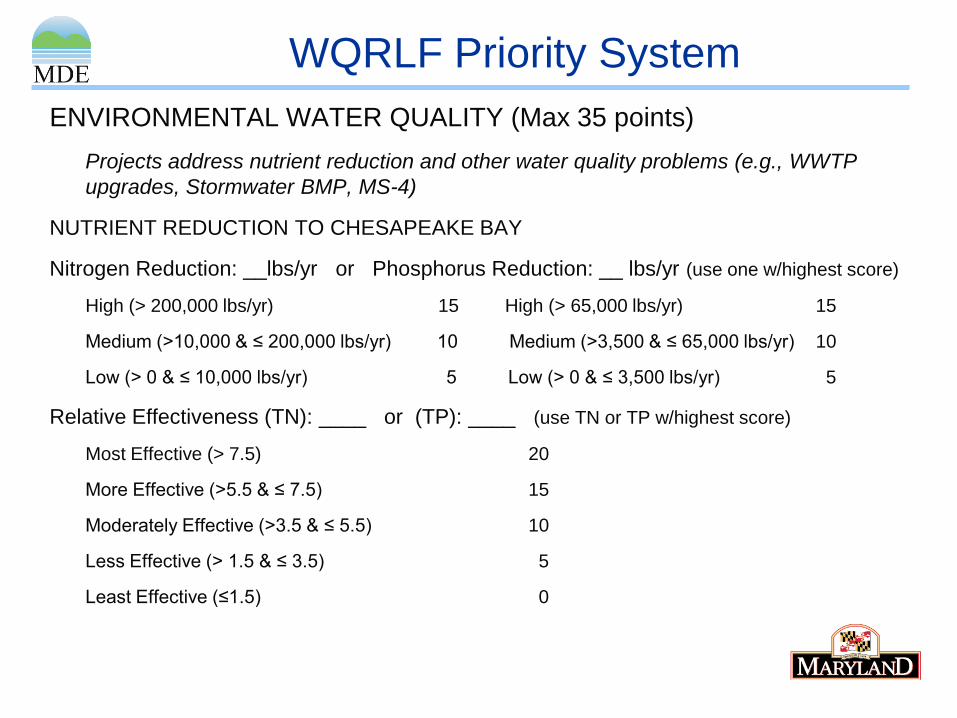
ENVIRONMENTAL WATER QUALITY (Max 35 points)
Projects address nutrient reduction and other water quality problems (e.g., WWTP
upgrades, Stormwater BMP, MS-4)
NUTRIENT REDUCTION TO CHESAPEAKE BAY
Nitrogen Reduction: __lbs/yr or Phosphorus Reduction: __ lbs/yr (use one w/highest score)
High (> 200,000 lbs/yr) 15 High (> 65,000 lbs/yr) 15
Medium (>10,000 & ≤ 200,000 lbs/yr) 10 Medium (>3,500 & ≤ 65,000 lbs/yr) 10
Low (> 0 & ≤ 10,000 lbs/yr) 5 Low (> 0 & ≤ 3,500 lbs/yr) 5
Relative Effectiveness (TN): ____ or (TP): ____ (use TN or TP w/highest score)
Most Effective (> 7.5) 20
More Effective (>5.5 & ≤ 7.5) 15
Moderately Effective (>3.5 & ≤ 5.5) 10
Less Effective (> 1.5 & ≤ 3.5) 5
Least Effective (≤1.5) 0
WQRLF Priority System
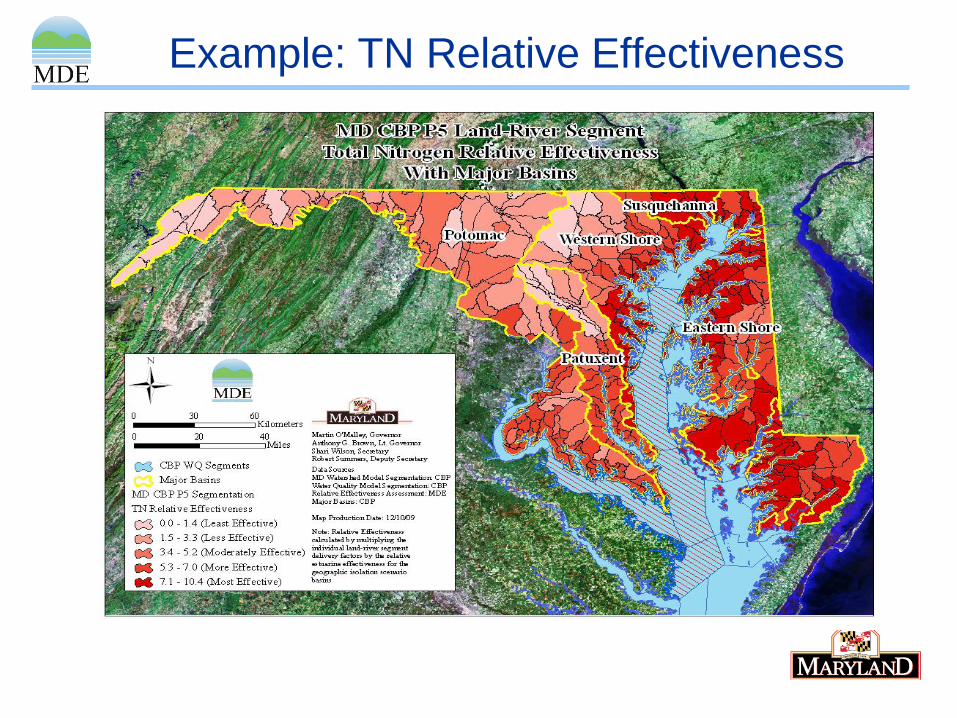
Example: TN Relative Effectiveness
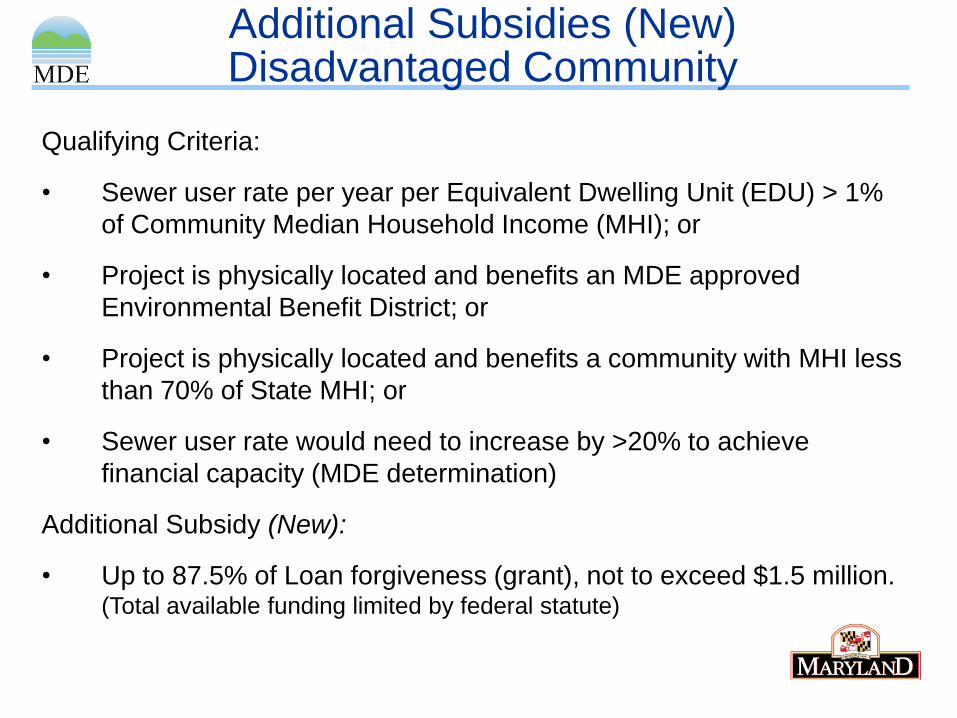
Additional Subsidies (New)Disadvantaged Community
Qualifying Criteria:
• Sewer user rate per year per Equivalent Dwelling Unit (EDU) > 1%
of Community Median Household Income (MHI); or
• Project is physically located and benefits an MDE approved
Environmental Benefit District; or
• Project is physically located and benefits a community with MHI less
than 70% of State MHI; or
• Sewer user rate would need to increase by >20% to achieve
financial capacity (MDE determination)
Additional Subsidy (New):
• Up to 87.5% of Loan forgiveness (grant), not to exceed $1.5 million. (Total available funding limited by federal statute)
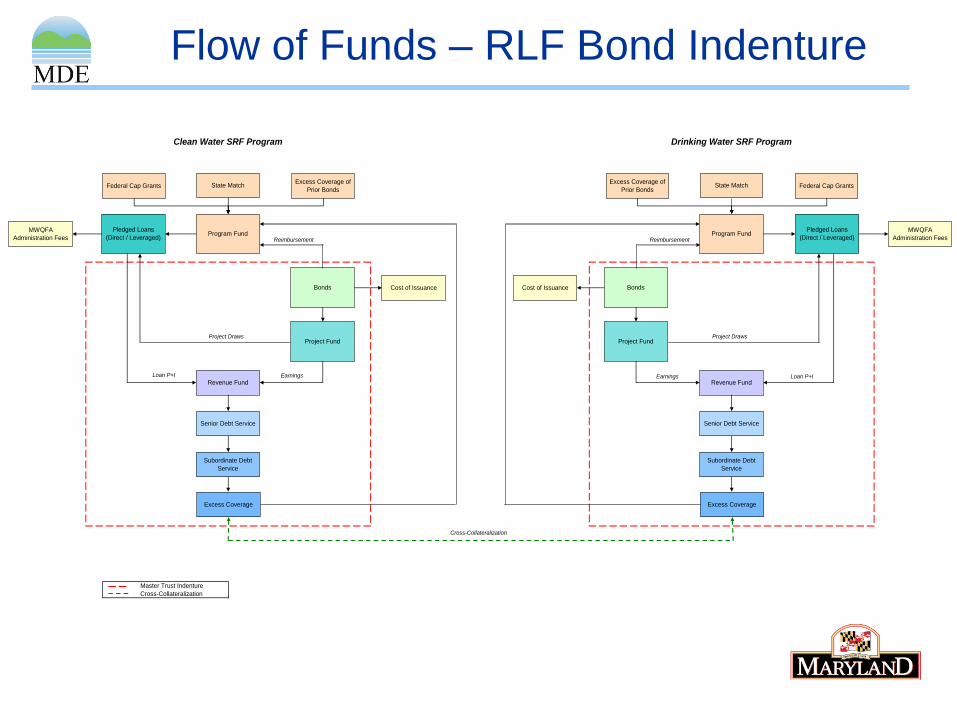
Flow of Funds – RLF Bond Indenture
Clean Water SRF Program Drinking Water SRF Program
Master Trust Indenture
Cross-Collateralization
Revenue Fund
Senior Debt Service
Subordinate Debt
Service
Excess Coverage
Pledged Loans
(Direct / Leveraged)
Loan P+I
Program Fund
Bonds Cost of Issuance
Project Fund
Earnings
State MatchFederal Cap GrantsExcess Coverage of
Prior Bonds
Reimbursement
MWQFA
Administration Fees
Project Draws
Revenue Fund
Senior Debt Service
Subordinate Debt
Service
Excess Coverage
Pledged Loans
(Direct / Leveraged)Program Fund
BondsCost of Issuance
Project Fund
Earnings
State MatchExcess Coverage of
Prior BondsFederal Cap Grants
MWQFA
Administration Fees
Project Draws
Loan P+I
Reimbursement
Cross-Collateralization
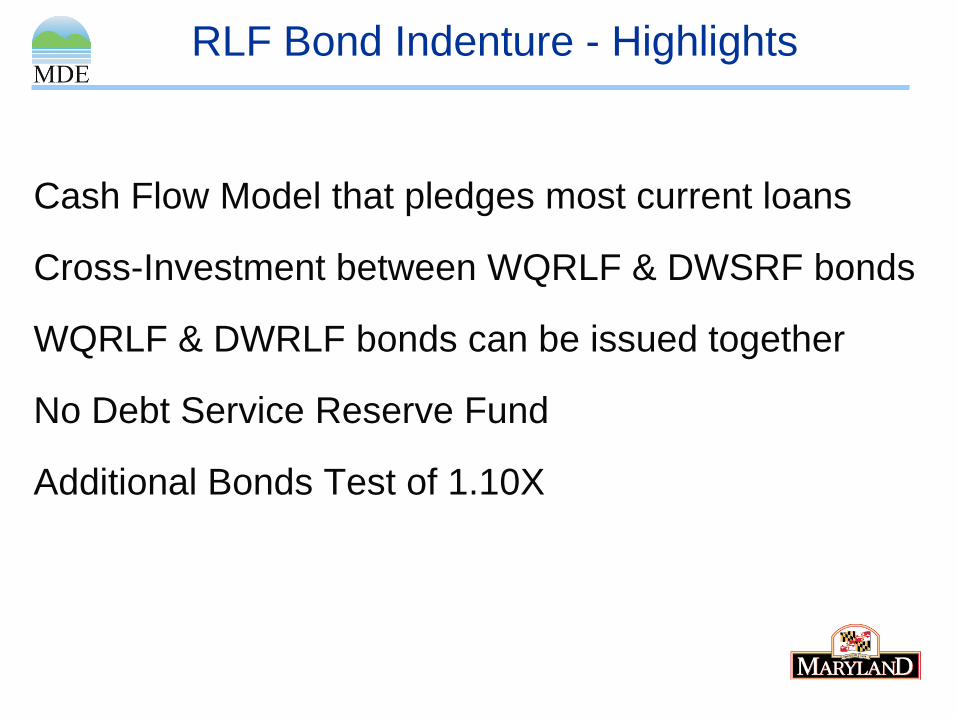
RLF Bond Indenture - Highlights
Cash Flow Model that pledges most current loans
Cross-Investment between WQRLF & DWSRF bonds
WQRLF & DWRLF bonds can be issued together
No Debt Service Reserve Fund
Additional Bonds Test of 1.10X
1800 Washington Boulevard | Baltimore, MD 21230-1718410-537-3000 | TTY Users: 1-800-735-2258
www.mde.state.md.us
Maryland Department of the Environment
Maryland Water Quality Financing Administration1800 Washington Boulevard
Baltimore, MD 21230410-537-3119
www.mde.state.md.us/wqfa