Embed Size (px)
Citation preview

Masibambane Water Services Sector Coordinating Committee Meeting
22 February 2007
STRATEGIC OVERVIEW OF WATER SECTOR PROGRESS FOR THE 3rd
QUARTER 2006/2007 AND KEY ISSUES FOR THE 4th QUARTER
Kalinga Pelpola
Masibambane Programme Manager

• Sector Highlights
• President’s State of the Nation Address – 9 Feb 07
• National Budget Speech 2007/8 – 21 Feb 07
• Challenges for the Sector
• Key findings for the 3rd Quarter 2006/07
• Financial Summary – 3rd Quarter and YTD
• Key issues for 4th Quarter 2006/07
• Conclusion
INDEX

Another award…The VUNA Award for Local Government Support was awarded to DWAF by the Minister DPLG. This achievement highlights the
successful collaboration between DWAF, DPLG and SALGA.
HIGHLIGHTS
15 December 2006

• Cabinet Lekgotla – January 2007, and key issues affecting WS;
• Sector Collaboration with Business Partners for Development;
• SA and Netherlands signed “Partner for Water” Agreement on 5 December 2006;
• Swiss/SA annual consultation held on Sunday 18 Feb 07 in Cape town;
• Completion of Provincial Water Sector Plans; and
• Progress towards finalisation of National WS Programme III 2007/8- 2012/12 = National WS Strategy + National WS Work plan
HIGHLIGHTS

• Address challenges of poverty, unemployment and marginalisation of communities;
• Accelerate economic growth and development (6% pa);
• Apply Batho Pele principles to improve effectiveness of social development programmes and institutional operational efficiency;
• Support local government sphere as per the Five Year Local Government Strategic Agenda;
• Speed up skills development and fill vacancies of senior management and professionals in municipalities;
• Align planning instruments across the spheres of government (i.e. National Spatial Development Perspective, Provincial Growth and Development Strategies and Integrated Development Plans);
PRESIDENT’S STATE OF THE NATION ADDRESS – 9 Feb 07

PRESIDENT’S STATE OF THE NATION ADDRESS – 9 Feb 07
Expand access to services such as water, electricity and
sanitation and ensure the objectives of the MDG’s and
government’s service delivery targets are achieved: – Bucket eradication in formal settlements – Dec 2007;– Eradication of water supply backlog – 2008;– Eradication of sanitation backlog – 2010;– Eradication of clinic water and sanitation backlog – 2007;
Integrate youth development into the mainstream of
government work; Increase the roll-out of the low cost housing programme
(and by implication water and sanitation services); Strengthen monitoring and evaluation capacity across all
spheres; and Accelerate implementation of NEPAD Programmes.

FINANCE Minister'sBudget Speech – 21 Feb 07
Human life has equal worth…
Motho Motho ke motho - ga ana bosehlana (a human being is a human
being, there is no lesser human being)
The idea, that human life has equal worth, and that this is the core value that
unites us, invites us to ask whether we have done enough to give practical
effect in SA today to our shared humanity. Have we acted in a manner that
shows that human life has equal worth?
Reconfirmation of service delivery targets & availability of additional
funding;
Funding mechanisms;
Sound management of public finance
Structural unemployment (mismatch of skills);
Capacity and skills development

DWAF CHALLENGES FROM PRESIDENT’S ADDRESS
• Challenges: - Lack of skills and public service capacity;
- Meeting the water and sanitation targets;
- Effective implementation of Local Government Support Programmes;
- Monitoring and information management;
- Poverty eradication through economic opportunities in the WS;
- Supporting delivery of MDGs in Africa/Nepad with special focus on emerging democracies e.g.; DRC,Liberia
• Issues to be addressed:- Promote effective sector collaboration;
- Improve leadership within DWAF management;
- Decentralisation and empowerment of DWAF Regional Offices;
- Engage Institutions of Higher Learning to fast track talent building
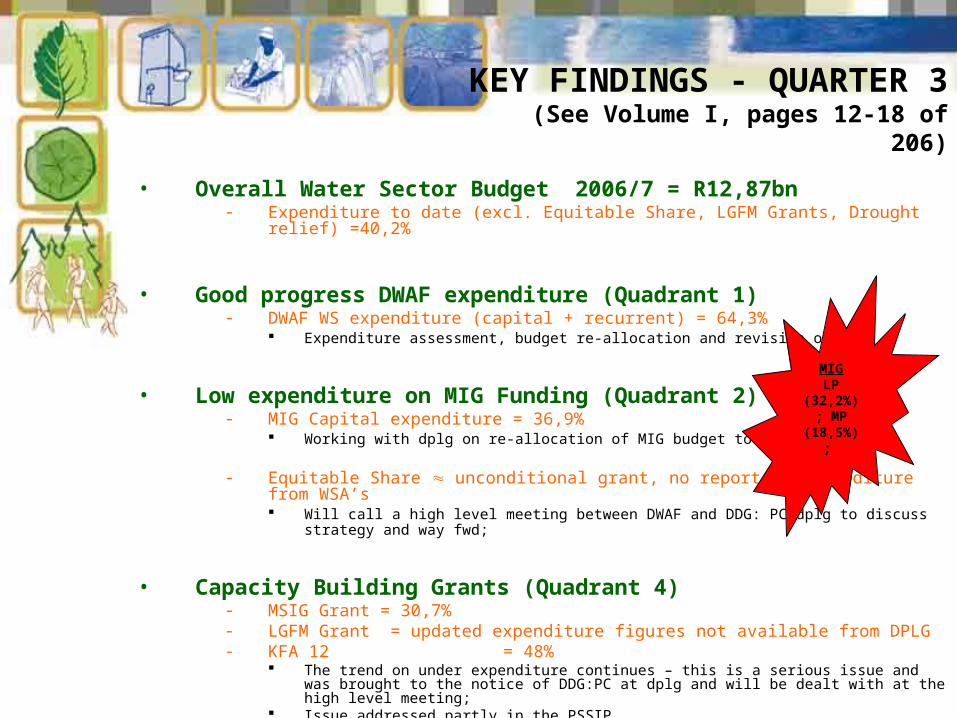
• Overall Water Sector Budget 2006/7 = R12,87bn - Expenditure to date (excl. Equitable Share, LGFM Grants, Drought relief)
=40,2%
• Good progress DWAF expenditure (Quadrant 1)- DWAF WS expenditure (capital + recurrent) = 64,3%
Expenditure assessment, budget re-allocation and revision of FD;
• Low expenditure on MIG Funding (Quadrant 2)- MIG Capital expenditure = 36,9%
Working with dplg on re-allocation of MIG budget to munics;
- Equitable Share unconditional grant, no report on expenditure from WSA’s Will call a high level meeting between DWAF and DDG: PC dplg to discuss strategy and
way fwd;
• Capacity Building Grants (Quadrant 4)- MSIG Grant = 30,7%- LGFM Grant = updated expenditure figures not available from DPLG- KFA 12 = 48%
The trend on under expenditure continues – this is a serious issue and was brought to the notice of DDG:PC at dplg and will be dealt with at the high level meeting;
Issue addressed partly in the PSSIP
MIGLP
(32,2%); MP
(18,5%);
KEY FINDINGS - QUARTER 3(See Volume I, pages 12-18 of 206)

*unverified MIG sanitation data (not yet confirmed by dplg) is provided by DWAF Sanitation unit
SERVICE DELIVERY PROGRESS - QUARTER 2
Water Sector Progress - Financial Year 2006/2007
Quarter 3 (October to December 2006) Activity Annual Sector
Target
YTD Sector1
DWAF DPLG3 DOE Health Housing
Access to Services
Household
Water
1,500,000
people
1,414,189 people 0 n/a - - n/a
Household
Sanitation
350,000
households
291,013
households
0 150,637 - - n/a
School Water 597 schools 324 schools - - n/a - -
School
Sanitation
2,211 schools 621 schools - - n/a - -
Clinic Water4 79 clinics 8 clinics - - - n/a -
Clinic
Sanitation4
155 clinics 11 clinics - - - n/a -
Bucket
Eradication
80,000
households
50,565
households
8,427 - - -
Health &
Hygiene
n/a n/a - - - -
FBW
provision
75% people 74,65% (of total population) served with FBW;
165 out of 170 WSA’s providing FBW
Chinese
development
aid (PTD2)
3,066km of uPVC pipes installed;
163,727 water meters installed
*

The total number of job days created by the MIG programme to end September 2006 amounts to 20,287,959 job days, of which 34,52%
(7,004,387) are woman job days and 35,52% (7,206,943) youth job days. This is however not specific to the water sector.
SERVICE DELIVERY PROGRESS - QUARTER 2
Water Sector Progress - Financial Year 2006/2007
Quarter 3 (October to December 2006) Activity Annual Sector
Target
YTD Sector1
DWAF DPLG3 DOE Health Housing
Institutional Development & Performance
Policy and
Strategy
WS
Amendment
Bill by Mar’05
Guideline document on Small Scale & Productive uses of water at
household level is being finalised;
Guideline Document on Private Land is being piloted in 3 DM’s;
draft 2: National Water Services Bill produced.
IGR and
sector
collaboration
WS functioning Gauteng Sector Forum launched;
Provincial sector meetings held in EC, KZN, EC, FS, and NC.
Provincial WS Plans reviewed.
LG Support DWAF 5-Year Local Government Water Sector Support Plan
Support provided to municipalities through Project Consolidate.
WSDP 155 WSDPs
received by
Mar’05
Support currently provided to 155 municipalities
2006/07 = WSDP’s in various stages of development.
Drinking
Water Quality
Number of health related DWQ failures – EC(14), LP(4), NW(148 borehole
samples), FS(10), WC(6), MP(2)
WSA’s
Checklist
154 WSA’s checklist interviews completed
122 checklist results signed off and adopted by some sort of Committee,
Council or Executive Manager.
Transfer of
Schemes
58 transfer
agreements &
318 schemes
transferred by
March 2006
52 transfer agreements concluded (1 in circulation awaiting Minister’s
approval
304 of the original 318 water schemes identified in the Funational
Assessment transferred;
Total 1,628 schemes transferred in accordance with TA’s.
FINANCIAL SUMMARY
Quadrant 1 DWAF
WSS specific
Quadrant 3Not WSS
specific
Quadrant 2Non DWAF
WSS specific
Quadrant 4Non DWAF
Non WSS specific
Capital – R479mRecurrent R 1,104bn
Capital – R nilRecurrent – R 66mNot WSS specific
Capital MIG – R 2,282bnCapital DFID – R 14m
Recurrent – R 2,679bn
1
3 4
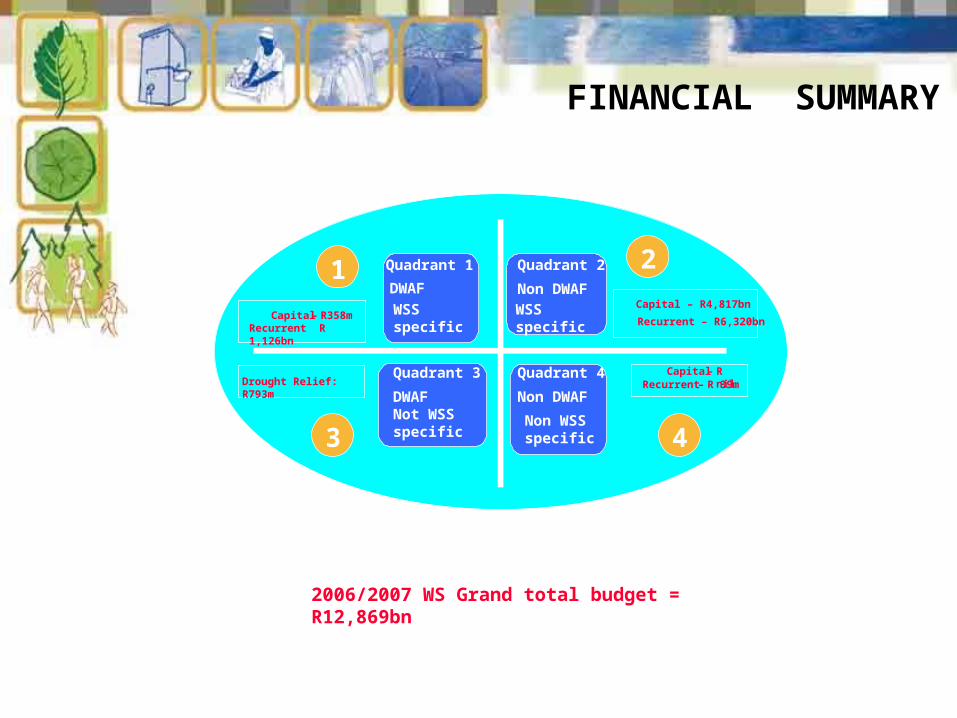
2Quadrant 1
DWAF
WSS specific
Quadrant 3
DWAFNot WSS specific
Quadrant 2
Non DWAF
WSS specific
Quadrant 4
Non DWAF
Non WSS specific
Capital – R358mRecurrent R 1,126bn
Capital – R nilRecurrent – R 39mDrought Relief: R793m
Capital – R4,817bn
Recurrent – R6,320bn
2006/2007 WS Grand total budget = R12,869bn
1
3 4
2

EXPENDITURE ANALYSISQUADRANT 1: DWAF WATER SERVICES
Quadrant 1: DWAF - Water Services Specific
Budget Expend.
R'000 R' 000
Capital
- DWAF Funding
> Indirect Grant to Capital Projects - - -
> Management Support Overheads 71,470 31,514 44%
- Donor Funding (EU, DCI, Flemish, Swiss 286,820 137,301 47.9%
> EU 231,736 112,666 48.6%
> DCI 46,556 17,871 38.4%
> Flemish 5,528 3,764 68.1%
> Swiss 3,000 3,000 100.0%
358,290 168,815 47.1%
Recurrent
- Department Baseline 273,602 150,594 55.0%
- Indirect Grant Water Services Operating Subsidy 990,500 375,309 37.9%
1,264,102 525,903 41.6%
Total 1,749,071 1,123,783 64.3%
2006/2007
% Expenditure

QUADRANT 1: DWAF EXPENDITURE PER PROVINCE
Province
Q1 June 06 - Cumulative
Expenditure YTD
Q2 - Sept 06 Cumulative
Expenditure YTD
Q3 - Dec 06 Cumulative
Expenditure YTD2006/2007 RFD
Sept 06%
ExpenditureCC 377,327 1,342,145 4,457,567 4,420,000 100.8%EC 3,375,484 10,155,729 12,977,181 30,870,000 42.0%FS 820,369 2,691,813 7,579,410 17,225,000 44.0%GT 899,060 6,665,781 12,401,131 19,550,000 63.4%HO 14,712,989 39,193,609 62,167,371 129,377,000 48.1%KN 371,101 670,001 2,928,420 10,348,344 28.3%LP 9,799,807 15,334,942 24,530,114 57,388,612 42.7%MP 4,492,715 9,187,163 14,107,479 34,222,000 41.2%NC 547,459 1,290,506 5,617,910 13,648,000 41.2%NW 3,803,452 3,815,074 8,014,160 23,346,050 34.3%WC 548,655 5,028,396 14,034,265 17,895,000 78.4%
Grand Total 39,748,418 95,375,158 168,815,008 358,290,006 47.1%Note: 2006/2007 RFD Sept 06 = DWAF Budget 2006/2007 FY
As at 5 February 2007, total BAS expenditure = R168,815,008 (47,1%)
0
20,000,000
40,000,000
60,000,000
80,000,000
100,000,000
120,000,000
140,000,000
Am
ou
nt
CC EC FS GT HO KN LP MP NC NW WC
Province
Quadrant 1: DWAF Capital Expenditure per Region
Q1 June 06 - Cumulative Expenditure YTD Q2 - Sept 06 Cumulative Expenditure YTD
Q3 - Dec 06 Cumulative Expenditure YTD 2006/2007 RFD Sept 06
GP (63,4%);
WC (78,4%);
KZN (28,3%);
NW (34,3%)

QUADRANT 1: EXPENDITURE PER KFA
OVERALL WATER SERVICE PROGRAMME
2006/2007
Expenditure Dec 06
MTEF Budget of
Prog 3
Donor Budget
Total Budget
Exp vs.
Total Budget
R' 000 R' 000 R' 000 R' 000 %
KFA 10 – Water & Sanitation Services 70,635
21,131 78,147 99,278 71%
KFA 11 – Water Sector Support 142,279 119,911 99,806 219,717 65%
KFA 12 – Institutional Support 70,968 57,109 91,617 148,726 48%
KFA 13 - Transfers 1,110 15,480 5,500 20,980 5%
KFA 14 – African Participation 0 400 2,500 2,900 0%
KFA 18 – Water Services Admin 81,466 116,096 0 116,096 70%
KFA 21 – Operation of Water Services 753,331 1,132,124 0 1,132,124 67%
KFA 6 – Water Resource Interface 3,994 0 9,250 9,250 43%
1,123,783 1,462,251
286,820 1,749,071 64%

EXPENDITURE ANALYSISQUADRANT 2:
NON-DWAF WATER SERVICES
Quadrant 2: Non-DWAF - Water Services Specific
Budget Expen WS Budget WS Expend.
R'000 R'000 R' 000 R' 000
Capital
- Municipal Infrastructure Grant - MIG (61,49%) 5,865,300 3,606,573
- Eradication of Bucket Sanitation - (100%) 400,000 400,000
- Dept. of Education
Provincial Infrastructure Grant (2.5%) 4,118,000 - 102,950 - 0%
- Dept. of Health
Hospital Revitalisation Grant (5%) 1,440,000 1,114,100 72,000 55,705 77%
- Dept. of Housing
Integrated Housing and Human Settlement Dev Grant (10%) 6,350,000 4,171,909 635,000 417,191 66%
- Cities Network 139,000 - 0%
18,312,300 7,596,231 4,816,523 1,893,451 39.3%
Recurrent
- Equitable Share 18,057,940 6,320,279 0%
18,057,940 0 6,320,279 0 0.0%
Total 36,370,240 7,596,231 11,136,802 1,893,451 17.0%
2006/2007
% WS Expenditure
2,310,222 1,420,556 36.9%

QUADRANT 2: MIG EXPENDITURE PER PROVINCE
Province
MIG BUDGET 2006/07 as per
DoRA
Estimated MIG WS Budget 2006/2007 (61.49% of DoRA
allocation)
Q1 - MIG WS Cumulative
Expenditure (Apr - June 2006)
Q2 - MIG WS Cumulative
Expenditure (Apr - Sept 2006)
Nov 06 - MIG WS Cumulative
Expenditure (YTD)
% MIG WS Expenditure
2006/07EC 1,288,257,481 792,149,525 90,666,180 215,876,761 313,033,859 39.5%FS 563,895,790 346,739,521 26,003,245 73,975,931 120,773,178 34.8%GT 898,553,840 552,520,756 30,456,614 109,831,040 183,334,321 33.2%KZ 1,262,412,326 776,257,339 80,068,598 191,187,747 284,567,544 36.7%LP 821,263,702 504,995,051 29,597,305 92,183,743 162,644,031 32.2%MP 470,283,899 289,177,569 10,112,381 28,668,533 53,587,422 18.5%NW 525,573,629 323,175,225 14,589,333 93,701,591 160,200,755 49.6%NC 130,922,167 80,504,040 7,116,034 12,219,255 26,404,230 32.8%WC 304,136,901 187,013,780 25,671,965 86,327,909 116,009,996 62.0%
Grand Total 6,265,299,735 3,852,532,807 314,281,656 903,972,510 1,420,555,335 36.9%
0
100,000,000
200,000,000
300,000,000
400,000,000
500,000,000
600,000,000
700,000,000
800,000,000
Am
ou
nt
EC FS GT KZ LP MP NW NC WC
Province
MIG Water Services Expenditure per Province
Estimated MIG WS Budget 2006/2007 (61.49% of DoRA allocation) Q1 - MIG WS Cumulative Expenditure (Apr - June 2006)
Q2 - MIG WS Cumulative Expenditure (Apr - Sept 2006) Nov 06 - MIG WS Cumulative Expenditure (YTD)
MIGNW (49,6%);WC (62,0%
%)
MIGMP
(18,5%); LP
(32,2%);

ProvinceEquitable Share Sector
Budget 2006/07WS - Equitable Share (35%) Budget 2006/07
Equitable Share Expenditure June 2006
EC 2,308,185,000 807,864,750FS 1,222,029,000 427,710,150GT 5,107,755,000 1,787,714,250KZ 3,091,031,000 1,081,860,850LP 1,565,837,000 548,042,950MP 1,284,092,000 449,432,200NC 424,513,000 148,579,550NW 1,202,687,000 420,940,450WC 1,851,811,000 648,133,850
Grand Total 18,057,940,000 6,320,279,000
0200,000,000400,000,000600,000,000800,000,000
1,000,000,0001,200,000,0001,400,000,0001,600,000,0001,800,000,000
Am
ou
nt
EC FS GT KZ LP MP NC NW WC
Province
Quadrant 2: WS Portion of Equitable Share per Region
WS - Equitable Share (35%) Budget 2006/07 Equitable Share Expenditure June 2006
QUADRANT 2: EQUITABLE SHARE
Note: Equitable share is an unconditional grant – no reports submitted by WSA’s

QUADRANT 3: DWAF NON-WATER SERVICES
(DROUGHT RELIEF FUNDING PER PROVINCE)
ProvinceDR Exp Dec 06 (approved for
payment)Total Gazetted D/Relief
allocation % DR ExpenditureEastern Cape 106,404,429 138,726,000 76.7%Free State 11,850,066 18,528,000 64.0%Gauteng 25,443,309 27,524,000 92.4%KwaZulu Natal 187,201,543 198,529,000 94.3%Limpopo 102,067,389 151,218,000 67.5%Mpumalanga 40,721,891 45,856,000 88.8%North West 57,487,932 97,768,000 58.8%Northern Cape 70,284,699 77,640,000 90.5%Western Cape 19,845,960 36,251,000 54.7%
Grand Total 621,307,218 792,040,000 78.4%
Quadrant 3: Drought Relief Funding as at December 2006
0
50,000
100,000
150,000
200,000
250,000
Province
Am
ou
nt
(R '0
00
)
DR Exp Dec 06 (approved for payment) Total Gazetted D/Relief allocation
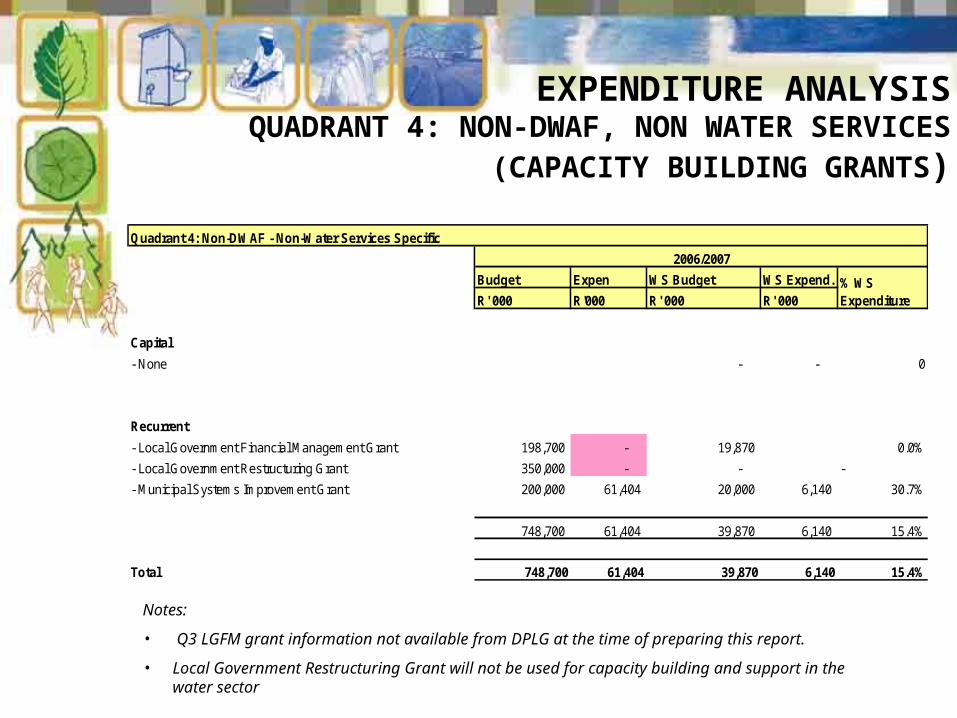
Notes:
• Q3 LGFM grant information not available from DPLG at the time of preparing this report.
• Local Government Restructuring Grant will not be used for capacity building and support in the water sector
EXPENDITURE ANALYSISQUADRANT 4: NON-DWAF, NON WATER SERVICES
(CAPACITY BUILDING GRANTS)
Quadrant 4: Non-DWAF - Non-Water Services Specific
Budget Expen WS Budget WS Expend.
R' 000 R'000 R' 000 R' 000
Capital
- None - - 0
Recurrent
- Local Government Financial Management Grant 198,700 - 19,870 0.0%
- Local Government Restructuring Grant 350,000 - - -
- Municipal Systems Improvement Grant 200,000 61,404 20,000 6,140 30.7%
748,700 61,404 39,870 6,140 15.4%
Total 748,700 61,404 39,870 6,140 15.4%
2006/2007
% WS Expenditure

• Finalisation of NWSP 2007-12 and work plan & financial delegation 2007/8
• Towards a communication & change management plan to better understand WfGD
• High level meeting between DWAF & dplg and SALGA;
• Bi-lateral engagement between DWAF & DoHealth;
• Extension of the WS M&E reporting into WR + Forestry and impact assessment of WS programmes;
• WS/WR interface and alignment;
• Support dplg/munics towards meeting target;
• Support for acceleration of the sanitation delivery and bucket eradication;
• Support municipalities through Project Consolidate;
• Finalisation of DWAF LG Water Sector Support Plan;
• Towards establishment of Siyense Manje ‘water sector’ unit in collaboration with DBSA/dplg/SALGA & DWAF
KEY ISSUES FOR THE 4TH QUARTER 2006/07

• Implementation of partnership agreement between the
Private Sector and knowledge sharing agencies in
Netherlands & SA: – Support the water sector in SA through Partnership with Private
Sector and sharing & transferring expertise and experience available in the Dutch WS and SA.
• Support SADC and NEPAD through DWAF and WSP-AF
Strategic Cooperation Alliance : – Assist with poverty reduction programmes throughout Southern
Africa and in other NEPAD countries;
– Partnerships in the accelerated delivery of WS MDG’s in Africa;
– Sharing knowledge and best practice through WIN
KEY ISSUES FOR THE 4TH QUARTER 2006/07 (cont…)

• In view of consultations held with provincial and national
stakeholders, progress reports for the 3rd quarter
2006/2007 were compiled into:– Volume I: Consolidated Water Sector Report
– Volume II: Regional Reports
– Volume III: Sector Partner Reports
• It is recommended that the above reports are formally
accepted by the WSSCC, subject to incorporation of the
comments made today at the meeting.
THE END
CONCLUSION