Embed Size (px)
Citation preview

Mask Projection Microstereolithography 3D Printing of Gelatin Methacrylate
Wyatt Redmond Surbey
Thesis submitted to the faculty of the Virginia Polytechnic Institute and State University
in partial fulfillment of the requirements for the degree of
Master of Science
In
Materials Science and Engineering
Abby R Whittington
Johan E Foster
Hang Yu
April 9th, 2019
Blacksburg, VA
Keywords: 3D printing, GelMA, tissue engineering
Copyright ©

Mask Projection Microstereolithography 3D Printing of Gelatin Methacrylate
Wyatt Surbey
ABSTRACT
Gelatin methacrylate (GelMA) is a ubiquitous biocompatible photopolymer used in tissue
engineering and regenerative medicine due to its cost-effective synthesis, tunable
mechanical properties, and cellular response. Biotechnology applications utilizing
GelMA have ranged from developing cell-laden hydrogel networks to cell encapsulation
and additive manufacturing (3D printing). However, extrusion based 3D printing is the
most common technique used with GelMA. Mask projection microstereolithography
(MPµSL or µSL) is an advanced 3D printing technique that can produce geometries with
high resolution, high complexity, and feature sizes unlike extrusion based printing. There
are few biomaterials available for µSL applications, so 3D printing GelMA using µSL
would not only add to the repertoire materials, but also demonstrate the advantages of
µSL over other 3D printing techniques. A novel GelMA resin was tested with µSL to
create a porous scaffold with a height and print time that has not been displayed in the
literature before for a scaffold of this size. The resin consists of GelMA, deionized water,
lithium phenyl-2,4,6-trimethylbenzoylphosphinate (LAP, photoinitiator), and 2-Hydroxy-
4-methoxybenzophenone-5-sulfonic acid (sulisobenzone, UV blocker) and can be
processed at room temperature. Four resins were tested (w/w %) and characterized for
µSL printing: 20% GelMA 0.5% UV blocker, 20% GelMA 1.0% UV blocker, 30%
GelMA 0.5% UV Blocker, and 30% GelMA 1.0% UV blocker. Swell testing, working
curve, photo-rheology, photo-DSC (dynamic scanning calorimetry), 3D printing, and cell
culture tests were performed and results showed that 30% GelMA 1.0% UV blocker had
the best 3D print fidelity among resin compositions.

iii
Mask Projection Microstereolithography 3D Printing of Gelatin Methacrylate
Wyatt Surbey
GENERAL AUDIENCE ABSTRACT
Three dimensional (3D) printing is a widely used technology to rapidly produce
structures with varying degrees of complexity. 3D printing of biological components is of
interest because as the world population increases, there is a lack of donors available to
compensate for organ loss and tissue replacement. 3D printing offers a solution to great
custom scaffolds and structures that mimic physiological geometry and properties. One
printing technique is known as microstereolithography, or µSL, which uses a projector-
like system to pattern ultraviolet (UV) light in specific arrangements to generate complex
geometries and 3D parts. Gelatin is a material of interest for this technology because
gelatin is derived from collagen, which is the most abundant protein found in the body.
Gelatin can be modified so that it is reactive with UV light, and can be processed with
µSL to generate 3D structures. In this work, gelatin was modified into the form of gelatin
methacrylate (GelMA) in order to develop and test resin formulations for use with µSL.
Four different resins were tested and characterized and the results indicated that one
GelMA resin produced prints with greater fidelity and resolution than other formulations.
This resin has been identified for potential applications in tissue engineering and 3D
printed organ development.

iv
Dedication
I dedicate this thesis to my parents, Lisa and Glen Surbey who taught me everything I
have needed to know in life thus far, and who have shown me the beauty of unconditional
love. Through them I have blossomed into a young man ready to tackle the future and life
at length. I will never forget the three most important things they taught me about life:
God, family, and everything else.

v
Acknowledgements
I would first like to acknowledge my advisor, Dr. Abby Whittington for taking me on as a
graduate student and seeing me through this process of growth and development.
Additionally for tolerating my constant perfectionism as well as procrastination.
I would also like to acknowledge my committee members Dr. Johan Foster and
Dr. Hang Yu for working with me throughout this project. Their feedback has been
indispensable and encouraged me multiple times throughout this process.
Lastly I would like to thank the following people and laboratories for their assistance
throughout this project: Nick Chartrain for his endless help and direction and significant
contribution to the aims of this work, Casey Clark for his aid in GelMA synthesis and
direction with this work, Dr. Christopher Williams and the DREAMS lab at Virginia
Tech for the utilization of their space in Goodwin Hall, and Dr. Timothy Long for the use
of his instrumentation and laboratory space in ICTAS II at Virginia Tech.

vi
Table of Contents
Section Page Number
Chapter 1: Introduction
1
1.1 An Introduction to 3D Printing 1
1.2 AM Techniques 2
1.3 Biomaterial Development in AM 6
1.3.1 Shape and Resolution 7
1.3.2 Material Heterogeneity 8
1.3.3 Material Heterogeneity: Synthetic Polymers 8
1.3.4 Material Heterogeneity: Natural Polymers 10
1.3.5 Biocompatibility and Cell-Material Interactions 13
1.4 Gelatin and Gelatin Methacrylate 14
1.4.1 Synthesis of Gelatin Methacrylate 15
1.4.2 Development of a µSL resin 16
1.4.3 Additional Printability Considerations:
The Photoinitiator
18
1.5 Thesis Aims 25
Chapter 2: Materials and Methods 28
2.1 Materials 29
2.2 Gelatin Modification and Verification 30
2.2.1 Gelatin Methacrylation 30
2.2.2 NMR Spectroscopy 30
2.3 Photocurable Resin Formulation 31
2.3.1 Photo-Rheology 32
2.3.2 Photo-DSC 32
2.4 Film Fabrication and Swelling 33
2.4.1 Film Curing 33
2.4.2 Swell Testing 33
2.5 3D Printable Resin Validation 34
2.5.1 Working Curve 34
2.5.2 Mask Projection Microstereolithography
(3D Printing)
34

vii
Chapter 3: Results and Discussion
41
3.1 NMR Confirmation of Gelatin Modification 41
3.2 Photo-Rheology 44
3.3 Photo-DSC 48
3.4 Swell Testing 52
3.5 Working Curve 53
3.6 3D Printing Analysis 55
3.6.1 Scaffold Face Measurements 58
3.6.2 Top of Scaffold Measurements 61
3.6.3 Bulk Scaffold Measurements 65
3.6.4 Scaffold Layer Measurements 69
3.7 Cell Culture 71
Chapter 4: Conclusions and Future Directions 75
4.1 Conclusions 75
4.2 Significance 76
4.3 Future Directions 78
Appendix A 82
References 86

viii
List of Figures
Figure Page Number(s)
1-1
Figure 1-1. Comparison of AM techniques that are used in bio-AM.
Figure reproduced with publisher’s permission [2].
3
1-2
Figure 1-2. µSL system diagram, as described, a (typically UV) light
source emits light at a specific wavelength which is then reflected and
pattern via a mirror and dynamic mask onto the surface of a
photopolymer container with a build stage containing cross-linkable
resin. Figure reproduced with publisher’s permission [9].
5
1-3
Figure 1-3. GelMA Synthesis Scheme. Figure reproduced with
publisher’s permission [35].
15
1-4
Figure 1-4. (A) HNMR of gelatin. (B) HNMR of GelMA. Figure
reproduced with publisher’s permission [37].
16
1-5
Figure 1-5. Crosslinking of GelMA in the presence of UV irradiation,
Irgacure 2959 and PBS to create a hydrogel network. Figure
reproduced with publisher’s permission [35].
17
2-1
Figure 2-1: Image of the .STL file for desired print structure
35
3-1
Figure 3-1: Representative 1H NMR of A) Type B Gelatin as
received and B) GelMA after modification. The phenylalanine peak
was used to normalize the spectra. Peaks a (2.9 ppm) corresponds to
lysine methylene signal and b (1.9 ppm) corresponds to the methyl
signal. Peaks c and d were observed at 5.6 and 5.4 ppm and
correspond to methacrylic functions from acrylic protons.
D2O
42

ix
3-2
Figure 3-2: A) Photo-rheology data of GelMA samples (w/w %)
(refer to Table 2-1 for exact concentrations). M-GelMA 1 was
significantly different than H-GelMA 1 and H-GelMA 2 (*p < 0.001)
and M-GelMA 2 was significantly different than H-GelMA 1 and H-
GelMA 2 (**p < 0.001). Both M-GelMA and H-GelMA resins were
significantly different than L-GelMA resins (p < 0.001), while L-
GelMA 1 was significantly different than L-GelMA 2 (where no data
could be collected, this same trend applies to 3-2B)). B) The gel point
was determined as the crossover point between G’ and G’’ and was
reported across all samples. H-GelMA 1 was significantly different
than H-GelMA 2 (*p < 0.05), while M-GelMA 2 was significantly
different than HGelMA 1 and H-GelMA 2 (**p < 0.005), and M-
GelMA 1 was significantly different than HGelMA 1 (***p < 0.05).
Experiments were run in triplicate (n = 3) and reported as the average
± standard deviation.
44
3-3
Figure 3-3: Photo-rheology data of the average G’ of GelMA samples
(w/w %). From bottom to top, the lines represent M-GelMA 1 (blue),
M-GelMA 2 (orange), H-GelMA 1(yellow), and HGelMA 2 (gray).
The L-GelMA data was not included because these two formulations
were deemed unsuitable for further study. All experiments were run
in triplicate (n = 3).
48

x
3-4
Figure 3-4: A) Representative Photo-DSC curves of GelMA samples
(w/w %). From bottom to top, the lines represent M-GelMA 1 (blue),
M-GelMA 2 (orange), H-GelMA 1 (yellow), and HGelMA 2 (gray).
The low concentration GelMA samples were not included on the
graph because their heat flow was too low to display properly and
they were deemed unsuitable compositions. B) Calculated average
specific heat of GelMA samples (w/w %). M-GelMA 1 was found to
be significantly different than H-GelMA 1 and H-GelMA 2 (*p <
0.05) just as M-GelMA 2 was found to be significantly different than
H-GelMA 1 and H-GelMA 2 (**p < 0.005). C) Average cure time
based upon the time at which the highest peak occurs. H-GelMA 1
was significantly different than H-GelMA 2 (*p < 0.05), while M-
GelMA 2 was significantly different than H-GelMA 1 and M-
GelMA 1 (**p < 0.05), and M-GelMA 1 was significantly different
than H-GelMA 2 and M-GelMA 1 (***p < 0.05). Refer to Table 2-1
for exact concentrations. Experiments were run in triplicate (n = 3)
and reported as the average ± standard deviation.
49
3-5
Figure 3-5: Working curve of GelMA Resins H-GelMA 1 (gray), H-
GelMA 2 (yellow), MGelMA 1 (blue), M-GelMA 2 (orange).
Measurements were taken in triplicate (n = 3) and the error bars
represent the average standard deviation.
55
3-6
Figure 3-6: Representative light images of GelMA scaffolds with
features measured of the A) scaffold face and B) scaffold top. C)
Table depicting printing parameters input into the LabView software
for each resin type, the pore size for each scaffold type was 1 mm in
diameter.
56
3-7
Figure 3-7: A) Pore height measurements and standard deviations for
faces of printed GelMA scaffolds (n = 10). For the pore height, only
H-GelMA 2 was significantly different (#p < 0.05) than all other
GelMA resins in terms of the pore height measurements. B) Percent
error bar graph depicting the deviation between GelMA Resins and
the theoretical pore height measurements.
59
xi
3-8
Figure 3-8: A) Pore width measurements and standard deviations for
faces of GelMA scaffolds and resins (n = 10). M-GelMA 1 is
significantly different than all other resins (*p < 0.001). M-GelMA 2
is significantly different than M-GelMA 1 and H-GelMA 2 (**p <
0.001). H-GelMA 1 is significantly different than M-GelMA 1 and H-
GelMA 2 (***p < 0.01). Lastly, compared to all other groups H-
GelMA 2 is significantly different (#p < 0.001) than all other
GelMA resins in terms of the pore width measurements. B) Percent
error bar graph depicting the deviation between GelMA Resins and
the theoretical pore width measurements.
60
3-9
Figure 3-9: A) Pore height measurements and standard deviations for
faces of GelMA scaffolds and resins (n = 10). M-GelMA 1 is
significantly different than all other resins (*p < 0.001). H-GelMA 1
is significantly different than M-GelMA 1 (**p < 0.001). Lastly,
HGelMA 2 is significantly different than M-GelMA 1 and M-GelMA
2 (#p < 0.005) in terms of the pore height measurements. B) Percent
error bar graph depicting the deviation between GelMA Resins and
the theoretical pore height measurements.
63
3-10
Figure 3-10: A) Pore width measurements and standard deviations for
faces of GelMA scaffolds and resins (n = 10). M-GelMA 1 was
significantly different than all other resins (*p < 0.001). H-GelMA 1
is significantly different than M-GelMA 1 (**p < 0.001). Lastly, H-
GelMA 2 was significantly different than M-GelMA 1 and M-GelMA
2 (#p < 0.005) in terms of the pore width measurements. B) Percent
error bar graph depicting the deviation between GelMA Resins and
the theoretical pore width measurements.
64

xii
3-11
Figure 3-11: A) Scaffold height measurements and standard
deviations for bulk GelMA scaffolds (n = 10). M-GelMA 1 is
significantly different than all other resins (*p < 0.05). M-GelMA 2
is significantly different than M-GelMA 1 and H-GelMA 2 (**p <
0.05). H-GelMA 1 is significantly different than M-GelMA 1 and H-
GelMA 2 (***p < 0.05). Lastly, compared to all other groups H-
GelMA 2 is significantly different (#p < 0.05) than all other GelMA
resins in terms of the scaffold height measurements. B) Percent error
bar graph depicting the deviation between GelMA Resins and the
theoretical scaffold height measurements.
67
3-12
Figure 3-12: A) Scaffold width measurements and standard
deviations for bulk GelMA scaffolds (n = 10). Compare to all other
resins, H-GelMA 2 is significantly different (#p < 0.05) in terms of
the scaffold width measurements. B) Percent error bar graph
depicting the deviation between GelMA Resins and the theoretical
scaffold width measurements.
68
3-13
Figure 3-13: A) Scaffold layer measurements and standard deviations
for bulk GelMA scaffolds (n = 10). Significance was determined
between all resin types regarding the scaffold layer measurements (*p
< 0.05). B) Percent error bar graph depicting the deviation between
GelMA Resins and the theoretical pore height measurements.
70
3-14
Figure 3-14: Cell culture study results for 1 and 3 day studies.
Experiments were run in triplicate (n = 3). At 1 day, no significant
difference was observed between resins as well as between the resins
and control (p > 0.05). For 3 day, no significance was observed
between resins, but there was significance between each resin and the
control (*p < 0.05). Further statistical analysis between 1 and 3 days
revealed that for each resin type there was a significance between 1
and 3 days of cell culture (i.e. M-GelMA 1 at 1 day was significantly
different than M-GelMA 1 at 3 day) (**p < 0.05).
73

xiii
3-15
Figure 3-15: Representative light microscopy images of GelMA films
seeded with 3T3s and stained for nuclei (DAPI, blue) and actin
(Texas Red, red). Experiments were run in triplicate (n = 3)
73

xiv
List of Tables
Table Page Number(s)
2-1
Table 2-1: GelMA resin formulations
31
3-1
Table 3-1: Average swell percentage of GelMA resins. Significance
was found between MGelMA 1 and M-GelMA 2 (**p < 0.005) as
well as H-GelMA 1 and H-GelMA 2 (*p < 0.05). All experiments
were run in triplicate (n = 3).
53
3-2
Table 3-2: From Figure 3-6 the following values were derived. The
Dp corresponds to the slope of the trend lines while the Ec
corresponds to the x-intercept.
55
3-3
Table 3-3: Summary of printability for GelMA Resin Formulations.
71

xv
List of Abbreviations
Additive manufacturing (AM)
Rapid prototyping (RP)
Computer aided design (CAD)
Stereolithography (SL)
Mask projection microstereolithography (µSL)
Three dimensional (3D)
Two dimensional (2D)
Ultraviolet (UV)
Gelatin methacrylate (GelMA)
Extracellular matrix (ECM)
[3-(4,5-dimethylthiazol-2-yl)-5-(3-carboxymethoxyphenyl)-2-(4-sulfophenyl)-2H-
tetrazolium (MTS)
Poly (propylene) fumarate (PPF)
Diethyl fumarate (DEF)
N-Vinylpyrrolidone (NVP)
Trimethylene carbonate (TMC)
Trimethylolpropane (TMP)
Polycaprolactone (PCL)
Polylactide (PLA)
Poly(ethylene glycol) diacrylate (PEG, PEGDA)
Poly d, l-lactic-glycolic acid (PLGA)
Poly(ethylene glycol) dimethacrylate (PEGDMA)
Oxidized methacrylic alginate (OMA)

xvi
Arginine, Glycine, and Aspartate (Arg-Gly-Asp, or RGD)
Poly(ethylene glycol) methyl ether methacrylate (PEGMEM)
Hyaluronic acid (HA)
Glycosaminoglycan (GAG)
Matrix metalloproteinases (MMPs)
Degree of functionalization (DF)
Degree of substitution (DS)
Degree of methacrylation (DM)
Phosphate buffered saline (PBS)
2-hydroxy-l-[4-(hydroxyethoxy)phenyl]-2-methyl-l-propanone (Irgacure 2959)
2,2-dimethoxy-2-phenylacetophenone (DMPA)
Lithium phenyl-2,4,6-trimethylbenzoylphosphinate (LAP)
2,2'-Azobis[2-methyl-N-(2-hydroxyethyl) propionamide] (VA-086)
Eosin Y/Triethanolamine/l-vinyl-2-pyrrolidinone (EY)
Methacrylated hyaluronic acid (HAMA)
Cellulose nanocrystals (CNCs)
Nuclear magnetic resonance (NMR) spectroscopy
Methacrylic anhydride (MA)
2-Hydroxy-4-methoxybenzophenone-5-sulfonic acid (sulisobenzone)
Deuterium oxide (D2O)
Fetal bovine serum (FBS)
Deionized (DI) water
Photo-Differential Scanning Calorimetry (DSC)

1
Chapter 1: Introduction
1.1 An Introduction to 3D Printing
Additive manufacturing (AM), also known as three-dimensional (3D) printing has become a
widely used technology across many fields of science and engineering. Originally deemed rapid
prototyping (RP) because of its industrial applications for rapidly developing a prototype in
which a final product can be built or commercialized upon – the term has since evolved to AM
and 3D printing in the research field to describe technologies that create physical prototypes
directly from digital model data [1]. In fact, many parts for industrial and research applications
are directly manufactured using AM machines, thus labelling them as prototypes is inadequate
[1]. The basic principle of AM technology is to take a 3D computer-aided-design (CAD) model
and fabricate the part by adding consecutive layers [1]. This layer-by-layer approach is the
anchor between AM techniques. How AM techniques differ lie in the type of materials that can
be used, how the layers are generated, and how the layers are bonded to one another [1]. These
differences determine factors like the accuracy of the final product, and both its material and
mechanical properties [1]. Different AM techniques will also determine factors like how quickly
the part can be made, how much post-processing of the part is required, the size of the AM
machine used, and the overall cost of the AM machine and process [1]. For the purposes of this
research, not all AM techniques will be described at length. However, it is important to realize
that AM technologies have a wide range of applications and features with varying pros and cons.
In this thesis, the focus will be on polymeric biomaterial resin development for the AM
technique mask projection microstereolithography (also known as vat photopolymerization,

2
MPµSL, or µSL). As an introduction, first, a few competing AM technologies will be discussed:
extrusion, inkjet, and laser-assisted 3D printing. Then, the significance and limitations of
biomaterial development in AM will be discussed regarding extrusion, inkjet, and laser-assisted
3D printing. Lastly, µSL will be discussed at length with regards to a specific polymeric
biomaterial (gelatin methacrylate, GelMA) and the aims to be addressed in this work.
1.2 AM Techniques
In AM, there are many alternative methods to extrusion 3D printing that each have their own
unique advantages and disadvantages. These printing techniques differ in the materials that can
be used, how the layers are created, and how the layers are bonded to each other. Such
differences will determine factors like the accuracy of the final part plus its material properties
and mechanical properties. They will also determine factors like how quickly the part can be
made, how much post-processing is required, the size of the AM machine used, and the overall
cost of the machine and process [2, 3]. Figure 1-1, presents a simplified schematic of AM
printing technologies and their advantages/disadvantages in respect to considerations such as
viscosity, resolution, and print speed. A bio-ink is different from a biomaterial in that bio-inks
contain cells within their solution while biomaterials are stand-alone, but may incorporate cells
after a scaffold is produced [2, 4-7]. For the purposes of this research, only biomaterial
configurations will be considered, not bio-inks.

3
Figure 1-1. Comparison of AM techniques that are used in bio-AM. Figure reproduced with
publisher’s permission [2].
Extrusion-based printing is the most widely used and well known technique; it uses a pneumatic
or mechanical system in order to expel the material and create 2D patterns on a substrate [2].
These 2D patterns produced are then solidified either physically or chemically, and then the
process is repeated to yield a 3D object or scaffold [2, 8]. When considering using extrusion-
based printing for biomaterial production, the printability may depend on a variety of factors
such as: the viscosity of the polymer, the temperature of the pneumatic or mechanical system
used to expel the solution, or a potential crosslinking mechanism to solidify the layers post
processing. Extrusion-based printing is also limited by the extrusion nozzle length and size. In
general, the advantage of extrusion-based printing includes wide bio-ink/biomaterial selectivity
(materials of varying viscosity and mechanical properties) [2]. However, a disadvantage of
extrusion-based printing is that the overall resolution (feature sizes such as pores and layer
thickness) is greater than 100 m. Additionally, in order to reach higher resolution higher
pressures and slower print speeds are required which slow down the overall process (on the

4
magnitude of hours depending on the part size). Figure 1-1 also depicts inkjet and laser assisted
3D printing. Inkjet printing existed first as a two-dimensional process via printing documents and
images from computers, but evolved as a 3D printing method in which particles of material were
deposited onto a substrate [1]. The process has since extended into acrylate photopolymers, in
which droplets of liquid monomer are deposited and then exposed to ultraviolet (UV) light to
photopolymerize [1]. As Figure 1-1 shows, the advantages of inkjet printing include low cost and
high speed printing. Additionally inkjet printing allows for ease of multi-material printing, but
the choice of materials is limited and the resolution and part accuracy is also limited as the scale
of parts increases [1]. Inkjet printing can produce resolutions lower than 100 m, but that
resolution is sacrificed when printing constructs that are cm in size [1]. Additionally this process
is much faster than extrusion printing, with constructs typically being printed in less than an hour
[1]. Laser-assisted printing is similar to inkjet printing, but instead a donor layer is present from
which the material is deposited. This donor layer allows for higher viscosity materials to be used,
but the laser inherently increases the cost of the apparatus. Like inkjet printing, the primary
limitation of laser-assisted printing is the lack of materials available. Laser-assisted printing also
typically produces constructs in less than an hour and can reach resolutions lower than 100 m
[1].
The technique that particularly stands out in Figure 1-1 is stereolithography, because it
comparatively has fewer limitations while providing higher resolution and faster print speeds at a
lower cost. Stereolithography (SL), is a photochemical process in which light causes chemical
monomers to link together to form polymers [2]. These polymers then make up the body of a
three-dimensional solid. A more advanced technique of stereolithography is known as mask

5
projection microstereolithography, which will be referred as µSL for the remainder of this
document. The µSL process is different than traditional SL in that instead of having a light
source to scans across the vat of material and selectively curing points, there is a dynamic mask
that patterns the light to expose an entire cross-section of the desired print at once [9]. Figure 1-2
provides an in-depth schematic of a µSL machine.
Figure 1-2. µSL system diagram, as described, a (typically UV) light source emits light at a
specific wavelength which is then reflected and pattern via a mirror and dynamic mask onto the
surface of a photopolymer container with a build stage containing cross-linkable resin. Figure
reproduced with publisher’s permission [9].
By exposing an entire cross-section at once, the printing time can be dramatically reduced [9]. In
addition, the feature sizes of the print are not limited to the radius of the light source, meaning
feature sizes smaller than 10 µm can be produced [9]. This small feature size is a huge advantage
for µSL systems because scaffold shape and resolution directly affects cell-material interactions
[6]. One of the primary limitations for µSL is material availability. Since most material
development is targeted toward extrusion based printing, other 3D printing technologies tend to
lack commercially available materials. This leaves space where there is a necessity for
biomaterial development and 3D printability testing. This is just one reason this work will focus

6
on biomaterial development for stereolithography, more specifically: improving on gelatin
methacrylate (GelMA) 3D printing in µSL. In order to do so, understanding biomaterial
development in AM must be addressed.
1.3 Biomaterial Development in AM
In the biomedical engineering field, 3D printing is especially of interest for tissue engineering
and regenerative medicine applications. Regenerative medicine encompasses tissue engineering,
but both terms refer to the ability to create a functional tissue from either scaffolds, cells, and/or
biologically active molecules in pursuit of curing damaged tissues or organs [7, 10]. In order to
produce scaffolds, it is necessary to develop materials or biomaterials that are not only
compatible with the human body, but also compatible with the variety of 3D printing systems
available. The difference between a material and a biomaterial lies in the name itself: a
biomaterial is a material (natural or synthetic) that is used in medical applications to support,
enhance, or replace damaged tissue or a biological function [11]. Since AM techniques
originated from engineering, they present challenges to materials scientists and chemists alike
when developing new materials for use in AM [5]. Researchers are still understanding what
makes a material “printable” and what they can do to optimize a material’s printability [4, 5]. For
example, in extrusion there might be considerations like the temperature of the pneumatic print
head, or the print bed, but for µSL there might be considerations like laser intensity and build
volume. Some researchers utilize rheological or mechanical characterization to narrow material
selection by exploring material chemistry, such as ionic interactions and coordination bonds [5].

7
However, in general, printing and material considerations for AM specific to biomaterials can be
broken down into three categories:
1. Shape and resolution (layer thickness – feature sizes)
2. Material heterogeneity (viscoelasticity, mechanical strength/integrity, curing
mechanism, biocompatibility, print speed)
3. Cell-material interactions (degradation, cell fusion, structural changes) [6].
1.3.1 Shape and Resolution
Since µSL has such high control over tissue scaffold geometry and resolution, it could become a
key player in continuing to understand mechanisms of the cellular environment and regenerative
process [11]. µSL can obtain resolutions below 100 µm [3, 9]. Ideally, this would give
researchers and engineers the ability to create a tissue engineering scaffold that not only mimics
the structural properties of the extra cellular matrix (ECM), but also the in vivo transport
mechanisms of water, oxygen, nutrients, and waste. However, the main impedance with µSL’s
capabilities is the repertoire of materials for use with µSL is limited in comparison to other AM
techniques like extrusion [3, 4, 11, 12]. This lack of materials available also transcends to the
characterization methods reported with µSL. Often in the literature, a scaffold or 3D printed part
is imaged via optical photography or microscopy and reported utilizing a novel material system.
However, the fidelity of prints are rarely seen analyzed or quantified via some type of fidelity
metric. One method identified is to compare the .STL or CAD file to the produced part in order
to assess the deviation from the CAD file [9]. Many researchers avoid critical analysis of their
scaffolds, so there is a gap in the literature where the fidelity and repeatability of micro patterns,
scaffolds, and other 3D generated parts is quantified.

8
1.3.2 Material Heterogeneity
Commercial (encompassing large scale and micro applications) stereolithography (SL) materials
typically range from epoxies to acrylics, neither of which tend to be biocompatible or
biodegradable [11, 13]. Since biocompatibility (meaning the surface of the scaffold will be
chemically compatible with cells without inducing an immune response) and biodegradability
(meaning the scaffold would degrade in vivo without causing an immune response) are key
characteristics of tissue engineering scaffolds used in bio-AM, an alternative selection of SL
materials have been researched (some of which are commercially available and some which are
not) for µSL applications [4, 14]. Typically, these materials range from synthetic polymers to
naturally derived polymers that have been modified to have photo-active groups such as
acrylates and methacrylates, or a combination of the two [4].
1.3.3 Material Heterogeneity: Synthetic Polymers
One of the first notable synthetic polymers that was deemed biocompatible and biodegradable
for use in µSL is poly(propylene fumarate) (PPF) which is typically crosslinked along with
diethyl fumarate (DEF), methyl methacrylate, and N-vinylpyrrolidone (NVP) [3, 11, 14, 15].
DEF and NVP are added as diluents and lower the viscosity of the resulting resin, making the
solution easier to process via µSL [11, 14]. However, these diluents can add toxicity into the
environment and reduce biocompatibility [11]. Although PPF/DEF systems are attractive in bone
tissue engineering they are limited in soft tissue applications due to their mechanical properties
are similar to trabecular bone [15]. While numerous articles report osteogenic (bone tissue
forming) regenerative effects using PPF/DEF, PPF/DEF soft tissue (nerves, muscles, blood
vessels) applications are nearly non-existent [15, 16]. Thus, PPF/DEF is not a universal material

9
system for µSL. Lee et al demonstrated another novel photopolymer from trimethylene
carbonate (TMC) trimethylolpropane (TMP) that demonstrated similar biocompatible and
biodegradable properties to PPF, but with mechanical properties closer to cartilage [15, 17].
However, the resin still consists of diluents that cause toxicity upon degradation, and the
mechanical properties are dependent on diluent concentrations [15]. Other notable synthetic
biomaterial resins consist of: polycaprolactone (PCL), polylactide (PLA), acrylated or
methacrylated poly(ethylene glycol) (PEG, PEG-DA, PEG-DMA), and poly d, l-lactic-glycolic
acid (PLGA) [4, 11, 15, 18-21]. PCL has high elasticity and thermal properties, but limited
cellular attachment due to its hydrophobicity [15, 19, 22]. PLA has shown biodegradability and
µSL process-ability, but poor mechanical and thermal stability [19]. PEG (and its subsequently
mentioned derivatives) is a relatively rigid photopolymer that exhibits excellent rheological
properties for use in µSL; however, PEG is considered a bio-inert polymer meaning while it does
not elicit an immune response, cells do not adhere to PEG scaffolds readily [2, 11, 21]. Lastly,
PLGA holds similar properties to PCL and PLA but exhibits faster degradation and the
degradation products can be toxic in high concentrations [22, 23]. Although synthetic polymers
provide a wide avenue of material selection for materials scientists and chemists to manipulate
and explore, their tailor-ability must match their biocompatible and biodegradable properties in
order for them to be suitable in µSL tissue engineering applications. And, while most of the
synthetic polymers mentioned do have µSL tissue engineering applications, synthetic polymers
lack natural ECM components to promote cell growth, and display loss of mechanical properties
and leaching of toxic diluents/products upon degradation [4, 11, 19]. Due to this, natural
polymers present a potentially more desirable route of processing because of their inherent ECM
characteristics and bioactivity.

10
1.3.4 Material Heterogeneity: Natural Polymers
Natural polymers such as alginate, chitosan, hyaluronic acid, collagen, and gelatin have already
been modified for 3D tissue engineering applications [2, 4, 6, 8]. However, many natural
polymers have few µSL applications and require either co-polymerization with a synthetic
polymer or reaction with synthetic chemicals to achieve photoactive properties. Natural polymers
can be reacted with chemicals like methacrylic anhydride to modify the structure and add
acrylate groups to the polymeric backbone. Typical photocrosslinkable modifications of natural
polymers require di-acrylates, methacrylates, or acrylamides to be added in as side groups.
Various degrees of modification of natural polymers have been reported, typically ranging from
as low as 10% to as high as 99% [11, 24, 25]. However, not all natural polymers are used for
µSL applications, so having a photoactive element does not mean the material will be compatible
with µSL. This can depend on the degree of modification, wavelength of light, and µSL system
being used to produce the desired structure. The most common natural polymers that will be
discussed for this work include: alginate, chitosan, hyaluronic acid, collagen, and gelatin.
Alginate is a naturally occurring polysaccharide found in the cell walls of brown algae [26].
Alginate has been previously printed using extrusion-based and laser assisted methods, with
reports that it is a biodegradable material with no inflammatory response. However, alginate
lacks cell adhesion ligands for cell attachment [2]. In µSL, oxidized methacrylic alginate (OMA)
scaffolds have been functionalized with Arginine, Glycine, and Aspartate (Arg-Gly-Asp, or
RGD) sequences to promote cell adhesion and co-polymerized with synthetic poly(ethylene
glycol) methyl ether methacrylate (PEGMEM) to improve degradation and printing [27].
Utilizing RGD to improve cell adhesion is common with synthetic or non-cell-adhesive natural

11
polymers. RGD is an amino acid sequence found in ECM proteins and act to help simulate and
mimic the ECM environment in vivo – more specially, cell membrane proteins known as
integrins act as receptors for RGD sequences, recognizing their ligands and binding with the
sequences to mediate cell-cell attachment and interactions [4, 5, 7]. The resulting µSL alginate
scaffolds had mechanical properties suited for musculoskeletal and cartilage applications [28].
Although this is an incredible feat in the realm of tissue engineering, the necessity of synthetic
polymers and functionalization with RGD sequences still creates drawbacks when considering
the biodegradability and biocompatibility of the resulting tissue scaffolds.
Chitosan is another polysaccharide (sugar) composed of D-glucosamine and N-acetyl-D-
glucosamine, and is commonly extracted from the exoskeleton of crustaceans and insects [26].
Chitosan has also been utilized in extrusion-based printing, but with limited cell viability (~75%)
[2, 5]. For µSL chitosan has been hybridized with PEGDA in order to create ear-shaped scaffolds
with 50 µm pore sizes for cartilage regeneration [29]. Once again, since chitosan is a natural
polymer it mimics ECM characteristics in order to promote cell growth. PEGDA was chosen for
its ease of processing with µSL. However, as expected the presence of PEGDA limited the
biocompatibility and biodegradability of the scaffold and increased the mechanical
strength/rigidity of the resulting scaffolds [29]. Although, chitosan is inherently biodegradable so
it promotes degradability within the scaffold with the limitation of non-degradable PEGDA.
Hyaluronic acid (HA) is also another polysaccharide. Additionally known as hyaluronan, HA is a
glycosaminoglycan (GAG) found in mammalian tissues (particularly mammalian connective
tissue: cartilage, ligaments, and tendons) [26, 28]. GAGs are long chains of disaccharide units

12
with side groups that link collagens to form a network of ECM [26]. This characteristic of HA is
what makes it a potentially attractive biomaterial for use in µSL. Unlike alginate and chitosan,
the µSL applications of HA have been explored more extensively [list refs here]. Suri et al
reacted HA with glycidyl methacrylate to produce GMHA, a photoactive HA due to the added
methacrylate groups [30]. Although no mechanical data was reported, tubular “nerve guides”
were created using a µSL technique. Even though HA is a biomaterial it is not inherently cell
adhesive and the resulting GMHA was modified with cell-adhesive peptides and proteins to
promote cell growth. Other HA µSL feats included co-polymerizing HA with PEG [28]. The
addition of PEG increased the mechanical strength of the scaffolds, which were then intended for
cartilage repair [28].
Lastly, collagen, and its derivative gelatin, is one of the most widely used natural polymers in
regenerative medicine and tissue engineering [2, 4, 28]. Collagen is a part of the ECM and is
found in both hard and soft connective tissues, as it makes up 20-30% of the protein in
mammalian bodies [2, 5]. Collagen chains contain RGD residues that allow for cell-adhesion [2,
6, 26]. In addition, collagen is also biodegradable via the body’s natural enzymes [2]. Collagen
and gelatin contain enzymatic sites which matrix metalloproteinases (MMPs) can cleave and
allow for further expansion and proliferation of cells throughout the body [2]. What makes
collagen different than the previously mentioned natural polymers is its versatility. Collagen’s
mechanical properties are generally suited for wound-healing applications (particularly skin) and
other soft tissues unlike chitosan and HA which are generally used for cartilage repair [28]. This
makes collagen a versatile material in that it can be combined with other natural polymers like
HA to increase mechanical strength and enhance biocompatibility in harder tissue applications

13
[28]. Although almost all bio-AM utilizing collagen is extrusion-based or laser assisted, gelatin
(which is partially denatured collagen), can be used in SL and µSL applications [2, 5, 11, 31].
Gelatin is water soluble and forms physically crosslinked gels below 35°C. Although these gels
are not stable at physiological temperatures (37 °C), gelatin can be chemically crosslinked upon
modification to become thermally stable for bio-AM applications [5].
1.3.5 Biocompatibility and Cell-Material Interactions
When designing a tissue engineering and biomaterial scaffold, the intention is cells will populate
the scaffold and the body’s natural regeneration mechanisms will take over [7, 23]. In doing so it
is important to understand that cells depend on the diffusion of nutrients and waste to survive. In
the human body, the average inter-capillary distance is around 100 µm in order to support
diffusion of nutrients and waste in tissues [9]. It is also important to consider the average size of
a eukaryotic cell is around 25 µm, but mammalian cell sizes can range anywhere from 5-100 µm
[32]. Thus, being able to produce a 3D tissue engineering scaffold that mimics these natural
parameters would be ideal, and research regarding cell-scaffold interactions in 3D is pioneering
[4, 7, 11, 12, 23, 31]. What research has shown so far is 3D tissue scaffolds should aim to imitate
the ECM in vivo [7, 12, 31]. The ECM is a complex, heterogeneous network of structural
proteins and signaling molecules arranged in a 3D manner to provide structural support to living
cells. [12, 31]. Understanding the cellular microenvironment has become pivotal in
understanding how to enact the body’s natural regenerative processes (wound healing,
tissue/organ growth); and, developing 3D tissue engineering scaffolds is crucial to continue this
research [11, 12, 23, 31].

14
1.4 Gelatin and Gelatin Methacrylate
Gelatin is a natural biopolymer derived from collagen, making gelatin and any of its
modifications of particular interest for biomaterial development. GelMA (referred to in the
literature as methacrylated gelatin (MeGel), methacrylamide modified gelatin, gelatin
methacrylamide, or gelatin methacrylol as well) is a biocompatible and biodegradable polymer
that undergoes free radical polymerization in the presence of a photoinitiator and UV light to
create a hydrogel network [25, 28, 33]. Once crosslinked, GelMA is thermally stable at and
above physiological temperatures [25]. Being a derivative of collagen, GelMA contains RGD
sequences to support cell-adhesion and MMP sites to promote enzymatic degradation [25]. This
means GelMA does not require further functionalization with cell-adhesive ligands or proteins
like alginate or HA. Additionally, since GelMA is not co-polymerized (although it can be) with
PEG, the degradability and strength of resulting photocrosslinked hydrogels is not effected
unlike chitosan. The strength of GelMA hydrogels can instead be altered by increasing or
decreasing the concentration of a GelMA in solution, or varying the degree of modification of
GelMA during the synthesis [34]. The biocompatible, biodegradable, and mechanical properties
of GelMA have made it stand out among synthetic and natural polymers. However, the majority
of research conducted this far has been in drug delivery, micro-fluidics, cell-encapsulation, soft
lithography, and extrusion-based printing [25, 33, 35]. While GelMA has been utilized in µSL
applications, there is a gap in the literature in what qualifies GelMA 3D printing. This is because
3D printing of GelMA with SL or µSL techniques has not shown high complexity in the z-
direction of printing. However, before delving into this gap in the literature, a few more of the
basics of GelMA will be covered including: GelMA synthesis, µSL resin development, and
photoinitiator concerns. All of these categories are relevant to the gap in the z-direction because

15
they impact the reactivity and characterization of the result GelMA resins to be tested.
Researchers have been grappling with modifications to GelMA itself, modification to the GelMA
resin produced, and concerns with crosslinkers and photoinitiatiors that ultimately affect the
fidelity of a 3D print. This has led to less complex “3D” scaffolds in terms of their z-height that
needs to be addressed and improved upon with GelMA and µSL applications.
1.4.1 Synthesis of GelMA
GelMA undergoes a facile synthesis in which gelatin is combined with methacrylic anhydride
(MA) in water or phosphate buffered saline (PBS) at 50°C [24, 35]. During this process the MA
monomers are reacted with the lysine and hydroxyl lysine side groups on the gelatin backbone
(Figure 1-3) [24]. This synthesis is commonly referred to as a “one-pot” synthesis, and was
originally developed by Van Den Buckle et al in 2000 (and has remained unchanged) [36].
Figure 1-3. GelMA Synthesis Scheme. Figure reproduced with publisher’s permission [35].
To confirm the resulting GelMA product HNMR is used (Figure 1-4). The reduction in peak a,
and appearance in peaks b, c, and d correspond to GelMA. One interesting property of the
synthesis of GelMA researchers may control is the percentage of methacrylate side groups per
volume. This is known as the degree of functionalization (DF), substitution (DS), or
methacrylation (DM) and can be quantified via colorimetric assays or HNMR [24, 34, 35]. Most
batches of synthesized GelMA range between a DS of 20 ~ 80%, however, Shirahama et al has
recently improved the GelMA synthesis to consistently obtain DM over 90% [35]. A higher DS

16
correlates to faster curing and higher mechanical strength GelMA [34-36]. Another way to
increase the curing kinetics and mechanical strength of GelMA is to increase the w/w or w/v
percentage of GelMA in solution. A higher concentration of GelMA also correlates to faster
curing and higher mechanical strength/moduli [36]. The exploration of various GelMA solutions,
or resins, for use in µSL has allowed for potential expansion of the repertoire of printable
biocompatible µSL materials, and for further understanding of 3D tissue engineering
environments.
Figure 1-4. (A) HNMR of gelatin. (B) HNMR of GelMA. Figure reproduced with publisher’s
permission [37].
1.4.2 Development of a µSL resin
To create a photocurable resin for µSL generally requires five components: a monomer with
photoactive side groups, a solvent to form the solution/resin, a photoinitiator to initiate the
crosslinking reaction, a photoabsorber (also known as a UV blocker) to aid in controlling layer
thickness/scaffold resolution, and any additional components required to alter the resulting
resin’s characteristics (such as diluents to reduce resin viscosity) [3, 9, 11, 14, 15]. With GelMA,
a common photocurable resin consists of: GelMA, water or phosphate buffered saline (PBS,
solvent), and Irgacure 2959 (photoinitiator) [25, 33, 35]. The curing mechanism behind this type
of GelMA resin is shown in Figure 1-5. The reaction is known as free-radical polymerization,
where an intermediate is created by irradiation of the photoinitiator and crosslinking follows [3].

17
Figure 1-5. Crosslinking of GelMA in the presence of UV irradiation,
Irgacure 2959 and PBS to create a hydrogel network. Figure reproduced with publisher’s
permission [35].
If the monomer itself is not already one biocompatible concern, then developing a biomaterial
that is soluble with a photoinitiator, UV blocker, and any additional components can add
additional challenges. Diluents combined with natural photopolymers have led to toxic by-
products upon leaching or degradation. The selection of resin components is crucial for
processing with µSL. GelMA has already been established as a viable biomaterial, but
photoinitiators and UV blockers are synthetic materials that can introduce toxicity when trying to
use GelMA in bio-AM applications.
In µSL, common sources of toxicity that can reduce a resin’s biocompatibility include: trapped
unreacted monomer (after crosslinking), residual photoinitiator, residual UV blocker, residual
solvent (if organic and cytotoxic), high concentrations of photoinitator, high concentrations of
UV blocker, and byproducts of polymer degradation [11, 28]. Balancing all of these components
is critical to developing a successful µSL resin. Using GelMA, PBS, and Irgacure 2959 as an
example of how these components influence the resulting resin, one might experience the
following scenarios: if there is too much PBS, the methacrylate volume would be reduced and
the resin might not cure… increasing the amount of GelMA is an option, but then the resin
viscosity would increase and the resin could not be processed using µSL… adding more Irgacure
2959 might reduce the crosslinking time, but might cure a thicker layer of material, and could

18
reduce the resulting scaffold’s biocompatibility due to leaching of unreacted Irgacure 2959 or
unreacted monomer since the total crosslinking is not 100%… and lastly, a UV blocker could be
introduced to reduce layer thickness, but since it absorbs UV irradiation it would slow down the
crosslinking process and potentially introduce a toxic element to the resulting scaffold.
1.4.3 Additional Printability Considerations: The Photoinitiator
Of all of these components the one that garners the most concern is the photoinitiator [28]. This
is because, photoinitiators are inherently cytotoxic and they tend to be non-water soluble [28].
There are ways to combat this issue, particularly a wide variety of photoinitiators are available
for µSL applications, but each photoinitiator has its advantages and disadvantages. With GelMA
and µSL, the following photoinitiators have either been used, or are worth mentioning for the
purposes of this research: 2-hydroxy-l-[4-(hydroxyethoxy)phenyl]-2-methyl-l-propanone
(Irgacure 2959), 2,2-dimethoxy-2-phenylacetophenone (Irgacure 651, DMPA), lithium phenyl-
2,4,6-trimethylbenzoylphosphinate (LAP), 2,2'-Azobis[2-methyl-N-(2-hydroxyethyl)
propionamide] (VA-086), and Eosin Y/Triethanolamine/l-vinyl-2-pyrrolidinone (EY) [28, 38].
The choice of photoinitiator tends to come down to two things: the light source being utilized on
the µSL apparatus (the wavelength required for the photoinitator to release an intermediate for
the crosslinking reaction to occur) and the solvent to dissolve the photoinitiator. Of course, the
biocompatibility of the photoinitiator is important as well because even though photoinitiators
are cytotoxic, some are less toxic than others [28]. Irgacure 2959 is one of the most common
photoinitiators and is used in almost every photocuring application of GelMA [25, 28, 33, 35,
36]. This is due to it being the least cytotoxic of the family of Irgacures and is water soluble [28,

19
38, 39]. However, most applications with GelMA and Irgacure 2959 are better suited for 2D
applications such as biopatterning and microfluidics [40-42] as Irgacure 2959 is considered a
“weak” photoinitiator with a broad absorbance spectrum and long exposure times compared to
other photoinitiators [25, 43, 44]. This is acceptable for 2D applications because the thickness of
the resulting components is generally less than 1 mm and the resulting components do not
require complex pore shapes or sizes. For example, Kolesky et al utilized extrusion-based
printing with GelMA, Irgacure 2959, and PBS to create 2D vascular constructs for various cell
types [41]. The scaffolds produced by Kolesky mimicked vasculature and some microfluidic
device applications, and in the XY direction were greater than 2 mm, however, no analysis on
the z-direction was reported. Also, no fidelity analysis of the filament extrusion or deviation
from .STL or CAD file was reported. Only few representative images of scaffolds were shown,
without any further fidelity quantification. Additionally, they claim to use this same resin to
create a heterogeneous 3D tissue construct, but from their images the height of each scaffold is
less than 1 mm. Due to the limitations of their extrusion-based printer, the pore sizes of the
resulting tissue constructs were 200 µm (however, for their desired application this was
sufficient). Bertassoni et al also utilized GelMA, Irgacure 2959, and PBS for extrusion based
printing of HepG2 (liver cells) and NIH3T3 (skin cells) bioinks to create “3D” architectures [42].
Cell viability was sufficient, but the paper does not show side or isometric views of their
resulting architecture, so a z-dimension is missing, and their scaffold pore size was 500 µm. The
cure times of their constructs averaged around 60 s. If µSL was used, a potentially more complex
structure could be manufactured with a low cure time and 3D shape with a z-dimension greater
than 1 mm. While the use of Irgacure 2959 in µSL has not proved to be entirely viable, it has
produced 3D scaffolds with heights higher than 1 mm. Ovsianikov et al demonstrated this with

20
their two photon printing (2PP) of GelMA (they refer to it as GelMOD), Irgacure 2959, and PBS
resin [44]. 2PP is a type of µSL that utilizes a single laser that rasters across the resin instead of a
projecting each layer with a dynamic mask [44]. The 2PP apparatus used emitted light at 515 nm,
and Irgacure 2959’s wavelength is close to the half-wavelength emitted by that source, making it
a suitable choice for their setup. The authors were able to successfully cure ~2.5 mm tall
scaffolds. Printing one scaffold took 5 hours and no quantification of fidelity in comparison to
the intended CAD file was reported. Although a perceivable 3D scaffold was produced, the pore
size and architecture did not fully display the capabilities of µSL, and could be theoretically
produced using extrusion-based techniques. Also, 5 hours to produce one scaffold is an
incredibly long time especially considering the scaffolds were nearly 3 mm tall. However, the
authors were able to successfully adhere bone cells to the scaffolds to demonstrate its
biocompatibility. Irgacure 2959 is definitely a good choice of photoinitiator for GelMA
applications, but might be best suited for 2D applications due to its limitations in photoactivity
and cure time. Testing alternative photoinitiators is an option to overcome these limitations.
DMPA is another photoinitiator with 3D printing and bio-AM applications [3, 28, 38, 45, 46].
DMPA has wavelength peaks at 240 and 350 nm, is non-water soluble, and more cytotoxic than
Irgacure 2959 [28, 38, 39]. Due to its insolubility in water and cytotoxicity, DMPA tends to be
used with synthetic polymers instead of natural ones, but has been used with GelMA [45-48].
However, not all of these applications were µSL based. A purely synthetic example was
demonstrated Chan-Park et al [48]. In this paper, novel diacrylated triblock macromers were
produced and micropatterned using soft photolithography. This lithography technique is similar
to µSL, but a 3D construct is not produced, thus it is a 2D approach. However, from this the

21
authors noted that cure times of their novel macromers with DMPA ranged from 7-56 s. This fast
cure time is already a huge improvement over Irgacure 2959. Additionally, the authors proved
cell-adhesion to some of their novel macromers after rinsing them with acetone to remove any
remaining uncured macromer, immersing the samples in a 70:30 ethanol water solution for 3
days, and then rinsing the samples with PBS before proceeding to cell culture. These washing
steps were necessary to rid the samples from any unreacted or residual toxic components and
promote the idea that although DMPA may be more cytotoxic than Irgacure 2959, it still has
shown cell viability. Chartrain et al displayed the use of DMPA with a biodegradable
photocurable polyester using µSL [47]. The resulting 3D scaffolds had larger pore sizes (400 x
800 µm), but 7.5 s cure times per 100 µm layer with the inclusion of a UV blocker in the printing
resin. The paper also showed the exclusion of the UV blocker ended up in the pores filling up,
i.e. a reduction in print resolution, but a faster cure time of 1.5 s per 100 µm layer. Additionally,
a 1 day cell culture study demonstrated the printed material had higher viability than tissue-
culture treated polystyrene with a 2 w/w % concentration of DMPA. The fast cure time of
DMPA makes it an incredibly attractive photoinitiator for µSL applications, however its water
insolubility is its biggest drawback. Because of this, DMPA must be dissolved with harsh
organic solvents like acetone or NVP, which introduce a toxic component to the printing resin
[39, 46, 48]. The water insolubility of DMPA also makes µSL applications with GelMA and
DMPA almost non-existent since harsher solvents like isopropyl alcohol or acetone are used to
dissolve DMPA alternatively, and gelatin will precipitate in these solvents [49]. Kim et al used
SL with a 365 nm light source to make poly(ethylene glycol) dimethacrylate (PEGDMA) and
GelMA nanopatterned cell culture substrates to model a vascular environment [45]. Although
this is a 2D application of GelMA with DMPA, their results showed tunable mechanical, cell-

22
adhesive, and degradation properties of the cured patterns based on GelMA and PEGDMA
concentrations. Skardal et al utilized methacrylated hyaluronic acid (HAMA) and GelMA (which
they refer to as GEMA) to create a HAMA-GEMA bioink for use in extrusion-based printing
[46]. The results showed the resulting resin supported the growth of HepG2 and NIH3T3 cells
and did not initiate an inflammatory response when injected under the skin of nude mice. The
authors also produced a “3D” tubular structure, but the paper does not depict the height of the
desired shape. The authors admit the structure lacks complexity and could be improved upon, but
demonstrated the potential viability of this bioink for AM applications. DMPA definitely has its
advantages and disadvantages over Irgacure 2959, and could show future adaptions in µSL of
GelMA.
Of the remaining photoinitiatiors mentioned, LAP and EY have all shown SL techniques with
GelMA, while VA-086 has only shown 2D micropatterning with LED light [43, 50-53].
However, from the “3D” printing works, a gap still remains in the literature of what constitutes a
true 3D printed scaffold. Fairbanks et al used LAP in comparison with Irgacure 2959 to create
PEGDA hydrogels using a 365 nm light source [43]. Their results revealed solutions with LAP
had a cure time that was 1/10 of those with Irgacure 2959. This demonstrated LAP’s advantages
over Irgacure 2959 as a more efficient photoinitiator that is also biocompatible and water soluble
[28, 38]. However, the resulting hydrogels were still 2D films. PEGDA was also studied with the
addition of cellulose nanocrystals (CNCs) in a µSL system with LAP in order to increase the
mechanical properties of PEGDA scaffolds [54]. In this applications the authors were able to
produce high complexity “butterfly” scaffolds and even a reproduction of a human ear, the 3D
printing fidelity was definitely displayed but the authors included no biocompatibility studies

23
regarding their resulting printing resin [54]. However, both of these µSL applications with LAP
were demonstrated with PEGDA, not GelMA. There is room for expansion and exploration of
GelMA LAP photocureable resins with µSL applications.
Taller structures with GelMA and LAP in µSL have yet to be reported on. Most applications are
in micropatterning or 2D SL, not µSL fabrication. One example comes from Monteiro et al,
these researchers explored the use of LAP over Irgacure 2959 in dental applications of GelMA.
The authors showed that LAP exhibited less cytotoxicity compared to Irgacure 2959 when cured
with a dental light due to the differences in the absorption peaks of the photoinitiators [55].
Additionally, the authors note increasing the concentration of LAP increased the cytotoxicity of
the GelMA resin. However, in Monteiro et al no 3D scaffold or structure was produced, thus
LAP could further be studied in µSL to expand the literature regarding 3D printing GelMA. EY
was also tested as a water soluble photoinitiator that is less cytotoxic than Irgacure 2959 and has
a peak wavelength at 514 nm [28, 38, 50, 51]. In their Master’s thesis, Wang set out to create a
novel photocurable resin to be 3D printed using a visible light µSL system and printing resins of
GelMA-PEGDA and GelMA with EY as the photoinitiator [50]. The GelMA-PEGDA resin
exhibited higher mechanical properties but less cell adhesion than the GelMA resin. The
resulting scaffold produced, however, did not display a high resolution. Instead a simple lattice
structure was produced with 1 cm square pores, and did not contain a z-axis measurement or
fidelity analysis. In another recent Master’s thesis McColl set out to do the same thing as Wang
experienced similar results [51]. The resin McColl used was nearly identical to that of Wang and
so was the visible-light based µSL system. However, McColl strictly focused on 3D printing a
resin with GelMA, and admitted that their produced scaffolds did not significantly improve upon

24
current GelMA 3D printing. McColl was unable to provide any images indicating the z-height of
their scaffolds, but claimed their scaffolds were less than 2 mm tall. Additionally, the resin cure
time ranged from 60-120 s using EY. Both McColl and Wang did not analyze the fidelity of
their prints produced, or measured any tolerances of their µSL system.
Lastly, since µSL applications with VA-086 and GelMA cannot be found, it is not the most
viable photoinitiator for this application. Billiet et al demonstrated extrusion-based printing of
GelMA with VA-086 as a photoinitiator [56]. The resulting scaffolds ranged from 1 ~ 3 mm in
height. Much like Ovsianikov et al demonstrated “tall” scaffolds of GelMA with Irgacure 2959,
the resolution limits of the printing technique or resin prevent any demonstration of highly
complex GelMA scaffolds. However, the authors of Billiet et al were still able to create a 3D
construct using GelMA and VA-086 that exhibited cell viability with HepG2 cells which is a feat
in itself. As far as the literature is concerned, a representation of µSL printing GelMA scaffolds
greater than 2 mm in height, with a quantifiable comparison to the intended CAD or .STL file
does not exist. This section has outlined numerous attempts utilizing various types of
photoinitiators, which was a key consideration for µSL GelMA material development.
1.5 Thesis Aims
The overall goal of this work is to develop a novel GelMA resin that will improve on the
previously discussed µSL applications of GelMA. Improvements would mainly be defined as a
reduction in cure time, increase in scaffold height, and increased scaffold geometry/resolution
displayed in the literature. Additionally, providing a quantifiable method to characterize print

25
fidelity in µSL is a concern. Since GelMA is regarded as a biocompatible material, the
biocompatibility of the resulting resin will be assessed but is not a main concern. These
improvements are broken down into the following specific aims:
1. Develop a novel GelMA resin that can print a 3D scaffold with a height greater than 2
mm. This resin should also improve on the overall cure time of the scaffold produced.
2. Display the complexity of µSL with this novel GelMA resin by being able to produce a
scaffold with porosity and pore sizes less than 500 µm, and a layer thickness less than
200 µm
In order to address the first aim, the literature has shown a variety of GelMA compositions.
Some compositions include additional monomers like PEGDA to improve printability, or UV
absorbers to improve feature sizes. Ideally a resin containing only GelMA would display an
improvement on current resins in the literature, but other monomers may be explored as this
approach is common. Additionally, it is clear from the literature Irgacure 2959 is not the most
efficient photoinitiator. Although a 3D scaffold of GelMA has been produced with Irgacure
2959, it took 5 hours to produce. A resin that can incorporate DMPA or LAP as the
photoinitiator should demonstrate a lower cure time. The immediate issue with using DMPA is
that it is not water soluble so other solvents for GelMA and DMPA may have to be explored. To
measure the first aim the following techniques will be employed: optical microscopy, photo-
rheology, photo-DSC (differential scanning calorimetry). Optical microscopy will be used to
measure scaffold height and printed feature sizes. Photo-rheology is a technique that measures
the storage modulus over time of a material as it cures under UV exposure. Photo-rheology
provides insight into the viscoelastic properties and cure time of the resin. The time (in seconds)
it takes the modulus of stiffness (G’) to reach constant value, indicates the cure time. Photo-DSC

26
is another valuable technique that provides insight into the cure time and curing kinetics of the
resin. Photo-DSC measures the heat of reaction of the resin over time, and produces a peak once
the resin has fully cured. The time in which this peak occurs corresponds to the cure time. The
area underneath the curve can be measured to quantify the specific heat of the material.
Typically, a large exotherm would correspond to a very reactive resin [57]. A working curve will
be developed to determine the layer thickness and exposure time of the material for the printing
process. A working curve plots the layer thickness as a function of UV exposure. To measure
this, a thin layer of resin may be cured at the surface for a specified amount of time and then
measured using a micrometer to determine its thickness. In altering the exposure, varying
thickness measurements can be taken and a plot can be developed. This plot gives insight into
what type of layer thickness can be expected from a print as well as proving insight into what
type of exposure time would generate a certain layer thickness. Developing a working curve is
necessary for both aims 1 and 2.
To address the second aim: the literature thus far has not provided a GelMA containing scaffold
with layers less than 200 µm. Although porous 3D GelMA scaffolds have been produced with
extrusion, with µSL the porous structures produced are not 3D and do not display heights greater
than 2 mm. These marginal values provide a good baseline for an improvement on the literature,
and would potentially provide researchers insight on how µSLA feature sizes can be tailored. In
order to reduce the layer thickness or increase the resolution of the 3D scaffold, it is likely that a
UV blocker will be incorporated into the resin. Ideally the UV blocker would be water soluble
and non-toxic to cells. To measure the pore size and layer thickness, and quantity print fidelity,
optical microscopy will be used. Optical microscopy can measure the feature sizes immediately

27
after a scaffold is produced. Though it may not be as precise as scanning electron microscopy
(SEM), it is more accessible and SEM has been deemed outside the scope and scale of this work.
Beyond these aims, additional characterization techniques will be employed in characterize the
properties and performance of the developed GelMA resin. Swell testing will be necessary to
understand the water content and hydrogel properties of the resulting resin. Cell studies will be
performed to measure the biocompatibility of the cured resin and observe any cytotoxic
response.
The importance of µSL is it can fabricate complex scaffolds with feature sizes similar to in vivo
cellular environments, but lacks a repertoire of biomaterials to do so. Potential applications for
high resolution scaffolds include: precise anatomical models for pre-surgical planning, wound
healing (skin substitutes), organ regeneration, and drug delivery [11]. GelMA has already been
identified as a biocompatible and biodegradable photocurable material, making it an ideal
candidate to increase the current repertoire of synthetic and natural available µSL materials.
Quantifying and characterizing a novel photocureable GelMA resin is a necessary and significant
contribution to current work that has yet to report structures greater than 2 mm in height and
measure the fidelity and repeatability of printed scaffolds.

28
Chapter 2: Materials and Methods
Based upon the previous literature review (Chapter 1), several resins were explored before
choosing GelMA as the focus of this research. Appendix A outlines these other resins. In
general, the GelMA resin was developed in the following way:
1. GelMA synthesis and characterization via nuclear magnetic resonance (NMR)
spectroscopy,
2. Photo-curable resin formulation development, photo-rheology, photo-Differential
Scanning Calorimetry (DSC),
3. Cured film fabrication and swell-testing,
4. 3D Printing development with working curve, 3D printing and optical microscopy
analysis
5. Cell culture.
Photo-DSC and photo-rheology are relatively new, thus these techniques are not currently
reported often. The authors believe this type of instrumentation would offer additional insight
into the resin development and so it was decided to utilize these tools in order to further
characterize the photo-curable system as well as adding to the repertoire of printability analyses
available in literature.

29
2.1 Materials
The following materials for this work were purchased from Sigma Aldrich and distributed from
the United Sates: GelMA was produced from type B gelatin (200 bloom), and methacrylic
anhydride (MA); NMR was performed on GelMA using deuterium oxide (D2O) (99 atom %);
GelMA films and 3D prints were cured with 2-Hydroxy-4-methoxybenzophenone-5-sulfonic
acid (sulisobenzone, UV blocker) and Lithium phenyl-2,4,6-trimethylbenzoylphosphinate (LAP,
photoinitator); Mouse fibroblasts, NIH/3T3, ATCC® CRL-1658™ were cultured in ⍺-MEM
supplemented with 10% fetal bovine serum (FBS), 1% penicillin streptomycin, and amphotericin
B and cleaved with trypsin-EDTA (0.5%). The following materials were purchase from Gibco
Sciences (USA): phosphate buffered saline (PBS) was used to make GelMA as well as culture
cells. The following materials were purchased from Thermo Fischer and distributed in the United
States: dialysis was performed on GelMA with SpectraPOR 4 dialysis tubing (12-14 kD MWCO,
75 mm Flat-width) and deionized (DI) water. Trypan blue was used to count cells and qualify
viability, while 4′,6-diamidino-2-phenylindole (DAPI) and Texas Red sulfonyl chloride were
used to stain GelMA films post cell studies for confocal imaging (Thermo Fischer, US). Lastly
the [3-(4,5-dimethylthiazol-2-yl)-5-(3-carboxymethoxyphenyl)-2-(4-sulfophenyl)-2H-
tetrazolium (MTS) assay was used to quantify cells for proliferation and mitochondrial activity
and purchased from Promega (USA). All chemicals were used as purchased with no further
purification.

30
2.2 Gelatin Modification and Verification
2.2.1 Gelatin Methacrylation
Gelatin was modified by adapting previously published protocols [25, 33, 35, 42]. Briefly, 10 g
gelatin was dissolved in 80 mL PBS on a hot plate with rapid stirring at 60 °C. Once the gelatin
was fully dissolved, 20 mL MA was added and stirred vigorously at 1300 rpm. The temperature
and stirring were maintained overnight to allow for complete reaction. The following day the
solution was moved to dialysis tubing and placed in excess DI water with stirring at 150 rpm.
The dialysis water was changed 3 times on the first day, and twice every day thereafter until the
solution appeared clear/pale-amber in color (4 – 7 d). After the solution was dialyzed, it was
centrifuged at 1500 rpm for 10 min and the supernatant was collected. The resulting GelMA
solution was then frozen overnight at -4°C and lyophilized the following day for 3 d to yield a
purified white foam-powder. The GelMA product was stored in a freezer at -80°C with desiccant
for future use.
2.2.2 NMR Spectroscopy
1H NMR (500 MHz Prodigy, Bruker, US) was used to determine the degree of methacrylation
(DM) of GelMA (also referred to as the degree of substitution, DS). First, 50 mg GelMA was
dissolved in 1 mL 99 atom % D2O at 40 °C. 1 H NMR was performed at 64 cycles and 400
MHz. Plain gelatin was run for a control. From the resulting spectra the degree of methacrylation
was determined by integrating the GelMA spectrum at 2.9 ppm (lysine methylene signal) after
normalizing the GelMA spectrum with respect to the plain gelatin using the phenylalanine peak
at 7.2 ppm. Next, the area was integrated from 7.0 – 7.5 ppm (phenylalanine), then the lysine

31
methylene signal was integrated from 2.85 – 2.95 ppm. The reduction in the peak at 2.9 ppm
corresponds to the degree of methacrylation [25, 35]. Gelatin modification can also be confirmed
by the appearance of methacrylic functional groups at 5.4 and 5.6 ppm, in addition to the
appearance of a methyl functional group at 1.9 ppm. The following equation was used to
calculate the degree of methacrylation (where DS refers to degree of substitution, an A refers to
the area beneath the peak from the NMR spectra):
(Equation 2-1) [37]
2.3 Photo-curable Resin Formulation
Each GelMA resin shown in Table 2.1 was created by a weight by weight (w/w %) measurement
of the starting polymer (GelMA) to the total solvent weight (DI water). For example, a 10 mL
printing resin of 20% GelMA with 0.5% sulisobenzone would consist of the following: 8 g DI
water, 2 g GelMA, 0.05 g sulisobenzone and 0.05 g LAP. For all GelMA resins, the
concentration of LAP was held at 0.5%. The 3D print resins were produced by first dissolving
the sulisobenzone and LAP in DI water (stirred at 40 °C). Then, the respective GelMA amount
was added to the beaker. The beaker was covered in Parafilm® and stirring was reduced to 60
rpm until the solution was a uniform amber color with no bubbles (approx. 1 hr.).
Table 2-1: GelMA resin formulations GelMA (w/w %) Sulisobenzone (w/w %) LAP (w/w %)
L-GelMA 1 10.0 0.5 0.5
L-GelMA 2 10.0 1.0 0.5
M-GelMA 1 20.0 0.5 0.5
M-GelMA 2 20.0 1.0 0.5
H-GelMA 1 30.0 0.5 0.5
H-GelMA 2 30.0 1.0 0.5

32
2.3.1 Photo-Rheology
A TA Instruments Discovery Hybrid Rheometer with a UV Source attachment was utilized to
perform photo-rheology on GelMA resins at 22 °C. A parallel plate setup was used and GelMA
resins were pipetted directly onto the quartz crystal surface of the rheometer, any excess material
was removed once the gap was closed. The experiment was setup with a 30 s delay in which the
shutter was closed. After 30 s the shutter opened to expose the resin to a light intensity of 9
mW/cm2 (the minimum intensity of the UV light source). The light intensity was confirmed
before the experiment using an irradiance meter. Samples were run at a strain of 0.3% and
frequency of 2.0 Hz. The total time of each experiment was 300 s. The same light source used
for photo-rheology was also used for photo-DSC (OmniCure® Series 2000). The experimental
procedure was adapted and referenced from Golaz et al 2012 [57].
2.3.2 Photo-DSC
A TA Instruments Discovery DSC with a photocalorimeter accessory (PCA) was utilized to
perform photo-DSC on GelMA resins at room temperature. Using Tzero DSC pans, 15 – 20 mg
GelMA resins samples were tested. First an isotherm was set for 1 min at 20 °C prior to the
shutter opening. The experiment proceeded for 3 min after which the shutter was closed and an
additional isotherm at (20 °C) proceeded prior to ending data collection. The experimental
procedure was adapted and referenced from Golaz et al 2012 [57].

33
2.4 Film Fabrication and Swelling
2.4.1 Film curing
To create films for use in swell testing and cell culture studies a silicone casting mold was used.
The silicone mold consisted of three pieces: a top flat layer, a middle layer with multiple punches
of 14 mm diameter discs, and a bottom flat layer. Each resin was pipetted into the mold until it
filled the perimeter (approx. 250 μL). Then, the top sheet was rolled over the film to ensure no
bubbles were present and the disc was flat on both sides. A 365 nm UV lamp (OmniCure® UV
LED head, 15W/cm2) was used to cure the films for 30 s on each side. After cured, the top and
middle layers of the mold were removed to reveal films approximately 14 mm in diameter and 1
mm in thickness.
2.4.2 Swell Testing
Swell testing was performed on all GelMA films. The films were weighed immediately after
fabrication to obtain their bulk weight. A micrometer and caliper were also used to determine
their average thickness and diameter. The films were then submerged in PBS and allowed to
swell overnight at 22 °C. The swollen weight of the films was then measured. Since the films are
more fragile once swollen, their dimensions were not able to be measured wet. After this, the
films were then transferred to a petri dish and placed in a vacuum oven at 60 °C for 12 hr to
obtain the dry weight. The percentage of water in the films was determined as a function of the
swollen weight (Ws) and dry weight (Wd). The following equation was used:
Swelling (%) = (Ws – Wd) / Wd × 100 % (Equation 2-2) [37].

34
2.5 3D Printable Resin Validation
2.5.1 Working Curve
A working curve is used to determine the critical exposure (Ec) and depth of penetration (Dp) of
photoactive polymer resins [3]. The equation is based on the Beer-Lambert law of absorption and
is defined as:
Cd = Dp ln(E ⁄ Ec) (Equation 2-3) [9].
This equation relates the exposure of light delivered at the prepolymer surface (E) to the depth at
which the prepolymer is crosslinked, also known as the cure depth (Cd). The minimum exposure
required to begin polymer crosslinking is the critical exposure (Ec). The working curve gives
insight to the amount of UV energy required for photopolymer curing. Therefore, GelMA resins
were exposed to a series of exposure times, ranging from 500 ms to 3000 ms, at the resin surface
and then the thickness of the resulting polymer film was measured using a micrometer. The
thickness at each exposure was then plotted on a semi-log plot. Typically working curves display
a linear relationship between the cure depth and the natural log of exposure. The critical
exposure was then determined by the resulting curve’s x-intercept. The depth of penetration was
determined by the slope of the resulting curve.
2.5.2 Mask Projection Microstereolithography (3D Printing)
An in-house LabView program was developed for the 3D printer and an .STL file of the desired
print structure was uploaded to the software prior to printing (Figure 2-1) [9]. The print file was a
4 x 4 x 5 (l, w, h) mm scaffold with 1000 μm pores, where 1-2 mm of the scaffold height was

35
incorporated as a raft. A raft (also referred to as burn-in layers) is an initial print area (or
additional printed section) of a scaffold that is printed in order to improve the overall fidelity of
the scaffold. The raft acts similar a sacrificial layer that sets up the printed area on top which will
be the true measured printing area. In the case of Figure 2-1, a raft was incorporated as an extra
layer of additional pores creating a rectangular shape instead of a square (not shown in Figure 2-
1, but an additional row of two 1 mm pores in the x, y, and z planes were incorporated at the
bottom of the scaffold).
Figure 2-1: Image of the .STL file for desired print structure.
Originally, the intended scaffold design was a scaffold with gradient porosity ranging from 200
μm to 1000 μm sized pores in order to address Aim 2 of this thesis: “Display the complexity of
µSL with this novel GelMA resin by being able to produce a scaffold with porosity and pore
sizes less than 500 µm, and a layer thickness less than 200 µm.” However, preliminary printing
discovered this print file could not be printed effectively, nor did the print file retain pore sizes.

36
The initial printed constructs could not successfully be reproduced, thus a simpler scaffold
design (Figure 2-1) was chosen and Aim 2 of this work was adjusted as follows, where the thesis
aims are:
1. Develop a novel GelMA resin that can print a 3D scaffold with a height greater than 2
mm. This resin should also improve on the overall cure time of the scaffold produced.
2. Display the complexity of µSL with this novel GelMA resin by being able to produce a
scaffold with porosity and pore sizes of 1000 µm, and a layer thickness less than 200 µm
In order to print, 10 mL of GelMA resin was placed into a small beaker and a build stage was
attached to the printer then lowered into the resin (see Figure 1.2 for a visual representation of
the overall printer). The UV light source (Ushio, Japan) used for printing had an intensity of 10
mW/cm2. Each layer was cured between 1 ~ 5 s depending on the GelMA resin. The resulting
layer thickness was set between 100 and 200 μm. Once the print was finished, it was removed
from the build stage and placed into warm water for several minutes to wash out any uncured
GelMA resin. The print was shaken lightly and a pipette was used to flush out the porous parts of
the structure. After gently washing, the 3D print was blotted with laboratory tissue paper to
remove any excess water prior to imaging. The prints were then imaged using an optical
microscope (AmScope™ 3.5X-180X Manufacturing 144-LED Zoom Stereo Microscope with
10MP Digital Camera). Isometric and planar images were taken via optical microscopy and the
pore size, layer thickness, and overall scaffold dimensions were measured to quantify 3D print
fidelity using the AmScope™ desktop software. A print was considered “good” or “bad”
depending on how much the pore size and layer thickness deviated from the .STL file of the
print. Rather than use qualitative adjectives to define the print, the fidelity was determined based

37
on a % deviation from the theoretical values of the .STL image (Figure 2-1), reported as the %
error. Since no such ranking system or print fidelity analysis currently exists for this particular
instrument and resin formulation, a ranking system was developed based off of the instrument’s
capabilities and/or limitations.
Paul Lambert’s thesis (2014), describes an in-depth system characterization which includes
tolerances of the designed µSL instrument as well as sources of instrumental error [9]. To
validate the developed µSLA printer, he tested a polypropylene glycol diacrylate (PPGDA)
photopolymer resin with 2% w/v DMPA as photo initiator and categorized tolerances in the XY,
XZ, and YZ directions. Two test prints were analyzed to determine the smallest resolvable
features that could be obtained by the system. It was determined the minimum feature size
obtained was 200 µm (XY) (with an error percentage of 5-8%), the minimum layer height
obtained was 20 µm (with an error percentage of 1-2%), and the maximum build volume was 6 x
8 x 60 mm [9]. Lambert comments these tolerances were subjective based on the part geometry,
resin formulation, and mechanical limitations of the instrument. The layer height tolerance was
based off the ability of the stepper motor (which controls the build platform) to precisely move
20 µm after each layer was recoated, Lambert did not test the minimum layer height to be
achieved with the PPDGA resin formulation, only as a function of the stepper motor used to
move the build platform during part fabrication. Lambert noted for this system, the z accuracy
was poor, reporting error percentages greater than 100% for YZ and XZ measurements. This was
attributed to the tested PPDGA formulation contained no UV absorber and the depth of
penetration was larger than the intended YZ and XZ features. Lambert did not measure YZ and
XZ tolerances with the addition of UV blocker, as the goal of his work was to benchmark the

38
tolerances of the system, not the resin formulation. However, upon the addition of Tinuvin 400, a
UV blocker, with increasing concentrations, Lambert reported the z-dimensional over cure was
reduced from 500 µm to nearly 5 µm at the highest concentration of Tinuvin 400 (this
corresponds to a reduction in 50% error to roughly 5% based off of Lambert’s intended scaffold
design). Lambert also reported at too high of UV blocker concentrations it was possible for
layers to under cure, reducing the intended z-height of a printed scaffold.
Additionally, although the minimum feature size was reported to be 200 µm, in practice 200 µm
size features may not be resolved. For this work, the intended pore sizes were 1 x 1 x 1 mm
(1000 µm in each direction) and the layer height was set to 100 µm. This should require 10
layers to resolve a 1 mm feature size. Across 10 cured layers, unless the resin formulation has
been optimized, the user may encounter under cure, over cure, and/or infill issues that would
reduce the overall print fidelity from the intended structures. This could potentially result in a
structure that has smaller or larger feature sizes based on resin formulation.
After taking the work of Lambert into account, and their validation of tolerance and % error for
this particular µSL system, it was decided the % error from the .STL file would be assessed
based off the % error in tolerances that Lambert discovered in order to assess print fidelity. Thus,
for resolvable features such as pore height (YZ), pore width (XZ), pore length (XY), scaffold
width (X), and scaffold height (Z), it was decided that < 10 % error would be deemed a “very
good” print, 10-20 % error would be deemed an “good” print, and > 20 % error would be
classified as a “poor” print. This was based off of the minimum feature size (XY) Lambert
reported. Although Lambert reported z tolerances for this system were greater than 100%, this

39
was due to the high depth of penetration of PPGDA and lack of UV blocker in the resin
formulation, so it is impractical to assess the z accuracy based off of reported z % error. The
GelMA resins tested in this work do contain UV blocker (sulisobenzone) which will alter the
overall z accuracy (as Lambert discovered with Tinuvin 400). Since Lambert found that the
tolerances for layer height were much more accurate (since this is a mechanical limitation of the
stepper motor), it was decided that for layer height measurements 1-5% error would be deemed
“very good,” 5-15% error would be “good,” and anything greater than 15% error would be
classified as “poor.”
2.6 Cell Culture
All cell culture experiments were performed on 1 mm thick GelMA films in 24-well plates. The
GelMA films were placed in PBS overnight, then washed 3 times with 70% ethanol, followed by
2 washes with PBS (1 hr each at 37 °C), and placed in media in the incubator (37 °C) overnight
prior to seeding. The media was removed prior to cell seeding at 2 x 10⁴ cells/well in 50 ~ 100
µL fresh media. The cells were allowed to adhere to films for 2 hr and fresh media added to a
total working volume of 500 µL. Cells were allowed to proliferate for 1 to 3 days. At each time
point, films (n = 3) were moved to a new 24-well plate and an MTS assay was used to quantify
cell number via UV-Vis spectroscopy at 490 nm [58]. The cell density of films was reported
using the obtained cell number divided by the surface area of the GelMA films (film diameter 14
mm). Qualitative analysis of the stained cells was used to gain insight into how the cells adhered
to the GelMA films in terms of their morphology and density. One film from each resin was

40
stained for nuclei and cytoskeleton actin formation via DAPI and Texas Red stains respectively
and visualized using a Zeiss Confocal Microscope.
2.7 Statistical Analysis
All experiments where run in triplicate (n = 3) including the 3D printed structures and image
analysis. Microsoft Excel was used to run one-way single factor ANOVA tests. If the test
revealed that F > Fcritical then it was determined that one or multiple samples do not belong to the
same population, thus there could be significance between groups. The Bonferroni approach was
then used with a post hoc test to further analyze groups. This approach included two sample t-
tests assuming equal variances that were run to compare within and between groups.
Significance was determined if p < 0.05. Not all experiments required statistical analysis. Results
are reported with significance markers as well as the average ± standard deviation.

41
Chapter 3: Results and Discussion
3.1 NMR Confirmation of Gelatin Modification
1H NMR utilizes an external magnetic field to aid in the determination of the structure of a
molecule and was used to confirm gelatin modification. The resulting spectra of gelatin and
GelMA were compared and integrated to determine the degree of methacrylation (the estimation
of substitution, DS, of methacrylate groups per amine group on the gelatin backbone). For plain
gelatin (Figure 3-1A), the peaks at a and b correspond to the lysine methylene and methyl
functions respectively, that will change upon methacrylation. New peaks appear at 5.6 ppm and
5.4 ppm (c and d respectively, Figure 3-1B) which correspond to methacrylic functions from the
acrylic protons. Additionally, peak b increases in intensity, corresponding to a methyl group;
while peak a decreases in intensity. This disappearance corresponds to a reduction in the lysine
methylene peak from plain gelatin at 2.9 ppm; suggesting lysine residues were reacted. Each of the
relevant peaks discussed were present in all of the spectra collected during experimentation, and a
total of 10 syntheses were performed to produce modified gelatin (GelMA) for this work. The
average batch size was approximately 10 g per batch, with a yield of 90% or more of GelMA.

42
Figure 3-1: Representative 1H NMR of A) Type B Gelatin as received and B) GelMA after
modification. The phenylalanine peak was used to normalize the spectra. Peaks a (2.9 ppm)
corresponds to lysine methylene signal and b (1.9 ppm) corresponds to the methyl signal. Peaks c
and d were observed at 5.6 and 5.4 ppm and correspond to methacrylic functions from acrylic
protons.
D2O
Phenylalanine
b
a
A)
D2O B)
a
c d
Phenylalanine
b

43
To determine the DS of GelMA, the two spectra from Figure 3-1 were first normalized using the
phenylalanine peak as reference. The area under 2.9 ppm was compared between the two spectra
using Equation 2-1 to determine the DS. The DS was found to be 54% +/- 4% across 10
syntheses and was considered to be a medium level of substitution. According to the literature
high DS is considered to be above 80%, while medium is around 50% and low is around 20%
[24, 35]. Some researchers have focused on the DS in order to optimize the total modification of
gelatin [24]. GelMA syntheses up to 95% DS have been reported [24]. However, for the
purposes of this research, the focus was not on the synthesis of GelMA. The goal here was to
modify gelatin in order to achieve enough methacrylate groups so a photoactive resin would be
created – this was achieved. Investigating the impact of DS on the resulting GelMA resins could
be future work. A higher DS corresponds to more methacrylate groups per volume. This in turn
would increase the reactivity of the resulting GelMA resin. A higher DS resin would also likely
have a higher molecular weight, which would contribute to an increase in viscosity of GelMA
resin [24, 25, 34, 48]. If the resin is too viscous the build stage would not be able to move and
curing consecutive layers would become difficult. Additionally, a higher DS may alter the gel
point of the resin. For µSL it is optimal to have a resin that prints at room temperature, so heating
and stirring are not necessary to maintain a homogenous solution or lower the solution viscosity.
Again, it was determined for the purposes of this research, 50% DS was suitable to produce 3D
printed constructs. However, the low concentration GelMA resins (L-GelMA 1 and L-GelMA 2)
did not create suitable printing resins. This could be a result of the DS. Achieving a higher DS
(around ~80%) may mean printing lower concentrations of GelMA (~10 w/w %) could be
achievable due to a higher volume of methacrylate groups.
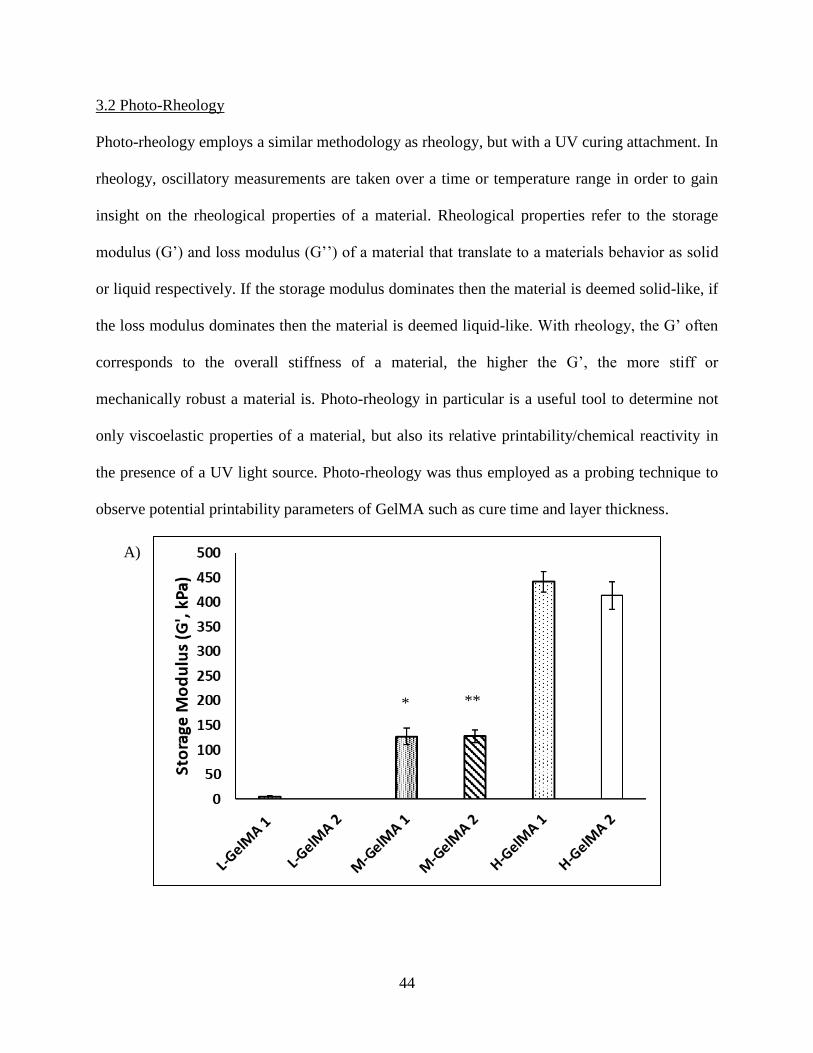
44
3.2 Photo-Rheology
Photo-rheology employs a similar methodology as rheology, but with a UV curing attachment. In
rheology, oscillatory measurements are taken over a time or temperature range in order to gain
insight on the rheological properties of a material. Rheological properties refer to the storage
modulus (G’) and loss modulus (G’’) of a material that translate to a materials behavior as solid
or liquid respectively. If the storage modulus dominates then the material is deemed solid-like, if
the loss modulus dominates then the material is deemed liquid-like. With rheology, the G’ often
corresponds to the overall stiffness of a material, the higher the G’, the more stiff or
mechanically robust a material is. Photo-rheology in particular is a useful tool to determine not
only viscoelastic properties of a material, but also its relative printability/chemical reactivity in
the presence of a UV light source. Photo-rheology was thus employed as a probing technique to
observe potential printability parameters of GelMA such as cure time and layer thickness.
A)
* **

45
Gel Point (sec)
L-GelMA 1 4.7 ± 0.11
L-GelMA 2 N/A
M-GelMA 1 3.1 ± 0.77***
M-GelMA 2 4.0 ± 0.25**
H-GelMA 1 1.9 ± 0.11*
H-GelMA 2 2.9 ± 0.28*
Figure 3-2: A) Photo-rheology data of GelMA samples (w/w %) (refer to Table 2-1 for exact
concentrations). M-GelMA 1 was significantly different than H-GelMA 1 and H-GelMA 2 (*p <
0.001) and M-GelMA 2 was significantly different than H-GelMA 1 and H-GelMA 2 (**p <
0.001). Both M-GelMA and H-GelMA resins were significantly different than L-GelMA resins
(p < 0.001), while L-GelMA 1 was significantly different than L-GelMA 2 (where no data could
be collected, this same trend applies to 3-2B)). B) The gel point was determined as the crossover
point between G’ and G’’ and was reported across all samples. H-GelMA 1 was significantly
different than H-GelMA 2 (*p < 0.05), while M-GelMA 2 was significantly different than H-
GelMA 1 and H-GelMA 2 (**p < 0.005), and M-GelMA 1 was significantly different than H-
GelMA 1 (***p < 0.05). Experiments were run in triplicate (n = 3) and reported as the average ±
standard deviation.
Figure 3-2A demonstrates with increasing GelMA concentration, the storage modulus (G’) of the
GelMA significantly increased (p < 0.001). This phenomenon is well described in the literature
[9, 18, 29, 50]. It was difficult to comparison the storage modulus among the literature, because
most research on GelMA quantifies mechanical properties of resins formed from 5, 10, and 15
w/w% respectively, without the addition of UV blocker and instead utilizing Irgacure 2959 as a
photoinitiator [18, 27]. Thus, the mechanical properties reported in this research are unique to
this particular system/formulations of GelMA resins. However, the trend in the mechanical
properties corresponds to that reported in prior literature. Nichol et al 2010 reports regardless of
altering the DS, at 10% and 15% (w/w) concentrations of GelMA, the compressive modulus of
their GelMA films increased with increased concentration of GelMA [35]. They also found at
consistent DS the compressive modulus of their films increased with increasing GelMA
concentration [35]. This indicated at certain concentrations of GelMA, the DS may not impact
B)

46
the mechanical properties, but the concentration will. Looking at rheological properties, Van Den
Bulcke et al 2000 investigated both the effects of gelatin and GelMA without photoinitiator and
with UV curing [36]. Their research showed at temperatures greater than 40 °C the physical
properties of gelatin and GelMA change as the physical network of gelatin “loosens” upon
reaching its melting point. However, as concentrations of GelMA increased from 10% w/v to
20% w/v the storage modulus of cured films of GelMA increased as well [36]. Van Den Bulcke
et al 2000 also reported an average storage modulus of approximately 10 kPA for GelMA films
produced at 15 w/v % and 40% DS [36]. In comparison to the results shown in Figure 3-2A, the
GelMA produced in this research is a 10 fold increase in the storage modulus and a trifold
increase upon that of 30 w/w % GelMA. This current work suggests the increase in storage
modulus for GelMA is exponential depending on the concentration. However, the synthesis
performed in this work was different than that used in Van Den Bulcke et al 2000 and previous
reported literature. The concentrations and DS explored in this research were higher than those
explored in Van Den Bulcke et al 2000. The trends observed from this work are consistent with
those across past literature, even though the material system and concentrations are novel.
As shown in Figure 3-2B, as GelMA concentration was increased, the gel point (time at which
the storage modulus supersedes the loss modulus) decreased (p < 0.05). This was attributed to a
higher concentration of photo-active (methacrylate) groups present within the higher
concentrations of GelMA. Also, when the UV blocker concentration was increased the gel point
increased for the H-GelMA formulations (Figure 3-2B). The UV blocker absorbs UV energy and
thus prevented the system from curing as fast, in turn raising the gel point. However, for M-
GelMA 1 and M-GelMA 2 resins only the GelMA concentration had an impact on the overall

47
cure time, not the concentration of UV blocker. This is suggested by the M-GelMA 2gel point
being significantly higher (**p < 0.005) than both H-GelMA 1 and H-GelMA 2. However, M-
GelMA 1 was only significantly higher (***p < 0.05) than H-GelMA 1, meaning that at a lower
concentration of GelMA and UV blocker, this resin may behave similarly to H-GelMA 2 in
terms of its gel point and potentially its printability parameters. This may indicate more UV
blocker would be required for this specific concentration to yield a significant effect on the
printability of M-GelMA resins.
Photo-rheology was also useful in gaining insight into the printability of the GelMA resins. Since
the gap height in the photo-rheometer is set to 0.5 mm, uniform 0.5 mm films cure, and when the
storage modulus reaches a constant value this was determined to be the full cure of the system.
Figure 3-3 shows this full cure occurred within 90 s for all GelMA concentrations. This gave
insight toward the overall print time and layer thickness to be expected from GelMA when used
in µSL. Since one of the primary goals was to produce layers less than 200 µm faster than
currently researched GelMA resins, the photo-rheology data gives preliminary data for what
parameters to set in the LabView program prior to printing. A cure time of 90 s per layer would
be far too high for reaching the desired print fidelity. This was a good indication of an
improvement on current µSL GelMA resins, because typical cure times are on the magnitude of
5 ~ 30 min for a print. This would correspond to 32 s exposure per layer based off of the
intended structure (see section 3.6). For this work, the highest cure time per layer was 1.6 s
(section 3.6) which is a massive improvement given the current state of the art.

48
Figure 3-3: Photo-rheology data of the average G’ of GelMA samples (w/w %). From bottom to
top, the lines represent M-GelMA 1 (blue), M-GelMA 2 (orange), H-GelMA 1(yellow), and H-
GelMA 2 (gray). The L-GelMA data was not included because these two formulations were
deemed unsuitable for further study. All experiments were run in triplicate (n = 3).
3.3 Photo-DSC
Like Photo- rheology, photo-DSC also utilizes the same principles of DSC, but with a UV curing
attachment. The photo-DSC gives insight into the curing reaction of photo active resins by
measuring the heat flow or energy required to fully cure a system over time. Since GelMA is
derived from a natural polymer, it is inherently less photoactive than synthetic materials such as
PEGDA and contains less photoactive groups. GelMA forms a hydrogel material, meaning >
80% of the structure is water, with synthetic resins this is the complete opposite, where > 80% of
the structure is monomer that can be cured, making synthetic resins much more photoactive.
Much like with photo-rheology, photo-DSC was used as a probing technique to gain insight
toward printability and functionality of GelMA resins. Figure 3-4A represents the heat flow as a

49
function of time for respective GelMA resins. L-GelMA resins were not included because their
heat flow was too low to display on the graph and they were deemed unsuitable for further
testing. The heat flow is negative, indicating an exothermic reaction and crosslinking. A negative
heat flow is common for these types of reactions as the resin has a lower heat flow than that of
the reference pan. The specific heat in Figure 3-4B is determined by integrating the area under
the heat flow graph in Figure 3-4A.
B)
*
A)
**

50
Cure Time (sec)
L-GelMA 1 38 ± 1.4
L-GelMA 2 50 ± 0.0
M-GelMA 1 33 ± 1.1***
M-GelMA 2 42 ± 4.2**
H-GelMA 1 34 ± 2.5*
H-GelMA 2 43 ± 4.3*
Figure 3-4: A) Representative Photo-DSC curves of GelMA samples (w/w %). From bottom to
top, the lines represent M-GelMA 1 (blue), M-GelMA 2 (orange), H-GelMA 1 (yellow), and H-
GelMA 2 (gray). The low concentration GelMA samples were not included on the graph because
their heat flow was too low to display properly and they were deemed unsuitable compositions.
B) Calculated average specific heat of GelMA samples (w/w %). M-GelMA 1 was found to be
significantly different than H-GelMA 1 and H-GelMA 2 (*p < 0.05) just as M-GelMA 2 was
found to be significantly different than H-GelMA 1 and H-GelMA 2 (**p < 0.005). C) Average
cure time based upon the time at which the highest peak occurs. H-GelMA 1 was significantly
different than H-GelMA 2 (*p < 0.05), while M-GelMA 2 was significantly different than
H-GelMA 1 and M-GelMA 1 (**p < 0.05), and M-GelMA 1 was significantly different than
H-GelMA 2 and M-GelMA 1 (***p < 0.05). Refer to Table 2-1 for exact concentrations.
Experiments were run in triplicate (n = 3) and reported as the average ± standard deviation.
Originally three GelMA concentrations were to be tested (see Table 2-1), but almost immediately
the 10% GelMA concentration was eliminated because it was unable to cure properly as
observed in both photo-rheology and photo-DSC. The 10% solutions were turbid upon
production, which was the first indication of their potential failure. The turbidity was attributed
to insolubility between GelMA and sulisobenzone, an indication from particulates that were
present in 10% solutions. First, from photo-rheology the lack of a gel point for L-GelMA 2 was a
strong indication that this formulation would fail. Photo-DSC then further supported the
elimination of the 10% GelMA concentration from the printable resins. Therefore, it was deemed
L-GelMA 1 and L-GelMA 2 would be inadequate to explore for 3D printing, so from this point
on the other four resins from Table 2-1 were explored. Similar to photo-rheology, photo-DSC
observed increasing GelMA concentration significantly increased the energy (specific heat, J/g)
C)

51
absorbed by the system. This was expected since higher concentrations of GelMA have a greater
concentration of monomer available to react and initiate free radical polymerization.
Unlike photo-rheology which gives a rough estimate of the initial cure time based on the gel-
point and the total cure time based on the storage modulus, photo-DSC yields an absolute
measurement of the total time required to completely cure the resin as it measures the total
energy required to cure. This is useful not only for post-curing procedures of 3D printed
scaffolds, but it also gives insight into the total printing time of the resin system, or the total
energy and time required to react the monomers completely. The highest reported time (Figure 3-
4C) was 50 s and agreed with the 90 s total cure time found in photo-rheology. This overall cure
time suggests larger 3D printed structures of GelMA could be produced in a fraction of the time
compared to extrusion-based methods.
Statistical analysis described in Figure 3-4C further suggested the overall cure time of the resin is
impacted by both the GelMA concentration and UV blocker. As seen with H-GelMA 1 and H-
GelMA 2, with increasing UV blocker concentration, the cure time increased for similar GelMA
concentrations (p < 0.05). This is because the UV blocker absorbs some of the UV energy
preventing it from interacting with the GelMA and LAP. There is an obvious formulation
interplay that occurred between M-GelMA and H-GelMA resins. Since the photoinitiator was
held constant, the two factors that affected the characterization were UV blocker and GelMA
concentration. At different GelMA concentrations but same UV blocker concentrations there was
no significant difference in cure times. However, at higher concentrations of UV blocker the cure
time was significantly affected. Although the UV blocker concentration had no impact on the

52
rheological properties of the formulations, it is definitely apparent that the UV blocker
concentration had an impact on the kinetics of the reaction and overall cure times of each
formulation tested.
3.4 Swell Testing
Having officially ruled out the L-GelMA resins from any further characterization, the next step
was to test the overall water content of hydrogels formed with the remaining formulations. Swell
testing is a common method for hydrogel materials to determine the overall water capacity
within the physical network of the material. In the literature, it is a common trend that increasing
GelMA concentration decreases the overall water content of subsequent hydrogels [25, 33, 35,
36, 42, 53, 55]. The swollen weight of a hydrogel can affect cell nutrient diffusion and transport,
as well as the mechanical properties of the hydrogel. Thus, the higher the water content in a
material, the less mechanically robust it may be, but it may be more efficient at transporting
waste and nutrients to mimic a cellular microenvironment. Table 3-1 depicts the results from
swell testing with M-GelMA and H-GelMA resins. Significantly higher swelling (p < 0.05) was
experienced by lower concentrations of GelMA, while less swelling was observed for higher
concentrations of GelMA, which agreed with previous reports [25, 33, 35, 36, 42, 53, 55].
Higher concentrations of UV blocker resulted in less swelling (p < 0.05), while lower
concentrations of UV blocker resulted in greater swelling. A higher UV blocker concentration
correlated to a lower swell percentage, which could in turn result in reduced cell proliferation
and viability. Swelling properties also have the potential to effect mechanical properties. Photo-
rheology data did not detect a significant impact on the storage modulus of GelMA films for M-
GelMA and H-GelMA resins with different UV blocker concentrations (but, these films were not

53
swollen when rheological tests were run). The swelling was less for M-GelMA 2, and H-GelMA
2, and both these compositions have higher UV blocker concentrations. The polymeric networks
of these resins could be more crosslinked than their lower UV blocker concentration
counterparts. This could be due to the fact there would be additionally energy required (as shown
in the photo-DSC data) to cure resins with higher UV blocker concentrations. This energy could
correlate to higher crosslinking within the hydrogels, preventing the same amount of swelling
between formulations from occurring. It is also key to mention that these resins swell
considerably, and this may have an impact on overall print fidelity. During the printing process
the 3D printed part is lowered back into the resin vat after each layer. There may be residual
swelling that occurs during this process as well as post-washing of the scaffolds that swells the
3D printed part and impacts the overall print fidelity (this could result in a reduced feature size
such as pores, contributing to the deviation from the .STL file/intended 3D print structure).
Table 3-1: Average swell percentage of GelMA resins. Significance was found between M-
GelMA 1 and M-GelMA 2 (**p < 0.005) as well as H-GelMA 1 and H-GelMA 2 (*p < 0.05). All
experiments were run in triplicate (n = 3).
% Swelling
M-GelMA 1 426 ± 2**
M-GelMA 2 344 ± 6**
H-GelMA 1 284 ± 1*
H-GelMA 2 240 ± 4*
3.5 Working Curve
As discussed in section 2.5.1, the working curve is a crucial component of developing any resin
for 3D printing with SLA. The working curve relates the exposure of light delivered at the
prepolymer surface (E) to the depth at which the prepolymer is crosslinked, also known as the
cure depth (Cd). The minimum exposure required to begin polymer crosslinking is the critical
54
exposure (Ec). The working curve gives insight to the amount of UV energy and time required
for photopolymer curing. Figure 3-6 revealed H-GelMA 1 has the lowest critical exposure,
which was expected since H-GelMA 1 has the highest GelMA concentration and lowest UV
blocker concentration. M-GelMA 2 has the longest critical exposure, but lowest depth of
penetration. This was also expected as M-GelMA 2 has a lower GelMA concentration and
highest UV blocker concentration. Increasing GelMA concentration would decrease exposure
time because there is a higher amount of methacrylate groups per volume of the pre-polymer
(Table 3-2). However, increasing UV blocker concentration would increase exposure time
because more free radicals will be scavenged by the UV blocker instead of the monomer. Based
off of Figure 3-6, the most promising resin prior to 3D printing would be M-GelMA 2, because
the layer thickness and depth of penetration are lowest, meaning theoretically this resin should
produce the smallest layers in a 3D printed scaffold. The only drawback would be it has a higher
critical exposure, which could mean a 3D printed scaffold from M-GelMA 2 would take longer
to print compared to H-GelMA 1, but it would be more difficult to introduce porosity into a resin
from H-GelMA 1 because it has a larger depth of penetration. A larger depth of penetration
means that if the targeted layer height for printing is 100 µm, and the depth of penetration of the
resin is > 100 µm, consecutive layers would experience UV exposure past the layer height (over
cure). If UV exposure is bleeding into consecutive layers then over curing will occur and fill any
negative space or porosity that was intended for the scaffold. However, this appeared to only be
the case for the H-GelMA 1 resin. The result of the working curve was promising for producing
the intended GelMA scaffold with a layer height of 100 µm and choosing µSL as a method over
extrusion for this type of resolution.

55
Figure 3-5: Working curve of GelMA Resins H-GelMA 1 (gray), H-GelMA 2 (yellow), M-
GelMA 1 (blue), M-GelMA 2 (orange). Measurements were taken in triplicate (n = 3) and the
error bars represent the average standard deviation.
Table 3-2: From Figure 3-6 the following values were derived. The Dp corresponds to the slope
of the trend lines while the Ec corresponds to the x-intercept.
Depth of penetration (Dp) (µm)
Critical exposure (Ec) (s)
M-GelMA 1 91.60 0.06
M-GelMA 2 35.94 1.08
H-GelMA 1 145.62 0.98
H-GelMA 2 80.38 1.38
3.6 3D Printing Analysis
3D print images were divided into five different categories: scaffold face measurements, top of
scaffold measurements, bulk scaffold measurements, pore measurements, and scaffold layer
measurements. The analysis was based off of the .STL file in Figure 2-1 of a 4 x 4 x 5 mm
(l, w, h) rectangular 3D scaffold. Figure 3-7A and 3-7B show representative images of a scaffold
with the measurements labelled for both the face and the top of a scaffold respectively.
Figure 3-7C depicts the printing parameters that were informed from the previous

56
characterization techniques: photo-rheology, photo-DSC, and working curve in order to reach the
minimum exposure time require to generate a 3D structure. The layer height was kept constant to
reduce the variables and measure how precise the limit could be met with various resins.
Sc
affo
ld H
eig
ht
Pore Width
Scaffold Width
Po
re H
eig
ht
Layer Height
A)

57
Layer height (µm) Exposure time (ms)
M-GelMA 1 100 900
M-GelMA 2 100 1600
H-GelMA 1 100 700
H-GelMA 2 100 1200
Figure 3-6: Representative light images of GelMA scaffolds with features measured of the A)
scaffold face and B) scaffold top. C) Table depicting printing parameters input into the LabView
software for each resin type, the pore size for each scaffold type was 1 mm in diameter.
A face of scaffold (Figure 3-7A) measurement was deemed to be one of the four sides of the
cube. Multiple faces were measured per scaffold to obtain a total of 10 measurements per
parameter. A top of scaffold (Figure 3-7B) measurement came from the last layer printed (top
face, one per scaffold). A bulk scaffold measurement was deemed to be a bulk dimension of the
scaffold such as total length or total width across the cube (Figure 3-7A). The pore width was
Pore Width
Po
re L
en
gth
B)
C)

58
defined as the total distance across the pore in the x-direction. The pore height was defined as the
total distance across the pore in the z-direction. The pore length was defined as the total distance
across the pore in the y-direction. A layer measurement was defined the height of the layer
generated from the 2D projection exposed on the resin surface, and was averaged over several
layers. Refer to Chapter 2: Materials and Methods for how the images were taken and how many
measurements were taken per scaffold.
3.6.1 Scaffold Face Measurements
For the scaffold face measurements, pore height and pore width were analyzed. Pore height in
each scaffold was intended to be 1 mm across. Pore height was considered significant in that it
composes the z-direction of the pore and helps produce the negative feature. Ideally, each pore
would be perfectly square, but that was not the case for the GelMA prints here. In Figure 3-8 the
only significant difference reported for the pore height was with H-GelMA 2 (p < 0.05). H-
GelMA 2 had a larger pore height than the other formulations. This suggested at a high
concentration of GelMA and UV blocker, a significant impact on the pore height fidelity was
made. The trend observed in Figure 3-8A show an increase in pore height across resins, while the
trend overserved in Figure 3-8B show a decrease in % error. H-GelMA 2 was not only
significantly larger (p < 0.05) in terms of its pore height than all other resins, but also had the
lowest % error which was the first indication H-GelMA 2 could be a good resin formulation for
GelMA printing with µSLA.

59
Figure 3-7: A) Pore height measurements and standard deviations for faces of printed
GelMA scaffolds (n = 10). For the pore height, only H-GelMA 2 was significantly different (#p
< 0.05) than all other GelMA resins in terms of the pore height measurements. B) Percent error
bar graph depicting the deviation between GelMA Resins and the theoretical pore height
measurements.
Next, the pore width measurements were analyzed. Pore width in each scaffold was intended to
be 1 mm across. Pore width was considered significant in it composes the x-direction of the pore
and produces the negative feature with the z-direction of the pore. From Figure 3-9A it was
apparent there was significant differences between the pore width measurements for all GelMA
B)
A)
#

60
resin types. More specifically, M-GelMA 1 and H-GelMA 2 resins were significantly different (p
< 0.001) from all other resin types. M-GelMA 1 reported significantly smaller pore widths, while
H-GelMA 2 reported significantly larger pore widths. This demonstrates how the resin
formulation changes the overall fidelity of the final printed part. The lowest concentration of
GelMA/UV blocker observed more over cure while the highest concentration of GelMA/UV
blocker observed less over cure. This yields proof the GelMA concentration and UV blocker
concentration have a direct impact on the fidelity of this scaffold type in terms of pore width.
Since the intended pore width was 1000 µm, a comparison between the theoretical pore width
and actual pore width was determined as the % error (Figure 3-9B). From this, it was determined
that M-GelMA 1 had the largest deviation from the intended structure, while H-GelMA 2 again
had the lowest deviation, which directly correlates to the observation in Figure 3-9A. Overall
Figure 3-9 revealed the H-GelMA 2 resin had the highest print fidelity in terms of pore width on
the scaffold faces across all samples.
A)
*
** ***
#

61
Figure 3-8: A) Pore width measurements and standard deviations for faces of
GelMA scaffolds and resins (n = 10). M-GelMA 1 is significantly different than all other resins
(*p < 0.001). M-GelMA 2 is significantly different than M-GelMA 1 and H-GelMA 2 (**p <
0.001). H-GelMA 1 is significantly different than M-GelMA 1 and H-GelMA 2 (***p < 0.01).
Lastly, compared to all other groups H-GelMA 2 is significantly different
(#p < 0.001) than all other GelMA resins in terms of the pore width measurements. B) Percent
error bar graph depicting the deviation between GelMA Resins and the theoretical pore width
measurements.
Based off of these two categories, it was apparent there was more variation present in the pore
width compared to the pore height. However, H-GelMA 2 stands out in both categories with the
lowest percentage of error in each category (Figures 3-8B and 3-9B). In terms of printability of
this resin system, it means 30% GelMA and 1.0% UV blocker yielded the best printability for
these GelMA resins, but it still must be determined whether or not this H-GelMA 2 was
successful in terms of the instrument specifications. H-GelMA 2 prints resulted in pores that
were approximately 800 x 800 µm. This correlates to an error of roughly 20% in terms of both
pore height and pore width. This was the lowest % error reported, and based off of the ranking
system described in section 2.5.2 this was deemed a “good” print, while the other resin
formulations all fell within the “poor” print category.
B)

62
3.6.2 Top of Scaffold Measurements
Similar to the face scaffold measurements, the top of scaffold measurements were taken in
reference to Figure 3-7B. The pore width and pore length bear the same significance as the pore
width and pore height on the face of the scaffold. The top of scaffold is relevant because that is
where the least amount of UV exposure is endured by the scaffold. As mentioned in section 3.5
regarding the working curve, depending on the depth of penetration and critical exposure, the
scaffold can experience over curing due to the bleeding of excess UV light into consecutive
layers of the 3D scaffold. The top of scaffold pore width and pore length are relevant to the
overall fidelity of the 3D printed scaffold.
In terms of the pore length, M-GelMA 1 was significantly smaller than all other resin types
(Figure 3-10A, p < 0.001) and has the highest % error of all other resin types (Figure 3-10B).
This suggested M-GelMA 1 was not an ideal resin type for µSLA printing in terms of the pore
length at the top of the scaffold. This was interesting as the top most layer of the scaffold
experiences the least amount of UV exposure (due to the bottom-up manufacturing approach),
one would expect the top layer to not have any significant differences across all resin types. This
was another clear indication that GelMA concentration and UV blocker concentration indeed
have a direct impact on the printability of the scaffold. In terms of printability, the % error in
pore length for M-GelMA 2, H-GelMA 1, and H-GelMA 2 all fell between 10-20%, meaning
these prints were “good” in terms of pore length. M-GelMA 1 was above 20% error and deemed
a “poor” print.
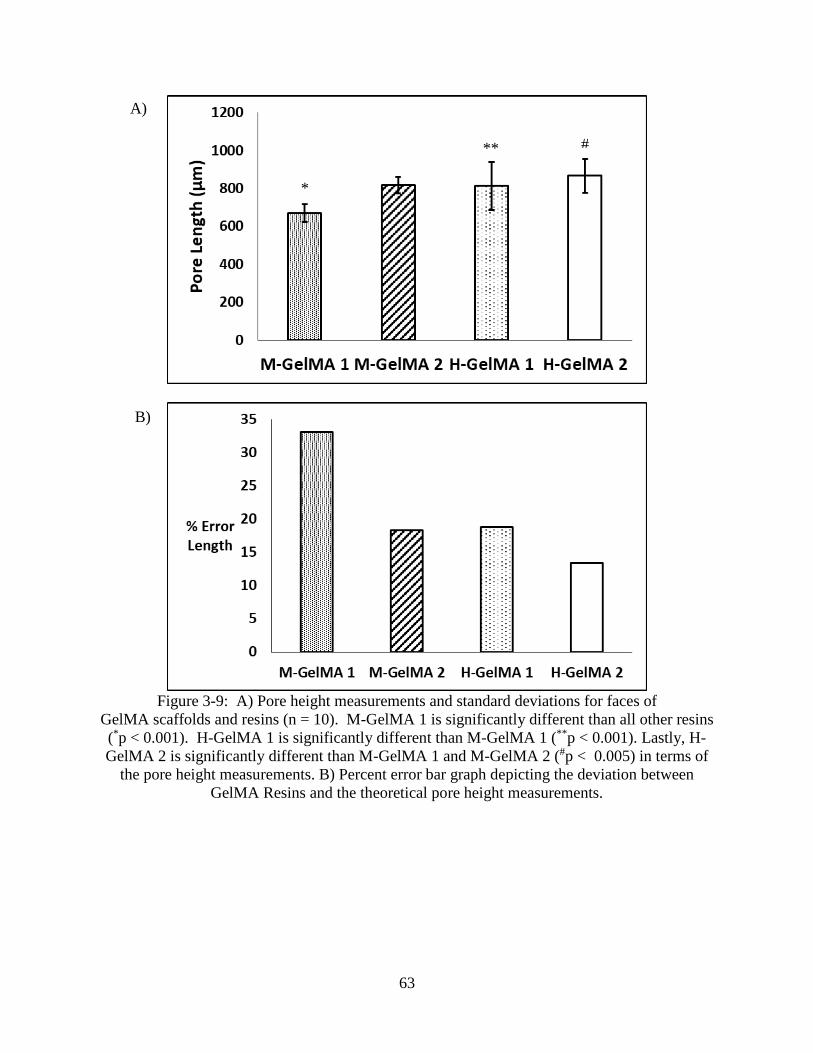
63
Figure 3-9: A) Pore height measurements and standard deviations for faces of
GelMA scaffolds and resins (n = 10). M-GelMA 1 is significantly different than all other resins
(*p < 0.001). H-GelMA 1 is significantly different than M-GelMA 1 (**p < 0.001). Lastly, H-
GelMA 2 is significantly different than M-GelMA 1 and M-GelMA 2 (#p < 0.005) in terms of
the pore height measurements. B) Percent error bar graph depicting the deviation between
GelMA Resins and the theoretical pore height measurements.
B)
#
*
**
A)

64
Next, the top of scaffold pore width measurements were analyzed (Figure 3-11). The same trends
as that observed in Figure 3-10 were observed in Figure 3-11. H-GelMA 2 was significantly
larger than both M-GelMA 1 and M-GelMA 2 (p < 0.005) in terms of pore width. H-GelMA 1
was only significantly different than M-GelMA 1 (p < 0.001), suggesting that at lower
concentrations of GelMA and higher concentrations of UV blocker, M-GelMA 2 and H-GelMA
1 behave similarly. The overall trend revealed that M-GelMA 1 does not produce good 3D
prints. Figure 3-11B, shows that H-GelMA 2 has the lowest percentage of error in terms of the
pore width measurements, making it the overall best printing resin within this category. The %
error in pore width for M-GelMA 2, H-GelMA 1, and H-GelMA 2 all fell between 10-20%,
meaning these prints were “good” in terms of pore width. M-GelMA 1 was above 20% error and
was deemed a “poor” print.
A) # **
*

65
Figure 3-10: A) Pore width measurements and standard deviations for faces of
GelMA scaffolds and resins (n = 10). M-GelMA 1 was significantly different than all other
resins (*p < 0.001). H-GelMA 1 is significantly different than M-GelMA 1 (**p < 0.001). Lastly,
H-GelMA 2 was significantly different than M-GelMA 1 and M-GelMA 2 (#p < 0.005) in terms
of the pore width measurements. B) Percent error bar graph depicting the deviation between
GelMA Resins and the theoretical pore width measurements.
3.6.3 Bulk Scaffold Measurements
The bulk scaffold measurements (Figure 3-7A) include the total scaffold height and total scaffold
width. Similar to scaffold face pore height measurements, there was significance across
formulations for scaffold height measurements (Figure 3-12). Two outstanding observations
were that: M-GelMA 1 was significantly smaller in terms of scaffold height than all other resins,
H-GelMA 2 was significantly taller than all other formulations, and M-GelMA 2 and H-GelMA
1 were not significantly different. M-GelMA 1 was unable to reach the 4 mm intended height of
the scaffold. This could indicate there was an error within the 3D printer itself (i.e. over cure or
under cure occurred), or there were material limitations for what can and cannot be printed with
this µSL system (i.e. the prints could have been collapsing on themselves). Additionally, the
B)
66
geometry of the print may play a role in print fidelity. These sources of error can be derived from
the working curve (see Section 3.5) as well as the instrumental error (see Section 2.5.2). If the
critical exposure and depth of penetration are below or beyond the limitations of the projector
used in the instrument, then it is likely to encounter errors where the intended structure cannot be
produced. Sources of instrumental error include that the layer height is mediated by the build
platform’s stepper motor. Calibration during printer setup can cause small deviations where a
layer is either over or under exposed. The focal length of the projector is also sensitive to
movement, which can cause small deviations in the projection and affect the overall bulk
dimensions of the scaffold. Another source of error for M-GelMA 1 could be that since M-
GelMA 1 would have less methacrylate groups per volume, M-GelMA 1 could be experiencing
less crosslinking. Similar to the trends found in Figure 3-9 through Figure 3-11, H-GelMA 2 has
the lowest % error among all other resins. H-GelMA 2 is the most promising resin for producing
precise scaffolds with this µSL system while maintaining the highest scaffold fidelity. In terms
of scaffold height M-GelMA 2, H-GelMA 1, and H-GelMA 2 all fell within 5-10% error,
deeming them “very good” prints. M-GelMA 1 fell within the 10-20% range for scaffold height,
deeming it a “good” print in this category.

67
Figure 3-11: A) Scaffold height measurements and standard deviations for bulk
GelMA scaffolds (n = 10). M-GelMA 1 is significantly different than all other resins (*p < 0.05).
M-GelMA 2 is significantly different than M-GelMA 1 and H-GelMA 2 (**p < 0.05). H-GelMA
1 is significantly different than M-GelMA 1 and H-GelMA 2 (***p < 0.05).
Lastly, compared to all other groups H-GelMA 2 is significantly different
(#p < 0.05) than all other GelMA resins in terms of the scaffold height measurements.
B) Percent error bar graph depicting the deviation between GelMA Resins and the theoretical
scaffold height measurements.
Next, the total scaffold width was measured and analyzed in the same way as the scaffold height.
Unlike with the scaffold height measurements, H-GelMA 2 scaffold widths were significant
larger (Figure 3-13A, p < 0.05) compared to other formulations. Once more H-GelMA 2 reported
A)
B)
# ***
*
**

68
the lowest % error in terms of the total scaffold width. The same observation regarding the total
scaffold height was seen for M-GelMA 1 and M-GelMA 2 in terms of scaffold width. For all
formulations, the scaffold width reported was not close to the 4 mm intended width. This could
be attributed to the instrumental error described above. In terms of printability, H-GelMA 2 fell
within the 10-20% error category, producing a “good” print while the rest of the formulations
were greater than 20% error, deeming them “poor” prints.
A)
B)
#

69
Figure 3-12: A) Scaffold width measurements and standard deviations for bulk
GelMA scaffolds (n = 10). Compare to all other resins, H-GelMA 2 is significantly different
(#p < 0.05) in terms of the scaffold width measurements. B) Percent error bar graph depicting
the deviation between GelMA Resins and the theoretical scaffold width measurements.
3.6.4 Scaffold Layer Measurements
Lastly, the scaffold layer measurements were measured and analyzed. The input parameter in the
LabView program was 100 µm. Figure 3-13A depicts the various reported layer heights across
scaffolds. Statistical analysis determined all layer height measurements were significantly
different than one another (p < 0.05). In terms of print fidelity Figure 3-13B surprisingly
revealed M-GelMA 1 had the lowest % error in terms of the layer measurement. This is
surprising because in almost all other categories of print fidelity, M-GelMA 1 failed to meet the
desired printability parameters set. It was also interesting to report that H-GelMA 2, which had
the lowest % error in every other category, had the second highest % error in respect to layer
height. The additional layer height may be a product of why H-GelMA 2 met the fidelity
requirements for bulk scaffold measurements (total scaffold width and total scaffold height).
Since H-GelMA 2 has the highest concentration of GelMA and UV blocker, it had the second
highest exposure time (Figure 3-7C). A higher exposure time is needed to cure layers because the
UV blocker scavenges free radicals needed to induce crosslinking. M-GelMA 1 and H-GelMA 1
had the lowest amount of UV blocker, but Figure 3-13A demonstrates that H-GelMA 1 could not
maintain 100 µm layers. The working curve also predicts this observation. (H-GelMA 1 has the
highest depth of penetration). In terms of print fidelity, since M-GelMA 1 feel within the 1-5%
error range it was deemed a “very good” print. All other resin formulations had greater than 20%
error in terms of layer height, deeming them “poor” prints.

70
Figure 3-13: A) Scaffold layer measurements and standard deviations for bulk
GelMA scaffolds (n = 10). Significance was determined between all resin types regarding the
scaffold layer measurements (*p < 0.05). B) Percent error bar graph depicting the deviation
between GelMA Resins and the theoretical pore height measurements.
Table 3-2 summarizes the analyzed printability of all GelMA formulations. The resin
formulation that had the most “good” and “very good” printability rankings was H-GelMA 2.
Overall, H-GelMA 2 was the only formulation able to resolve the closest desired porosity in the
XY, XZ, and YZ direction. H-GelMA 2 only lacked fidelity in terms of the layer height.
Although M-GelMA 1 and H-GelMA 1 were able to resolve porosity at the top of the scaffold,
they failed in terms of the XZ and YZ tolerances. M-GelMA 1 resolved the best layer height.
A)
B)
*

71
This was due to the fact it had the lowest monomer concentration as well as the lowest UV
blocker concentration and likely led to under curing. As described in section 2.5.2, this particular
instrument lacks z-directional accuracy, and even Lambert reported errors of 100% in terms of
the z-accuracy, so tailoring the proper layer height would require a formulation that likely has
higher UV blocker concentration if the monomer concentration is above 30% w/w GelMA. The
working curve data predicted that M-GelMA 2 would have performed the best due to the low
depth of penetration and critical exposure time. This should have allowed the resin to reach layer
heights as low at 35 µm. However, in application, M-GelMA 2 tied for second best formulation
with H-GelMA 1, with M-GelMA 1 being the worst. Even at 1 s exposure, M-GelMA 2 could
not generate consecutive layers and produce a 3D scaffold.
Table 3-3: Summary of printability for GelMA Resin Formulations.
M-GelMA 1 M-GelMA 2 H-GelMA 1 H-GelMA 2
Pore Height (face)
Poor
Poor
Poor
Good
Pore Width (face)
Poor
Poor
Poor
Good
Pore Length (top)
Poor
Good
Good
Good
Pore Width (top)
Poor
Good
Good
Good
Scaffold Width
Good
Good
Good
Very Good
Scaffold Height
Poor
Poor
Poor
Good
Layer Height
Very Good
Poor
Poor
Poor
3.7 Cell Culture
GelMA is ubiquitous in its biological applications due to its inherent biocompatibility [16, 33,
35, 38, 42, 52, 53, 55, 56, 59]. Multitudes of researchers have examined cell viability,

72
biocompatibility, and cell proliferation with various GelMA compositions, all reporting viability
above 80% [16, 33, 35, 38, 42, 52, 53, 55, 56, 59]. GelMA concentrations tested in cell culture
range from 10 – 20% w/v, with an observed increase in viability with an increase in GelMA
concentration [16, 33, 35, 38, 42, 52, 53, 55, 56, 59]. This is because the higher GelMA
concentration corresponds to more RGD sequences on the polymeric backbone that the cells
recognize for signaling and proliferation. Results from 1 and 3 day cell culture studies are shown
below in Figure 3-14. At 1 day, no significant difference in cell density was found between resin
formulations or the control. At 3 day, no difference was found between resin formulations.
However, the 3 day control was significantly higher (p < 0.05) than all resin types. This could
indicate at 1 day, the samples behaved similar to the control, but at 3 days there was a reduced
cell density compared to the control. Potentially, cell growth or attachment could be delayed on
GelMA films with LAP and sulisobenzone. Further analysis of a 7 day or 14 day study may
prove the cell density would recover to be similar that of the control. No significant difference
was found between UV blocker concentration and cell density within these GelMA resins.
Between 1 and 3 day studies there was significance increase in cell density across all resin types
and the controls. This was a positive result because it validates the cell density did increase over
the allotted time period, meaning the GelMA formulations developed are biocompatible and do
support cell growth/adhesion. Cell staining was also performed to observe qualitative responses
to GelMA films in vitro (Figure 3-15). By 3 day, the cells became more spindle-like shape and
were more clustered compared to 1 day, this visually confirmed the cell density has increased.

73
Figure 3-14: Cell culture study results for 1 and 3 day studies. Experiments were run in triplicate
(n = 3). At 1 day, no significant difference was observed between resins as well as between the
resins and control (p > 0.05). For 3 day, no significance was observed between resins, but there
was significance between each resin and the control (*p < 0.05). Further statistical analysis
between 1 and 3 days revealed that for each resin type there was a significance between 1 and 3
days of cell culture (i.e. M-GelMA 1 at 1 day was significantly different than M-GelMA 1 at 3
day) (**p < 0.05).
1 Day 3 Day
M-GelMA 1
*
**

74
M-GelMA 2
H-GelMA 1
H-GelMA 2
Figure 3-15: Representative light microscopy images of GelMA films seeded with 3T3s and
stained for nuclei (DAPI, blue) and actin (Texas Red, red).
Experiments were run in triplicate (n = 3)

75
Chapter 4: Conclusions and Future Directions
4.1 Conclusions
Developing a novel biomaterial resin for use in µSLA comes with its challenges. This work
successfully developed, characterized, and 3D printed a novel gelatin methacrylate resin for use
in µSL. The significant contribution to the field was the fidelity and resolution achieved in the
z-direction of each print. In the past, scientists have only proven to alter the surface of GelMA
resins creating 2D microstructures, 2D micropatterns, or “3D” prints less than 2 mm in height
and lack complexity in the z-direction. This work has demonstrated that the limits of GelMA can
be pushed to produce taller structures that utilize the high resolution of µSL printing. In the
work described, six novel GelMA resins were formulated and produced for use in µSL. Two
resins at lower GelMA concentrations were deemed incompatible due to miscibility issues, and
this was validated with photo-rheology and photo-DSC, which proved the reactivity and cure
times of those formulations was not ideal for µSL. Of the remaining four formulations, all were
characterized prior to 3D printing to gain insight into what parameters to expect for 3D printing.
Once scaffolds were printed, an approach was developed to quantify the fidelity achieved with
GelMA resins by measuring features including: pore height, pore width, pore length, scaffold
height, scaffold width, and layer height via optical microscopy. The best resin was determined
based off of the % error from the .STL file from which the 3D print was produced. One resin was
identified as a stepping stone for future work. The H-GelMA 2 resin proved to retain its fidelity
and had the lowest error percentage compared to the original .STL file from which it was printed.
Not only were prints with H-GelMA 2 resin visually more successful than the other resins, but a

76
method was developed to quantify the printability of the system. The printability was defined
using a semi-quantitative method. This method utilized optical microscopy to measure feature
sizes, and a ranking system based off of the instrumental tolerances of the µSLA printer to
categorize prints as either “very good” “good” or “poor.”
The two specific aims of this work were to:
1. Develop a novel GelMA resin that can print a 3D scaffold with a height greater than 2
mm. This resin should also improve on the overall cure time of the scaffold produced.
2. Display the complexity of µSL with this novel GelMA resin by being able to produce a
scaffold with porosity and pore sizes of 1000 µm, and a layer thickness less than 200 µm.
Aim 1 was fully addressed. In all formulations a scaffold height greater than 2 mm was
produced. And the longest recorded print time for a scaffold was less than 5 minutes. In aim 2,
the goal was to produce 1000 µm pores based off of the print file. As shown in the work, the
highest pore size (width and height) achieved was 800 µm on scaffold faces. However, a layer
thickness less than 200 µm was achieved for all resin formulations.
4.2 Significance
This work is significant because for the first time reported in µSLA, a structure was produced
with GelMA that had a z-height greater than 2 mm and layer thickness close to 100 µm, which
has not been demonstrated before. Additionally, this resin was deemed biocompatible after cell
culture studies verified an increase in cell density from 1 to 3 days. This opens the door for a

77
world of applications in tissue engineering, regenerative medicine, drug screening, pre-surgical
planning, and 3D bioprinting with µSL and GelMA.
Another significant contribution of this work to the additive manufacturing and 3D printing
community is the comprehensive characterization approach with semi-quantitative print fidelity
rankings. There is a lack of standardized quantification that exists to differentiate different
systems and material developed for 3D printing. This work demonstrates numerous
characterization techniques: photo-rheology, photo-DSC, working curve, and optical microscopy
analysis to characterize rheological properties, reaction kinetics, printability parameters, and
print fidelity respectively. Most literature does not utilize fidelity measurements to validate
printability, which begs the question of how can we, as a scientific community, prove our 3D
print system is successful. Although a material may produce a scaffold or geometry, how do we
judge or define whether or not that design or printed part is successful? Additionally, the
statistical analysis performed on this work validates the characterization methods used were
indeed significant. The reported results and statistical analysis confirmed trends relating to
material properties seen in previous literature, as well as trends in the overall printability of
resins. This work systematically defines GelMA formulations that were or were not compatible
for µSL printing. The L-GelMA resin formulations, containing 10% GelMA, failed to reach the
printing stage as their rheological properties could not be reliably measured, and their specific
heat and cure times were too low to warrant processing via µSL. This was attributed to a lack of
solubility between the UV blocker and GelMA, where L-GelMA 1 resins were still turbid, but
clearer than L-GelMA 2 resins.

78
The H-GelMA 2 resin was the most successful in terms of printability. From photo-rheology, the
H-GelMA 2 resin exhibited a storage modulus around 400 kPA and a gel point around 3 s. From
photo-DSC, the H-GelMA 2 resin exhibited a specific heat around 3 J/g and total cure time
around 40 s. The H-GelMA 2 formulation swelled approximately 240% and had a depth of
penetration of 80 µm and critical exposure of 1400 ms. H-GelMA 2 reported the best print
fidelity, ranking highest in 5 categories out of 6. Additionally the biocompatibility of the H-
GelMA 2 resin was proved successful. After 3 days, the cell density on H-GelMA films
increased 300%. This is a great starting point for producing larger constructs of GelMA via µSL,
however, there is plenty of room for future work and improvements.
4.3 Future Directions
Future work regarding this project can lead in multiple directions: 1. focusing on the raw
materials/synthesis of GelMA; 2. focusing on the printable shape/3D construct; and 3. altering
the concentrations of components within the resin further. These future directions are primarily
focused on the µSL application of GelMA since the work described contributes to a novel resin
formulation and print fidelity analysis not seen in prior literature. Applications for GelMA range
from wound healing constructs, to neural repair and regeneration, and even tendon and ligament
formation. Ideally, the same approach developed in this work could be used as a benchmark for
various different resin formulations tested in µSL, not just GelMA and hydrogel printing.
Especially in the tissue engineering community there is a push to understand the cellular
microenvironment and cell interactions based off of mechanical cues and geometry. The µSL

79
application of GelMA would allow researchers to create larger constructs that mimic the
geometry and material properties found in vivo.
The synthesis of GelMA would be an interesting point for future analysis because varying the
DS could have impacts on the cure time and reactivity of the resin. As discussed, in this work an
average of 54% DS was achieved. Aiming for 90-99% DS would alter the reactivity and
exposure times needed for printing. Additionally, at 99% DS, a 10% w/v GelMA resin may print
similar to 20% or 30% respectively. Solubility tests would be essential to first see if a higher DS
would prevent turbid solutions from forming. Printing at a lower concentration of GelMA would
allow researchers to produce GelMA scaffolds with lower storage moduli and greater swelling,
which for different applications in organ printing or cell types would be useful.
The 3D print file is another point of future work. In this work, a simple window structure was
analyzed as a benchmark for improving on the z-height and complexity of GelMA prints in
literature. As a proof of concept, the H-GelMA 2 resin was successful, but how would this vary
based on the layer height and printed shape. What if the shape were conical? Or had circular
pores? Would over curing be more or less noticeable? Some limitations on the printed shape
depend solely on the machine on which they are printed. For example, the resolution of the
printer used in this work should theoretically be 10 µm, but when Lambert tested the system they
commented the pixel size has an error of 2 µm, and the smallest feature they were able to cure
was 20 µm, not 10 µm. Material properties are of great concern, and with GelMA, over curing
was a common issue. The refraction of light within the construct during printing can cause issues
as well. Potentially with this chosen geometry may exhibit more or less over cure than a different

80
geometry. Also, this is an open system, meaning oxygen on the surface of the resin during
printing can act as an inhibitor. This could result in longer exposure times on the resin surface,
which may ultimately lead to over cure. More optical image analysis would be required to test
different geometries with the same resin formulation to observe this phenomenon. Additionally,
the impact of swelling on the 3D printed part could be further explored. If the swelling is truly
making an impact on the print fidelity, further analysis would be needed to verify this.
The resin formulation is always an area for discovery. Especially with regards to this work,
increasing the UV blocker concentration from 1.0% to perhaps even 2.0% may drastically
improve the fidelity of printed constructs. Higher UV blocker concentration may increase
exposure time, but reduce layer height and improve on the overall fidelity of the structure.
Increasing the UV blocker concentration would cause concern for the biocompatibility of the
formulation. More UV blocker or photoinitiator may introduce more cytotoxicity into the resin
formulation and reduce cell viability. There may also be a solubility concern at higher UV
blocker concentrations. Developing a phase diagram to observe the upper or lower limit of
solubility of formulation components would be incredibly useful. Just as the L-GelMA resins
were turbid and had immiscible components, this same effect may be observed at higher
concentrations of UV blocker relative to the GelMA concentration.
In closing, this work pushes the current work surrounding 3D printing and GelMA. Prior work
with µSL printing GelMA produced 2D or “2.5D” scaffolds, or a 3D scaffold that would take
nearly 6 hours to produce. This work also comments on the lack of characterization in terms of
print fidelity within the 3D printing community. Machine tolerances and error percentages need

81
to be considered. Simply being able to produce a pattern or scaffold with a scale bar should not
be the only characterization of fidelity. The H-GelMA 2 resin and printability analysis method
are a great start for future µSL printing with gelatin methacrylate and this system to further push
the boundaries of GelMA printing with µSL.

82
Appendix A:
Appendix A lists the various resin formulations tested as a part of preliminary resin
development. Each section is commented on respectively.
Date
Res
in
Co
mp
os
ition
(w/w
%)
Cu
re T
ime
(UV
La
mp
)
Cu
re T
ime
(Prin
ter)
La
ye
r
Th
ick
ne
ss
(Prin
ter)
3D
Prin
t?
Bio
co
mp
atib
ility
Oth
er
Ch
ara
cte
ristic
s
9/1
1/2
01
7
20
% G
elM
A
50
% A
mp
s
10
% H
em
a
25
% H
2O
1%
DM
PA
1%
Su
lisob
en
zo
ne
30
se
c
10
se
c
~2
50
um
Ye
s
Te
ste
d re
su
lts in
dic
ate
d
po
or v
iab
ility)
-Th
in film
s s
we
ll a lo
t
-No p
rint p
ictu
re a
va
ilab
le b
ut it d
id
prin
t a p
oro
us s
tructu
re
-Th
in film
s s
ee
me
d b
rittle
-So
lub
ility is
su
es w
ith
DM
PA
an
d A
MP
S/H
2O
-Ad
ditio
na
lly w
en
t do
wn
in H
2O
co
ncen
tratio
n to
20
%
9/2
7/2
01
7
20
% G
elM
A
50
% A
mp
s
10
% H
em
a
25
% H
2O
1%
DM
PA
0.0
5%
Avob
en
zo
ne
1 m
in
N/A
N/A
N/A
Te
ste
d (c
ells
die
d
afte
r 3 d
ays)
-Film
s s
ee
me
d to
cra
ck a
lot
-Had
troub
le w
ith
the
ste
riliza
tion

83
11
/3/2
01
7
20
% G
elM
A
50
% A
mp
s
10
% H
em
a
20
% H
2O
1%
Irga
cu
re 2
959
0.0
5%
Su
lisob
en
zo
ne
5 m
in
N/A
N/A
No
Te
ste
d (c
ells
gre
w)
-Lo
ng
expo
su
re tim
e
pe
r film c
rea
tion
-Prin
ting
requ
ired
alte
rna
tive
ligh
t so
urc
e
11
/6/2
01
7
22
.5%
Ge
lMA
55
% A
mp
s
22
.5%
H2
O
2%
Irga
cu
re 8
19
(BA
PO
)
0.5
% S
ulis
obe
nzon
e
N/A
N/A
N/A
No
N/A
-Th
is re
sin
form
ula
tion
did
no
t work
11
/14
/20
17
10
% G
elM
A
30
% A
mp
s
30
% P
EG
DA
30
% H
2O
1%
DM
PA
0.5
% S
ulis
obe
nzon
e
Le
ss th
an 2
0 s
ec
1 s
ec
~1
40
um
Ye
s
Te
ste
d (n
o a
dhe
sio
n c
ell v
iab
ility n
ot
ap
pa
ren
t)
-Wa
s a
ble
to p
rint w
indo
w s
tructu
re
-So
lutio
n m
ain
ly m
ade
of P
EG
DA
an
d A
MP
S
-In c
ell c
ultu
re trie
d re
mo
vin
g s
ulis
ob
en
zo
ne
an
d e
ve
n in
cre
asin
g G
elM
A
-Mis
cib
ility is
su
es a
nd
sh
ield
ing
occu
rring
du
ring
cu
ring
?
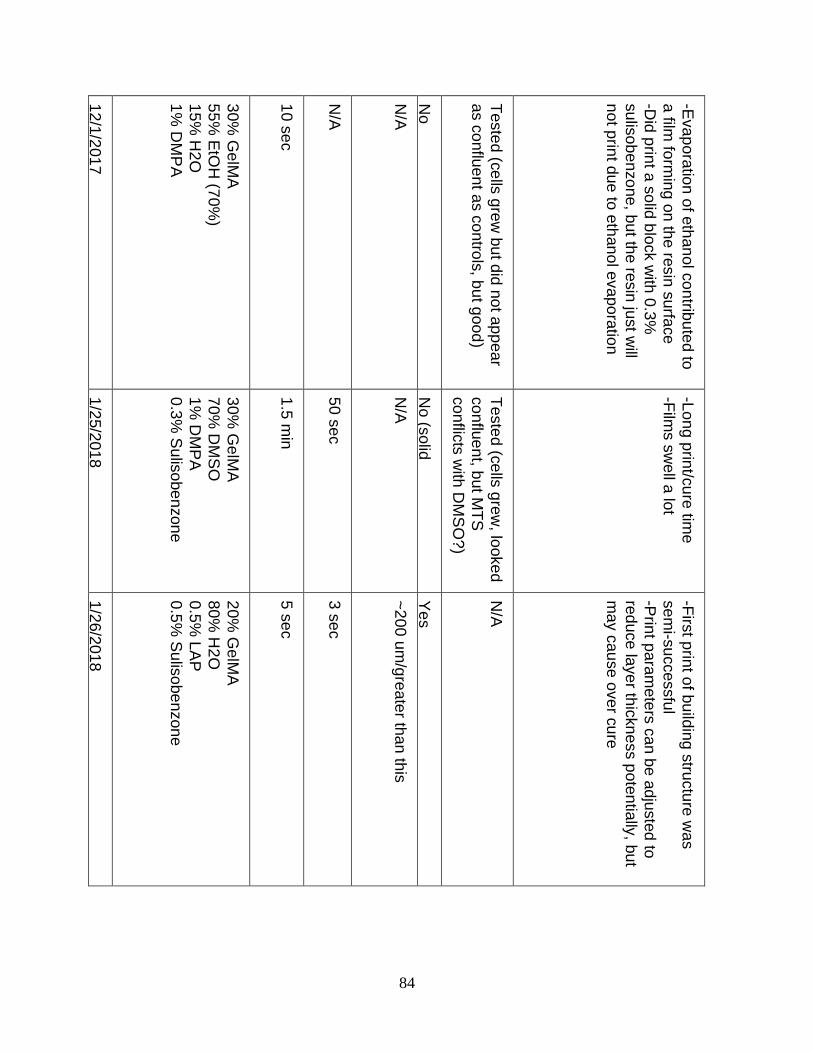
84
12
/1/2
01
7
30
% G
elM
A
55
% E
tOH
(70
%)
15
% H
2O
1%
DM
PA
10
se
c
N/A
N/A
No
Te
ste
d (c
ells
gre
w b
ut d
id n
ot a
pp
ea
r
as c
onflu
ent a
s c
on
trols
, bu
t goo
d)
-Eva
po
ratio
n o
f eth
an
ol c
on
tribu
ted
to
a film
form
ing
on
the
resin
su
rface
-Did
prin
t a s
olid
blo
ck w
ith 0
.3%
su
liso
be
nzo
ne
, bu
t the re
sin
just w
ill
no
t prin
t du
e to
eth
an
ol e
va
po
ratio
n
1/2
5/2
01
8
30
% G
elM
A
70
% D
MS
O
1%
DM
PA
0.3
% S
ulis
obe
nzon
e
1.5
min
50
se
c
N/A
No (s
olid
cu
be
)
Te
ste
d (c
ells
gre
w, lo
oke
d
co
nflu
en
t, but M
TS
co
nflic
ts w
ith D
MS
O?
)
-Lo
ng
prin
t/cu
re tim
e
-Film
s s
we
ll a lo
t
1/2
6/2
01
8
20
% G
elM
A
80
% H
2O
0.5
% L
AP
0.5
% S
ulis
obe
nzon
e
5 s
ec
3 s
ec
~2
00
um
/gre
ate
r tha
n th
is
Ye
s
N/A
-Firs
t prin
t of b
uild
ing
stru
ctu
re w
as
se
mi-s
ucce
ssfu
l
-Prin
t pa
ram
ete
rs c
an b
e a
dju
ste
d to
red
uce
laye
r thic
kn
ess p
ote
ntia
lly, b
ut
ma
y c
au
se o
ve
r cu
re
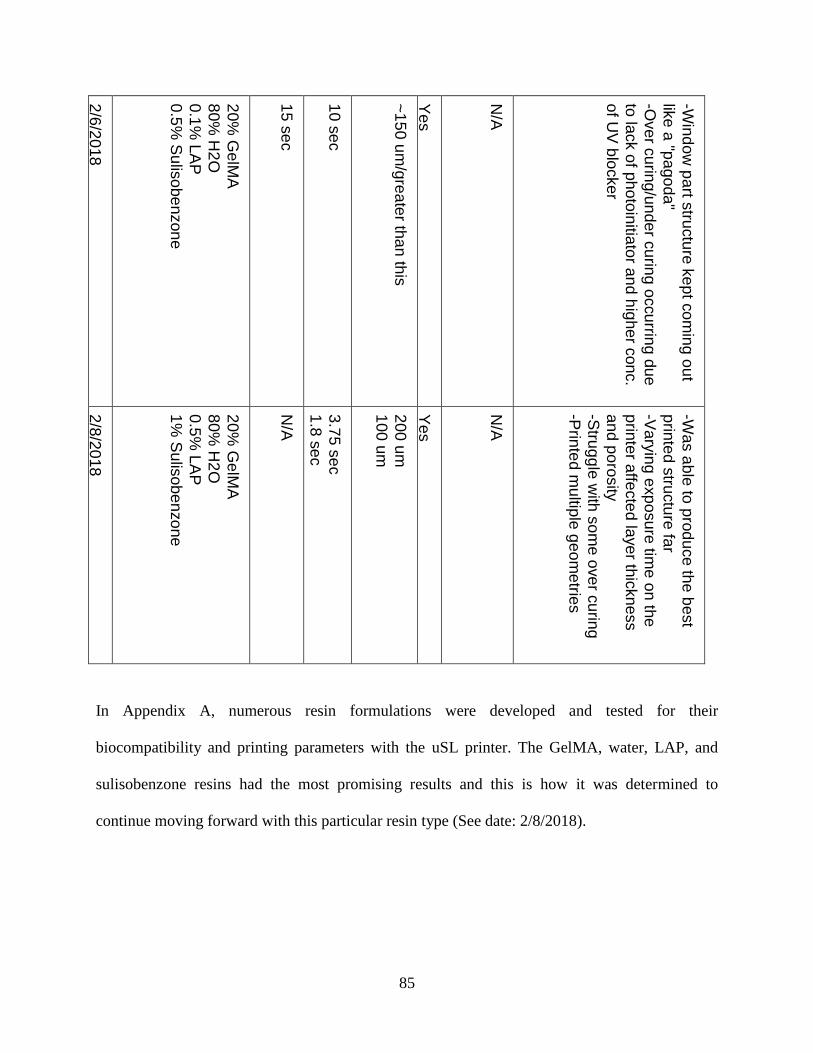
85
2/6
/20
18
20
% G
elM
A
80
% H
2O
0.1
% L
AP
0.5
% S
ulis
obe
nzon
e
15
se
c
10
se
c
~1
50
um
/gre
ate
r tha
n th
is
Ye
s
N/A
-Win
do
w p
art s
tructu
re k
ep
t co
min
g o
ut
like
a "p
ago
da
"
-Ove
r cu
ring
/un
de
r cu
ring
occu
rring
du
e
to la
ck o
f ph
oto
initia
tor a
nd h
ighe
r con
c.
of U
V b
locke
r
2/8
/20
18
20
% G
elM
A
80
% H
2O
0.5
% L
AP
1%
Su
lisob
en
zo
ne
N/A
3.7
5 s
ec
1.8
se
c
20
0 u
m
10
0 u
m
Ye
s
N/A
-Wa
s a
ble
to p
rod
uce th
e b
est
prin
ted
stru
ctu
re fa
r
-Va
ryin
g e
xp
osu
re tim
e o
n th
e
prin
ter a
ffecte
d la
ye
r thic
kne
ss
an
d p
oro
sity
-Stru
gg
le w
ith s
om
e o
ve
r cu
ring
-Prin
ted
mu
ltiple
geo
me
tries
In Appendix A, numerous resin formulations were developed and tested for their
biocompatibility and printing parameters with the uSL printer. The GelMA, water, LAP, and
sulisobenzone resins had the most promising results and this is how it was determined to
continue moving forward with this particular resin type (See date: 2/8/2018).

86
References:
[1] R. D. Gibson I., Stucker B., Additive Manufacturing Technologies. New York, NY:
Springer, 2015.
[2] I. Donderwinkel, van Hest, J. C. M. and Cameron, N. R., "Bio-inks for 3D bioprinting:
recent advances and future prospects," Polymer Chemistry, vol. 8, no. 31, pp. 4451-4471,
2017.
[3] N. C. Philip Lambert, Alison Schultz, Shelley Cooke, Timothy Long, Abby Whittington,
Christopher Williams and "Mask Projection Microstereolithography of Novel
Biocompatible Polymers " presented at the 16th Annual Conference of the North
Carolina Tissue Engineering and Regenerative Medicine Society, Durham, NC, 2014.
[4] A. A. Sean V Murphy, "3D bioprinting of tissues and organs," Nature Biotechnology,
vol. 32, no. 8, pp. 773-785, 2014.
[5] T. Jungst, Smolan, W., Schacht, K., Scheibel, T. and Groll, J., "Strategies and Molecular
Design Criteria for 3D Printable Hydrogels," Chemical Reviews, vol. 116, no. 3, pp.
1496-1539, 2015 2015.
[6] W. Y. Y. J.M Lee, "Design and Printing Strategies in 3D Bioprinting of Cell-Hydrogels:
A Review," Advanced Healthcare Materials, vol. 5, no. 22, pp. 2856-2865, 2016.
[7] J. R. Jones, "Observing cell response to biomaterials," Materials Today, vol. 9, no. 12,
pp. 34-43, 2006.
[8] Y. Seol, Kang, H., Lee, S. J., Atala, A. and Yoo, J. J., "Bioprinting technology and its
applications," European Journal of Cardio-Thoracic Surgery, vol. 46, no. 3, pp. 342-348,
2014.
[9] P. Lambert, "Design and Fabrication of a Mask Projection Microstereolithography
System for the Characterization and Processing of Novel Photopolymer Resins " M.S,
Mechanical Engineering, Virginia Tech, 2014.
[10] N. I. o. Health. (8). Tissue Engineering and Regenerative Medicine. Available:
https://www.nibib.nih.gov/science-education/science-topics/tissue-engineering-and-
regenerative-medicine
[11] B. M. W. H. N. Chia, "Recent advances in 3D printing of biomaterials," Journal of
Biological Engineering, vol. 9, no. 1, 2015.
[12] Q. L. a. C. Choong, "Three-Dimensional Scaffolds for Tissue Engineering Applications:
Role of Porosity and Pore Size," Tissue Engineering Part B: Reviews, vol. 19, no. 6, pp.
485-502, 2013.
[13] F. M. J. Jansen, D. Grijpma and J. Feijen, "Fumaric Acid Monoethyl Ester-
Functionalized Poly(d,l-lactide)/N-vinyl-2-pyrrolidone Resins for the Preparation of
Tissue Engineering Scaffolds by Stereolithography," Biomacromolecules, vol. 10, no. 2,
pp. 214-220, 2009.
[14] R. W. J. Choi, S. Lee, K. Choi, C. Ha and I. Chung, "Fabrication of 3D
biocompatible/biodegradable micro-scaffolds using dynamic mask projection
microstereolithography," Journal of Materials Processing Technology, vol. 209, no. 15-
16, pp. 5494-5503, 2009.
[15] S. Skoog, Goering, P. and Narayan, R., "Stereolithography in tissue engineering,"
Journal of Materials Science Materials in Medicine, vol. 25, no. 3, pp. 845-856., 2013.
[16] K. Kim, Dean, D., Wallace, J., Breithaupt, R., Mikos, A. and Fisher, J., "The influence of
stereolithographic scaffold architecture and composition on osteogenic signal expression
87
with rat bone marrow stromal cells. Biomaterials," Biomaterials, vol. 32, no. 15, pp.
3750-3763, 2011.
[17] S. Lee, Kang, H., Park, J., Rhie, J., Hahn, S. and Cho, D, "Application of
microstereolithography in the development of three-dimensional cartilage regeneration
scaffolds," Biomedical Microdevices, vol. 10, no. 2, 2007.
[18] M. Schuster, Turecek, C., Kaiser, B., Stampfl, J., Liska, R. and Varga, F. (2007).
Evaluation of Biocompatible Photopolymers I: Photoreactivity and Mechanical Properties
of Reactive Diluents. Journal of Macromolecular Science, Part A, 44(5), pp.547-557.,
"Evaluation of Biocompatible Photopolymers I: Photoreactivity and Mechanical
Properties of Reactive Diluents," Journal of Macromolecular Science, Part A, vol. 44,
no. 5, pp. 547-557, 2007.
[19] F. C. Andrew A. Gill, Haycock, J., "3D Structuring of Biocompatible and Biodegradable
Polymers Via Stereolithography," in 3D cell culture, vol. 3rd ed, J. Haycock, Ed. Totowa,
N.J.: Humana Press, 2011, pp. 309-321.
[20] M. a. M. Mizutani, T. (2002). Liquid photocurable biodegradable copolymers: In vivo
degradation of photocured poly(ε‐caprolactone‐co‐trimethylene carbonate). Journal of
Biomedical Materials Research, 61(1), pp.53-60., "Liquid photocurable biodegradable
copolymers: In vivo degradation of photocured poly(ε‐caprolactone‐co‐trimethylene
carbonate)," Journal of Biomedical Materials Research, vol. 61, no. 1, pp. 53-60, 2002.
[21] K. Arcaute, Mann, B. and Wicker, R. (2010). Stereolithography of spatially controlled
multi-material bioactive poly(ethylene glycol) scaffolds. Acta Biomaterialia, 6(3),
pp.1047-1054., "Stereolithography of spatially controlled multi-material bioactive
poly(ethylene glycol) scaffolds," Acta Biomaterialia, vol. 6, no. 3, pp. 1047-1054, 2010.
[22] H. Sung, Meredith, C., Johnson, C. and Galis, Z. , "The effect of scaffold degradation rate
on three-dimensional cell growth and angiogenesis," Biomaterials, vol. 25, no. 26, pp.
5735-5742, 2004.
[23] W. C. J. Dunn, V. Cristini, J. Kim, J. Lowengrub, S. Singh and B. Wu, "Analysis of Cell
Growth in Three-Dimensional Scaffolds," Tissue Engineering, vol. 12, no. 4, pp. 705-
716, 2006.
[24] H. Shirahama, Lee, B., Tan, L. and Cho, N., "Precise Tuning of Facile One-Pot Gelatin
Methacryloyl (GelMA) Synthesis," Scientific Reports, vol. 6, no. 1, 2016.
[25] K. Yue, Trujillo-de Santiago, G., Alvarez, M., Tamayol, A., Annabi, N. and
Khademhosseini, A. , "Synthesis, properties, and biomedical applications of gelatin
methacryloyl (GelMA) hydrogels," Biomaterials, vol. 73, pp. 254-271, 2015.
[26] M. A. Carletti E., Migliaresi C, "Scaffolds for Tissue Engineering and 3D Cell Culture,"
in 3D Cell Culture. Methods in Molecular Biology (Methods and Protocols), vol. 695, H.
J., Ed.: Humana Press, 2011.
[27] P. Zorlutuna, Jeong, J., Kong, H. and Bashir, R., "Tissue Engineering: Stereolithography-
Based Hydrogel Microenvironments to Examine Cellular Interactions," Advanced
Functional Materials, vol. 21, no. 19, pp. 3597-3597, 2011.
[28] R. Mondschein, Kanitkar, A., Williams, C., Verbridge, S. and Long, T. , "Polymer
structure-property requirements for stereolithographic 3D printing of soft tissue
engineering scaffolds," Biomaterials, vol. 140, pp. 170-188, 2017.
[29] V. Morris, Nimbalkar, S., Younesi, M., McClellan, P. and Akkus, O. , "Mechanical
Properties, Cytocompatibility and Manufacturability of Chitosan:PEGDA Hybrid-Gel

88
Scaffolds by Stereolithography," Annals of Biomedical Engineering, vol. 45, no. 1, pp.
286-296, 2016.
[30] S. Suri, Han, L., Zhang, W., Singh, A., Chen, S. and Schmidt, C. , "Solid freeform
fabrication of designer scaffolds of hyaluronic acid for nerve tissue engineering,"
Biomedical Microdevices, vol. 13, no. 6, pp. 983-993, 2011.
[31] H. K. B. Harley, M. Zaman, I. Yannas, D. Lauffenburger and L. Gibson, ,
"Microarchitecture of Three-Dimensional Scaffolds Influences Cell Migration Behavior
via Junction Interactions," Biophysics Journal, vol. 95, no. 8, pp. 4013-4024, 2008.
[32] S. F. Charles Molnar and Jane Gair, Rebecca Roush, James Wise, Yael Avissar, Jung
Choi, Jean DeSaix, Vladimir Jurukovski, Robert Wise, Connie Rye, Concepts of Biology-
1st Canadian Edition. B. C. C.: B.C. Open Textbook Project, 2013.
[33] D. Loessner, Meinert, C., Kaemmerer, E., Martine, L., Yue, K., Levett, P., Klein, T.,
Melchels, F., Khademhosseini, A. and Hutmacher, D. , "Functionalization, preparation
and use of cell-laden gelatin methacryloyl–based hydrogels as modular tissue culture
platforms," Nature Protocols, vol. 11, no. 4, pp. 727-746, 2016.
[34] B. Lee, Lum, N., Seow, L., Lim, P. and Tan, L. , "Synthesis and Characterization of
Types A and B Gelatin Methacryloyl for Bioink Applications. Materials," Materials, vol.
9, no. 10, p. 797, 2016.
[35] J. Nichol, Koshy, S., Bae, H., Hwang, C., Yamanlar, S. and Khademhosseini, A, " Cell-
laden microengineered gelatin methacrylate hydrogels," Biomaterials, vol. 31, no. 21, pp.
5536-5544, 2010.
[36] A. Van Den Bulcke, Bogdanov, B., De Rooze, N., Schacht, E., Cornelissen, M. and
Berghmans, H.. "Structural and Rheological Properties of Methacrylamide Modified
Gelatin Hydrogels," Biomacromolecules, vol. 1, no. 1, pp. 31-38, 2000.
[37] T. Lai, Yu, J. and Tsai, W., "Gelatin methacrylate/carboxybetaine methacrylate hydrogels
with tunable crosslinking for controlled drug release," Journal of Materials Chemistry B,
vol. 4, no. 13, pp. 2304-2313, 2016.
[38] H. Lin, Zhang, D., Alexander, P., Yang, G., Tan, J., Cheng, A. and Tuan, R. ,
"Application of visible light-based projection stereolithography for live cell-scaffold
fabrication with designed architecture," Biomaterials, vol. 34, no. 2, pp. 331-339, 2013.
[39] L. Xu, Sheybani, N., Yeudall, W. and Yang, H. , "The effect of photoinitiators on
intracellular AKT signaling pathway in tissue engineering application," Biomaterials
Science, vol. 3, no. 2, pp. 250-255, 2015.
[40] S. Wüst, Müller, R. and Hofmann, S. , "Controlled Positioning of Cells in Biomaterials—
Approaches Towards 3D Tissue Printing," Journal of Functional Biomaterials, vol. 2, no.
4, pp. 119-154, 2011.
[41] D. Kolesky, Truby, R., Gladman, A., Busbee, T., Homan, K. and Lewis, J. , "3D
Bioprinting of Vascularized, Heterogeneous Cell-Laden Tissue Constructs," Advanced
Materials, vol. 26, no. 19, pp. 3124-3130, 2014.
[42] L. Bertassoni, Cardoso, J., Manoharan, V., Cristino, A., Bhise, N., Araujo, W., Zorlutuna,
P., Vrana, N., Ghaemmaghami, A., Dokmeci, M. and Khademhosseini, A. , "Direct-write
bioprinting of cell-laden methacrylated gelatin hydrogels," Biofabrication vol. 6, no. 2, p.
24105, 2014.
[43] B. Fairbanks, Schwartz, M., Bowman, C. and Anseth, K., "Photoinitiated polymerization
of PEG-diacrylate with lithium phenyl-2,4,6-trimethylbenzoylphosphinate:

89
polymerization rate and cytocompatibility," Biomaterials, vol. 30, no. 35, pp. 6702-6707,
2009.
[44] A. Ovsianikov, Deiwick, A., Van Vlierberghe, S., Dubruel, P., Moller, L., Drager, G. and
Chichkov, B. , "Laser Fabrication of Three-Dimensional CAD Scaffolds from
Photosensitive Gelatin for Applications in Tissue Engineering," Biomacromolecules, vol.
12, no. 4, pp. 851-858, 2011.
[45] P. Kim, Yuan, A., Nam, K., Jiao, A. and Kim, D., "Fabrication of poly(ethylene glycol):
gelatin methacrylate composite nanostructures with tunable stiffness and degradation for
vascular tissue engineering," Biofabrication, vol. 6, no. 2, p. 24112, 2014.
[46] A. Skardal, Zhang, J., McCoard, L., Xu, X., Oottamasathien, S. and Prestwich, G. ,
"Photocrosslinkable Hyaluronan-Gelatin Hydrogels for Two-Step Bioprinting," Tissue
Engineering Part A, vol. 16, no. 8, pp. 2675-2685, 2010.
[47] M. V. Nicholas A. Chartrain, Dung T. Han, Justin M. Sirrine, Allison Pekkanen, Timothy
E. Long, Abby R. Whittington, Christopher B. Williams, "Microstereolithography of
Tissue Scaffolds Using a Biodegradable Photocurable Polyester," presented at the Solid
Freeform Fabrication 2016: Proceedings of the 26th Annual International Solid Freeform
Fabrication Symposium – An Additive Manufacturing Conference Texas, 2016.
[48] M. Chan-Park, Zhu, A., Shen, J. and Fan, A. , "Novel Photopolymerizable Biodegradable
Triblock Polymers for Tissue Engineering Scaffolds: Synthesis and Characterization,"
Macromolecular Bioscience, vol. 4, no. 7, pp. 665-673, 2004.
[49] GMIA, Gelatin Handbook, GMIA, ed., 2012. [Online]. Available: http://www.gelatin-
gmia.com/images/GMIA_Gelatin_Manual_2012.pdf. Accessed on 2018.
[50] Z. Wang, "Development of a Visibile Light Stereolithography-Based Bioprinting System
for Tissue Engineering.," M.S, Mechanical Engineering, The University of British
Columbia 2016.
[51] E. McColl, "Using stereolithography to 3D print GelMA hydrogels," M.S, Health and
Biomedical Innovation, Queensland University of Technology, 2017.
[52] N. S. P. Occhetta, F. Piraino, A. Redaelli, M. Moretti and M. Rasponi, "Fabrication of 3D
cell-laden hydrogel microstructures through photo-mold patterning," Biofabrication, vol.
5, no. 3, p. 35002, 2013.
[53] R. V. P. Occhetta, L. Russo, L. Cipolla, M. Moretti and M. Rasponi, "VA-086
methacrylate gelatine photopolymerizable hydrogels: A parametric study for highly
biocompatible 3D cell embedding," Journal of Biomedical Materials Research Part A,
vol. 103, no. 6, pp. 2109-2117, 2014.
[54] J. M. N. Palaganas, A. de Leon, J. Palaganas, K. Pangilinan, Y. Lee and R. Advincula,
"3D Printing of Photocurable Cellulose Nanocrystal Composite for Fabrication of
Complex Architectures via Stereolithography," ACS Applied Materials & Interfaces, vol.
9, no. 39, pp. 34314-34324, 2017.
[55] G. T. N. Monteiro, A. Athirasala, A. Tahayeri, C. França, J. Ferracane and L. Bertassoni,
"Photopolymerization of cell-laden gelatin methacryloyl hydrogels using a dental curing
light for regenerative dentistry," Dental Materials, 2017.
[56] E. G. T. Billiet, T. De Schryver, M. Cornelissen and P. Dubruel, "The 3D printing of
gelatin methacrylamide cell-laden tissue-engineered constructs with high cell viability,"
Biomaterials, vol. 35, no. 1, pp. 49-62, 2014.

90
[57] V. M. B. Golaz, Y. Leterrier, J.-A.E. Månson, "UV intensity, temperature and dark-
curing effects in cationicphoto-polymerization of a cycloaliphatic epoxy resin," Polymer
Chemistry, no. 53, pp. 2038-2048, 2012.
[58] P. Corporation. (2012, March 29 2019). CellTiter 96® AQueousOne Solution Cell
Proliferation Assay. Available: www.promega.com
[59] X. Q. A. Zhang, P. Soman, K. Hribar, J. Lee, S. Chen and S. He, "Rapid Fabrication of
Complex 3D Extracellular Microenvironments by Dynamic Optical Projection
Stereolithography," Advanced Materials, vol. 24, no. 31, pp. 4266-4270, 2012.


![Abstract arXiv:submit/2732192 [cs.CV] 15 Jun 2019cyfu/pubs/imp.pdfIMP: Instance Mask Projection for High Accuracy Semantic Segmentation of Things Cheng-Yang Fu Tamara L. Berg Alexander](https://img.pdfslide.net/doc/110x75/5f7fc59c23c4d555154f6997/abstract-arxivsubmit2732192-cscv-15-jun-cyfupubsimppdf-imp-instance-mask.jpg)