Embed Size (px)
Citation preview
Moorthy et. al., page 1 of 20.
Mass spectral similarity mapping applied to fentanyl analogs 1
A.S. Moorthy a*, A.J. Kearsley b, W.G. Mallard a,c, and W.E. Wallace a 2
a – Mass Spectrometry Data Center, Biomolecular Measurement Division, National Institute of 3
Standards and Technology (NIST), Gaithersburg, MD, 20899-8362 4
b – Mathematical Analysis and Modeling Group, Applied and Computational Mathematics 5
Division, National Institute of Standards and Technology, Gaithersburg, MD, 20899-8910 6
c – NIST Associate 7
* To whom correspondence should be addressed: Arun Moorthy, [email protected]. 8
9
Abstract: This manuscript outlines a straight-forward procedure for generating a map of similarity 10
between spectra of a set. When applied to a reference set of spectra for Type I fentanyl analogs 11
(molecules differing from fentanyl by a single modification), the map illuminates clustering that 12
is applicable to automated structure assignment of unidentified molecules. An open-source 13
software implementation that generates mass spectral similarity mappings of unknowns against a 14
library of Type I fentanyl analog spectra is available at http://github.com/asm3-15
nist/FentanylClassifier. 16
Keywords: Drug Identification, Fentanyl, Hybrid Match Factors, k-means Clustering, Mass 17
Spectral Library Searching, Mass Spectral Similarity Mapping, Multidimensional Scaling. 18
19
1 Introduction 20
Compound identification is a fundamental task in forensic chemistry. A common tool towards this 21
process is mass spectral library searching [1–4]. The mass spectrum of an analyte is compared to 22
a database of spectra for known compounds, returning a hit list of entries with similar spectra to 23
the analyte. Ideally, top hits will provide an analyst adequate information to correctly infer the 24
identity of an analyte. It is important to note that the eventual classification of the analyte is still a 25
human task - the burden of identification resides with the analyst. 26
This manuscript introduces a natural extension to traditional mass spectral library searching – mass 27
spectral similarity mapping. In addition to returning a hit list of database entries with similar 28
spectra to the analyte spectrum, the mass spectral similarity mapping procedure generates a map 29
of spectral similarity between the hit list spectra themselves. The map can then be scrutinized using 30
numerical techniques. The objective of this extension is to provide analysts with additional 31
information which can improve confidence in identifying analytes, and may eventually lead to 32
automated classification with quantifiable uncertainty. 33
34
35

Moorthy et. al., page 2 of 20.
2 Materials and Methods 1
2.1 Mass Spectral Library Searching 2
Several descriptions of mass spectral library search procedures have been presented in the 3
literature [5–7]. Revisiting these with self-consistent notation is necessary for comprehensive 4
discussion of the extension presented in this manuscript. To this end, we discuss mass spectra, 5
match factors, and library searching in the context of unit mass resolution mass spectra obtained 6
with electron ionization (EI) mass spectrometry. 7
Mass spectra: Let 𝒎𝑥 = {𝑚1, 𝑚2, … , 𝑚𝑛} and 𝒂𝑥 = {𝑎1, 𝑎2, … , 𝑎𝑛} be ordered sets of 𝑛 mass-to-8
charge values and relative abundances, respectively, in mass spectrum 𝑥. Note that a measured 9
relative abundance corresponds to a recorded mass: 𝒂𝑥 = 𝑓(𝒎𝑥). Spectrum 𝑥 is easily represented 10
as a vector 𝒂𝑥∗ of length 𝑚upper where each element is defined by 11
𝒂𝑥∗ [𝑖] = {√𝑓(𝑖) if 𝑖 ∈ 𝒎𝑥
0 otherwise, (1)
12
for all 1 ≤ 𝑖 ≤ 𝑚upper and 𝑚𝑛 ≤ 𝑚upper. In (1), the square root of relative abundance recorded in 13
the spectrum are elements of the representative vector. Other methods of transforming relative 14
abundance when constructing representative vectors, including mass weighting, have been studied 15
with varied success [5,8,9]. 16
Match Factors: Accurately characterizing the similarity between pairs of spectra is integral to any 17
library search procedure. A commonly employed class of numerical approximations to mass 18
spectral similarity are match factors. This class of approximations are extensions to traditional 19
cosine similarity between two non-zero vectors. A simple match factor (𝑠𝑀𝐹) between spectra 𝑥1 20
and 𝑥2 is defined by, 21
𝑠𝑀𝐹(𝑥1, 𝑥2) = ⌊𝐶1 ⋅
(∑ 𝒂𝑥1∗ [𝑖] ⋅ 𝒂𝑥2
∗ [𝑖]𝑖 )2
(∑ 𝒂𝑥1∗ [𝑖]𝑖
2) ⋅ (∑ 𝒂𝑥2
∗ [𝑖]𝑖2
)⌉,
(2)
where we use the notation ⌊⋅⋅⌉ to indicate rounding to the nearest integer. For historical reasons, 22
match factors computed using (2) are implemented such that the constant 𝐶1 is 999. Simple match 23
factors approaching 𝐶1, suggesting that the spectra are very similar, are computed between spectra 24
of molecules that contain fragment-ions with the same mass-to-charge values. Ideally, this means 25
the spectra are replicate measurements of one molecule that can then be uniquely identified. 26
However, some isomers and structural analogs also result in spectra with simple match factors 27
approaching 𝐶1. A hybrid match factor (hMF) between spectra 𝑥1 and 𝑥2 requires the known or 28
estimated molecular mass difference between the compounds producing the spectra, DeltaMass 29
(Δ1,2), be provided. The hMF is defined by, 30

Moorthy et. al., page 3 of 20.
ℎ𝑀𝐹(𝑥1, 𝑥2, Δ1,2) = 𝑠𝑀𝐹(𝑥1, ℎ) = 𝑠𝑀𝐹 (𝑥1, hs1(𝑥1, 𝑥2, Δ1,2)) , (3)
1
where hs1 is an algorithm that constructs a hybrid spectrum, ℎ, by allowing peaks from 𝑥2 to be 2
shifted by DeltaMass such that its simple match factor with 𝑥1 is maximized. Hybrid Match Factors 3
approaching 𝐶1 occur between spectra of compounds that contain fragment ions with identical 4
mass or that are shifted by the molecular mass difference between the compounds. These are 5
typically spectra of analog molecules with structural modifications that only appear in a single 6
fragmentation pathway – cognates – as well as spectra associated with the same molecules with 7
large simple match factors. More details about simple and hybrid match factors can be found in 8
[5–7,10]. 9
Library Searching: Let 𝒍 = {𝑙1, 𝑙2, … , 𝑙𝑀} be a library of 𝑀 measured reference spectra. Each 10
reference spectrum 𝑙𝑖 can be described as a vector using (1) and its associated simple and hybrid 11
match factors with a representative vector of a query spectrum, 𝑞, can be computed using (2) and 12
(3), respectively. A Simple Search, or Hybrid Search, of 𝑞 will return a hit list of the reference 13
spectra in order of decreasing associated match factors. Several manuscripts describing the general 14
effectiveness of library searching can be found in the literature [5,11–13] as can recent examples 15
of the Hybrid Search applied to electrospray ionization tandem mass spectra [14–20]. 16
2.2 Mass Spectral Similarity Mapping: 17
Given a set of spectra, 𝒙 = {𝑥1, 𝑥2, … , 𝑥𝑛}, we can create a similarity map, 𝑹𝒙, as an 𝑛 × 𝑛 matrix 18
of pair-wise similarity between all elements of 𝒙. Each element of 𝑹𝒙 is computed as 19
𝑹𝒙[𝑖, 𝑗] = 𝜉(𝑥𝑖, 𝑥𝑗) , (4)
20
where the function 𝜉 is a mass spectral similarity measure such as (2) or (3), or others as outlined 21
in literature [21,22]. The square matrix 𝑹𝒙 is populated by non-negative real entries. Analysis of 22
the map, particularly when using commonly employed numerical algorithms, may benefit from 23
the map being symmetric. We can generate the symmetric similarity map 𝑺𝒙 as follows 24
𝑺𝒙 =1
2(𝑹𝒙 + 𝑹𝒙
𝑇), (5)
25
where 𝑹𝒙𝑇 is the transpose of 𝑹𝒙. Note that if 𝑹𝒙 is itself symmetric, 𝑹𝒙 = 𝑹𝒙
𝑇 = 𝑺𝒙. A dissimilarity 26
map based on 𝑺𝒙 can then be constructed 27
𝑫𝒙 = 𝟏𝑛 −1
𝜉∗ 𝑺𝒙, (6)
28
where 𝟏𝑛 is an 𝑛 × 𝑛 all-ones matrix, and 𝜉∗ is the maximum score of the employed similarity 29
measure. If the set 𝒙 is constructed as follows, 30
Moorthy et. al., page 4 of 20.
𝒙[𝑖] = { 𝑞 if 𝑖 = 1,
𝑙𝑖−1 if 2 ≤ 𝑖 ≤ 𝑁, (7)
1
where 𝑞 is a query spectrum and 𝑙𝑖 ∈ 𝒍 are library spectra as described in Section 2.1, and 𝑁 =2
𝑀 + 1 where 𝑀 is the number of reference spectra in the library, the mass spectral similarity map 3
𝑹𝒙 will contain all the information that would be obtained in a traditional library search of 𝑞 against 4
library 𝒍. We refer to the process of constructing a set 𝒙 as in (7), generating maps as in (4) through 5
(6) as augmented mass spectral library searching because the resulting maps, which we refer to 6
as a hit maps, contain the hit list results of a traditional mass spectral library as well as additional 7
relationships between the hit list spectra. 8
3 Application of Mass Spectral Similarity Mapping to Fentanyl Analogs 9
The number of incidents of opioid abuse is a growing concern [23]. The rise of fentanyl and related 10
analogs, synthetic opioids with fast onset and high therapeutic index (see [24,25] and references 11
therein), is a major contributor to this social problem. Forensic practitioners struggle to provide 12
confident identifications when encountering novel designer fentanyl analogs [26]. This section of 13
the manuscript describes how constructing a mass spectral similarity map of fentanyl analog 14
spectra, as described in sections 2.1 and 2.2, can be used to determine whether a query spectrum 15
is a fentanyl molecule, or an analog that differs from fentanyl by up to two modifications. 16
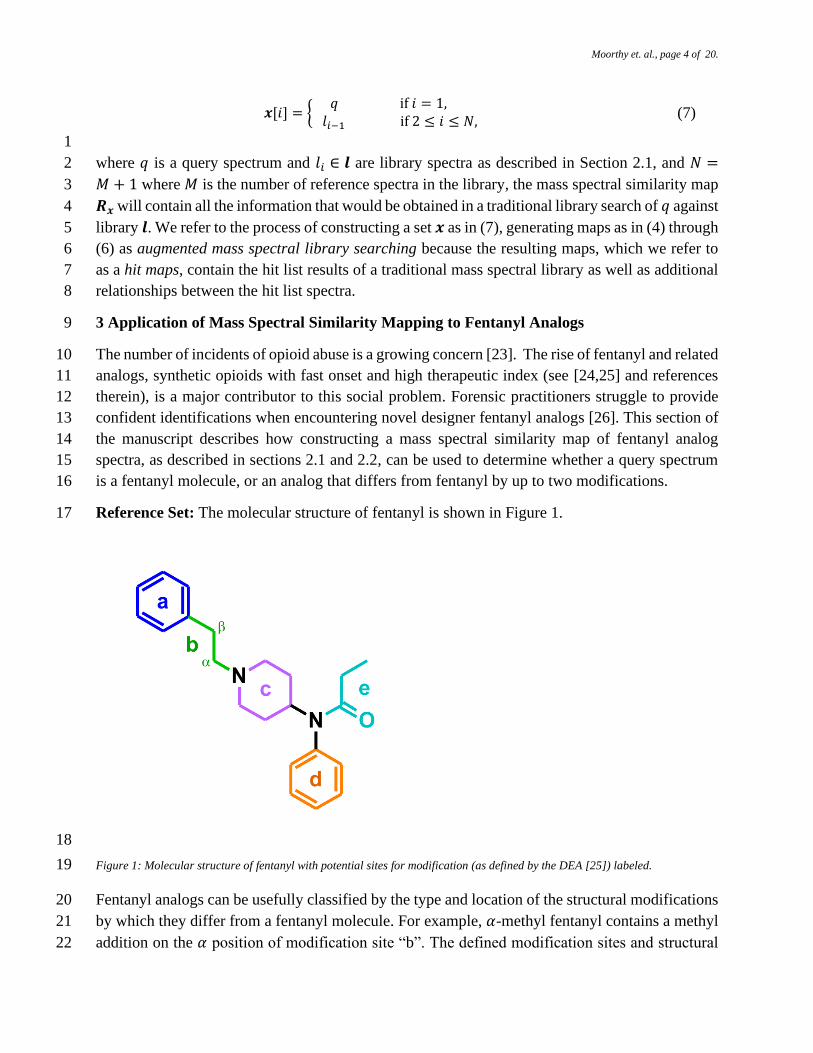
Reference Set: The molecular structure of fentanyl is shown in Figure 1. 17
18
Figure 1: Molecular structure of fentanyl with potential sites for modification (as defined by the DEA [25]) labeled. 19
Fentanyl analogs can be usefully classified by the type and location of the structural modifications 20
by which they differ from a fentanyl molecule. For example, 𝛼-methyl fentanyl contains a methyl 21
addition on the 𝛼 position of modification site “b”. The defined modification sites and structural 22
Moorthy et. al., page 5 of 20.
scaffold in Figure 1 are an interpretation derived from the definitions provided in [27]. We 1
introduce the notion of fentanyl analog type in this manuscript, indicating the number of structural 2
locations (modification sites) by which an analog differs from the molecule fentanyl. For example, 3
𝛼-methyl fentanyl is considered a Type I fentanyl analog, as it differs from fentanyl at a single 4
modification site. Type II analogs have modifications in two locations, and so forth for Types III-5
V. If an analog has two modifications that exist on a single modification site, it would be 6
considered a Type I analog. The spectra and structure information for all Type I fentanyl analogs, 7
along with the spectrum for the molecule fentanyl, contained in the Scientific Working Group for 8
the Analysis of Seized Drugs (SWGDRUG) Mass Spectral Library version 3.3 [28] form the 9
reference set, or library, used in this investigation. The library totals 44 mass spectra, all unique 10
compounds (no replicates). 11
Mapping: Following the methods outlined in Section 2.2, a map of the Type I fentanyl reference 12
set can be generated. As we are primarily concerned with classification as a step toward 13
identification in this study, we exclusively employed hybrid similarity match factors to 14
approximate spectral similarity when generating maps. Multidimensional Scaling (MDS) is a 15
procedure for representing measurements of dissimilarity among pairs of objects as distances 16
between points in a low-dimensional space while preserving correlations from the original data as 17
best as possible [29–32]. While other techniques for looking at high dimensional data have been 18
employed in forensic applications [33–35], MDS has previously been successfully applied to 19
studying the quality of mass spectral libraries [36], motivating its application in this context. By 20
using MDS to project the Type I fentanyl analog dissimilarity matrices down to two dimensions, 21
we can easily visualize the space. We refer to this 2D projection as mass spectral similarity space. 22
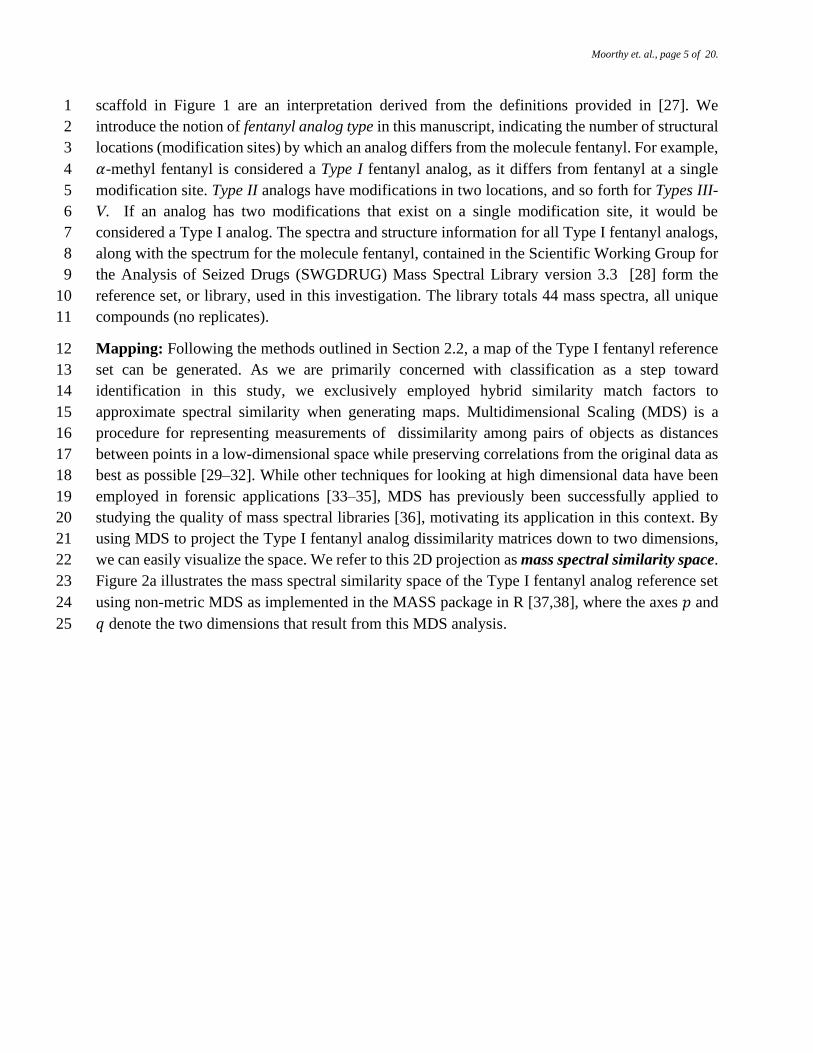
Figure 2a illustrates the mass spectral similarity space of the Type I fentanyl analog reference set 23
using non-metric MDS as implemented in the MASS package in R [37,38], where the axes 𝑝 and 24
𝑞 denote the two dimensions that result from this MDS analysis. 25
Moorthy et. al., page 6 of 20.
1
Figure 2: (a) Mass spectral similarity space of the Type I fentanyl analog reference set visualized by non-metric 2 Multidimensional Scaling of dissimilarity matrices generated using hybrid similarity match factors and the methods outlined in 3 Section 2.2. Each point in the mass spectral similarity space represents a mass spectrum of a molecule and its coloring indicates 4 at which modification site it differs from fentanyl (labeled 13, in red). Groups 1-3 were discovered through k-means clustering of 5 the mass spectral similarity space data, with bold black dots indicating cluster centers and dotted outlines indicating the 50% 6 (inner) and 95% (outer) confidence ellipse around each center. (b) Spectra associated with points 13, 28 and 9 in spectral 7 similarity space. 8

Moorthy et. al., page 7 of 20.
1
Spectral Related Index (SRI): Defined for the first time in this manuscript, the spectral 2
relatedness index (SRI) between any pair of mass spectra is given by 3
SRI𝑥𝑖,𝑥𝑗
=ℎ𝑀𝐹(𝑥𝑖, 𝑥𝑗)
ℎ𝑀𝐹∗max (0, 𝑑𝑥𝑖,𝑥𝑗
) , (8)
4
where ℎ𝑀𝐹(𝑥𝑖, 𝑥𝑗) is the hybrid match factor between mass spectra 𝑥𝑖 and 𝑥𝑗, ℎ𝑀𝐹∗ is a constant 5
999, indicating the maximum computable hybrid match factor, and 6
𝑑𝑥𝑖,𝑥𝑗= 1 −
√(𝑝𝑥𝑖− 𝑝𝑥𝑗
)2
+ (𝑞𝑥𝑖− 𝑞𝑥𝑗
)2
𝐶2 ,
(9)
where (𝑝𝑥𝑖, 𝑞𝑥𝑖
) and (𝑝𝑥𝑗, 𝑞𝑥𝑗
) are the coordinates of the points representing mass spectra 𝑥𝑖 and 𝑥𝑗, 7
respectively, in 2D mass spectral similarity space (Figure 2a) and 𝐶2 is an algorithmic parameter 8
indicating the maximum distance of interest between points in mass spectra similarity space. In the 9
present implementation of the algorithm, 𝐶2 is set to √8, the computed distance assuming that 10
coordinates differ by two units in both directions, beyond which the spectral related index is 11
unlikely to be informative. The optimal value of 𝐶2 will depend on how well clusters separate in 12
similarity space and may vary greatly for different classes of compounds and spectra. The SRI 13
provides a useful and complimentary indicator when match factors alone are ambiguous. 14
Clustering: Visualizing the spectral similarity space of the Type I fentanyl analog reference set 15
discloses three distinct groups of mass spectra (see Figure 2a) which we refer to as Groups 1, 2, 16
and 3. The existence and nature of these groups was unanticipated prior to employing our mapping 17
and performing an MDS analysis of the results. Group 1 spectra generate high match factors 18
without shifted peaks. Group 2 spectra have a single major peak (the base peak) shifted by 19
precisely the mass difference between the analog and fentanyl. Group 3 spectra have three major 20
shifts by the mass difference between the analog and fentanyl. Some broad observations can be 21
made about the resulting groups: typically, spectra of Type I fentanyl analogs with a modification 22
on site a or b were in Group 1, spectra of analogs with a modification on site e were in Group 2, 23
and spectra of analogs with a modification on site d were in Group 3. While these observations 24
appear to be valid in a majority of compounds tested, an exception is 𝛼-methyl fentanyl which has 25
a modification on the 𝛼 carbon of site b yet falls into Group 3. This unique example illustrates how 26
classes determined by structure, as categorized by the DEA [27], may not always be reflected in 27
the mass spectra; the common cleavage site of fentanyl analogs is the bond between the 𝛼 and 𝛽 28
carbons and so any modification on the 𝛼 carbon will result in a shifted fragment (see Figure 2b). 29
A recent investigation of fentanyl analogs using EI coupled with high-resolution mass 30
spectrometry has illuminated several fragmentation pathways [39]. Analogs in the reference set 31
with a modification on site c were contained in either Group 2 or 3 depending on the modification. 32

Moorthy et. al., page 8 of 20.
In particular, carfentanil is located just outside the 0.95 ellipse centered around Group 2, and 3-1
methylfentanyl lands within Group 3, near the ellipse center. 2
Heuristics for automated structure proposal for a query mass spectrum: Given a mass spectral 3
similarity map constructed through augmented library searching (see Section 2.2) of a query mass 4
spectrum against the Type I fentanyl analog reference set, a preliminary set of tests with just the 5
hit list can be used to decide whether or not the query is a fentanyl, Type I or Type II analog. A 6
flowchart summarizing these tests is provided as Figure 3. 7
8
9
10
11
12
13
14
15
16
17
18

Moorthy et. al., page 9 of 20.
1
Once determined that a query is a Type I or II fentanyl analog, assessment of spectral similarity 2
space can suggest a potential structure. If deemed a Type I analog, the probable site at which the 3
query differs from fentanyl is determined by the group in which the query spectrum lands as a 4
point in spectral similarity space. Specifically, the distance between the query point and each group 5
center point is computed using (9) where, for example, (𝑝𝑥𝑖, 𝑞𝑥𝑖
) are the coordinates of the query 6
point and (𝑝𝑥𝑗, 𝑞𝑥𝑗
) are the coordinates of a group center point. If the query point to Group 1 center 7
point has the shortest distance, the query likely differs from fentanyl by a moiety on site a or b. 8
Similarly, if the shortest distance is measured to the Group 2 center point the query is likely a 9
fentanyl analog modified on site e, and the query is likely a fentanyl analog modified on site d if 10
the shortest distance measured is to the Group 3 center point. Additionally, if a spectrum within 11
the reference set is representative of the analyte, as determined by a large hMF and SRI with the 12
query spectrum and a DeltaMass value of zero, then the probable moiety by which the analyte 13
differs from fentanyl can be determined. 14
The probable sites of modification for a Type II analog query are determined by the two group 15
centers with shortest distances to the query point in spectral similarity space. For example, if the 16
Figure 3: “Fentanyl Type” decision-making heuristic for determining the likely classification of an unidentified compound from
its electron ionization mass spectrum searched against the Type I fentanyl analog reference set. The example match factor cutoff
(650), 𝛼 value (1.2), and spectral relatedness cutoff (0.85) were empirically determined for a small set of examples.

Moorthy et. al., page 10 of 20.
shortest distances to the query point are from the center of groups 2 and 3, the query is likely 1
modified at sites d and e. As there are no Type II analogs in the reference set, the determination of 2
the potential moieties by which the Type II analog query differs from fentanyl is done indirectly. 3
Every Type II fentanyl analog will be a cognate to exactly two Type I analogs. For example, the 4
Type II fentanyl analog “para-methyl-acetylfentanyl” is a cognate with “acetylfentanyl” and also 5
with “para-methylfentanyl” (See Figure 4). For a given Type II fentanyl analog, we refer to the 6
pair of Type I analogs to which it differs from each by a single modification as composing cognates 7
of the Type II analog. The potential composing cognates of a query are identified as the spectra 8
within the two previously identified modification groups with hybrid match factors greater than a 9
match factor cut-off (e.g. 850). If no such spectra are contained in the reference set, and thus the 10
groups, the fentanyl classifier cannot give more information than the probable sites of 11
modification. 12

Moorthy et. al., page 11 of 20.
1
Figure 4: A visual demonstration of the "composing cognate" concept. Acetyl fentanyl (b) and Para-methyl fentanyl (c) are Type I 2 fentanyl analogs, each differing from fentanyl (a) by a single modification that affects only a single fragmentation pathway; they 3 are cognates with fentanyl. Additionally, (b) and (c) are composing cognates of the Type II fentanyl analog Para-methyl acetyl 4 fentanyl (d) as they are the only cognates that are Type I analogs. Note that the pairs (a) and (d) and the pairs (b) and (c) are not 5 cognates as the molecules differ by more than one modification. 6
Moorthy et. al., page 12 of 20.
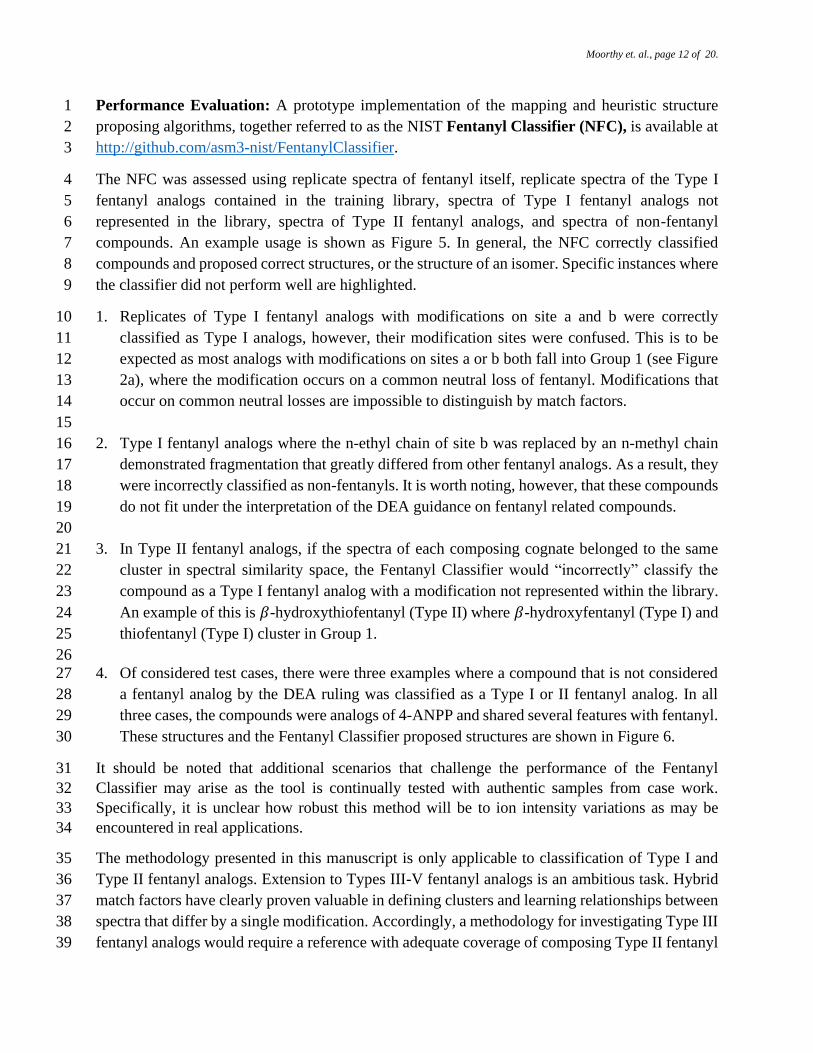
Performance Evaluation: A prototype implementation of the mapping and heuristic structure 1
proposing algorithms, together referred to as the NIST Fentanyl Classifier (NFC), is available at 2
http://github.com/asm3-nist/FentanylClassifier. 3
The NFC was assessed using replicate spectra of fentanyl itself, replicate spectra of the Type I 4
fentanyl analogs contained in the training library, spectra of Type I fentanyl analogs not 5
represented in the library, spectra of Type II fentanyl analogs, and spectra of non-fentanyl 6
compounds. An example usage is shown as Figure 5. In general, the NFC correctly classified 7
compounds and proposed correct structures, or the structure of an isomer. Specific instances where 8
the classifier did not perform well are highlighted. 9
1. Replicates of Type I fentanyl analogs with modifications on site a and b were correctly 10
classified as Type I analogs, however, their modification sites were confused. This is to be 11
expected as most analogs with modifications on sites a or b both fall into Group 1 (see Figure 12
2a), where the modification occurs on a common neutral loss of fentanyl. Modifications that 13
occur on common neutral losses are impossible to distinguish by match factors. 14
15
2. Type I fentanyl analogs where the n-ethyl chain of site b was replaced by an n-methyl chain 16
demonstrated fragmentation that greatly differed from other fentanyl analogs. As a result, they 17
were incorrectly classified as non-fentanyls. It is worth noting, however, that these compounds 18
do not fit under the interpretation of the DEA guidance on fentanyl related compounds. 19
20
3. In Type II fentanyl analogs, if the spectra of each composing cognate belonged to the same 21
cluster in spectral similarity space, the Fentanyl Classifier would “incorrectly” classify the 22
compound as a Type I fentanyl analog with a modification not represented within the library. 23
An example of this is 𝛽-hydroxythiofentanyl (Type II) where 𝛽-hydroxyfentanyl (Type I) and 24
thiofentanyl (Type I) cluster in Group 1. 25
26
4. Of considered test cases, there were three examples where a compound that is not considered 27
a fentanyl analog by the DEA ruling was classified as a Type I or II fentanyl analog. In all 28
three cases, the compounds were analogs of 4-ANPP and shared several features with fentanyl. 29
These structures and the Fentanyl Classifier proposed structures are shown in Figure 6. 30
It should be noted that additional scenarios that challenge the performance of the Fentanyl 31
Classifier may arise as the tool is continually tested with authentic samples from case work. 32
Specifically, it is unclear how robust this method will be to ion intensity variations as may be 33
encountered in real applications. 34
The methodology presented in this manuscript is only applicable to classification of Type I and 35
Type II fentanyl analogs. Extension to Types III-V fentanyl analogs is an ambitious task. Hybrid 36
match factors have clearly proven valuable in defining clusters and learning relationships between 37
spectra that differ by a single modification. Accordingly, a methodology for investigating Type III 38
fentanyl analogs would require a reference with adequate coverage of composing Type II fentanyl 39

Moorthy et. al., page 13 of 20.
cognates. It is unclear a priori how many Type II fentanyl analogs are necessary to observe distinct 1
groups (if any), and we are limited by the number of Type II fentanyl analog spectra available. 2
One approach may be developing a new match factor capable of capturing similarity between 3
spectra from compounds that differ by two or more modifications, allowing us to leverage our 4
existing Type I fentanyl analog reference set. 5
Exploring the efficacy of other measures of spectral similarity to generate spectral maps would be 6
a natural extension to this work. For example, there are several recent manuscripts exploring 7
statistical approaches that assign likelihoods of correct identification [40,41]. Combining such 8
approaches with clustering methods presented here could provide a quantifiable uncertainty with 9
a proposal of possible or likely structure. Additionally, revisiting statistical procedures employed 10
by the Fentanyl Classifier with a focus on optimization would be a fruitful endeavour. At present, 11
the choice of MDS to two dimensions and k-means clustering was aided by the experience of the 12
authors, but it is possible that better classification can be attained using alternative methods of 13
dimension reduction, such as principal component analysis, or refined clustering schemes. 14
Considering higher dimensions with MDS and optimizing parameters is also future work of 15
interest. 16
The present implementation is not capable of distinguishing positional isomers when proposing 17
structures. Incorporating recent advancements in isomer identification [42] would strengthen the 18
capabilities of our methods and the incorporation of these ideas into the Fentanyl Classifier is on-19
going work. 20

Moorthy et. al., page 14 of 20.
1

Moorthy et. al., page 15 of 20.
Figure 5: An example usage of the methodology to propose structure of an experimental query spectrum. A query spectrum is 1 searched against the reference set. “Spectral similarity space” illustrating query and all reference spectra is generated. Based 2 on the hit list and spectral similarity space, Fentanyl Classifier determined that the query spectrum was a Type II fentanyl 3 analog. One of the Type I composing cognates was not in the reference set and so only the modification site was indicated in the 4 proposed structure. A full implementation of the methodology is available at http://github.com/asm3-nist/FentanylClassifier. 5
6
7

Moorthy et. al., page 16 of 20.
1 Figure 6: 4-ANPP analogs incorrectly classified as Type I or II fentanyl analog. 2
3
4
5
6
Moorthy et. al., page 17 of 20.
4 Conclusions 1
This manuscript described a method to generate mass spectral similarity hit maps from EI mass 2
spectra, and reported on the efficacy of this methodology when applied to a reference set of 3
fentanyl analogs. In particular, generating a hit map of Type I fentanyl analogs illuminated clusters 4
that can then be employed to classify spectra of designer fentanyl analogs. When a reference 5
spectrum of the query is contained in the reference set, the map can predict the compound structure 6
with reasonable accuracy. It was shown that the spectra of Type I fentanyl analogs fall into three 7
groups based on the number of shifted peaks necessary to generate a high hybrid match factor with 8
fentanyl. Extending the fentanyl classification methodology to (i) better distinguish positional 9
isomers, and (ii) to investigate Types III-V fentanyl analogs, is ongoing work. 10
5 Acknowledgments 11
The authors would like to thank Prof. David Sparkman (University of the Pacific) for his valuable 12
feedback while preparing this manuscript and accompanying software. 13
6 References 14
[1] R.M. Silverstein, G.C. Bassler, Spectrometric Identification of Organic Compounds, J. 15
Chem. Educ. 39 (1962) 546–553. doi:10.1021/ed039p546. 16
[2] D.J. Creek, W.B. Dunn, O. Fiehn, J.L. Griffin, R.D. Hall, Z. Lei, R. Mistrik, S. Neumann, 17
E.L. Schymanski, L.W. Sumner, R. Trengove, J.-L. Wolfender, Metabolite identification: 18
are you sure? And how do your peers gauge your confidence?, Metabolomics. 10 (2014) 19
350–353. doi:10.1007/s11306-014-0656-8. 20
[3] L. Rivier, Criteria for the identification of compounds by liquid chromatography-mass 21
spectrometry and liquid chromatography-multiple mass spectrometry in forensic 22
toxicology and doping analysis, Anal. Chim. Acta. 492 (2003) 69–82. doi:10.1016/S0003-23
2670(03)00889-4. 24
[4] E.L. Schymanski, J. Jeon, R. Gulde, K. Fenner, M. Ruff, H.P. Singer, J. Hollender, 25
Identifying small molecules via high resolution mass spectrometry: Communicating 26
confidence, Environ. Sci. Technol. 48 (2014) 2097–2098. doi:10.1021/es5002105. 27
[5] S.E. Stein, D.R. Scott, Optimization and testing of mass spectral library search algorithms 28
for compound identification, J. Am. Soc. Mass Spectrom. 5 (1994) 859–866. 29
doi:10.1016/1044-0305(94)87009-8. 30
[6] A.S. Moorthy, W.E. Wallace, A.J. Kearsley, D. V. Tchekhovskoi, S.E. Stein, Combining 31
Fragment-Ion and Neutral-Loss Matching during Mass Spectral Library Searching: A 32
New General Purpose Algorithm Applicable to Illicit Drug Identification, Anal. Chem. 89 33
(2017) 13261–13268. doi:10.1021/acs.analchem.7b03320. 34
[7] M.C. Burke, Y.A. Mirokhin, D. V Tchekhovskoi, S.P. Markey, J. Heidbrink Thompson, 35
C. Larkin, S.E. Stein, The Hybrid Search: A Mass Spectral Library Search Method for 36
Discovery of Modifications in Proteomics, J. Proteome Res. 16 (2017) 1924–1935. 37
doi:10.1021/acs.jproteome.6b00988. 38
Moorthy et. al., page 18 of 20.
[8] S. Kim, I. Koo, X. Wei, X. Zhang, A method of finding optimal weight factors for 1
compound identification in gas chromatography – mass spectrometry, Bioinformatics. 28 2
(2012) 1158–1163. doi:10.1093/bioinformatics/bts083. 3
[9] I. Koo, S. Kim, X. Zhang, Comparative analysis of mass spectral matching-based 4
compound identification in gas chromatography-mass spectrometry, J. Chromatogr. A. 5
1298 (2013) 132–138. doi:10.1016/j.chroma.2013.05.021. 6
[10] S.E. Stein, An integrated method for spectrum extraction and compound identification 7
from gas chromatography/mass spectrometry data, J. Am. Soc. Mass Spectrom. 10 (1999) 8
770–781. doi:10.1016/S1044-0305(99)00047-1. 9
[11] S.E. Stein, Estimating probabilities of correct identification from results of mass spectral 10
library searches, J. Am. Soc. Mass Spectrom. 5 (1994) 316–323. doi:10.1016/1044-11
0305(94)85022-4. 12
[12] F.W. Mclafferty, B. Stauffer, M. Zhang, S.Y. Loh, Comparison of Algorithms and 13
Databases for Matching Unknown Mass Spectra, J. Am. Soc. Mass Spectrom. 9 (1998) 14
92–95. doi:10.1016/S1044-0305(97)00235-3. 15
[13] X. Wei, I. Koo, S. Kim, X. Zhang, Compound identification in GC-MS by simultaneously 16
evaluating the mass spectrum and retention index, Analyst. 139 (2014) 2507–2514. 17
doi:10.1039/c3an02171h. 18
[14] C.A. Remoroza, T.D. Mak, M.L.A. De Leoz, Y.A. Mirokhin, S.E. Stein, Creating a Mass 19
Spectral Reference Library for Oligosaccharides in Human Milk, Anal. Chem. 90 (2018) 20
8977–8988. doi:10.1021/acs.analchem.8b01176. 21
[15] I. Blaženović, Y.T. Oh, F. Li, J. Ji, A.-K. Nguyen, B. Wancewicz, J.M. Bender, O. Fiehn, 22
J.H. Youn, Effects of Gut Bacteria Depletion and High-Na + and Low-K + Intake on 23
Circulating Levels of Biogenic Amines, Mol. Nutr. Food Res. 1801184 (2018) 1801184. 24
doi:10.1002/mnfr.201801184. 25
[16] D.K. Barupal, S. Fan, O. Fiehn, Integrating bioinformatics approaches for a 26
comprehensive interpretation of metabolomics datasets, Curr. Opin. Biotechnol. 54 (2018) 27
1–9. doi:10.1016/j.copbio.2018.01.010. 28
[17] I. Blaženović, T. Kind, J. Ji, O. Fiehn, Software Tools and Approaches for Compound 29
Identification of LC-MS/MS Data in Metabolomics, Metabolites. 8 (2018) 31. 30
doi:10.3390/metabo8020031. 31
[18] I. Jang, J. Lee, J. Lee, B.H. Kim, B. Moon, J. Hong, H. Bin Oh, LC–MS/MS Software for 32
Screening Unknown Erectile Dysfunction Drugs and Analogues: Artificial Neural 33
Network Classification, Peak-Count Scoring, Simple Similarity Search, and Hybrid 34
Similarity Search Algorithms, Anal. Chem. 91 (2019) 9119–9128. 35
doi:10.1021/acs.analchem.9b01643. 36
[19] M.C. Burke, Z. Zhang, Y.A. Mirokhin, D. V. Tchekovskoi, Y. Liang, S.E. Stein, False 37
Discovery Rate Estimation for Hybrid Mass Spectral Library Search Identifications in 38
Bottom-up Proteomics, J. Proteome Res. 18 (2019) 3223–3234. 39
doi:10.1021/acs.jproteome.8b00863. 40

Moorthy et. al., page 19 of 20.
[20] B.T. Cooper, X. Yan, Y. Simon-Manso, D. V Tchekhovskoi, Y.A. Mirokhin, S.E. Stein, 1
Hybrid Search: A method for identifying metabolites absent from tandem mass 2
spectrometry libraries, Anal. Chem. 91 (2019) 13924–13932. 3
doi:10.1021/acs.analchem.9b03415. 4
[21] A.S. Moorthy, A.J. Kearsley, Pattern similarity measures applied to mass spectra 5
(submitted), 2020. 6
[22] A.J. Kearsley, A.S. Moorthy, Identifying fentanyl with mass spectral libraries (submitted), 7
2020. 8
[23] K. Humphreys, J.P. Caulkins, V. Felbab-Brown, Opiate of the masses: Stopping an 9
American Epidemic From Going Global, Foreign Aff. 1 (2018) 118–129. 10
doi:10.1111/apha.12736. 11
[24] D. Cooper, M. Jacob, A. Allen, Identification of fentanyl derivatives., J Forensic Sci. 31 12
(1986) 511–528. 13
[25] N. Misailidi, I. Papoutsis, P. Nikolaou, A. Dona, C. Spiliopoulou, S. Athanaselis, 14
Fentanyls continue to replace heroin in the drug arena: the cases of ocfentanil and 15
carfentanil, Forensic Toxicol. 36 (2018) 12–32. doi:10.1007/s11419-017-0379-4. 16
[26] J.B. Morrow, J.D. Ropero-Miller, M.L. Catlin, A.D. Winokur, A.B. Cadwallader, J.L. 17
Staymates, S.R. Williams, J.G. McGrath, B.K. Logan, M.M. McCormick, K.B. Nolte, T.P. 18
Gilson, M.J. Menendez, B.A. Goldberger, The Opioid Epidemic: Moving Toward an 19
Integrated, Holistic Analytical Response, J. Anal. Toxicol. (2018). 20
doi:10.1093/jat/bky049. 21
[27] Federal Register, Vol. 83, No. 25, February 6, 2018, pages 5188–5192. 22
[28] SWGDRUG Mass Spectral Library version 3.3. URL https://swgdrug.org. 23
[29] I. Borg, P.J.F. Groenen, P. Mair, Applied multidimensional scaling, Springer-Verlag 24
Berlin Heidelberg, 2013. 25
[30] A.J. Kearsley, R.A. Tapia, M.W. Trosset, The solution of the metric STRESS and 26
SSTRESS problems in multidimensional scaling using Newton’s method, Comput. Stat. 27
13 (1998) 369–396. 28
[31] A. Buja, D.F. Swayne, M.L. Littman, N. Dean, H. Hofmann, L. Chen, Data visualization 29
with multidimensional scaling, J. Comput. Graph. Stat. 17 (2008) 444–472. 30
doi:10.1198/106186008X318440. 31
[32] S. Agarwal, G. Lanckriet, J. Wills, D. Kriegman, L. Cayton, S. Belongie, Generalized 32
non-metric multidimensional scaling, J. Mach. Learn. Res. 2 (2007) 11–18. 33
[33] D.N. Harris, S. Hokanson, V. Miller, G.P. Jackson, Fragmentation differences in the EI 34
spectra of three synthetic cannabinoid positional isomers: JWH-250, JWH-302, and JWH-35
201, Int. J. Mass Spectrom. 368 (2014) 23–29. doi:10.1016/j.ijms.2014.05.005. 36
[34] B.P. Mayer, A.J. DeHope, D.A. Mew, P.E. Spackman, A.M. Williams, Chemical 37
Attribution of Fentanyl Using Multivariate Statistical Analysis of Orthogonal Mass 38
Moorthy et. al., page 20 of 20.
Spectral Data, Anal. Chem. 88 (2016) 4303–4310. doi:10.1021/acs.analchem.5b04434. 1
[35] J.T. Davidson, G.P. Jackson, The differentiation of 2,5-dimethoxy-N-(N-2
methoxybenzyl)phenethylamine (NBOMe) isomers using GC retention indices and 3
multivariate analysis of ion abundances in electron ionization mass spectra, Forensic 4
Chem. 14 (2019) 100160. doi:10.1016/j.forc.2019.100160. 5
[36] W.E. Wallace, W. Ji, D.V. Tchekhovskoi, K.W. Phinney, S.E. Stein, Mass Spectral 6
Library Quality Assurance by Inter-Library Comparison, J. Am. Soc. Mass Spectrom. 7
(2017) 733–738. doi:10.1007/s13361-016-1589-4. 8
[37] W.N. Venables, B.D. Ripley, Modern Applied Statistics with S, Fourth, Springer, New 9
York, 2002. http://www.stats.ox.ac.uk/pub/MASS4. 10
[38] R Core Team (2018). R: A language and environment for statistical computing, Vienna, 11
Austria. URL https://www.R-project.org/ 12
[39] Q. Nan, W. Hejian, X. Ping, S. Baohua, Z. Junbo, D. Hongxiao, Q. Huosheng, S. Fenyun, 13
S. Yan, Investigation of Fragmentation Pathways of Fentanyl Analogues and Novel 14
Synthetic Opioids by Electron Ionization High-Resolution Mass Spectrometry and 15
Electrospray Ionization High-Resolution Tandem Mass Spectrometry, J. Am. Soc. Mass 16
Spectrom. (2020). doi:10.1021/jasms.9b00112. 17
[40] M.A. Bodnar Willard, R. Waddell Smith, V.L. McGuffin, Statistical approach to establish 18
equivalence of unabbreviated mass spectra, Rapid Commun. Mass Spectrom. 28 (2014) 19
83–95. doi:10.1002/rcm.6759. 20
[41] M.A. Bodnar Willard, V.L. McGuffin, R.Waddell Smith, Statistical comparison of mass 21
spectra for identi fi cation of amphetamine-type stimulants, Forensic Sci. Int. 270 (2017) 22
111–120. doi:10.1016/j.forsciint.2016.11.013. 23
[42] J. Bonetti, Mass spectral differentiation of positional isomers using multivariate statistics, 24
Forensic Chem. 9 (2018) 50–61. doi:10.1016/j.forc.2018.06.001. 25
26