Embed Size (px)
Citation preview
Mass Spectrometry
in Life Science:
Technology and
Data-EvaluationH. Thiele
Bruker Daltonik, Germany

MALDI-TOF Mass SpectrometryProteomics
Functional Genomics
Proteome AnalysisInvestigation of
protein diversity
Genomics
SNP GenotypingSearch
for genetic variations
MALDI-TOF MSIdentification
No a priori knowledgeabout analyte
Screening
Analyte of known MW
Bridging Proteomics & Genomics
Mass Spectrometer Mass Spectrometer
for for
Biopolymer ResearchBiopolymer Research
The Technology
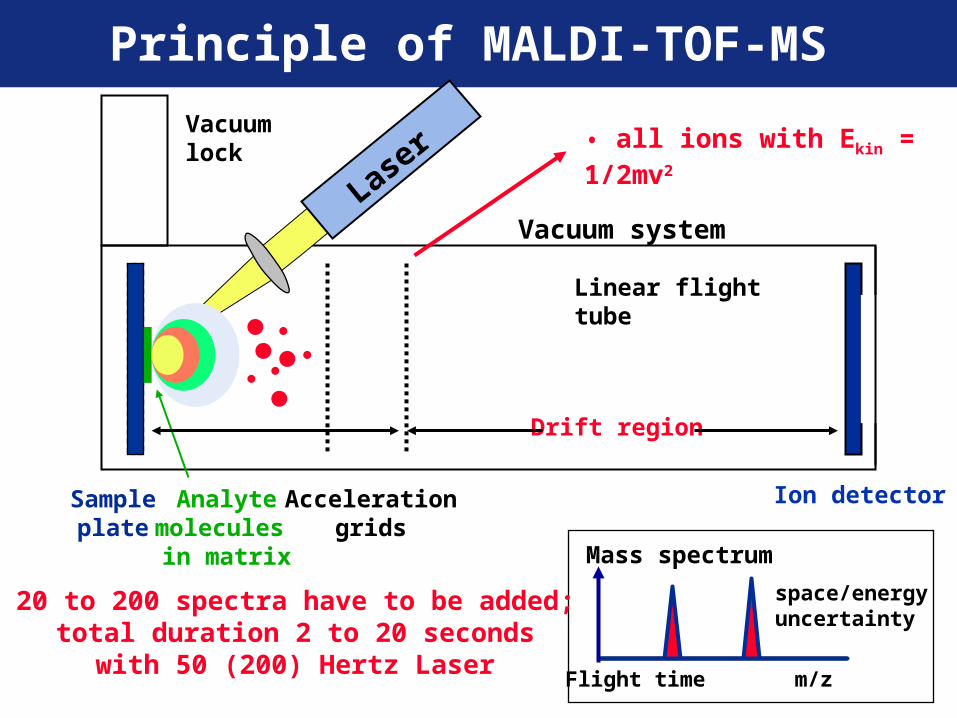
Laser
Sampleplate
Analytemolecules in matrix
Accelerationgrids
Drift region
Ion detector
Mass spectrum
Vacuum system
Vacuumlock
20 to 200 spectra have to be added;total duration 2 to 20 seconds
with 50 (200) Hertz Laser
Principle of MALDI-TOF-MS
Linear flight tube
Flight time m/z
• all ions with Ekin = 1/2mv2
space/energyuncertainty

HiRes mass spectrum
Iondetector
MALDI ionsource
Ion reflector
The reflector focuses ions of same mass but different Ekin (velocity)
on detector;
high resolution is obtained
Laser
High resolution TOF-MS with Reflector
Flight time m/z
0V + kV

MS/MS by PSDMS/MSMS/MS = fragment ion or = fragment ion or
tandem mass tandem mass spectromentryspectromentry
PSDPSD = Post Source Decay = Post Source Decay
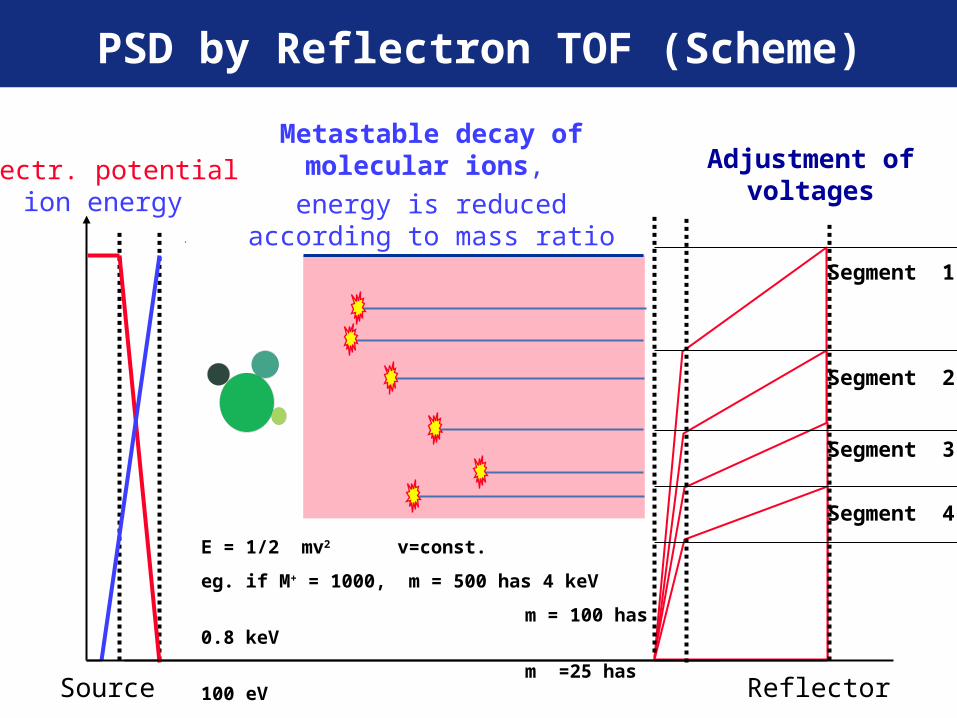
Electr. potentialion energy
Metastable decay of molecular ions,
energy is reduced according to mass ratio
Source Reflector
PSD by Reflectron TOF (Scheme)
Adjustment ofvoltages
Segment 1
Segment 2
Segment 3
Segment 4
E = 1/2 mv2 v=const.
eg. if M+ = 1000, m = 500 has 4 keV
m = 100 has 0.8 keV
m =25 has 100 eV
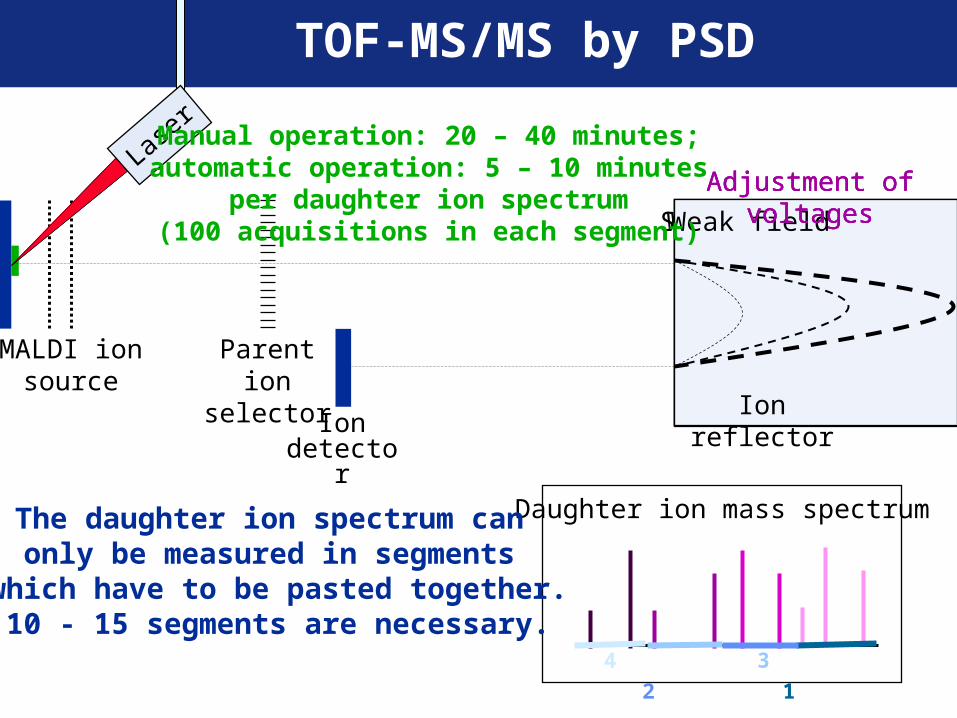
Daughter ion mass spectrum
Iondetector
Parent ionselector
MALDI ionsource
Laser
The daughter ion spectrum can only be measured in segments
which have to be pasted together.10 - 15 segments are necessary.
Strong fieldWeaker fieldWeaker fieldWeak field
Adjustment of voltagesAdjustment of voltagesAdjustment of voltages
Ion reflector
4 3 2 1
Manual operation: 20 – 40 minutes;automatic operation: 5 – 10 minutes
per daughter ion spectrum(100 acquisitions in each segment)
TOF-MS/MS by PSD
In proteomics, many proteins have to be separated and analysed fast to avoid degradation
Regarding structure information,MALDI MS/MS appears to be optimal, but PSD is much too slow !
Consequence: Development of a fast MALDI MS/MS instrument !

MALDI TOF/TOFMALDI TOF/TOFwith post-with post-
accelerationaccelerationby potential LIFTby potential LIFT
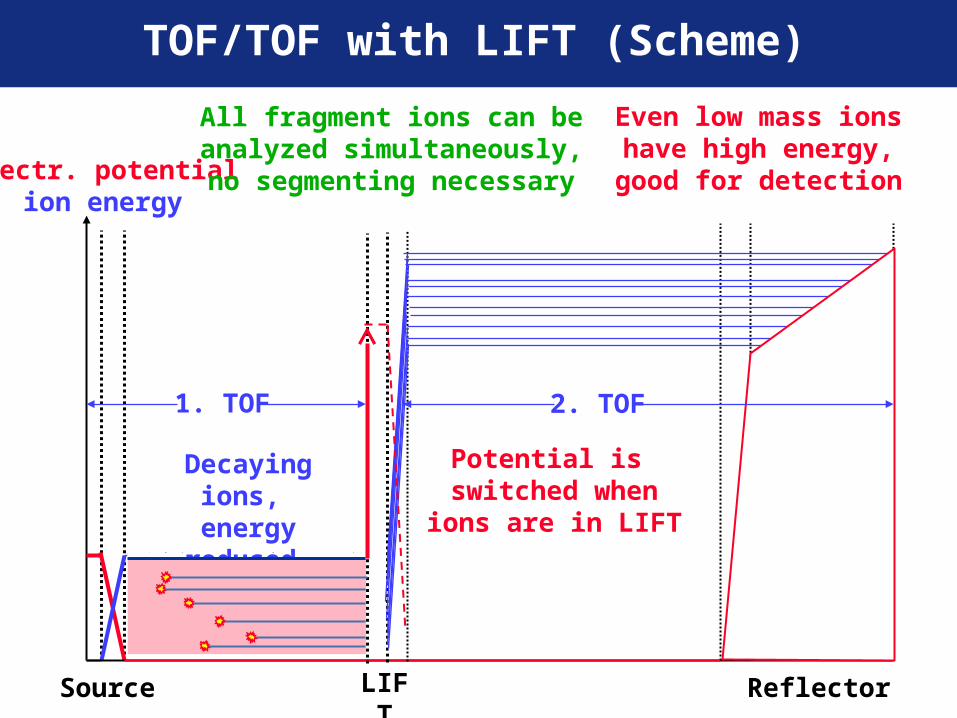
Electr. potentialion energy
Decaying ions, energy reduced,
low speed
Source ReflectorLIFT
All fragment ions can beanalyzed simultaneously,no segmenting necessary
1. TOF 2. TOF
Even low mass ionshave high energy,good for detection
Potential is switched whenions are in LIFT
TOF/TOF with LIFT (Scheme)

Daughter ion mass spectrum
Iondetector
Ion reflector
Parent ionselector
MALDI ionsource
PotentialLIFT for post acceleration
MS/MS spectrum of daughter ionsis measured in a single acquisition;
no pasting of segments;low sample consumption,
high speed, high sensitivity
1 to 200 spectra needed;1 to 10 seconds only
with 20 Hertz laser
Laser
Parent ionsupressor
TOF -MS/MS with post-acceleration by LIFT
LIDLID
CollisionCell (CID)
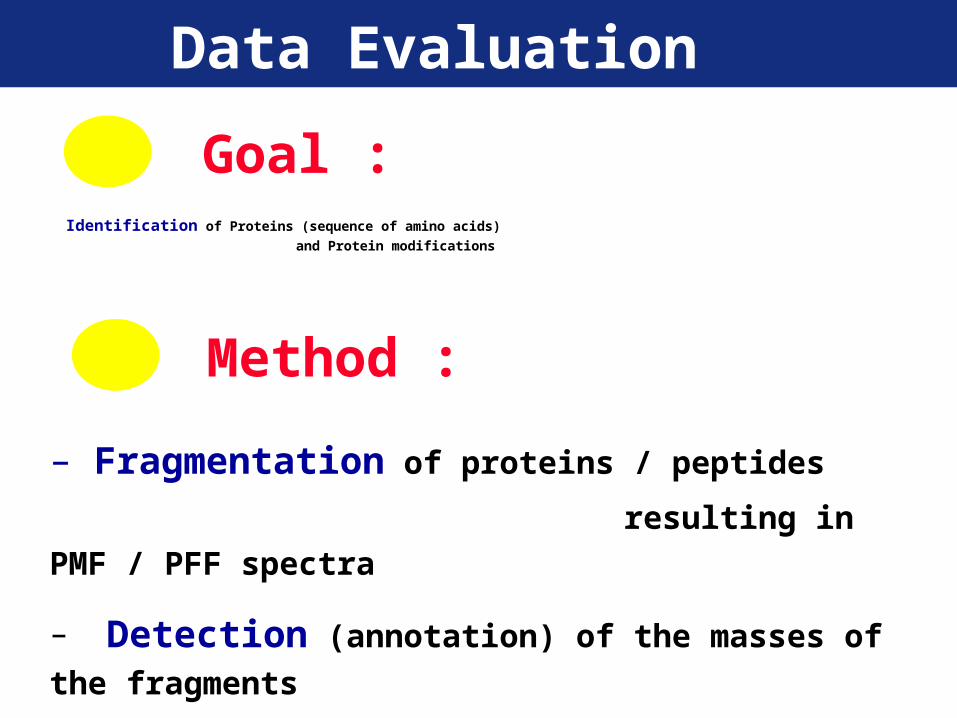
Identification of Proteins (sequence of amino acids)
and Protein modifications
Data Evaluation
Goal :
– Fragmentation of proteins / peptides
resulting in PMF / PFF spectra
– Detection (annotation) of the masses of the fragments
– Identification by database searches
Method :

- Detection of peaks with low signal/noise ratio
- Identification (mass, area, intensity) of (overlapping) isotopic patterns
- Score the results
- Detection of multiple charges (TOF spectra z = 1,2)
average mass
monoisotopic mass
Problems to be solved by Bioinformatics
Detection ofprotonated molecular ion[M+H]+
Isotopicresolution
nominal mass

12C93 1H146 14N24 16O24 32S+ : monoisotopic
Isotopic pattern of peptides
12C93 1H145 2H 14N24 16O24 32S+ : 1.4%,
m=2094.0547
12C92 13C 1H146 14N24 16O24 32S+ : 88.9%,
m=2094.0517
12C93 1H146 14N23 15N 16O24 32S+ : 8.1%,
m=2094.045512C93 1H146 14N24 16O24 33S + : 0.7%, m=2094.0478
12C93 1H146 14N24 16O23 17O1 32S+ : 0.9%,
m=2094.0526
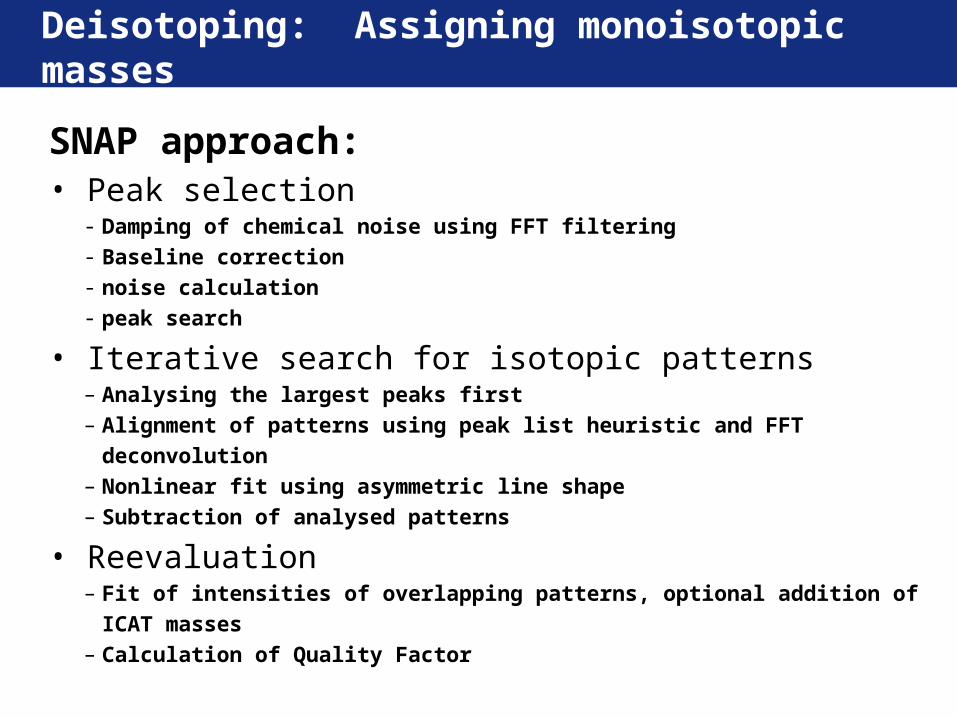
Deisotoping: Assigning monoisotopic masses
SNAP approach:• Peak selection
- Damping of chemical noise using FFT filtering- Baseline correction- noise calculation- peak search
• Iterative search for isotopic patterns– Analysing the largest peaks first– Alignment of patterns using peak list heuristic and FFT deconvolution– Nonlinear fit using asymmetric line shape– Subtraction of analysed patterns
• Reevaluation– Fit of intensities of overlapping patterns, optional addition of ICAT
masses– Calculation of Quality Factor
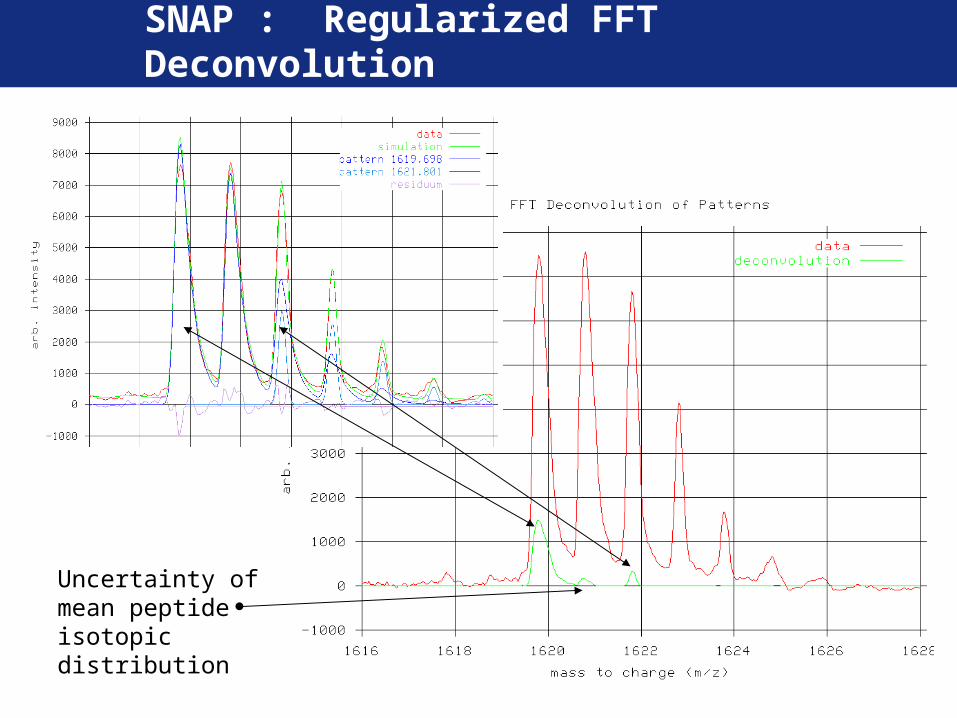
SNAP : Regularized FFT Deconvolution
Uncertainty of mean peptide isotopic distribution

SNAP : Nonlinear Fit
- 2
Exponentially modified gaussians for asymmetric line shapes:
Local optima for least square fit:
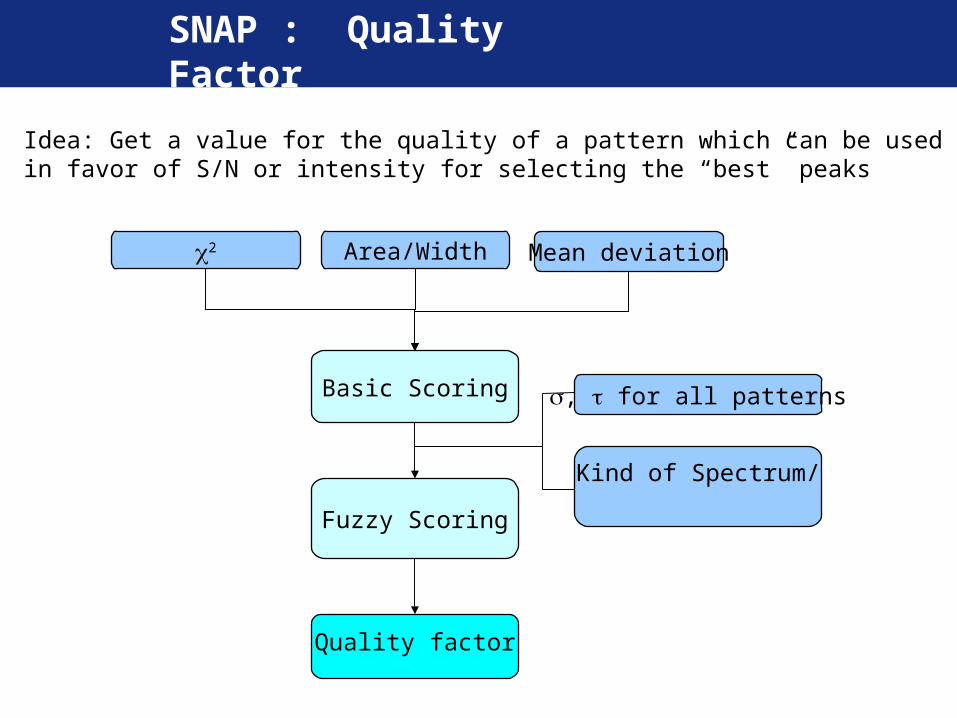
SNAP : Quality Factor
Idea: Get a value for the quality of a pattern which can be usedin favor of S/N or intensity for selecting the “best” peaks
Fuzzy Scoring
Basic Scoring
2 Area/Width Mean deviation
, for all patterns
Kind of Spectrum/
Instrument
Quality factor
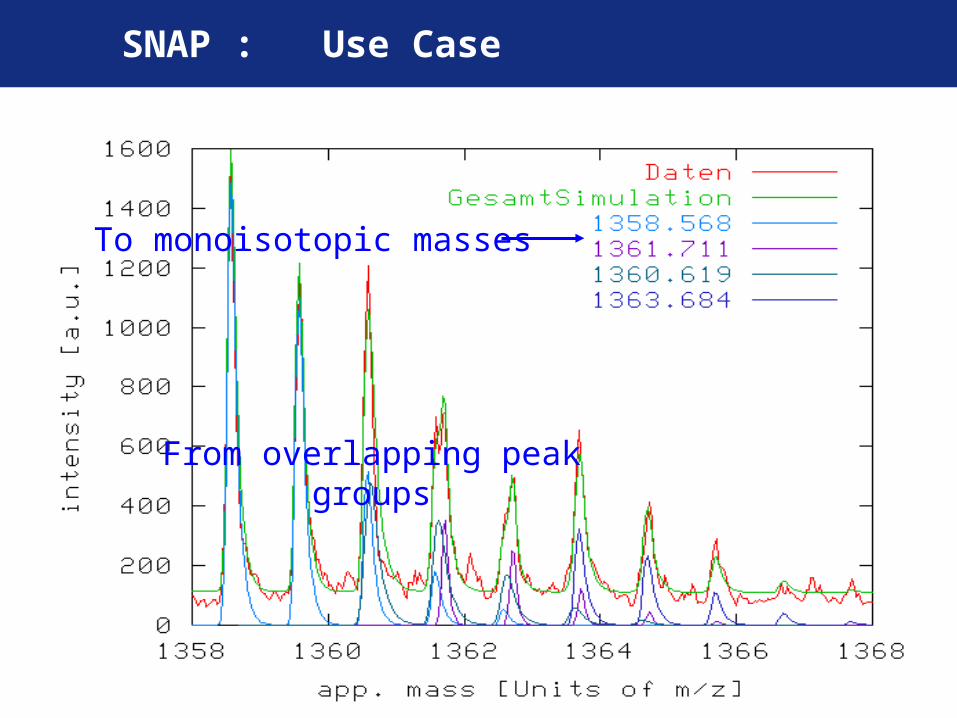
From overlapping peak groups
SNAP : Use Case
To monoisotopic masses
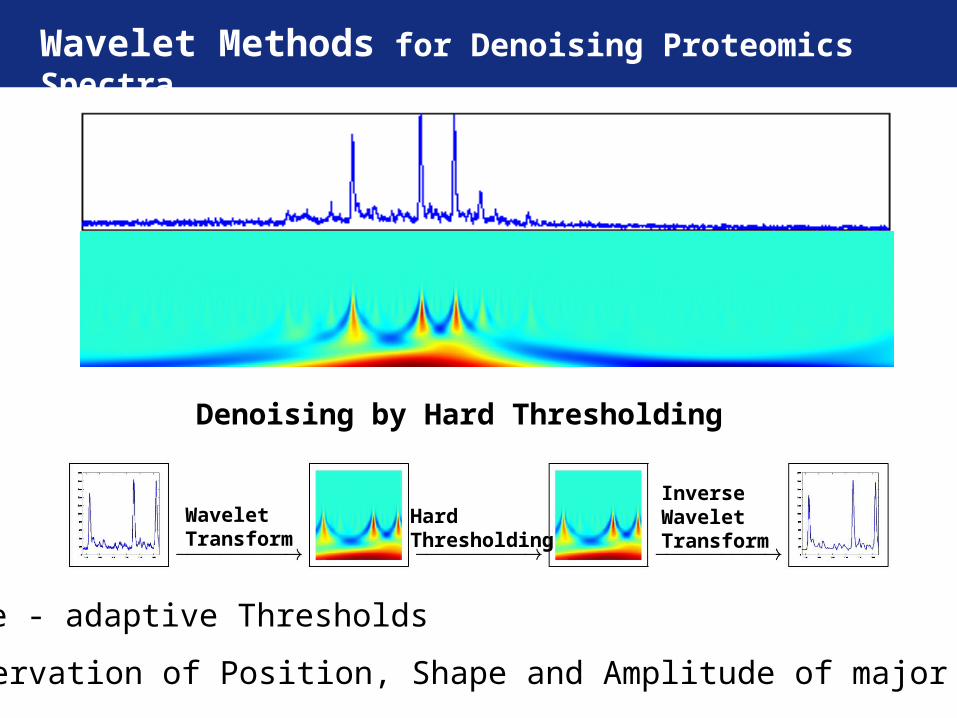
Wavelet Methods for Denoising Proteomics Spectra
Denoising by Hard Thresholding
Scale - adaptive Thresholds
Preservation of Position, Shape and Amplitude of major Peaks
WaveletTransform
HardThresholding
InverseWaveletTransform

Denoising by Hard Thresholding
Further Developments
Baseline Correction
Deconvolution of Isotopic Patterns
Scale-Energy Parameters for enhanced Clustering
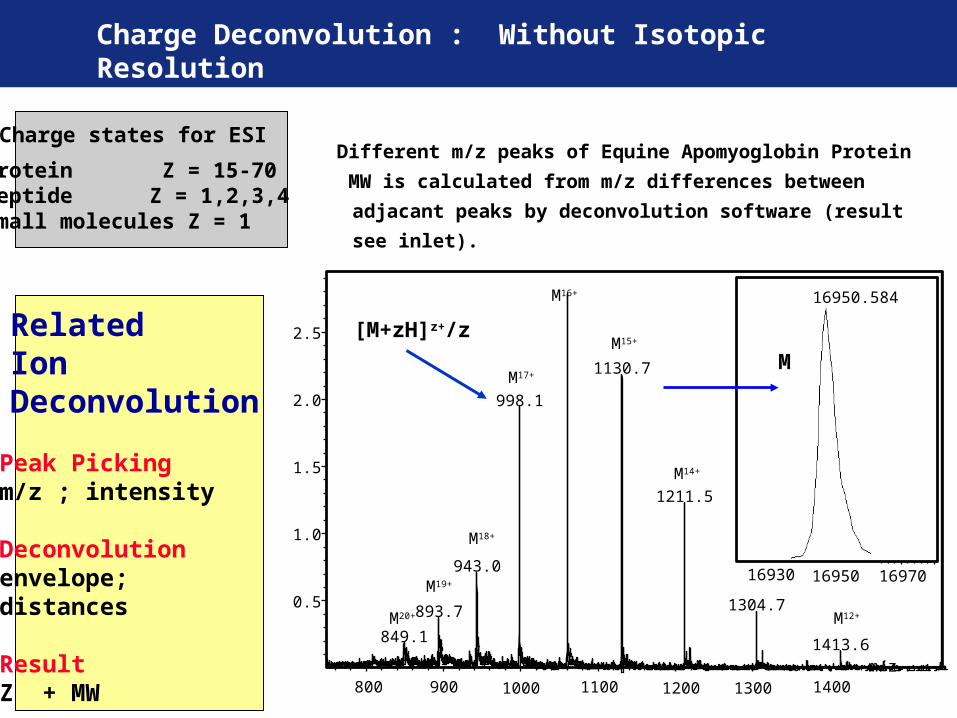
Charge Deconvolution : Without Isotopic Resolution
m/z
Different m/z peaks of Equine Apomyoglobin Protein
MW is calculated from m/z differences between adjacant
peaks by deconvolution software (result see inlet).
M16+
M17+
M14+
M15+
800 900 1000 1100 1200 1300 1400
0.5
1.0
1.5
2.0
2.5
998.1
943.0
893.7
849.1
1130.7
1211.5
1304.7
1413.6
16930 16950 16970
16950.584
M18+
M19+
M20+ M12+
Protein Z = 15-70Peptide Z = 1,2,3,4Small molecules Z = 1
Charge states for ESI
RelatedIonDeconvolution
Peak Pickingm/z ; intensity
Deconvolutionenvelope;distances
ResultZ + MW
[M+zH]z+/z
M
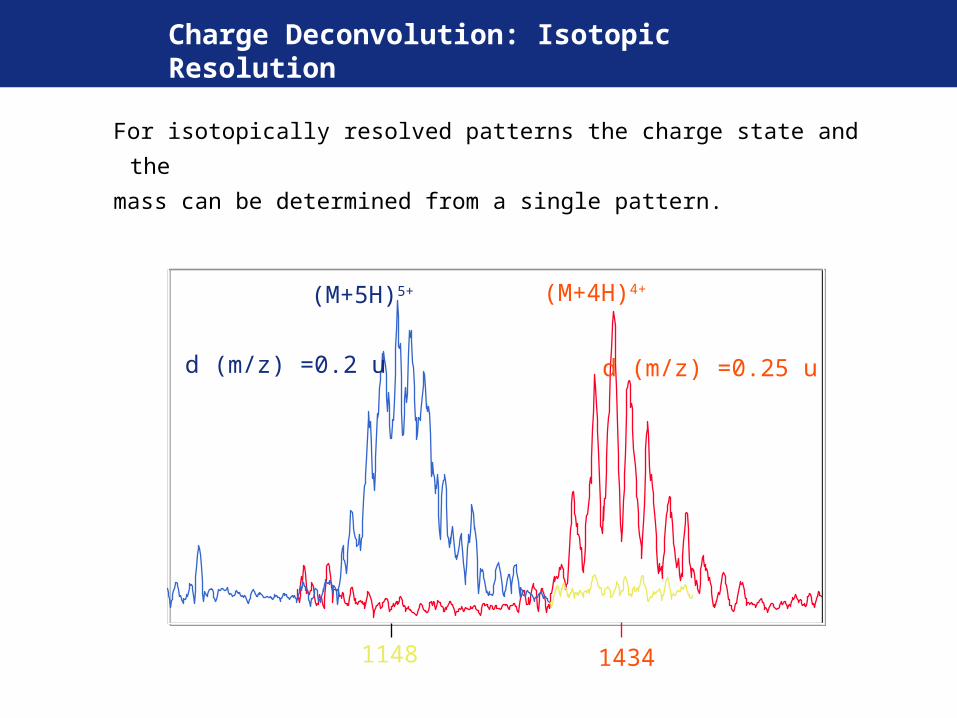
Charge Deconvolution: Isotopic Resolution
14341148
d (m/z) =0.25 ud (m/z) =0.2 u
(M+4H)4+(M+5H)5+
For isotopically resolved patterns the charge state and the
mass can be determined from a single pattern.

CalibrationCalibration
Get more Get more
accurate dataaccurate data
Problems to be solved by Bioinformatics
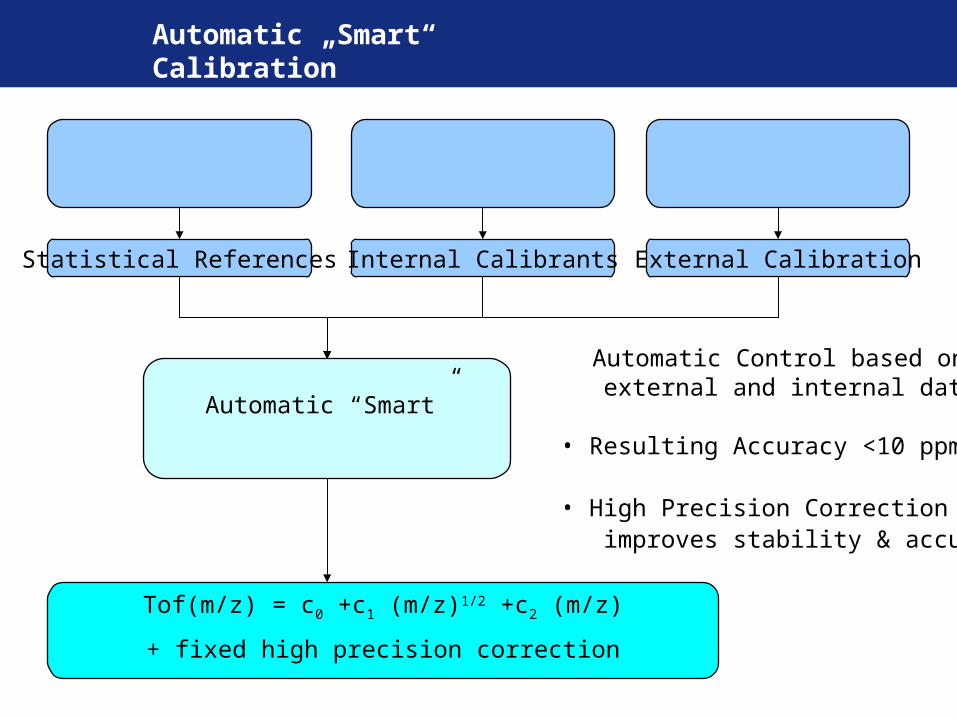
Automatic „Smart“ Calibration
• Automatic Control based on external and internal data
• Resulting Accuracy <10 ppm
• High Precision Correction improves stability & accuracy
Contaminants,self digestion
Mass distributionof peptides
External calibrationspots
Statistical References Internal Calibrants External Calibration
Automatic “Smart”
Calibration
Tof(m/z) = c0 +c1 (m/z)1/2 +c2 (m/z)
+ fixed high precision correction
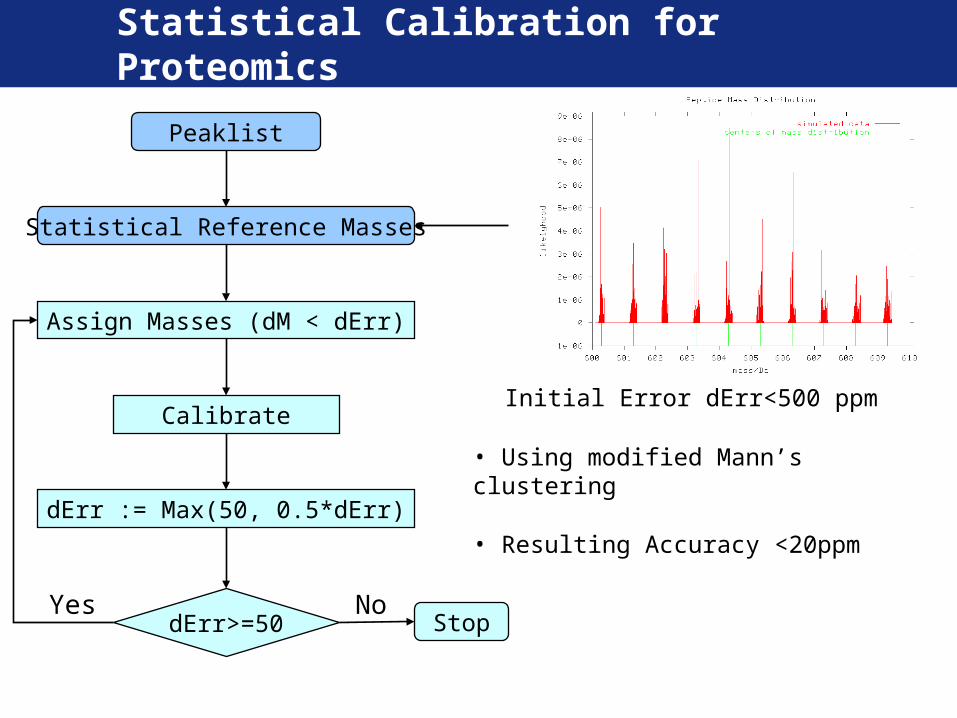
Statistical Calibration for Proteomics
Peaklist
Statistical Reference Masses
Assign Masses (dM < dErr)
Calibrate
dErr := Max(50, 0.5*dErr)
dErr>=50 Stop
• Initial Error dErr<500 ppm
• Using modified Mann’s clustering
• Resulting Accuracy <20ppm
NoYes
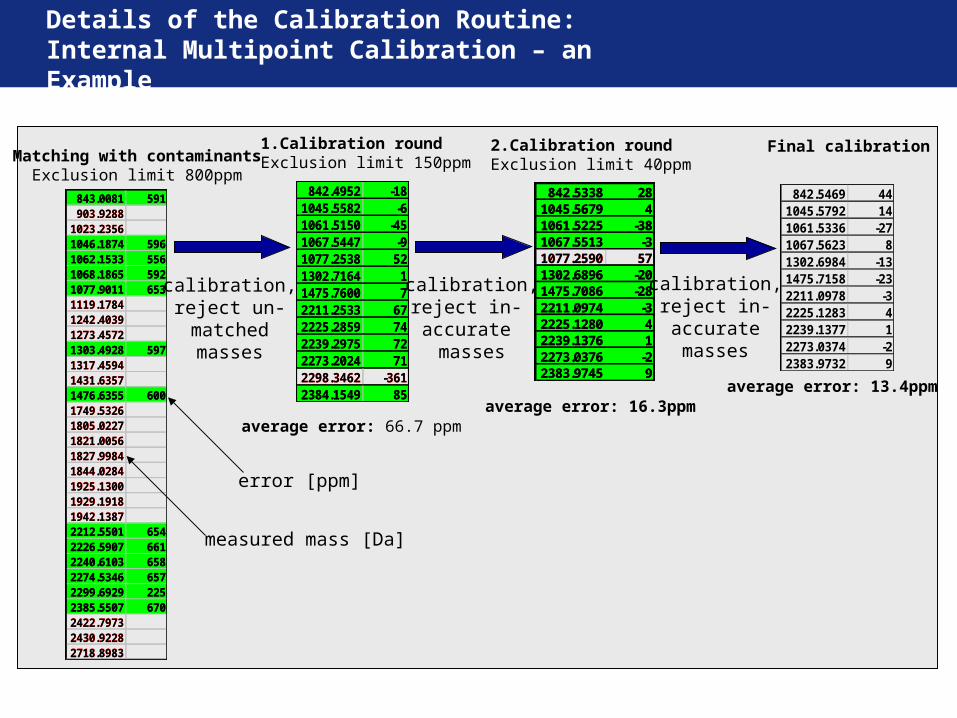
Details of the Calibration Routine: Internal Multipoint Calibration – an Example
843.0081 591903.9288
1023.23561046.1874 5961062.1533 5561068.1865 5921077.9011 6531119.17841242.40391273.45721303.4928 5971317.45941431.63571476.6355 6001749.53261805.02271821.00561827.99841844.02841925.13001929.19181942.13872212.5501 6542226.5907 6612240.6103 6582274.5346 6572299.6929 2252385.5507 6702422.79732430.92282718.8983
842.4952 -181045.5582 -61061.5150 -451067.5447 -91077.2538 521302.7164 11475.7600 72211.2533 672225.2859 742239.2975 722273.2024 712298.3462 -3612384.1549 85
842.5338 281045.5679 41061.5225 -381067.5513 -31077.2590 571302.6896 -201475.7086 -282211.0974 -32225.1280 42239.1376 12273.0376 -22383.9745 9
Matching with contaminantsExclusion limit 800ppm
842.5469 441045.5792 141061.5336 -271067.5623 81302.6984 -131475.7158 -232211.0978 -32225.1283 42239.1377 12273.0374 -22383.9732 9
Final calibration
calibration,reject in-accuratemasses
average error: 13.4ppm
843.0081 591903.9288
1023.23561046.1874 5961062.1533 5561068.1865 5921077.9011 6531119.17841242.40391273.45721303.4928 5971317.45941431.63571476.6355 6001749.53261805.02271821.00561827.99841844.02841925.13001929.19181942.13872212.5501 6542226.5907 6612240.6103 6582274.5346 6572299.6929 2252385.5507 6702422.79732430.92282718.8983
calibration,reject un-matchedmasses
1.Calibration roundExclusion limit 150ppm
average error: 66.7 ppm
842.4952 -181045.5582 -61061.5150 -451067.5447 -91077.2538 521302.7164 11475.7600 72211.2533 672225.2859 742239.2975 722273.2024 712298.3462 -3612384.1549 85
2.Calibration roundExclusion limit 40ppm
calibration,reject in- accurate masses
average error: 16.3ppm
842.5338 281045.5679 41061.5225 -381067.5513 -31077.2590 571302.6896 -201475.7086 -282211.0974 -32225.1280 42239.1376 12273.0376 -22383.9745 9
error [ppm]
measured mass [Da]
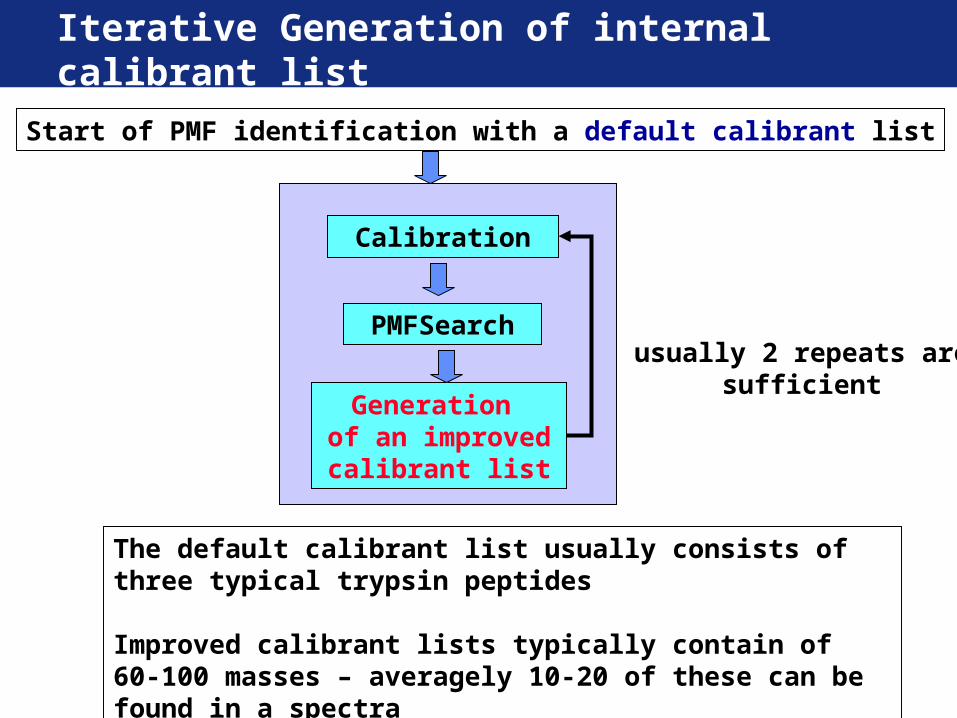
Iterative Generation of internal calibrant list
Calibration
PMFSearch
Generation of an improved
calibrant list
Start of PMF identification with a default calibrant list
usually 2 repeats aresufficient
The default calibrant list usually consists of three typical trypsin peptides
Improved calibrant lists typically contain of 60-100 masses – averagely 10-20 of these can be found in a spectra
MS basedMS basedIdentity SearchIdentity Search
Search Search EnginesEngines
Problems to be solved by Bioinformatics
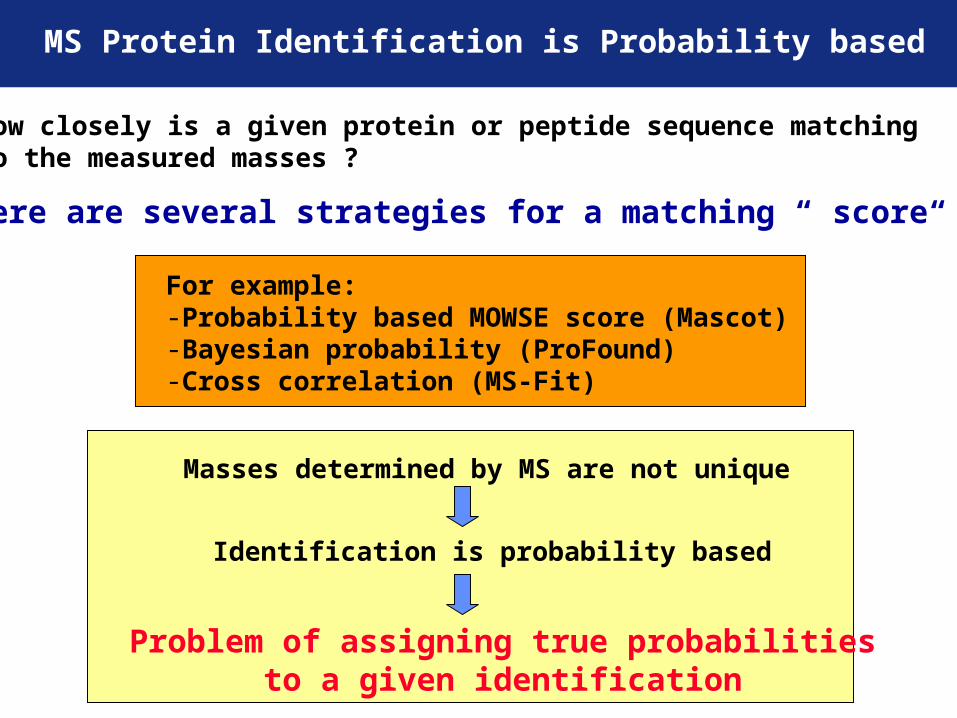
MS Protein Identification is Probability based
How closely is a given protein or peptide sequence matching to the measured masses ?
There are several strategies for a matching “ score“ :
For example:-Probability based MOWSE score (Mascot)-Bayesian probability (ProFound)-Cross correlation (MS-Fit)
Masses determined by MS are not unique
Identification is probability based
Problem of assigning true probabilitiesto a given identification
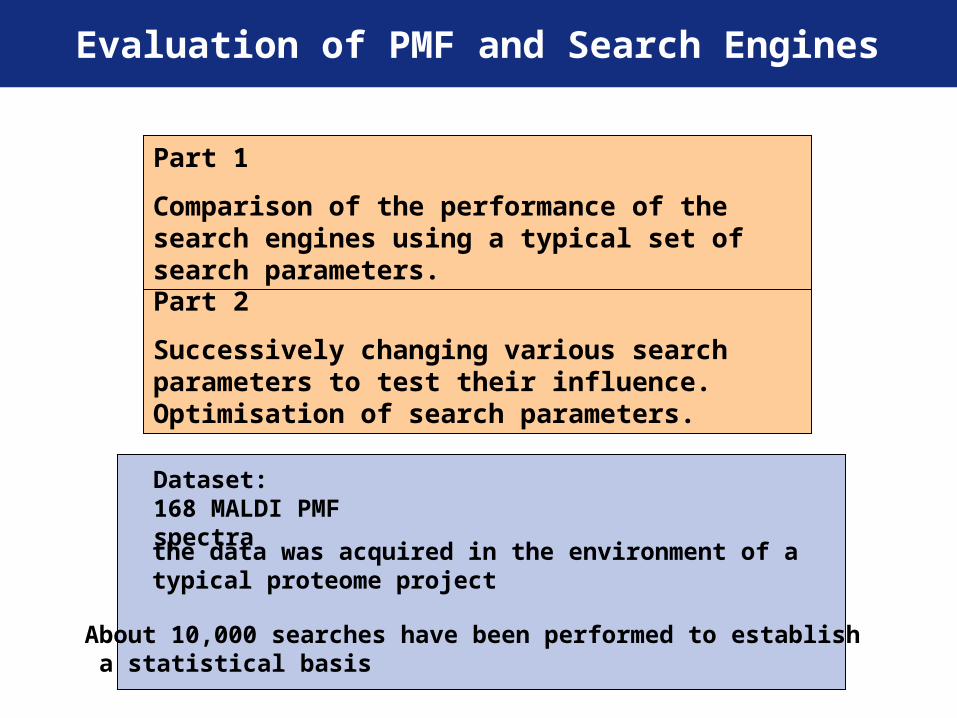
Part 2
Successively changing various search parameters to test their influence. Optimisation of search parameters.
Part 1
Comparison of the performance of the search engines using a typical set of search parameters.
Dataset:168 MALDI PMF spectra
About 10,000 searches have been performed to establish a statistical basis
the data was acquired in the environment of a typical proteome project
Evaluation of PMF and Search Engines
0.0 0.5 1.0 1.5 2.0 2.502468
101214161820
% o
f sea
rche
s
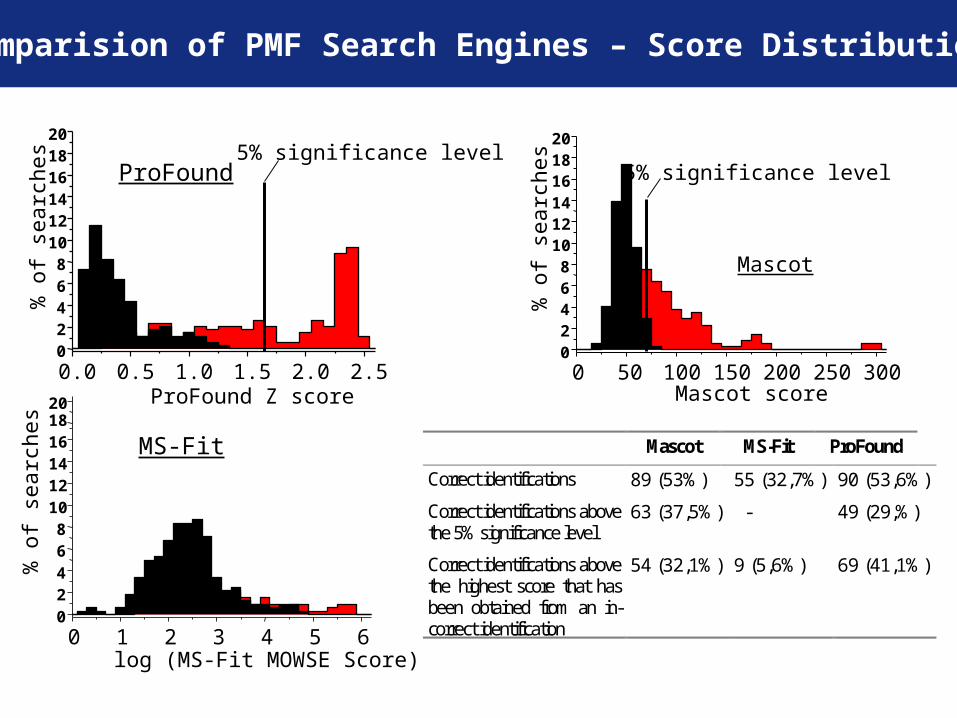
ProFound Z score
5% significance levelProFound
0 50 100 150 200 250 30002468
101214161820
% o
f sea
rche
s
Mascot score
5% significance level
Mascot
0 1 2 3 4 5 602468
101214161820
% o
f sea
rche
s
log (MS-Fit MOWSE Score)
MS-Fit Mascot MS-Fit ProFound
Correct identifications 89 (53%) 55 (32,7%) 90 (53,6%)
Correct identifications above the 5% significance level
63 (37,5%) - 49 (29,%)
Correct identifications above the highest score that has been obtained from an in-correct identification
54 (32,1%) 9 (5,6%) 69 (41,1%)
Comparision of PMF Search Engines – Score Distribution
randommatches
0.0 0.5 1.0 1.5 2.0 2.50
2
4
6
8
10
12
14
16
18
20
% o
f se
arc
he
s
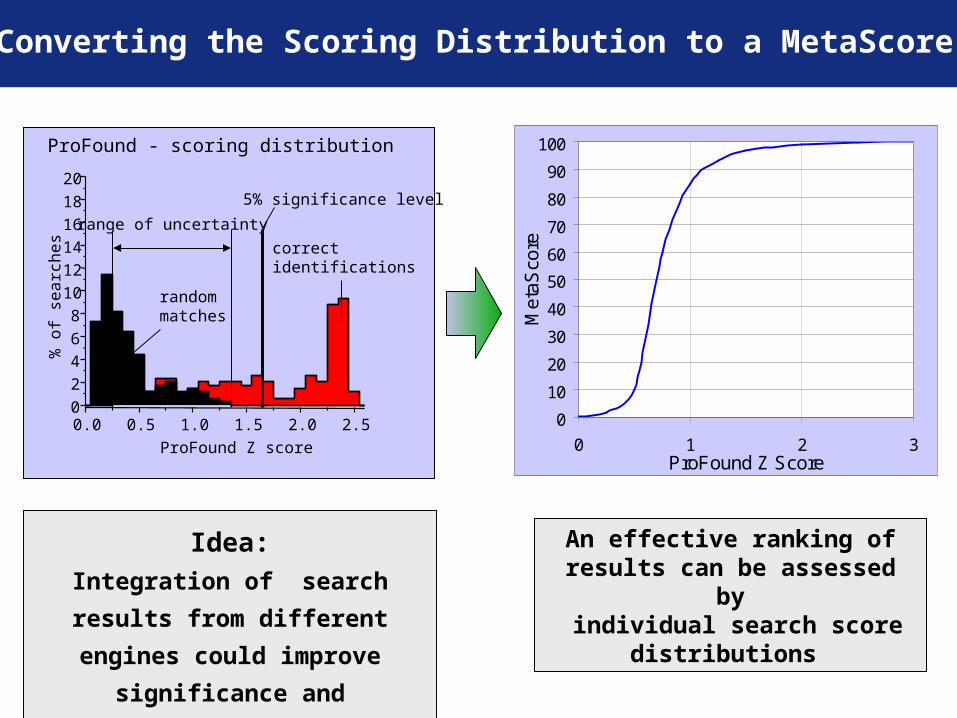
ProFound Z score
5% significance level
range of uncertainty
correctidentifications
ProFound - scoring distribution
0
10
20
30
40
50
60
70
80
90
100
0 1 2 3ProFound Z Score
Met
aSco
reIdea:
Integration of search results from
different engines could improve
significance and confidence!
An effective ranking of results can be assessed by
individual search score distributions
Converting the Scoring Distribution to a MetaScore
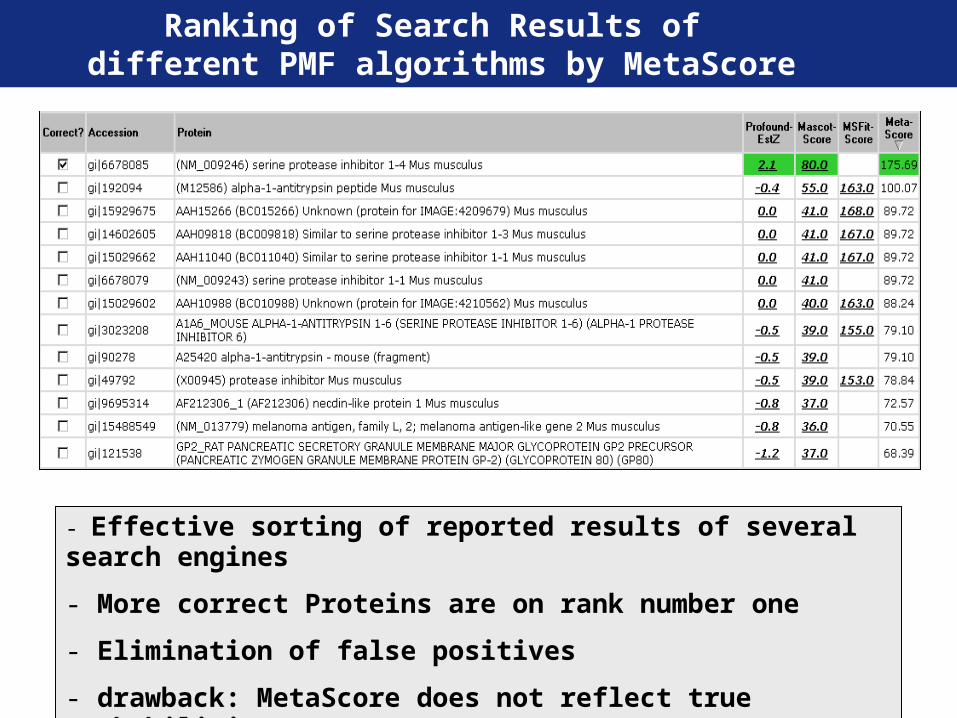
- Effective sorting of reported results of several search engines
- More correct Proteins are on rank number one
- Elimination of false positives
- drawback: MetaScore does not reflect true probabilities
Ranking of Search Results of different PMF algorithms by MetaScore

Automated Automated validationvalidation
of Search Resultsof Search Results
Search Search EnginesEngines
Problems to be solved by Bioinformatics
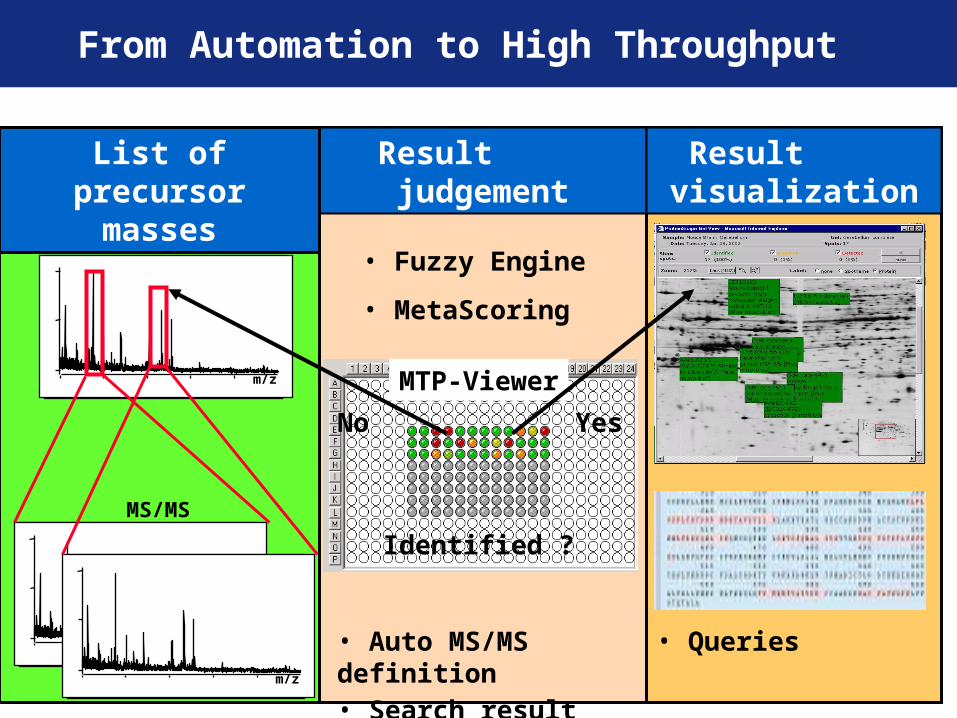
m/z
PMF
Result judgement
m/z
MS/MS
m/z
List of precursor masses
• Fuzzy Engine
• MetaScoring
MTP-Viewer
Result visualization
Identified ?
No
• Auto MS/MS definition• Search result driven
• Queries
Yes
From Automation to High Throughput

Fuzzy Engine for Protein Identifikation from PMF spectra
FLFL
Probability Score
Probability Score
Score Ratioto unrelated Sequence
Sequence Coverage
Correlation Coefficient
Peak Quality Factor
Identified
Undefined
Uncertain (unique)Uncertain (multiple)
Identified (multiple)
Bad data

AutomatedAutomatedMS/MS Precursor MS/MS Precursor
Ion SelectionIon Selection
Automation &Automation &
High ThroughputHigh Throughput
Problems to be solved by Bioinformatics
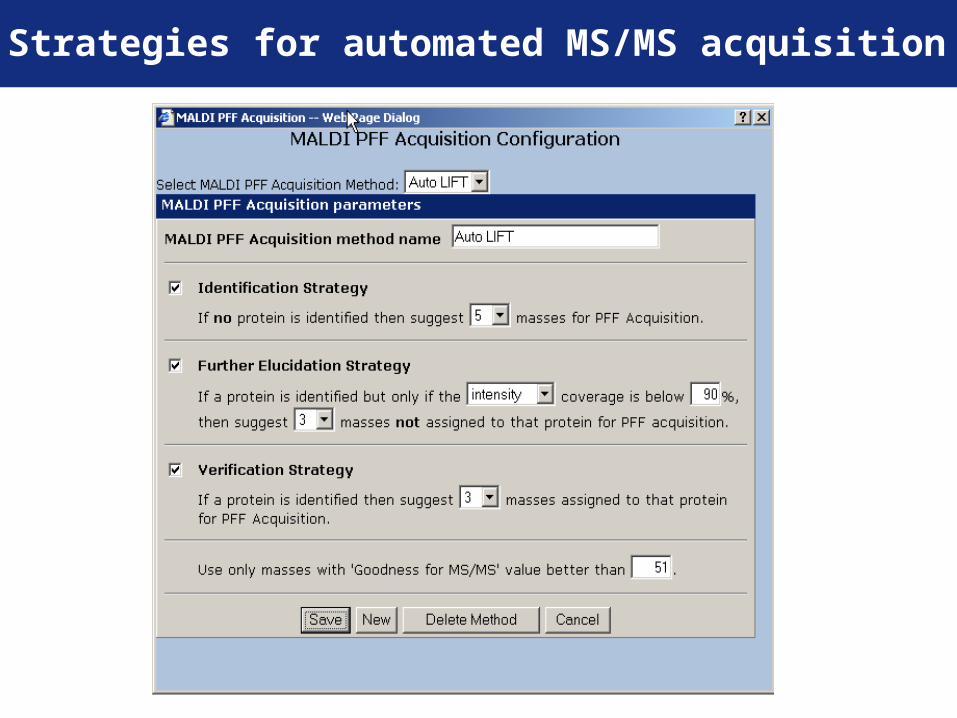
Strategies for automated MS/MS acquisition
Acknowledgement
Jens Decker , Michael Kuhn
Bruker Daltonik
Martin Blüggel , Daniel Chamrad
Peter MaaßKristian Bredies