Embed Size (px)
Citation preview
1
Mass-Transfer Characteristics of a Double-Y-Type Microchannel Device
Susumu NII Nagoya University
Japan
1. Introduction
Microfluidic devices have been extensively applied to high-throughput chemical analyses or reactions using hazardous substances (van den Berg et al., 2000). These systems are characterized by a large area per volume and a well-defined laminar flow. As a result of their high potential for the precise manipulation of chemical reactions with respect to controlled temperature, contacting time, and molecular orientation at the interface, researches on microfluidic devices for the production of highly valuable substances are increasing in importance (Ajmera et al., 2001, Maruyama et al., 2003, Löb et al., 2004). The production system is often referred to as a desktop chemical plant and the keys to realizing the plant are understanding and successfully manipulating the flow in microchannels (Hetsroni et al., 2005). A unique feature of the microchannels is the formation of liquid layers when multiple liquids are brought into one channel. Reactions and/or mass-transfers occur in the vicinity of the interface. Liquid-liquid extractions (Brody and Yager, 1997, Tokeshi et al., 2000) are reported for systems of aqueous and organic solutions. Even mutually miscible liquids form the layers because of the laminar-flow nature (Yamaguchi et al., 2004) and a mass-transfer occurs between the liquids under well-controlled conditions. For the purpose of chemical processing, the stacked liquid layers should be separated in each layer for further treatment. However, flow splitting in microchannel devices is rarely found in published papers. In reported works for the analytical application of microchannels, the solute’s concentration profile was directly measured within the channel using a laser-based refractive index detector (Costin and Synovec, 2002) or a microscope for measuring fluorescence emission (Costin et al., 2004). A strategy for flow splitting has not yet been developed for the application of microchannel devices to analytical chemistry. In the present study, two aqueous layers were brought into contact and separated into two streams after a mass-transfer between the layers. The amount of solute transferred was obtained with a simple analysis of liquid samples taken at the channel outlet. The mass-transfer characteristics were examined through the measurement of the diffusion coefficients for solutes. Even under carefully controlled liquid feed conditions, equal flow splitting was difficult to obtain. Proposed is a method to choose solute concentration data for equal flow splitting using the ratio of the flow rate of one liquid to the other. The mass-transfer of benzoic acid was successfully analyzed with a conventional penetration model with an additional parameter. Furthermore, the diffusion coefficients of sucrose, glycine,
www.intechopen.com
Advanced Topics in Mass Transfer
4
tryptophan, and urea were measured using a basic equation obtained with benzoic acid. The values are in accordance with the literature or the correlated values. Since the same parameter is applied for obtaining the diffusion coefficients of the four different solutes, the additional parameter should characterize the flow behavior in the microchannel. The proposed method is also useful for determining the unknown diffusivities of solutes. Furthermore, to investigate the flow characteristics, the value of an additional parameter is determined in various channels having different lengths, depths and knife-edge angles. A Comparison of this parameter helps us to understand the effect of flow on mass-transfer.
2. Determination of diffusivity
2.1 Microchannel module and materials
Benzoic acid, sucrose, tryptophan, urea, and glycine were selected as transferring solutes.
The aqueous solutions were prepared as feedstock, and the concentration of each of these
was set at 1.19x10⁻³ kmol/m3, 1.46x10⁻² kmol/m3, 1.19x10⁻³ kmol/m3, 8.7x10⁻² kmol/m3, and
6.7x10⁻² kmol/m3 respectively. The solutions were filtered prior to use to remove the
suspended solid to prevent the clogging of the channel.
10cm
microscope
syringe pump60°
stainless steel sheet
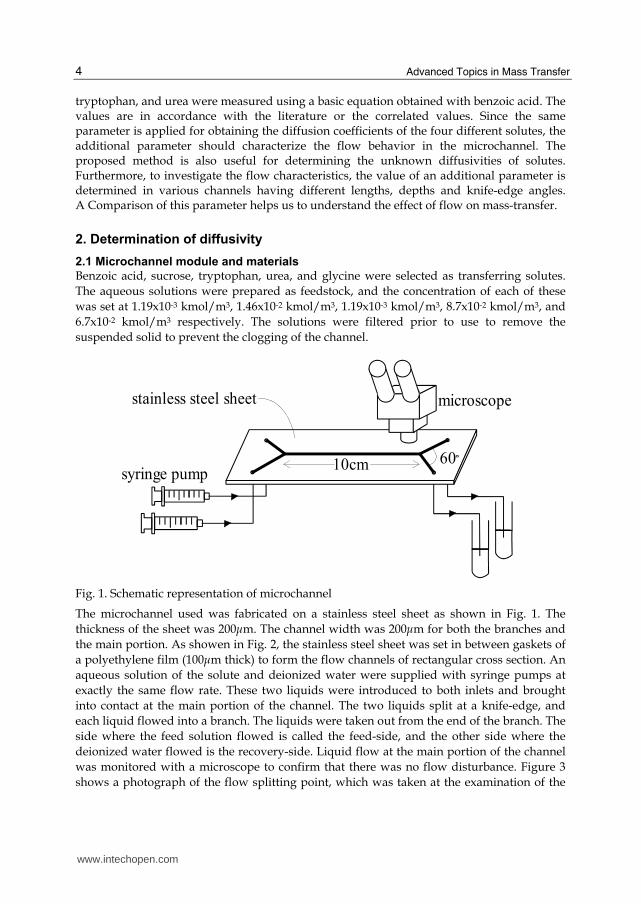
Fig. 1. Schematic representation of microchannel
The microchannel used was fabricated on a stainless steel sheet as shown in Fig. 1. The
thickness of the sheet was 200μm. The channel width was 200μm for both the branches and
the main portion. As showen in Fig. 2, the stainless steel sheet was set in between gaskets of
a polyethylene film (100μm thick) to form the flow channels of rectangular cross section. An
aqueous solution of the solute and deionized water were supplied with syringe pumps at
exactly the same flow rate. These two liquids were introduced to both inlets and brought
into contact at the main portion of the channel. The two liquids split at a knife-edge, and
each liquid flowed into a branch. The liquids were taken out from the end of the branch. The
side where the feed solution flowed is called the feed-side, and the other side where the
deionized water flowed is the recovery-side. Liquid flow at the main portion of the channel
was monitored with a microscope to confirm that there was no flow disturbance. Figure 3
shows a photograph of the flow splitting point, which was taken at the examination of the
www.intechopen.com
Mass-transfer Characteristics of a Microchannel Device of Double-Y Type
5
flow profile with the supply of a Cibacron blue solution and water in each inlet. The blue
solution formed a layer and a stable interface is observed at the center of the channel. The
two solutions were then split with a knife-edge at the end of the main portion of the
channel.
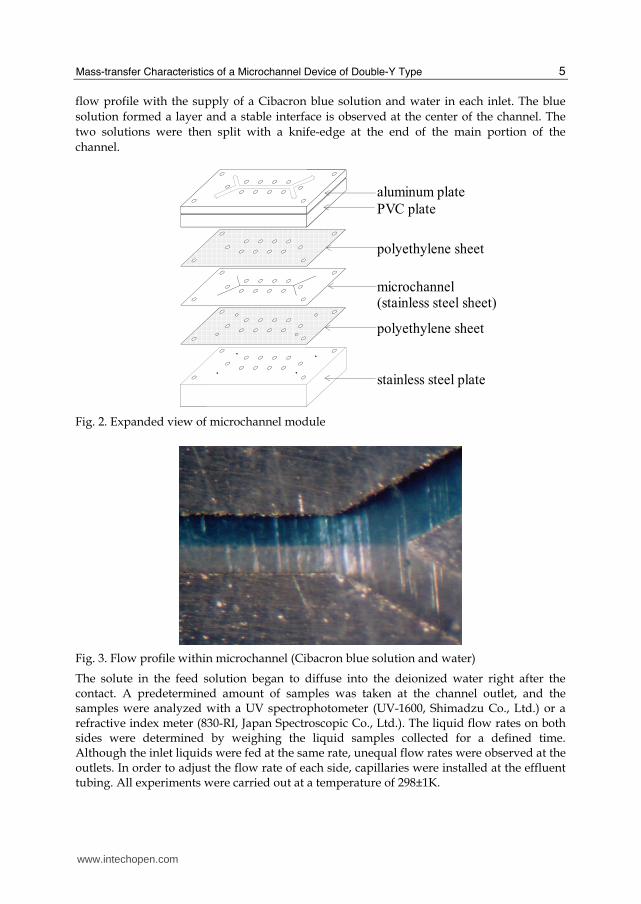
aluminum plate
PVC plate
polyethylene sheet
stainless steel plate
polyethylene sheet
microchannel(stainless steel sheet)
Fig. 2. Expanded view of microchannel module
Fig. 3. Flow profile within microchannel (Cibacron blue solution and water)
The solute in the feed solution began to diffuse into the deionized water right after the contact. A predetermined amount of samples was taken at the channel outlet, and the samples were analyzed with a UV spectrophotometer (UV-1600, Shimadzu Co., Ltd.) or a refractive index meter (830-RI, Japan Spectroscopic Co., Ltd.). The liquid flow rates on both sides were determined by weighing the liquid samples collected for a defined time. Although the inlet liquids were fed at the same rate, unequal flow rates were observed at the outlets. In order to adjust the flow rate of each side, capillaries were installed at the effluent tubing. All experiments were carried out at a temperature of 298±1K.
www.intechopen.com
Advanced Topics in Mass Transfer
6
2.2 Mass-transfer model Within the range of liquid velocities examined, the Reynolds number varies from 17 to 172. The liquid flow examined is laminar. Even when two kinds of aqueous solutions are brought into contact at the same velocity in one microchannel, a contacting plane is formed. If a concentration difference exists between the two liquids, the solute will diffuse from the concentrated to the less concentrated side across the contacting plane. Under conditions of short contact time for a mass-transfer and a considerably larger solute concentration in the feed-side than the recovery-side, the penetration model (Higbie, 1935) can be applied for solute diffusion.
( )A i b2D
N C Cπ θ= − (1)
where NA is the mass-transfer rate at the interface; D, the diffusion coefficient; θ, the contact time; Ci the concentration at the contacting plane; Cb, the concentration of bulk liquid. The contact time; θ, is calculated from the channel length of main portion of the channel, l divided by the average velocity of the contacting plane, vint,av. Eq. (1) then reduces to
( )int,avA i b2
D vN C C
lπ= − (2)
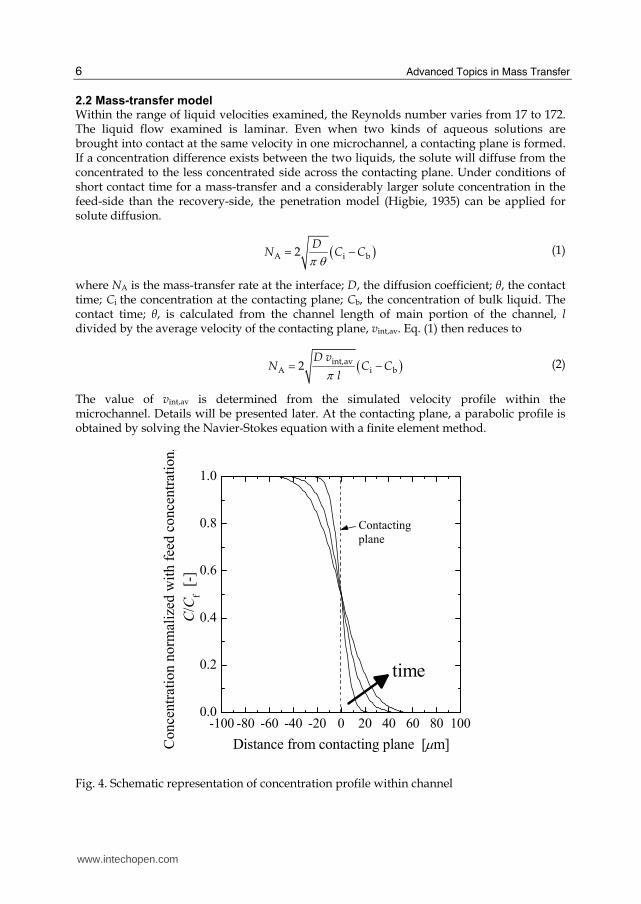
The value of vint,av is determined from the simulated velocity profile within the microchannel. Details will be presented later. At the contacting plane, a parabolic profile is obtained by solving the Navier-Stokes equation with a finite element method.
Fig. 4. Schematic representation of concentration profile within channel
-100 -80 -60 -40 -20 0 20 40 60 80 1000.0
0.2
0.4
0.6
0.8
1.0
Con
centr
atio
n n
orm
aliz
ed w
ith f
eed
co
nce
ntr
atio
n,
C/C
f [-
]
Distance from contacting plane [μm]
time
Contacting
plane
www.intechopen.com
Mass-transfer Characteristics of a Microchannel Device of Double-Y Type
7
The mass-transfer across the contacting plane is modeled on the basis of the diffusion in a
semifinite slab. For unsteady diffusion in a semifinite slab, the concentration profile at the
cross section of the main portion is schematically represented in Fig. 4. Since the two liquids
are aqueous solutions, a symmetrical profile is formed in the vicinity of the contacting plane.
The profile decays with the progress of contact time with maintaining a constant concentration
at contacting plane, Ci. When deionized water is used as the recovery liquid, Ci equals to 0.5Cf,
and the bulk concentration, Cb, can be assumed to be zero. Then Eq. (2) is simplified to
int,av
A f
D vN C
lπ= (3)
The mass balance around the recovery-side of the channel can be expressed as
A out in( )avN A v S C C= − (4)
where A is the area of the contacting plane; vav, the average liquid velocity in the main
portion of the channel, which is defined as the total volumetric flow rate divided by the
cross-sectional area (200μm x 200μm); S, the cross-sectional area of the recovery-side, which
is half the cross-sectional area of the main portion; Cout, the outlet concentration of the
recovery liquid; and Cin, the concentration at the inlet of the recovery liquid. The area, A, is
expressed as the channel height, h, multiplied by the length of the main portion of the
channel, l, and the area S is written as hL, where L is half the channel width. Hence, Eq. (4)
becomes,
av out inA
( )L v C CN
l
−= (5)
For the supply of deionized water to the recovery-side, Cin, is set to zero. Therefore, the mass
balance around the recovery-side is written as
av outA
L v CN
l= (6)
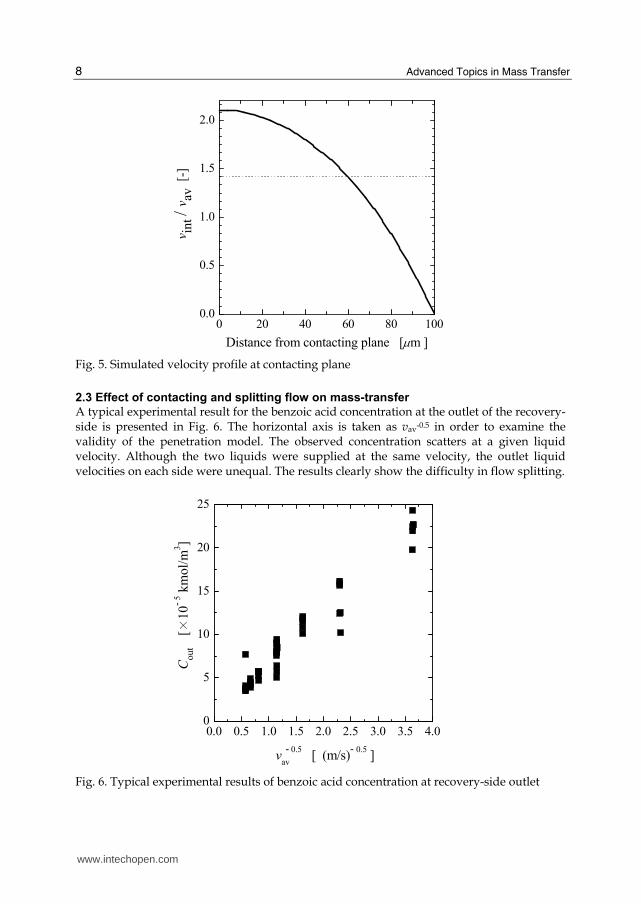
Attention should be paid to the difference between vav and vint,av. The former is a three-
dimensional average, while the latter is two dimensional. Velocities calculated at the
contacting plane, vint, are normalized with vav, and the values of vint/vav are plotted in Fig. 5.
A parabolic profile is obtained and the velocity of the contacting plane is averaged to
determine the value of vint, av/vav. As is presented in the figure, the value of vint,av/vav is 1.4.
The result suggests that the two-dimensional average of vint,av is 1.4 times bigger than the
three-dimensional average, vav. Combining Eqs. (3) and (6) gives the outlet concentration of
the recovery-side,
out fav
1.4 lDC C
L vπ= (7)
This is the fundamental equation for determing the solute diffusion coefficient from the
measurement of the solute concentration at the outlet of the recovery-side.
www.intechopen.com
Advanced Topics in Mass Transfer
8
0 20 40 60 80 1000.0
0.5
1.0
1.5
2.0
vin
t / v
av
[-]
Distance from contacting plane [μm ]
Fig. 5. Simulated velocity profile at contacting plane
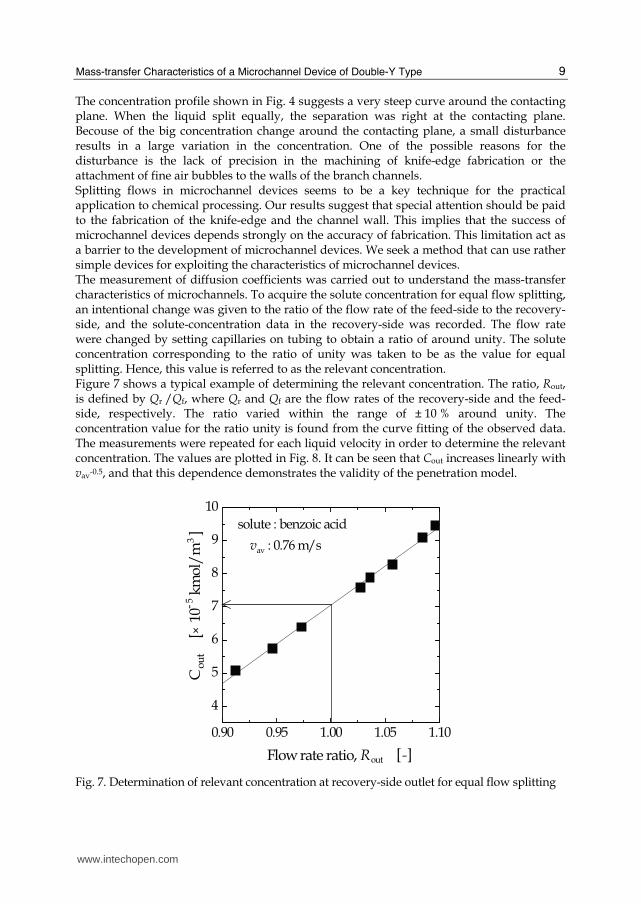
2.3 Effect of contacting and splitting flow on mass-transfer
A typical experimental result for the benzoic acid concentration at the outlet of the recovery-side is presented in Fig. 6. The horizontal axis is taken as vav-0.5 in order to examine the validity of the penetration model. The observed concentration scatters at a given liquid velocity. Although the two liquids were supplied at the same velocity, the outlet liquid velocities on each side were unequal. The results clearly show the difficulty in flow splitting.
0.0 0.5 1.0 1.5 2.0 2.5 3.0 3.5 4.00
5
10
15
20
25
v - 0.5
av [ (m/s)
- 0.5 ]
Cout
[×
10
- 5 k
mol/
m3]
Fig. 6. Typical experimental results of benzoic acid concentration at recovery-side outlet
www.intechopen.com
Mass-transfer Characteristics of a Microchannel Device of Double-Y Type
9
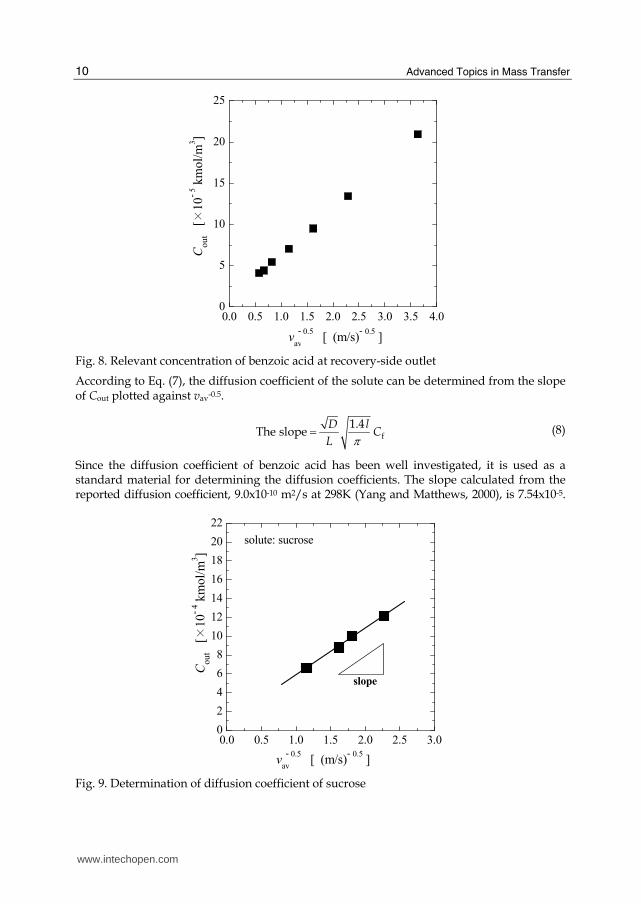
The concentration profile shown in Fig. 4 suggests a very steep curve around the contacting plane. When the liquid split equally, the separation was right at the contacting plane. Becouse of the big concentration change around the contacting plane, a small disturbance results in a large variation in the concentration. One of the possible reasons for the disturbance is the lack of precision in the machining of knife-edge fabrication or the attachment of fine air bubbles to the walls of the branch channels. Splitting flows in microchannel devices seems to be a key technique for the practical application to chemical processing. Our results suggest that special attention should be paid to the fabrication of the knife-edge and the channel wall. This implies that the success of microchannel devices depends strongly on the accuracy of fabrication. This limitation act as a barrier to the development of microchannel devices. We seek a method that can use rather simple devices for exploiting the characteristics of microchannel devices. The measurement of diffusion coefficients was carried out to understand the mass-transfer characteristics of microchannels. To acquire the solute concentration for equal flow splitting, an intentional change was given to the ratio of the flow rate of the feed-side to the recovery-side, and the solute-concentration data in the recovery-side was recorded. The flow rate were changed by setting capillaries on tubing to obtain a ratio of around unity. The solute concentration corresponding to the ratio of unity was taken to be as the value for equal splitting. Hence, this value is referred to as the relevant concentration. Figure 7 shows a typical example of determining the relevant concentration. The ratio, Rout, is defined by Qr /Qf, where Qr and Qf are the flow rates of the recovery-side and the feed-side, respectively. The ratio varied within the range of ± 10 % around unity. The concentration value for the ratio unity is found from the curve fitting of the observed data. The measurements were repeated for each liquid velocity in order to determine the relevant concentration. The values are plotted in Fig. 8. It can be seen that Cout increases linearly with vav-0.5, and that this dependence demonstrates the validity of the penetration model.
0.90 0.95 1.00 1.05 1.10
4
5
6
7
8
9
10
solute : benzoic acid
vav : 0.76 m/s
Cou
t
[×10
- 5 k
mol
/m
3]
Flow rate ratio, Rout ] [-
Fig. 7. Determination of relevant concentration at recovery-side outlet for equal flow splitting
www.intechopen.com
Advanced Topics in Mass Transfer
10
0.0 0.5 1.0 1.5 2.0 2.5 3.0 3.5 4.00
5
10
15
20
25
Co
ut
[×
10
- 5 k
mol/
m3]
v - 0.5
av [ (m/s)
- 0.5 ]
Fig. 8. Relevant concentration of benzoic acid at recovery-side outlet
According to Eq. (7), the diffusion coefficient of the solute can be determined from the slope of Cout plotted against vav-0.5.
f
1.4The slope
lDC
L π= (8)
Since the diffusion coefficient of benzoic acid has been well investigated, it is used as a standard material for determining the diffusion coefficients. The slope calculated from the reported diffusion coefficient, 9.0x10⁻¹⁰ m2/s at 298K (Yang and Matthews, 2000), is 7.54x10⁻⁵.
0.0 0.5 1.0 1.5 2.0 2.5 3.00
2
4
6
8
10
12
14
16
18
20
22
Co
ut
[×
10
- 4 k
mol/
m3]
v - 0.5
av [ (m/s)
- 0.5 ]
solute: sucrose
slope
Fig. 9. Determination of diffusion coefficient of sucrose
www.intechopen.com
Mass-transfer Characteristics of a Microchannel Device of Double-Y Type
11
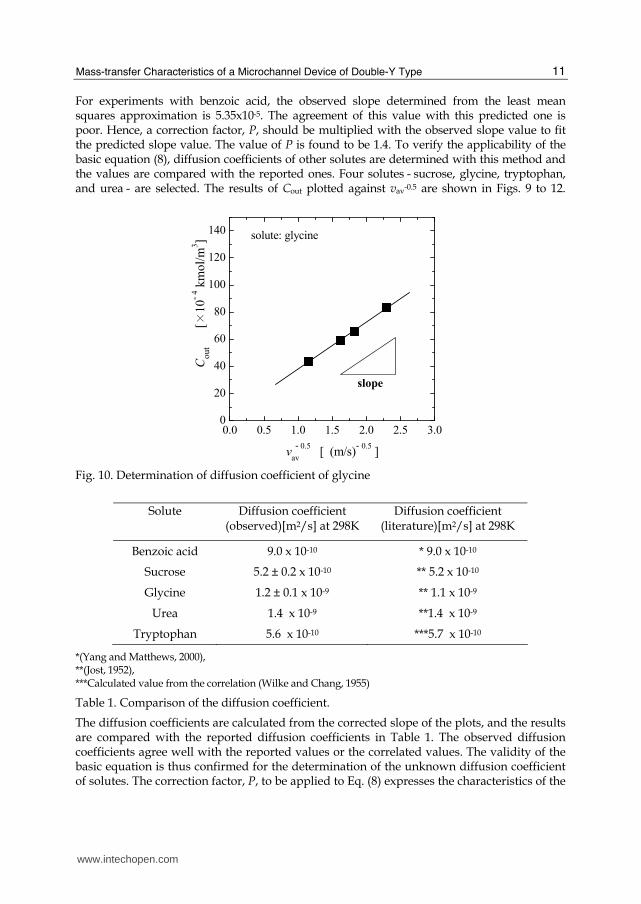
For experiments with benzoic acid, the observed slope determined from the least mean squares approximation is 5.35x10⁻⁵. The agreement of this value with this predicted one is poor. Hence, a correction factor, P, should be multiplied with the observed slope value to fit the predicted slope value. The value of P is found to be 1.4. To verify the applicability of the basic equation (8), diffusion coefficients of other solutes are determined with this method and the values are compared with the reported ones. Four solutes - sucrose, glycine, tryptophan, and urea - are selected. The results of Cout plotted against vav-0.5 are shown in Figs. 9 to 12.
0.0 0.5 1.0 1.5 2.0 2.5 3.00
20
40
60
80
100
120
140
Co
ut
[×
10
- 4 k
mol/
m3]
v - 0.5
av [ (m/s)
- 0.5 ]
solute: glycine
slope
Fig. 10. Determination of diffusion coefficient of glycine
Solute Diffusion coefficient (observed)[m2/s] at 298K
Diffusion coefficient (literature)[m2/s] at 298K
Benzoic acid 9.0 x 10-10 * 9.0 x 10-10
Sucrose 5.2 ± 0.2 x 10⁻¹⁰ ** 5.2 x 10⁻¹⁰
Glycine 1.2 ± 0.1 x 10⁻⁹ ** 1.1 x 10⁻⁹
Urea 1.4 x 10⁻⁹ **1.4 x 10⁻⁹
Tryptophan 5.6 x 10⁻¹⁰ ***5.7 x 10⁻¹⁰
*(Yang and Matthews, 2000), **(Jost, 1952), ***Calculated value from the correlation (Wilke and Chang, 1955)
Table 1. Comparison of the diffusion coefficient.
The diffusion coefficients are calculated from the corrected slope of the plots, and the results are compared with the reported diffusion coefficients in Table 1. The observed diffusion coefficients agree well with the reported values or the correlated values. The validity of the basic equation is thus confirmed for the determination of the unknown diffusion coefficient of solutes. The correction factor, P, to be applied to Eq. (8) expresses the characteristics of the
www.intechopen.com
Advanced Topics in Mass Transfer
12
0.0 0.5 1.0 1.5 2.0 2.50
2
4
6
8
10
12
14
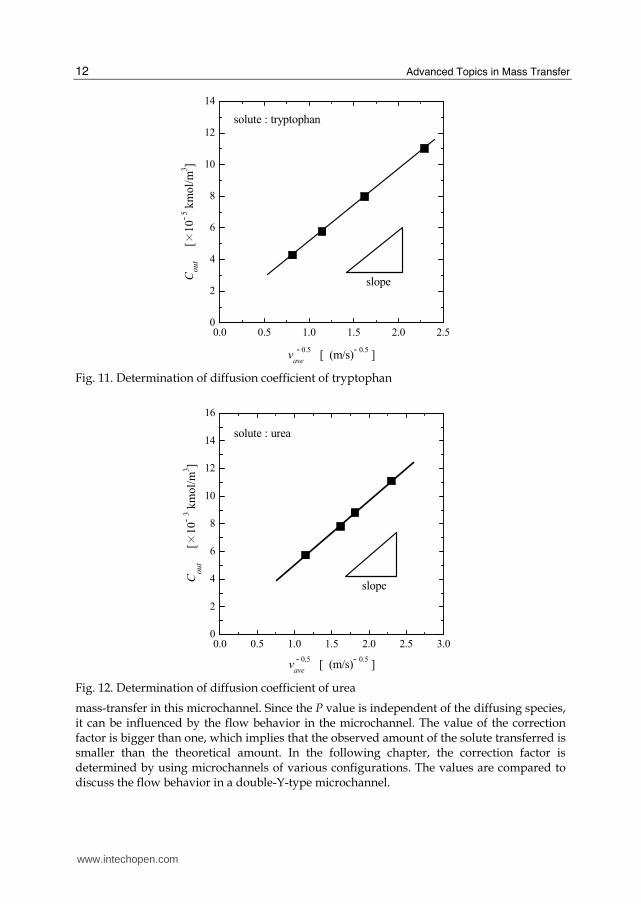
solute : tryptophan
Co
ut
[×
10
- 5 k
mo
l/m
3]
v - 0.5
ave [ (m/s)
- 0.5 ]
slope
Fig. 11. Determination of diffusion coefficient of tryptophan
0.0 0.5 1.0 1.5 2.0 2.5 3.00
2
4
6
8
10
12
14
16
solute : urea
C
out
[×
10
- 3 k
mo
l/m
3]
v - 0.5
ave [ (m/s)
- 0.5 ]
slope
Fig. 12. Determination of diffusion coefficient of urea
mass-transfer in this microchannel. Since the P value is independent of the diffusing species, it can be influenced by the flow behavior in the microchannel. The value of the correction factor is bigger than one, which implies that the observed amount of the solute transferred is smaller than the theoretical amount. In the following chapter, the correction factor is determined by using microchannels of various configurations. The values are compared to discuss the flow behavior in a double-Y-type microchannel.
www.intechopen.com
Mass-transfer Characteristics of a Microchannel Device of Double-Y Type
13
3. Flow characteristics in double-Y-type microchannel
3.1 Channel configurations and materials
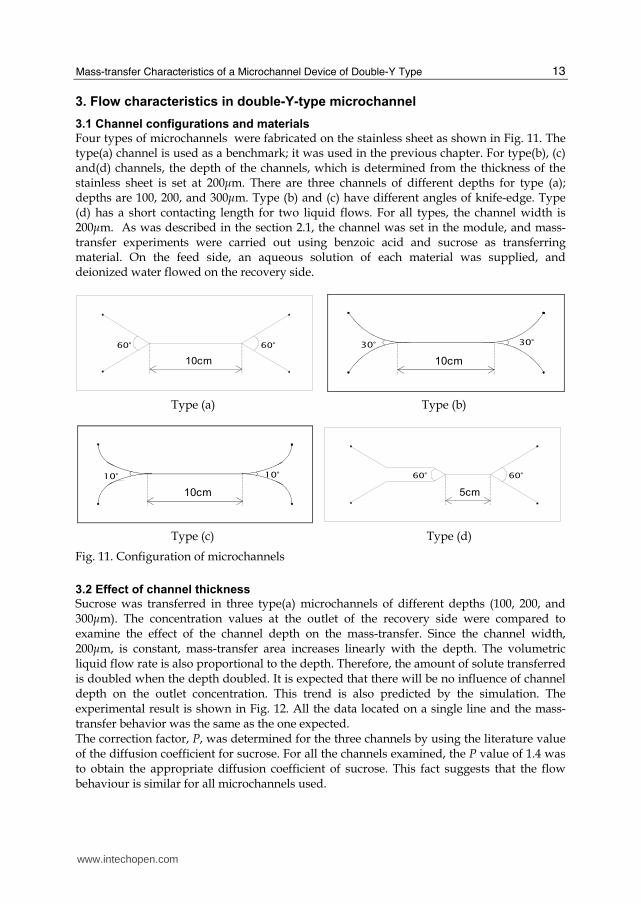
Four types of microchannels were fabricated on the stainless sheet as shown in Fig. 11. The type(a) channel is used as a benchmark; it was used in the previous chapter. For type(b), (c) and(d) channels, the depth of the channels, which is determined from the thickness of the stainless sheet is set at 200μm. There are three channels of different depths for type (a); depths are 100, 200, and 300μm. Type (b) and (c) have different angles of knife-edge. Type (d) has a short contacting length for two liquid flows. For all types, the channel width is 200μm. As was described in the section 2.1, the channel was set in the module, and mass-transfer experiments were carried out using benzoic acid and sucrose as transferring material. On the feed side, an aqueous solution of each material was supplied, and deionized water flowed on the recovery side.
10cm
60°60°
30° 30°
10cm
Type (a) Type (b)
10° 10°
10cm
5cm
60°60°
Type (c) Type (d)
Fig. 11. Configuration of microchannels
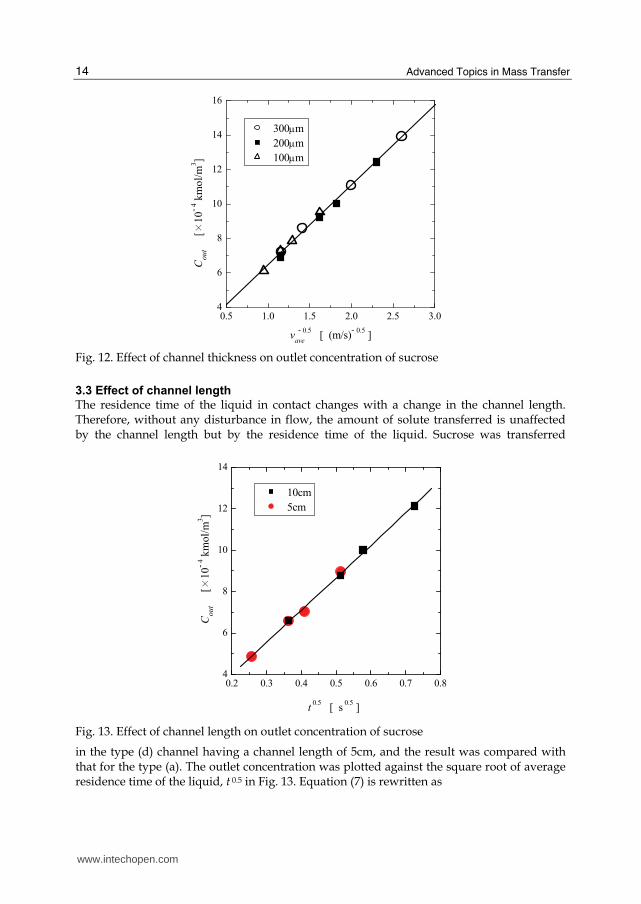
3.2 Effect of channel thickness
Sucrose was transferred in three type(a) microchannels of different depths (100, 200, and 300μm). The concentration values at the outlet of the recovery side were compared to examine the effect of the channel depth on the mass-transfer. Since the channel width, 200μm, is constant, mass-transfer area increases linearly with the depth. The volumetric liquid flow rate is also proportional to the depth. Therefore, the amount of solute transferred is doubled when the depth doubled. It is expected that there will be no influence of channel depth on the outlet concentration. This trend is also predicted by the simulation. The experimental result is shown in Fig. 12. All the data located on a single line and the mass-transfer behavior was the same as the one expected. The correction factor, P, was determined for the three channels by using the literature value of the diffusion coefficient for sucrose. For all the channels examined, the P value of 1.4 was to obtain the appropriate diffusion coefficient of sucrose. This fact suggests that the flow behaviour is similar for all microchannels used.
www.intechopen.com
Advanced Topics in Mass Transfer
14
0.5 1.0 1.5 2.0 2.5 3.04
6
8
10
12
14
16
Cout
[×
10
- 4 k
mo
l/m
3]
v - 0.5
ave [ (m/s)
- 0.5 ]
300μm
200μm
100μm
Fig. 12. Effect of channel thickness on outlet concentration of sucrose
3.3 Effect of channel length
The residence time of the liquid in contact changes with a change in the channel length. Therefore, without any disturbance in flow, the amount of solute transferred is unaffected by the channel length but by the residence time of the liquid. Sucrose was transferred
0.2 0.3 0.4 0.5 0.6 0.7 0.84
6
8
10
12
14
10cm
5cm
Cout
[×
10
- 4 k
mol/
m3]
t 0.5
[ s 0.5
]
Fig. 13. Effect of channel length on outlet concentration of sucrose
in the type (d) channel having a channel length of 5cm, and the result was compared with that for the type (a). The outlet concentration was plotted against the square root of average residence time of the liquid, t 0.5 in Fig. 13. Equation (7) is rewritten as
www.intechopen.com
Mass-transfer Characteristics of a Microchannel Device of Double-Y Type
15
f 0.5out f
av
1.4 1.4C
L
l DDC C t
L vπ π⎛ ⎞= = ⎜ ⎟⎜ ⎟⎝ ⎠ (9)
The factor, P for the type (d) channel was 1.4, which was the same for the type (a) and also
as channels of different thickness of type (a). The accordance demonstrates that the factor is
not an intrinsic value of a specific channel, and characterizes a general flow behavior found
in the double-Y-type channels.
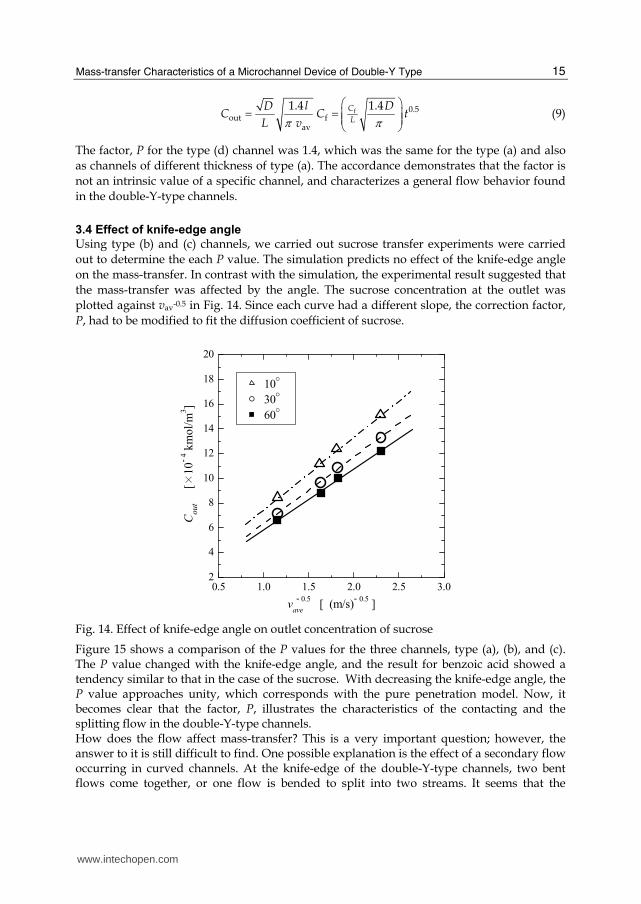
3.4 Effect of knife-edge angle
Using type (b) and (c) channels, we carried out sucrose transfer experiments were carried
out to determine the each P value. The simulation predicts no effect of the knife-edge angle
on the mass-transfer. In contrast with the simulation, the experimental result suggested that
the mass-transfer was affected by the angle. The sucrose concentration at the outlet was
plotted against vav-0.5 in Fig. 14. Since each curve had a different slope, the correction factor,
P, had to be modified to fit the diffusion coefficient of sucrose.
0.5 1.0 1.5 2.0 2.5 3.02
4
6
8
10
12
14
16
18
20
10°
30°
60°
Cout
[×
10
- 4 k
mo
l/m
3]
v - 0.5
ave [ (m/s)
- 0.5 ]
Fig. 14. Effect of knife-edge angle on outlet concentration of sucrose
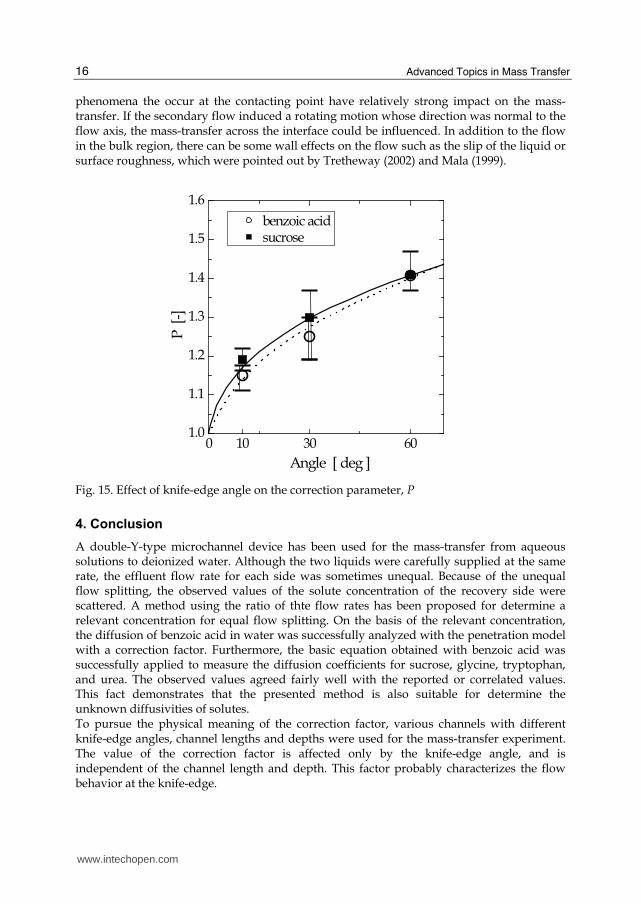
Figure 15 shows a comparison of the P values for the three channels, type (a), (b), and (c). The P value changed with the knife-edge angle, and the result for benzoic acid showed a tendency similar to that in the case of the sucrose. With decreasing the knife-edge angle, the P value approaches unity, which corresponds with the pure penetration model. Now, it becomes clear that the factor, P, illustrates the characteristics of the contacting and the splitting flow in the double-Y-type channels. How does the flow affect mass-transfer? This is a very important question; however, the answer to it is still difficult to find. One possible explanation is the effect of a secondary flow occurring in curved channels. At the knife-edge of the double-Y-type channels, two bent flows come together, or one flow is bended to split into two streams. It seems that the
www.intechopen.com
Advanced Topics in Mass Transfer
16
phenomena the occur at the contacting point have relatively strong impact on the mass-transfer. If the secondary flow induced a rotating motion whose direction was normal to the flow axis, the mass-transfer across the interface could be influenced. In addition to the flow in the bulk region, there can be some wall effects on the flow such as the slip of the liquid or surface roughness, which were pointed out by Tretheway (2002) and Mala (1999).
0 10 30 601.0
1.1
1.2
1.3
1.4
1.5
1.6
benzoic acid sucrose
P
[-]
Angle [ deg ]
Fig. 15. Effect of knife-edge angle on the correction parameter, P
4. Conclusion
A double-Y-type microchannel device has been used for the mass-transfer from aqueous solutions to deionized water. Although the two liquids were carefully supplied at the same rate, the effluent flow rate for each side was sometimes unequal. Because of the unequal flow splitting, the observed values of the solute concentration of the recovery side were scattered. A method using the ratio of thte flow rates has been proposed for determine a relevant concentration for equal flow splitting. On the basis of the relevant concentration, the diffusion of benzoic acid in water was successfully analyzed with the penetration model with a correction factor. Furthermore, the basic equation obtained with benzoic acid was successfully applied to measure the diffusion coefficients for sucrose, glycine, tryptophan, and urea. The observed values agreed fairly well with the reported or correlated values. This fact demonstrates that the presented method is also suitable for determine the unknown diffusivities of solutes. To pursue the physical meaning of the correction factor, various channels with different knife-edge angles, channel lengths and depths were used for the mass-transfer experiment. The value of the correction factor is affected only by the knife-edge angle, and is independent of the channel length and depth. This factor probably characterizes the flow behavior at the knife-edge.
www.intechopen.com
Mass-transfer Characteristics of a Microchannel Device of Double-Y Type
17
5. Nomenclature
A area of contacting plane [m2] Cb concentration of bulk liquid on the recovery-side [kmol/m3] Cf concentration of liquid on the feed-side [kmol/m3] Ci concentration at the contacting plane [kmol/m3] Cin concentration of recovery liquid at the inlet [kmol/m3] Cout concentration of recovery liquid at the outlet [kmol/m3] D diffusion coefficient [m2/s] Dobs observed value of diffusion coefficient [m2/s] Dlit literature value of diffusion coefficient [m2/s] L half width of the channel [m] l length of the main portion of the channel [m] NA mass-transfer rate [mol/(m2s)] S cross sectional area of the recovery-side [m2] t average contact time defined by l /vav [s] P correction parameter for Eq/(8) [-] Rout flow rate ratio defined as Qr / Qf [-] Qf flow rate for the feed-side [m3/s] Qr flow rate for the recovery-side [m3/s] vav average liquid velocity [m/s] vint, av average liquid velocity of the contacting plane [m/s]
Greek symbol
θ contact time defined by l/vint, av [s]
6. References
Ajmera, S. K.; Losey, M. W.; Jensen, K. F.; Schmidt, M. (2001). Microfabricated packed-bed reactor for phosgene synthesis. AIChE J., 47(7), 1639-1647, ISSN 1547-5905
Brody, J. & P.; Yager, P. (1997). Diffusion-based extraction in a microfabricated device. Sensors and Actuators A: Physical, 58(1), 13-18 ISSN 0924-4247
Costin, C. D.; & Synovec, R. E. (2002). Measuring the transverse concentration gradient between adjacent laminar flows in a microfluidic device by a laser-based refractive index gradient detector. Talanta, 58(3), 551-560 ISSN 0039-9140
Costin, C. D.; McBrady, A. D.; McDonnell, M. E.; Synovec, R. E. (2004). Theoretical modeling and experimental evaluation of a microscale molecular mass sensor. Anal. Chem., 76(10), 2725-2733 ISSN 0003-2700
Hetsroni, G.; Mosyak, A.; Pogrebnyak, E.; Yarin, L. P. (2005). Fluid flow in micro-channels. Int. J. Heat and Mass Transfer, 48(10), 1982-1998, ISSN 0017-9310
Higbie, R. (1935). The rate of absorption of a pure gas into a still liquid during short periods of exposure Trans. AIChE, 31, 365-389
Jost, W.(1952) Diffusion in solids, liquids, gases, Academic Press Inc., New York. Löb, P.; Löwe, H.; Hessel, V. (2004). Fluorinations, chlorinations and brominations of
organic compounds in micro reactors. J. Fluorine Chem., 125(11), 1677-1694, ISSN 0022-1139
www.intechopen.com
Advanced Topics in Mass Transfer
18
Maruyama, T.; Uchida, J.; Ohkawa, T.; Futami, T.; Katayama, K.; Nishizawa, K.; Sotowa K.: Kubota, F.; Kamiya, N.; Goto, M. (2003). Enzymatic degradation of p-chlorophenol in a two-phase flow microchannel system. Lab on a Chip 3(4), 308-312, ISSN 1473-0197
Mala, G. M. & Li, D. (1999). Flow characteristics of water in microtubes, Int. J. Heat and Fluid Flow, 20(2) 142-148, ISSN 0142-727X
Tokeshi, M.; Minagawa, T.; Kitamori, T. (2000). Integration of a microextraction system on a glass chip: ion-pair solvent extraction of Fe(II) with 4,7-diphenyl-1,10-phenanthrolinedisulfonic acid and tri-n-octylmethylammonium chloride. Anal. Chem., 72(7), 1711-1714 ISSN 0003-2700
Tretheway, D. C. & Meinhart, C. D. (2002). Apparent fluid slip at hydrophobic microchannel walls, Physics of fluids, 14(3), L9-L12, ISSN 1070-6631
Yamaguchi, Y.; Takagi, F.; Watari, T.; Yamashita, K.; Nakamura, H.; Shimizu, H.; Maeda, H. (2004). Interface configuration of the two layered laminar flow in a curved microchannel. Chem. Eng. J., 101(1-3), 367-372, ISSN 1385-8947
Yang, X. & Matthews, M. A. (2000). Diffusion coefficients of three organic solutes in aqueous sodium dodecyl sulfate solutions. J. Col. and Int. Sci., 229(1), 53-61 ISSN 0021-9797
van den Berg, A.; Olthuis, W.; Bergveld, P. (2000). Micro total analysis systems 2000, Springer, ISBN 0792363876, Dordrecht
Wilke, C. R. & Chang P. (1955). Correlation of diffusion coefficients in dilute solutions, AIChE J., 1(2), 133 – 272, ISSN 1547-5905
www.intechopen.com
Advanced Topics in Mass TransferEdited by Prof. Mohamed El-Amin
ISBN 978-953-307-333-0Hard cover, 626 pagesPublisher InTechPublished online 21, February, 2011Published in print edition February, 2011
InTech EuropeUniversity Campus STeP Ri Slavka Krautzeka 83/A 51000 Rijeka, Croatia Phone: +385 (51) 770 447 Fax: +385 (51) 686 166www.intechopen.com
InTech ChinaUnit 405, Office Block, Hotel Equatorial Shanghai No.65, Yan An Road (West), Shanghai, 200040, China
Phone: +86-21-62489820 Fax: +86-21-62489821
This book introduces a number of selected advanced topics in mass transfer phenomenon and covers itstheoretical, numerical, modeling and experimental aspects. The 26 chapters of this book are divided into fiveparts. The first is devoted to the study of some problems of mass transfer in microchannels, turbulence, wavesand plasma, while chapters regarding mass transfer with hydro-, magnetohydro- and electro- dynamics arecollected in the second part. The third part deals with mass transfer in food, such as rice, cheese, fruits andvegetables, and the fourth focuses on mass transfer in some large-scale applications such as geomorphologicstudies. The last part introduces several issues of combined heat and mass transfer phenomena. The bookcan be considered as a rich reference for researchers and engineers working in the field of mass transfer andits related topics.
How to referenceIn order to correctly reference this scholarly work, feel free to copy and paste the following:
Susumu Nii (2011). Mass-Transfer Characteristics of a Double-Y-Type Microchannel Device, Advanced Topicsin Mass Transfer, Prof. Mohamed El-Amin (Ed.), ISBN: 978-953-307-333-0, InTech, Available from:http://www.intechopen.com/books/advanced-topics-in-mass-transfer/mass-transfer-characteristics-of-a-double-y-type-microchannel-device