Embed Size (px)
Citation preview
MASSACHUSETTS FOOD
SYSTEM PLAN
JULIE CONROY, PROJECT MANAGER
DECEMBER 11, 2014
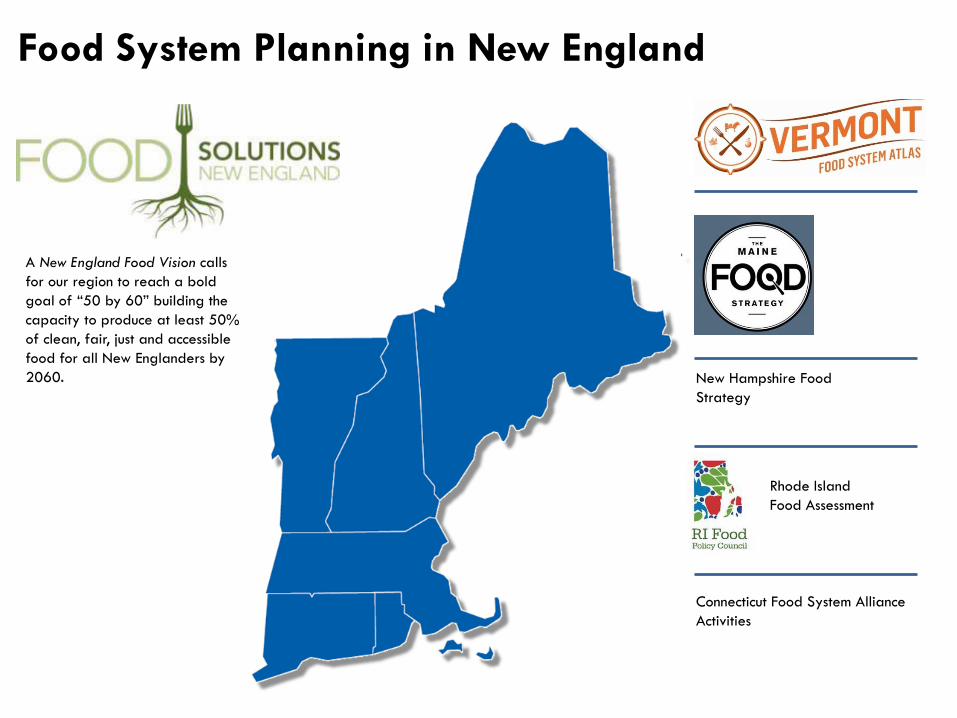
A New England Food Vision calls
for our region to reach a bold
goal of “50 by 60” building the
capacity to produce at least 50%
of clean, fair, just and accessible
food for all New Englanders by
2060.
Food System Planning in New England
New Hampshire Food
Strategy
Rhode Island
Food Assessment
Connecticut Food System Alliance
Activities

1974 Governor’s Commission on
Food Report 37 “Solutions” including:

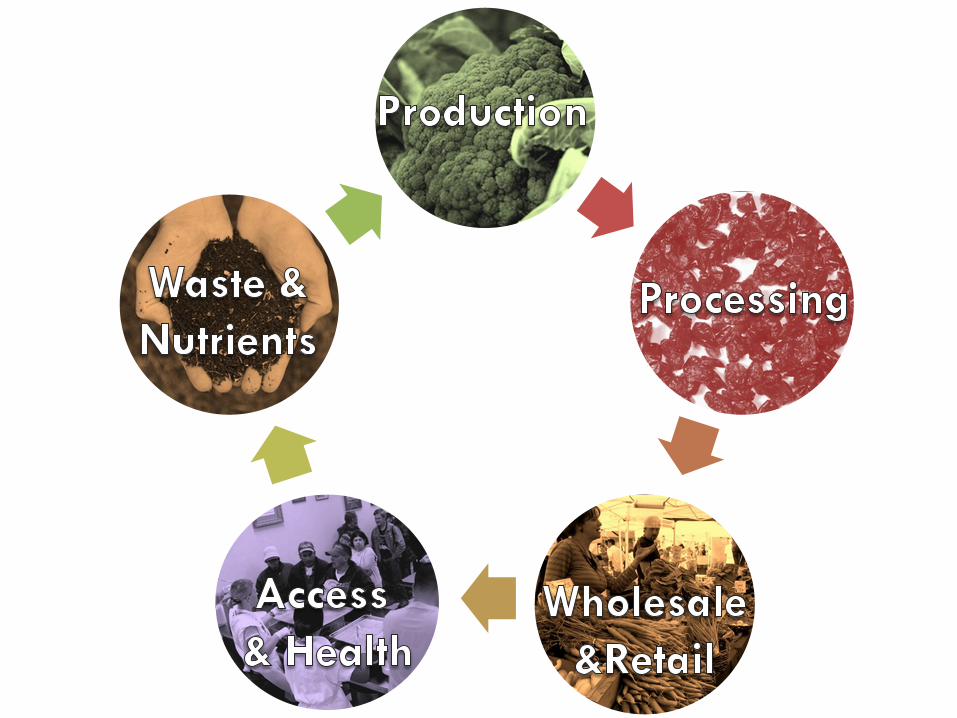
What is a
Food System?
4


Food System Jobs in Massachusetts
7 SOURCE: EOLWD ES-202, CENSUS NONEMPLOYER STATISTICS 2013, USDA CENSUS OF AGRICULTURE 2012
0
50,000
100,000
150,000
200,000
250,000
300,000
350,000
400,000
450,000
Food Services and Drinking Places
Food and Beverage Stores
Manufacturing
Wholesale Distribution
Food Production
Farm Inputs
427,000 jobs –
10% of Total
Employment
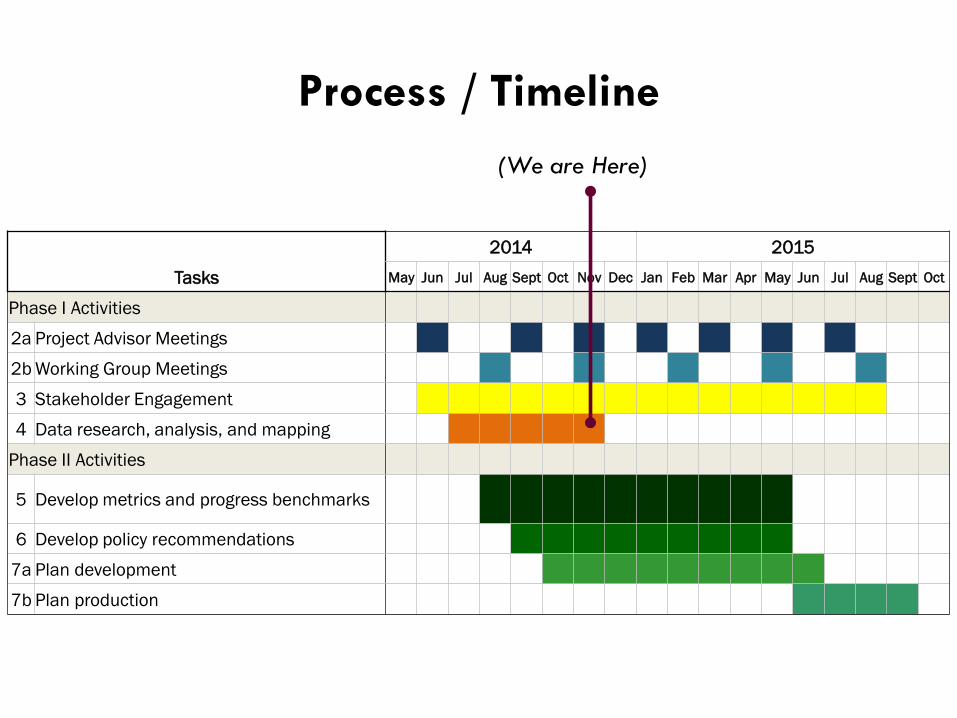
Process / Timeline
2014 2015
Tasks May Jun Jul Aug Sept Oct Nov Dec Jan Feb Mar Apr May Jun Jul Aug Sept Oct
Phase I Activities
2a Project Advisor Meetings
2b Working Group Meetings
3 Stakeholder Engagement
4 Data research, analysis, and mapping
Phase II Activities
5 Develop metrics and progress benchmarks
6 Develop policy recommendations
7a Plan development
7b Plan production
(We are Here)

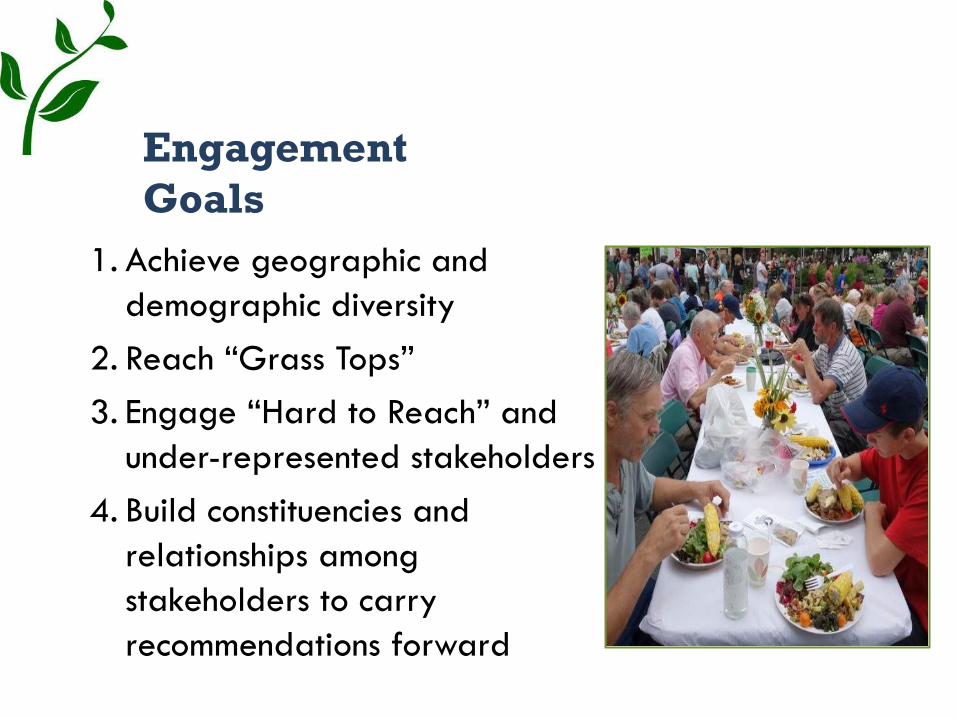
1. Achieve geographic and
demographic diversity
2. Reach “Grass Tops”
3. Engage “Hard to Reach” and
under-represented stakeholders
4. Build constituencies and
relationships among
stakeholders to carry
recommendations forward
Engagement
Goals

Outcomes
Food System
Policy Recommendations
Sta
kehold
er
Enga
gem
ent
Food System
Plan and Action
Items
Food System
Challenges and
Opportunities
Food System Existing
Conditions
Food System
Metrics and
Benchmarks

DATA Trends Affecting State Food System

13 SOURCE: USDA CENSUS OF AGRICULTURE 2012
MA Agriculture Key Statistics
7,755 farms (5.6% are CSAs)
68,110 jobs (as of 2011)
523,517 acres (8% of state land area)
22,000 seafood industry jobs

Food Production Crop farms, livestock, seafood, aquaculture
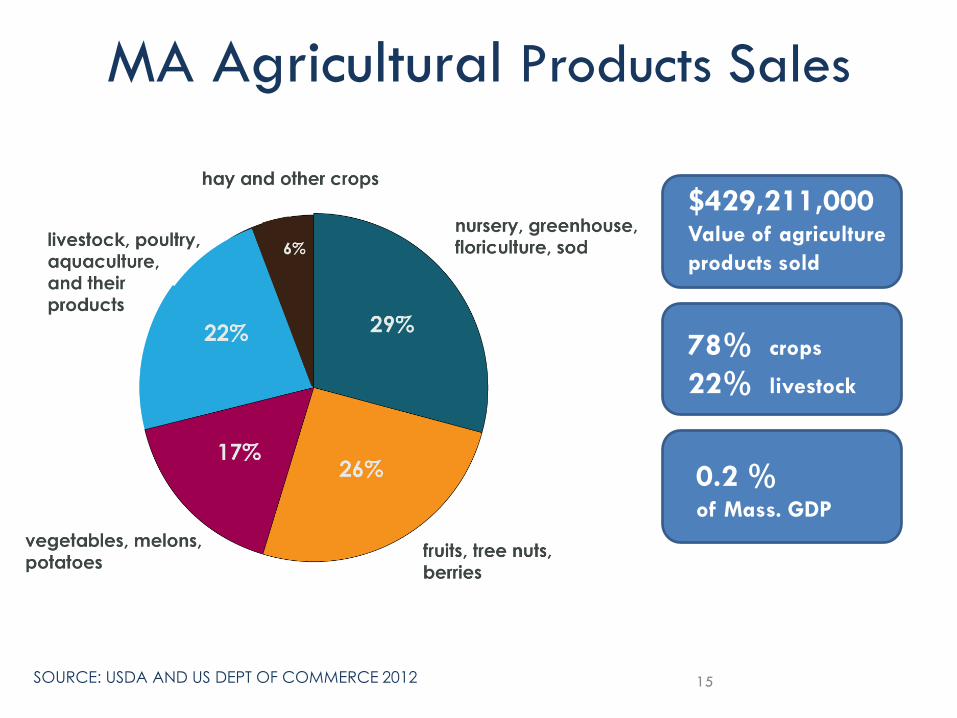
15 SOURCE: USDA AND US DEPT OF COMMERCE 2012
MA Agricultural Products Sales
$429,211,000 Value of agriculture
products sold
78% crops
22% livestock
0.2 % of Mass. GDP

MA Top 8 Agricultural Products
by $ sales Seafood: #2
Cranberries: #2
Wild blueberries: #2
Squash: #9
Maple syrup: #9
Raspberries: #10
Apples: #12
Pumpkins: #13
SOURCE: USDA CENSUS OF AGRICULTURE 2012
17
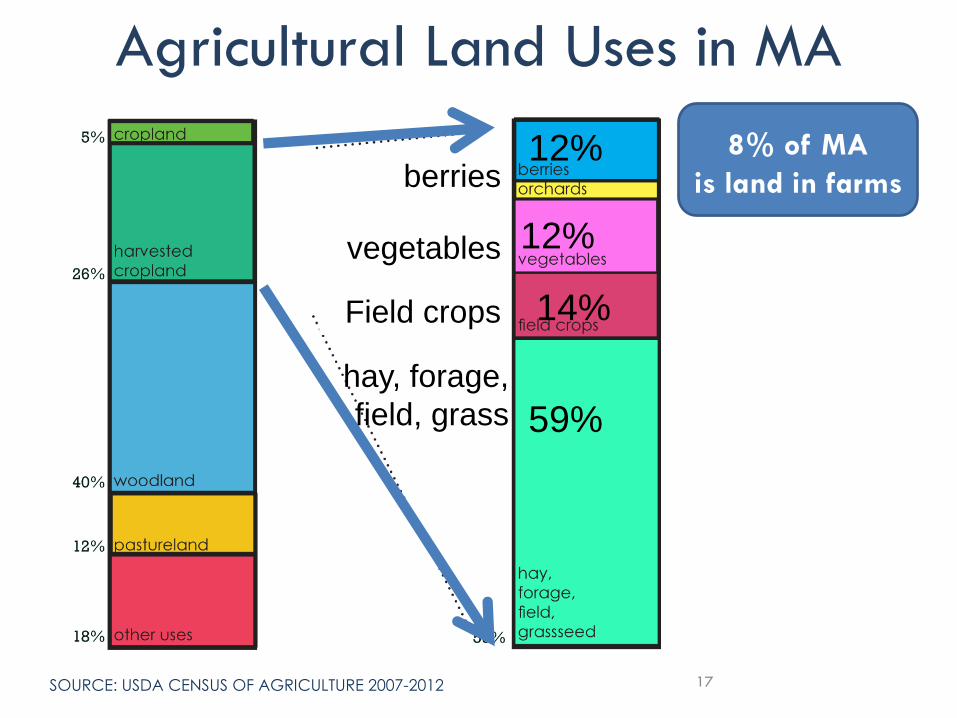
Agricultural Land Uses in MA
SOURCE: USDA CENSUS OF AGRICULTURE 2007-2012
8% of MA
is land in farms
59%
14%
12%
12%
hay, forage,
field, grass
Field crops
vegetables
berries

18
SOURCE:
MA Agricultural Land
SOURCE: MAPC PARCEL DATABASE, USDA SSURGO DATA, DEP WETLANDS
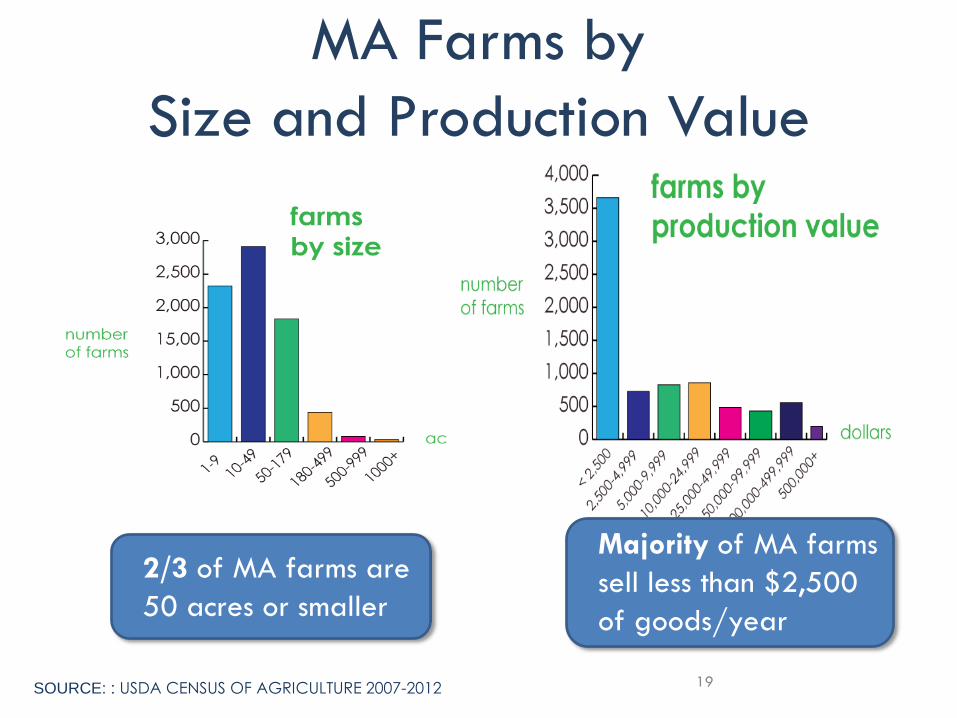
19 SOURCE: : USDA CENSUS OF AGRICULTURE 2007-2012
MA Farms by
Size and Production Value
2/3 of MA farms are
50 acres or smaller
Majority of MA farms
sell less than $2,500
of goods/year
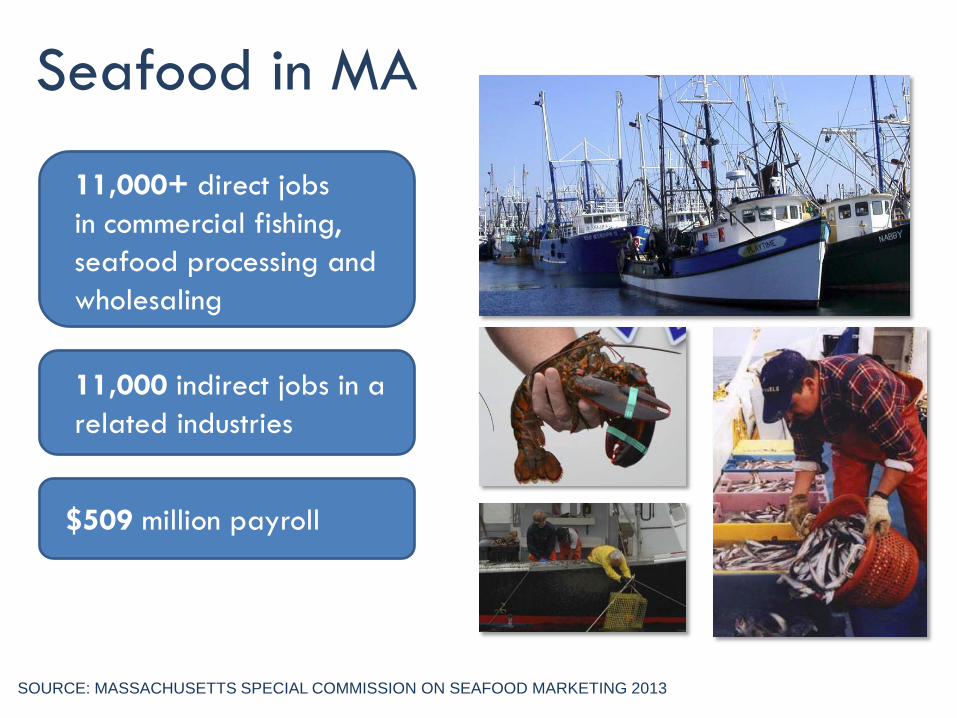
Seafood in MA
SOURCE: MASSACHUSETTS SPECIAL COMMISSION ON SEAFOOD MARKETING 2013
11,000+ direct jobs
in commercial fishing,
seafood processing and
wholesaling
11,000 indirect jobs in a
related industries
$509 million payroll
Retail Sales &
Distribution Grocery stores, coops, convenience stores,
restaurants, warehouses, trucking and
delivery

Retail Food in Massachusetts
1,293 full-line grocery stores
2,709 convenience stores
5,976 sit-down restaurants
4,709 fast food restaurants
252 farmers markets
SOURCE: USDA 2011

Food Waste &
Nutrients

Food Waste & Nutrients in MA

Food and People Hunger relief, “food deserts,” public health

MA Population
26 SOURCE: U.S. CENSUS BUREAU, 2010, SF1, MASSGIS

27 SOURCE: U.S. CENSUS BUREAU, 2000 AND 2010, SF1, MASSGIS
Residents of Color: Growing % in Cities

28 SOURCE: U.S. CENSUS PUBLIC USE MICRODATA SAMPLE 2007-2011
Age Cohorts by Race: Growing Diversity
68% 71% 70%
76%
85% 90%
8% 8%
7%
6%
5%
4%
14% 13%
13% 10%
5% 3%
6% 5% 7% 6%
4% 3% 4% 3% 3% 2% 1% 1%
0%
10%
20%
30%
40%
50%
60%
70%
80%
90%
100%
Under16 16-18 19-29 30-49 50-64 65+
Other or Multiracial
Asian
Latino
Black
White
Boomers and Retirees Teens & Young Workers
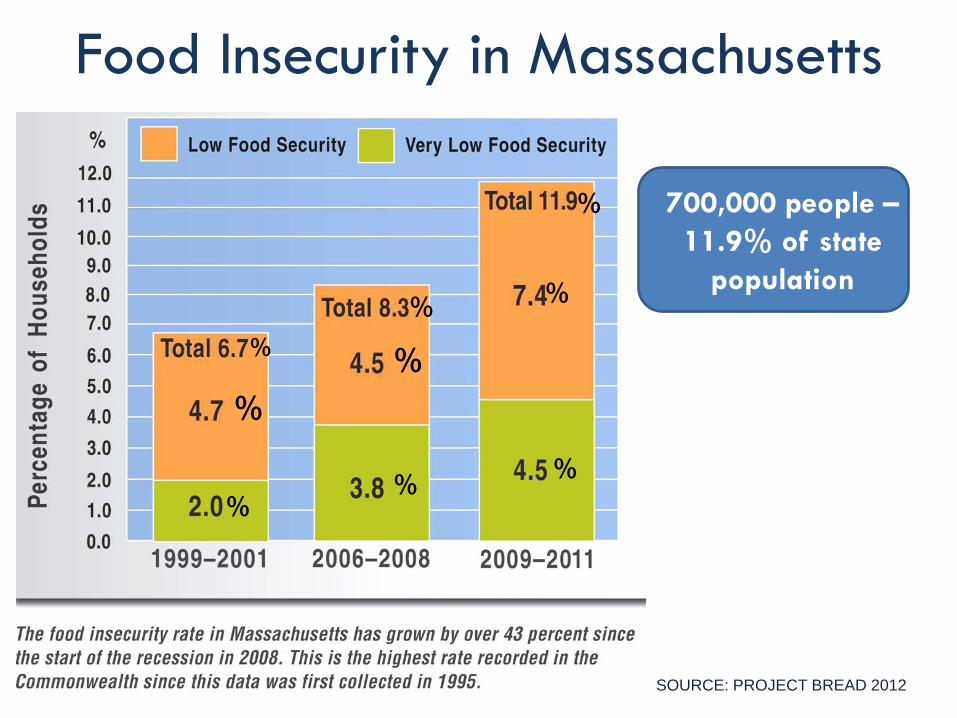
SOURCE: PROJECT BREAD 2012
Food Insecurity in Massachusetts
%
%
%
%
%
%
%
%
%
700,000 people –
11.9% of state
population
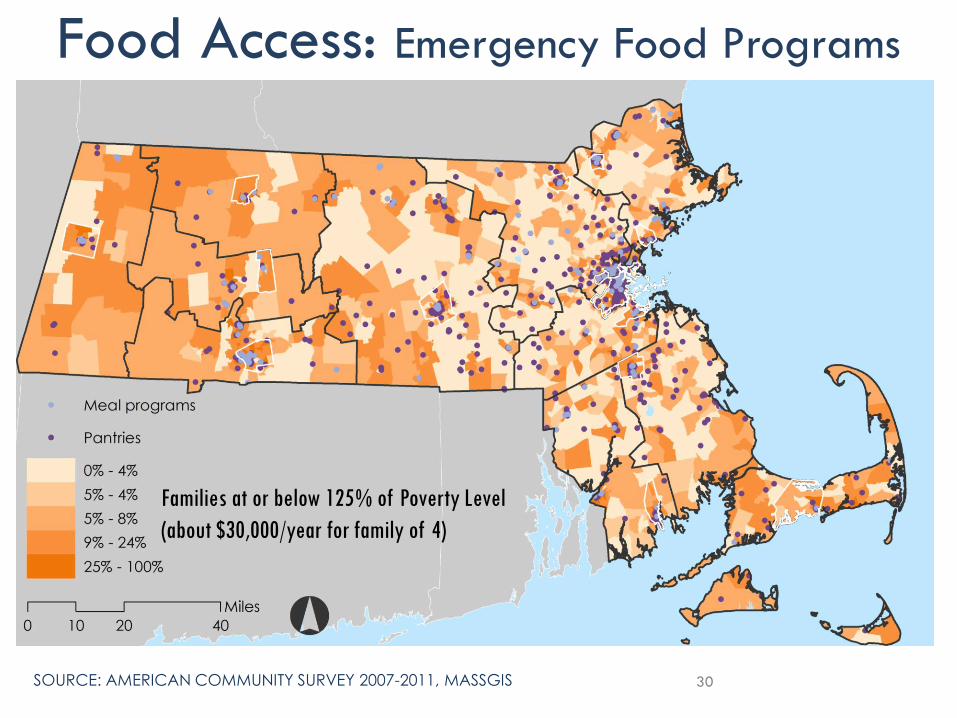
30 SOURCE: AMERICAN COMMUNITY SURVEY 2007-2011, MASSGIS
Food Access: Emergency Food Programs
Families at or below 125% of Poverty Level
(about $30,000/year for family of 4)

31 SOURCE: BRFSS
Percentage of Mass. residents who do not eat
5 servings of fruits or veggies per day
%

SUMMARY

Contacts: Julie Conroy, AICP Mary Praus David Elvin
MAPC, Project Manager FRCOG, Land Use Planner PVPC, Sr. Regional Planner
617-933-0749 413-774-3167 x131 413-781-6045
[email protected] [email protected] [email protected]
Heidi Stucker Alex Risley Schroeder
MAPC, Food Systems Planner MWA, Program Director
617-933-0739 413-531-8783