Embed Size (px)
Citation preview

MASTER LAND USE PLAN
ETHIOPIA
MAIN REPORT
Report prepared forthe Government of the PeoplesDemocratic Republic of Ethiopia
based on the workof
B.L. Henricksen
in collaboration with
D.C. Adiei-TwumL. Mayer
E. de PauwR.A.Schipper
andJ.A. Wicks
UNITED NATIONS DEVELOPMENT PRL,GRAMMEFOOD AND A6RICULTURE ORGANIZATION OF THE UNITED NAT ONS
AG/ETH/82/010TECHNICAL REPORT 1
Rome 198S

This technical report is one of series of reports prepared duringthe course of the proiects identified on the title page. Theconclusions and recommendations given in the report are thoseconsidered appropriate at the time of its preparation. They may bemodified in the light of further knowledge gained at subsequentstages of the proiect.
The designations employed and the presentation of material in thisdocument do not imply the expression of any opinion whatsoever onthe part of the United Nations and the Food and AgricultureOrganization of the United Nations concerning the legal status ofany country, territory, city or area, or of its authorities, orconcerning the delimitation of its frontiers or boundaries.

FAO. Assistance to Land Use Planning, Ethiopia.Master Land Use Plan, Main Report, based on the work ofB.L. Henricksen, in collaboration with D.C. Adjei-Twum,L. Mayer, E. de Pauw, R.A. Schipper and J.A. Wicks.Addis Ababa, 1988. 107 p., 23 figs. AG:DP/ETH/82/010,Technical Report 1.
ABSTRACT
This report summarizes the indings of a 6-man consulting missioncharged with the responsibility of preparing a draft Master LandUse Plan (MLUP) of Ethiopia, an original obiective but uncompletedoutput of the Phase I, FAO/UNDP Assistance to Land Use PlanningProiect, ETH/78/003. The draft MLUP prepared by the missionprovides a concise articulation and quantification of current landuse, land potential and of the constraints and possible solutionsto development. Much of the detail is presented in graphic form toassist higher level planners and decision makers, as requested inthe consultant's terms of reference. A total of 5 Techni calReports comprise the MLUP. The Main Report is supported by 4Technical Annexes, and 1:2 million scale maps on constraints andpotentials for development are attached. The analysis of landresources, agriculture, population and socio-economics contained inthe MLUP relies heavily on the data base produced during the PhaseI, Assistance to Land Use Planning Proiect. The backbone of theMLUPis an analysis of the proiected food demand and populationsupporting capacity (ESC) in Ethiopia, in the short (1985), med um(1995) and long term (2(10). The ESO was estimated using acomputer model which optimizes the land requirements for foco, fueland forage production sufficient to meet the subsistence needs of atypi cal farm family in each Awraia of the country. Resulteindicate that food demand will outstrip production by 2010 atcurrent levels of production and consumption, even if allpotentially arable land is cultivated. Development is concluded tobe constrained by physical, policy related and institutionalproblems. Recommedations include the immediate reallocation ofresources towards achieving increased agricultural output,decreased population growth, and increased nutrition and welfare_levels.
iii

AKNOWLEDGEMENTS
The Food and Agriculture Organization is greatly indebted to allthose who assisted in the implementation of the project byproviding information, advice and facilities. In particular, theMaster Land Use Plan preparation mission wishes to aknowledge thespecial assistance provided by the following agencies of theGovernment of Ethiopia: the Fourth Livestock Development Project,the Forestry Department, the Soil Conservation and CommunityForestry Department, the Land Use Planning and RegulatoryDepartment and the Agricultural 'Development Department, the ProjectPlanning Group and the Special Land Resource Studies group of theMinistry of Agriculture, the Agricultural Marketing Corporation,the Ministry of Coffee and Tea, the Water Resources DevelopmentAuthority, the Relief and Rehabilitation Commission, the NationalMeteorological Services Agency, the Agricultural Inputs andSupplies Corporation, the Institute of Agricultural Research, theEthiopian Mapping Agency, the Nationalities Commission and theCentral Statistics Office. Special thanks are also directed to theoffices of the following International Agencies in Ethiopia: theInternational Livestock Centre for Africa, the World Bank, theWorld Food Program, the United Nations Development Program, theoffice of the FAO Representative, and the national andinternational staff of the FAO/UNDP Assistance to Land Use Planningproject, ETH/82/010.
iv
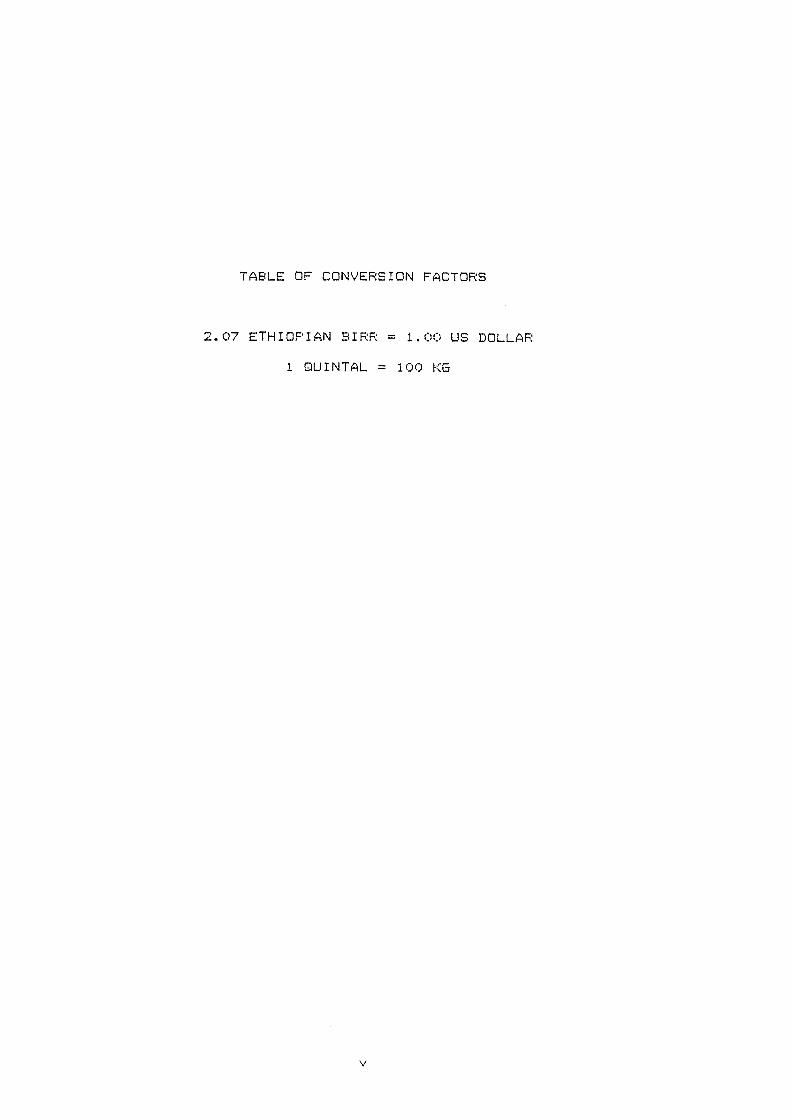
TABLE DF CONVERSION FACTORS
2.07 ETHIOPIAN BIRR = 1.00 US DOLLAR
1 QUINTAL = 100 KG

TABLE OF CONTENTS
INTRODUCTION1
1.1 BACKGROUND1.2 THE COMPONENTS OF THE MLUP ....... ......... ........ 31.3 GENERAL SETTING1.4 OUTLINE. OF METHODOLOGY FOR THE MLUP 4
THE ECONOMY, POPULATION AND FOOD DEMAND 6
"7.1 AGRICULTURE AND THE ECONOMY .......... ........ .............62.2 TRADE 00 6
INDUSTRY00 0.000000.00.0 0000 000 000000 MP........ .0011.00.0.102.4 OTHER SECTORS OF THE ECONOMY 102.5 EDUCATION AND HEALTH . 00.00. 00.00011.00.0...0 0 000.0 0012112.6 POPULATION AND FOOD DEMAND 122.8 FOOD DEMAND 0000.1100 00 00,01/000 0 0000..0 00.0000.00.0.6.0000013
PHYSICAL RESOURCES soyemaananwarson ..... am. ...... oassana.oaras21
3.1 GENERAL ........ ............... ................ ..........213.2 TRADITIONAL ALTITUDE ZONES3;3 MOISTURE AVAILABILITY FOR RAINFED CROP PRODUCTION 263.4 LAND MANAGEMENT CLASSES3.5 LAND COVER AND VEGETATION RESOURCES ........3.6 NATIONAL PARKS AND WILDLIFE ........ ..... ...... 33
LAND USE AND PRODUCTION SYSTEMS ........ .......... ..... ..74
4.1 GENERAL ......... ..... ....................................344.2 FARMING SYSTEMS .................... ....... ...............754.3 MAIN CROPS AND CROPPING PRACTICES ....... ...............364.4 LIVESTOCh ........... ..... ..... .............. ..... 414.5 SOIL DEGRADATION ..... ..............................444.6 DEGRADATION OF VEGETATION RESOURCES ....... ...............37
QUANTIFICATION OF LAND USE. THE POPULATION SUPPORTINGCAPACITY MODEL ........ ....................................49
5.1 BACKGROUND...-. ............ ..................... ....... ..495.2 THE POPULATION SUPPORTING CAPACITY MODEL ...... ........ ..... 495.3 ANALYSES UNDERTAKEN... ...... ........ ...... .......5.4 RESULTS OF THE ANALYSIS 56
vi

6. POTENTIAL FARMING SYSTEMS.......................... ......... 63
6.1 GENERAL.. .......... .......... ....... ........ ..... -676.2 FERTILIZERS VERSUS ROTATIONS...............................636.3 GENERAL AGRONOMIC CONSIDERATIONS AND POTENTIAL CROPPING....686.4 CROP SUITABILITY ASSESSMENT................................726.5 IMPROVEMENT OF FORAGE SUPPLIES.................. ..... ..... 74
SUMMARY OF CONSTRAINTS AND POTENTIALS FOR AGRICULTURE.......78
7.1 GENERAL ..... .......................... ...... ........... 787.2 MAIN PHYSICAL CONSTRAINTS AND POTENTIALS FOR DEVELOPMENT...787.3 POLICY CONSIDERATIONS............................. ......... 847.4 INSTITUTIONAL
CONCLUSIONS AND RECOMMENDATIONS....................... ...... 97
8.1 GENERAL ...... soassam ........ ussousso.ososessesouomousoususs938.2 ECONOMIC AND SOCIAL CONDITIONS............ ...... ..... 978.3 ENERGY CONSIDERATIONS.................. ................ ....948.4 MAIN CONSTRAINTS TO AGRICULTURE8.5 POTENTIAL FOR IMPROVED CROP PRODUCTION 988.6 LIVESTOCK PRODUCTION ..... ...... ......... ........... .. (D1
8.7 DEVELOPMENT AND PRESERVATION OF UNIQUE RESOURCES... ....... 103
REFERENCES... ..... . .............. ...... . ..... ........ ..... 104
vii

LIST OF TABLES
Total apparent consumption per capita in the base year. 15Required increase in food production between 1985 and 162010 to raise nutrition to recommended standards. 48Estimated annual fuelwood demand.Population supporting capacity classes. ........ 60Main crop groups used in the land suitability assessment.- 73Suitability of crops in relation to traditional 76agroecological zones.
LIST OF FIGURES
1. Location map. .1141. ....... *most. ...... 00110.0400 ..... pUboatamm 5
4. Contribution of different sectors to GDP, 1984/85. ....... 7GDP and agricultural GDP growth. ...... ..... ........ 7Value of imports, 1985. ....... ................... ........ SValue dpf imports, 1974. 0.1.passioubsomunalla.0* ..... te ...... eValue of exports, 1985. ..................... ........ 9Value of exports, 1974. ......... ....... ....... 9Projected population of Ethiopia. 14Index of population and food production. 14
Projected food demand in Ethiopia: 1985 - 2010. ...... 19
Traditional altitude zonation. ......... 25Dependable growing period - days: Ethiopia.Land management classes: Ethiopia. .......... 31
Current land cover: Ethiopia. 71
Area under major crops. ........ ..... .......... ...... 38
Crop yields: Ethiopia. ..... ......... .............. . 38Livestock by type (% of total TLU). 42Population supporting capacity: Shewa 2 - Base model. 57Population supporting capacity: Shewa 2 - Achievable 57
optimum.Supporting capacity trends: Base model. ..... 59Relative impact of interventions on PSC. 59
44. Fertilizer/grain price and fertilizer use. ......... 65
23. Proposed cropping calendars for different lengths of 75
growing peribd (LGP) in the Kola zone.
LIST OF ATTACHMENTS
Map 1: Physi cal constraints to agricultural development.
Map 2: Land development potential.
viii

LIST OF ABBREVIATIONS
AEZ Agroecological zoneADD Agricultural Development DepartmentAIDB Agricultural and Industrial Development BankAISCO Agricultural Inputs and Supply CorporationAMC Agricultural Marketing CorporationCBE Commer'cial Bank of EthiopiaCMC Coffee Marketing CorporationOSO Central Statistical OfficeDAP Diamonium PhosphateEHRS Ethiopian Highland Reclammation StudyEPID Extension and Proiect Implementation DepartmentESC Ethiopian Seed CorporationFAO Food and Agriculture Organization of the United
NationsFLDP Fourth Livestock Development ProjectGDP Gross Domestic ProductGoE Government of Socialist EthiopiaIAR Institute of Agricultural ResearchICRISAT Internation Centre for Research in Semi-Arid
Tropics.IDA Internaitonal Development AssociationIFAD International Fund for Agricultural DevelopmentILCA International Livestock Centre +or AfricaLUPRD Land Use Planning and Regulatory DepartmentMoA Ministry of AgricultureMPP Minimum Package ProgramN NitrogenONCCP Office of the National Committee for Central
PlanningPhosphorous
PA Peasant AssociationFADER Peasant Agricultural Development Programpc Producer CooperativePDRE Peoples Democratic Republic of EthiopiaRRC Relief and Rehabilitation CommissionSC Service CooperativeSCCFMD Soil Conservation and Community Forestry.
Main DepartmentUNDF United Nations Dvelopment ProgramWFP World Food Program
ix
1. INTRODUCTION
1.1 BACKGROUND
The Land Use Planning and Regulatory Department (LUPRD) of theMinistry of Agriculture (MoA) in Ethiopia has been receivingUNDP/FAO assistance since 1575, in the form of the Assistance toLand Use Planning Project, ETH/78/003 (Phase-I) and, more recently,ETH/82/010 (Phase II). The preparation of a draft Master Land UsePlan (MLUP) was one of the objectives of the Phase-I proiect but,due to time and manpower constraints, it was not completed duringeither phase of the project.
A draft MLUP synthesized from the vast quantity of data generatedduring the Phase-I project life - concerning both physical andsocio-economic aspects of agriculture in Ethiopia - would haverepresented a logical conclusion to this phase of the project. A5-man consulting mission was subsequently given the task ofcompleting the MLUP between August 1987 and February 1588, basedprimarily on the data produced during Phase-I and subsequent phasesof the Assistance to Land Use Planning proiect .
1.1.1 Definition and scope of the MLUP
The draft MLUP envisaged under the Assistance to Land Use Planningproject is defined as a summary document containing a simpleexpression of the distribution of land potential and current landuse in the country; and a concise and comprehensive articulation ofthe constraints and their possible solutions in a languageunderstandable to higher level decision makers and planners atnational and regional levels. It is an abstraction of the resourcemaps and information on land use and land suitability, and theintegration of the analysis and findings of the various studiesundertaken at the exploratory level of 11,000,000 scale during thePhase-I proiect.
The small-scale character of the original data base used to compilethe MLUP dictates that the conclusions from the data are onlyapplicable for large areas and should not, therefore, be used forcompiling detailed land use plans that can be laid down on the-ground. The MLUP is, however, designed to help planners and_decision makers at higher levels identify areas of the countryrequiring state intervention, areas requiring more detailed studiesto fully assess the potentials or constraints to development, andto assist the development of policies at national and regionallevels +or rational use of land. The MLUP also integrates thefindings of the Phase-I project with more recently gatheredagricultural statistics, livestock data, and land use informationto provide an improved basis from which appropriate land usepolicies can be formulated.
1.1.2 Summary of activities suggested in the ter-me of reference:
a) Identify, characterize and quantify the current landuse in the country;
b) Identify the problems and potentials associated withcurrent land use practices;
c) Identify, characterize and quantify the landresources in the country suitable for:
rainfed crop production;mechanized rainied crop production;perennial crop production;extensive livestock production;semi-intensive livestock production, includingdairying;
vi, production of wood for fuel and timber;vii irrigated agriculture, both small scale and
large scale.
d) Identify and quantify areas requiring preservationincluding:
i. unique ecosystems;natural forests;areas of wildlife concentration
d) Identify areas which are degraded or threatened bydegradation.
e) Identify the physical, institutional andinfrastructuralconstraints to realizing potentials, and suggestpolicies to overcome these.
f) Match the land resources with the demand for theseresources in the short, medium (1995) and long term(2010).
g) Quantify the land resources and their current use,including potentials and constraints at national andregional levels.
1.1.3 Composition of the consultancy team
The following consultant inputs were made to the MLUP:
Land Use Planner/Team Leader 7 months- Agricultural Economist (macro) 1.7 months
Agricultural Economist (micro) 1.7 months
Range/Livestock Consultancy
Techn cal Report 4
Potential Farming Systems
Technical Report
A Summary of the Agricultural Ecology of Ethiopia
Much of the information presented in the technical annexes is inthe form of bar graphs and charts to improve the ease of-comprehension for higher level decision makers and planners.Technical Report 1 summarizes the findings detailed in the othertechnical reports referred to above. Technicians wishing to probefor detailed analysis of the various subiects treated in the MLUPwill find that information available in the remaining technicalreports.
'Prepared in collaboration with NMSA and CSO: FAO/TCP/ETH/6658.
- Range Ecologist months- Agronomist 2 months- Agroclimatologist 1 month
1.2 THE COMPONENTS OF THE MLUP
The MLUP consists of a number of reports which together constitutethe draft master plan. The list of components is as follows:
Technical Report 1
Main Report
Annex 1 - Population Supporting Capacity AnalysisSummary of Resulte
Annex 2 - Regional Profiles of Land Resources
Annex 3 - Regional Profiles of Land Use and Crop,Livestock and Forest Production
Annex 4 - Atlas of Maps
Technical Report 2
Agricultural Economics Consultancy
Technical Report

1.3 GENERAL SETTING
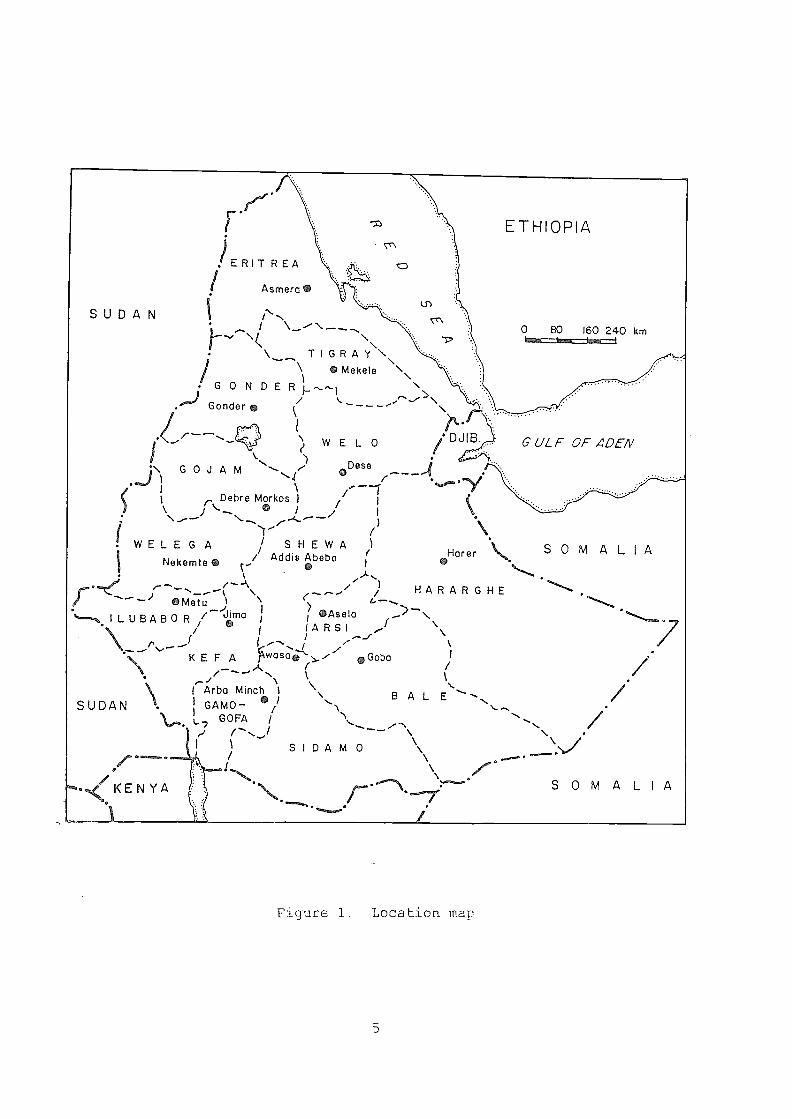
Ethiopia lies wholly in the tropics, between 3°N and 16°Nlatitudes, and 33"E and 48°E longitudes in the Horn of Africa(see Figure. 1). The land area is approximately 1.24 millionkm, and is bounded in the northeast by the Red Sea and the Gulfof Aden, the Republic of Diibouti and Somalia in the east, Kenya inthe south and the Sudan in the west. Ethiopia is unique physicallybecause of the high proportion of its landmass over 2000 maltitude, where the climate is more temperate than tropical. Over80% of the 45 million inhabitants live in these highlands, 907. ofthem rural and relying on subsistence agriculture.
Temperatures vary widely throughout the country, -From the hotteston earth to those found in the frost prone, Afro-alpine zone. Thisvariation is mainly due to extremes in altitude. Rainfall is alsoquite variable in both amount and extent, ranging from a fewhundred mm per year in the semi-arid zone to more than 2000 mm inthe western highlands. The highlands in general are surrounded byhot, semi-arid lowlands in the north, east and south, and by hothumid lowlands in the west.
Soils used for agriculture are predominantly formed on volcanicmaterials. This, coupled with temperate highlands and adequaterainfall, suggests a rich agricultural potential, but climaticvariability, outdated farming practices, and limited incentives forfarmers inhibit productivity. The dramatic famine of 1964/65,following iust 10 years after similar problems in 1974, highlightedthe fragility of the existing subsistence agricultural system inrelation to the food demand of the rapidly rising population.
1.4 OUTLINE OF METHODOLOGY FOR THE MLUF
The MLUP aims at providing planners and higher level decisionmakers with an obiective assessment of the malar constraints andpgtMritialm of thm agricultural resources of Ethiopia, with a viewto identifying appropriate policies and interventions to stimulatefood production over the next 25 years.
The backbone of the MLUP is the quantification of land resources:From the Phase-I project, the population census and agriculturalstatistics. These are presented in an easy to use graphic form in
-the annexes listed in section 1.2. Data on land resources were fedinto a population supporting capacity model developed during theMLUP activity. This provides an assessment of the ability ofavailable land resources to provide a satisfactory level ofsubsistence for rural farmers and the population as whole. Variousanalyses using the model test the benefits of interventions to theland use systems in terms of the population supporting capacity.Potential farming systems which may help to realize the benefitssimulated in the population supporting capacity model are discussedin later chapters. Potentials and constraints to agri culturaldevelobment are also discussed, along with suggestions on ofpolicies which may help to realize potentials or to overcomeconstraints.
4
ERITREA
iAsmeraSUDAN ( /N._\
(.5-)
l'*\0 60 160 240 km
1---'/-\( NN "P ) - . .
\ TIGRAY \\
G 0 N D E R \1)....-..--7
Mekele \\i
......-...
N
. ....) Gonderl \/ ,.._____/-----\
-- \ W E L 0 / DJIB.
\ .),
r.- .......... Metu 1
N_........% \É---.1\ ... - e-...., ...../
)
1...- ..../ HARARGHE
-../,. I > Asela- ILUBABOR if 'elm' III
..-)-1./ I ARSI el \ \r ....--
j r, I ..-..1
K E F A wasa,./ Goba I.-- .... \-
( //- -----A 1 1./ \
SUDAN \.
I Arba Minch I 6 AL Es.---I GAMO- ./I \
N \ N.\ .. ,,,
I\ 1/4.. ...) GOFA / 1N. N.-.
........ ..--- Ne, r'N...,/ - \ \
\ \I I SIDAM 0 \
/1.\\l...'"kk
0
0f ' , asoiam
\NM...,KENYA r --7;1 /.
Figure 1. Location map
5
ETHIOPIA
.
G ULF OF ADEN
*-\ GOJAMDeseI r. Debre Markos /0-
/N.,
( WELEGA SHEWA/)
*HarerSOM ALIA
Nekemte Addis Ab eba
SOMALIA
2. THE ECONOMY, POPULATION AND FOOD DEMAND
..1 AGRICULTURE AND THE ECONOMY
Agriculture is the mainstay of the Ethiopian economy, accountingfor approximately 507. of the GDP, 85% of employment and the maiorshare of exports. The share of GDP, however, fell from around 58%to 41% between 1965 and 1985, and agricultural GDP growth averaged1.17. over the last decade, while the economy grew at around 2.57.during the same period. Recent economic indicators show adeclining trend, with the drought of 1984/85 having a strongnegative influence (World Bank 1987). The contribution ofdifferent sectors to GDP in 1984/85, and the relationship betweenGDP and Agricultural GDP in the period 1979/80 and 1984/85, areshown in Figures 2 and 3.
Ethiopia has an estimated GNP per capita of around US$140, makingthe country one of the poorest in the world (World Bank 1983).This has resulted in a declining spiral of subsistence, exacerbatedby two serious famines in the last 25 years. Some 95% of the foodproduced is by peasant farmers whose primary obiective is to meetsurvival needs before any consideration of generating cash incomefor consumer goods. Where surpluses of grain are produced, theseamount to some 20% of a subsistence farmers production and aresold for cash or traded. However, income disparity between theagriculture and non-agriculture sectors is more than 1 to 6.Cereals make up the bulk of the food production, with pulses,oilseeds, enset (Ensete ventricosum), roots and tubers accountingfor the remainder. These are supplemented by livestock products.
2.2 TRADE
" 1 The nature of imports and exports
In the export sector, coffee is by far the most importantagricultural commodity in Ethiopia, accounting for some 607. oftotal export earnings (EHRS 1986). Livestock products and liveanimals are also important export earners. Exports accounted for .
approximately 13% GDP during the last 10 years, while imports have-increased from around 157. to 20% during the same period. The,structure of imports has changed somewhat since the revolution in1974, with considerably more food now being imported in absoluteterms and also relative to other commodities. Petroleum products,machinery and equipment and manufactured goods account for most ofthe remainder. The percent of imports and exports by commoditysector in both 1974 and 1985 is shown in Figures 4 to 7.
2.2.2 Trading partners and foreign exchange
Ethiopia's maior trading partners are currently the FederalRepublic of Germany, Italy, Japan, the Netherlands, the UnitedStates, the United Kingdom, and the USSR. The rate of exchange has
6

DISTRBUME SEFN1CM (17.65)
4
o
-10
-12
-14
-1679/a0
CM-IE9 SEIM (22.05)
GROSS DOMESTIC PRODUCT 1884/85SDLIRCE: CINCCP
O GDP GREM.11-1
IFIDLI.IHES (1E85)
Figure 2.
GDP AND AGRICULTURAL GDP GROWTHsouRm WORD BANK 197
Figure 3.
7
AGRC. GDP
R/GLIL11_FiE (43a70
B1 /S2 82/0',3 8.3/S4 84,1E.;5

FAXHIt.ERY (237%)
F.O.CHWERY (235.5:
lylANLJFACTURED GOMM (1 3.57.)
SOURCE co 1937
SCLIRCE: MO 1937FC.OD lz UVE ANIMALS (3.8%)
8
VA,LUE OF IMPORTS - 1805Figure 4.
VALUE OF IMPORTS - 1874Figure 5.

CRUDEIrIATE194123 (192g)
OT1-ER (1 AF.)
Figure 7.
CRUDEMATERALS (372%
Ki NEPAL FUELS Erc (9B.%)
tiER.61. Fl F1 ETC (15.)
SCLJRCE: co 1937
VALUE OF EXPORTS - 1974
9
Lid-41%44123 (ea.cF.)
D LAN FAAL:-..;
Figure 6 . VALUE OF EXPORTS - 1985

remained essentially unchanged since 1975, at 1US$ = 2.07 Eth.Birr, and it is estimated that up until 1983, the import weightedreal effective exchange rate appreciated by nearly 40% (IMF 1983).Recent international currency luctuations should have reduced thisimbalance somewhat, but nonetheless it has tended to act as adisincentive to export (EHRS 1986).
2.3 INDUSTRY
Food and textile industries account for most manufacturing inEthiopia, with the vast majority taking place in or around AddisAbaba and Asmera. Most large-scale industry is run by the state,consistent with the GoE's desire to develop a socialist economy.It is mostly based on the processing of agricultural raw materialssuch as cotton or livestock products, is highly import-dependent,capital intensive and caters mainly for the urban sector (EHRS1986). Small-scale and cottage industries are very diverse andwidespread, mostly privately owned, labour-intensive and b,pted onlocally available resources. Availability of credit, lack o+technical support and confidence about future government policy arecited by EHRS (1986) as the main constraints to expansion of thissector of the economy.
2.4 OTHER SECTORS OF THE ECONOMY
4 1. Transport and communications
Modern transportation in Ethiopia comprises national andinternational air, road, sea and rail links. One of the tworailways links Addis Ababa and Diibouti. The second, linkingAsmera and Massawa, has been inoperative since 1974. Air trafficis intensive, especially on international routes, as Addis Ababaprovides a transit point to and from Europe and Asia for trafficexiting Eastern, Southern and Western Africa. The nationalairline, Ethiopian Airlines, thus contributes significantly toforeign exchange earnings. Domestic air routes are also wellestablished, with daily flights to most regional capitals fromAddis Ababa. Road transport, despite one of the lowest roaddensities in Africa, is the backbone of the modern transportationsystem within the country. The mountainous topography in Ethiopiahas placed natural limits on the expansion of the road network andthis remains today one of the most severe constraints to-accelerated development of the country. Sea links are alsolimited, with facilities at the port cities of Aseb and Massawabarely able to cope with the demand placed upon them, despiterecent upgrading of freight handling facilities.
Traditional transportation is either by foot or by donkey, horse ormule. Equines have been estimated to carry more than 10% of thatcarried by all the modern means of transport in the country (EHRS,1986).
10

The utility of the donkey as a freight carrier has led to it beinglabelled 'the Ethiopian LandRover' by many Government workers. Itsfuture role, however, may be threatened by diminishing feedresources.
Communications in Ethiopia have been steadily upgraded over theyears following the revolution and include a modern telephonenetwork in Addis Ababa, with radio and telephone connections to andwithin Regions. International telex and facsimile connectionsexist in the national capital but, beyond this, postal services intowns provide the main source of long distance communication inrural areas.
2.4.2 Fuels and Energy
According to recent surveys (Anderson and Fishwick, 1984),Ethiopia's fuel consumption is divided almost entirely betweenfuelwood (including charcoal) and animal dung supplemented by cropresidues. Kerosene, LPG and electricity are minor contributorsoverall, but are important in major cities and towns. Energyconsumption is primarily centered around fuel for cooking. Recentpopulation trends indicate that fuel availability will soon reachcritical levels in Ethiopia. Details are discussed later in thereport.
2.5 EDUCATION AND HEALTH
2.5.1 Education
Education has grown at a considerable rate in Ethiopia in recentyears, with literacy improving from 77. in 1974 to around 50% in1985. This was mostly the result of a non-formal, nationwideliteracy campaign instigated by the Government in 1979. Formalschooling has also considerably expanded, with total enrolments inall levels rising from 1.15 million in 1974/75 to 3.12 million in1985/86 (CSO, 1987). The most substantial increase has been at theprimary level. The number of schools at all levels increased overthe same period from 3827 to 9109, but despite increased numbers ofteachers, the teacher to student ratio continues to decline.
2.5.2 Health
_Ethiopia's location in tropical Africa, the relatively Iownutrition of many sectors of the community, coupled with the factthat only 47, of the population has access to protected watersupplies (World Bank, 1985), means that disease problems areconsiderable. According to the World Bank (1985): "Diseasepatterns are exacerbated by low standards of living, producing inturn poor hygiene and inadequate nutrition, and by limited use ofhealth facilities."
The leading causes of morbidity at hospitals and health centres arequoted as follows: Malaria; Helminthiasis; Skin irritations;Venereal disease; Rheumatic pain; Malnutrition; Fevers; Upper
11
respiratory tract infections; and Tuberculosis.
Source: World Bank 1985, MOH statistics, 1981
In addition to these frequently occuring diseases, diarrheas playan important role in infant morbidity. Some 60% of childhooddiseases appear preventable (World Bank 1985). Other diseases ofimportance are schistosomiasis, yellow fever, leprosy,leishmaniasis and onchocerhiasis (river blindness). Epidemics ofviral hepatitis, cholera, tick fever, typhus and typhoid occur, butcan be managed by improved sanitation, provision of potable water,and improved medical facilities and education. Overall, the highincidence of parasitic diseases and malnutrition lowers theresistance of individuals to a wide variety of other seriousinfections.
Mortality data are not widely available or reliable, but thosewhich are indicate the crude death rate to be in the region of18/1,000. Life expectancy is about 47 years, average forsub-Saharan Africa, but around 23% of children die under 5 years.The main causes of death recorded in hospitals are dysentry andgastroenteritis, tuberculosis, pneumonias, malnutrition and anemia,liver diseases including hepatitis, tetanus and malaria (World Bank1985). In or following drought years, death from malnutritionbecomes acute. Such famines have regularly visited Ethiopia overhistory, but recent population trends have hightened theprobability of further problems.
An ambitious ten-year health sector plan developed by thegovernment for the period 1984/85 to 1993/94 sets out a detailedstrategy of health services development, among other things toreduce infant and child mortality and increase overall lifeexpectancy. Financial and manpower constraints may limit theanticipated gains of the plan according to the World Bank, butoverall its obiectives are sound.
2.6 FOFULATION AND FOOD DEMAND
2.6.1 Population proiections
Jr, May 1984 the first complete census in Ethiopia revealed that 42Million people were living in the country (OSO, 1985), about 7
'million more than previously believed to be the case. At thenational level population is presently increasing by 2.97. perannum. The World Bank (1985) offers three scenarios for populationgrowth up to 2010 using the 1984 census. They are:
no fertility decline;
gradual fertility decline;
accelerated fertility decline.
12

The first assumption implies that fertility will not change andprovides a benchmark for comparison. The second scenario assumes agradual decline in fertility after 1990. Such a decline isexpected during the course of normal socio-economic developmentwithout major government intervention. The final model assumes arapid fall after 1990 and represents the maximum that could beachieved with considerable government involvement. This lattersituation is based on the experiences of countries which haveachieved considerable reductions in population in the recent past.This is not considered likely in Ethiopia in the forecast period inview of the current stage of economic development. For thepurposes of the MLUP, therefore, the population was only projectedfor the two remaining growth scenarios, adiusting the 1984 censusdata to 1985 and taking into account the increased deaths duringthe 1984/85 famine. The projected population data for the years1985, 1995 and 2010, which are used in the MLUP, are shown inFigure 8. Further details of the methods used to proiectpopulation are .given in MLUP Technical Report 2, AgriculturalEconomics Consultancy. Detailed graphic presentation of theproiected rural population iE also provided in Annex 1 of this mainreport.
The emerging pattern is clear from Figure 8, Ethiopia's populationis entering a phase whereby it is likely to double to more than 90million before 2010, placing enormous strains on the economythrough the increased demand for food, energy and services. Acomparison of the index of population and food production between1979/80 and 1.984/85 is given in Figure 9. Low levels ofurbanization have so far reduced the burden on employment and urbandevelopment. But, even with the relatively low levels of proiectedurban population growth, the numbers will probably treble by 2010and thus throw the burden back on these factors with all theimplied consequences.
2.8 FOOD DEMAND
2.8.1 General
The demand for food depende on the FAZE and composition of thepopulation and on its purchasing power. Food demand estimatespresented below are based en combinations of the population growthproiections and different economic growth scenarios. TheOercentage growth in the demand for food was calculated taking into
'account population growth, value added growth, demand and valueadded elasticity. The exact methods of calculation are detailed inMLUP Technical Annex 2.
2,6.2 Apparent consumption of grain equivalents
Before estimating the demand +or food, it was first necessary toquantify the average apparent consumption, taken-over a number ofyears, to obtain a reasonable estimate for the base year, 1985.Production and availability of cereals, pulses, enset, roots and
13

PROJECTED POPULATION OF ETHIOPIA19,= -3D10
14
1995 20 10 1-11G1-1 2010 AiED.
V /1 /7.771 URBAN
INDEX OF POPULATION AND FOOD PRODUCTIONJURE: War) BANK 1287
79/S0 E1/2 82/83 a 4 84/35
F771 POPLLAMON CROP PRO0UC110N

tubers, and milk and milk products were taken into account in thisprocess. The calculation is based on area and yield data of crops,and FAO (1987c) nutrition data, the details of which are presented inMLUP Technical Report 2. Table 1 below summarizes the results ofthis analysis.
TABLE 1
TOTAL APPARENT CONSUMPTION PER CAPITA IN THE BASE YEAR
Domestic Imports Subtotal Subtotal Cons.of oilsProduction vegetables
(1) (2) (3) & meat
National 155 10 165 1306 260 1566average
Rural 146 9 155 1227 245(4) 1472areas
Urban 207 21 228 1805 347(4) 2157'areas
Domestic production of cereals and pulses, enset, roots-and tubers,and milk and milk products.
Imports of cereals, commercial as well as food aid.
Conversion from kg grain equivalents/year to calories/day:0.65*(3400/365) = 7.918
National average of 260 calories/capita/day, divided between ruraland urban sectors as follows:
Rural (0.80/0.85)*260 = 245; Urban (0.20/0.15)*260 = 347
2.8.3 Economic growth proiections
The World Bank (1987a) offers two growth scenarios for the developmentof the Ethiopian economy between 1983/84 and 1991/92. In the first,referred to here as low growth, GDP is estimated to grow at 2.6% perannum, the value added growth of the agricultural sector at 2.4% perannum and the value added growth of the non-agricultural sector at
Grain equivalents kg/year Calories/day Total

287.. In the second scenario, referred to here as medium growth,GDP is expected to grow at 3.6% per annum, the value added growthof the agricultural sector at 3% per annum and that of thenon-agricultural sector at 4.2% per annum.
A third scenario is introduced for the MLUP which postulates thatthe average national consumption of food will reach adequatenutrition standards by 2010. This implies 2330 calories per capitaper day in Ethiopia. Assuming the same percentage is met -Fromoils, vegetables and meat as at present, 1943 calories are requiredfrom cereals, pulses, enset, roots and tubers and milk and milkproducts. Assuming also that imports of food are no longerrequired, this increased demand for food will have to be met bydomestic production. At the national level this means thatproduction must increase from 155 kg grain equivalent per capi ta to245 kg. Details are summarized in Table 2.
TABLE 2
REQUIRED INCREASE IN FOOD PRODUCTION BETWEEN 1985 AND 2010TO RAISE NUTRITION TO RECOMMENDED STANDARDS
Total production requi red from cereal s, pulses, enset,roots and tubers, and milk and milk products.
1985 2010 2010High Population Medium Population
Growth Growth
Totalprod. 155*42.41 = 6,574 2453(95.0 = 23,282 24544E34.89 = 20,651MT*1000
Increasein production 3.5 times 3.1 timesrequired by 2010relative to 1985
Percent growth 5.2 % 4.7,per annum required
Information concerning food demand income elasticities and thepopulation growth rates in rural and urban areas, detailed in MLUPTechnical Report 2, indicate that the value added growth in theagricultural sector under the high population growth alternativewill have to increase at some 5.17. per annum, while in thenon-agricultural sector it will have to grow at 8.6% per annum.Under the medium population growth alternative it will still have
16
to grow at 4.6% in the agricultural sector and 8.17. in thenon-agricultural sector to meet demand at the desi red minimumnutrition levels.
Growth rates of the order postulated above appear impos=ibly highto maintain over 25 years. No other country in the world hassustained such levels, most particularly under rainfed acriculturalconditions (World Bank, 1987). This points to the need to lowertargets for the agricultural sector. To achieve this, lowernutrition and/or continued import of cereals financed by exports ofother commodities, such as coffee, will be necessary. The highgrowth scenario, despite appearing impossible to achieve in 25years, provides useful insight into the enormity of the task aheadfor Ethiopia and a measure of the upper limit for the necessarygrowth in the agricultural sector. More importantly, is the factthat policies toward certain aspects of agriculture will have tochange before high growth rates can be approached. Foremost arethe price and marketing policies. Farmers will be required to sella- greater proportion of their production in order to adequatelyfeed the growing non-agricultural population, in addition toproviding enough food for their on increased consumption levels.They must have incentives to do so, especially since therisk/reward situation changes with the higher level of inputsrequired. Cash for these can only come from sales of surpluses atprices which reflect the risks involved to the farmer. *Credit,input supply, research, extension and infrastructure are al soimportant in the context of improved production.
Productivity of land (increased yields and increased gross marginper ha) would have to increase to achieve the growth in agriculturesuggested, since the availability of arable land for expansion ofcultivation is limited and insufficient to feed the expandingpopulation at current levels of production (the availability ofland resources for food production j.5 discussed later in thereport).
The low growth scenario discussed by the World Bank (1987a) impliesa continuation ,of current government policies regarding foodproduction in the peasant sector. The overall growth of GDPproiected under these circumstances - 2.6% per annum - is less thanproiected population growth, which implies, that per capita incomeand consumption will decline. In the medium growth scenario, GDPis proiected to grow at 3.6% per annum, higher than population upto 1995, implying increased per capita incomes and consumption upto that time. After 1995 a growth rate of 3.6% of GDP is marginalfor increased per capita incomes under high (3.57. per annum)population growth rate conditions. If the medium population growthrate of 2.77. per annum can be achieved, per capita incomes willcontinue to improve.
To realize medium growth conditions, the World Bank (1987a)considers that maior policy changes are necessary including:adjustment of the exchange rate, improvements in producerincentives, and measures to raise domestic and external resourcemobilization.
17

It has been suggested that post drought (1984/85) recovery shouldoccur before 1990 and enable Ethiopia to return to a growth ofaround 37.. However, variability of weather conditions rom year toyear, especially in marginal production areas, makes suchpredictions tenuous. A target of 37. growth is only consideredfeasible by the World Bank (1987b) under the following assumptions:remunerative input-output price relations, a favourable marketingsituation, sufficient and timely supply of inputs, adequateagricultural research and extension, and widespread adoption ofconservation based farming to arrest degradation. This latterpoint is elaborated on later in MLUP Technical Report 1.
2.8.4 Food demand proiections
The proiections of food demand in this section of the report arebased on the population growth proiections and economic developmentscenarios presented earlier. Detailed analyses for a total of 11population and economic growth scenarios are contained in MLUPTechnical Report 2, Table C9, but these are summarized here forconvenience. Figure 10 compares several of the possiblecombinations of population growth and economic development +or 1995and 2010.
In 1995, the range of possible food demand indicated in TechnicalReport 2 is for a 317. to 367. increase over that in 1985, indicatingproduction increases of between 2.77. and 3.27. per annum arerequired. Only under a medium growth proiection would there be aslight increase in per capita food availability. Under the highpopulation proiection, in 2010 a medium level of economic growthwould merely maintain the present food demand levels, while foodavailability would deteriorate to the extent that only 139 kg grainequivalent per capita per annum (1100 calories per capita per day)would be available. Under a high economic growth proiection, whiChraises nutrition to the levels discussed in section 2.8.3, totalfood production - not allowing for imports - has to increase by afactor of between 3.1 and 3.4 times, depending on populationgrowth.
An increase of this magnitude without significant yield increasesis dubious, since the amount of land available for expansion ofcultivation is limited in extent and, in many parta of the country,further limited by the competing requirements of land for forageand fuelwood - fundamental to the rural farmers existence withcurrently available energy technology and cultivation techniques.It has been estimated for example, that one ha of annual croplandrequires 1.7 ha additional grazing land +or the draught oxen usedto bring land under cultivation to feed a farm family at currentyield levels (FAO 1986b, 1987b).
Much of the land currently used for forage production ispotentially arable, although certainly not all. But the use of
18

24
22
20
18
LEG Low Economic Growth
MEG Medium Economic Growth
BEG Biqh EconeMic Growth
BPG Biqh Population Growth
1985-2010
19
YEAR AND GROVYTH CONDITIONS
PROJECTED FOOD DEMA D ETHIOPIA
2010 HPG yiEG 2010 HPG/HEG1995 MEG 2010 LEG1995 LEG1985

potentially arable land +or forage production may be in competitionwith crop production requirements in the future. Thus, even if 3.4times as much arable land were available than presently used forcropping, it is unlikely, given the livestock and fuelwood demandsof the future population, that enough land would be availableannually to meet 3.4 times the food demand at current yieldlevels. Thus, under a high economic growth and populationscenario, the outlook is bleak unless significant increases inyield can be achieved. Under the medium population proiection thesituation is somewhat improved. The situation would be negative,however, if the current low economic growth combined with highpopulation growth rates continues.
A detailed analysis of the competing requirements of livestock andcrops in the future can be found in MLUP Technical Report 2. Theseaspects are further expanded in this report under discussionsrelated to the population supporting capacity model.
2.8.5 The need for a population policy
Population, together with improved agricultural productivity,appears, therefore, to hold the key to adequate food availabilityin Ethiopia over the next 25 years. Considerable effort has beenspent in the past devising means to increase agriculturalproduction, but the other half of the equation, population, has notbeen considered in depth up to this time. However, a policy toencourage family planning is paramount to Ethiopia's futureprosperity. Considerable resistance to family planning can beexpected in rural areas, as the traditional concept of an extendedfamily offers security in old age and labour for farm operations.Appropriate education of the rural population is going to beessential in this regard. A more appropriate start may be theurban areas, until employment possibilities can be expanded in thenon-agricultural sector.
20
3. PHYSICAL RESOURCES
3.1 GENERAL
This section of the report contains a brief outline of the variousphysical resources of Ethiopia. More detailed information can befound in technical publications in the LUPRD and other governmentoff ices.
3.1.1 Geology
Ethiopia is underlain by Precambrian metamorphic and sedimentaryrocks, the greatest extent of which are exposed in the west of thecountry. These are among the oldest rocks on earth, laid don morethan 600 million years before the present (b.p.). Mesozoic(135-240 million years b.p.) sedimentary sequences overly thePrecambrian basement in the central, northern and eastern parts ofthe country. These are in turn overlain in central Ethiopia bymuch younger Tertiary (less than 65 million years b.p.) basalts andother lavas on which fertile soils have developed. Localized areasof sediments deposited by wind and water and lake deposits ofQuaternary age (less than 1.8 million years b.p.) occur, the lattermainly in the Rift Valley. Quaternary lava flows and othervolcanic deposits are aleo common in the Rift Valley and evidenceof Quaternary glaciation is apparent on the highest peaks (Mohr,1971).
Mineral wealth in Ethiopia is limited mainly to gold deposits inthe basement complex and alluvial placers in the west. Platinumalso occurs in the south. Persistent searches for petroleum in theOgaden lowlands in the east have failed to locate significantdeposits, but the geological setting is favourable for oil.
3.1.2 Physiography
The physiography of Ethiopia is strongly linked to the underlyinggeology, more perhaps than any other country in Africa (Mohr,1971). It is dominated by the deeply eroded volcanic mountains andhigh altitude plateaux of the central, northern and easternhighlands, much of which lie above 2000 m elevation, and by the_Great African Rift Valley which terminates off the coast of
Ethiopia. Dramatic tectonic events in the Upper Eocene (36-45'million years b.p) resulted in widespread uplift of the centralland-mass and the eubsequent rifting associated with the formationof the Rift Valley has effectively bisected the country from SW toNE.
Perhaps the best known physiographic feature of Ethiopia, is theBlue Nile, which rises in the mountains surrounding Lake Tana(considered the source of the Blue Nile) and flows southeast into a
21

picturesque canyon of immense proportions. This physicallyseparates the administrative regions of Goiam and Welo. From hereit makes an about face and flows westward through an ever-wideningcanyon, whereupon it flows out into the Sudan plains to meet theWhite Nile on its way to Egypt. Hot, dry lowlands líe east andsoutheast of the highland massive, while hot and humid lowlandsexist in the west of the country.
Soils
The FAO/UNDP Assistance to Land Use Planning Proiect has providedan extensive data base on soils, as a result of surveys conductedsince 1979. Details can be found in the Geomorphology and Soilsmap of Ethiopia, the Soil Association map of Ethiopia (FAO, 1984a)and a number of supporting field documents and reports producedover the years since this proiect bagan operations.
Soils in the highlands commonly have high clay contents (egNitosols and Vertisols) and are relatively high in nutrient status,despite the common opinion that they are severely degraded throughpoor agricultural practices. Exchangable cations, organic matterand potassium are relatively high by African and even worldstandards, although nitrogen levels are declining due to thewidespread Use of dung for fuel and reduced fallow periods becauseof increased pressure on land. Phosphorous is low in most soilsand fixation by clay minerals may be the cause of the poor fieldresponses to this element noted by researchers, despite the lowphosphorous levels indicated in laboratory analysis of Ethiopiansoils.
Much of Ethiopia is covered by shallow 25 cm depth), stony soils(lithosols), the end product in many cases of centuries of carelessland management. These soils occur commonly in the northernprovinces of the country. Soils of intermediate depth (25 - 50 cmdepth) also occupy significant areas in this zone., Despite thedepth restrictions, population pressure has resulted in theirintensive cultivation for the production of cereals. Notsurprisingly, the shallower soils are more drought sensitivebecause of limited moisture holding capacity. Deep red, brown andblack clays are the main soils used for agriculture in the moreproductive central, southern and eastern highlands of Ethiopia, andare remarkable in that they maintain much of their fertility at"depth. Exchanqable bases and other nutrients appear in adequate,quantities even at 100 cm in the deeper soils. This point will beelaborated upon in later discussions concern no the effect ofdegradation on the yield of crops.
.4 Climate
Ethiopia is blessed by substantial areas of the country having highrainfall. In the central, southern and eastern highlands of thecountry mean annual rainfalls are commonly over 1000 mm per year.
22

In the southwest highlands they approach, or exceed, 2000 mm peryear. However, the northern highlands of Ethiopia, encompassingthe provinces of Welo, Tigray, Eritrea and parts of Gonder, have amuch lower and more variable rainfall regime. Rainfall isgenerally correlated with altitude, the middle and higher altitudes(above 1500 m elevation) receiving substantially greater falls thanlow-lying areas (FAO, 1984b). The exception to this rule are thelowland areas in the west of the country where rainfalls are high.While the average annual rainfall above 1500 m altitude may exceed900 mm per year, variations from year to year can be extreme. Thismakes agricultural planning difficult, with high risk of failure inbelow average rainfall years unless crops and cultivars arecarefully chosen to cope with this variation. Even traditionalcrops, with inherent resistance to drought, do not always fair wellin extreme years such as 1984. Rainfall in the eastern, northernand southern lowlands of Ethiopia is even more variable, withoverall totals ranging from 200 to 750 mm, depending on locality.These areas are mainly populated by pastoralists.
The distribution of rainfall throughout the year also varieswidely. In the northeastern zone rainfall is mainly bimodal, thesmaller of the two seasons, occurring around March/April, isreferred to locally as the Belq. The second season is referred toas the Kremt or Meher and occurs mainly in the second half of thecalendar year. It is usually the main cropping season, beginningaround June/July. In some areas the two rainy seasons combine intoa unimodal pattern of rainfall distribution. This is more commonin the west and northwest of the country where rainfalls aregenerally higher. Between the two extremes, in the centralhighlands for example, there is a tendancy for the two seasons tomerge, with the Belg season being indistinguishable in many yearsfrom the Meher season. In other years the Belo may be absentaltogether. The lowlands of the east and southeast contrast withthe remainder of the country by having a distinctly bimodalrainfall distribution. Here the main component of the rainfallcomes in the first half of the year, beginning around March andending in May. The second, smaller season begins between Septemberand November, depending on the locality. Generally speaking, themore' distinctly bimodal areas are those with marginal rainfallconditions for annual crops. The influence of rainfall amounts anddistribution on moisture availability for crops is discussedfurther later in this section of the report.
The other equally important aspect of the overall climate inEthiopia is temperature. Temperature is very strongly correlatedwith altitude, as indicated previously. Variations are extreme,from the searing heat of the Dallol Depression, the hottest placeon average on earth, to the sub-zero temperatures which occur athigh altitudes. Snowfalls, for example, have been recorded on MtRas Dashen, the highest peak in Ethiopia (4620 m). Much of thehigh altitude plateau above 2000 m also suffers from overnightfrost between October and February. Because of the strong

influence of altitude on temperature regimes, a traditionalzonation related to the crops and farming systems which arefavoured in particular areas, has evolved among Ethiopian farmers.This provides a very useful fil-st approximation to crop suitabilityand is widely understood by local planners and farmers alike. It
is therefore treated in this report as fundamental informa.tion forhigher level decision makers and planners. Details are providedlater in the report and in Annex 2 and Annex 4.
=.2 TRADITIONAL ALTITUDE ZONES
3.2.1 General
Altitude dominates all aspects of agriculture in Ethiopia, becauseof its influence over temperature. Strong statistical correlations(r2>0.9) have been demonstrated between the two (FAO 1984b) andthese relationships provide a good approximation of the temperatureregimes existing at different elevations and, thus, to thesuitability of crops and other vegetation to these elevations. TheWeina Dega and Dega zones are preferred for cropping and are mostlyfree from malaria and trypanosomiasis. The Kolla zone is favouredwhere moisture is not limiting for crops, but the diseasesmentioned above are commonly present, particularly in the west ofthe country. The Wurch zone is -frost prone and generallyunfavourable for cropping, except for hardy strains of barley and afe w other frost tolerant crops. The High Wurch is largely undernatural vegetation and used +or livestock grazing where landpressure is high.
The definition of traditional altitude zones is somewhat impreciseas microclimes may influence their classification on a localscale. The different zones and their approximate altitudinallimits are listed below and the extent of each,in Ethiopia is shownin Figure 11.
Zone Code Temperature Altitude limitsRange (m)
(°C)
High Wurch UN < 7.5 > 3500 / 3700
Wurch W 7.5 - 12.0 2900 - 3500
Dega D 11.0 - 16.0 2300 - 2900
Weina Dega WD 16.0 - 21.0 1800 - 2300
Kolla* K > 21.0 < 1500 / 1800
*Below 500/800 m altitude, where dry, the Kolla zone is referred toas Bereha. This has not been treated as a separate altitude zone inFigure 11.

DEG A 07. GAS)
WUR (0.G.35)
<60
Ç77) 6ELG SEA...`74.
TRADITIONAL ALTITUDE ZONATION
UPPER WURCH (0.235)
G1-120
25
Figure 12.
1/1 K0L r",,5-6.cf%)
Figure 11.
DEPEND BLE GROWING PERIOD - DAYSE71-!!!7.,P I A.
100
GO -
121-150 151-210 >210
MEHER

Because these zones are widely used, by local planners to estimateagricultural potential at regional and sub-regional levels, chartsdetailing the percent area of the different zones in each Awraiaare presented in Annex 2. The area assessment was made using theGILES geographic information system in the LUPRD.
7.7 MOISTURE AVAILABILITY FOR RAINFED CROE PRODUCTION
3.3.1 General
Moisture availability is an important control on the development ofcrops and vegetation in general, and so knowledge of the amount anddistribution of moisture +or plant growth is critical to effectiveagricultural planning. Unfortunately, a high degree of variabilityover time in moisture conditions makes planning difficult.Strategies aimed at reducing the risk of failure over a 10 or 20year period involve statistical predictions from meteorologicaldata collected over long periods of time, commonly 25 years ormore. Data recorded +or periods of less than 25 years are stilluseful, but less reliable results can be expected.
The likelihood of drought periods occurring during critical stagesin the development of different crops can be determined withconsiderable reliability, provided the frequency of meteorologicaldata recording is sufficiently high. Daily records are desirable,but 10-day periods are acceptable +or most agriculturalapplications. Apart from a few selected stations, however, data ofthis type are unavailable to land use planners in Ethiopia and thisrepresents a serious constraint to more effective planning. Themonthly rainfall data currently available through the NMSA provideonly general guidance on moisture availability.
3.3.2 Dependable growing period
A number of methods are available for estimating expected moistureconditions +or crops, including the statistical examination ofrainfall data and the use of water balance models. Water balancemodels examine the effectiveness of rainfall for crop growth andprovide a more reliable means for determining seasonal growingconditions than is possible from rainfall data alone. A model ofthis type, the LGP model, developed by FAO (1978), was used in thePhase I Assistance to Land Use Planning proiect to estimate the-average length of growing periods (LGPs) in the different,ecological zones o+ Ethiopia.
Growing period (GP) is a technical term used to describe the periodin days throughout the year when moisture conditions in the soilare suitable +or the crop growth uninhibited by moisture stress.Moisture available for crop growth at any point in time iEinfluenced by the moisture stored in the soil. This iE the sum ofmoisture stored from previous rainfall and the amount of rainfalling in the period considered, less losses due to evaporation
26

and the transpiration of plants carrying out their life processes,lossea from surface run-off,and the amount water percolatingthrough the soil without being stored. The manner in which GPs arecalculated is detailed in MLUP Technical Report 5.
GPs can be estimated for individual seasons of the year, one year,averaged over many years, or treated statistically to give somemeasure of their likely reoccurrence over time. Dependable growingperiod (DGP) is a term used to describe the likelihood of a GP of aparticular length occuring 8 years in 10. If the expected lengthof the GP is known with this degree of certainty, selection ofcrops and cultivare for improved production can proceed withgreater confidence. Some crops require very long GPs, 200 or moredays uninterupted by drought periods of iust a fe w days. Othercrops can succeed on as little as 60 days GP.
Figure 12 indicates the proportion of Ethiopia which experiencesdifferent lengths of DPGs. The lengths of DGPs which occur duringthe Belg and Meher seasons are shown separately according to thelegend. DGPs of less than 90 days are considered unreliable forthe production of most crops and varieties currently grown inEthiopia. Growing periods in excess of 150 days are indicative ofsecure production zones, while those experiencing greater than 210days of favourable moisture conditions are suitable for intensifiedagriculture and for perennial crops. The proportion of the countrywith DGP's sufficient for reliable crop production is limited toabout 50%, as indicated in Figure 12.
The concept of DGP and its application in planning is developedfurther in the next section of the report. Details of thedistribution and length of DGPs in each Awraia of the country areprovided in Annex 2. The details are presented in graphic form forease of comprehension and are intended for regional planners whomay require information on the prevailing mo sture conditions in aparticular Awraja.
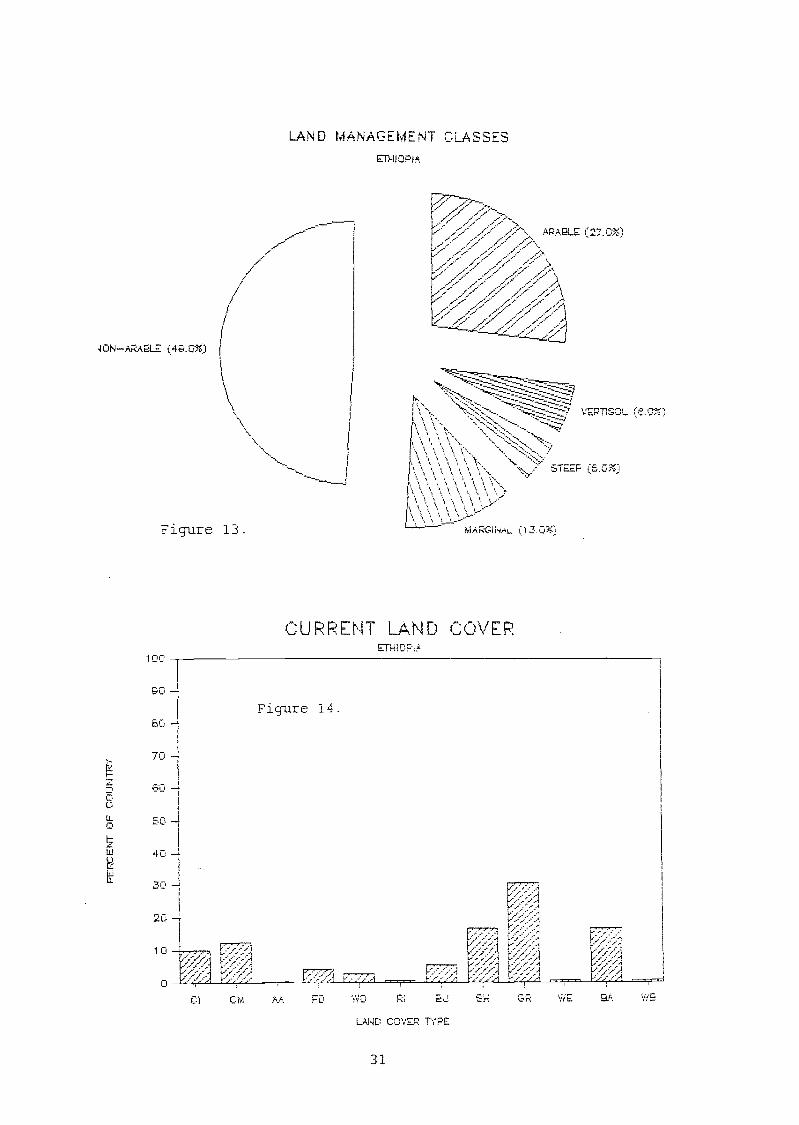
7.4 LAND MANAGEMENT CLASSES
3.4.1 General
Knowledge of the extent of land in a planning zone which has'certain limitations or potentials with respect to intended uses, is-essential for meaningful land use planning. In Ethiopia, most landis required for subsistence agriculture. The amount of landsuitable for food production is, therefore, the most obviouslimitation on the population supporting capacity in Ethiopia.Other limitations inherent in the land which prevent -Forage orfUelwood production, also reduce its capacity to support a largernumber of people.
For the MLUP, characteristics which could reduce the land'scapacity to support a subsistence population were identified using

the land resources inventory generated during the Phase-I, FAO/UNDPAssistance to Land Use Planning Proiect. This information wascomputerized or MLUP use and fed into a population supportingcapacity model described later in this report.
3.4.2 Land management classes
To simplify the population supporting capacity estimation, aminimum number of land management classes were identified using theland resources data base described above. Detailed information onthe distribution of these classes by Awraia is presented in Annex 2and Annex 4 of this document. The charts and maps in the reportannexes also provide and easy to use, and suitably generalized,picture of the distribution of land resources in Ethiopia suitablefor the use of higher level decision makers and planners.
A simplified definition of the 5 land management classes used inthe population supporting capacity analysis is shown bel o. A morecomprehensive definition can be found in Annex 2.
Arable land
- DGP more than 90 dayssoils more than 25 cm deepsurface stoniness less than 50 to 907. stone coverVertisola not includedslopes over 307. not included
Vertisols
all areas predominantly covered by heavy black claysoils
Steep land
all land over 307. slopeall other factors as for arable land
Marginal land
land with significant moisture limitations in many
days of
(less than 90 days of DGP, but more than 60 days on
All other factors similar to arable land
Non-arable land
land with severe moisture limitations (lees than 60GP on average)
- soils less than 25 cmsurface stoniness > 50 to 907.
28
years
average

As implied above, the definition of arable land is somewhatgenerous, bearing in mind that soils down to 25 cm depth and landup to 307. slope have been classed as arable for the MLUP. However,in the context of Ethiopian subsistence agriculture this land isoften as productive as that with much deeper soils and gentlerslopes. In marginal rainfall years shallow soils are morevulnerable to moisture stress, but otherwise production on thecomplete gambit of land and soils classed as arable is uniformlylow, as the production figures in Annex 7 indicate. The reasonsfor this are complex, but relate mainly to the nature of thetraditional crops and cropping systems used throughout the countryand the very low level of inputs, such as fertilizer andherbicides, which are used.
Vertisols were separated in the land classification because,although potentially arable, they do have special managementrequirements for crop production. Their poor drainage oncesaturated and their high draught requirements are both importantconstraints to successful cultivation. On the positive side, theydo have a very high water holding capacity and are relativelyfertile. In most cases, they provide dry season grazing reservesfor livestock in the highlands of the country, where most of thehuman population is concentrated. Where population pressure isparticularly high, Vertisols are increasingly being brought undercultivation by farmers. Vertisols have considerable aptential,however, +or more intensive crop production using techniquesdeveloped by ICRISAT and ILCA which are described later in thereport.
Steep lands were separated in the classification of land managementtypes to take account of the need for intensive conservationmeasures to ensure their sustained productivity. Some 207. of theland area on slopes over 707. is required for conservationstructures, biological conservation such as tree lines, and toallow for pockets of shallow stony soils. Steep lands are quitewidely cultivated in Ethiopia where land pressure is significant,and this will continue at an increasing rate in the future in theabsence of regulation by government. There is potential forfuelwood and perennial crop production on these lands, providedland pressure is sufficiently reduced to enable their assignmentfor this purpose.
Marginal land was separated in the classification of land typesused in the MLUP because of its limited moisture availability forrainfed cropping and its significant extent (177. of the country).This zone is presently used for livestock production and forlimited and uncertain cropping. However, with appropriate earlymaturing crops and varieties there is considerable potential forincreased and more secure food product on in this zone.
Non-arable land was identified because it has little or nopotential for rainfed crop production. At present it prov des
29

subsistence for a considerable number of nomadic pastoralists,habitat for wildlife and is utilized for the production ofincense. There is potential for more intensively managed ranching,improved wildlife management and tourism, and incense production inthis zone.
Figure 13 provides a countrywide picture of the distribution of theland management classes. The spatial distribution of the variousland management classes is shown in map -form in Annex 4. Animportant constraint in Ethiopia is apparent from Figure 13, thelimited amount of arable land available for the expansion ofrainfed agriculture, even according to the somewhat generousdefinition of arable used. This is in contrast to the popularbelief in Ethiopia that the land resource potentials in the countryare more or less unlimited for expansion of rainfed agriculture.
3.5 LAND COVER AND VEGETATION RESOURCES
3.5.1 General
Land cover is largely dictated by climate, the characteristics ofland resources and population pressure. Due to centuries ofexpanding cultivation in northern Ethiopia, natural vegetation inthe highlands has diminished to a minimum. Natural vegetation incentral, eastern and southern Ethiopia has also come underincreasingly heavy pressure in the last century. The steadilyrising human population, with its energy demands and need to clearland for cultivation, has been taking an ever-increasing toll onnatural vegetation resources during the later half of thiscentury. Forests and woodlands for example, once considerably morewidespread than at present, .are shrinking rapidly in area. Theexisting distribution of land cover types, including bothcultivated land and natural vegetation, is summarized in Figure 14to provide an appreciation of the structure of the remainingvegetative resources of the country. This is based on datacontained in the Land Use and Land Cover map of Ethiopia, producedby the LUERD (FAO, 1984c). Further information on the distributionof the maior land cover and natural vegetation types is provided inAnnex 3, in the form of bar charts for easy comprehension. Ageneral description of the land use and land cover types which-appear on the Land Use and Land Cover map of Ethiopia is provided_below.
3.5.2 Intensively cultivated land (CI)
In the summary of land cover given in Figure 14, this categoryincludes both state farms and land cultivated by small farmers.More than half of the land is assumed under cultivation in any oneyear, the remainder being fallow and mostly used for livestockgrazing. This category includes the most productive cerealproducing areas of the country.
30
40N-AA ELE (40.0%)
100
GO -
80 -1.
70 -
fio
50 ,
40
30 -
20 --T
LAND MANAGEMENT CLASSESETHIOPIA
Figure 14.
,
FO WO RiOJLAND CO VER TYPE
31
\ S!,
Figure 13. R.G I / . 0%)
CURRENT D-;.ND COVERErH! 0 FlA
10
0

3.5.3 Moderately cultivated land (CM)
Land of this type is described as having a significant proportionof natural shrub or bush which is grazed or browsed. This lattercomponent is not cultivated. More than 50% of land in this classis said to be fallow. Included in this category are lands withsignificant areas of perennial crop. The proportion of fallow landis approximately that of the moderately cultivated land.
3.5.4 Afro-alpine and sub Afro-alpine vegetation (AA)
This occurs at high altitudes, generally above 3200 m elevation.It includes Erica woodland, shrubland and scrub and is oftenbrowsed by livestock.
3.5.5 rorest land (F0)
Three categories of forest land are included here: dense coniferoushigh forest, dense mixed high forest and disturbed high forest. Inthe last case, forest harvesting and expansion of cultivation aretaking place in the forest.
3.5.6 Woodland (WO)
Woodlands include Acacia species interspersed with grasslands andscrub, and Eucalyptus woodlands +or local fuelwood production.
3.5.7 Riparian woodland or bushland (RI)
includes riverine vegetation.
3.5.8 Bushland (BU)
Includes, woody vegetation of medium height. May include incenseproducing species, smaller Acacias and bamboo interspersed withshrub or grasslands.
3.5.9 Shrubland (SH).
Small shrubs and scrub interspersed with grass vegetation.
7.5.10 Grassland (GR)
,Some woody species may occur, but generally open grasslands usedfor pastoral production (where water is available).
3.5.11 Wetland
Swamp and marsh vegetation. May be either perennial or seasonal,but inundated for considerable periods of the year.

3.5.12 Bare land
This category is rarely bare in a total sense. Patches of hardyscrub and bush colonize most exposed rock sur-faces and sand andsalt flats to some degree.
3.5.13 Water bodies
Lakes and permanently inundated lands of eignificant area.
7.6 NATIONAL PAWS AND WILDLIFE
Ethiopia i5 extremely fortunate in possessing valuable wildliferesources which have hitherto been little developed compared tothose of some of its African neighbours. More than 100 species ofanimals and over SOO species of birds have been identified and anumber of these are specific to the country. Maior national Parksinclude:
AwashSimien mountainsRift Valley LakesBale Mountains
- Nechisar
In addition there are 14 wildlife sanctuaries/reserves. and 14controlled hunting areas. Taken together they represent some 47. ofthe land area of the country.
Some emphasis has been placed on the cultural heritage of thewildlife by the GoE, but education of the rural population isrequired to emphasize this point. Encroachment of national parksthrough livestock grazing emphasizes the lack of appreciation forthe worth of wildlife by pastoral populations living adjacent toparks. Reducing local interference to park habitats and moreintensive management programs for wildlife offere great potentialfor increased foreign exchange earnings through tourism.

4. LAND USE AND PRODUCTION SYSTEMS
4.1 GENERAL
Rainfed crop production is the basis of almost all subsistencefarming in Ethiopia and accounts for 95% of the land areacultivated annually. Export crops, livestock and livestockproducts are also essential components of the production systems.Since the revolution in 1974, the small farmers, who till the 6 to10* million hectares of land cultivated each year, have userrights to land and are organized in Peasant Associations (PAs)which comprise 200,' to 400 families. There are some 120,000 PAsorganized in groups of 3 to 6 to form Service Cooperatives (SCs)which act as management centres for grain purchases, retail outletsfor the provision of comodities such as salt and coffee, andoutlets for agricultural inputs such as fertilizers. The PAs andSCs are organized along democratic lines, with officials at eachlevel elected by their constituents.
Other important production systems in Ethiopia include state farmsand producer cooperatives. The formation of producer cooperativesis actively encouraged by government through incentives andsubsidies, but to date their contribution to the economy has beenminimal as yields, and total production appear less than or equal tothose from PAs (World Bank, 1987b). State +arms receiveconsiderable financial assistance from the GoE to develop exportproduction, promote import substitution, increase the area ofcultivation and promote better farming technology and organizationthrough provision of improved seeds to the agri cultural sector.State farms account for 37. of the area sown to major crops and 5 to.67. of national production. The efficiency of the state farm sectorhas been criticized by a number of agencies, especially in relationto its past credit performance (World Bank, 1987b).
A wide variety of +arming systems are practised by small farmers inEthiopia, but there are many common threads such as the predominantuse of draught oxen for the tilling of land. Inputs tend to beminimal and yields low. Management practices, such as weeding,also tend to be much lees intensive than required for higheryields. Livestock, mainly through the requirement for draught, areprincipal components of most farming systems. and Ethiopia possesses-the largeet livestock population in Africa, approximately 40million TLU. Most are concentrated in the highlands.
*Comparison of CSO and LUPPD estimates for the cultivated area ofland in Ethiopia are discussed later in this report
34

4.2 FARMING SYSTEMS
4.2.1 General
The great var ety of agroecological conditions in Ethiopia hasencouraged the development of diverse crop and livestock systems.The maior limitation to intensi+ication and expansion of rainfedcrop production is availability of moisture (FAO, 1984b). However,given adequate moisture availability, altitude, and thustemperature, determines crop suitability.
Three agroecological zones can be distinguished at a general levelin Ethiopia sufficient ta broadly classify systems of agriculture:highlands, moist lowlands and dry lands (AACM, 1987). Westphal(1974), FAO (1984c) and AACM (1987) all recognize four main farmingsystems in Ethiopia which can be further subdivided according toclassifications for tropical farm ng systems (FAO, 1984c). Thefour major systems are as follows:
the seed farming complexthe enset-planting complex
- shifting cultivation andthe pastoral complex.
4.2.2 Seed-farm ng complex
This system is predominantly a cereal farming system with theproduction o+ almost all crops from seed. Pulses and oil seeds areal so important, with roots and tubers subsidiary. Livestock areprimarily for draught, but provide a store of wealth, fuel (throughdried dung), food and transport. Systems with thesecharacteristics can be found in the central, eastern and northernhighlands of Ethiopia, and in the Konso region of the south.Details regarding the further subdivision of this system can befound in Technical Report 3, AG:DP/ETH/78/003 (FAO, 1984c)
4.2.3 The enset (Ensete ventricosum) planting system
Enset is restricted in extent as a maior production system inEthiopia to the southwest of the country. It is found in thehighlands from 1600 to 3000 m elevation. The plant is related tobanana and both the pseudostem and corms are cut and pulped for'food. The pulp may be cooked when fresh or, as is more common,-fermented in silos usually in the ground. Fermentation may take afew weeks or years (FAO, 1984c). The main production zone of ensetis above 2000 metres where it yields exceedingly well, generallyproviding more than 30 quintals/ha of product. It is ofteninterplanted with coffee or chat (Catha edulis) and is rarely thesole source of human food in the farming system. Cereals, pulses,tubers and cash crops are usually important components of theoverall farming system, supplemented extensively by livestockraising. Land preparation may involve a long digging stick or theplough may be used. Planting, harvesting and preparation for food

vary widely throughout the enset zone. Because of its highproductivity, both in terms of food production and livestockforage, it has potential +or expansion in heavily populated areaswith suitable environmental conditions +or its culture. Socialacceptance on a wider scale has so far limited its expansion.Further details can be obta ned from AG:DP/ETH/78/003 TechnicalReport 3.
4.2.4 Shifting cultivation systems
Shifting cultivation is not well documented in Ethiopia and ismainly confined to the lowland tribes in the west and southwest ofthe country. It is reportedly practised by the Gumuz, Berta,Kaffa, and Gimira-Maii groups and among the Mekan-Surma and somepeoples in Sidamo. The typical pattern of shifting cultivation, isuse of the same area for one or two years and then abandonment ofthese fields and movement to more productive land. Crops grown aremainly sorghum, supplemented by maize, finger millet, sesame,groundnut and pumpkin. Cotton is used as a cash crop. Again,details can be found in AG:DP/ETH/78/003.
4.2.5 The pastoral complex
The role of livestock in almost all farming systems in Ethiopia 1Fvery important, beyond the simple provision of draught power. Forthe current purposes, however, pastoral systems are defined asthose which depend almost completely on livestock production forthe subsistence of those who practise them. Pastoralism as definedis practised in the hotter and drier zones of Ethiopia, usuallybecause no other sustainable system is possible in these areas-Most pastoralists can therefore be found in the north, eaet andsouth of the country, but limited pastoralism is also practisedalong the Sudan border in the west of Ethiopia. Pastoralism isdiscussed in more detail in MLUF Technical Report 3.
4.3 MAIN CROPS AND CROPPING PRACTICES
4.3.1 General
The crops and cropping practices in Ethiopia are almost as diverseas the environments in which they are found. The following sectionof the report presente a statistical summary of the area cultivatedto the major crops and the average yields of these crops. AnAwraia based presentation of area cultivated and crop yields ispresented in Annex 3.
4.3.2 Area cultivated to malor crops.
Over rrcent years, a consi derable degree of diSCUEE1OM hasdeveloped in Ethiopia regarding differences between two alternativeestimates of the area oropped each year. The OSO produces ayearly summary of the area, product ion and yields of common crops,based on statistical samples drawn on a regional basis for all

accessible Regions of the country. The LUPRD, in 1984, produced anestimate of the area of cultivated land in Ethiopia as part of it=nationwide land use assessment. The LUPRD data are den ved in themain from satellite imaoe interpretation anC fielC traverses.
The firat and most important fact to note is that the two sources0+ information (ie CSC and LUPRD estimates) quote data concerningtwo quite different aspects o+ land use. On the one hand, the OSOestimates are almea entirely at estimating the cropped area in anyone year. The LUPRD data provide details of the area of land whichhas been subiect to cultivation in the recent past; the cultivatedarea. The two are quite distinct. The spatial extent of thecultivated area estimated by the LUPRD was determined in the mainfrom the patterns of cultivation evident on satellite imagery.These patterne indicate where land has been cultivated in therecent past, not iust where land is cultivated in the currentyear. The patterna formed by cultivation scars and former fieldboundaries may, however, last for several years in +allowed land,as casual observation will demonatrate. The fallow area in any oneyear can thus be considerably understated in the LUPRD esti mates.Taken on face value, the eatimated crop producing area will beoverstated by an equal margin when extrapolated to estimate totalproduction.
By the same token, the inability of the OSO to be able to conductmore extensive aurveye and to reach inaecure Regione al so serves tounderestimate the total area of production. The truth no oduttlies somewhere between the two eatimates, but the belief of theMLUP mission is that the OSO estimates are much closer to theactual cropped area than those den ved from the LUPRD data in theirpresent form.
The production area of the main crops grown in Ethiopia +or the1982/83 cropping season is presented in Figure 15. These figuresare indicative only, as year to year variations in the area croppedcan be considerable depending on environmental conditions auch asrainfall. The figures are drawn from the 1982/82 MoA agriculturalsurveys, which repreaent the only available crop production data onan Awraia basis or the entire country. They ara presented here inpreference to the OSO average figuree (overall they are-goncoroant), for consistency, as these are the data uaet to,estimate production figures on an wrala baeis in Annex 3. Thesymbols used in Figure 15 for the main crops are as follows:
Te-Te-f, Ba-Barley, Wh-Wheat, Ma-Maize, So-Sorghum,Mi-Millet,Tu-Tubers, Pu-Pulses, Di-Oilseeds, Fa-Fallow,Co-Coffee, En-Enset, Oh-Chat.
4.3.3 Crop yielda
The estimated yields of malor crops grown in Ethiopia are shown inFigure 16. The symbols used are the same as those in Figure 15.Yield estimates are derived from the data contained in the MoA,General Agricultural Survey (1982/83), which -forme the basis of all

30
28
24
+12
20
Figure 16.
AREA UNDER MAJOR CROPSETHIOPIA
SOURCE: MOA 1;82/-7
CROP YIELDSETHIOPIA
Figure 15.
38
'*'-'/;...*.r '.."...?..."..., ...1
'
....
.: r r r
':
.."..
.r
r . '..."."1.
.
. : ..."
. ..
r"11
' .
'..?...";:'.
. ...../.2/
'
r e,/,,
.."
. e
N
re ? e ...1
11 ..
'
cr. 1 E
e
14
12
lo
4
T B.j Wh M.j S Mi
SOURCE: M OA 1 gE.
Tu Pu O i Cc: En

currently available Awraia yield estimates. These data were usedin a arm model, described later in the report, to estimate theminimum land area requi red to support the various subsistencefarming systems present. This was an essential input into thepopulation supporting capacity estimation carried out for eachAwraia, presented later in the report.
4.3.4 Cropping practices
A great deal of information already exists on cropping pract ces inEthiopia and it would be counterproductive to present other than abrief summary here from a selection of references, includingWestphal (1975), EHRS (1986) and AACM (1937).
Land preparation. Most cultivation in Ethiopia depends on theplouoh. Westphal (1975) estimates this has been the case for some2000 years. The traditional plough is still basically unchanged.The 'Maresha', as it is known locally, has a chisel action and doesnot invert the soil as it passes- Weed control is less effectivethan for a mouldboard. However, it has lower draught requirementsthan a mouldboaro and provides minimal tillage, which tends toleave the soil lees susceptible to erosion.
Preparation times ara prolonqed, especially for the favoured cerealte+ (Eraprostis abyssinica). The average number of passes of theplough +or te+ is 6, and for most other crops 2 to 7. Thie placesconsiderable stress on livestock resources at peak land preparationtimes. Although the distribution of total livestock numbersroughly equals the draught requirement on a PA or Awraia basis,inequitable distribution of livestock constrains farmers with fewor no oxen during the peak land preparation period. It reaults inless land cultivated or late planting which, in shorter thanaverage growing seasonE, may cause severe yisld reductions.Wealthier farmers with adequate livestock tend to co well underthene circumstances while the poor cat poorer, a point elaboratedupon by Gryseels et Si (1986).
Another serioue dizadvantade of repeated ploughings lE that it laysopen the soil to more severe eroeion, especially sinos the peakland preparation period is usually early in the wet seaaon whenxainiall is most intense.
The main reason for prolonged land preparation requirements,especially +or te-f, appeare to be weed control. There is clearly aconstraint with respect to weed infestation and control and,alternative control measures were available, such se theapplication of pre-emergence herbicidee., there is aptential forreducing draught requirements during the peak land preparationperiod.
Other systems of cultivation include the hoe ano digging stick. In
enset/root crop systems the hoe and digging stick are the maintools for land preparation. Hoe cultivation is also w dely

practised in the eastern highlanos, especially here farmers applymore inputs and obtain greater yields. The limitation on the hoesystem is primarily one of not being able to bring sufficient landunder cultivation to support a iarm -f ami at current, low yieldlevels.
Seeds and planting. Suitable varieties are available for maize andwheat (EHRS, 1986). Some 5000 tonnes of improved seed are used inthe peasant Sector, mostly by producer cooperatives. Improveoseeds are generally not available for other crops. ADD (1988)esti mates that improved varieties generally provide only 20% morain terms of yield than local varieties and that more improvementcomes from scrupulous weeding and fertilizer inputs.
Most seed ia broadcast in cereal systems and covered by a finalpass of the plough. In the case of tef, seed ia muddled into thesurface and left uncovered. AACM (1987) eetimates 5 days for-ox-asaisted seeding and 4 days for hoe seeding.
Crop husbandry. Fertilizer use is est mated to be 2.5% of landcultivated by peasants (EHRS, 1986). This is negligible on acountrywide scale. Where applied it ia usually in lesa thanrecommended amounts. The reasons +or such low levels of fertilizeruse are limitad availability, timelinesE of delivery, inadequatecredit and cost. Yield responses in traditional crops ara alsoattenuated by the lack of complimentary inputs, such as adequateweeding and protection from pests. ,Weedind is most commonly doneby hand, but for large grain crops the plough may be used. AACM(1987) estimates te+ receives 3 weedings, maize and sorghum 2 andother crops one. First weedinge are estimated to take about 20man-days per hectare, reducing for later weedings. ADD (1988)'suggest thiE is totally inadequate and that ineffective weeding isa major conetraint to achievind potential yields.
Harvesting is generally carried out usind the sickle and crops leftto dry in the fiel de. Threshing is most commonly accomlished usingoxen to trample the harveated crop. Winnowing is done using woodenpitch forks or other similar instrumente.
Peste and diseases. Local varieties of crops are generallyresistant to most pests and diseases, but fungal problems and smut,have been reported in some grains. Rodents are a major problem inmany areas, both pre and post harvest. Baboone create a great dealof damage in arcas where there is sufficient natural vegetationcover nearby for their protection. In the western zone, elephantsand pigs can be problematic, but as cultivation expands in thewestern zone thie may increase. Locusts, grasshoppers, andarmyworm have also caused serious problems in the past in Ethiopiaand national and international programs are in place to monitorthese serious pests. Termites and weevils are serious post harvestpests in some regions of the country.
40

4.4 LIVESTOCK
4.4.1 General
Livestock are fundamental to almost all farming systems inEthiopia. Recent surveys (AACM, 1984) confirm that the reasons forkeeping livestock include:
as a store of wealth,insurance against crop failure and famine,draught power for crop cultivation systems,manure for fuel,manure for fertilizer,transport,
e products for saleproducts (co dairy) for home consumption
The ubiquitous role of livestock in subsietence systems in Ethiopiano doubt accounts for the estimated 40 million TLU (see MLUPTechnical Report 3) which are present.
4.4.2 Types and distribution
Livestock comprise cattle of the Zebu type, small ruminanteeequines and camels. Cattle and sheep are dominant in the highlandsand cattle and doats in the lowlands, except for the large camelherds of the Afar and lesas peoples in the northern Rift Valley andin eastern Ethiopia. Equines are evenly distributed throughout thehighlands with the exception of so6theastern Ethiopia. Here theyare more abundant. The estimated proportion of epacies on anational scale is shown in Figure 17,
4.4.3 Feed resources
Detailed estimates of available feed resources are contained inMLUP Technical Report 3. These resulte are summarized on an Awraiabasis and in graphic form in Annex 3 of the Main Report. InTechnical Report 3, it is estimated that the 36 to 40 million TLUpresent in Ethiopia have available some 86 million tonnes of drymatter annually. This represents an average daily consumable dry'matter of 2.32% of liveweight. While the overall figure appears,satisfactory, substantial differences occur on a Region and Awraialevel. Large quantities of dry matter, for example, are availablein the sparsely populated western lowlande, but here teetse andtrypanosomiasis are widespread.
Similarly, in eaetern Ethiopia, there i77.: subetantial dry matteravailable from natural savanna veeetation, but water availabilityfor livestock limits acceez to these reeources.
41

GOATS (4.2%)
SHEEP (.6.5%)
EQUINES (1 3.7%)
LIVESTOCK HY TYFE (% TOTAL TLU)
Figure 17.
Dry matter production comes from three main sources in Ethiopia:natural vegetation, crop residues and aftermath grazing. For the-purposes of the MLUP, total annual dry matter production for eachAwraja was determined using crop production data, crop residue
'conversion actors and conversion actors for production romnatural herbage. The production from the latter was obtained usingthe Land Use and Land Cover map attached to the Assistance to LandUse Planning, Technical Report 3. Substantial differences inavailable dry matter are indicated by the Awraja level data. Areasintensively cropped are, in general, in a deficit situation withregard to feed resources- The high requirement for draught duringthe peak land preparation period places pressure on farmers to keepmore animals than can be adequately fed from available resources,creating a spiral of vegetation degradation. Since grazing lands
42

ara largely a communal responsibility little is done to improveproduction. There has thus been an increase in the need to useEteep and degraded terrain and to depend more on waterlogged areaswith attendant risks to animal health. The most productivepastures in the highlands are inundated for much of the growingseason and animals have to be moved to more margirlial areae onhigher ground or to +allo land to avoid these risks. These landsare predominantly on Yertisols, which poses a future problem whenthese soils may need to be brought under crop cultivation to feedthe growing human population.
Seasonal shortages in both the quantity and quality of forage canbe acute. At the onset of the rains there is usually a shortage ofbulk. Seasonal waterlogging at an advanced stage of the rainyseason can also cause shortages and by the time inundation recedes,the quality of the feed has already passed its best. In denselypopulated areas with less animal-dependent cultivation, moreintensive feeding systems have developed for livestock. Here feedis cut and carried, as in parts of Harerge and the enset zone ofthe southwest. Potential exists for increased dependence onhillside exclusion zones and cut and carry systems. In general,intensive management of crop and forage production, through systemssuch as al ley cropping, will become mandatory in the future iflivestock forage requirements are to be met.
Environmental +actors, such as bush encroachment and recentdecreases.: in rainfall in pastoral areas, are concerning, as theyindicate an accelerating spiral of declining forage resources whencoupled with the trend toward overgrazing. Availability of waterduring recent droughts has further intensified the problems +ornomadic pastoralists. For some years now the traditional lands ofthe Afar and Kereyu people of northern Rift Val ley have beenreduced in extent through irrigation deVelopment, although somecompensation has been attempted by limite irrigation of pastureadiacent to the Awash river.4.5.3 Animal health, nutrition and productivity
Health. Livestock in Ethiopia are subiect to numerous parasiticand infectious diseases which, together with poor nutrition,restrain animal productivity. Maior diseases such as Rinderpest,Contagious Bovine Fleur° Fnueumonia (CBPP) and TrypansomiaEis haveCaused high levele of morbidity and mortality in the past.-Trypanosomiasis is a maior constraint to the expansion of
traditional farming systems, which depend on animal drauoht, in thewestern zones of Ethiopia. Tick-borne livestock diseases are al soimportant in this regard.
Nutrition. Nutrition is a fundamental problem affecting theproductivity of livestock in Ethiopia. High stocking rates, asdiscussed above, tend to produce unfavourable rates of foraoeavailable for livestock in many areas of the country. Togetherwith poor feed availability and the generally low levels of
nutritive value of many of the forage species, shortages in bothenergy and protein are common. In addition, resulte of forage and

blood analyses (Faye et al, 1983) suggest the extent of traceelement deficiencies iE considerable throughout the country.
Productivity. Most livestock are estimated to be kept at intakesnear the maintenance level. Overall efficiency of feed use istheref ore low, as 85-90% of feed is estimated necessary to covermaintenance, while the remainder is available for productivepurposes. Exposure to disease and poor nutrition has also tendedto direct livestock selection toward survival rather thanperformance. According to EHRS (1984), Ethiopian productivityindicators are up to 1/3 lower than the average +or tropicalAfrica. The tendency to communal grazing further increases thetrend toward greater numbers of less productive animals, in orderfor individuals to gain the most from shared resources.
4.5 SOIL DEGRADATION
4.5.1 General
A considerable volume of information has been produced in recentyeare regarding soil degradation in Ethiopia, but certain basicfacte remain obscure. Why, for example, do farmers requireincentives euch as Food For Work to encourage them to conserve landif the benefits from the increased production are so great? Why,if the anticipated fertility decline iE so dramatic throughoutEthiopia, have yields not declined in an equally dramatic mannerover the laet 10 years (see MLUE Technical Report 2). Totalproductivity may have fallen +or lack of rainfall, poor farmmanagement or socio-economic reasons, but yields have remained moreor less uniform across. the country, albeit low. Answers to thesequestions are basic to a proper perspective of soil degradation inEthiopia and its eventual solution.
4.5.2 The nutritive character of Ethiopian soils
While the fertility of soils in many parts of Africa iE con+ ned tothe topsoils, where nutrients are concentrated and once lost cannotbe replaced without fertilizers or other soil improvements, themajority of Ethiopia's hoighland soils remain relatively fertile at-depth. For example, exchangeable bases at 100 cm depth are,available in equal amounts to those found in topsoils (FAO 1984a).The same is true for a number of other important nutrients. Underthese circumstances erosion reduces depth and the water holdingcapacity of the soils, and not inherent fertility. Depth becomeslimiting when insufficient to provide the moisture reserve neededto protect crops against the droughty periods which may occurduring their growth cycles.
Virgin soils retain even hidher levels of inherent fertility in theorganic layar of the topsoil. Substantial quantities of nutrientsand organic matter can be lost after just a few years of carelessfarming when these soils are first opened up for cultivation. Onthe intensively farmed land in Ethiopia the clock has alreacy been
44

set to zero and the hioh nutrient levels in the top ew centimetersof these once virgin soils has long since disappeared.
4.5.7 Minimum soil depth for productive yields
Yield reductions due to erosion have traditionally been assum.=d tostem mainly from nutrient losses (EHRS, 1986), Loss of waterholding capacity and decrease in rooting depth are cited by Thomasand Cassell (1979) and Stocking and Pain (1983) as equally, if notmore important. Stacking and Pain (19873) point out, however, thatprovided 50 to 75% of target yields can be achieved in small holdersystems, the minimum soil depth tolerated by grain crops isremarkably low. Depths down to 25 cm were modelled as beingsufficient to meet 50 to 75% target yields in sorghum. The extentof these reductions is very much a function of individual croptolerances, soil character and depth, and management techniques.Most crops grown in Ethiopia have evolved with a bias for survivaland modest yields in most years, rather than for high levels ofproduction in some years. This makes yield reduction undermoisture stress less severe than for higher yielding varietiesunder similar circumstances. The rooting depth of most local cropsis also of the order of 25 to 50 cm. Beyond this depth moistureremains largely inaccessible to them, indicating that moistureproblems are unlikely to appear above this threshold unless due torainfall deficits.In those zones of Ethiopia here cultivation hasbr=en practised for centuries, soils have become excessively shallowas a result of poor management practices and steadily worseningerosion. Here the problem of soil depth and associated poormoisture retention is a maior concern. But emphasis should be madeof the fact that soils in northern Ethiopia are generally moreerodable than other parts of the highlands and they have aleo takencenturies to reach their current levels of decline-. Despite theshallow soils, in years of adequate rainfall, yields equate tothose in areas with much deeper sails.
4.5.4 Farmer motivation for conservation
One of the main reasons that farmers in Ethiopia are not motivatedto apply conservation measures, is that yields rarely show anyimprovement without simultaneously increasing levels of other-inputs such as fertilizers. Physical conservation measures al so-occupy up to 207. of the land in steep areas and this furtherdiscourages their adoption. Once it is understood that shallowsoils are capable of sustaining the present lo w yields ofsubsistence farmers in all but the poorest rainfall years, itbecomes clearer why farmers do not invest effort in soilconservation without inducements such as Food for Work. Thisof: course, an oversimplification, because many other factore enterinto their motivatian. Prevailing market pri ces for their produceand the need to feel security of tenure, so that tney invest effortin improving their land, are equally important.
4.5.5 Soil depth modelled over 25 years
The emphasis in recent yeare placed on the urgency for soil
45

conservation in Ethiopia, prompted the MLUP mission to examine theinfluence of soil loss rate on the extent of potentially arableland over the next 25 years. Using available data on estimatedsoil loss rates and present Boil depth, produced during the PhaseIproject, the probable soil depth in 25 years was modelled for eachAwraja. The most vulnerable soils were assumed to be thosepresently 25 to 50 cm in depth. With high soil loss rates of 0.5cm .or more. these soile could be reduced to critical levels in 25years.
Despite estimated loss rates in excess of 1 cm/annum in EGMElocations, critical soil depths of 25 cm or even 50 cm, appearunlikely to be reached before 2010, except for tho=.e alreadycritical areas in northern Ethiopia. For the remainder of thecountry, it may take 50 years or more for the problem to becomecritical at a national level.
4.5.6 The future role of soil conservation
The EHRS estimates that the loss of productivity caused by soildegradation in Ethiopia will amount to EB 15,000 million over thenext 25 years, or some EB 600 million per annum. These figures arebased primarily on the estimated losses from lower crop yields,loss of crop land, and lower forage production. Losees of
productivity Ar linked by the EHRS tc reduced scil depth snd lcsIEof nutrients. While the loss of soil is undeniably extreme inEthiopia, the opinion Of the current mission is that productivitylosses are somewhat overestimated in the above study, im view ofthe low input, levels and uniformly low yields c.f curent farmingsystems. This is not tm ca'' that soil degradation is not a =_eriousproblem in Ethiopia, but that the present loes of productivity isconcentrated in areas_ where soil depths reached critical levelsmore than a century ago, in the northern provinces of Eritrea,Tigray, Welo and parts of Gonder. iven sufficient time,productivity loesee will aleo become extreme in mther, rapidlyeroding areas of the country, such as southern Shawa, Gamo 'Gofa antHarerge.
The question is really one of time. The MLUP mission believes that_Ethiopia faces a food crisis' driven by its rapidly expandindPopulation and low agricultural productivity, long before a moderndedradation crisis has time to significantly alter the current foodproduction potential of the land. Of course production in manyareas of the country will eventually be reduced to the currentlevels of northern Ethiopia if soils are not properly conserved.However, simply conserving soils will do little in increase totalfood production, but merely maintain the status quo. Yields mustbe increasied if food sufficient to meet the population's neede isto be produced over the next 25 years. Inteneified farming inwhich conservation forms an integral part of generally better landmanagement is one answer. Under theee circumstances inputs, suchas fertilizer, are more effective on land susceptible to erosion,as lossee caused by surface water movement are minimized. Detailsare discusEed later in the report.
46

4.6 DEGRADATION OF VEGETATION RESOURCES
4.6.1 General
The extent of natural woody vegetation has been diminishing forsome time in Ethiopia, at rates vastly greater than it canregenerate. The two main reasons for this are land clearance foragriculture and the growing need +or fuelwood and wood for buildingmaterials. Closed canopy forest has been reduced to below 4% ofthe land area of Ethiopia, according to LUPRD figures produced in1983. Unless appropriate state intervention in the control ofthese resources is forthcoming, they will degenerate much morerapidly in the future because of the demands of the risingpopulation.
4.6.2 Fuelwood availability
The energy needs of the population are already placing undue strainon the natural vegetation resources in most of the highlands ofEthiopia. Demand will continue to expand exponentially over thenext 25 years without an energy substitute for cooking. At thepresent time, dried cattle dung and crop residues provide up to 50%of the annual per capita requirements for fuel. This has negativefeedback on attempts to improve food production, because of theloss of nutriente to the ecil. An alternative energy source isobviously desirable, but has yet to be defined and establiehedeoonomical and reliable.
The estimated availability of fuelwood for each Awrala in thecountry iE shown in Annex 7, in chart form. Estimates indicate apositive or negative availability, according to the demand of theprojected population and the annual production rate from naturalvegetation. Estimates of the projected national requirement,availability, and the plantation area required to supplement thedemand are included in Table 7. The figures in the table werederived from estimates of the annual regeneration rate of thevarious natural vegetation types in the country and the fuelwooddemand of the projected population in 1985, 1995 and 2010.Consumption of fuelwood per capita is assumed to be 0.8mz."Vcaput/annum, the remaining portion of the 1.3 m requi red isassumed to come from dried dung and crop residues.
Rates of regeneration were determined using the Land Use and Land-Cover map produced by the LUPRD (FAO, 1984c), and annual productionrates +or analagous agro-ecological zones in Africa (Anderson andFishwick, 19)84). It is important to note that production fromclosed high forest was excluded in the current eatimation, becausethe MLUP miseion feels that these ecologically unique resourcesshould only be harvested under strict Government management and notindiscriminantly by farmers. Otherwiee, irreversible damage may bedone to theee dwindling resourcee- Estimates of production fromcloeed high foreet ara included in Table 7, and Annex 3.
47
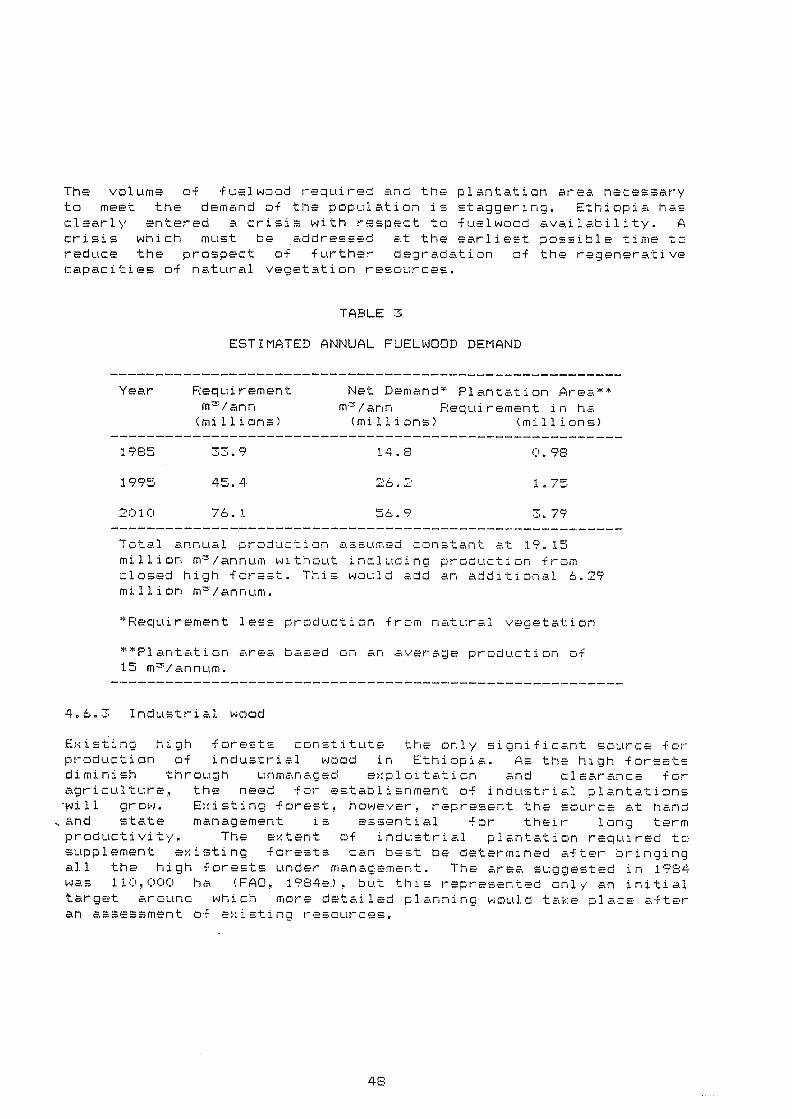
The volume of fuelwood requi red and the plantation arca necessaryto meet the demand of the population is staggering. Ethiopia hasclearly entered a crisis with respect to fuelwood availability. A
crisis which must be ,addressed at the earliest possible time toreduce the prospect of further degradation of the regenerativecapacities of natural vegetation resources.
TABLE 3
ESTIMATED ANNUAL FUELWOOD DEMAND
4.6.3 Industrial wood
Existinm high forests constitute the only significant source forproduction of industrial wood in Ethiopia. As the high forestsdiminish through unmanaged exploitation and clearance foragriculture, the need +or establishment of industrial plantationswill grow. Existing forest, however, represent the source at handand state management iE essential for their long termproductivity. The extent o+ industrial plantation required tasupplement existing +crests can best be determined after bringingall the high forests under management. The area sugmested in 1984was 110,000 ha (FAO, 1984e), but this represented only an initialtarget around which more detailed planning would take place afteran assessment of existing resources.
Year Requirement Net Demand* Plantation Area**mr-Vann rrI'Vann Requirement in ha(millions) (millions) (millions)
1985 77.9 14.8 0.98
1995 45.4 26.2 1.75
2010 76.1 56.9 3.79
Total annual production assumed constant at 19.15million mVannum without including production fromclosed high forest. This would add an additional 6.29million m'/annum.
*Requirement less production from natural vegetation
**Plantation area based on an average production of15 m'-'Vannum.
48
49
5. QUANTIFICATION OF LAND USE
THE POPULATION SUPPORTING CAPACITY MODEL
5.1 BACKGROUND
For 95% of Ethiopia's population, maintenance of a basicsubsistence standard of living requires the production of a minimumarea of crops, maintenance of a livestock population adequate toproduce sufficient draught oxen, and access to adequate fuelwoodfor cooking. Livestock compliment the subsistence system byproviding some meat and milk +or household consumption, and dungfor fuelwood substitution. This section of the report examines thepotential of each Awraia in Ethiopia to provide these subsistenceneeds under varying population, production and consumptionproiections.
5.2 THE POPULATION SUPPORTING CAPACITY MODEL
"5.2.1 General
The population supporting capacity (PSC) of each Awraia depends onthe resources available to meet the combined food, livestock andfuelwood requirements of the subsistence population. To quanti -fthe capacity of available resources to support these needs, a PSCmodel was developed during the course of the MLUP. The model(through a farm sub-model) first estimates the available food grainequivalent produced by the composite farming system in an Awraia,oxen requirements, income from sales of grain and costs ofproduction. The minimum area required for subsistence by a typicalfarm family is estimated in the model from these parameters, foreach Awraia. This takes into account the basic nutrition and fuelneeds of a farm family, and the area required to maintain theirdraught oxen. Additional land must also be set aside bysubsistence farmers in many areas to meet their share of governmentgrain quotas. Subsequent steps in the PSC model calculate thenumber of farm families which can be supported by the availableresources at current levels of productivity. The supportablenumber of families is compared in the model with present and future-estimates of family numbers, based on population proiectionsdetailed in MLUP Technical Report 2. Disposable incomes based onAMC, open market and CM C (if applicable) incomes are alsoestimated.
5.2.2 Data sources
The minimum area required for subsistence depends to a large extenton the productivity of the land and farming system in the Awraia

concerned. To estimate the productivity of different systems, areaand production estimates from the General Agricultural Survey ofthe Ministry of Agriculture (1984) were examined, together with adata set from Anderson and Fishwick (1984). Coffee data werecompiled from a combined data set obtained from MCTD, FAO (1983)and the mapped distribution of coffee areas.
5.2.3 The farm submodel
A single standardized model of a composite +arming system wasdeveloped for each Awraia from the data above. This was necessaryas the detail required to take account of the spatial distributionof farming systems within Awraias could not be justified in termsof available time or the quality of the available data. Since themodel was developed from Awraia totals, the results of the +armmodel component cannot be taken as a reflection of any componentsystem within the Awraia, but an indication of the averagesituation.
The farm modal takes into account global parameters, regionalparameters and individual composite farming system models. Globalparameters include:
number of ploughings;crop residue coefficients;percent loss and seed requirement;AMC and CMC prices; and,a parameter for modifying yields.
Parameters for each of the major. grain crops, tubers/root crops,pulses, oilseeds, -fallo-, coffee, enset and chat, are alsoincluded. The various global parameters were estimated from LUPRDreports (FAO, 1985, 1986b, 1967e). The values of the globalparameters, such as the number of ploughings, influence the demandfor draught o> en pairs per hectare of the farming system. Thissubsequently affects the area of pasture land required and,ultimately, the ESO. Sensitivity of the analysis to differentvalues of global parameters could readily be tested by alteringthese values in the model. AMC and CMC prices for crops -ereobtained from official sources here applicable.
One set of regional parameters were specified, indicating theaverage open market price for grains, pulses and oilseeds. Thesewere obtained from a variety of sources specified in MLUP TechnicalReport 2.
Individual composite farming system models provide esti mates of theaggregate production, less percentage losses and seed requirement,+or each Awraia. Consumable or marketable surpluses of each cropcomponent of the system are also estimated. Dry matter productionfrom crop residues and fallow are provided, based on the residuecoefficients and yields per hectare of +allow land specified inMLUP Technical Report 7. For an improved technology scenario
50

described in MLUP Technical Report 25 cash costs per hectare arealso estimated. Finally, income is estimated from sales to AMC,CMC and the open market.
The output from the farm sub-model for input into the PSC modelincludes:
available food grain equivalent from grain and pulses(kg)
available food grain equivalent from tubers and enset(kg)
income from AMC sales (EB/annum)
income from CMC sales (EB/annum)
total residue production (kg)
total ox-pair plough requirement (days)
cash costs of the farming system (EB/ha)
The details of the methods of computing these values for eachAwraia are contained in MLUP Technical Report 2.
' 4Jo4. Population supporting capacity est mation
The PSC model integrates the crop, livestock and fuelwoodrequirements of farm families in each Awraia. The solution of themodel, a linear programming problem, identifies the maximum numberof rural households, plus the.associated urban population, whichcan be supported from the available resources in each Awraia.
Inputs to the model include:
estimated area of potentially arable land;
estimated rural and urban population (1985, 1995, 2010medium, 2010 high);
average rural household site, and hence estimated numberof rural households in 1965, 1995, and 2010;
an oxen to cattle conversion factor which uses the herdstructure of different areas to compute the minimumnumber of cattle required by the farming system;
the proportion of total AMC procurement which has to beobtained from each Region, based on current practice;
- potential fuelwood production per hectare fromnon-arable and arable land in each Awraia;
51
potential forage production per hectare from non-arableand potentially arable land in each Awraja
- global parameters for the entire model defining humannutrition levels, cattle nutrition levels, current AMCpurchases, proiected AMC purchases (1995, 2010), percaput fuelwood consumption, and farm fixed costs.
Arable and non-arable land. The supporting capacity of each Awraiadepends to a large extent on the characteristics of the landavailable to produce the subsistence requirements of thepopulation. The relative extent, therefore, of arable andnon-arable land from which the crop, fuelwood and livestockproduction requirements can be met in each Awraia is a necessaryinput to the model. The extent of arable and non-arable land wasdetermined from the land resources data base produced by thePhase-I, Assistance to Land Use Planning proiect, according to thedefinitions set out in Chapter 3 of this report. The relativeextent of arable and non-arable land in each Awraia is shown inAnnex 2, and the spatial distribution in Annex 4.
Fuel wood requirements. Annual fuelwood requirement of ruralhouseholds, plus a proportion of the urban demand, is estimated inthe PSC model for 1985, 1995 and 2010. Fuelwood consumption isestimated on the basis of Anderson and Fishwick's (1984) figures,but can be varied in the model to simulate different situations,including the influence of substituting dried cattle dung forfuel. These aspects are discussed later in detail.
Forage requirement. Requirements are estimated from the results DI:the farm sub-model. This is achieved by comparing the feedrequirement of the cattle needed to sustain one hectare of the+arming system, with the feed available from residues. If indeficit, the forage requirement is computed from the size of thedeficit and the recommended crop area, otherwise the feed balanceis set to zero.
Optimizinq land use. Since crops can only be grown on potentiallyarable land, two possible situations exist in the model fordetermining the maximum PSC in an Awraia:
Where crop requirements exhaust all potentiallyarable land and limit the possible number ofhouseholds;
Where available arable land exceeds the requirements ofa population constrained by insufficient non-arableland to provide the necessary livestock forage andfuelwood.
In the first case, the maximum number of households which can be
52

supported is determined in the model by comparing the area ofarable land with the minimum farm size required to support asubsistence farm family in the Awraja under consideration. Theminimum +arm size is the number of hectares required to provide thefood grain equivalent needs of a rural family, taking into accountthe the needs of the local urban population and the AMC quota.
Where non-arable land is insufficient to meet the fuelwood andforage production needs of the population which could otherwise besupported from the available arable land, the model reclaims arableland for production of fuelwood and forage and adjusts the land useuntil all of the land is used and a balance is struck between thecompeting needs of the system. This maximizes the number ofhouseholds which can be supported under these conditions.
Presentation of PSC results.
For each of the projected situations in the model, the number ofhouseholds under each series of population growth assumptions andconsumption levels is compared with the supportable number ofhouseholds according to the model. This is expressed as a positiveor negative percentage, depending on whether the particular Awraiais projected to be over or under supporting capacity. A detailedgraphic presentation of the results of several simulations is givenin Annex 1.
Farm economics. Incomes are expressed as Disposable Income LessFixed Costs. In view of the number of assumptions involved in themodel and general nature of the data base, disposable income is amore appropriate indicator of cash available +or consumer goods forrural families. Income from crop sales is assumed to come from:
sales to AMCopen market salessales from coffee
All sales of coffee are assumed to be conducted through CMC. Fixedcosts are deducted from disposable income to a total of ES 74.00,comprising household poll tax, fees and depreciation of tools.Details of the methods of calculation and interpretation of resultsare contained in MLUP Technical Report 2.
5.: ANALYSES UNDERTAFEN
5.3.1 General
The population supporting capacity model was used to simulate anumber of future land use scenarios to determine the robustness ofthe model, particularly in view of the many assumptions made. A
number of analyses are presented in MLUP Technical Report 2.Subsequent analyses were conducted using more precise data on theextent of arable and non-arable land, which became available fromthe GILES geographic information system in the LUPRD after theinitial runs of the model had been completed. The trends of the

54
results are generally concordante and differ only in detail.
The Base Model
The base model represents a reasonable approximation to theexisting PSC situation in many parts of the country, with thepossible exception of the assumptions concerning fuelwoodconsumption and Vertisol use. Dried cattle dung and crop residues,such as sorghum roots, are used as substitutes in areas desparatelyshort of fuelwood, accounting for up to 50% of the per capitafuelwood requirement per annum (World Bank 1984). Cultivation ofVertisols is also expanding in areas where arable land is in shortsupply, but not without severe land management constraints forfarmers. Despite the pessimistic picture this model presents, itdoes provide a means +or determining the relative worth ofinterventions into the land use systems aimed at improving the PSC,by establishing a zero level against which to measure potentialgains.
Assumptions. The following assumptions are contained in the basemodel:
Arable land defined as in Chapter 7;
- Vertisols not available for cultivation;
- Nutritional requirements of the human population 162.6kg of grain equivalent per annum;
- Nutritional rnequirements of livestock, a total of 2280kg of consumable dry matter per annum;
Fuelwood requirements/caput/annum set at 1.3m...7*/caput/annum;
- Tseste affected areas are excluded from arable land.
= -r Reduction of fuelwood demand to 507. current of levels
The influence of fueiwood demand on the ESO in each Awraia wastested independently by holding all other factors constant in the
-base model and reducing the demand for fuelwood to 0.7m/caput/annum. The standard fuelwood comsumption adopted in thebase model is 1.3 m'/caput/annum. This scenario most closelyresembles the actual situation in Awraias with a serious shortageof fuelwood. The burning of dried cattle dung and selected cropresidues have been estimated to supplement the fuelwoodrequirements of families in such circumstances by up to 507'. (AACM1987). All assumptions regarding arable and non-arable land remainas defined in the base model.,..1.. ..4 An increase in forage production of 507.
The base model was again altered with respect to one parameter, the

55
amount of forage available for livestock. The objective was todetermine if an increase in forage production, without preiudice toother levels of productivity in the base model, could make asignificant difference to the population supporting capacity. Allassumptions regarding arable and non-arable land remain as definedin the base model.
vertisols fully untiliced +or crop cultivation
Vertisols are the heavy black clay soils widespread in thebottomlands of the Ethiopian highlands and along the Sudan/Ethiopiaborder. They are quite extensive, occupying as much as 87. of theland area of the country. Vertisols are mainly used for forageproduction at present, because they are difficult manage. Poordrainage and high draught requirements are the main problems.However, the high proportion of Vertisols in growing period zonessuitable for cropping increases their relat ve worth as potentiallyarable land.
= "IT Z. isetse control
The presence of Tsetse (Glossina sp) in many areas of westernEthiopia has provided a natural barrier for the westward expansionof cultivation for centuries. Tseste flies ara vectors fortrypanosomiasis, a disease which is fatal or debilitating tocattle, the essence of draught power for cultivation in thehighlands of the country. The species of flies known to carryhuman sleeping sickness have also been identified in Ethiopia, ashas the disease iteelf (Sthaller & Kuls 1972). However, livestocktrypanosomiasis is far more widespread and is serious in Gomo Gofa,Goiam, Ilubabor, Kefa, Sidamo and Welega Regions. It is generallyconfined to altitudes below 1800 metres. These Regions all havesubstantial land ares below 1600 metres with the associated highhumidity necessary for-survival of the Tsetse flies.
In the base model, the areas affected by Tsetse have beeneliminated from consideration as arable land, because sustainedproduction of food crops under the current animal-draught systemscannot be guaranteed. In this run of the PSC model Tsetse is_assumed to have been controlled.
= -7 Yields increased by 507. over current levels
This run of the PSC model demonstrates the influence of the currentlow yields and the high food demand of the increasing population onthe PSC of each Awraia. Yields are assumed to increase by 507.without prejudice to other factors, all other variables in themodel assuming the values used in the base model.
5.3.8 Achievable optimum
This run of the ESC model reflects the combined effect of
simultaneously introducing all of the improvements treatedindependently in previous runs of the model and, at the same time,

improving human nutrition to recommended levels (FAO 1987c). It
reflects what might be realistically achievable over the next 25years if appropriate development policies can be implemented in thenear future. The most difficult of the desired improvements tomake, is that of providing an alternative fuel to wood while at thesame time achieving biological improvement in the nutrient statusof soils.
7 0 -uther simulationsSeveral other runs of the PSC model were carried out, including aninvestigation of the amount of land available for production afterfirst satisfying future food needs. Runs simulating reduced yieldsdue to drought and the impact of improved farming systems are alsoincluded. These results are not presented graphically in Annex 1
for reasons of conciseness. However, they are discussed at lengthin MLUP Technical Report 2.
5.3.10 Disposable incomes
Details of the methods and interpretation of the disposable incomeanalyeis are contained in Technical Report 2. The results aresummarized further in this report.
5.4 RESULTS OF THE ANALYSIS
= 4 1. General
In ViEW of the brief time available for development and teeting ofthe modele and the reconnaissance nature of the data base on whichthe various analyses depended, a degree of caution should bemaintained when interpreting the results. Considerable scoperemains for improvement of the models, but thie lies beyond thepresent terms of reference of the MLUP. Despite these limitations,the wide range of sensitivity tested in the various runs of themodel is believed to reasonably reflect the limits of the actualPSC situation in Ethiopia.
Charts indicating the PSC by Awraia are presented in Annex 1 tothis report, to provide higher level planners and decision makerswith a means for rapidly appraising the sitation. Two examples ofthe charts are given in Figures 18 and 19. Figure 18 reflects the-result of including all limitations on the extent of arable land,le the base model. Figure 19 reflects the most optimistic run ofthe model attempted, the achievable optimum. All major constraintswere removed and a 50% increase in food and forage production
.included in this case.
By examinind the coneecutive charts in Annex 1, each of whichreflects the influence of removing or seeing one conetraint onpotential PSC relative to the base model, an indication of thepossible benefit of each intervention can be gained. Typicaldifferences are apparent in Figures 18 an 19.
56

1C0
90SO
70
SO
40
30
10
o-10
-3340
50
-eo-70-SD
-90-103
10D
90SO
70SO
5040
30
10
o-10
-30-40
EQ
60
-70
90
-1C)D
POPULATION SUPPORTING CAPACITYSI-ENIA 2 - BA MO Ca_
57
Figure 18.
A,.:. ,x
-.. ", / .
;¡.:...,
4,:
..y
Figure 19.
7
' . .7:::..i.:..;.:.7.4.
:. .
.
........
x*.:-..
'..
1
...,:...,:::.
,
`rIEFER HAFTJTCH EUTkDRA kEl..iSATA C 1-E30
199S 2010
POPULATION SUPPORTING CAPACITYSI-EYA 2 - IEE FTIMUirl
19ES
YEFER HAIN1DTCH c EUTAJIRA BATA C I-ES 0
194 199S 2010
5.4.2. Minimum farm size
The results of the base model analysis suggest a variation ofaround four times between the most and least productive Awraias, interms of orain equivalent produced per hectare of farming system.That is, a mínimum area requirement of between 0.8 and 3.2hectares. Most values lie between 1.0 and 2.2 hectares.Surprisingly, the Awraias in which enset is important do not appearto be as intensive, in terms of grain equivalent production, asanticipated. The main reason, supported by more detailed LUPRDstudies currently underway, is that despite the high productivityof enset relative to common cereals, a considerable proportion ofthe farming systems in these areas is devoted to grain crops.Another complicating factor may be the reported enset yields in theGeneral Agricultural Survey (MoA 1984), which are only two thirdsof values reported by the LUPRD (FAO, 1987b).
Data detailed in MLUP Technical Report 2 indicate that minimum farmsizes need to increase over the next 25 years, as a result of theassumptions that family size of rural households will remainconstant at 2.97. and that growth of urban households will increaseat 47.. Each rural household therefore, has to *ovide -Food to anincreasing urban population if self sufficiency in food productionis intended by 2010. This can only be done by increasing thecropped area and/or increasing yields.
.4.3 Population supporting capacity analysis
This indicates a disturbing trend throughout the heavily populatedhighlands of Ethiopia. Even if population growth can be curtailedto some extent in the future, a number of Regions in the country.are clearly approaching, or have already entered, a crisis withrespect to PSC. Welo, Ti grey and Eritrea, for example, have moreAwraias presently over capacity, according to the model, than undercapacity. This appears to be the case regardless of the influenceof possible interventions proposed in the various runs of the ESCmodel.
The next 10 to 25 years appear to be the most critical, with manypreviously considered surplus producing arcas predicted to exceedtheir population supporting capacity between 1985 and 2010. Figure20 shows the trend in the number of Awraias, according to the baseAodel estimates, in each of five PSC classes . The five classesShown in Figure 20 are explained in Table 4. Figure 21 shows the
'distribution of the same classes .by 2010, according to each ofseveral strategies to improve the PSC. This diagram sugoests thatunless a concerted effort is made to bring about improvements inthe yields of crop and forage, tsetse control, and reduction offuelwood requirements, the PSC will continue to decrease tocritical levels. By comparing the relative numbers of Awraiaspredicted to be in particular classes by 2010, it becomes clearthat isolated improvements through intervention in any one sectorhas little effect. The improvements gained on a national scale-From combining the possible interventions is substantially greatPr
5

SUPPORTING CAPACITY TRENDS
p tr2.7.9).. T1 0 t--1 S.11_1Ec:W-ING C.A.P.ACLASSES.v/./.1
RELATIVE IMPACT OF INTERVENTION,IS ON PSCTl-ll0PI
2AS E MODEL
59
RASE F.WOOD FORAGE VERTISOL TS6.7SE YIELD
AT10N S.1...1Ft7:ING CAP. CLASSES. E
1285 15

TABLE 4.
POPULATION SUPPORTING CAPACITY CLASSES
A +50 *to. +1007. Under capacity
+20 to +507. Acceptable
C +20 ta -207. Marginal
-20 to -1007. Over capacity
< -1007. Criti-al
than +or the individual factors. 0+ the individual factors, thecontrol of tsetae appears to have the most influence on improvingthe PSC.
The influence o+ the various interventions can, o+ course, beinterpreted in an entirely different manner. Increasing productionis akin to reducing demand, and it is this si do of the equatiorfwhich has so often been neglected by planners in the past.Population is the key to demand. A policy aimed at reducing thepopulation levels assumed in the PSC predictions would have thesame effect as simultaneously reducing demand for fuelwood, foodproduction and livestock +or tillage, thereby substantiallyincreasing PSC.
5.4.4 Limitations on the interpretation of the PSC results
Additional caution should be exercised in interpreting the resultsof the PSC analysis, because of the variable environmentalcharacteristics of some Awraias. Where substantial areas ofnon-arable lowlands are inaluded in an Awraia, this may influencethe apparent supporting capacity estimation as pastoralists mayhave been included in the estimates of total population. This
-tends to inflate the proiected food demand beyond the requirementfrom grains, as pastoralists live to a large extent on livestockproducts. Without a more detailed sampling frame, ie Woreda levelanalysis, it is not possible to remove this limitation. This levelof detail lies beyond the mandate of the MLUP.
Additionally, in Awraias such as Dire Dawa, many fam lies have beenrecorded in the census as rural households, when in fact they havetrading activities outside the agricultural sector. Incomes aretherefore likely to be substantially greater than reflected in the
PSC Class Percent of Remarkssupporting
capacity remaining

simple analysis of grain and coffee sales. This fact applies to anumber of Awrajas in Harerge, where trade in chat keeps disposableincomes at much higher levels than reflected in the output from thebase model. Income from trading and from livestock were notpossible to estimate from the available statistics on an Awraialevel, which leaves the possibility that disposable incomes may besubstantially greater than estimated in areas where dependence ongrain and coffee sales are less than average. Income from labour,for example for coffee harvesting, my also alter rural incomessignificantly. Again this was not possible to estimate at theAwraia level from the data base available for the MLUP. This mayhelp to explain why highly populated areas in Shewa, such asKembata and Hadiya, are able to survive when they appear to havealready passed their supporting capacity from subsistence farming.Areas in southern Shewa al so produce enset, roots and tubers. Theper hectare production figures of these crops used in the model mayunderestimate PSC. It is possible yields are up to 30% more thanestimated, but this would still not offset the food demandproiected for these Awraias by 2010.
Although rural incomes from sources other than grains and coffeemay be considerably higher in some Awraias than could be estimatedduring the current planning activity, the present and proiecteddependence of these Awraias on food purchases can be sean from theESC results. Unless these sources of income can be guaranteed,vulnerability to food shortages will be considerable.
5.4.5 Critical areas
By examining the resulta of the PSC analysis for each of thescenarios presented (including those in MLUP Technical Report 2),it is possible to iudge which Awraias (or Regions) appear to befacing diff.iculties which render them vulnerable to food shortagesin the next 25 years, or limited purchasing power to obtain food.
For Goiam, Shewa and Arsi Regions, which together currently provide857. of AMC purchases, the population growth by 2010 will increasefood demand to such an extent that food now available as surpluswill be required for home consumption. If per hectare productiondoes not increase markedly, either the ESO will fall, nutritionlevels decrease to unacceptable levels, or AMC Will have to tapadditional sources of supply to meet urban demand.
'Southern Shewa and northern Sidamo may be particularly critical if-incomes and production are not increased. In particular, theAwrajas of Kembata and Hadiya, Chebo and Guragie and Welayitaappear critical.. As indicated previously, incomes from sourcesother than those assessed may enable these Awraias to survive asthey are, but this is doubtful. Expansion of the area under enset,rbots and tubers may further improve the ESO in this zone.
The Regions of Eritrea, Tigray and Welo all appear to have poorprospects for the future, even assuming the optimistic situationpresented in the achievable optimum run of the ESO model. There
61.

seems little alternative but to redistribute the population ifalternative sources of income outside agriculture cannot begenerated in the short to medium term.
5.4.6 Prospects for coffee
The results obtained from the ESC model (Eee MLUP Technical Report2) indicate that the Awraias of current-importance for coffee are;Gardula, and Geleb and Hamer Bako in Gamo Gofa; Gursum and GaraMuleta in Harerge; Bump, Gore and Mocha in Ilubabor; Limu, KuloKonta, Kefa, Mail and Goldiya, and Gimira in Kefa, Arero in Sidamo;Nekemte, Ario, Gimbi, Kelem, and Asosa in Welega. There ispotential for conflicts in land use in these areas, because theyare designated as suitable for expansion of cultivation. Thecomparative advantage of coffee and -Food crops should be carefullyweighed in these areas before more intensive development of eitheris commenced.
Dolo, Metekel, Wegera and Jem Jema Awraias are currently minorproducers of coffee, but their favourable PSC position suggeststhat possibilities for increased coffee production should beinvestigated.
62

6. POTENTIAL FARMING SYSTEMS
6.1 GENERAL
The population supporting capacity analysis indicates that percapita food production will decline at increasing levels over thenext 25 years unless food production and export earnings fromagriculture can be significantly increased in the same period.There are two main poseibilities for achieving this: to increaseproductivity of crops and livestock per hectare, and to expand thearea used for cultivation and livestock production. IncreaSing thearea under cultivation at current levels of productivity will alonenot meet these needs. There is thus a clear need for increasedyields of most maior crops and forage production in Ethiopia. Thisraieee the obvious question of where this increase is to come from.
Since 95% of the food production in the country originates fromindividual peasant farms, this would seem the obvious place, wheremodest but effective improvements would bring the greatest overallbenefit in terms of total production. A number of alternativestrategies designed to achieve such improvements are discussedbelow.
6.2 FEFTILIZERS VERSUS ROTATIONS
6.2.1 The present situation
Yields have stagnated under the low input levels of peasantagriculture and must be improved if Ethiopia is to come near toself-sufficiency in food production over the next 25 years. Thisimplies the use of improved technologies such as fertilizers andgenerally more intensive agriculture. Fertilizers do increaseyields, but to obtain the full benefit farmers must use recommendedamounts and improve crop husbandry, including more intensive.weeding and improved seeds. The fertilizer price relative to grainprices has an important influence on the willingness of farmers toapply fertilizers, even when available. The timeliness of supplyand the efficiency of the distribution network also influenceattitudes to fertilizer use.
The fertilizers farmers use are imported, which impliesconsiderable cost in foreign exchange to the economy. The lack so'far of significant quantities of raw materials suitable for the-manufacture of fertilizers makes dependence on imports effectivelytotal. Handling and transportation costs in Ethiopia, with itslimited infrastructure, are also considerable. Prices to thefarmers reflect the costs at the official exchange rate of ES 2.07= US$ 1.00, plus the average marketing prices which includetransport and handling charges. There are Some 100 marketingcentres where fertilizers are delivered to Service Cooperatives(SCs) upon request, but requests must be approved by the MoA andONCCP. All fertilizers are imported and marketed through AISCO.
63
Fertilizer prices in 1987 are shown in Table 84 of MLUP TechnicalReport 2. The ertilizer/price ratio for tef and maize, togetherwith statistics on the total fertilizer used, are shown in Figure22, based on World Bank (19e7b) figures. It is apparent from thegraph, that when the cost of fertilizer is high relative to thegrain Price Ratio, the amount of fertilizer used declines sharply.
6.2.2 Improved technologies +or peasant farmers
In view of the current difficulties related to widespreadfertilizer use in the peasant sector, a series of alternativetechnology levels is set out below which could both improveproduction and nutrition at the same time. The improvements arebased on modest applications of fertilizer coupled with cereal,legume, pulse rotations which provide 50% yield increases and aratio of calories to protein o+ 7:1. The present national ratio i.e6:1.
Present technology (Type I), practised by the vast majority ofpeasants, is defined for comparison to include:
- local unimproved varieties of crops;- no fertilizer use;
no pesticides or weedicides;current agronomic practices;draught animals and/or hoeing;stagnating yields caused by shortening +allows,lack'oi green manure, decreasing amounts of dungfor fertilizer, loss o+ organic matter and landdegradation through erosion.
Improved technology (Type II) suggested +or adoption by themajority of individual peasants by 2010 is characterized by the+ollowing:
- local or improved var eties, whichever is demonstratedto be the most ef+ect ve;limited amounts of fertilizer (25-100 ko DAP and 50KgUrea to increase yields up to 50%)
ora rotation of cereals and pulses in a ratio of 7:1, incombination with undersowing cereals with a leguminousgreen manure, increasing cereal yields up to 1007. over a10 year period;no pesticidesimproved agronomic practices, with emphasis on rowplanting and better weeding;draught animals and/or hoeing;improved conservation, but must be practical and not toocostly;current cropping patterns, except in the case of thecereal/pulse/legume rotations.
64

FERTILIZER/GRAIN PRICE FERT 7LR
1979/80 980/81 1981/82 1982/83 1983/84 1984/85
TEFF \ MAIZE FERTILIZER L.ISED
The third technology type recommended (Type III) is for possibleadoption by producer cooperatives. It is characterized by:
inputs similar to those of Type II, but ifeconomic, mechanized land preparation. The mainbenefits of mechanization are not in higher yields,except where soil preparation needs to be achievedin a short time to achieve sowing/planting at thecorrect time in an intensified system ofproduction. Mechanization could reduce pressure onlivestock numbers and release land for otherpurposes (eg for fuelwood or crops) and reduce landdegradation due to livestock pressure;
crops and cropping patterns as defined under TypeII;
pesticides if required;- adequate conservation.
A fourth alternative is suggested for state farms in TechnicalReport 2 but since this simply places more emphasis onmechanization, fertilizers and pesticides, it is not discussedfurther here.
6.2.3 Input-output analysis for improved technologies usingfertilizer as recommended
The question of whether fertilizers provide a satisfactoryincremental benefit or farmers hinges on the relationship betweenfertilizer cost, yield improvement and market prices. The resultsof the input-output analysis for a number of economically importantcrops indicate that this is not the case at presente
Since fertilizers must be bought, farmers are required to sell ahigher prbportion of their harvest to meet the increased costs ofproduction. Input-output calculations in MLUP Technical Report 2reveal that the percentage of production sold should rise from thecurrent 20% to between 30% and 407. at current fertilizer and AMCgrain pricee to meet costs and achieve a small improvement indomestic grain availability. The benefits of fertilizer use arethus scarce and the risks considerable, considering the var abilityof +actors such as rainfall or pest attack.
-The incremental benefits and costs of the suggested technologieswere tested against the current situation by setting imaginaryprices for grains which are above AMC prices, but below open marketprices. Farmgate prices are well above AMC prices in most cases inmost years because of the artificially small markets caused by aforced quota, relatively low price and restriction on private tradebetween Regions. The imaginary prices are more or less in linewith proposals for AMC price increases made by the Food StrategyTaskforce (July 1987). The detailed results of these input-outputcalculations +or the main cereals in Ethiopia are contained inTables 89 to 821 in MLUP Technical Report 2. A summary of theresults is contained in Table BS.
66

It should be noted that price increases alone will not necessarilyresult in increased inputs and, therefore, increased production.Much more is necessary, including adequate and timely delivery ofseeds and fertilizers to accessible market places, adequateextension services, adequate research, improved marketing,transport and infrastructure, and, where required, credit schemes.
6.2.4 Results of Type II technology using fertilizers
Results indicate that barley, wheat, te-F, maize, and horsebeanwould be economic under the Type II technology proposed usingfertilizer. This is not the case for oats and millet, whilesorghum is marginal. Except for oats and millet, the gross marginper hectare increases with increased fertilizer use, as well as thegross margin per labour day. The amount of grain available forhome consumption al so increases, but a higher proportion of yield,as suggested earlier, has to be sold.
There are a number of consequences of increased grain sales,including the need for an effective demand +or these grains. Thecreation of an effective demand can only be accomplished ifsufficient remunerative employment can be created outsideagriculture. Increased net disposable incomes in the hands offarmers may also cause a significant increase in livestock numbers,as this is a traditional 'banking system' that rural peasants use.Other consumer goods need to be available therefore to stimulatethe economy if disposable incomes should rise significantly. Thisdictates the need for development of the marketing system and ruralinfrastructure.
Foreign exchange implications
Estimates contained in MLUP Technical Report 2 indicate that tomeet the food demand in 2010, the harvested area under the presentlow yielding technology (Type I) would need to increase by some 21-.o 7.5 times. Assuming that such an extent of arable land isavailable, and that yields in 2010 are 50% hioher under Type IItechnology, there would still be a need for an area expansion ofsome 1.3 to 2.3 times the present area under cultivation. Thispresupposes about 50kg of DAP and 50 kg of Urea per ha of allland. This would require between 700,000 MT and 1,700,000 MT offertilizers, a 7 to 13 fold increase in fertilizer imports. Thisimplies between US$ 123 million and 226 million at present prices.And all of this to provide food +or domestic consumption. Added to
_these costs are the demands on transportation and infrastructure,which are tremendous. This makes the whole question of fertilizersat such levels of input questionable.
6.2.5 Cereal/legume/pulse rotations as an alternative to higherlevels of fertilizer use
A considerable amount of detail on the agronomic benefits of suchrotations is contained in MLUP Technical Reports 3 and 4. Takenover 25 years, it appears that a two-year wheat/one-year horsebean
67

68
rotation, with the wheat undersown with the legume Trifolium, wouldbe at an economic advantage over the use of fertilizers alone.Through an assumed build up of organic matter in the soil, wheatyields could be expected to increase from 1.0 to 1.5 MT in thefirst years, ta 3.0 MT over 17 years, after which they would remainstationary. Nutrient supply for the cereal would come fromhorsebean N-fixation of le kg per year and from the TrifoliumN-fixation of 20 kg per year, and the application of 50 kg DAR peryear to wheat and 30 kg per year to horsebeans.
The internal rate of return +or the system would be of the order of25" to 70%. The fertilizer use of such a system is about 407. ofthat +or continuous planting of wheat. Additional benefits comefrom the increased feed supply +or the livestock necessary to meetthe draught requirements of the farming system. In later years,some 7.7 MT of dry matter per year (2 years wheat, Trifolium, oneyear horsebeans) could be anticipated, compared with 2.7 MT drymatter from continuous wheat planting. The needs for improvedtechnology of this kind are discussed further, later in the report.
6.3 GENERAL AGRONOMIC CONSIDERATIONS AND POTENTIAL CROPPINGSYSTEMS
6.3.1 General
The low overall levels of crop husbandry in Ethiopia, evendiscounting production limitations of local crops and varieties,tends to hold production down to a minimum. Broadcast seeding,insufficient weeding and minimal levels of other inputs such asfertilizer, pesticides and herbicides are all partly responsible.While many of these limitations are controlled by economicconsiderations, as indicated in the previous section of the report,there is still room for considerable improvement in crop yieldswith economically viable alternatives, such as locally manufacturedweedicides. Perhaps an even more pressing requirement is for theintensification of agriculture. In the more eecure productionzones of the country, for example, substantial increases in theproductivity could be achieved by making more effective use of theavailable moisture. These agronomic considerations are discussedbelow, together with details of potential farming systems.
6.3.2 The case +or herbicides
Weeds cause production losses because small farmers do not havecultivating implements capable of creating a sufficiently cleanseed bed. Crops such as-tef face severe weed competition withoutsufficient land preparation, requiring an average of 6 cultivationsto prepare an adequate seed bed with traditional implements.FallOw fields in a low intensity agricultural system are alsosources, of weed reinfection.
Weeding is a labour intensive activity for small farmers withconsiderably more weeding necessary than is usually available or

the farmers are willing to apply. Small grains are more severelyeffected than the large grains such as maize, because effectiveweeding is near impossible. Broadcast methods of seedingexacerbate the situation, but farmers currently have neither theimplements or the experience for sowing in rows.
The only way in which to prepare an adequate seed bed in theabsence of appropriate cultivating and sowing implements is to useherbicides. ADD (1988) have suggested that knock down herbicidesapplied 1 to 3 weeks before first ploughing, would significantlyreduce the number of ploughings necessary +or most crops.Pre-emergence herbicides applied just after sowing would furtherreduce weed competition. However, soils must be left undisturbedafter the application of pre-emergence herbicides to maintain theherbicide film.
Yield improvements
ADD (1988) reports that yields of local and improved maizecultivars at various si tes in Ethiopia are between 20 and 45quintals per hectare, applying a package inputs which includedintensive weeding. Improved varieties offered only a 20% advantageover local cultivars and most of the reported yield difference (7to 4 times) iE attributed to the improved husbandry, especiallyweed control.
Cost of herbicides
Costs per hectare of some suitable herbicides ara:
The cost of knapsack sprays must be added - the cost of
herbicides.
Potential +or local production of herbicides
There is a case +or local production of many herbicides as theyare not particularly complex to manufacture and the patents haveexpired some time ago. This would greatly alleviate the cost andencourage more widespread use of the technology.
The potential advantage
There are a number of implications to the use of herbicides beyondsimply increased yields. For example, if the number of ploughingscan be reduced for many crops, especially te-f5 the soil degradationproblem aesociated with leaving the soil without vegetative cover
Roundup (1:1+11 24D) FR 68.00(Two applications of 1/2 1)Pre-emergence types for FE 70.00wheat and barley-Triazines for maize and EB 16-22.00Sorghum24D/MCPA (follow up) EB 8.00

during the most intensive rainfall period prior to planting, couldbe reduced considerably. Secondly, the requirement for draughtpower is always critical during the -Few weeks prior to planting.Reducing the need +or ploughing could greatly ease the burden oniarmers with limited livestock resources, who normally have to waituntil neighbours have completed their ploughing before oxen can beborrowed or hired. This results in late planting with attendantrisks of crop +ailure in drier than normal years.
The main drawbacks of increased herbicide Use include: cost andmaintenance of knapsack sprays, cost of herbicides and increasedextension and training oi -farmers.
6.3.3 More effective use oi available moisture
There is considerable scope in Ethiopia -For more intensive use ofthe land where moieture availability permits. In zones with tworeliable growing periods, examination of relay cropping and doublecropping options should be made. In many parts of Ethiopia Belgand Meher seasons are distinctly separate and could support twoshort season crops on a regular basis. Also, in long growingseasons such as occur in western and southwestern Ethiopia, thereie ample time for two crope in a year. The problem is one ofhaving to harvest the first crop during the wet season. A furtheralternative where harvesting in the wet season may be problematic,or where the Belg season is too short for a cereal or pulse crop,ie the incorporation of a leguminous forage crop into the +armingsystem or a crop to be ploughed-in for green manure.
Details of these improvements are contained in MLUP Technical Annex4, Potential Farming Systems.
6.3.4 Intercropping
Intercropping is successfully practised in many countries and isapplied to a limited extent in eastern Ethiopia, in the Harergehighlands. Intercropping involves the combination cl-f two or morecrop types grown at the one time, in the same field. The cropsusually have different maturation cycles and are planted andharvested at different times. In some systems of intercropping,one crop may provide shade or nutrient stimulus for the other. Thedifferent crops in the system are normally grown in alternating'rows, or on ridges and in furrows.
The crop combinations grown in Ethiopia depend to a large extent onthe prevailing environmental conditions in the locality, but themore common include: maize/pepper, sorghum/pepper,papaya/maize/sweet potato, maize/sweet potato. The technique neednot be confined to +ood crops. Forage crops are also usefulcomponents of an intercropping system in many parts of the world.Forage legumes have the advantage that they fix nitrogen andstimulate the production of other crops grown in combination withthem. There is enormous potential in Ethiopia for intensifying
70

crop production through intercropping, especially in view of thelimited use which is made of available moisture in many parts ofthe country.
6.3.5 Relay cropping
Relay cropping is a refinement of intercropping. Crops are plantedin relays as the term suggests, in the same field. One is plantedearly in the growing season and the other much later, when thefirat j.s near maturity. The technique makes very effective use ofavailable moisture, but these conditions should be predictable, asrelay cropping requires careful timing of operations and a goodappreciation of environmental conditions for total success. Timingis particularly important with respect to excese moisture duringthe harvest of the first crop or drought periods prior to theharvest of the second. Typical crop combinations could include aforage legume planted early, followed by te f or barley, or barleyfollowed by chickpea.
6.3.6 Undersowing
Undersowing most commonly involves the use of permanent pasturespecies in the last cropping cycle before land is fallowed. Itinvolves the sowing of pasture and crop, or two crop species,simultaneously or shortly after one another, with the intentionthat one of the two will follow on to maturity after the first haEbeen harvested. Typical examples of species grown in relay systemsinclude Trifoliums sown with cereal s, and Stylosanthes species withmaize and sorghum.
6.3.7 Minimum tillage
Where erosion losses are acute, minimum tillage has been successfulin a number of countries in reducing this problem. Anotherimportant advantage of minimum tillage is conservation of soilmoisture. The technique is based on the use of herbicides tocontrol weeds, but locally produced scrapers have been Euccested asan alternative. The technique was suggested as an alternativesystem by the EHRS, but no research has been attempted to date tosee if it could be successfully applied in Ethiopia.
6.3.8 Alley cropping
-Alley cropping is both a form of intensification of agriculture anda conservation technique. Leguminous trees, such as Leuceana sp.and Sesbania sp, are grown on conservation bunds and terraces tohelp reinforce these structures, while at the same time providingnitrogen fixation, limited fuelwood, and +oracle for livestock. Thetrees are extremely vigorous and can be out redularly for livestockfeed. The leaves are high in protein and an excellent form ofnutrition +or livestock.
71

Crops are grown in the alleys between the trees. Stabilizing thebunds can also te achieved using grasses or other types of
vegetation. Grasses carelessly managed can invade croplands, sogreater care is required in their management. The FLDP has hadconsiderable success in recent field trials using forage grasses tostabilize bunds. ILCA has also demonstrated the advantages ofAlley cropping over a number of years at its research sites inEthiopia.
6.4 CROF SUITABILITY ASSESSMENT
6.4.1 General
The Phase-I Assistance to Land Use Planning proiect produced a landsuitability assessment of a number of crops in Ethiopia, based onresource data available at the time the first proiect phase wascompleted. Subsequent studies on moisture availability, includingthe Agrocological Zones, study of Ethiopia (-see MLUF TechnicalReport 5), take account of probability factors, which wereunavailable in Phase-I.
A computer assesement of land suitability which used this later,more reliable information, was carried out as part of the AgronomyConsultant's inputs to the MLUF. Details can be found in MLUPTeohnical Report 4, Potential Farmi ng Systems. A summary of themethods is set out below.
6.4.2 Crops and crop groups considered for evaluation
Following in the theme of an improved population supportingcapacity throughout the country, crops considered for theevaluation were grouped according to both their environmentalrequirements and their nutritive value. For example, each groupdefined contains crops which provide carbohydrates (cereals, rootsand tubers), protein (pulses), or fats (oilseeds). In this manner,farming systems can be built up from the groups which provide thebasic nutritional requirements. of rural families. Cash crape andperennials, such as coffee and enset, were considered as singlecrops for matching with available land resources. Table 5 containsa list of the crops which go to make up the 9 main groups.
-Perennial and cash crops treated separately include: grapa, citrus,'sisal, coffee, sugarcane, oassava, banana, pineapple, ensat,pyrethrum, tobacco, kenaf and rice. Altogether, 46 crops wereexamined for suitability.
6.4.3 Methods of suitability asseesment
Methodology follows closely along the lines used in the Phase-Iproiect with two important differences. First, the environmentalparameters include DGP and traditional altitude zones, both
72

TABLE 5
MAIN CROP GROUPS USED IN THE LAND SUITABILITY ASSESSMENT
Group Crop members
73
'described earlier in the report. This enabled est mation of the-suitability of a crop group or individual crop to a particularlocatity on the basis of sustainable cropping B years in 10. Thesuitability of crops in relation to traditional agroecologicalzoneE, which broadly equate to temperature regimes, is set out inTable 6.
The second important difference is that the crop groups matchedagainst the characteristics of ths land contained in the landinventory were selected for their potential as components offarming systems, designed to improve nutrition. The land inventory
1 Barley, oats, wheat, horsebean,fieldpea, linseed, rapeseed andwhite potato
2 Barley, wheat, oats, haricot bean,soybean, sunflower, safflower andwhite potato
Te-f, chickpea, lentil, vetch,safflower, linseed, noug, sunflowerand white potato
4 Barley, wheat, oats, chickpea,lentil, vetch, safflower, linseedand noug
Sorghum, maize, haricot bean,soybean, lima bean, sunflower,sweet potato, and taro
6 Maize, sorghum, te-f, soybean,haricot bean, sweet potato andsunflower
7 Pearl millet, haricot bean, limabean, soybean, sweet potato andsesame
Finger millet, sweet potato,sesame, groundnut and cowpea
9 Tomato, shallot, cabbage and pepper

used to assess crop suitability is that used for the Phase-I study,but input into a computer for more rapid reapraisal of landsuitability.
Different traditional zones may support similar crop groups, butthe lower temperatures at higher altitudes require increasedlengths of growing period for crops to reach maturity. Thisrequirement was built into the suitability assessment, togetherwith details of.how intensification of different available growingperiods might be achieved. An example of crop group suitability inthe Kola zone, for different lengths of GP, is shown in Figure 23.All possible combinations of GP, altitude/temperature zone and cropsuitability are provided in MLUP Technical Report 4.
The results of the matching of land characteristics with cropgroups and crops is presented in MLUP Technical Report 4. Maps:which show the locations in the country suitable +or each group orcrop are attached to this report.
6.5 IMPROVEMENT OF FORAGE SUPPLIES
6.5.1 General
In the mixed farming systems common to Ethiopia it is imperativethat considerable interaction between livestock and crop productionshould exist for the benefit of overall farm productivity.Livestock, by providing draught power, transport, manure and cashplay a vital role in the development of crop production.Improvements to livestock should therefore spinoff to the system asa whole. Animal nutrition and animal health are two significantareas where aptential exists to improve overall farming.systemssignificantly.
The present overgrazed and mismanaged range and pasture resourcesin much of the country would benefit from a move toward moreintensive systems which integrate aspects of crop and livestockproduction. Any attempt to improve communal grazing lands will bedifficult because of utilization and management constraints, andforage development is therefore most likely to be successful ifconcentrated on individual holdings. Multi-purpose systems, such-as alley cropping, meet these obiectives. Alley cropping offersopportunities for simultaneous erosion control, soil fertilityimprovement, fuel supplementation, and livestock feed production.Interaction between highlands and lowlands, where the latter hassur-plus capacity to produce a stock of draught animals, should al sobe encouraged to reduce pressure on highland pastures.
Improvements in animal nutrition should not be viewed in isolation,but should be accompanied by animal health measures to improveproductivity.
74

DEPENDABLE LGP ( Days)
NOR CROP
Figure 23.
75
900
5
135
35
75
75
90130
5
5
135
165
120
120
125
45
MINOR CROP Gro p o275
Group b
G ouP 1 130
G o p 135
G oup 3 135
Group 4 135
Gr up 5 165
G o p 6 120
Group 7 120
Group 8 125
Group 9 t 145
75MINOR CROP G oup a300
G oup b 90
Group 130
G oup 135
Group 3 135
Group 4 135
G oup 165
Group 6 120
Group 7 120
Group 8 125
Group 9 145
A A S O N
MONTHS
PROPOSED CROPPING CALENDARS FOR DIFFERENT LENGTHS OF GROWINGPERIOD (LGP) IN THE KOLA ZONE.
210
240
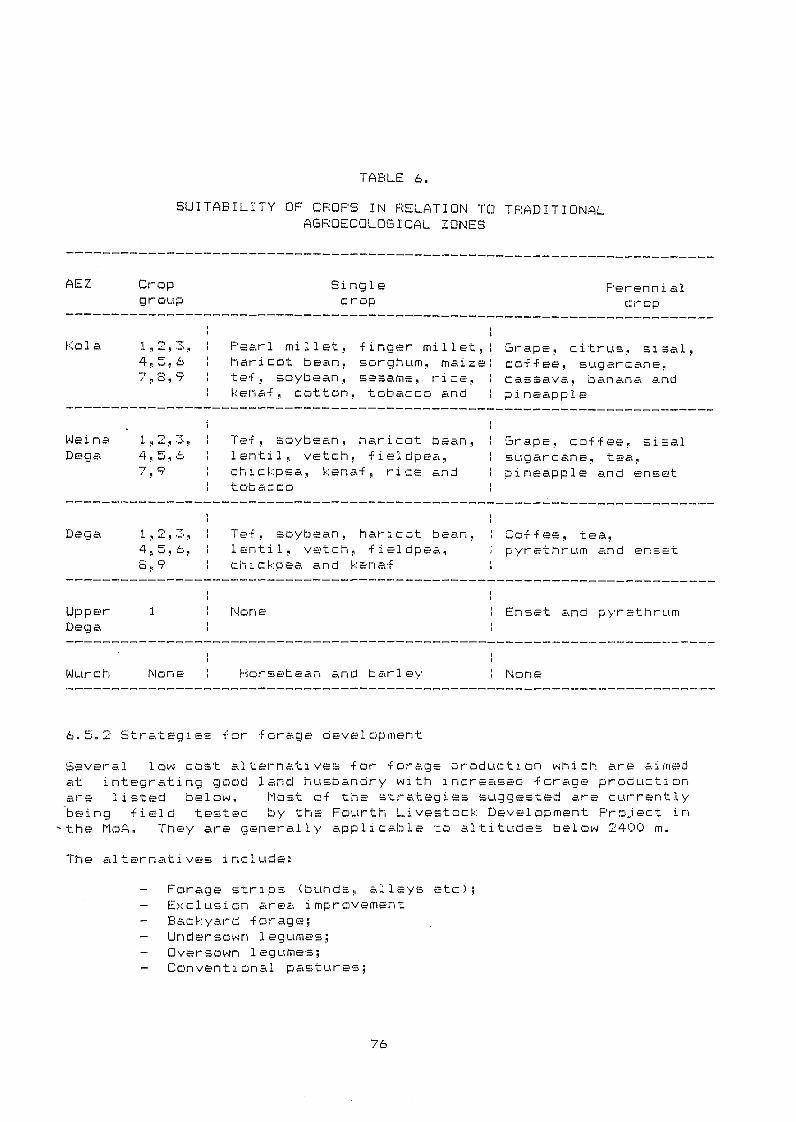
WeinaDega
TABLE 6.
SUITABILITY DF CROPS IN RELATION TO TRADITIONALAGROECOLOGICAL ZONES
Te-f, soybean, haricot bean,lentil, vetch, fieldpea,chickpea, kenaf, rice andtobacco
6.5.2 Strategies for forage development
Several low cost alternati ves for forage production which are aimedat integrating good land husbandry with increased forage productionare listed below. Most of the strategies suggested are currently-being field tested by the Fourth Livestock Development Proiect in-the MoA. They are generally applicable to altitudes below 2400 m.
The alternatives include:
Forage strips (bunds, alleys etc);Exclusion area improvementBackyard forage;Undersown legumes;Oversown legumes;Conventional pastures;
76
Grape, coffee, sisalsugarcane, tea,pineapple and enset
Dega 1,2,3, Te-f, soybean, haricot bean, Coffee tea,,
lentil, vetch, fieldpea, pyrethrum and enset6,9 chickpea and kenaf
AEZ Crop Single Perennialgroup crop crop
Kola 1,2,3, Pearl millet, finger millet,' Grape, citrus, sisal,4,5,6 haricot bean, sorghum, maize coffee, sugarcane,7,6,9 tef, soybean, sesame, rice, cassava, banana and
kenaf, cotton, tobacco and pineapple
Upper 1 None Enset and pyrethrumDega
Wurch None Horsebean and barley N ne

Fodder crops;Grazing management;Reduced livestock numbers.
The alternatives, with the exception of the last, ara more or lessranked in order of economic potential, technical feasibility andfarmer accepta'nce. Details on the character and applicability ofthese strategies to different environments in Ethiopia arediscussed at length in MLUP Technical Report 7.
77

7. SUMMARY OF CONSTRAINTS AND POTENTIALS FOR AGRICULTURE
7.1 GENERAL
This chapter outlines the main constraints limiting agr culturaldevelopment in Ethiopia, the main potentials to be realized, andsuggestions on policies which could assist development.
Before proceeding in detail, it is worthwhile recapping on theinformation presented in earlier chapters of the report to reaffirmthe nature of the global development problems facing Ethiopia overthe next 25 years.
7.1.1 Population
The first and foremost constraint faced by Ethiopia iF oopulatongrowth. It lies at the base crf most development problems nowfacing the country. People require food to sustain them and thisdictates that adequate amounts must come from domestic agriculture,or from imports. Thie will require substantial increases inproduction of all agricultural commodities, but Ethiopia's presentlimited capacity to generate foreign Exchange (mainly throughcoffee exports) dictates that subsistence agriculture will underpinfood production over the next 25 years-
The extent of potentially arable land.
The demand for food by 2010 will require on the order of 2.0 to 7.5times the present production, depending on nutrition levels- (seeChapter 2), to ensure self sufficiency. At present-yield levels,this would mean 2.5 to 5 times the current area under crop in ayear. Given the area requirements of cash crops, fallo w andlivestock production, and the cumulative ares loat throughdegradation (although of limited influence up to 2010), it isunlikely that sufficient arable land would be available in thecountry to meet theee needs at present yield levels. Per hectareyields must therefore increase globally to meet the future foodrequirements.
7.2 MAIN PHYSICAL CONSTFAINTE AND POTENTIALS FDP DEVELOPMENT
7.2.1 General
Physi cal constraints are generally more clear cut than thoserelated to policies, but may require substantial investment toalleviate. These are discussed below, together with the potentials.or development. Two 1:2,000,000 scale maps, one detailing the mainphysi cal constraints and the other the development potentials forthe possible expansion or improvement of agriculture, are attachedto the report for further clarification. The first (map 1) is
titled: "Physical Constraints to Agricultural Development"; and thesecond (map 2): "Land Development Potential".
78
7.2.2 Moisture availability for crop production
The extent of arable land, as defined by the MLUP, is stronglyinfluenced by the moisture available +or crop growth. The 90-daydependable growing period (DGP) required by the definition, meansthat only 27 % of the country which is otherwise suitable +oragriculture can be classed as arable. Marginally arable land isthat with a median growing period (MGP) of more than 60 days andDGP of less than 90 days. Below a 60 day growing period it isunlikely that any significant crop production can take place. Some137. of Ethiopia is marginally arable according to this definition.
The arable zone
Within the arable zone considerable potential exists +or better useof available moisture,. as indicated in the previous chapter. AboveGPs of 210 days, intensification of cereal based systems ispossible, together with expansion of perennial crop cultivation.Roots and tubers, such as sweet potato, white potato and ensetoffer high per hectare production potentials, of between 30 and 300quintale. Apart from food crops, this zone also offers thegreatest potential for the expansion of cash crops such as coffee.
There is further potential for intensification of cereals and othercrops in the zone below 210 day GPs, but this is mainly confined tosupplementary forage production, green manure crops, or doublecropping systems which include a short season pulse.
Techniques and inputs required for realizing the potentialsdescribed are included in MLUP Technical Report 4.
Marginally arable land
Moisture is a serious constraint for crop production in this cone,but there is potential for more intensive land use. Some 177. or15.9 million hectares of Ethiopia are marginally arable from a soilmoisture standpoint. Ta date in Ethiopia, this is ineffectivelyutilized. Many crops and cultivare exist which can make use ofshort growing seasons of between 60 and 90 days. In Kenya, forexample, there are short season varieties of maize, sorghum, andmillet which yield twice that of cereals currently grown in themoist zones of Ethiopia. Pulses which use such short seasons arealso available.
Moisture insufficient for rainfed cropping
Some 497. of Ethiopia is non-arable, mostly because of short growingseasons (less than 60 days), which vary greatly in length andstarting date from year to year. Most non-arable land is found inthe lowlands and populated by pastoralists, whose livestock herdsare confined in their range by the availability of drinking water.The spatial distribution of watering points for livestock varies byseason and year, according to rainfall patterns in a given year.
79

During prolonged dry periods, the movement of livestock herds isstrictly limited by the lack of water, and range conditions becomedegraded around watering points. Some pastor-aliste have dug deepwells in dry stream beds and other likely sources of groundwater tosupplement dry season water supplies and extend the range of theirherds to more abundant forage. There is considerable potential toextend water availability in the Ogaden and Sor-ene aras of
Ethiopia, both through surface water harvesting in the wet seasonand groundwater development. The Land Development Potential mapindicates where some of these opportunities, exist.
Additional agricultural potential exists in the lowland zones ofEthiopia for the development of natural gum and incenseproduction. Appropriate tree species are native to the hot lowlandenvironment. Since there is a substantial domestic andinternational demand for these products, potential exists fDrfurther development of the industry in this zone.
Recurrent drought
The problem of recurrent, severe 'drought in Ethiopia is aconstraint that must be incorporated into any assessment ofpotential, because o'f the dramatic effect it has on economicdevelopment. The causes of -f ami are many and complex, but thereis no doubt that drought plays a maior role in tipping the balancetoward widespread starvation and euffering. Marginal subsistenceagriculture, land degradation, inadequate strategic reserves andstorage facilities, limited infrastructure, low incentives forpeasant sector production and numerous other factors, ncrease thesusceptibility of the rural population to amine.
The one variable that cannot be controlled in this scenario is theweather, but it can be ,both monitored and utilized moreeffectively. The lack of a widespread reporting network, forexample, that can provide daily rainfall data to a monitoringcentre for analysis, reduces the effectiveness and reliability ofdrought early warning. Given daily or 10-daily rainfall datacollected over many years, agricultural planners could also devisemore appropri ate farming eystems for drought prone areas.
7.2.3 Tsetse infestation
This represents a serious physi cal constraint to expansion ofagriculture in Ethiopia. Some 9.8 million hectares are infestedwith tsetse, reducing the sustainability of animal-draught basedsystems of agriculture. These areas are indicated on map 1,Physi cal Constraints to Agricultural Development. The substantialimpact of removing this constraint on the potentially arable landcan be seen from the results of the PSC analyses contained in Annex1.
80

7.2.4 Malaria infestation
Malaria is largely responsible, together with the presence oftsetse, +or the limited cultivation in the western zones of
Ethiopia. It has been, and remains, a serious constraint tosustainable development of all regions of Ethiopia here it isprevalent. The extent of serious malaria infestation is shown onmap 1, but it is also present to a lesser degree in most areasbelow 1800 m. The potential gain from the control of malaria isdifficult to measure from available statistics, but it will be nearimpossible to fully realize agricultural potentials in westernEthiopia in the future without a malaria control proaram.
7.2.5 Vertisols
Vertisole are a mixed blessing. On the one hand they offer highagricultural potential, on the other, intensive management isrequired to realize their full potential. The need for drainageprotection and the high draught requirements are the mainconstraints to the widespread use of Vertisols +or agriculture.However, their gently sloping topography, depth, and inherentfertility make them candidates for expansion and intensification ofagriculture, once the limitations are overcome.
The management of Vertisols has been researched by both ILCA andICRISAT with considerable success. The use of a broadbed andfurrow system to improve aeration of the crop root zone offered themost significant gains in productivity in trials conducted inEthiopia. Vertisols respond most effectively under this managementsystem when fertilizers are applied. Otherwise the advantages arenot substantive, although the construction of broadbeds and furrowswhere seasonal drainage iS particularly poor, may providesufficiently improved drainage to allow a marginal yield whenconventional cultivation does not.
A notable feature of Vertisols in the highlands, is that above 2700meters they are more frost prone than other soils. The reason forthis lies in their common occurrence on bottomlands. Cool air fromsurrounding mountains tends to flow downhill and create frostproblems overnight. Farmers have responded in many high altitudezones by increasing the extent of Vertisols sown to oats, which aretolerant of frost and the somewhat poorly drained character of the-Vertisols.
The area of Vertisols in the arowing period zone havina greaterthan 60 days MGF, is around 7.4 million hectares. Because of theirdual character, Vertisols are shown on both maps 1 and 2. First,as constraints to the .intensification of agriculture and, in thesecond instance, as offerinq aptential for develapment underappropriate management.
7.2.6 Shallow stony soils
Most of the shallow, stony soils in northern Ethiopia are theresult of degradation over centuries of cultivation and poor land
81

management. Little can be done to halt the degradation and reversethe procese, short of maseive land reclammation and migration of asignificant proportion of the population. Soils which are lessthan 25 cm in depth are particularly prone to the effects ofdrought, even in reasonable rainfall years, because of their poormoisture holding capacity. This is a serious constraint foragricultural development in the areas affected. Wifh lowerpressure on the land, however, considerable regeneration of naturalvegetation should take place. Hillside closure, together withcropping under intensive land management schemes, offers potentialfor improved food, livestock and fuelwood production, providedpopuletion pressure is reduced. Certain droudht reeietantperennial orope such as sisal, olive and grape might be successfulycultivated in many such areas if appropriate research is firstcarried out. The extent of shallow stony soils has been indicatedon both map 1 and map 2.
-7 7 Soil degradation
The effect of degradation on land productivity has been discussedat length earlier in the report% It appears that serious problemsresultind from continued degradation are mostly confined to theshallower soils northern Ethiopia, where degradation isadvanced. For the remainder of the country, loss in productivitydue to degradation will become a critical constraint beyond th75-year time frame of the MLUF. However, it will become serious inthe next 50 years and all attempts to arreet it at the earliestpossible time should be made no. The extent of seriousl'ydegrading land is shown in map 1.
-7.2.8 Steep land
Land over 70% Elope, in areas here moisture conditions aresuitable for crop production, amounts to some 5% or 6.1 millionhectares in Ethiopia. Because of high erosion risks under cropproduction, this land requires very special management. In mostcountries in the world land of. thie slopewoulH.- not be cultivated,but land pressure has rendered it common practise in Ethiopia.Ideally, Eteep land should be used for forestry, cut and carryforage production or, at moat, perennial crop cultivation. Wherenot cropped, it is presently used for liveetock grazing, often.resulting in accelerated erosion because of overgrazing andvegetation dedradation and soil disturbance due to animal tracking.
If the demand for land necessitates cultivation of steep slopes inthe future, then at least 20% of the area will be required forconservation structures, such as bench terraces. Conventionalconservation structures can be replaced by an agroforestry systemin many instances, with cultivation taking place between treelines- This renders the area set aside for conservationproductive. Closing hillsides to cultivation and grazing andsubstituting a system of cut and carry fodder for livestock, hasalso been demonstrated at several locations in Ethiopia and provedboth productive and effective in regenerating degraded land.
Much of the land classed as steep by the MLUP is included in thatwhich is already degrading rapidly. Where the estimated soil lossrate is high (FAO, 1983b), it is shown on map 1 under this guise.Where era ion on steep land is not estimated to be excessive, ithas not been separated on the map. Steep land was consideredpotentially arable in the PSC analysis, but 20% of the land areawas deducted from the arable total to accommodate the conservationmeasures necessary to sustain production in the long term. Ifotherwise classed as arable, however, the 207. was still consideredsuitable for forestry and livestock production.
7.2.9 Unique ecosystems
The remaining unique ecosystems in Ethiopia of greatest importanceare the closed high forests of Bale, Sidamo and the western Regionsof Ilubabor, Kefa and Gamo Gofa. These resources have specialsignificance for the national heritage and should be managed andprotected at state level before fuelwood demands cause their totaldestruction. The various national parks in the country are alsounique ecosystems for wildlife preservation with potential for thecl.=velopment of domestic and international tourism. The locationsof both forest areas and national parks are shown on map 2.
7.2.10 Land suitable +or mechanization
Land suitable for mechanization was estimated from the Phase-I soildata base .and information on dependable growing period fromTechnical Report 5. The minimum dependable growing period was setat 60 growing days, ta allow +or the future possiblity of highinput +arming in low rainfall zones, comparable to that carried outin dryland environments such as parts of the United States andAustralia. Soil requirements included a soil depth of greater than100 cm, well drained, without serious toxicities and none to slightstoniness. Vertisols may also be considered suitable +ormechanization, but under intensive management. They are prone tocompaction and require tractors with special capabilities, such as4-whe.el drive. Another necessary management feature +or successfulmechanized farming on Vertisols is drainage protection.
The total area of Ethiopia where these criteria are met isapproximately 12.9 million hectares, or 4.9% of the country. The-area of Vertisols is not included in this estimate. Areas were,determined by the GILES geographic information system in thaLUPRD. A map of those areas with potential for mechanization isincluded in Annex 4 to the main report.
7.2.10 Irrigation potential
Irrigation is generally considered to fall into three claeses inEthiopia; large-scale (1000 ha and above), medium-scale (200 to1000 ha) and emall-scale (less than 200 ha). In tha case oflarge-scale irrigation, a number of previous studies on thepotentials have been compiled in considerable detail. The resultsof these studies are incorporated into the Land Development
ez;

Pptential map attached ta this report. Identification ofalternative large-scale irrigation potential lies beyond thecompetence of the MLUP.
Perhaps the most important constraints for large-scale irrigationare the extent of suitable land, particularly in terms oftopography and soils, as costs rise exponentially where extensiveland levelling works are required. Development costs of recentlyconstructed schemes in Ethiopia are around ES: 30,000 per hectare.This makes the production of cash crops a necessity in schemes ofthis type, in order to obtain a satisfactory rate of return on thecapital invested and ongoing maintenance and running costs.
In recent years, the growth of medium-scale irrigation has beensubstantial, as a follow-up ta the drought of 1984. Most activityhas been in Regions such as Welo which were badly affected by the1984 drought. Small-scale irrigation iES the responsibility of theSWCMD.
As a general rule, there are considerable opportunities for surfacewater harvesting in Ethiopia, due ta the high levels of runoffwhich occur during the peak of the rainy season. Elsewhere in theworld where long dry seasons occur, maximum use is made of wetseason runoff. This is not the case in Ethiopia. The usa ofinnovative methods of irrigation practised in dryland environments,such as Australia, Israel and the United States are worthy o+investigation and trial in Ethiopia. These include keylineirrigation and water spreading. The use of small ponds forirrigation of vegetable crops at village-level is anotherpossibility which requires further investigation. Ponds builtusing ox-drawn scoops and communal labour have been demonstratedviable by ILCA and the MoA for domestic and livestock watersupplies. They have further potential +or vegetable and fishproduction.
7.2.11 Fisheries development
Considerable opportunites exist in Ethiopia to expand fisheriesproduction, with a view ta both domestic and export markets. TheRed Sea and Rift Valley lakes are excellent resources from which tobuild an industry which contributes significantly ta the economy.-Asia in and Europe offer opportunities for export, as other African.countries have begun to discover. The general location o+ suitablezones for fisheries development are indicated on map 2.
7.: POLICY CONSIDERATIONS
7.-3.1 General
Agri cultural policies generally have a more profoUnd effect onproduction than most physical constraints and potentials, becausetheir effect can be felt in a very short time frame. A number ofpolicy issues related ta the government's obiectives fordevelopment in Ethiopia are discussed below in relation to thefindings of the PSC analysis presented in Chapter 5.
84

7.3.2 The ten-year perspective plan
Development objectives in Ethiop a are laid down in the theten-year perspective plan, for the period 1984/85 - 1993/94. Inthis plan, agriculture is proposed to receive 22.5% of the totalinvestment of come EB 42 million. The plan's summarized obiectivesfor agriculture include:
food self sufficiency;satisfying raw materials requirement of domesticindustries;promoting producer cooperatives;increased foreign exchange earnings through coffeepulse and oilseed exports, improved livestock forbetter access to world markets, and substitution ofagricultural commodity imports (eg tea, tobacco);identify more accurately the country's naturalresources, and conserve and develop them;strengthen links between agricultural research andextension;expanding and improving settlement programs.
Production targets include an annual rate of increase of around5.7% for cereals, pulses and oilseeds. The area under cultivationwould expand by 1.6% annually,-implying that the remainder wouldcome from intensification. These targets are suggested as overlyoptimistic by the World Bank (1987b) as agricultural supportservi ces would have tc expand substantially to provide thefertilizer, improved seeds and other inputs necessary to achievethis goal. It also suggests that the lack o-f detail concerningproduction incentives, credit and input supply distribution is amaior weakness in the plan.
7.3.3 Agri cultural policies and their influence on production
6rain marketing and pricing
This is described by the World Bank (1987b) as the most importantdisincentive to farmers to adopt new technology. The incentive for_farmers tz produce marketable surpluses and "invest" inputs andlabour in improving their land iS largely tied to the economics of
'production and risk/reward ratio of their farming systems. Theexisting policies regarding grain marketing and pricing centre onregulated marketing of grain, including compulsory quota deliveriesby producers to AMC at fixed prices. The AMC prices haveeffectively remained static since 1980, and are less than 50% ofimport parity prices for the main grains (World Bank, 1987b).While providing low-cost food for the urban population, it acts asa disincentive for producers. Input and living costs have al soescalated since 1980 and the World Bar:: estimates that thepurchasing power of pricea paid to farmers has fallen by 7.4"/. sincethen. This is further exacerbated by restrictions on private andinter-regional trade. The P80 analysis shows there ia clear
Cr8

imbalance in food demand between regions which could be eased by afree movement of grain.
Coffee marketing and pricing
Coffee is marketed officially through the Coffee MarketingCorporation (CMC). However, the peasant sector currently accountsfor over 95% of production. It is estimated that about 40% ef theFOB price is obtained by producere, excluding a small additionalamount for exporters (World Bank, 19S7b). Improved production forexport is therefore unlikely without inereaeed producer prices.Some improvement might alsc be obtained if inter-reeional movementof labour for coffee harvesting were not restricted.
Land tenure
The high population pressure in many areas of Ethiopia has resultedin reduction in the size of the average land holdings over recentyears. Unless land productivity is increased this will result inan ever decreasing spiral of minimal subsistence, especially sincethe opportunities for generatine off-farm income are virtuallynon-existant in many ,4e, the mereinal production zones.Uncertainties reeardine redistribution of land within PAs, andcommunalization of land through PCs, has a tendency ts discourageinvestment in individual holdings, includine conservation (WorldBank, 1987t). It further encourages inveetment inste.ad inlivestock holdings, which has neeative feedback on conservation andland productivity in general.
7.3.4 Producer cocperative (PCs
The formation of producer cooperati ves IE encouraged as part of thegovernment's ten-year perspective plan. Incentives in the form ofinputs are provided to farmers to eneourage them to loin PCs.Recent pressure on land has encouraged farmers tm reconeider theirinitial reluctence to farm collectively, as the shortage of draughtoxen in many PAs can only be sol ved throueh shared resources. ThisiE one of the etrongeet reasons stated by farmers for ioining PCs,when interviewed by the LUPRD during semi-detailed surveys in Gojamand southern Shewa (FAO, 1987b,e)
,bespite the relative advantages of incentives and subsidies notavailable to PAe, PCs have not shown considerable productionadvantages over PAs. As all grain must be sold to AMC at fixedgrain prices, incentiven are also as limited in PCe as they are +orPAs. Provided membership of PCs is entirely voluntary, there is noreason why, with the advantageE of ehared resourcee, that PCscannot perform substantially better than they have in the paet.
7.3.5 Villagization
The main purpose of villagization is to improve community aceess togovernment services. Associated benefite include reduced soildegradation and eenerally improved land utilization. The process
86

at the time of writing (February 198e) is well advanced and theimpact of this policy is already being seen in some areas.Villigization involves the physical movement of households to oneor several central village sites within each FA. In theory th;nsesi tes will receive the advantages of certain servi ces from theGovernment, such as social services, roads, extension services andinput supplies, and so the overall cost of these shared resourceswill bring benefit to the majority of people at minimum cost.Apart from improved services, it is claimed by government thatrelief efforts in time of drought and access to modern methods ofcultivation, such as mechanization, will provide improvedproduction and food security. Families retain their existing plotsof land and livestock ownership remains individual.
During the translocation stage the process interferes withsubsistence production, simply because of the time taken tophysically relocate houses. Although attempts are made to timeoperations in such a way that they cause minimum disruption tofarming schedules, the process inevitably causes disruption. Thisis only acute, however, during the initial stages of transformation-from the traditional system to the new, but some disruptive aspectsdo linder. For example, farmers commonly have several scatteredplots. Previously, each one was within reasonable walkind distanceof his house, as that was part of the reason for choosing, his houselocation in the first place. With villagication taking place, moreparticularly in moderately populated areas, walking distance toplots is substantially greater, creating and an additional burdenfor farmers.
Rsettlement
Resettlement has been an ongoing process in Ethiopia since the1973/74 drought and the ensuing famine. Some 46,000 families wereresettled by the RRC, formed after the drouoht, in the tan years to1984. With ths devastating effects of the more recent droucht in1984, the Government has intensified itE resettlement efforts aimedat including some 700,000 families in one year.
There i5 some doubt regarding the self-sustaining capacity of theoriginal settlements, but some have been reasonably succeEsful."Considerable international criticism has been levelled at the ScE-for hasty and non-voluntary settlement procrams in the past, butthe need for redistribution of ths population in marginal regionsiB no longer in doubt. The PSC model substantiates this need.Employment opportUnities in sectors other than agriculture ara alsoscarce in drought prone areas, offering no alternative to
out-migration if the population is to survi ve. The problem is tofind the least-cost alternative to resettlement, in itself anexpensive operation (EHRS, 198), or to at least minimize the :getto the economy of resettling people.
Expansion of cultivation through vol untary migration, supported byGovernment, would seem a desirable solution at this time. Si te
selection for new, sustainable communities should be the
87
responsibility of the GoE, as technical competence for this purposeexists within its various ministries. Unfortunately, this willplace additional strains on already overstretched manpowerresources in the Government.
Considerable emphasis should be placed on soil conservation inconjunction with new concentrations of population, especially inwestern Ethiopia where the environment is' more susceptible toerosion damage from intensive rainfall once the dense naturalvegetation cover is removed. Nev settlers siso need Governmentsupport until the settlements become self-sustaining, but silefforts should be made to encourage this at the Earliest possibletime after their relocation.Resettlement is, unfortunately, s temporary solution to alleviate amore fundamental problem, over-population. Unless populationcontrol measures are taken and agriculture made more producti ve,food demand will outstrip production by 2010 and the populationwill again face a food crisis without additional land beingavailable for the Expansion of cultivation and resettlement.
7.3.7 Mechanization
The extent of land suitable for mechan cation is discussed earlierin this chapter. The GoE wishes to expand mechanization, mainlythrough the use of tractors (World Bank, 1985b). The mainconstraint this imposes on the economy iS the need for foreignexchange to purchase and maintain the equipment required. Withindividual peasant holdings diminishing in size, the use oftractors without collective +arming would seem contradictory.Al so, since labour is concentrated in the agricultural sectoralternative employment must be found for those displaced bymechanization. The non-farm economy is not yet growing at asufficiently high rate to accommodate this movement acoording tothe World Bank.
With only 4.9% of the country suitable for large-scalemechanization, it may be more appropri ate to consider forms ofmechanization other than tractors. Many developing countries, forexample, have had success with hand-held cultivators. Research inthis direction might be considered as this form of mechanization isapplicable on much stonier and steeper soils than are tractors.Any increase in mechanization should relieve draught animalrequirements and, therefore, livestock numbers, with concomitantbenefits for land management. Given the cultural ipportance oflivestock for other than draught, this is unlikely in practise. Onthe deficit si de, the cost of equipment and spare parts +ormechanization must still come from foreign Exchange reserves.Training in maintenance ski 11e would al so have to be expanded tosub-Regional level, and possibly SC-level, to make such a schemepractical.
7.3.B State Farms
State farma are vigorously promoted by the GoE. Their inefficientuse of capital and high percentage of skilled manpower required to
88

operate them has rai sed questions about the wisdom of expandingthis sector of agriculture without first improving theirprofitability (World Bank 1987b). With high levels of skilledmanpower and considerable financial resources, their role isprobably best confined to specialized aspects of agriculture wherethey have a comparative advantage, such as cotton production,industrial and commercial crops, improved seed production, andlivestock improvement.
7.4 INSTITUTIONAL ISSUES
7.4.1 General
To take full advantage of resource potentials in Ethiopia and toovercome the physical conetraints limiting producti.on, not onlymust policies stimulate the agricultural sector, but infrastructureand institutional support must be available to put the policiesinto effect. Some of the mora significant institutional issues arediscussed below.
7.4.2 Land use planning
Scope ex sts in Ethiopia for land use planning at many differentlevels; from reconnaissance studies conducted on a national scale,to village level planning. At its inception in 1978, the LUPRD wasgiven, among other things, the mandate to carry out land-usestudies, land registration, prepare directives for policydecisions, and to regulate land-use.
Over the past 10 years, the LUPRD has only carriec out functioneconnected with the first of these oblectivee, by conducting landuse studies. The fledgeling department has, unfortunately, not hadsufficient experienced staff or time to become involved in theother areas suggested in ita charter.
Most land-use studies so far carried out by the LUPRD evaluate thepotential of land f or agriculture. Suitably generalizedreconnaissance studiee of ths entire country have been conducted-with the assistance of the FAO/UNDP, AssistanCe to Land UsePlanning (Phase 1) proiect. Several semi-detailed studiee, whichcover areas of around 700,000 ha each, have al so been completedwith FAO/UNDP assistance (Pheese II).
These studies provide gui dance on land potential for experiencedplanners, but do not constitute land use plane whioh can beimplementad on the ground. To realize potentials, sugeestedimprovements such as al ley cropping, conservation worke, or cloeureof hillsides to livestock, will not be attempted by farmers unlessadequate consultation iE maintained between farmere and planners,and the benefits of alternetive technologies are demonstrated.Thus, a need still exists in Ethiopia +or systematic, 'erass-roots'land use planning to the enable the widespreed implementation ofimproved agriculture.
89

Some attempts at more detailed planning, in both sub-catchments andat SC level, have been attempted by other departments of the MoA(eg SWCCFMD and FLDF), but there iB a clear requirement for thecoordination of these efforts, a role ideally suited to the LUPRD.Serious consideration should, therefore, be given to , ttachingadditional arms to the LUPRD, to develop land use planning methodswhich provide SCs and PAs with suitable assessments of theirresources and advice on land use.
Only by making use of the regional network of skilled staff in theMoA and cooperation of SCs, can significant chance be made in thaagricultural sector over extensive areas of the country in theshort to medium term. Otherwise, the pool of skilled land useplannino staff will be too small to provide sufficient coverage forsmall-scale plannino. Fortunately, the baeic skills to trainAwraia staff in the fundamentale of conducting sufficientlydetailed, yet generalized, surveys of SCs and PAs, already exist inthe LUPRD.
7. 4. ReseEtrch
IAR. This ie the Governmental oroanilation in Ethiopia withprimary responsibility for research. Most of the research isconcentrated on plant breedino, particularly of cereals andcoffe,s. Limited information, however, is available on the natureand potential of local cereal varieties. In most instances, theadvantages of improved varieties over local varieties have not beenadequately demonstrated in adaptive trials off research EiteE.Research in food crops thus tends to demonstrate what is possible,rather than what is feasible for smallholders, who constitute 95%of farmers.
Dissemination of technology is al so a problem, because ofinadequate linkages between researchers and extension (World Bank,1987t). In particular, reeearch is most often aimed at the highinput farmer, primarily state farms, and conducted in isolationfrom extension, which is aimed at the smallholder. More adaptiveresearch i5 therefore recommended by the World Bank (1987b),-particularly since most production comes from smallholders and,modest improvements in this sector promise the greateet nationalgains in the short to medium term.
rLcA. Of the non-Governmental oroanizations carrying outagricultural research in Ethiopia, ILCA is by far the largest andmost relevant. Research is not confined to livestock per se, buttouches on production syetema in which livestock are en integralcomponent, which appliee to most farming systems in Ethiopiaanyway. Consequently, a number of cooperative programe totransfer improved technology to farmers are already in operationbetween ILCA and departmente of the MoA.
Relevant research programs at ILCA include: the Vertisol program,intensification of cropping systems - including alley cropping,
90

ox-traction studies, pond construction utilizing oxen-drawn scoops,animal health and nutrition studies, improved animal productionsystems, drought monitoring and pastoral system studies.
7.4.4 Extension
Prior to 1979, extension was carried out through EPID and includedMPP projects sponsored by IDA and SIDA. The irst project, MMPI,was limited in extent to readilly accessible areas in highpotential zones. MPP1 is considered a SUCCESS by the World Bank(1987b), but the unfavourable terms of trade said to exist by thetime MPP2 began reduced incentive to adopt new technology andlessened the impact of the second project. However, EPID isgnerally considered to have been a success up until it wasdisbanded in 1979. Extension activities have since been carriedoLt by the ADD.
ADD operates through Regional and Zonal offices, spreading theconcentration of suitably trained extension staff throughout thecountry. At the time of writino (February, 1988), the MoA waspreparing to again reorganiza accordind to new administrativeboundaries based on 25 Redions and 4 Autonomous Regions. This maycause -Further, temporary tisruption to the extension service whichis already hampered by shortages of skilled and experienced staiFf.
For extension to be more effective, some concentration of manpowerresources to areas of high potential has been sugoested by theWorld Bank (1987t). In addition, improved linkaoes with researchand SC level planning activities would greatly accelerate thetranefer of proven research resulte to farmer 's fields.
7.4.5 Supply and distribution of inputs
AISCO. This is E relatively new, sami-autonomcus ordanizationwithin the MoA. Formed in 198Z, it began operations in 1965.AISCO is responsible -For estimating input demand, procurement anddistribution of inputs, such as fertilizer and pesticides, for thepeasant sector. In addition, it iB responsible for the storage anotransportation of all agricultural inputs.
-AISCO currently acts as an importer and wholesaler and plans exist+or further decentralization of retail sales to PA and PC membersthrough SCs. The World Bank (1987b) recommends AISCO regionalizesupply and distribution of inpute and progressively transfer MoAmarketing to SC ownership and operation.
ESO. This oroanization has responsibility +or producing improvedseede for both the state and peasant sectors. It is estimated thatonly 2% of farmers use improved seeds (World Bank, 1987b). Mostsales of improved seeds are made to state farms (ovar 60%). Seed
production is largely carried out on state +arms and only limitedamounts of certified seeds are produced. In the paet most seed hasbeen classed as improved and not certified. However, the number ofcertified new varieties coming from IAR has been limited according
91

to the World Bank.
More coordination between IAR, MoA, and AISCO and the extensionservice will be requi red before the full benefit can be gained fromimproved seeds.
7.4.6 Agricultural credit
Government sourced credit is available through the AIDB, CBE andAISCO. Private savings channeled through and informal networksupplement that available through Government. Of the creditextended to agriculture in Ethiopia through the AIDB, the peasantsector receives only 4%, with the major share (40%) going to statefarms (World Bank, 1987b).
According to the World Bank, AIDB has 5er ous arrears problems,creating cash flow difficulties. The reasons include cid inactiveloans, inoperative loans to state farms, operating weaknesses inthe banking system, unfavourable economic conditions for thepeasant sector, and operational problems in industry. Loan statusin relation to coffee cooperatives i5, however, generallyfavourable.
Input credit, to the peasant sector has so far been administered bythe MoA, with the AIDB providing funds. In the uture, the CBE mayprovide credit to agriculture, but does not presently do so. SCsara increasingly a channel for input credit and development fundsfrom AIDB for investments such as oxen, flour milla, and atoras.The marketing and input credit role of SCs is particularlyimportant in coffee marketing and providing advance funds tomembers for cereal purchases by AMC. Improved adcounting andadministration in SCs will be of particular importance to AIDB andother credit organizations in the futura.
92
B. CONCLUSIONS AND RECOMMENDATIONS
8.1 GENERAL
8.1.1 Global issues
The work undertaken during the MLUP has highlighted severaldisturbing trends; which ara undermining not only economic progressin Ethiopia, but will challenge the well being of individualfarmers throughout the country over the coming 10 to 25 years. Inparticular, the population supporting capacity analysis indicatesthat population pressure will raise the demand for food and energyresources to levels which cannot be met, at present levels ofproductivity, by the simple expansion of cultivation. This canonly result in a declining spiral of nutrition and welfare,exacerbated by the inevitable effects of periodic drought, unlesssignificant cnange takes place in the agricultural sector in theshort to medium term.
The overriding recommendation lE therefore that resourees should beallocated immediately towards achieving the long-term °electives ofincreased adricultural output, decreased population growth, anoincreased nutrition and welfare levels. Many of the suesequentrecommeneations ara directed towards oenereting these outoomes,either throudh direct impact or through creating an environmentconducive to these developments.
8.2 ECONOMIC AND SOCIAL CONDITIONS
8.2.1 Population and food demand
If present population trends continue, the population of Ethiopiaby 1995 will be 57 million inhabitants, and 95 million by 2010.This compares with 42 million in 1985. Depending on assumptionsmade regarding economic growth in the intervening years, tetween 2and 3.4 times as much food will be required in 2010 than in 1965.That is, between 1: and 22 million tonnes of grain equivalents.
_To meet this demand, with increased consumption levels to provideadequate nutrition, would require an economic growth rate of around
'5% in the agricultural sector and 8% in the non-agriculturalsector, over a period of 25 years. Growth ratas this high haverarely been achieved in the developing world, let alone sustainedover such a long period, even in those countries with substantiallygreater irrigation resources than Ethiopia. Development goalswill, therefore, need to be set at more realistic levels.
Reducing population growth by 1995 would lower food demandsignificantly by 2010. A reduction in population growth, forexample, from 2.9% to 2.7% per annum by 1995 would result in 15
93

million leee people to provide for in 2010. It iE thereforerecommended that urgent consideration be given in Ethiopia ..toaetabliehino a population control policy which encourages reducedpopulation growth at the earliest possible time. However,decreasing population growth al so requiree improved economicgrowth, in order to increase nutrition, health and education, anothis is only poesible if prevailing economic conditione permit.
It iE also recommended that areas with continuing histories ofdrought and crop failure receive immediate aeEistance in relocatingsignificant numbers of families, preferably under a voluntarymigration programs aeeisted by Government. This is a temporarysolution to the problem of increasing population, but a necesearyone as history indicatee and the PSC analysis supports.
8.2.2 Rural income generation
Rural incomes: provide an alternative tz total dependence onsubsistence agriculture. Incomes can be improvec by extension ofthe crop and livestock sectore, infraetruptural development andpromotion of rural industries- Inoreasec emphasis should be di ver'to ths implementation of these options, but care rizz=ds to beexercised that emphasis on programs such as 'fcon-for-work ogeenot dieplace farm labour too apruptly and undermine localagricultural production. Various opportunities for rural inoomegeneration are identified later in this chapter.
8.2.3 Land tenure
Becauee of the threat of periodic redietribution of land in FAE, asa reeult of increasing population and/or the formation of PCs,farmers are reluctant to trsat their assioned lano as an invesLmentworthy of conservation effort and inputs which will improve itslong term productivity. The redistribution of land must beminimized if per hectare production is to rise in the medium talong term.
8.3 ENERGY CONSIDERATIONS
8.3.1 General
-. Anal of the demand for fuelwood carried out by the MLUF MiEE1OMindi cate that Ethiopia lE currently in a crisie situation withregarn to availability of energy for cookino and rural constructionmaterials. The estimated nst demand for wood over availability ofover 55 million m"Vannum by 2010, innicatee the magnitude of theshortfall in available resources. Alternative energy eources tofuelwoon have not yet been demonstrated viable in Ethiopia, otherthan ths burning of animal dung, which has negativa feedback onsoil nutrition anC agriculture in general. An ensroy policy whichtakes account of theee shortcomings must be formulated in the shortterm to offset degranation of remaining resources-
94
8.4 MAIN CONSTRAINTS TO AGRICULTURE
8.4.1 Main physical constraints
The main physical constraints to agriculture identified by tha MLUFmission i nclude:
Limiten and variable mo sture availability for crops;Vertisols;Shallow, stony soil ;
- Soil degradation;- Steep land;
Malaria infestation;Tsetse infestation;
These +actors primarily lliit expansion of the area undercultivation in Ethiopia. Each is discussed in greater detallbel ow.
Moisture availabilit
Below a limit of 60 days DGF there is little that can be doneovercome lack of available moisture for crop produotion, other thanthrough irrioation. However, it is strongly recommended thatresearcn be gin immediately into the potential for short seasoncrops ann cultivars in the marginally arable (ie with 60-9f1! nav GF)zone of Ethiopia. Demonstration trials to indicate theopportunities for intensification of agriculture through better useof available moisture in more secure cropping zones is al sorecommended.
Recurrent drought is an i nevitable feature of the environment inEthiopia, but it must be monitored more effectively and improvedprovision made to ameliorate its devastating effects. Upgrading ofthe meteorolonical network to provide more timely and extensivecoverage iS a first step in better drouoht monitoring. Inputs frommeteorological satellites can al so assist. Strateoies to limit theeffect of drought must include expansion of the rural road network,development of adequate storage facilities and strategic reservesof grain. Much of Ethiopia will continue to experience droucht,but degrading farmlands and rising population will exacerbate its-effects unless the suggested improvements take place in under 10Years.
V -ti o
Systems of management are available which can render Yertisols moreproductive than lE generally the case in Ethiopia. In particular,the use of broadbeds and furrows should be encouragen throughextension and SC level planning efforts. There must be incentive,however, through improved terms of trade and greater security oftenure, before farmers will use Vertisols for other than communalgrazing lands.
95

Shallow, stony soils
The considerable extent of severely degraded lands in northernEthiopia, where shallow, stony soile predominate, cannot supportthe population currently living there. This is evident from thecontinuing susceptibility of the region to famine and the clearindications in the MLUP analysis of the low population supportingcapacities in northern Ethiopia.
Outmigration, reafforestation and hilleide 'closure to livestock,combined with cut and carry orage production, are recommended inconsultation with farmers. Research into the possible introductionof drought resistant perennial crops and innovative systems ofsmall-scale irrigation is further recommended.
Steep lands and soil degradation
Steep lands are generally foremost among those susceptible toaccelerated erosion and for conciseness are discussed here togetherwith soil degradation. Although the most serious effects of soildegradation in as yet productive lands will occur in more than 25years, the seriousness of the long term problem should not beunderestimated.
Action muat be undertaken immediately to arrest accelerateddegradation, particularly in those Awralaz where is has beendemonstrated to be most severe (see Annex 2). Improvements can bemade through intensive conservation programs, but emphaeis shouldbe placed on the need to use methods such as alley cropping, whichincreaae productivity while at the same time conserving soils.Without increased production, farmers will lack the motivationnecessary to voluntarily participate in conservation programs.
Systems of agro-forestry ere recommended for steep lance, makingfull use of perennial crape, livestock exclusion and cut and carryforage production where poseible.
Malaria infeetation
It iE recommended thit malaria control programs be intensified inthose areas of the country where hidhland families are beingresettled. Highland peoples have little resietance to thie diseaee,and serious outbreaks of malaria in new villagee have the potentialto decimate the population at some stage in the future.
Tsetse control
Cultivation in newly settled areas in the western regions ofEthiopia will remain dependent on animal draught systems for thenext '25; years. The control of trypanosomiasis iE therefore vitalto the future expansion of cultivation in these localities.Control on a modeet scale has been demonstrated in Ethiopia, butthis program must be stepped up to ensure sustainability ofagriculture in the western zone. This should be a priority
96

activity associated with the resettlement of farmers from otherareas of Ethiopia.
8.4.2 Terms of trade
To sti'mulate the intensification of land U5E the terms of tracemust be improved in the agricultural sector. This can beaccomplished by:
- providing a more efficient and timely supply of inputs,possibly coupled with input price adiustment by Region,to stimulate regional specialization based on differencesin production and transportation costs;
- modifying the role of the AMC from acquiring obligatoryquotas from producer and services cooperatives, andpeasant associations, to a buyer and seller of lastresort; the AMC would set a floor price for farmers anda ceiling price to consumers, thereby stabilizingmarkets and avoiding excessive marketing margins totraders;
incresaind the AMC pricee to levels more in line withmarket prices;
allowinc tracern tz buy directly from peasantstnroughout the country;
allowinc all acricultural prpducte to te moved andnrz,H.7,,,d freely between regionn, and
improving the availability coneumer dmads in localmarketind centres throughput the country to provideincentive for peasants to earn Ca...Eh income, and todiecourage ths buying of animals: with surplus cash, a
stratecy h: oh drives up animal prizes and increasesland dedradation.
8.4.7 Inetitutional iEEL'.Es
Availability of reeources and appropriate'policien to stimul ate'production will have little effect without the nezeesary-infrastructure and institutional capacity tO implementimprovements. Several important issuen are dincuesed bel o.
Land USE plannind
There iE an urgent need for drann-roots level, land U,Er.: planning inEthiopia. A SC le-el, consultative planninz sdheme similar to thatbeinz investicated by the FLDE could be coordinated ty the LUERD,with appropriate inputs from other departmente of the MoA. This isa role well suited to the LUERD, tut staff and faoilitiee arslimited and it iE recommended that consideration be di-en to
97

attaching additional staff to the LUFRD to train Awraia level etaffof the NoA to implement land use plans on the ground.
It is al so recommended that conaideration be given by the LUFRD tothe including land utilization types with modest technologicalimprovementa which are attainable by peasant farmers, in additionto the high and intermediate levels currently used by thedepartment in semi-detailed land evaluation studies.
Research and extension
It ia recommended that more adaptive research be conducted by theIAR and that thie include detailed inveEtigation of the potentialof local varieties of crops. In addition, investigation of thesuitability of short Eeason crops and cultivara in the considerableextent of marginally arable land in Ethiopia. Cooperative researchbetween the GoE and non-governmental organizations such SE ILCA ista be encouraoed.
Improved di scemi nation of research resulte to the extension serviceis recommended, to ensure that the benefite of research reachfarmers' fields at the earliest posaible time. This will alaorequire improved links. between extension and grasa-roots, levelland use planning. Some concentration of extension staff in areasof potential will be nery in the future to avoid ths currentdilution of manpower resources. AsEiatance for staff training mustalso be a priority.
Supply and distribution of inputs
The small percentage of individual -farmers. using inputs such asfertilizer, herbicides_ and improved seeds is indicative not only ofthe cost, but of poor supply and distribution on a national scale.These factors muet be improved, together with the availability ofcredit, if the smallholders presently responsible for 95% of thefood production in the country are to achieve substantialimprovementE in productivity.
8.5 POTENTIAL FOR IMPROVED CROP PRODUCTION
B. i General
-Resulta of the ESO analysis indicate that there is enoughpotentially arable land in Ethiopia to extend the cultivated areaby 2 to 3.4 times. the current area. However, the land requi red tzfeed the oxen Lt.:sad for drauoht and supporting liveatock has beenestimated at 1.7 times that required for human food production.a'reeult, there iE insufficient land to feed both the proiectedhuman population and the livestock at current levele of food-cropand forage prodJ_Lction. It iE thuE imperative to'intensifyagriculture by increasing yields and by raising the feedavailability for liveetock.
98
C2 Intensification of crop production
Legume-based technology
The high economic cost of fertilizer suggests that legume baeedtechnology offers a more economic alternative which could be easilymanaged by farmers, but basic rese,arch is required beforewidespread introduction of the technology could be attempted.Appropriate research should therefore be undertaken by the IAR atthe earliest possible time. The success of such technology willaleo depend, to a large extant, on the introduction of policieswhich etimulate farmer incentive.
Herb ici das
Production losses due to weeds are very significant in Ethiopia.Considerable gains can be made by the use of herbicides becausecurrent weeding practices, especially in the small grain cerealE,are insufficient to contain the weed problem.
There is potential for the local manufacture of herbicides whichwould alleviate the cost and encourage more widespread use of thetechnology. if pre-emergence herbicides are used other advantagesinclude reduction in the number of ploughings when preparing theseedbed and consequent reduction in peak draught oxenrequirements. The risk of soil degradation 1s al so reduced becausethere are shorter periods when the soil is bare and unprotectedfrom eroEive rainfall.
Intensified management systems
Additional means are available to raise the productivity of rainfedcrop production in Ethiapie, through more intensa ve landmanagement. They include inter-or:3point, relay croppinc,undereowing and al ley cropping. All of these systeme make betteruse of available moisture. Although there is potential tointroduce all of these systems in different circumEtanceE, thepotential of alley cropping is particularly high and thereforediscussed in more detail.
The growing requirements for food, livestock +crate, fuelwood anothe need for soil coneervation, indicate that alley cropping could'well provide sionificant gains in all D-F theee areas if introducedon a wide scale in Ethiopia. It is therefore strongly recommendedthat appropri ate incentives and extension assistance be provided tofarmers to encourage the introduction this technology wherepossible.
6.5.73 Crop diversification
The land suitability asseesment conducted by the MLUF inticateethat there is considerable opportunity for diversification of cropsand farming systems in Ethiopia.DiverEification offers a greaterdegree of protection from the effects of diseases, peet attack and
drought than dependence on a monoculture or limited range ofcrops. However, basic research and incentives to produce a widerrange of crops and cultivare are required before a greater degreeof diversification will become attractive across the board tosmallholders in Ethiopia.
One area of potential diversification in Ethiopia which deservesemphasis is the expanded production of roots and tubera, includingenset. Per hectare yields suggest vastly more favourable returnsin terms of carbohydrate than cereal a. Drawbacks are that rootsand tubers are mainly suited to higher rainfall sones andbiproducts for forage are limitad +or trope' other than sweet potatoand enset. There social acceptance is also generally les.Despite theee limitations it is recommended that farmers beencouraged to include more roots and tubers in rotations with morefavoured cereals.
8.5.4 Coffee and other rainfed cash crops
Coffee
The coffee sector can provide an important source of income to asignificant eection of the rural community as well as to thoseinvolved in itE marketing. A number of Awraias identified in theESO analysis as over supporting capacity have high levels of ruralincomes derived from coffee, which ensures their survivalindependent of subsistence food production. Currently, localdemand is suppressed by price poi i. Potential exists for furtherdeveloping export and-domeetic markets, but production is limitedby various factors-
It is recommended that iseuee suppressing production, such aslabour availability, taxation and marketing be inveetiosted todetermine their impact on yields and the necessary correctiveactione taken. It 15 al so recommended that those Awraias withcoffee potential be further investigated to identify suitablelocations for production by Peasant Associations and ProducerCooperati ves.
Other caeh crops
Other cash crops with potential for increasing rural incomesinclude, grape, olive, cotton, sugarcane, sisal, oilseeds, fruitsand vegetables. In semi-arid areas, incense production ispossible.
All of these crops are suited to production in PCs and SCs, where asmall amount of preliminary proceeeino can be organi sed to betterutilize available labour and increase rural incomee- .Aninveetigation into the potential for such agri-industries,particularly in drought prone areas where dryland perennials euchas sisal can be grown, should be inetigated to seek outalternatives to out-migration.
100

8.5.5 Irrigation
Existing studies suggest more than 2 million hectares are suitablefor medium and large-scale irrigation development in Ethiopia.However, this figure includes includes substantial areas ofVertisals which require specialized management and equipment tosustain productivity. In addition, the development and managementcosts of recent irrigation schemes has proven to be high and thetime for development considerable. Despite these drawbacks, largeand medium-scale irridation of cash crops should be initiated whereit can be demonstrated to have economic potential.
There are al so substantial opportunities +or small-scale Irrigationdevelopment, utilizing water harvesting, diversion schemes.- andgroundwater development where appropriate. Developments of thiskind should be given priority for credit throudh PCs and SCE, whereshown to be sound.
8.5.6 Mechanization
Because of the high foreign exchange costs involved, limitedmaintenance facilities, an excess of labour, and limited arPaasuitable for laroe-scale mechanization, it is recommended that theuse of tractors be confined to state farms and cooperati ves in theshort to medium term. It is further recommended that research tEinitiated on the potential of alternative forms of mechanizationsuitable for peasant farmers, such as hand-held cultivators.
8.6 LIVESTOCt PRODUCTION
8.6.1 General
Livestock are integral components of most armino systems inEthiopia. Their primsry role is for draught power in the cropzone, but they fulfill a multitude of other roles, ranoing from ameans to store of wealth, to transport. Pastoralists in thelowlands of Ethiopia ara wholly dependent upon livestock forsurvival.
One of the most important difficulties facing the planning ofthe livestock sector, is the lack of reliaale statistics on thetypes and distribution of livestock, details concerning locallivestock productivity and the value of indigeneous forage species.
8,6.2 Feed reeources
Existing +oracle production 1E both low in quality ano quanti ty,because of neavy over-use and lack of management of grazingresources. There appears to be no short term solution to largescale improvement of communally owned pasture and rangeland.
101
More intens ve crop production, utilizing systems such as alleycropping where forage production ia an integral component of thefarming eyetem, offer promise of better nutrition for liveetock.Undereowing and overeowing of forage spec:es, tmeether with theintroduction of early planted leeuminoue foragee which form part ofgenerally inteneified use of available moisture, eguld aleocontribute ueefully to improved liveetock nutrition. Hillsideclosure and cut and carry feed systems al so offer improved feedresources, through the positive feedback from reduced grezingpreeeure and subsequent degradation of land. Both systems arerecommended +or wideecele adoption in Ethiopia.
B.6.7 Health
Livestock are sublect to a multitude of paraeitic and infectiousdiseases:, many of which can be managed through environmentalcontrol or veterinary aeeistence. Livestock imprevement inEthiopia will be difficult without e simultaneous attack on pestsand dieeasee which reduce animal productivity.
Of the diseases present, trypanosomiasis is the mzet significant inreducing the expansion of livestock production in the country.Efforts to control Tsetse +lice, vectore of the diseeee, heve teensucceeeful in western Ethiopia, but the progrem muest be expanded tecope with the liveetoek requirements; of new eettlera in thie zone.Existing veterinary progrems in the NoP, muet likewise be uggretetta cope with the increseeine demand for aesietance from the peaeantsector.8.6.4 Improved livestock productivity
The limited genetic potentiel of local livestock, whioh ere bred asmuch for survival es preduction, euggeste that e dramatic responseto improved nutrition will not be fortheoming. However, ueefulimprovements in draught capability and meat preduction may teposeible through selecta ve breeding within indigenoue cettle, andpossibly cross-breedine. Selective breedine of sheep +or Improvedmeet and wool produotion is el se poeeible, but croee-oreeding withexotic animals muet be further investimated to estetlish the mmestdesirable optione. Thie is aleo true in specieliced areas of-production euch as dairy. No eeins will be made, however, unleee
,provieion +or the neceeeary research is made.8.6.5 Dairyine
It is recommended that dairy development be directed towardeeatiefying domestic demand initially within the framework of theexisting livesetock sector. Even though individual productionlevels are likely t6 be low, establishment of producer confidencewill result in the demand for neceseeary inputs and eubseguentdevelopment. Followine establishment of dairy production on amodest scale, locations where conditions are suitable cen beselectively upgraded through extension and the use of improved,
102

cross-bred dairy stock, and on-farm processing of products.
8.6.6 Livestock and land degradation
High livestock densities cause degradation directly through mechanical damage tothe soil and indirectly through removal of protective vegetation.These factore result in increased runoff and erosion. The laroenumbers of livestock, particularly in highland Ethiopia, areintimately involved in the spiral of land degradation affectingmuch of the country. Reducing livestock densities on grazinb landsis the only way to limit the problem. Hillside closure, cut andcarry forage systems, and stall feeding of livestock is recommendedin areae suffering from livestock induced land degradation.
8.7 DEVELOFNENT AND FFESEFVATION OF UNIQUE RESOURCES
8.7.1 General
Ethiopia lE gifted with unique ecolooical resources which also havethe potential to generate foreign exchange if managed effectively.These include forest and wildlife resourcee, and water raEourcassuitable for fisheries development.
8.7.2 Forest resources
Forestry contributes tz the economy in Ethiopia in three main ways:
soil coneervationsubsistence requirements for fuelwood and buildingindustrial products for the growing economy.
Of these, the subEistence requirement for fuel places the orez,estdemand on the existino foreet and woodland resources. Because ofthese demanda, and land clearance for cultivation, little remainsof ths closed, high forest in Ethiopia and this is a uniqueresource which should not be allowed to further degrade throughindiscriminant harvesting of fuelwood. It is therefore recommendedthat management policies te drawn up by Government for the statemanagement of each of the remaining areas of high forest before-further degradation of these resources, takes place. Implementation,of these plans will require cost and effort, but the value ofconservino the remaining forests in terms of their contributions tosoil conservation, wildlife management, and as a future source ofindustrial wood products are considerable.
8.7.3 Wildlife
International tourism is not currently a maior contri butor toforsion exchanoe earnings in Ethiopia, but potential exists tochange this Eituation in the medium to long term throuohdevelopment of wildlife resources. Kenya has managed to do thisvery successfully, and with appropriate management Ethiopia could
103

eventually benefit in a similar way tm its neighbour. It iatherefore recommended that development -funde be sought to upgradethe development of national parka ant wildlife reaources, with eneventual aim of increaoing earnings from tourism. Long termplanning for the upgrading of tourist facilitiea such as hmtela,and restoration of national monumento and other tourist attractionsto ensure a comprehensive package for potential tourists is el sorequired.
8.7.4 Fisheries development
The Rift Valley lakes and the Red Sea are of high potential- f-,fisheries development. There is a substantial domestic demand forfish in the mejor cities which is influenoed by the religiouacalendar. Thio demand could be expended if appropriate production,marketinm ene supply policies are initiated. Export potential is,on the other hand, largely untapped. It io strongly recommendedthat exiating surveys of aquatic: reaourcea be updated at theearliest p000itle tima, while at the same tiME an inveoti ation ofthe export potential of fish and crustaceans be initiated.
104

AACM1986
AACM1987
CSO Report on the household energy consumption survey of1984e Addis Ababa. Addis Ababa, Central Statistical Office.
CSO Time Series Data on area production and y eld of1984b principal crops by regions 1979/80-1983/84 ONCCP,
Addis Ababa,
CSO Population of Weredas and towns, by sex, and average1985 household siza based on the preliminary census
results; and population projections by age groups andrural-urban for total country and regions: 1984-1985.Addis Ababa, Central Statistical Office, 1985. (CensusSupplement).
CSO Peoples Democrat c Repubulic of Ethiopia, Facts and1987 Figures. Central Statistical Office, Addis Ababa.
EHRS1986
-Gryseels,- 1936
BIBLIGRAPHY
Crop responces to fertilizer, Ethiopia 1967-1985.Agricultural Development Department, Ministry ofAgriculture, working paper No. 6, Austral janAgricultural Advisory Team, Addis Ababa.
Assessment of agricultural land suitability in Southeastern, Southern, South-western and Western Ethiopia.Report to the Government of Socialist Ethiopia.
Personal communications
D. and R. Fishwick. Fuelwood consumption anddeforestation in African countries. World Bank staffworking Paper Number 704. The World Bank WashingtonD.C..
Ethiopian Highland Reclamation Study. Final reportVolume 1 and 2. Rome, FAO, 1986 (AG:UTF/ETH/037/ETH).
G., F.M. Anderson, J.W. Durkin and Getachew Assamenew.Draught power and smallholder grain production in theEthiopian Highlands. ILCA, Addis Ababa, 1986.
FAO Agricultural commodities proiections 1970-1980. Rome.1971
FAO Report on the Agro-ecological Zones Project, Vol 1,
1978 Rome.
FAO Ethiopia: Interim Report: Coffee and Tea Development1983e Planning Project No. AG:DP/ETH/77/014, Rome.
105
ADD1988
Anderson1984

106
FAO Methodology used in the development of a soil loss ratemap 1983b of the Ethiopian highlands. In: Assiitanceto land use planning,. Field document 5,AGDP/ETH/82/010,Addis Ababa.
FAO Geomorphology and Soils, In: Assistance to land use1984a planning, Ethiopia, Field Document 2, AG:DP/ETH/78/003.
Addis Ababa.
FAO Agroclimatic resources inventory for land use planning.1984b In: Assistance to land use planning, Ethiopia. Technical
Report 2, AG:DP/ETH/78/003. Rome.
FAO Land use and production systems. In: Assistance ta land1984c use planning, Ethiopia. Technical Report 4,
AG:DP/ETH/78/003, Rome.
FAO Ethiopian Land evaluation. Part two: land evaluation1984d types. AG:DA/ETH/78/003, Technical Report 5, part two,
Rome.
FAO Forest Resources and Potentrial for Development.1984e AG:DA/ETH/78/003, Technical Report 7, Rome.
FAO Ethiopian Socio economic evaluation of the current1985 land-use in the Borkena (Welo) study area. Technical
report 8, A6:DP/ETH/82/010, Addis Ababa.
FAO Ethiopia. Economic analysis of land use.1986a AG:DP/ETH/78/003, Technical Report no.S, Rome
FAO Ethiopia Socio economic evaluation of the current1986b land-use in Bichena (Gojam) study area, Field document
11, AG:DP/ETH/82/010, Addis Ababa.
FAO Manual on a computerized land evaluation system with1987a special reference ta the Highlands of Ethiopia.
Vol I: Land evaluation methodology, Field Document 16,Draft, Addis Ababa.
FAO Socio-economic evaluation of the current land-use and'1987b farming systems in the Hosaina (Shewa) study area.
Field document-14, draft, AG:DP/ETH/82/010, Addis Ababa.
FAO Ethiopia Assessment of the 1987 food supply situation.1987c Office for Special Relief Operations. Report of the
FAO/WFP/Multidonor Mission, OBRO: Report No. 05/87/E,Rome.
FAO The influence of environmental conditions on plant1987d growth and development. Field Document 18, Draft,
AG:DP/ETH/82/010, Addis Ababa.

FAO Land evaluation of the Bichena Study Area (Gojam).1987e Field Document 19, Draft, AG:DP/ETH/82/010, Addis Ababa.
FAO End-of-Assigment Report: Farm Management, based on1987+ the work of J.A. Wicks TCP/ETH/6668,
Food Strategy Task force. National Food Strategy for Ethiopia.1987g Office of the National Committee for Central Planning,
Revised Draft, Addis Ababa, *July 1987
IMF Ethiopia: Recent Economic Developments, Washington D.C..1983
MoA General Agricultural Survey Preliminary Report 19E33/841984 Vol.II. Planning and Programming Department Ministry of
Agriculture, Addis Ababa.
Mohr The Geology of Ethiopia. Haile Selassie I University1971 Press, Addis Ababa.
Schaller, K.F., and W. Kuls. Geomedical Monograph Series, 72-7901,1972 U. Springer, Berlin.
Stocking, M., and A. Pain. Soil Depth and Minimum Depth for1983 Productive Yields: Developing a New Concept. Discussion
Paper No-. 150, University of East Anglia, UK.
Thomas, D.J., and D.K. Cassell. Land forming Atlantic Plains1979 soils:crop yield relationships to soils physical and
chemical properties. J. of Soil & Water Cons.30(1):20-24.
Westphal, E. Agricultural Systems in Ethiopia. Centre for Ag.1975 Pub. & Doc., Wageningen, WFP/FAO-1982.
World Bank Ethiopia: Recent Economic Developments and Future1983 Report No. 4683 ET, 2 Vol., Washington D.C..
World Bank Sector Review, Ethiopia, Population, Health and1985 Nutrition, World Bank, Report No. 5299-ET, Washington
D.C..
'World Bank Ethiopia. Recent economic developments and prospecte for1987a recovery and growth. World Bank Report No. 5529-ET,
Washington D.C..
World Bank Ethiopia. Agriculture, a strategy for growth. A sector1987b review, Vol. I: Main Report Annexes 1 and 2 Vol.
Statistical Annex 3, Washington D.C..
World Bank Ethiopia. An Export Action Programm. World Bank Report1987c No. 6432-ET, Washington D.C..
107