Embed Size (px)
Citation preview
Single-molecule electrochemistry: from the design of
nanostructured electrodes to the formation of chemical bonds
by
Na Kong
Master of Material Science
Submitted in fulfilment of the requirements for the degree of
Doctor of Philosophy
Deakin University
August 2019


-i-
Acknowledgements
I would like to express my sincere gratitude to all the people who have helped me during
my Ph.D. journey.
Firstly, I’d like to express my sincere acknowledgement to my principal supervisor, Dr.
Wenrong Yang. Thank you so much for being continual supportive with my Ph.D.
project. It was a long and tough journey for me and it would be impossible without your
help. Thank you very much for your patience through my tough times and for your step
by step guidance towards publications. From Dr. Yang, I learned that research works
are not only referred to publications but are also aimed to explore novel knowledge and
to convert our ideas to reality. I also thank you very much for all your help in my daily
life. The parties you hosted in your house for international students on important
festivals like the Chinese Spring Festival, which help us overcome homesickness. I feel
very lucky to have you as my supervisor during the long four years of study in Australia.
Secondly, I want to thank Prof. Jingquan Liu at Qingdao University, Prof. Jin He at
Florida International University and Dr. Ross Marceau at the Institute for Frontier
Materials of Deakin University. Thanks to Prof. Liu for recommending and
encouraging me to pursue a Ph.D. degree at Deakin University, and your valuable
advice helped me a lot throughout the whole period of my Ph.D. Thanks to Prof. He
who offered me the opportunity to visit his group at Florida International University
and I learned the single molecule surface enhanced Raman techniques from him and
his group, which is an important part in the Chapter 5 of this thesis. Also, I enjoyed the
time at Florida International University. Thanks to Dr. Ross for giving me a lot of help
on preparing nanoelectrodes, using Atom Probe Tomography to analyse the electrode
-ii-
surface structure and composition.
I would also like to thank Prof. Colin Barrow, Prof. Neil Barnett and Prof. David Cahill
for your kind efforts in supporting me with my application of Ph.D. offer and
scholarship. Thanks for organizing the annual conference and group party which I am
always looking forward to.
I would also like to thank Deakin University and the Victorian Government for providing
me the scholarship (Victorian International Research Scholarship 2015) and allowing
me to carry out the project with good financial assistance. Thanks to the IPRS and ARC
for funding Dr. Yang to support this project. Also thanks to Deakin for providing
excellent support in both hardware and software to all HDR students. I’ve really
enjoyed these years spent here and the time at Deakin will always be kept in my heart.
I appreciate all the technical staffs in L&ES for their kind help with my research. I have
also gained a lot of experience of lab administration and management, including safety
training, risk assessment of chemicals, equipment training and so on.
I would like to thank Prof. Shuai Chang, Prof. Hong Zhou, Prof. Jing Liu, Dr. Qiong
Li, Prof. Da Li, Dr. Motilal Mathesh, Dr. Zhen Liu, Dr. Yichao Wang, Tejaswini
Ramakrishna, Jianmei Wang, Jing Guo and Qiushuang Ai for their timely support to
my project. You guys are awesome to provide points of view with my understanding
and experiments. And many thanks to those people involved in this project.
Finally, I would like to thank my family members, my husband Jizhen Zhang, my
parents and my brother, who have given me powerful emotional support and endless
love. I could not finish this journey without your support.
-iii-
Table of contents
Acknowledgements ......................................................................................................... i
Table of contents .......................................................................................................... iii
Abstract .......................................................................................................................... 1
List of abbreviations ...................................................................................................... 5
Chapter 1: Introduction .................................................................................................. 8
1.1 Nanostructured electrodes .................................................................................. 10
1.2 Electron transfer on the SAMs modified electrodes .......................................... 13
1.3 Single entity analysis ......................................................................................... 15
1.3.1 Nanoscale electrochemical detection techniques ............................................ 17
1.3.2 Ultra-micro- or nano-electrode preparation methods ...................................... 21
1.3.3 Single entity detection through the electrochemical methods ......................... 25
1.3.4 Electrochemical and surface-enhanced Raman spectroscopy ......................... 27
1.4 Research questions ............................................................................................. 30
1.5 Research aims of my Ph.D. project .................................................................... 31
Chapter 2: Experimental methodology ........................................................................ 33
2.1 Chemicals and reagents...................................................................................... 34
2.2 Sample preparations ........................................................................................... 35
2.2.1 Synthesis of chemically reduced graphene oxide nanosheets (CRGOs) ......... 35
2.2.2 Preparation of boron nitride-NH2 nanosheets ................................................. 36
2.2.3 Preparation of MoS2 nanosheets ..................................................................... 36
2.2.4 Preparation of various alkanethiol modified gold electrodes .......................... 37
2.2.5 Fabrication of 2D nanomaterials mediated SAMs electrodes ......................... 38
2.2.6 Preparation of MP-11 functionalised reduced graphene oxide (MP-11/rGO)
nanosheets ................................................................................................................ 38
2.2.7 Preparation and surface modification of gold nanoparticles ........................... 39
-iv-
2.2.8 Preparation of gold nanoelectrodes (GNE) and surface area characterization 39
2.2.9 Preparation of palladium tips and HDPE coated electrodes ........................... 41
2.3 Characterization techniques ............................................................................... 42
2.3.1 UV-visible spectroscopy ................................................................................. 43
2.3.2 Raman spectroscopy ........................................................................................ 43
2.3.3 Zetasizer .......................................................................................................... 43
2.3.4 Atomic force microscopy (AFM) .................................................................... 43
2.3.5 Transmission electron microscopy (TEM) ...................................................... 44
2.3.6 Scanning electron microscopy (SEM)............................................................. 44
2.3.7 Electrochemical measurements ....................................................................... 44
2.3.8 Electrochemical and SERS Measurement systems ......................................... 45
2.3.9 Density functional theory ................................................................................ 46
2.3.10 Atom probe tomography ............................................................................... 47
Chapter 3: Formation of efficient electron transfer pathways across self-assembly
monolayers by 2D nanomaterials................................................................................. 48
3.1 Introduction ........................................................................................................ 49
3.2 Results and discussion ....................................................................................... 53
3.2.1 CRGO mediated SAMs modified electrodes .................................................. 55
3.2.2 Other 2D nanomaterials mediated SAMs modified electrodes ....................... 66
3.3 Conclusions ........................................................................................................ 78
Chapter 4: Real-time electrochemical monitoring covalent bond formation in solution
via nanoparticle-electrode collisions............................................................................ 79
4.1 Introduction ........................................................................................................ 80
4.2 Results and discussion ....................................................................................... 84
4.2.1 Preparation and characterization of MP-11/rGO nanosheets .......................... 84
4.2.2 Characterization of MP-11/rGO nanosheets modified electrodes ................... 87
4.2.3 Electrochemical monitoring of MP-11/rGO nanosheets and electrode collision
events ........................................................................................................................ 90
-v-
4.3 Conclusion ......................................................................................................... 97
Chapter 5: Sing-molecule covalent chemistry: real-time direct observation of
intermediates of the covalent bond formation during single nanoparticle collisions .. 99
5.1 Introduction ...................................................................................................... 100
5.2 Results and discussion ..................................................................................... 101
5.2.1 Characterization of gold nanoelectrodes and gold nanoparticles .................. 102
5.2.2 Electrochemical current response during the collision process .................... 105
5.2.3 SERS signal analysis during the collision process ........................................ 108
5.3 Conclusion ....................................................................................................... 119
Chapter 6: SAMs stability investigated through the combined electrochemistry, atom
probe tomography and surface-enhanced Raman techniques .................................... 120
6.1 Introduction ...................................................................................................... 121
6.2 SAMs desorption results with different techniques ......................................... 124
6.2.1 APT desorption of alkanethiol monolayers ................................................... 124
6.2.2 Electrochemistry of SAM-PDNE .................................................................. 130
6.2.3 SERS measurements ..................................................................................... 133
6.3 Discussion and summary ................................................................................. 137
Chapter 7: Summary and perspectives ....................................................................... 140
References .................................................................................................................. 146
Curriculum Vitae-Na KONG ..................................................................................... 189
-1-
Abstract
It is unquestionable that single entity electrochemistry has expanded into a wide range
of topics, such as batteries, fuel and solar cells, supercapacitors, catalysis, sensing and
the emerging medical diagnostic techniques. Studies on the single entity
electrochemistry have offered new insights into electrochemical kinetics in the
nanoscale and enabled understanding in intrinsic electrochemical activities at interfaces
from the individual entity level. However, directly investigating single entity is still the
biggest challenge due to the transient nature and ultralow amplitude of electrochemical
responses. In the present thesis, I explored two approaches to realize the in-situ
observation of single nanomaterials. Firstly, by reducing electrode size and
functionalizing electrodes surface effectively reduced the background current noise.
Secondly, I developed efficient methods for direct recording both electrochemical and
Raman spectrum responses combining electrochemistry with surface-enhanced Raman
scattering (SERS) with advantages of high sensitivity and time resolution. Therefore,
my thesis meets the requirement for addressing current issues of single entity
electrochemistry.
In the first part, I reviewed recent progress and applications that related to surface
modification of electrodes with self-assembled monolayers (SAMs) and nanomaterials,
the electron transfer ability across the functionalized nanostructures, the brief history
of single entity analysis and preparation methods of nanoelectrodes for electrochemical
detection single entity. Finally, the most advanced electrochemical combined with
SERS is also introduced in this part. The research background reveals that the projective
and aims of my thesis are to explore the fundamental electron transfer kinetics and
monitor the single entity even single bond formation with the novel electrochemistry
-2-
and SERS techniques.
In Chapter 3, I focused on electrochemical kinetics study of 2D nanomaterials mediated
SAMs electrodes. The SAMs of alkanethiolates provide a convenient and simple
method to tailor the surface chemistry of electrodes, and it could effectively block
electrode surface reaction so that it reduces the background current noise. In this part,
I designed and prepared SAMs modified gold electrodes, which were blocked with four
alkanethiols with different lengths and systematically studied the electrochemical
activities on these electrodes before and after the 2D nanomaterials attachment
(including chemically reduced graphene oxide sheets, boron nitride and molybdenum
disulfide nanosheets). By using potassium ferricyanide as a redox probe, I found that
above three 2D nanomaterials could effectively enhance the heterogeneous electron
transfer due to the tunnelling effect of SAMs. The experimental measurements and
theoretical calculation results indicated that the electron transfer kinetics are attributed
to the conductivity of 2D nanomaterials and interaction between nanomaterials and
SAMs terminate surface.
Afterward, Chapter 4 described a new protocol to real-time monitor the covalent bond
formation process through nanoparticle-electrode collision events. Microperoxidase
(MP-11) was firstly attached to the surface of graphene nanosheets, while gold micro-
electrode was modified with Lomant’s reagent (3,3′-Dithiodipropionic acid di(N-
hydroxysuccinimide ester)) that leaves -NHS groups on its surface. Once MP-
11/reduced graphene oxide (rGO) nanosheets reach the surface of Lomant’s reagent
coated gold electrode, an amide covalent bond was formed between the -NH2 of MP-
11 and carboxyl of the Lomant’s reagent. Then MP-11/rGO nanosheets were firmly
stacked onto the gold electrode surface instead of being repelled away. Therefore, a
-3-
stepwise current signal was recorded, suggesting the “Hit-and-Stand” collision
behaviour between MP-11/rGO and modified electrode. While only spike current
signals being observed from the control experiment which could be regarded as the
“Hit-and-Run” model.
Considering the limitation of electrochemical techniques, however, no structure
revolution information could be recorded. To better explore the formation of chemical
bonds, SERS technique was introduced to track the amidation reaction happened
between nanoparticle and nanoelectrodes which were covered with designed single-
molecule layers (Chapter 5). The electrochemically etched gold nanoelectrodes were
insulated with high-density polyethylene (HDPE) and the tip apex was exposed to work
as nanoelectrodes. The tip apex then was modified with cysteamine, meanwhile the
GNPs were treated with the Lomant’s regent to functionalize the surface with -NHS
groups. The amide bonds were expected to form on the electrode surface when modified
GNPs meet the electrode surface. Simultaneously, the single GNP collision events
could be tracked by monitoring the time-resolved electrochemical currents and Raman
spectral changes. The experimental results suggested that this approach is a powerful
technique for monitoring the molecule junctions.
Based on the previous work, I have confronted with some challenges and questions
about the structural stability of formed SAMs. Therefore, I have explored the structural
nature and stability of SAMs in the final experimental part of my thesis (Chapter 6).
Electrochemical, atom probe tomography (APT) and SERS techniques are combined to
study the desorption process of SAMs. Based on my preliminary APT and
electrochemistry results, I found that the thiols with long molecular length tend to form
thermal and chemical stable monolayers.

-4-
Finally, the conclusion and future work were presented in Chapter 7. And most
importantly, I listed a few perspectives, such as the recognition of chiral molecules
based on novel electrochemistry and SERS techniques.
-5-
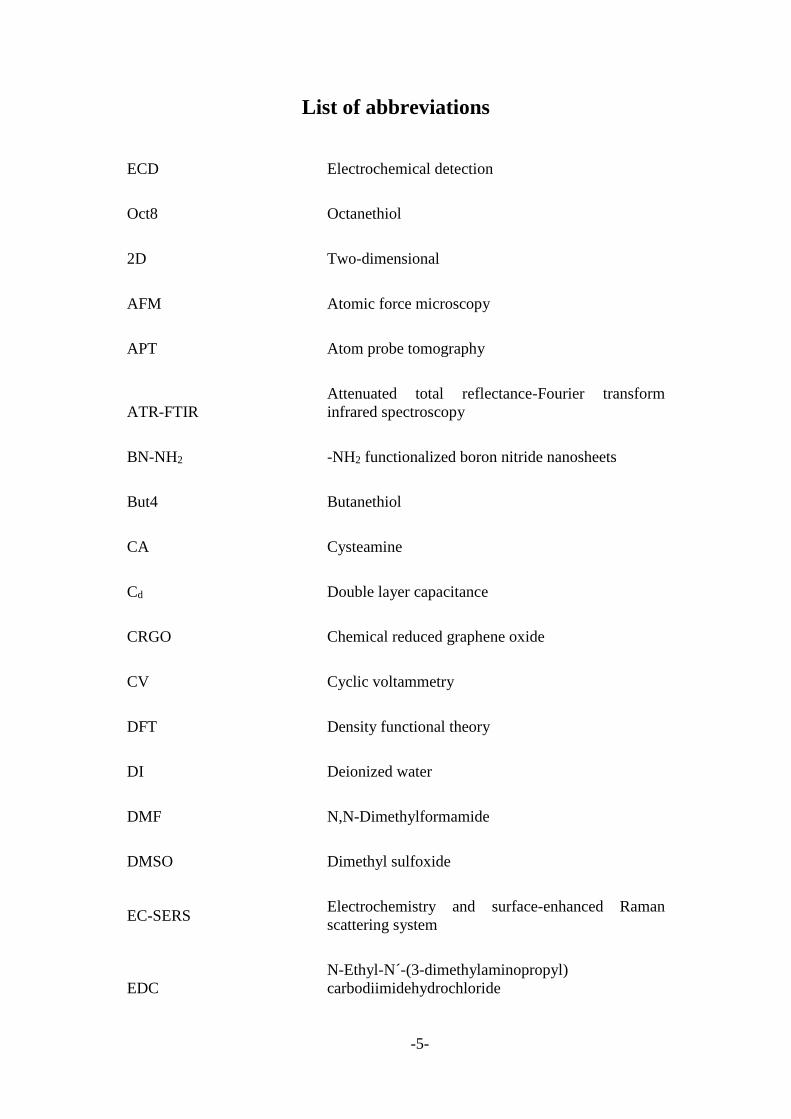
List of abbreviations
ECD Electrochemical detection
Oct8 Octanethiol
2D Two-dimensional
AFM Atomic force microscopy
APT Atom probe tomography
ATR-FTIR
Attenuated total reflectance-Fourier transform
infrared spectroscopy
BN-NH2 -NH2 functionalized boron nitride nanosheets
But4 Butanethiol
CA Cysteamine
Cd Double layer capacitance
CRGO Chemical reduced graphene oxide
CV Cyclic voltammetry
DFT Density functional theory
DI Deionized water
DMF N,N-Dimethylformamide
DMSO Dimethyl sulfoxide
EC-SERS Electrochemistry and surface-enhanced Raman
scattering system
EDC
N-Ethyl-N´-(3-dimethylaminopropyl)
carbodiimidehydrochloride
-6-
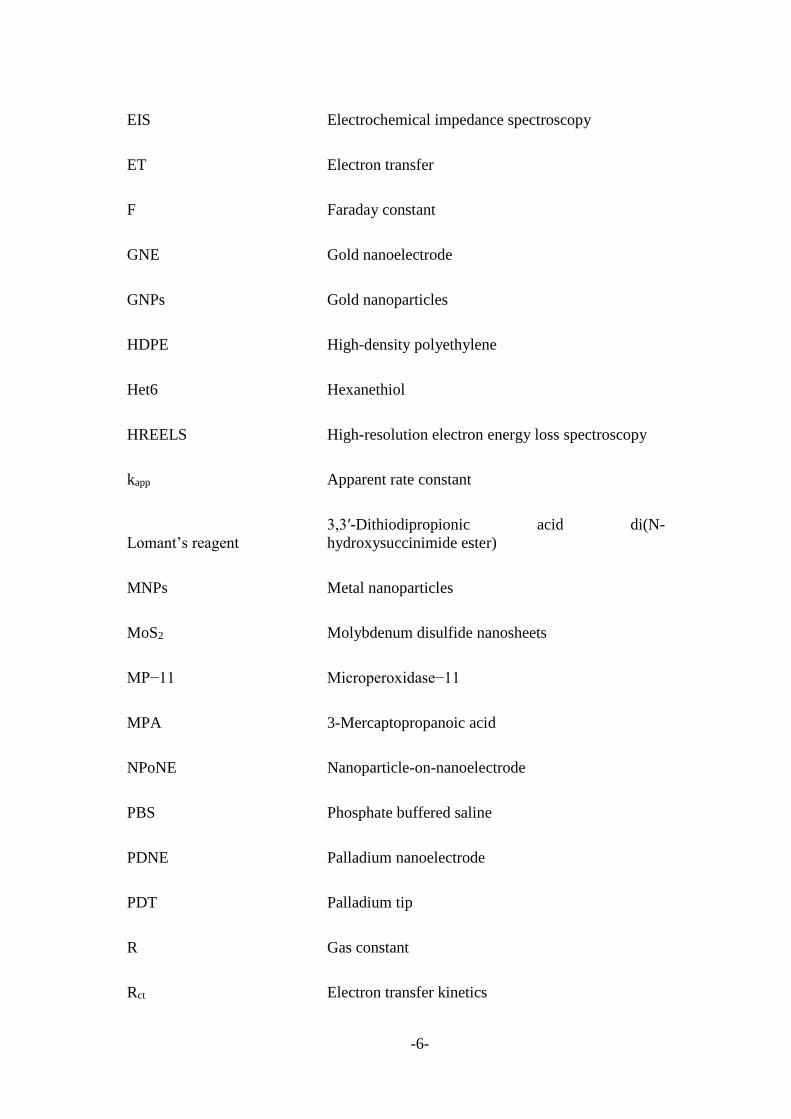
EIS Electrochemical impedance spectroscopy
ET Electron transfer
F Faraday constant
GNE Gold nanoelectrode
GNPs Gold nanoparticles
HDPE High-density polyethylene
Het6 Hexanethiol
HREELS High-resolution electron energy loss spectroscopy
kapp Apparent rate constant
Lomant’s reagent
3,3′-Dithiodipropionic acid di(N-
hydroxysuccinimide ester)
MNPs Metal nanoparticles
MoS2 Molybdenum disulfide nanosheets
MP−11 Microperoxidase−11
MPA 3-Mercaptopropanoic acid
NPoNE Nanoparticle-on-nanoelectrode
PBS Phosphate buffered saline
PDNE Palladium nanoelectrode
PDT Palladium tip
R Gas constant
Rct Electron transfer kinetics
-7-
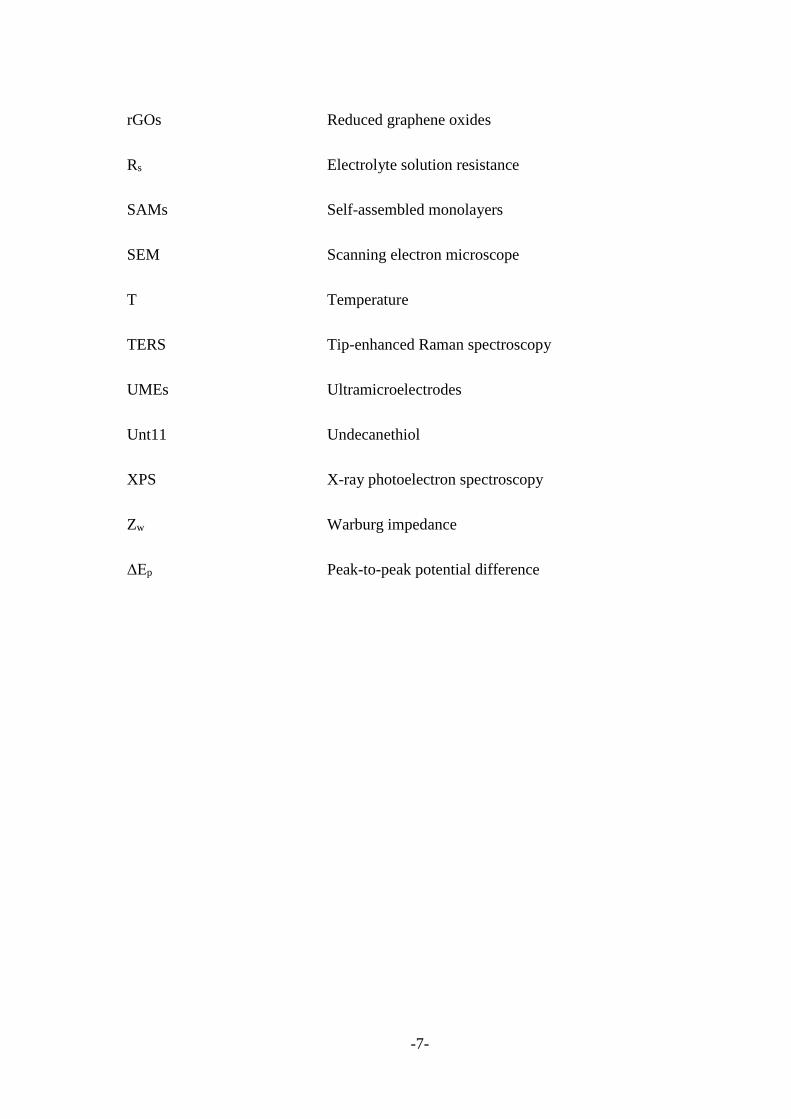
rGOs Reduced graphene oxides
Rs Electrolyte solution resistance
SAMs Self-assembled monolayers
SEM Scanning electron microscope
T Temperature
TERS Tip-enhanced Raman spectroscopy
UMEs Ultramicroelectrodes
Unt11 Undecanethiol
XPS X-ray photoelectron spectroscopy
Zw Warburg impedance
ΔEp Peak-to-peak potential difference

-8-
Chapter 1: Introduction

-9-
During the past decades, studies on the single-molecule level have attracted
considerable attention because they could lead to important new insights in the
molecule level of material properties.[1, 2] These works include direct or indirect
detection of single molecules or particles in solution or on the solid surface. The
significance of works on the single molecule is just as Richard Feynman, a very famous
physics Nobel winner, said “It is very easy to answer many of these fundamental
biological questions; you just look at the thing!”[3] The direct observing the
transformation of a single molecule could allow us to ‘see’ the complex chemical
reaction and physical transition. Researchers believe that the single molecule study
could provide a possible way to characterize proteins, DNA and other biomolecules.[4]
Particularly, electrochemical detection (ECD) method is a sensitive, low cost and easy-
handling method for analysing a wide range of target analytes based on their unique
electrochemical properties. For example, the direct detection of a single Pt nanoparticle
was achieved at an ultramicroelectrode using the electrochemical method in 2007.[5]
Subsequently, other nano entities, such as metal nanoparticles, polymer particles and
biomolecules, were also detected with electrochemical methods.[6-11] However, less
chemical specificity is considered in the electrochemical analysis models. Unlike the
electrochemical technique, Raman spectroscopy can access the chemical content of a
molecular system by recording molecular vibrations. In 2015, the combination of
electrochemistry (EC) and surface-enhanced Raman scattering (SERS) system, donated
as EC-SERS, was first developed by introducing the light into the EC-SERS cell, which
focused on the gap between the well-controlled tip and planar substrate, to acquire
potential-dependent Raman signal of the adsorbed aromatic molecules.[12] The subtle
change from the obtained EC-SERS results could provide configuration fingerprints
and lead to a deep understanding of the information of the molecular interfaces.
-10-
In this section, I will first introduce the recent progress on electrochemistry techniques,
including methods for electrode surface modification and nanomaterials-mediated
electron transfer behaviour, then I will review the emerging of nanoscale detection
techniques including nanoparticle-electrode collision system, chemical bond making
and breaking information, as well as the simultaneous electrochemical and Raman
techniques.
1.1 Nanostructured electrodes
A nanostructure electrode with a thickness of 1-100 nm could create local environments,
which would show different free energies, electronic states, conductivity and surface
morphology.[13, 14] This constructed surface contributes various characteristics
towards different applications such as sensing, catalysis, preparing cells and
supercapacitors. The most widely applied electrode materials include metal (gold,
palladium, platinum, nickel and so on), metal oxide (MnO2, Co3O4, CoO, NiO, V2O5)
[15-17] and carbon-based materials (glassy carbon and graphite). These electrode
materials show various properties towards different applications. For example, a glassy
carbon electrode was used as a substrate due to its stability and non-reactivity. This not
only means less electrochemistry activity would happen on the surface of the electrode
itself but also results in a synergetic detecting response when active probes were
induced to its surface. Due to the good electrocatalytic activity of gold electrodes, it has
been widely used in studies of electrochemical reactions, especially oxidation of
biomolecules.[18-20]
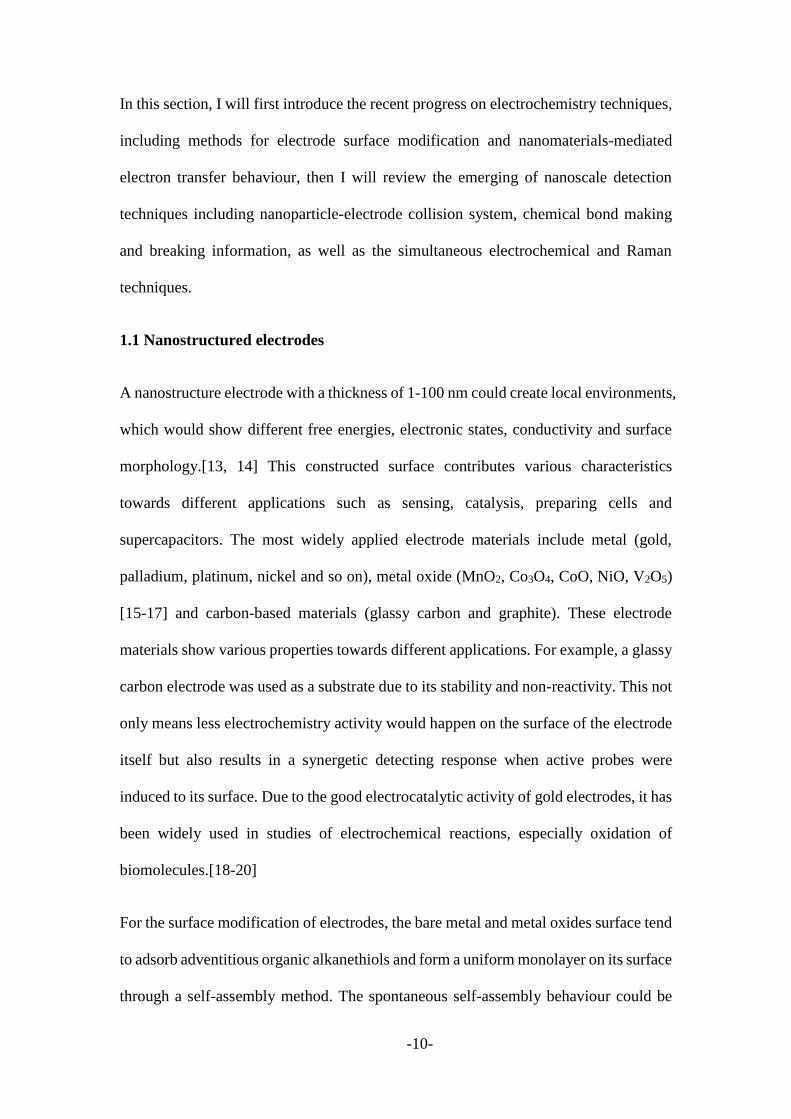
For the surface modification of electrodes, the bare metal and metal oxides surface tend
to adsorb adventitious organic alkanethiols and form a uniform monolayer on its surface
through a self-assembly method. The spontaneous self-assembly behaviour could be
-11-
attributed to the lower free energy of the interface between the metal or metal oxide and
the ambient environment.[14] These formed monolayers could alter interfacial
properties and result in advanced influence on the electrical activities of the electrode
surface.
Figure 1.1 (A) Scheme structure of SAMs; (B) Most studied surface-active
organosulfur compounds;[21] (C) Several applications of the self-assembled monolayer
in nanotechnology.[22-25]
The SAMs are normally self-assembled on the selected substrate surface by directly
adsorption of organic molecular constituents from the solution; the adsorbates are
organized spontaneously (and sometimes epitaxially) into crystalline (or
-12-
semicrystalline) structures, as shown in Figure 1.1A. A chemical functionality, or called
“headgroup”, at one end of molecules or ligands exhibits specific affinity towards
substrates including metal, metal oxide and semiconductor materials.[26-34] The most
widely explored and applied class of SAMs is derived from the self-adsorption of
alkanethiols on the metal surface (as listed in Figure 1.1B), which could be attributed
to the high affinity of “headgroup” towards noble metals. The well-ordered organic
monolayer affords the substrate surface with highly alterable chemical functionalities
thermodynamic stability and photoelectric variety. “Space group” is normally made of
alkane chains with different length, and the length of alkane chains would decide the
thickness of the formed SAM. This organic interphase could effectively prevent any
ionic or solvent penetrating to the electrode surface so as to block the electron transfer
between the electrode and solution. “Terminal group” also called “functional group”
that determines the surface properties and provide various active points for further
functionalization or modification.
The formation of SAMs offers a convenient and simple method to modify the electrode
surface, which could tailor the interfacial properties of metals, metal oxides, and
semiconductors. The changes in properties of electrode surface would play important
roles in the applications, such as biology, sensing, catalysis, fuel cells, supercapacitors,
anti-corrosion, drug delivery and other fields.[35-40] The SAMs are very easy to
prepare without specialized requirement on environments or equipment during the self-
assembling process. The most popular protocol for SAMs preparation on the metal
substrate is simply immersing a freshly prepared or cleaned substrate into a dilute
ethanolic solution of thiols (~1 to 10 mM) for 4 to 12 h at room temperature.[41-46]
The structure and density of formed monolayers could be adjustable by controlling the
experimental parameters, such as the solvent type, temperature, the concentration of
-13-
adsorbate, immersion time, adsorbate purity, cleanliness and roughness of the substrate
or the formation rate, suggesting the excellent flexibility and modifiability.
Additionally, the thickness of the formed monolayers is typically 1 - 3 nm, thus this
ultra-thin organic film could potentially be used to tailor substrate surface in nanoscale.
Moreover, the SAMs could not only provide a surface barrier but also regulate the
chemical and physical properties of the interface. This is due to the space group and
terminal groups of SAMs which introduce chemical functionality, thermodynamic
stability and photoelectric variety to the electrode surface and transfer molecular-level
structure to macroscopic interfacial phenomena, such as wetting, adhesion and friction.
The SAMs could be broadly adapted to other forms of nanotechnology and applications
as listed in Figure 1.1C. For example, SAMs can alter the substrate properties, for
selective attachment of other cells or organelles on its surface and then serve as models
for studying membrane properties.[47] Besides the application in micro- and nano-
fabrication, molecular recognition, nanodevices and molecular electronics, surface
protection and biomimetic systems, more and more potential applications are being
developed.[22-25]
1.2 Electron transfer on the SAMs modified electrodes
Compared with bulk level electron transfer process, the studies about electron transfer
process on the nanoscale are more complicated and just at its beginning. Nanoscale
electron transfer is significant in the frontier of fundamental science and nano-
technology applications. Electron transfer studies across the SAMs attached to
electrodes have been studied over the recent decades.[48, 49] The majority of
experimental measurements of the electron transfer on SAM-modified electrodes
include rate constants, spectroscopy and conductance/resistance measurements. The
-14-
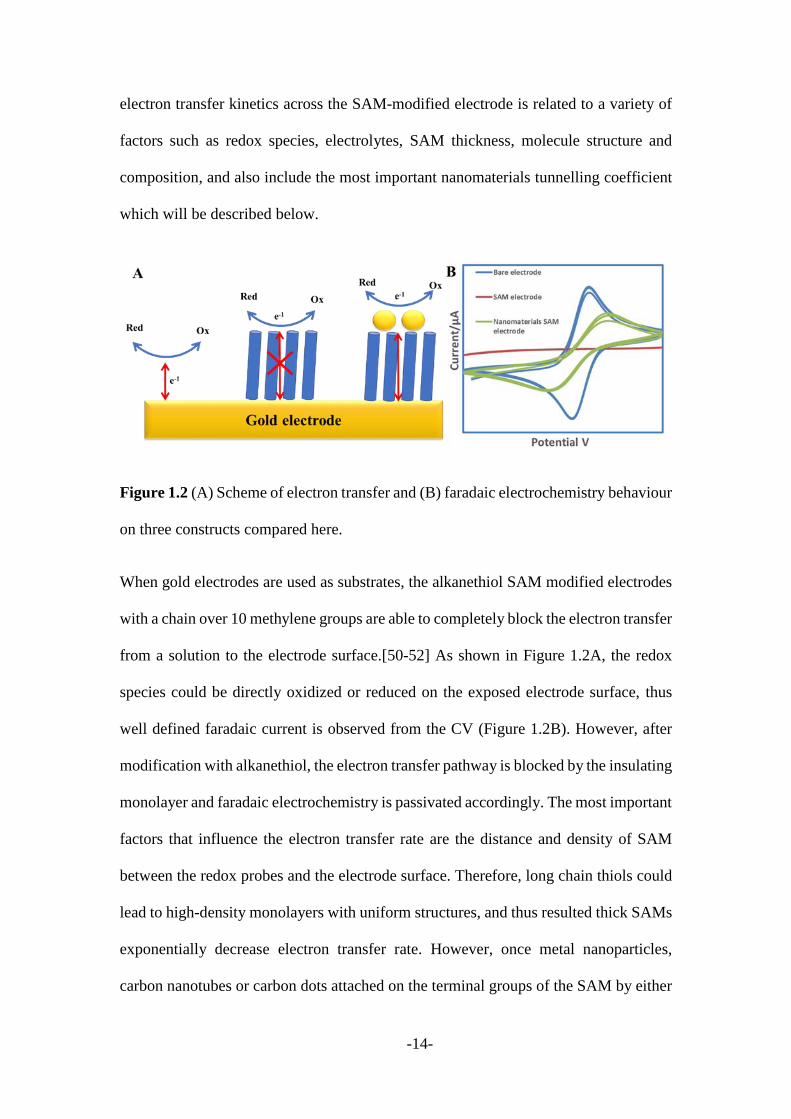
electron transfer kinetics across the SAM-modified electrode is related to a variety of
factors such as redox species, electrolytes, SAM thickness, molecule structure and
composition, and also include the most important nanomaterials tunnelling coefficient
which will be described below.
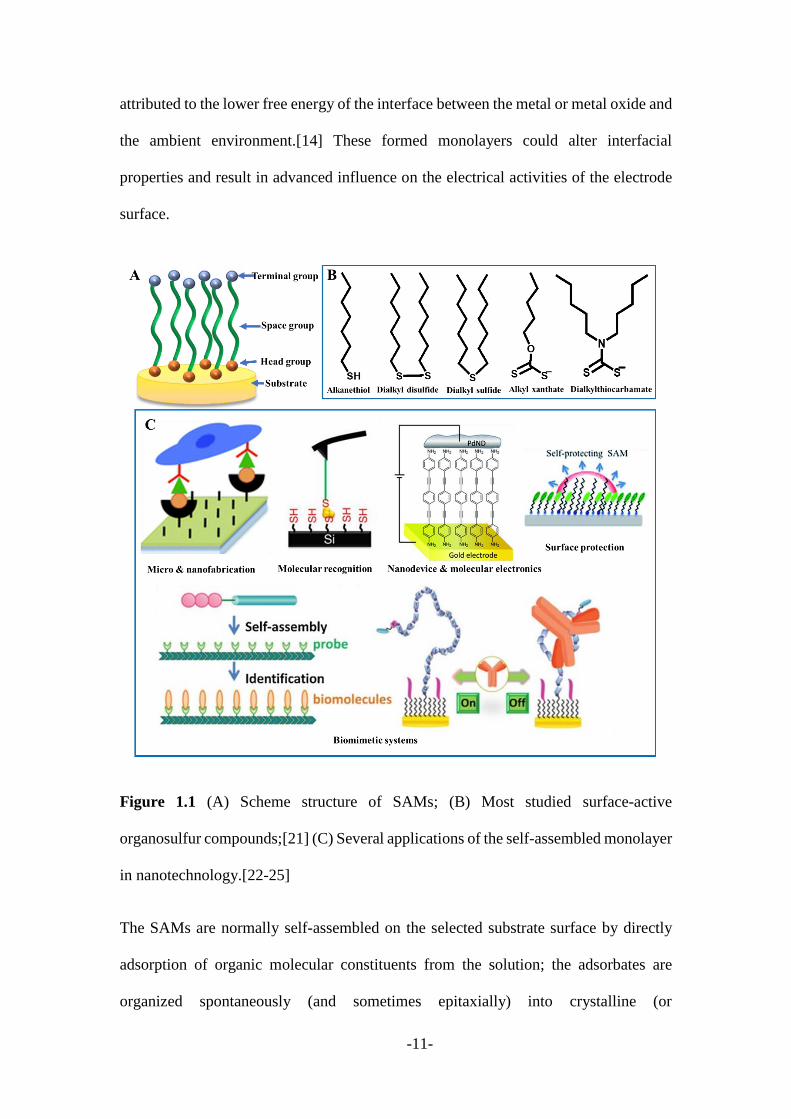
Figure 1.2 (A) Scheme of electron transfer and (B) faradaic electrochemistry behaviour
on three constructs compared here.
When gold electrodes are used as substrates, the alkanethiol SAM modified electrodes
with a chain over 10 methylene groups are able to completely block the electron transfer
from a solution to the electrode surface.[50-52] As shown in Figure 1.2A, the redox
species could be directly oxidized or reduced on the exposed electrode surface, thus
well defined faradaic current is observed from the CV (Figure 1.2B). However, after
modification with alkanethiol, the electron transfer pathway is blocked by the insulating
monolayer and faradaic electrochemistry is passivated accordingly. The most important
factors that influence the electron transfer rate are the distance and density of SAM
between the redox probes and the electrode surface. Therefore, long chain thiols could
lead to high-density monolayers with uniform structures, and thus resulted thick SAMs
exponentially decrease electron transfer rate. However, once metal nanoparticles,
carbon nanotubes or carbon dots attached on the terminal groups of the SAM by either
-15-
a covalent bond or van der Waals forces, appreciable electrochemical signal can be
observed as illustrated in Figure 1.2B. [53-55]
Gold nanoparticles modified electrodes have drawn the most attention since the first
report by Natan and co-workers in 1995.[56, 57] They proved that the immobilized gold
or silver nanoparticle on polymerized silane-modified platinum electrode could open
up electron transfer pathways that blocked by the organic monolayer and the
nanoparticle was located at the monolayer surface rather than embedded within the
monolayer. After that a similar phenomenon has been continually reported by others
since.[53, 58-61] Fermin and other co-authors have published a series of papers on the
gold nanoparticles modified electrodes, and they have made significant progress on the
carboxyl and amine self-assembled monolayers bonded gold nanoparticles.[62-65]
Fermin has showed that electron transfer was independent of the length of the linking
SAMs, and a “hot electron transfer” process that was proposed to explain the “switch
on” mechanism once gold nanoparticle attached on the SAM electrode surface. In the
same year, Gooding’s group[53] demonstrated that no significant deterioration in
electrode performance in the multilayer systems form one to five layers of linker-
nanoparticle bilayers. These pioneer works have greatly accelerated the development
of studies focus on nanomaterials mediated SAMs electrodes. Additionally, carbon
nanomaterials (for instance graphene, carbon nanotubes, quantum dots), metal
nanoparticles (including gold, platinum, silver nanoparticle) and biomolecular (such as
protein, DNA, enzymes) have attracted a great deal of interest on electron transfer
studies and their development of electrochemical detection device for detection of gas,
heavy metal ions, enzymes, antibodies, organic molecules and other analytes.[66-72]
1.3 Single entity analysis
-16-
Analytical chemistry has been converging to smaller and smaller samples with a target
to detect single molecules and probe chemical bonds information. In 1961, Rotman[73]
firstly reported the indirect detection of a single enzymatic molecule in multiple
reaction products. After 15 years, the first direct detection of a single molecule in
solution through a fluorescence method was performed by Hirschfeld.[74] And then, a
number of techniques including surface-enhanced Raman scattering (SERS),[75-77]
atomic force microscopy (AFM),[78] fluorescence, scanning electrochemical
microscopy[79] and other techniques[4, 5, 80-83] have been applied to detect the single
entity. Several techniques are based on observing the fluorescent emission or the
interaction force between the molecule and detection probes. The fluorescent emission
could provide essential information about the atom energy levels and environments of
the molecule, while the mechanical force could tell us the interaction of the target
molecule with a probing substrate.[84]
Monitoring the making and breaking of atomic bonds is of importance in the field of
chemistry and materials science, however, due to the ultrafast reaction dynamics, it
requires ultra-high time resolution equipment such as high-resolution electron energy
loss spectroscopy (HREELS), X-ray photoelectron spectroscopy (XPS) and
femtosecond X-ray scattering to record the bond formation during an ultra-fast
process.[85] Over the past decades, both the bond making and breaking process have
been studied in various molecular systems with the time-resolved techniques. However,
for the bond formation process, it requires the essential reactants and initiating
condition like the photo, UV, or other initiating regents. As a result, it is very hard to
realize the single bond formation in solution with the above-mentioned equipment. For
example, Kim et al.[86] published their achievement about direct observation of bond
formation in solution with femtosecond X-ray scattering in Nature in 2015. As reported,
-17-
the gold trimer complex, [Au(CN)-]3, which has weakly bound gold atoms in the ground
state, experienced a series of structural changes when it was photo-excited and this
process could be recorded by the femtosecond time-resolved X-ray solution scattering.
Despite these progresses have been made, the facile and low-cost approaches for
monitoring single-molecule bond making and breaking are highly demanded.
1.3.1 Nanoscale electrochemical detection techniques
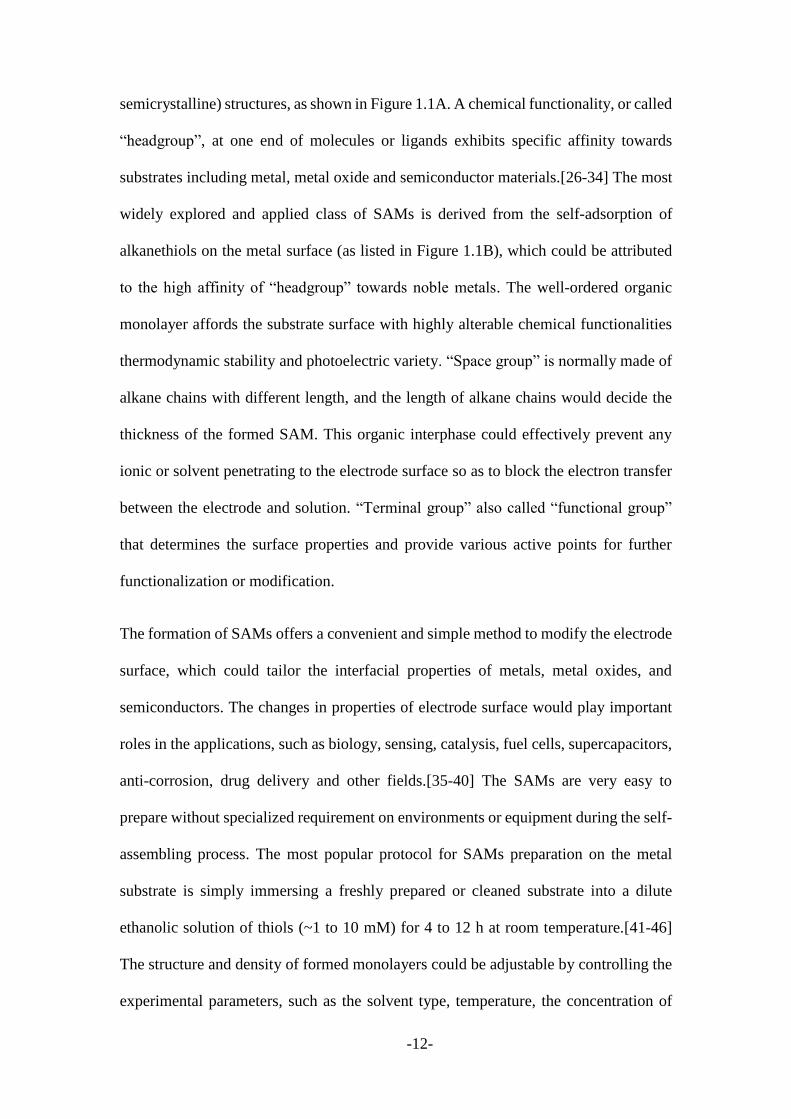
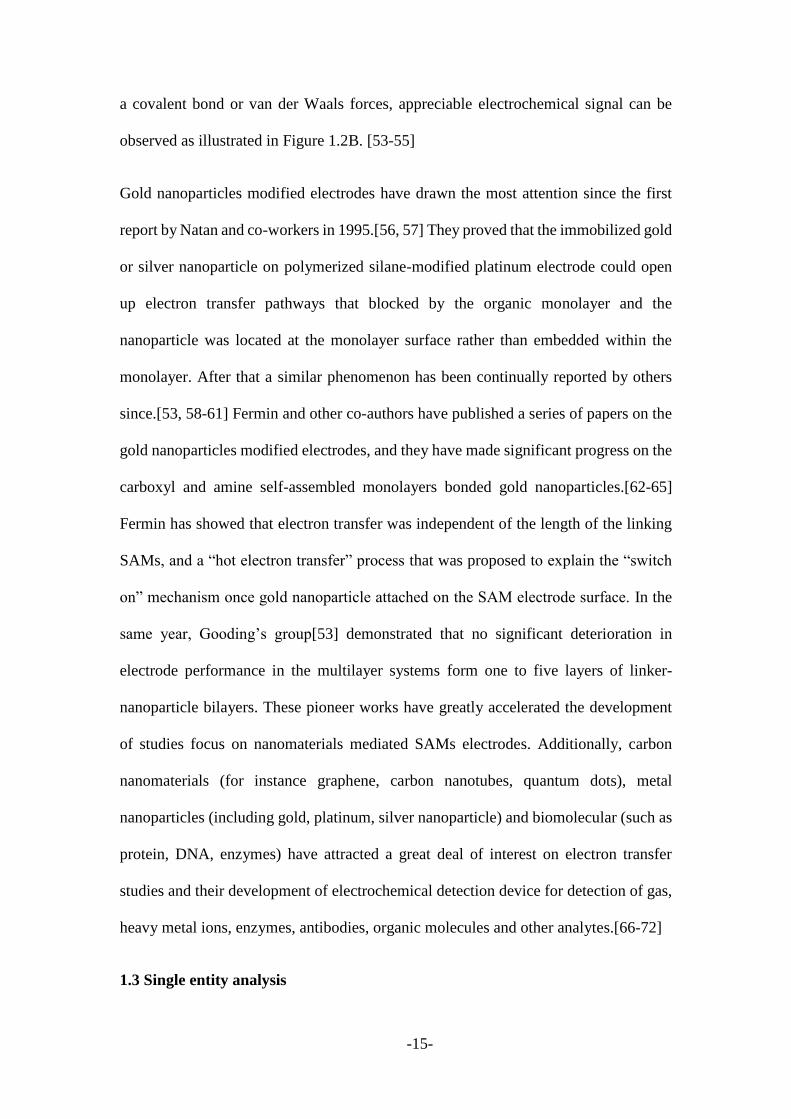
Figure 1.3 (A) Schematic of a single platinum nanoparticle collision with the
microelectrode and (B) CV results during the collision process.[5]
Conductive nanoparticles especially the metal nanoparticles and carbon nanoparticles
such as graphene, carbon nanotube have been used for wide electrochemical application
due to their fascinating physical and chemical properties.[60] The large surface area of
nanoparticles provide abundant active sites with surface modification and make
nanoparticles as ideal probes to investigate the nanoscale electrochemical processes.
The conductive nanoparticles have been reported to be used to study the electric double
layer effects towards to the interfacial electron-transfer reactions, electro-catalysis
properties towards hydrogen dioxide and other applications.[87-91]
Bard’s group [92-94] demonstrated the single nanoparticle collision with the
-18-
microelectrode could be directly observed at an ultra-microelectrode. As shown in
Figure 1.3A, when a single platinum nanoparticle diffuses to the electrode and collides
with the electrode surface, it catalysed the proton reduction which could be recorded in
an amperometric i-t curve to reflect the single particle collision events. The collision
events of platinum particles have been successfully monitored through this catalytic
amplification method. Following Prof. Bard’s work, the electrochemical collision
events study on ultramicroelectrodes (UMEs) have been applied to a wide range of
nanoparticles from the hard metal nanoparticles (such as gold, silver, platinum, nickel),
organic nanoparticle (including polystyrene beads) to biomolecules (like enzymes and
proteins).[9, 95-98] Although other effective techniques have been applied to detect
single particles, they only provide limited information about shapes or sizes about these
nanoparticles.[99-101]
Electrochemical detection is a powerful analytical method that can detect electric
currents generated from oxidative or reductive reactions in test compounds. And then
the electrochemical detection equipment expresses the reaction with a discrete or
continuous electrical signal that could be recognized by researchers. During the
detection process, the target molecule could be either freely diffused in solution or
absorbed, attached to the working electrode or probe surface.[79, 102, 103] The
different states of the target molecule may cause disturbing signals. Therefore, how to
prepare an optimal electrode and further modify the electrode surface is one of the most
important issues, which will be described later. While, the signals collected during the
electrochemical detection system could be concentrated on a basic principle: the
electron-transfer process. The first way is to detecting the charge transfer between the
target molecule and the electrode surface directly. However, detecting a few numbers
of electrons during a single oxidation or reduction event in the solution systems needs
-19-
extreme requirement towards environments or techniques. Furthermore, monitoring the
electrocatalytic current has been another well-developed technique. This is one of the
most popular methods to amplify its original signal because one single catalyst could
provide a continuous stream of electron flow and lead to a measurable current.
In 2016, Faraday Discussion (organized by Unwin, Bartlett, Fermin, Gooding, Koper,
and Vincent) on the topic of single entity electrochemistry presented lively debate and
discussion with the opportunity to hear complementary and contrasting views on topics
spanning physical chemistry, and prompted electrochemists to codify the concept of
single entity electrochemistry as a special area of inquiry.[104] Single entity
electrochemistry of the stochastic nanoparticle collision-based measurement has
developed rapidly and offered new insights into the fundamental electrochemical
kinetics as well as structure-function relations that cannot be resolved through
traditional ensemble measurements.[105-109] Additionally, several frontier reviews of
single entity electrochemistry analysis have been reported on comparing traditional and
up-to-date single molecules detection methods which focus on fundamentals and
applications of single entity electrochemistry, as well as methods and tools to make
single entity measurements [110-124] Long et al. has made significant progress on the
single molecules sensing, especially on nanoparticle collisions based nanopore,
nanoelectrode and nanopipette sensing.[125-129] Xu et al. summarized the single
particle collision behaviour from four different aspects, including the diffusing of
particles in the solution, the basic process of the method itself, the catalytic reaction on
the surface of particles, and the redox reaction of the particles.[107]
Our group has presented a novel electrochemical detecting method towards single
protein molecules (microperoxidase-11, MP-11), which are attached to the surface of
-20-
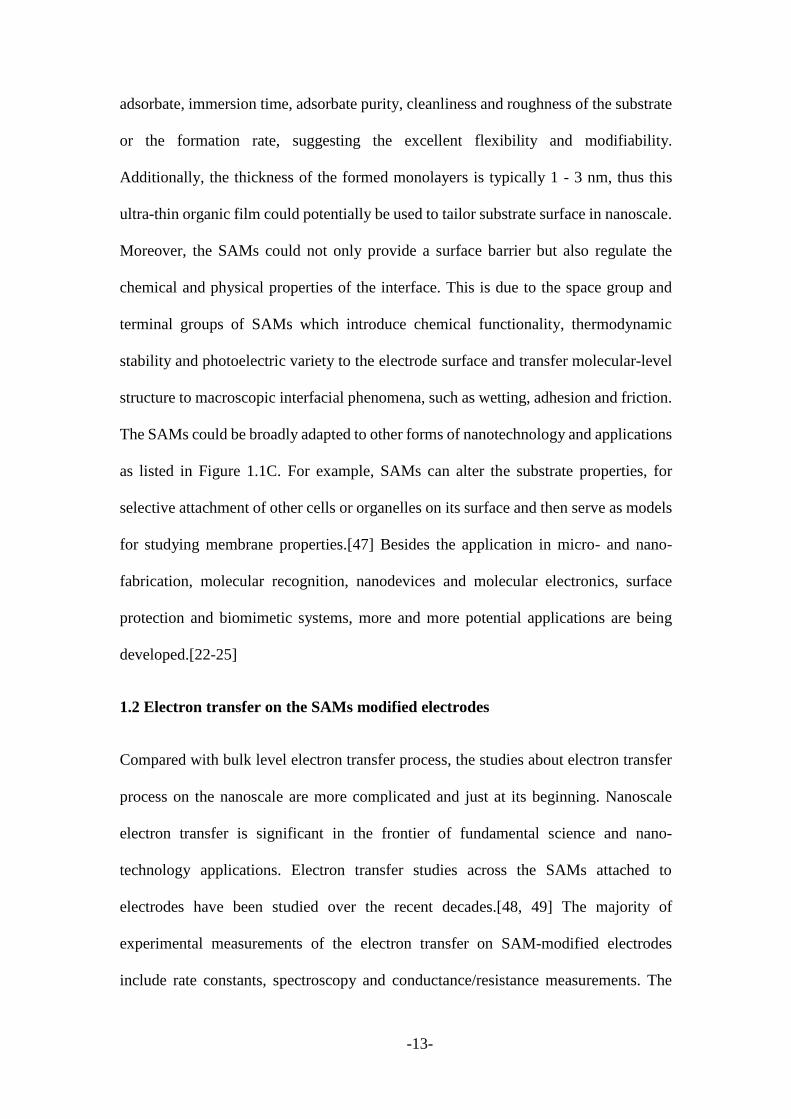
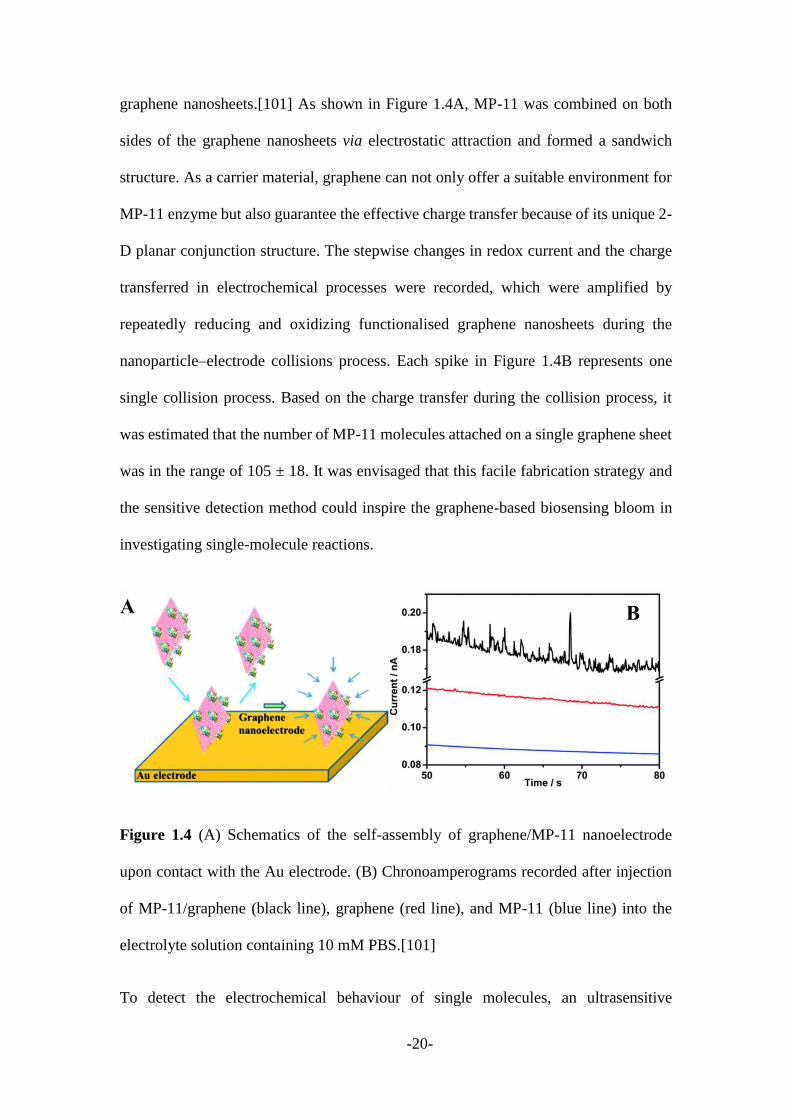
graphene nanosheets.[101] As shown in Figure 1.4A, MP-11 was combined on both
sides of the graphene nanosheets via electrostatic attraction and formed a sandwich
structure. As a carrier material, graphene can not only offer a suitable environment for
MP-11 enzyme but also guarantee the effective charge transfer because of its unique 2-
D planar conjunction structure. The stepwise changes in redox current and the charge
transferred in electrochemical processes were recorded, which were amplified by
repeatedly reducing and oxidizing functionalised graphene nanosheets during the
nanoparticle–electrode collisions process. Each spike in Figure 1.4B represents one
single collision process. Based on the charge transfer during the collision process, it
was estimated that the number of MP-11 molecules attached on a single graphene sheet
was in the range of 105 ± 18. It was envisaged that this facile fabrication strategy and
the sensitive detection method could inspire the graphene-based biosensing bloom in
investigating single-molecule reactions.
Figure 1.4 (A) Schematics of the self-assembly of graphene/MP-11 nanoelectrode
upon contact with the Au electrode. (B) Chronoamperograms recorded after injection
of MP-11/graphene (black line), graphene (red line), and MP-11 (blue line) into the
electrolyte solution containing 10 mM PBS.[101]
To detect the electrochemical behaviour of single molecules, an ultrasensitive
-21-
equipment is required to monitor the weak current change in the range of pico or nano
amperes. Furthermore, it also could be able to distinguish signals from the
environmental noise. The ideal detection system is that a well-defined nanoparticle
interacts with an electrode under potentiostats control. Besides, the electrode surface
need be carefully designed from its size, geometry and modification status. Therefore,
there are two ways to make the detecting signal stand out from the background noise.
The first way is reducing the background noise by decreasing the electrode surface area.
Secondly, boost original signals through detecting the catalytic response, recycled
redox currents and other amplification methods. These two parts will be detailed
described in next session. Reducing the electrode sizes to micrometre or nanometre
dimensions could greatly decrease the currents from nanoamperes to picoamperes
scale.[130] As one of the important parts of my project, the micro- and nano-electrode
fabrication and modification play a very important role.
1.3.2 Ultra-micro- or nano-electrode preparation methods
The ultra-microelectrodes (UMEs) are often recognized as working electrodes with a
final dimension smaller than 25 μm and have extensively applied for fast kinetics, high-
resolution electrochemical imaging, and electrochemical sensing in spatially restricted
environments such as biological cells.[131] In order to detect an analyte on single-
molecule level, a small electrode could support relatively large diffusion layers thus
reduces the background current.[61] The key requirements of a sharp needle for UMEs
preparation are the final dimension and good stability in detecting system. In this
section, I will review several techniques for the preparation of UMEs that could be
applied in electrochemical detection systems. Some materials will also be included for
UMEs preparation ranged from metals (e.g. gold, platinum, and palladium) to carbon
-22-
materials such as carbon fibre and so on.
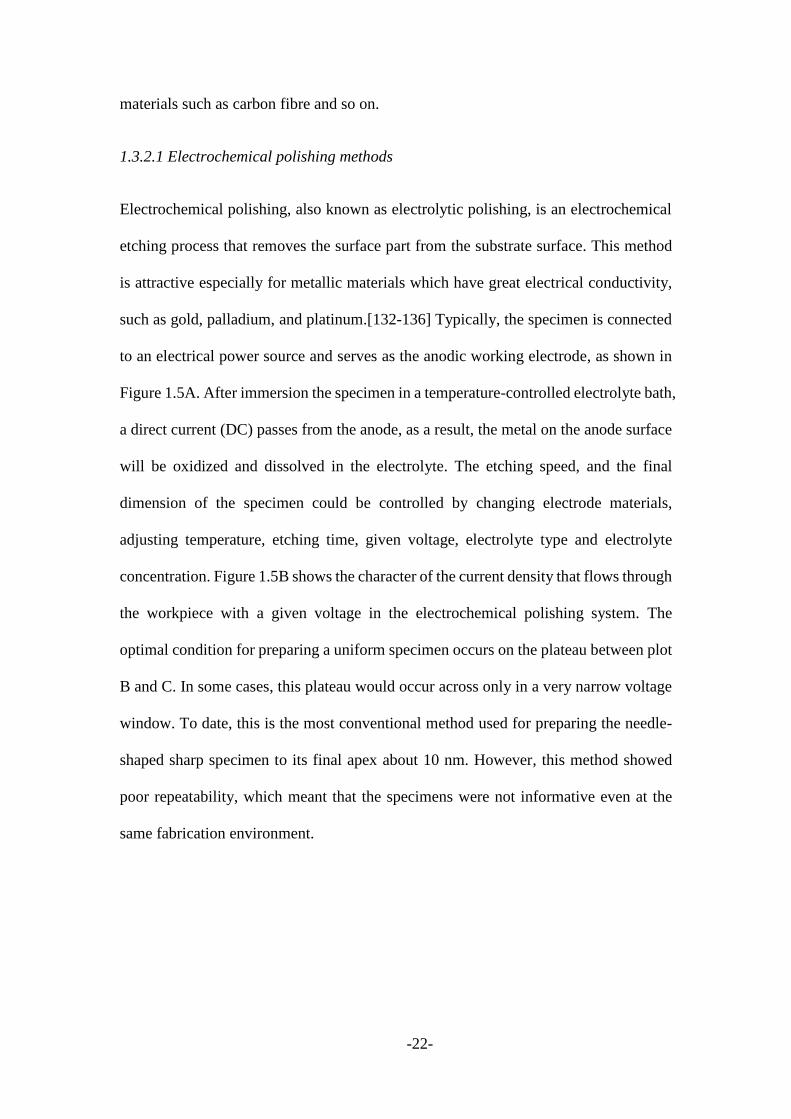
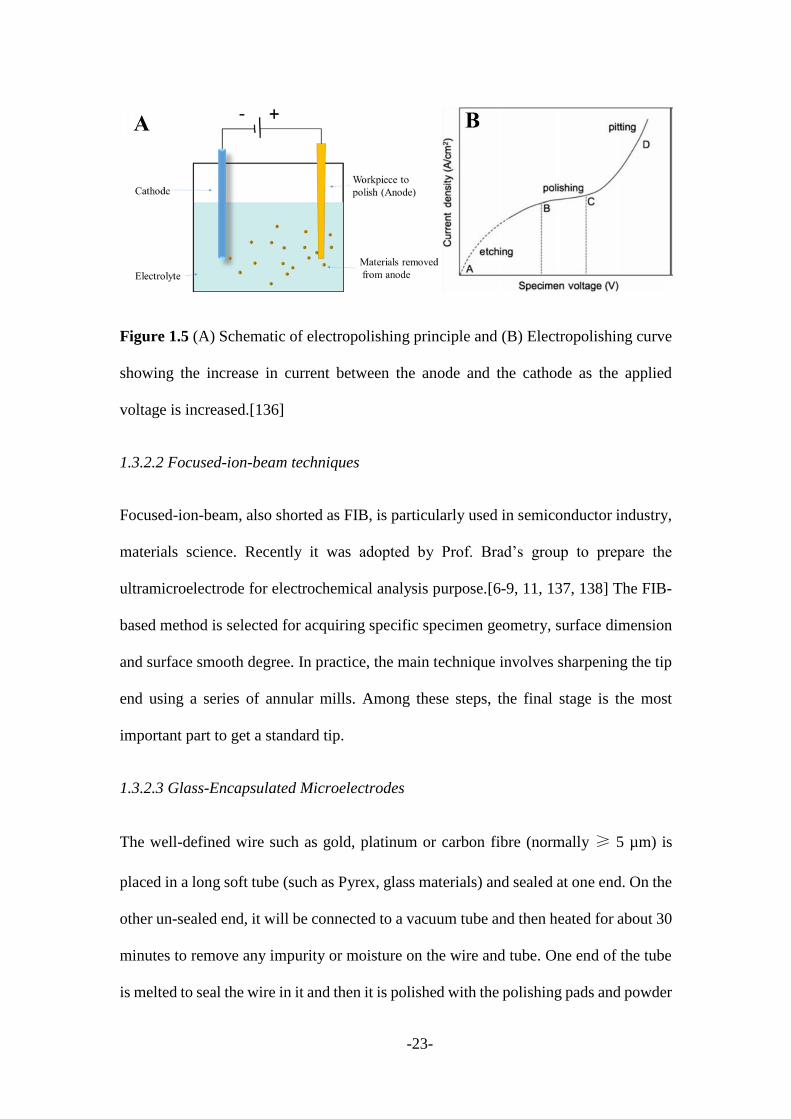
1.3.2.1 Electrochemical polishing methods
Electrochemical polishing, also known as electrolytic polishing, is an electrochemical
etching process that removes the surface part from the substrate surface. This method
is attractive especially for metallic materials which have great electrical conductivity,
such as gold, palladium, and platinum.[132-136] Typically, the specimen is connected
to an electrical power source and serves as the anodic working electrode, as shown in
Figure 1.5A. After immersion the specimen in a temperature-controlled electrolyte bath,
a direct current (DC) passes from the anode, as a result, the metal on the anode surface
will be oxidized and dissolved in the electrolyte. The etching speed, and the final
dimension of the specimen could be controlled by changing electrode materials,
adjusting temperature, etching time, given voltage, electrolyte type and electrolyte
concentration. Figure 1.5B shows the character of the current density that flows through
the workpiece with a given voltage in the electrochemical polishing system. The
optimal condition for preparing a uniform specimen occurs on the plateau between plot
B and C. In some cases, this plateau would occur across only in a very narrow voltage
window. To date, this is the most conventional method used for preparing the needle-
shaped sharp specimen to its final apex about 10 nm. However, this method showed
poor repeatability, which meant that the specimens were not informative even at the
same fabrication environment.
-23-
Figure 1.5 (A) Schematic of electropolishing principle and (B) Electropolishing curve
showing the increase in current between the anode and the cathode as the applied
voltage is increased.[136]
1.3.2.2 Focused-ion-beam techniques
Focused-ion-beam, also shorted as FIB, is particularly used in semiconductor industry,
materials science. Recently it was adopted by Prof. Brad’s group to prepare the
ultramicroelectrode for electrochemical analysis purpose.[6-9, 11, 137, 138] The FIB-
based method is selected for acquiring specific specimen geometry, surface dimension
and surface smooth degree. In practice, the main technique involves sharpening the tip
end using a series of annular mills. Among these steps, the final stage is the most
important part to get a standard tip.
1.3.2.3 Glass-Encapsulated Microelectrodes
The well-defined wire such as gold, platinum or carbon fibre (normally ≥ 5 µm) is
placed in a long soft tube (such as Pyrex, glass materials) and sealed at one end. On the
other un-sealed end, it will be connected to a vacuum tube and then heated for about 30
minutes to remove any impurity or moisture on the wire and tube. One end of the tube
is melted to seal the wire in it and then it is polished with the polishing pads and powder
-24-
to afford a smooth surface for further use. This method is suggested to prepare
submicron-sized ultramicroelectrode, and recently further optimized by White’s group
to fabricate the nanometre-sized ultra-microelectrodes.[139] In their method, the metal
wire was firstly etched at a given 180 Hz alternating current (AC) voltage to produce a
20-50 nm radius of curvature. And the sharp tips could be further sharped in a chemical
solution to less than 10 nm. After the further sharpening process, the obtained very
sharp tips are carefully sealed in a glass capillary. Finally, the critical step in this method
is repolishing the sealed end until a nanometre-sized metal disk exposed. Although this
method could be used to prepare nanometre-sized electrodes, the disadvantage of this
method is that it requires a lot of experience and it is difficult to prepare electrodes the
same surface morphology.
1.3.2.4 Other ultramicroelectrode preparation methods
Schiffrin and co-workers[131, 140] reported the spherical gold microelectrode
fabrication through self-assembled, using thiols cross-linkers, to form conductive bulk
materials and multilayer thin films. GNPs landed on the alkyl thiol passivated electrode
surface could effectively inspire the passivated electron transfer and act as the active
working electrode. In practice, the dithiol linking agent is confined to the tip lumen of
a micropipette and then it is immersed in a solution containing gold nanoparticles. The
gold nanoparticles move randomly in the solution due to the Brownian movement and
when one of them attaches to the end of the tip, it could be regarded as the electrode
surface for the electrochemical purpose.
Recently, Zhang et al.[87] reported the fabrication and electrochemistry of a new class
of graphene electrodes through dipping the reduced graphene oxides (rGOs) nanosheets
on the n-dodecanethiol-modified gold ultramicroelectrode. The alkylthiol self-
-25-
assembled monolayers could form a compact and rigid film, which could therefore
block the electron transfer. The conducting materials, such as metal nanoparticles and
carbon-based materials, immobilized on the passivated surface could “switch on” the
electron transfer, which is called tunnelling current effect. In order to investigate the
intrinsic electron transfer, they separated rGOs into flakes with different sizes and
modified the gold microelectrodes by alkylthiols with various carbon chains. As a result,
the electrochemistry of the fabricated graphene nanoelectrode show enhanced and
inhibited transport currents for the reduction of ruthenium and ferricyanide redox probe,
respectively.[141]
1.3.3 Single entity detection through the electrochemical methods
Using an electrochemical method to detect the single entity in a solution, we generally
record the detection process because of the Faradaic (electrochemical reactions such as
redox reaction or catalytic reaction) and non-Faradaic process (electrical charging). In
practice experiments, the current change is induced through three ways: the blockade
of current by nonconductive nanoparticle,[10, 142] the tunnelling current by conductive
nanoparticle on the passivated electrode and the boosted current by catalytic
nanoparticles.[143-148] The effect of blockade current was first investigated in 2002
[149] using submicrometer-sized nonconductive liposomes. In their work, each
collision event could lead to a negative current peak in a standard amperometric i-t
curve. Due to the signal to noise ratios, a requirement about the size of targeting
nanoparticle is reported that the negative current peak could not be observed unless the
nanoparticle size is larger than 10% of the electrode scale.[150] By reducing the size of
the electrode, smaller non-conductive nanoparticle could be distinguished with this
method. The tunnelling current based on conductive nanoparticle and SAMs passivated
-26-
electrodes also attracted considerable attention during the past years.[7, 151] SAMs,
particularly alkanethiol monolayers has been widely used. The alkanethiol monolayers
could easily form a well-defined insulator layer on an electrode surface to block the
electron transfer. According to the results from Gooding and other researchers,[152,
153] the electron tunnelling from redox species to electrodes could be restored by
conductive nanoparticles (such as carbon nanomaterials, metal nanoparticles)
adsorption on top of the insulating layer. This phenomenon was further interpreted by
a theoretical framework proposed by abundant works. In 2007, Bard’s group[92, 154]
proposed a new strategy to observe a single particle via the an electrochemical method.
In this approach, a single Pt nanoparticle collided with the electrode surface and
catalysed the proton reduction. Thus, the current increase is due to the electrocatalytic
reaction of the Pt nanoparticles. And the catalytic current could be 2 - 10 times larger
than the charging current.
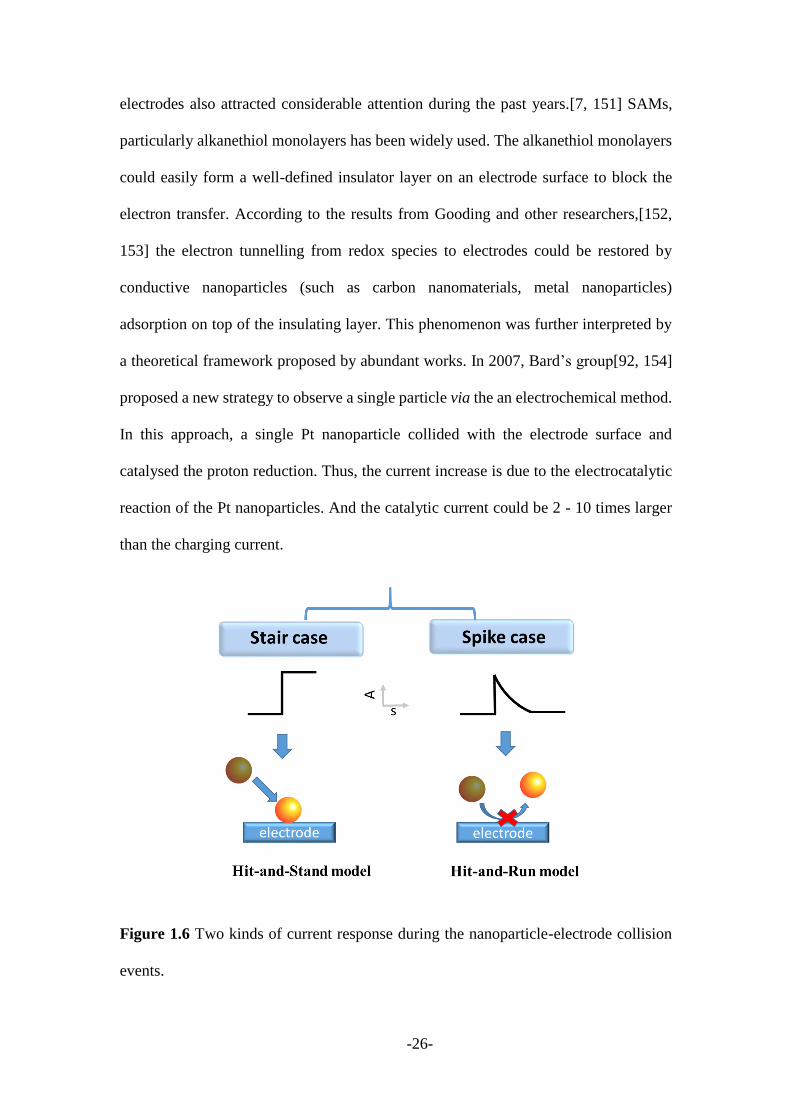
Figure 1.6 Two kinds of current response during the nanoparticle-electrode collision
events.

-27-
According to previous research, there are two kinds of current response recorded by the
amperometric i-t response during the nanoparticle-electrode collision events and
regarded as “stair case” and “spike case” as shown in Figure 1.6. For the stair case, the
current directly increased in a steady value, while the spike case, showing an attenuated
current to its previous value after increase. These two kinds of current responses are
representative of two collision events models – “Hit-and-Stand” model and “Hit-and-
Run” model. However, more complicated mechanisms have been developed for
nanoparticle monitor process, all of which are based on these two models.[155-159]
1.3.4 Electrochemical and surface-enhanced Raman spectroscopy
Raman spectroscopy has been widely applied to identify vibration modes of the
materials and molecules including intermolecular chemical bonding and the
intramolecular bonds. [160-162] However, due to the weak intensity of signals of
chemical bonds, conventional Raman is capable to trace analysis and single entity
detection. With the development of SERS technique, the signal intensity could be
magnified as much as 1010 to 1011, which means potential single entity analysis using
this technique.[163, 164] In 1997, two groups almost published their own work at the
same time on the observation of single-molecule surface-enhanced Raman
spectroscopy (SMSERS), which made probing single molecules fundamental
chemistries possible.[75, 77] With recent development in SERS technique, it has
become possible to combine the Raman technique for studying molecular switching
and chemical reaction and remaining their physical and chemical activities during the
measurements.[54, 55, 57, 165]
In 2015, the electrochemical tip-enhanced Raman spectroscopy (TERS) system,
donated as EC-TERS, was first developed by introducing the light horizontally to the
-28-
electrochemical scanning tunnelling microscopy (STM) cell and focused on the gap
between the well-controlled tip and planar substrate to acquire potential-dependent
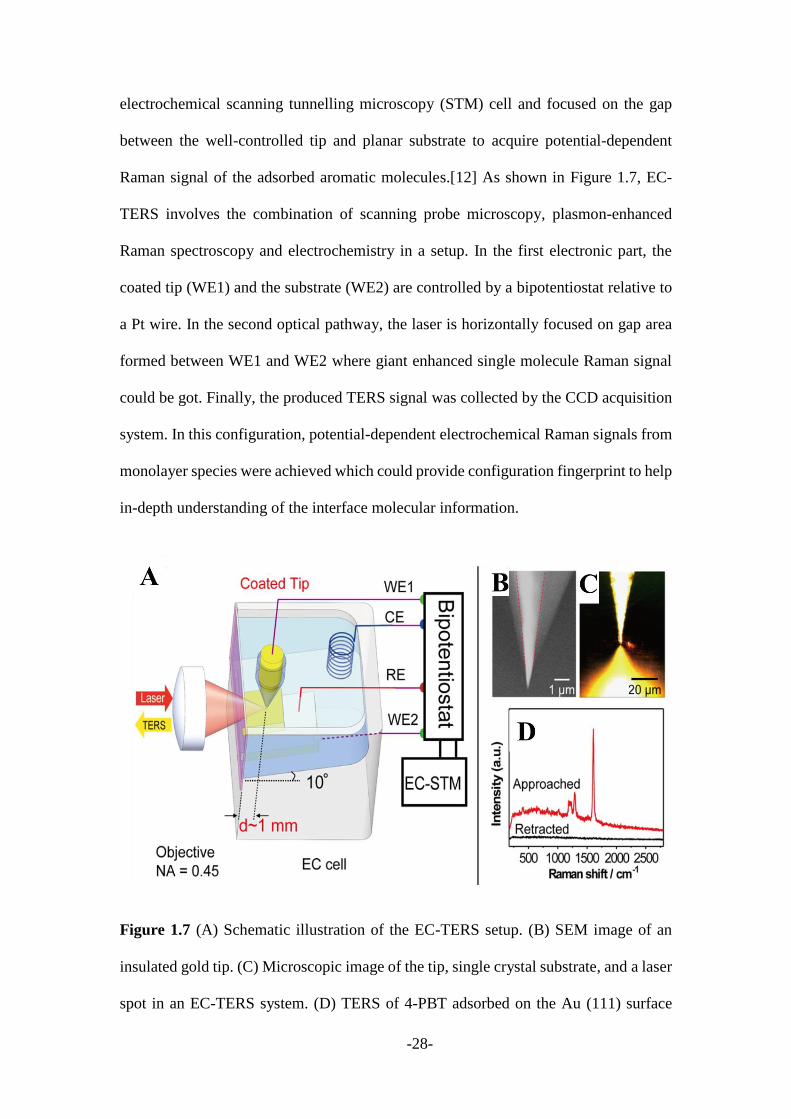
Raman signal of the adsorbed aromatic molecules.[12] As shown in Figure 1.7, EC-
TERS involves the combination of scanning probe microscopy, plasmon-enhanced
Raman spectroscopy and electrochemistry in a setup. In the first electronic part, the
coated tip (WE1) and the substrate (WE2) are controlled by a bipotentiostat relative to
a Pt wire. In the second optical pathway, the laser is horizontally focused on gap area
formed between WE1 and WE2 where giant enhanced single molecule Raman signal
could be got. Finally, the produced TERS signal was collected by the CCD acquisition
system. In this configuration, potential-dependent electrochemical Raman signals from
monolayer species were achieved which could provide configuration fingerprint to help
in-depth understanding of the interface molecular information.
Figure 1.7 (A) Schematic illustration of the EC-TERS setup. (B) SEM image of an
insulated gold tip. (C) Microscopic image of the tip, single crystal substrate, and a laser
spot in an EC-TERS system. (D) TERS of 4-PBT adsorbed on the Au (111) surface
-29-
obtained while the tip was approached (top) and retracted (bottom).[12]
In such a EC-TERS cell, the generated electromagnetic field is highly confined to the
vicinity of the gold tip apex, providing a single-molecule sensitivity and a sub-
molecular spatial resolution.[48, 49] The tip (WE1) shown in Figure 1.7 has two
important roles. Firstly, this sharp metallic nanotip could confine the local mode of
surface plasmon and produce enhanced electromagnetic field near the tip apex, which
could excite Raman scattering from the nanoscopic volume of analytes attached on the
tip surface. Secondly, this tip also works as a working electrode allowing tunnelling
current to pass. The technique of TERS has been demonstrated to improved detection
spatial resolutions and been explored for further wider applications, such as TERS
imaging.[166-171] Combining the chemical information provided from TERS and the
high spatial resolution details from AFM or STM, the vital insight into the molecular
distribution of complex samples could be predicted that is unachievable by any other
optical or analytical methods.
In the TERS system, to acquire strong enhancement factor, the apex of the probe tip
should be sharp (typically 20 nm) and smooth enough. However, further modification
on the tip surface could greatly decrease its enhancement factor. The nanoparticle-
assisted SERS technique could help to overcome the mentioned limitations of TERS
system. The nanogap between the nanoparticles and substrates, also known as the hot
spots, provides gigantic field enhancement towards molecules within the junction.[172]
Compared with the TERS, this nanoparticle-assisted SERS technique shows not only
greater stability and higher spatial resolution but also the diversity of nanoparticle and
substrate surface modification.[75, 173-175] Richard et al has developed SERS to map
molecular vibration with gold nanocomponents in a ‘nanoparticle-on-mirror’
-30-
geometry.[175] A junction model was formed by placing a gold nanoparticle directly
on a lipid alkanethiol hybrid bilayer modified gold, an intense gap plasmons are
assembled and provide molecular identification within the gap zone. By precisely
controlling the well-defined metal-molecule-metal junction, Bi and co-authors have
probed the voltage-driven conformation of a two-state molecular switch with SERS by
employing a tetragonal tip serving as an electrode.[57]
Integrated approach combined electrochemistry and surface-enhanced Raman
technology (EC-SERS) based on a single nanoparticle is an excellent method that
enables the study of the fundamental features of the formed nanojunction.[176, 177]
The advantage of this technique is that both the tunnelling current and Raman spectrum
revolution can be observed at the same time during a single nanoparticle nanoelectrode
collision process in a solution. The plasmonic molecular junction was formed when
nanoparticle diffuse to the SAMs modified electrode surface. Two kinds of collision
events – “Hit-and-Stand” and “Hit-and-Run” were distinguished from the time-
resolved EC-SERS technique. No changes were observed in SERS spectra with only
spike current recorded, which could assign to “Hit-and-Run” model. While clear
enhanced Raman signals were integrated with the observation of step case current,
showing a “Hit-and-Stand” event. The vibration the SERS spectrum illustrated the
junction transformation during the collision process. This method could lead to an in-
depth understanding of molecule junction interaction and provide a novel platform to
study molecular changes at single entity level.
1.4 Research questions
The single entity detection is important for understanding the fundamental chemical,
physical and biological questions. However, the present techniques or methods in single
-31-
molecule detection is quite expensive, time-consuming and difficult to follow one
single molecule monitoring in solution. In my Ph.D. project, a nanoparticle collision
method could potentially offer a new electrochemical detection approach for metal
nanoparticle, organic nanoparticle and biomolecules analysis. Through the
electrochemical signal, I can clearly “see” their movements in solution and monitor
their status. Measuring the small changes in electrochemical current and structure
revolution from Raman technology associated with the single molecule is one of the
key challenges, which needs great effort to tailor the surface functionalities on both a
nanoparticle and an electrode surface as well as update the experimental conditions with
high sensitivity and veracity.
My Ph.D. project aims to explore a simple yet innovative nanoparticle collision
electrochemical technique to monitor the formation process of chemical bonds and
understand and reveal the fundamentals of single molecules and chemical information
during the nanoparticle-electrode collision events. Four research questions will be
addressed in this project.
1) What is the tunnelling effect towards electrochemical kinetic of nanomaterials
mediated SAMs electrodes?
2) How electrochemical techniques could be used for ultrasensitive detection of
single molecules?
3) How could the chemical bonds formation be monitored? Especially monitor
the intermediate during the nanoparticle collision events.
4) How to investigate the structure and stability of SAMs on electrodes?
1.5 Research aims of my Ph.D. project
-32-
1) To explore the influence and kinetics of electro transfer through nanomaterials
mediated SAMs modified electrodes.
2) To real-time monitor the formation process of the covalent bond during the
nanoparticles-electrode collision events.
3) To monitor the formation of an intermediate of a chemical reaction by both a
combined electrochemistry and SERS technique.
4) To further understand the structural, chemical, microscopic information of
SAMs modified electrode.

-33-
Chapter 2: Experimental methodology
-34-
This chapter includes all chemical reagents, experimental methods and characterization
techniques that applied in my research thesis. These include the synthesis and surface
functionalization of various nanomaterials (graphene, graphene oxide, boron nitride,
MoS2, gold nanoparticle), gold electrode polish and surface modification as well as the
nanoelectrode preparation and so on.
2.1 Chemicals and reagents
Butanethiol (But4, 99%, Sigma-Aldrich, Australia), Hexanethiol (Het6, 99%, Sigma-
Aldrich, Australia), (Oct8, 98.5%, Sigma-Aldrich, Australia), Undecanethiol (Unt11,
98%, Sigma-Aldrich, Australia), Potassium ferricyanide (K3[Fe(CN)6], 99%, Sigma-
Aldrich, Australia), N,N-Dimethylformamide (DMF,), potassium chloride (KCI, ≥99%,
Sigma-Aldrich, Australia), L-ascorbic acid (99.9%, Sigma-Aldrich, Australia), graphite
flakes (Sigma-Aldrich), ethanol (Sigma-Aldrich, Australia ), Microperoxidase-11 (MP-
11, Sigma-Aldrich, Australia), Lomant’s reagent, i.e. 3, 3´-Dithiodipropionic acid
di(N-hydroxysuccinimide ester) (Sigma-Aldrich, Australia), 3-mercaptopropanoic acid
(MPA, Sigma-Aldrich, Australia), sodium phosphate dibasic anhydrous (Na2HPO4,
99.5%. Sigma-Aldrich, Australia), sodium chloride (NaCl, 99.6%, Sigma-Aldrich,
Australia), hydrogen peroxide (30%, Sigma-Aldrich, Australia), dimethyl sulfoxide
(DMSO, Sigma-Aldrich, Australia), sulfuric acid (98%, Fisher Scientific), cysteamine
(CA, Sigma-Aldrich, Australia), high density polyethylene (HDPE, Sigma-Aldrich,
Australia) were used directly without further purification. Phosphate Buffered Saline
(PBS) powder (pH 7.4) and absolute Ethanol (200 proof) were purchased from Fisher
Scientific.
All the aqueous solutions were prepared using deionized (DI) water (~18 M ohm). All
thiol solutions were prepared by dissolving the alkanethiols in ethanol with a
-35-
concentration of 10 mM. Millipore water (18 MΩ cm) was used to wash the electrodes
and prepare buffer solutions in all experiments.
2.2 Sample preparations
2.2.1 Synthesis of chemically reduced graphene oxide nanosheets (CRGOs)
Graphene oxide dispersed in aqueous solution was synthesized using a modified
Hummers’ Method.[178, 179] In a typical experiment, 2 g of graphite flakes were
mixed with 12 mL of concentrated H2SO4 (98 wt. %) and kept stirring at 80 °C for 5 h
on a heating plate. Then the solution was cooled at room temperature and ultrasonicated
using a water bath sonicator (VWR industries, GRANXUBA3) for another 5 h to break
the larger flakes into smaller flakes. The mixture was diluted with 500 mL of distilled
water and left overnight. The settled preoxidized graphite flakes were obtained by
filtering the solution with porous filters (200 nm pore size). The residue was dried at
80 °C in a drying oven to remove water quickly. To further transform the preoxidized
graphite into graphite oxide, the resultant powder was put into 120 mL H2SO4 (98
wt. %). Next, KMnO4 (15 g) was added slowly (within 1 h) and the mixture was then
stirred at room temperature for at least 2 h. The solution was diluted with 250 mL of DI
water very carefully and stirred for another 2 h, and then 700 mL DI water was added.
Within a short period of time, 20 mL of H2O2 (30 %) was added to the mixture until the
colour turned bright yellow. Ultrasonication was conducted for 4 h to exfoliate
graphene oxide sheets from the oxidized product. The resultant dispersion was divided
into 15 mL batches and centrifuged at 10,000 rpm for 30 min (Eppendorf centrifuge
5810R). Pellets were re-dissolved in 1:10 HCl (32 % w/w) with vigorous shaking and
centrifuged for 10 min to remove unwanted metal ions. This was repeated another two
times. Then pellets were collected and dissolved in 10 mL DI water and centrifuged for
-36-
10 min at 10,000 rpm to remove the acid. Centrifugation was performed repeatedly with
DI water until the light-yellow supernatant was obtained which were GO sheets.
The chemical reduced graphene oxide nanosheets (CRGOs) at different degrees of
reduction has been previously published.[101, 179] To prepare the CRGOs, L-ascorbic
acid was added into GO solution (1 mg/mL) in a 10:1 ratio followed by addition of
ammonia and subjected to continuous stirring at different time intervals (3, 4 and 6
hours), which were donated as CRGO3, CRGO4 and CRGO6, respectively. These
CRGOs were then dispersed into DMF (1 mg/mL) for further use.
2.2.2 Preparation of boron nitride-NH2 nanosheets
The -NH2 functionalized boron nitride nanosheets (BN-NH2) were prepared according
to an urea-assisted solid exfoliation method and briefly described below.[180] The h-
BN was firstly mixed with urea powder (weight ratio 1:60) and then processed by
planetary ball milling method for 20 hours under nitrogen atmosphere. The high
rotation speed (700 rpm) could effectively exfoliate the h-BN to single or few layered
BN nanosheets. The added urea regents could not only assist the exfoliation and protect
the BN nanosheets from excessive mechanical damage but also endow the nanosheets
with plenty of amino groups.[181] Finally, the collected mixture was further washed
and then centrifuged to get uniform sized BN nanosheets for the electrode surface
modification.
2.2.3 Preparation of MoS2 nanosheets
MoS2 nanosheets were synthesised using an adapted sol-gel method.[182] In a typical
process, about 0.5 g molybdenum chloride (MoCl5, Aldrich, 99 %) and 1.67 g thiourea
((NH2)2CS, Alfa-Aesar, 99 %) were mixed firstly and followed by slowly adding
-37-
ethanol with stirring until all powder was dissolved. The mixed solution was dried, and
then brown gel-like precursor powders were formed after drying and transferred into a
quartz boat and heated in a tube furnace for 3 h under argon flow at 550 °C. The final
product was then sonicated dispersed into DMF.
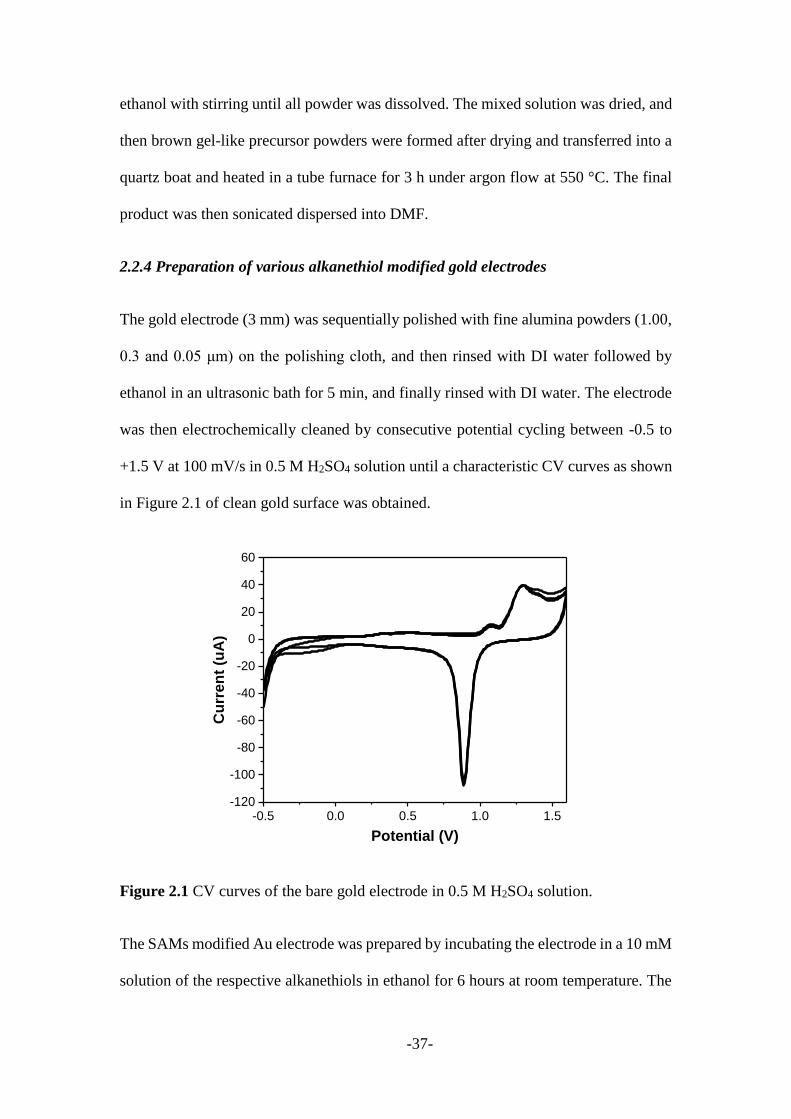
2.2.4 Preparation of various alkanethiol modified gold electrodes
The gold electrode (3 mm) was sequentially polished with fine alumina powders (1.00,
0.3 and 0.05 μm) on the polishing cloth, and then rinsed with DI water followed by
ethanol in an ultrasonic bath for 5 min, and finally rinsed with DI water. The electrode
was then electrochemically cleaned by consecutive potential cycling between -0.5 to
+1.5 V at 100 mV/s in 0.5 M H2SO4 solution until a characteristic CV curves as shown
in Figure 2.1 of clean gold surface was obtained.
Figure 2.1 CV curves of the bare gold electrode in 0.5 M H2SO4 solution.
The SAMs modified Au electrode was prepared by incubating the electrode in a 10 mM
solution of the respective alkanethiols in ethanol for 6 hours at room temperature. The
-0.5 0.0 0.5 1.0 1.5-120
-100
-80
-60
-40
-20
0
20
40
60
Cu
rre
nt
(uA
)
Potential (V)
-38-
electrode was rinsed with ethanol and dried under a nitrogen atmosphere for further
purpose.
2.2.5 Fabrication of 2D nanomaterials mediated SAMs electrodes
The immobilisation of the CRGOs on the SAMs surface was achieved by dipping the
electrode into CRGOs dispersion in DMF (1 mg/mL). Sufficient time (2 hours) was
required for dipping in order to get a proper attachment of CRGOs on to the SAMs
electrode. The electrode was then rinsed with DMF followed by deionised water to
remove the unbound CRGOs and then dried under a nitrogen atmosphere prior to
running the experiment.
The immobilisation of BN-NH2 on the SAMs surface was obtained by incubating the
electrode in BN-NH2 dispersion (1 mg/mL) for around 4 hours. The electrode was
rinsed with deionised water to remove the unbound BN-NH2 and then dried under a
nitrogen atmosphere before running the experiments. Similarly, the SAMs terminated
electrode was immersed in MoS2 solution for 4 hours to afford the MoS2 nanosheets
functionalized electrode.
2.2.6 Preparation of MP-11 functionalised reduced graphene oxide (MP-11/rGO)
nanosheets
The rGO nanosheets were functionalised with MP-11 by non-covalent methods and
formed a sandwich structure with MP-11 on both sides of rGO sheets.[183] The details
about the preparation and characterization of rGO nanosheets and self-assembly of MP-
11 functionalised rGO sheets were reported in our previous published paper.[183] The
standard concentration of MP-11 and rGO in electrolyte solution is 0.018 and 0.005 mg
mL-1, respectively. The sizes of rGO nanosheets were measured by atomic force
-39-
microscope (AFM) to be 40 ± 10 nm.
The MP-11/Graphene was prepared by a self-assembly method. 1 mL graphene (0.05
mg/mL) and 1 mL MP-11 (0.186 mg/mL) were added into a vial and the mixture was
diluted to 10 mL and stirred for overnight at room temperature. The MP-11 can
immobilize with the graphene. Then the MP-11 will self-assembly on the surface of
graphene. The MP-11/graphene solutions should be washed to remove the excess MP-
11 molecules. After washing the volume of MP-11/graphene solution was adjusted to
10 mL.
2.2.7 Preparation and surface modification of gold nanoparticles
45 nm gold nanoparticles (GNPs) were synthesized from HAuCl4 through chemical
reduction method according to our previous report. [184, 185] 1 mL of 5 mM HAuCl4
solution was added to 18 mL deionized water under stirring and the mixture was heated
till boiling. 0.365 mL 0.5 wt. % sodium citrate worked as the reducing agent was added
to reduce the Au3+ to Au0 by heating and stirring until the colour change was evident.
The final solution was topped up to 20 mL and the final concentration of the prepared
gold colloid was approximately 0.25 mM.
Fresh prepared GNPs solution was functionalized with Lomant regents by self-
assembly method and formed NHS ester terminated GNPs. 100 uL of 5 mM Lomant
solution was added to 2 mL GNPs solution and gently stirred for 4 hours. The mixture
solution was further washed by centrifuge to remove excess Lomant regents. The final
product was adjusted to 2 mL, the concentration of Lomant-GNPs was about 150 pM.
2.2.8 Preparation of gold nanoelectrodes (GNE) and surface area characterization
A standard two-stage electropolishing method was applied to prepare the nano-sized
-40-
gold electrode.[186] In the first “rough-polishing” step, 10 mm gold wire (0.25 mm,
99.998%) was dipped into a beaker containing electrolyte solution that mixed by
ethanol and hydrochloric acid (v:v=1:1). A Pt wire bent at one end to form a ring was
applied as the cathode electrode, the sample worked as the anode electrode. The applied
AC voltage is with a frequency of 4.2 kHz and amplitude of 25.5 V. In this stage, the
sampled was gradually polished until the sample’s end diameter was sufficiently
lowered. For the second “micro-polishing” stage, the sample tip top was gently
immersed below the solution level and continued sharpened with a lower AC with an
amplitude of 13.4 V at the same frequency to its final dimensions. For the second
“micro-polishing” stage, the sample tip was repeatedly pushed through the loop that
holds a drop of electrolyte (2 % perchloric acid and 2-butoxyethanol solution) and
sharpened to its final dimensions. After the electropolishing process, the sample was
sufficiently washed with ethanol and dried by compressed air to get rid of the electrolyte
solution. The etched sample was insulated with paraffin wax according to a previously
published method[186] to afford the final gold nanoelectrode (GNE). The effective
surface area and the quality of a GNE were determined by voltammetry of ferrocene
solution and SEM images.

-41-
Figure 2.2 (A to E) Several images about the gold nanoelectrode preparation process.
2.2.9 Preparation of palladium tips and HDPE coated electrodes
To conduct atom probe tomography, needle-shaped tips with tip diameter less than 100
nm are prepared with a standard two-stage electropolishing method similar to the gold
nanoelectrode preparation method.[136, 187] Prior to the polishing process, 10 mm
palladium wire (0.25 mm, 99.9 %) was cut and mounted into a copper tube. In a first
“rough-polishing” step, the sample was dipped into a beaker containing 30 mL
electrolyte solution that mixed by 10% perchloric acid and glacial acetic acid. A gold
wire that bent at one end to form a ring was applied as the cathode electrode, the sample
worked as the anode electrode. The applied voltage range varies from 20 - 24 V
according to the etching rate. In this stage, the sampled was gradually polished until the
sample’s end diameter was sufficiently lowered. For the second “micro-polishing”
stage, the sample tip was repeatedly pushed through the loop that holds a drop of
-42-
electrolyte (2 % perchloric acid and 2-butoxyethanol solution) and sharpened to its final
dimensions. After the electropolishing process, the sample was sufficiently washed
with ethanol and dried by compressed air to get rid of the electrolyte solution.
To prepare the palladium nanoelectrode (PDNE) for the electrochemical purpose, the
etched palladium tip (PDT) was insulated with high-density polyethylene (HDPE)
according to a previously published method[186] to afford the final PDNE. The
effective surface area and the quality of a PDNE were determined by voltammetry of
ferrocene solution and SEM image.
Adsorbed impurities on the palladium surface may hinder electrochemical processes
and the formation of SAMs. Before coating by alkanethiols monolayer, specimen
surface cleaning is essential for both PDT and PDNE. PDT for APT measurement was
“pre-evaporated” with an APT microscope (LEAP 4000HR, Cameca Instruments) until
0.5 million atoms achieved to remove all contaminations on its surface and to form a
spherical shaped apex. While the PDNE was electrochemical fresh in 0.5 M H2SO4
electrolyte from 0 to 1.2 V at a scan rate of 50 mV/s until reproducible scans recorded
(typically 50 cycles). In this cyclic voltammetry method, a monolayer of Pd-oxide was
first electrochemically formed and then reduced. Fresh cleaned PDT and PDNE were
immediately immersed in 5 mM alkanethiols (octanethiol and decanethiol respectively)
solution (in ethanol) for 4 hours to afford a uniform monolayer over tip surface. After
coating, PDT was carefully washed with ethanol to remove physically adsorbed regents
and immediately transferred into APT buffer chamber. SAM-modified PDNE was been
carefully washed with ethanol and then used for electrochemical analysis.
2.3 Characterization techniques
-43-
2.3.1 UV-visible spectroscopy
The MP-11 functionalized graphene nanocomposites were characterized by UV
spectroscopy. All the scans were performed in a continuous mode from 800 nm to 350
nm using quartz cuvette of path length 1 mm, with a scan rate of 500 nm/min and data
interval of 1 nm using Varian Cary 300. A quartz cuvette with a light path of 1 mm was
applied for the measurement. All samples were prepared in an aqueous or organic
solution. Sonication was used to help the samples better disperse.
2.3.2 Raman spectroscopy
Raman measurements were conducted using Renishaw Invia Raman
Microspectrometer (Reinshaw plc, Gloucestershire, UK), equipped with 457, 514 and
633 nm laser, 1800 or 2400 grating and a thermo-electrical cooled CCD detector.
2.3.3 Zetasizer
The particle size and surface charge of graphene nanosheets, gold nanoparticle and their
composites after functionalization were measured using Zetasizer nano ZS. All the
measurements were repeated for at least 3 times at room temperature with a certain
refractive index and equilibration time of 2 min.
2.3.4 Atomic force microscopy (AFM)
Bruker Multimode 8 AFM (USA) was used in peak force quantitative nano-mechanical
imaging mode. For imaging graphene nanosheets, a highly diluted graphene nanosheets
solution was drop cast on a freshly cleaved mica surface that mounted on a spin coater
(WS-650MZ-23NPP) and dried at room temperature. To characterize the 2D
nanomaterial mediated SAMs electrode, a gold wafer was selected as the substrate and
-44-
then modified as the same way of electrode modification. The obtained images were
processed using Nanoscope Analysis (Version 8.1) provided with the instrument and
the height profile was obtained by WsXM (Nanotech Electrica, S.L., Spain).
2.3.5 Transmission electron microscopy (TEM)
The gold nanoparticle was examined using TEM (JEOL 2100 LaB6, USA). A drop of
diluted gold nanoparticle solution was taken on the TEM grid and dried in a vacuum
oven and finally inserted into the TEM chamber.
2.3.6 Scanning electron microscopy (SEM)
The as-prepared sharp metal tip and HDPE coated nanoelectrodes were characterized
by SEM (Zeiss Supra 55VP). The tip and coated electrode were mounted on the sample
platform with carbon tip and then stored in a vacuum chamber at least overnight before
SEM test.
2.3.7 Electrochemical measurements
Cyclic voltammetry (CV) and electrochemical impedance spectroscopy (EIS) were
carried out with CHI 760E (USA) electrochemical workstation in a three-electrode
system consisting a reference electrode (Ag/AgCl), a counter electrode (platinum wire)
and a working electrode (Au electrode). Before all electrochemistry tests, the electrolyte
was saturated with nitrogen for 15 min to remove the soluble oxygen. The CV
experiments were taken from -0.2 to 0.6 V at 100 mV/s in 1 M KCl solution containing
10 mM Fe(CN)63-/4-. And the EIS was performed at the steady open circuit potential
with a peak- to- peak amplitude of the sinusoidal perturbation of 10 mV and a frequency
range from 100 kHz to 10 MHz.
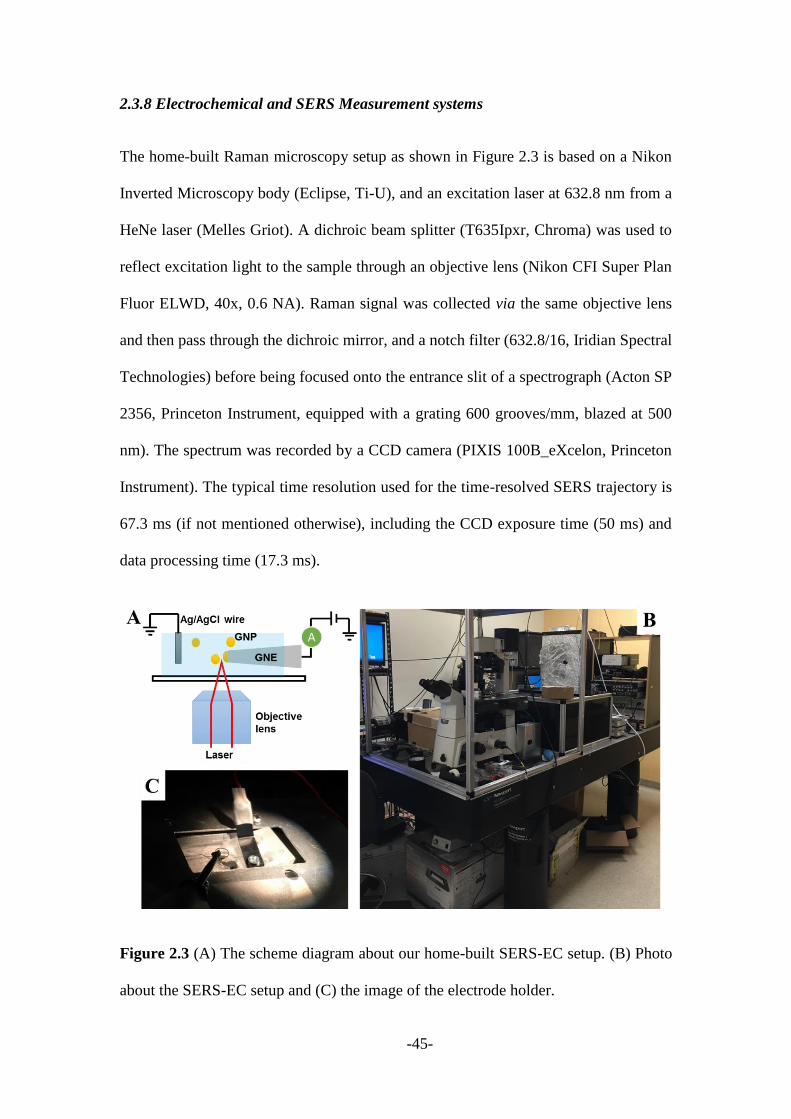
-45-
2.3.8 Electrochemical and SERS Measurement systems
The home-built Raman microscopy setup as shown in Figure 2.3 is based on a Nikon
Inverted Microscopy body (Eclipse, Ti-U), and an excitation laser at 632.8 nm from a
HeNe laser (Melles Griot). A dichroic beam splitter (T635Ipxr, Chroma) was used to
reflect excitation light to the sample through an objective lens (Nikon CFI Super Plan
Fluor ELWD, 40x, 0.6 NA). Raman signal was collected via the same objective lens
and then pass through the dichroic mirror, and a notch filter (632.8/16, Iridian Spectral
Technologies) before being focused onto the entrance slit of a spectrograph (Acton SP
2356, Princeton Instrument, equipped with a grating 600 grooves/mm, blazed at 500
nm). The spectrum was recorded by a CCD camera (PIXIS 100B_eXcelon, Princeton
Instrument). The typical time resolution used for the time-resolved SERS trajectory is
67.3 ms (if not mentioned otherwise), including the CCD exposure time (50 ms) and
data processing time (17.3 ms).
Figure 2.3 (A) The scheme diagram about our home-built SERS-EC setup. (B) Photo
about the SERS-EC setup and (C) the image of the electrode holder.
-46-
An Axon 200B patch clamp amplifier (Molecular Devices Inc., CA) in voltage clamp
mode was placed in a sound-proof Faraday cage and used to supply the bias and amplify
the current. The i-t traces were recorded with an Axon Digidata 1440A analog-digital
converter (Molecular Devices Inc., CA). In the electrochemical cell, the GNE was used
as working electrode, and Ag/AgCl wire as a quasi reference electrode. No counter
electrode was used because the current through the electrodes is very small. The
Ag/AgCl electrode was always grounded and the working electrode was biased relative
to the Ag/AgCl electrode. The i-t traces were typically recorded as follows: first, the i-
t curve was recorded at +0.6 V for 10 min in 40 µL solutions of 10 mM PBS (pH=7.4)
with 3 mM Potassium Ferrocyanide. Then, Faraday cage was opened and 40 µL 150
pM GNPs were injected. The colour of the testing solution is uniform immediately after
injection. All measurements were performed at room temperature.
Current Data Analysis. The current spikes were analysed by Clampfit (Molecular
Devices Inc.) and home-built programs. The spikes were detected by a threshold event
detection method.[188, 189] The mean value of the baseline current was used as the
baseline for event detection. For noisy curves, the baseline was smoothed by the moving
average method with various window sizes, which can range from 1000 points (20 ms)
to 30000 points (600 ms). The threshold is usually 5 times the standard deviation σ of
the local noise background. If we use a window size of 1000 points (or 20 ms), the
threshold is typically 0.4-0.6 pA. We normally used the mean value of points at the
current spike top for the spike height.
2.3.9 Density functional theory
The simulated geometry optimization and Raman spectra were calculated by using
density functional theory (DFT) methods. The DFT method in the flavor of B3LYP was
-47-
used for the geometry optimizations and vibrational frequency calculations. The basis
sets for carbon, nitrogen, hydrogen, oxygen and sulphur atoms were 6-311+G**.[190]
For gold, the valence electrons and the internal shells were described by the basis
functions, LANL2DZ, and the corresponding relativity effective core potentials.[24]
Computational simulations were carried out with the Gaussian 09 program package.[23]
A scaling factor of 0.963 was used to assign all vibrational bands.
2.3.10 Atom probe tomography
Atom Probe Tomography (APT) measurements were conducted using a local electrode
atom probe (LEAP 4000 HR, Cameca Instruments) in pulsed-voltage mode.
Experiments were carried out in analysis chamber with pressure below 9 × 10¹¹ Torr
and specimen temperature was about 60 K. A constant fraction of 15% DC voltage was
sent to the local electrode with a voltage pulse frequency of 200 kHz. The evaporated
ions were collected with a sensitive detector with a detection rate of 0.5% (0.005
ions/pulse). Reconstruction and visualization of obtained APT data were performed
using IVAS 3.6.12 software (Cameca Instruments).
-48-
Chapter 3: Formation of efficient electron transfer pathways
across self-assembly monolayers by 2D nanomaterials
-49-
In this chapter, I studied the influence of 2D nanomaterials (chemically reduced
graphene oxide sheets, boron nitride and molybdenum disulfide nanosheets) on the
efficient electron transfer pathways across the various alkanethiol monolayers insulated
gold electrodes. The gold electrodes were firstly passivated with methyl or carboxylic
acid terminated alkanethiols with different carbon chain length (n =4, 6, 8 and 11) and
followed attachment of 2D nanomaterials via the hydrophobic or electrostatic
interaction. Both CV and EIS measurements were performed to explore the 2D
nanomaterials mediated electrochemical kinetics. By using the potassium ferricyanide
as a redox probe, we observed that these 2D nanomaterials effectively enhanced the
heterogeneous electron transfer (ET) through the SAMs due to the tunnelling effect.
Electron transfer rates were also calculated and compared in this chapter.
3.1 Introduction
Understanding and controlling chemical interactions at the nanoscale is a grand
challenge for many fields, including nanotechnology, chemistry, physics and materials
science.[191-193] The ultimate goal of research in this field is to rationally engineer
nanostructured materials with programmable structures and predictable properties
through molecular design, thereby producing desirable bio-functions. SAMs have
attracted considerable attention because they are not only easy to form but also show
good affinity to bind with a broad range of different chemical functional moieties which
can create multi nano-architectures.[194, 195] The frameworks of highly structured and
molecular interfaces obtained via self-assembly have a wide range of applications, such
as the fabrication of electron transfer (ET), electrochemical analysis and the
examination of the interactions between the organic functional groups and
nanomaterial.[196-198]

-50-
SAMs has become a popular means of preparing functional interfaces for special
applications. The spontaneous adsorption of n-alkanethiols or their derivatives to the
metal surfaces could leave the metal surface with high order monolayers. It has been
proved that the n-alkanethiols monolayers are impenetrable by the species of interest,
such as solvent molecules or ions, which result in a decrease in the charge transfer
properties. However, carbon nanotubes and metal nanoparticles have been found to be
able to open up pathways for electrochemistry to occur at blocked electrodes.[53, 199]
The first example of this phenomenon was reported by Natan and co-workers[56] using
gold and silver nanoparticles covalently attached to a polymerized silane-modified
platinum electrode. Gooding et al. have covalently immobilized aligned carbon
nanotubes to a gold electrode to allow the attachment of the enzyme at the end of the
nanotubes to achieve direct electron transfer between the enzyme and the electrode.[53]
The same group also investigated the electrochemical properties of carbon tube arrays
modified with alkanethiols, which are attached as SAMs with methyl or carboxyl-1-
alkanethiols of different chain lengths, indicating that the rate of electron transfer can
be affected by the SAMs length, surface polarity and their adsorption kinetics.[200-202]
Most of the studies have outlined the characterization of alkanethiols with carboxylate
terminated and sulfur groups showing that they can control the surface chemistry and
binding of different molecules on to the monolayer.[203]
As a newly discovered member in the carbon family, graphene has attracted strong
scientific and technological interest in recent years.[204-207] For example, due to its
physicochemical properties: large surface area, excellent conductivity and strong
mechanical strength, graphene has been proposed for many potential applications, such
as electronics, energy storage, batteries, fuel cells and solar cells.[208-214] In
electrochemical studies, graphene also generated its own trend in both fundamental and
-51-
promising novel applications due to the outstanding electrical properties they
afford.[215-217] Graphene synthesised by the reduction of GO generally has large
structural defects and functional groups which are more beneficial for electrochemical
studies.[218-221] Furthermore, graphene exhibits excellent electron transfer and
catalytic activity towards some species, such as neurotransmitters and with some
species involved in enzymatic reactions.[222-225] These significant properties make
carbon nanostructures of interest as a new class of electrode material with potential
applications in electrochemical and bio-sensing.[224, 226] In most cases, SAMs tend
to form a very dense and firm film based on the long carbon chain length, which can
block the electron transfer (ET) between the Au electrode surface and redox couple.[87]
Electron transfer can be restored when nanomaterials attached on to the SAMs either
covalently or non-covalently.[152, 200, 227-230]
Motivated by the astonishing success of graphene, alternative layered 2D materials
have become new research hotspot for their unique physical and chemical
properties.[231] By breaking the layered interaction via physical or chemical method
and reducing the thickness of layered material to single or only few layers, some
extraordinary variations may occur in their electronic, magnetic, thermal, optical and
mechanical properties, and woke up their potential applications in the area of catalysis,
electronic, optoelectronic and spintronic devices. Among the 2D nanomaterials family,
graphene and its derivates, Boron nitride (BN, also regarded as “white graphene”),
MoS2 nanomaterials are the most widely researched and commercially developed
nanomaterial for their high stability under ambient environments for monolayers and
excellent combined performance in real life applications.[205, 215, 216] The most
import feature about 2D nanomaterials is their nanosized thickness, which contributes
to the particular physical properties due to the quantum size effect. Some remarkable

-52-
changes occur in electronic and optical properties of layered materials, which may be
due to the electron confinement and also the layers are in close contact with each other
to form interfaces. Therefore, the electron transfer in freestanding atomic layers
afforded the 2D nanomaterials innovative applications in photocatalysts, sensors,
nanoreactors, and nanocontainers.[232]
Mediating the above-mentioned nanodevices by attaching 2D nanomaterials to the
organic molecules passivated electrode surface could provide advantages properties
such as: 1) the insulated monolayer could afford the electrode surface with low
capacitances, 2) making controllable nano arrays on the electrode surface and 3)
introducing new active reaction centre. In the as-formed electrode-organic layer-
nanomaterials assemblies, there is still a primary question about the electron transfer
through such nanoassemblies need to be understood. As to the well-studied gold
nanoparticles (GNPs) fabricated electrode-organic layer-GNPs assemblies, the possible
mechanism proposed by Fermin’s group is that the attached GNPs could increase high
exchange current densities and allow resonant electron transfer across the organic film,
compared with when the nanoparticle is absent, and result in the efficient electron
transfer between redox species in solution and the underlying electrode.[233]
Alternatively, Gooding and co-workers proposed the electronic coupling mechanism
with the GNPs as the Coulombic islands by electrostatically adsorbing the redox species
onto the nanoparticle and bridging the tunnelling route between the electrode surface
and redox molecule.[152] Similarly, 2D nanomaterials such as graphene and its
derivates have been previously proved to have the ability to restore the passivated
electron transfer by us and other groups. Graphene and its derivates mediated electrode
surface exhibited high potential in sensing and catalytic applications.[234-236]
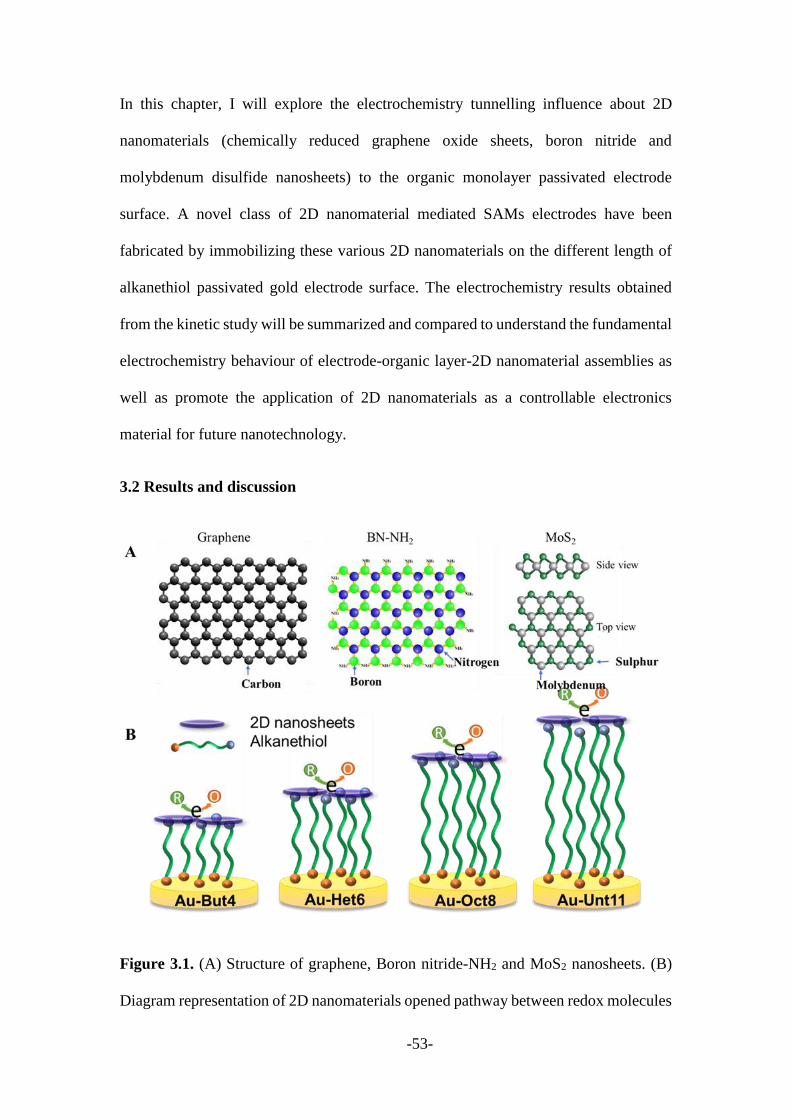
-53-
In this chapter, I will explore the electrochemistry tunnelling influence about 2D
nanomaterials (chemically reduced graphene oxide sheets, boron nitride and
molybdenum disulfide nanosheets) to the organic monolayer passivated electrode
surface. A novel class of 2D nanomaterial mediated SAMs electrodes have been
fabricated by immobilizing these various 2D nanomaterials on the different length of
alkanethiol passivated gold electrode surface. The electrochemistry results obtained
from the kinetic study will be summarized and compared to understand the fundamental
electrochemistry behaviour of electrode-organic layer-2D nanomaterial assemblies as
well as promote the application of 2D nanomaterials as a controllable electronics
material for future nanotechnology.
3.2 Results and discussion
Figure 3.1. (A) Structure of graphene, Boron nitride-NH2 and MoS2 nanosheets. (B)
Diagram representation of 2D nanomaterials opened pathway between redox molecules
-54-
in solution and various length SAMs passivated electrodes surface.
Figure 3.1 displays the structure of graphene, Boron nitride-NH2 and MoS2 nanosheet
separately. Graphene and its derivatives have shown excellent electron transfer ability
and been well studied as the electron transfer mediator materials.[180, 199, 228, 230]
Boron nitride nanosheet (BN) has a typically 2D honeycomb crystalline form of the
hexagonal boron nitride (h-BN). It is well known that BN is an electrical semiconductor
and has a wide band gap of 5.9 eV,[237] which is not suitable for the direct electrode
surface modification. Appropriate doping, functionalization or changing the number of
layers is able to decrease its band gap.[180] For example, amino groups functionalized
BN (BN-NH2) could attract more negative redox probes to its surface.[238]
Furthermore, in the single-layer MoS2 films, Mo4+ and S2- are constructed to a sandwich
structure by covalent bonds in a sequence of S–Mo–S, whereas the sandwich layers are
interacted by relatively weak van der Waals forces.[239] In this study, the 2D
semiconductor nanomaterials BN-NH2 and MoS2 will be adapted to mediate the SAMs
passivated electrode surface, and then compared with other nanomaterials tuned
electrode surface.
As shown in Figure 3.1B, four alkanethiols with different chain lengths (n= 4, 6, 8, and
11) were applied in this work. The spontaneously formed alkanethiol monolayer could
establish a useful barrier structure on the electrode surface and block effective electron
transfer (ET) between the electrode surface and redox probes in solution.[230] And then
the 2D nanomaterials were attached on the -CH3 terminated electrode surface. Similar
as other conductive nanoparticles like gold, palladium and silver nanoparticles, the
semiconductive nanomaterials might be able to open the pathways for electrical
communication through the well-passivated monolayers acting as a “short circuit”
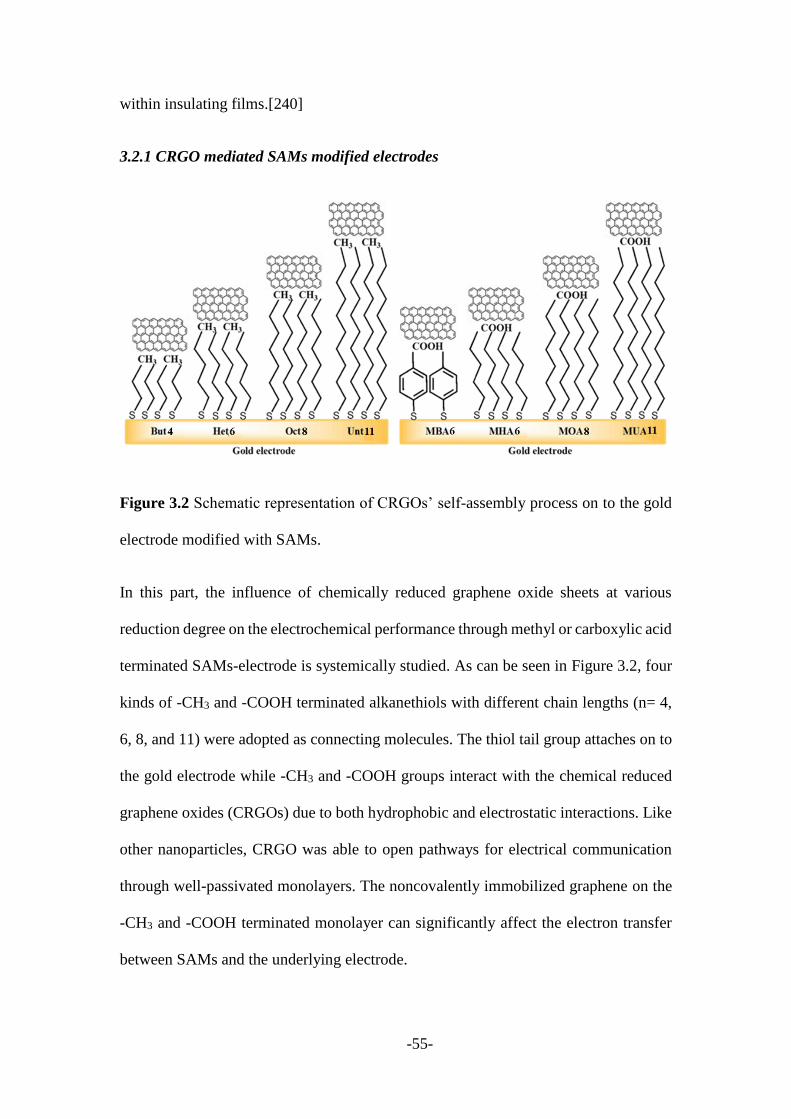
-55-
within insulating films.[240]
3.2.1 CRGO mediated SAMs modified electrodes
Figure 3.2 Schematic representation of CRGOs’ self-assembly process on to the gold
electrode modified with SAMs.
In this part, the influence of chemically reduced graphene oxide sheets at various
reduction degree on the electrochemical performance through methyl or carboxylic acid
terminated SAMs-electrode is systemically studied. As can be seen in Figure 3.2, four
kinds of -CH3 and -COOH terminated alkanethiols with different chain lengths (n= 4,
6, 8, and 11) were adopted as connecting molecules. The thiol tail group attaches on to
the gold electrode while -CH3 and -COOH groups interact with the chemical reduced
graphene oxides (CRGOs) due to both hydrophobic and electrostatic interactions. Like
other nanoparticles, CRGO was able to open pathways for electrical communication
through well-passivated monolayers. The noncovalently immobilized graphene on the
-CH3 and -COOH terminated monolayer can significantly affect the electron transfer
between SAMs and the underlying electrode.
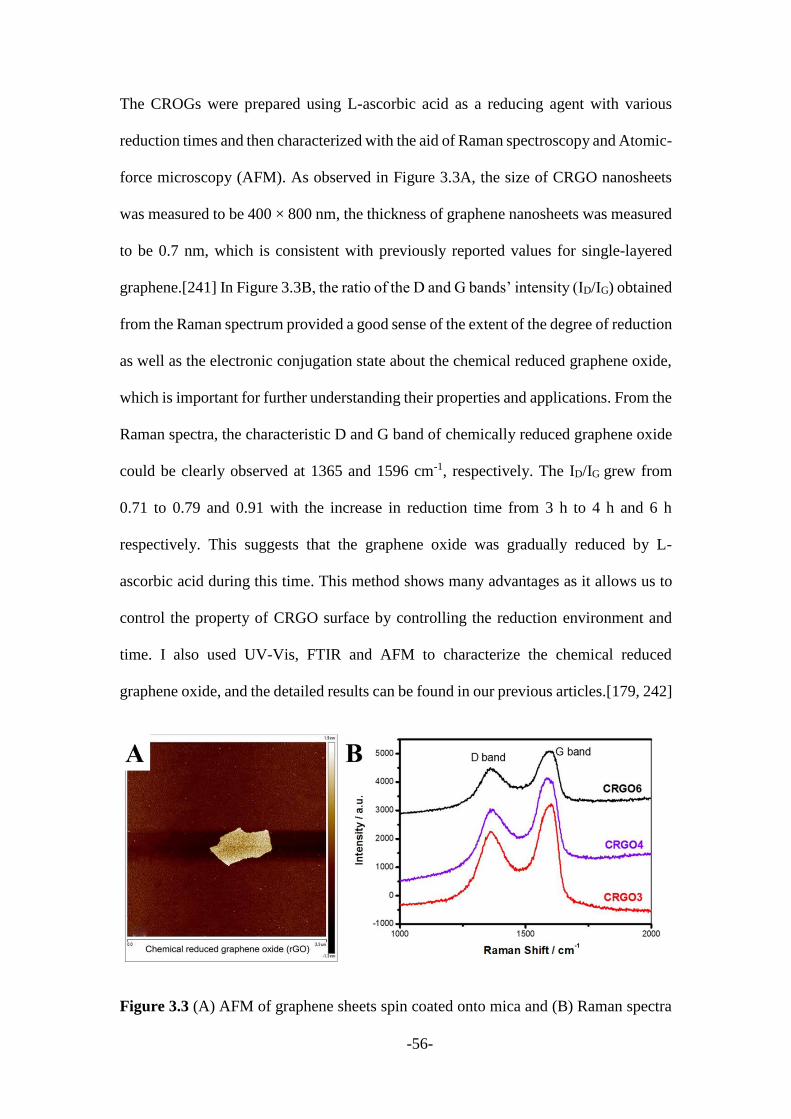
-56-
The CROGs were prepared using L-ascorbic acid as a reducing agent with various
reduction times and then characterized with the aid of Raman spectroscopy and Atomic-
force microscopy (AFM). As observed in Figure 3.3A, the size of CRGO nanosheets
was measured to be 400 × 800 nm, the thickness of graphene nanosheets was measured
to be 0.7 nm, which is consistent with previously reported values for single-layered
graphene.[241] In Figure 3.3B, the ratio of the D and G bands’ intensity (ID/IG) obtained
from the Raman spectrum provided a good sense of the extent of the degree of reduction
as well as the electronic conjugation state about the chemical reduced graphene oxide,
which is important for further understanding their properties and applications. From the
Raman spectra, the characteristic D and G band of chemically reduced graphene oxide
could be clearly observed at 1365 and 1596 cm-1, respectively. The ID/IG grew from
0.71 to 0.79 and 0.91 with the increase in reduction time from 3 h to 4 h and 6 h
respectively. This suggests that the graphene oxide was gradually reduced by L-
ascorbic acid during this time. This method shows many advantages as it allows us to
control the property of CRGO surface by controlling the reduction environment and
time. I also used UV-Vis, FTIR and AFM to characterize the chemical reduced
graphene oxide, and the detailed results can be found in our previous articles.[179, 242]
Figure 3.3 (A) AFM of graphene sheets spin coated onto mica and (B) Raman spectra
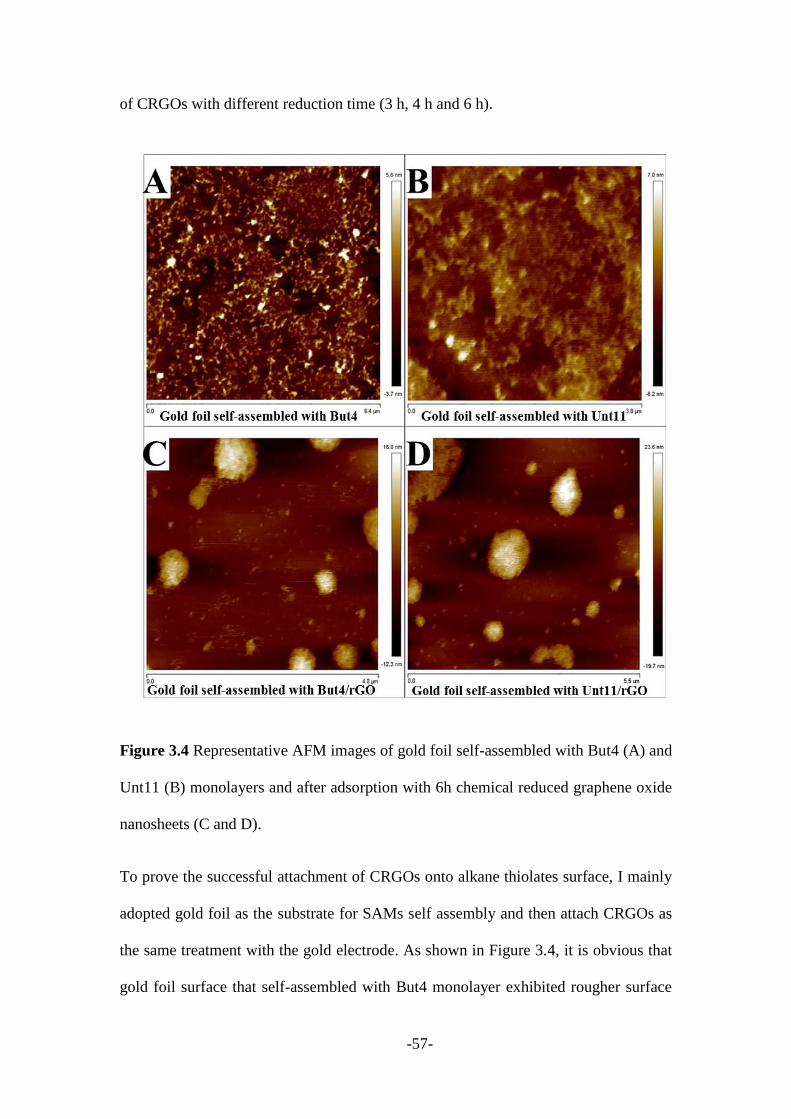
-57-
of CRGOs with different reduction time (3 h, 4 h and 6 h).
Figure 3.4 Representative AFM images of gold foil self-assembled with But4 (A) and
Unt11 (B) monolayers and after adsorption with 6h chemical reduced graphene oxide
nanosheets (C and D).
To prove the successful attachment of CRGOs onto alkane thiolates surface, I mainly
adopted gold foil as the substrate for SAMs self assembly and then attach CRGOs as
the same treatment with the gold electrode. As shown in Figure 3.4, it is obvious that
gold foil surface that self-assembled with But4 monolayer exhibited rougher surface
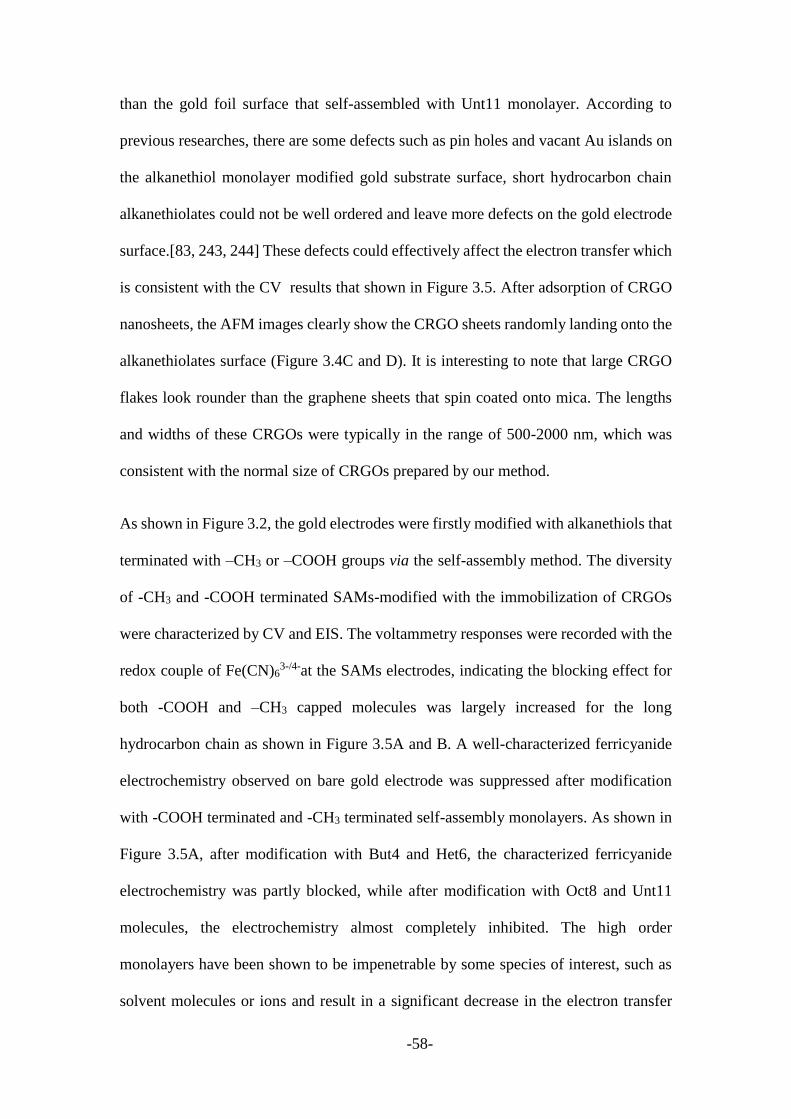
-58-
than the gold foil surface that self-assembled with Unt11 monolayer. According to
previous researches, there are some defects such as pin holes and vacant Au islands on
the alkanethiol monolayer modified gold substrate surface, short hydrocarbon chain
alkanethiolates could not be well ordered and leave more defects on the gold electrode
surface.[83, 243, 244] These defects could effectively affect the electron transfer which
is consistent with the CV results that shown in Figure 3.5. After adsorption of CRGO
nanosheets, the AFM images clearly show the CRGO sheets randomly landing onto the
alkanethiolates surface (Figure 3.4C and D). It is interesting to note that large CRGO
flakes look rounder than the graphene sheets that spin coated onto mica. The lengths
and widths of these CRGOs were typically in the range of 500-2000 nm, which was
consistent with the normal size of CRGOs prepared by our method.
As shown in Figure 3.2, the gold electrodes were firstly modified with alkanethiols that
terminated with –CH3 or –COOH groups via the self-assembly method. The diversity
of -CH3 and -COOH terminated SAMs-modified with the immobilization of CRGOs
were characterized by CV and EIS. The voltammetry responses were recorded with the
redox couple of Fe(CN)63-/4-at the SAMs electrodes, indicating the blocking effect for
both -COOH and –CH3 capped molecules was largely increased for the long
hydrocarbon chain as shown in Figure 3.5A and B. A well-characterized ferricyanide
electrochemistry observed on bare gold electrode was suppressed after modification
with -COOH terminated and -CH3 terminated self-assembly monolayers. As shown in
Figure 3.5A, after modification with But4 and Het6, the characterized ferricyanide
electrochemistry was partly blocked, while after modification with Oct8 and Unt11
molecules, the electrochemistry almost completely inhibited. The high order
monolayers have been shown to be impenetrable by some species of interest, such as
solvent molecules or ions and result in a significant decrease in the electron transfer
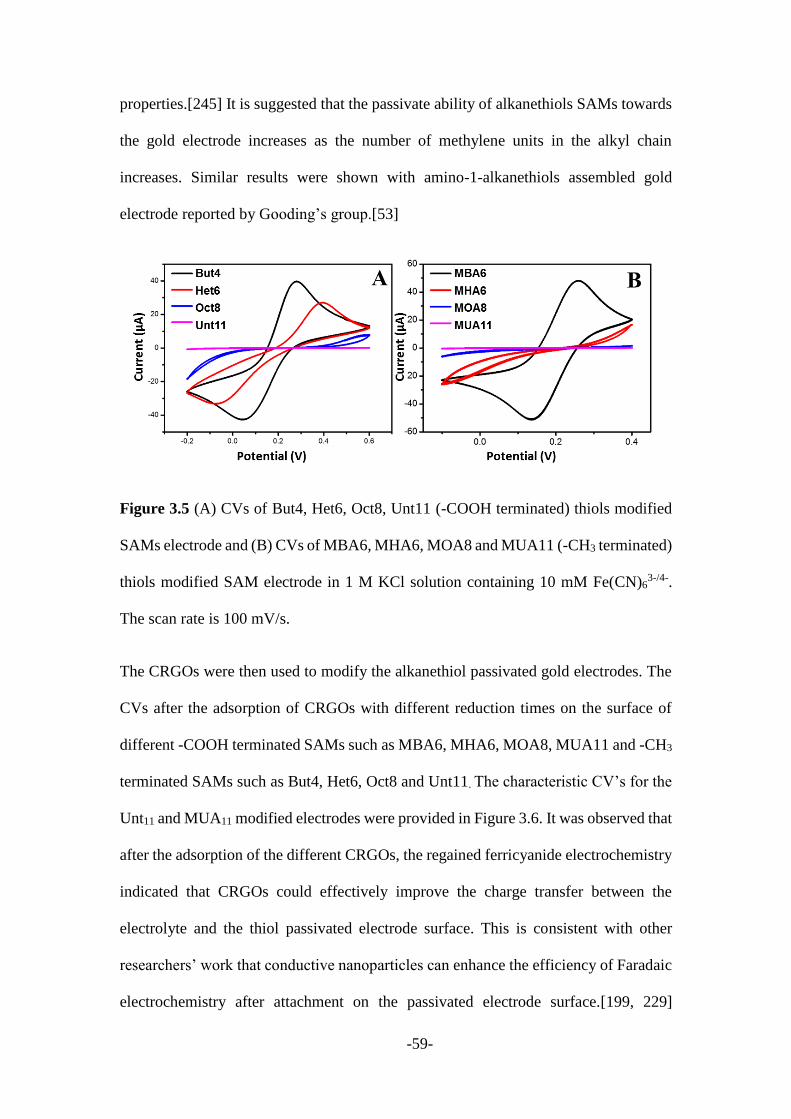
-59-
properties.[245] It is suggested that the passivate ability of alkanethiols SAMs towards
the gold electrode increases as the number of methylene units in the alkyl chain
increases. Similar results were shown with amino-1-alkanethiols assembled gold
electrode reported by Gooding’s group.[53]
Figure 3.5 (A) CVs of But4, Het6, Oct8, Unt11 (-COOH terminated) thiols modified
SAMs electrode and (B) CVs of MBA6, MHA6, MOA8 and MUA11 (-CH3 terminated)
thiols modified SAM electrode in 1 M KCl solution containing 10 mM Fe(CN)63-/4-.
The scan rate is 100 mV/s.
The CRGOs were then used to modify the alkanethiol passivated gold electrodes. The
CVs after the adsorption of CRGOs with different reduction times on the surface of
different -COOH terminated SAMs such as MBA6, MHA6, MOA8, MUA11 and -CH3
terminated SAMs such as But4, Het6, Oct8 and Unt11. The characteristic CV’s for the
Unt11 and MUA11 modified electrodes were provided in Figure 3.6. It was observed that
after the adsorption of the different CRGOs, the regained ferricyanide electrochemistry
indicated that CRGOs could effectively improve the charge transfer between the
electrolyte and the thiol passivated electrode surface. This is consistent with other
researchers’ work that conductive nanoparticles can enhance the efficiency of Faradaic
electrochemistry after attachment on the passivated electrode surface.[199, 229]
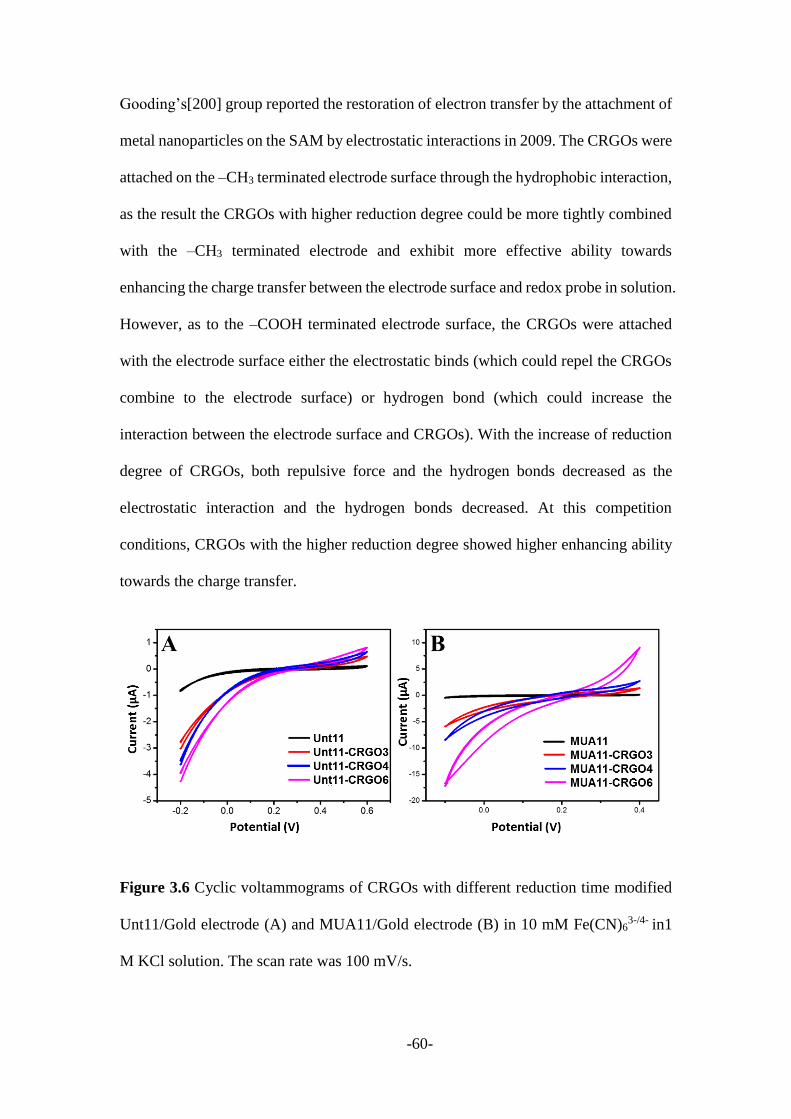
-60-
Gooding’s[200] group reported the restoration of electron transfer by the attachment of
metal nanoparticles on the SAM by electrostatic interactions in 2009. The CRGOs were
attached on the –CH3 terminated electrode surface through the hydrophobic interaction,
as the result the CRGOs with higher reduction degree could be more tightly combined
with the –CH3 terminated electrode and exhibit more effective ability towards
enhancing the charge transfer between the electrode surface and redox probe in solution.
However, as to the –COOH terminated electrode surface, the CRGOs were attached
with the electrode surface either the electrostatic binds (which could repel the CRGOs
combine to the electrode surface) or hydrogen bond (which could increase the
interaction between the electrode surface and CRGOs). With the increase of reduction
degree of CRGOs, both repulsive force and the hydrogen bonds decreased as the
electrostatic interaction and the hydrogen bonds decreased. At this competition
conditions, CRGOs with the higher reduction degree showed higher enhancing ability
towards the charge transfer.
Figure 3.6 Cyclic voltammograms of CRGOs with different reduction time modified
Unt11/Gold electrode (A) and MUA11/Gold electrode (B) in 10 mM Fe(CN)63-/4- in1
M KCl solution. The scan rate was 100 mV/s.
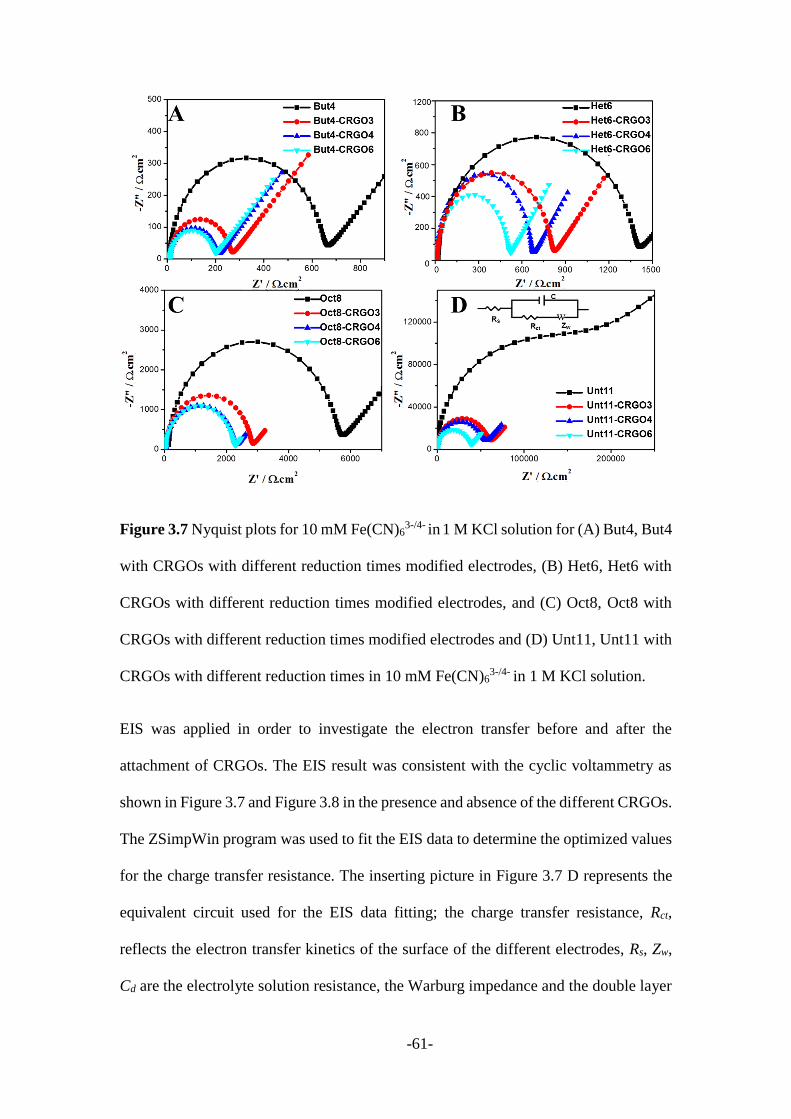
-61-
Figure 3.7 Nyquist plots for 10 mM Fe(CN)63-/4- in 1 M KCl solution for (A) But4, But4
with CRGOs with different reduction times modified electrodes, (B) Het6, Het6 with
CRGOs with different reduction times modified electrodes, and (C) Oct8, Oct8 with
CRGOs with different reduction times modified electrodes and (D) Unt11, Unt11 with
CRGOs with different reduction times in 10 mM Fe(CN)63-/4- in 1 M KCl solution.
EIS was applied in order to investigate the electron transfer before and after the
attachment of CRGOs. The EIS result was consistent with the cyclic voltammetry as
shown in Figure 3.7 and Figure 3.8 in the presence and absence of the different CRGOs.
The ZSimpWin program was used to fit the EIS data to determine the optimized values
for the charge transfer resistance. The inserting picture in Figure 3.7 D represents the
equivalent circuit used for the EIS data fitting; the charge transfer resistance, Rct,
reflects the electron transfer kinetics of the surface of the different electrodes, Rs, Zw,
Cd are the electrolyte solution resistance, the Warburg impedance and the double layer

-62-
capacitance, respectively.[246] For example, as shown in Figure 3.7D the Rct derived
from the semicircle domains of EIS spectra, was 2278219 Ω for the Unt11 passivated
electrode, 872070 Ω after CRGO3 attachment, 791227 Ω after CRGO4 attachment and
537518 Ω after CRGO6 attachment. The decrease in the diameter of the semicircle in
the Nyquist diagram indicates that the CRGOs could form a conducting pathway
through the passivating monolayer. Similar phenomena are also observed from other -
CH3 and -COOH terminated electrodes in comparison with alkanethiols passivated
electrode, as shown in Figure 3.7 and Figure 3.8.
Figure 3.8 Nyquist plots for 10 mM Fe(CN)63-/4- in 1 M KCl solution for (A) MBA6,
MBA6 with CRGOs with different reduction times modified electrodes, (B) MHA6,
MHA6 with CRGOs with different reduction times modified electrodes, and (C) MOA8,
MOA8 with CRGOs with different reduction times modified electrodes and (D)
MUA11, MUA11 with CRGOs with different reduction times in 10 mM Fe(CN)63-/4- in
-63-
1 M KCl solution.
The main aspect of this study is to show that the charge transfer rate between the
electrode surface and the redox couple in solution which could be calculated from the
Nyquist plot of the SAM-modified Au electrode before and after adsorption of different
CRGOs. The charge transfer rate can be calculated using the following formula:[247,
248]
𝑘𝑎𝑝𝑝 =𝑅𝑇
𝐹2𝑅𝑐𝑡𝐶⁄
Where kapp is the apparent rate constant at the SAM-modified electrode, R is the gas
constant, T is temperature, F is the Faraday constant, the Rct is the charge transfer
resistance and C is the concentration of redox couple. The variations in charge transfer
resistance (Rct) and the apparent rate constant (kapp) with the length of the SAM in the
absence and presence of CRGOs with different reduction degree are shown in Table
3.1.
The fitting results clearly indicate that the charge transfer resistance (Rct) increased with
increasing of the carbon chain length in -COOH and -CH3 terminated thiols as shown
in Table 3.1. After the adsorption of different CRGOs, the Nyquist plots in Figure 3.7
and Figure 3.8 indicated that electron transfer was much more efficient under these
conditions. Since the longer alkanethiols can form more densely closed packed
structures than the shorter thiols which resemble higher packing structures would guide
to higher resistance when compared to shorter ones. In the case of assemblies
terminated with CRGOs, the electrochemistry was well-defined and showed an
improved charge transfer (Rct). Figure 3.6A and B showed that there is an obvious
change in Rct with different CRGOs. Therefore, the rate constant of electron transfer
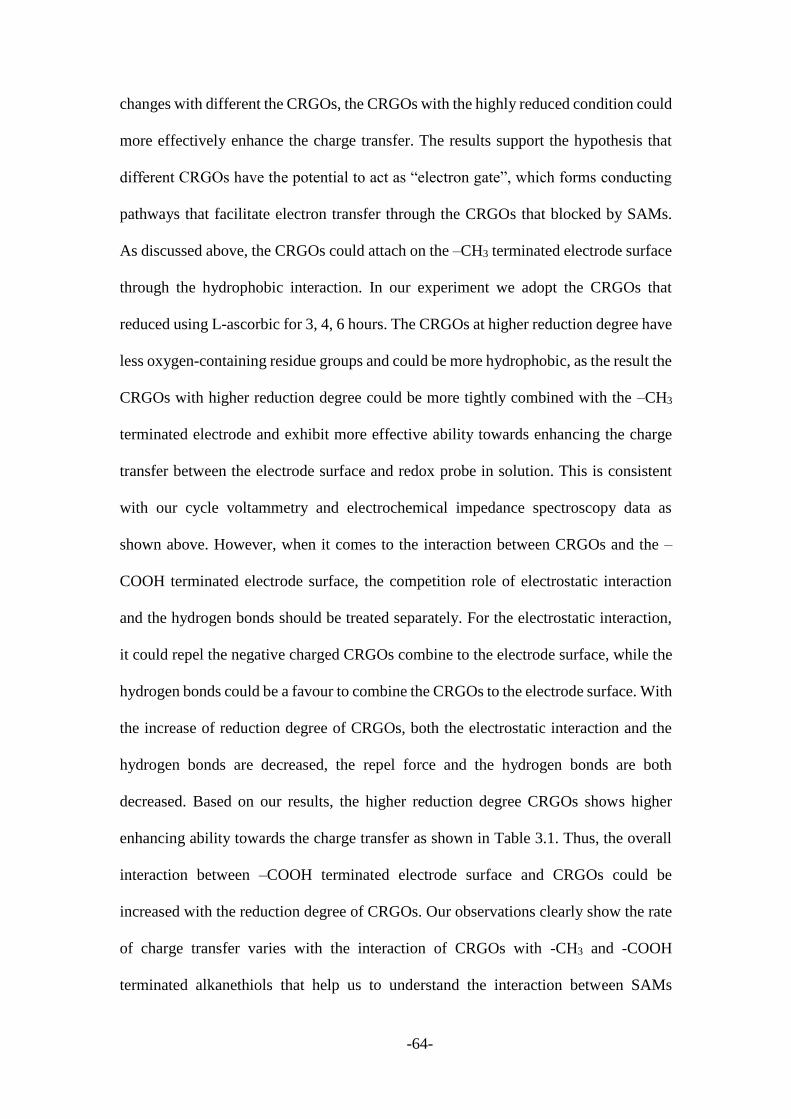
-64-
changes with different the CRGOs, the CRGOs with the highly reduced condition could
more effectively enhance the charge transfer. The results support the hypothesis that
different CRGOs have the potential to act as “electron gate”, which forms conducting
pathways that facilitate electron transfer through the CRGOs that blocked by SAMs.
As discussed above, the CRGOs could attach on the –CH3 terminated electrode surface
through the hydrophobic interaction. In our experiment we adopt the CRGOs that
reduced using L-ascorbic for 3, 4, 6 hours. The CRGOs at higher reduction degree have
less oxygen-containing residue groups and could be more hydrophobic, as the result the
CRGOs with higher reduction degree could be more tightly combined with the –CH3
terminated electrode and exhibit more effective ability towards enhancing the charge
transfer between the electrode surface and redox probe in solution. This is consistent
with our cycle voltammetry and electrochemical impedance spectroscopy data as
shown above. However, when it comes to the interaction between CRGOs and the –
COOH terminated electrode surface, the competition role of electrostatic interaction
and the hydrogen bonds should be treated separately. For the electrostatic interaction,
it could repel the negative charged CRGOs combine to the electrode surface, while the
hydrogen bonds could be a favour to combine the CRGOs to the electrode surface. With
the increase of reduction degree of CRGOs, both the electrostatic interaction and the
hydrogen bonds are decreased, the repel force and the hydrogen bonds are both
decreased. Based on our results, the higher reduction degree CRGOs shows higher
enhancing ability towards the charge transfer as shown in Table 3.1. Thus, the overall
interaction between –COOH terminated electrode surface and CRGOs could be
increased with the reduction degree of CRGOs. Our observations clearly show the rate
of charge transfer varies with the interaction of CRGOs with -CH3 and -COOH
terminated alkanethiols that help us to understand the interaction between SAMs
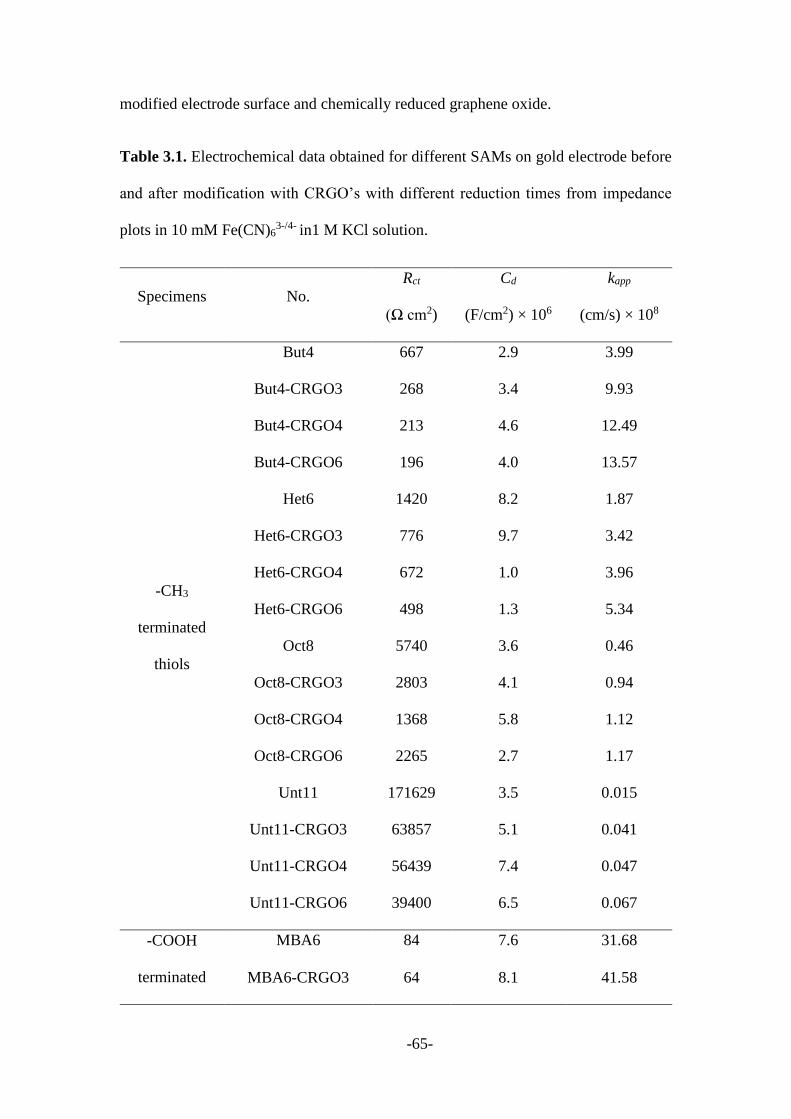
-65-
modified electrode surface and chemically reduced graphene oxide.
Table 3.1. Electrochemical data obtained for different SAMs on gold electrode before
and after modification with CRGO’s with different reduction times from impedance
plots in 10 mM Fe(CN)63-/4- in1 M KCl solution.
Specimens No.
Rct
(Ω cm2)
Cd
(F/cm2) × 106
kapp
(cm/s) × 108
-CH3
terminated
thiols
But4 667 2.9 3.99
But4-CRGO3 268 3.4 9.93
But4-CRGO4 213 4.6 12.49
But4-CRGO6 196 4.0 13.57
Het6 1420 8.2 1.87
Het6-CRGO3 776 9.7 3.42
Het6-CRGO4 672 1.0 3.96
Het6-CRGO6 498 1.3 5.34
Oct8 5740 3.6 0.46
Oct8-CRGO3 2803 4.1 0.94
Oct8-CRGO4 1368 5.8 1.12
Oct8-CRGO6 2265 2.7 1.17
Unt11 171629 3.5 0.015
Unt11-CRGO3 63857 5.1 0.041
Unt11-CRGO4 56439 7.4 0.047
Unt11-CRGO6 39400 6.5 0.067
-COOH
terminated
MBA6 84 7.6 31.68
MBA6-CRGO3 64 8.1 41.58
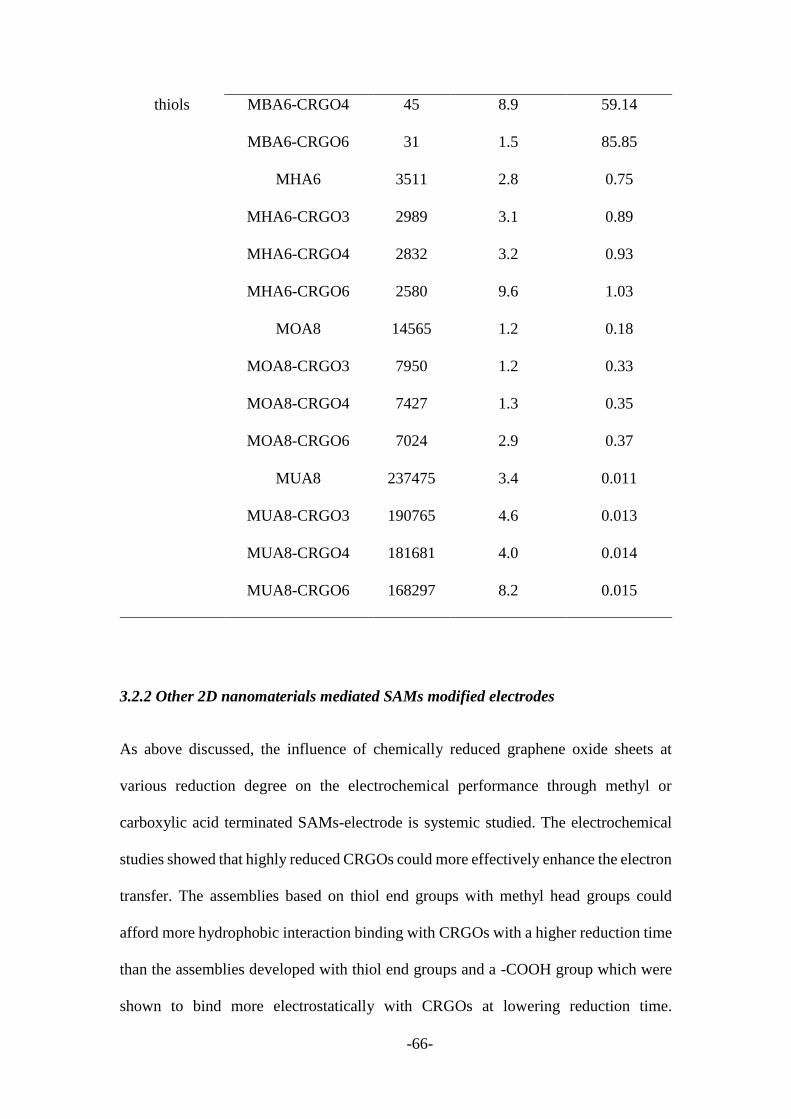
-66-
thiols MBA6-CRGO4 45 8.9 59.14
MBA6-CRGO6 31 1.5 85.85
MHA6 3511 2.8 0.75
MHA6-CRGO3 2989 3.1 0.89
MHA6-CRGO4 2832 3.2 0.93
MHA6-CRGO6 2580 9.6 1.03
MOA8 14565 1.2 0.18
MOA8-CRGO3 7950 1.2 0.33
MOA8-CRGO4 7427 1.3 0.35
MOA8-CRGO6 7024 2.9 0.37
MUA8 237475 3.4 0.011
MUA8-CRGO3 190765 4.6 0.013
MUA8-CRGO4 181681 4.0 0.014
MUA8-CRGO6 168297 8.2 0.015
3.2.2 Other 2D nanomaterials mediated SAMs modified electrodes
As above discussed, the influence of chemically reduced graphene oxide sheets at
various reduction degree on the electrochemical performance through methyl or
carboxylic acid terminated SAMs-electrode is systemic studied. The electrochemical
studies showed that highly reduced CRGOs could more effectively enhance the electron
transfer. The assemblies based on thiol end groups with methyl head groups could
afford more hydrophobic interaction binding with CRGOs with a higher reduction time
than the assemblies developed with thiol end groups and a -COOH group which were
shown to bind more electrostatically with CRGOs at lowering reduction time.
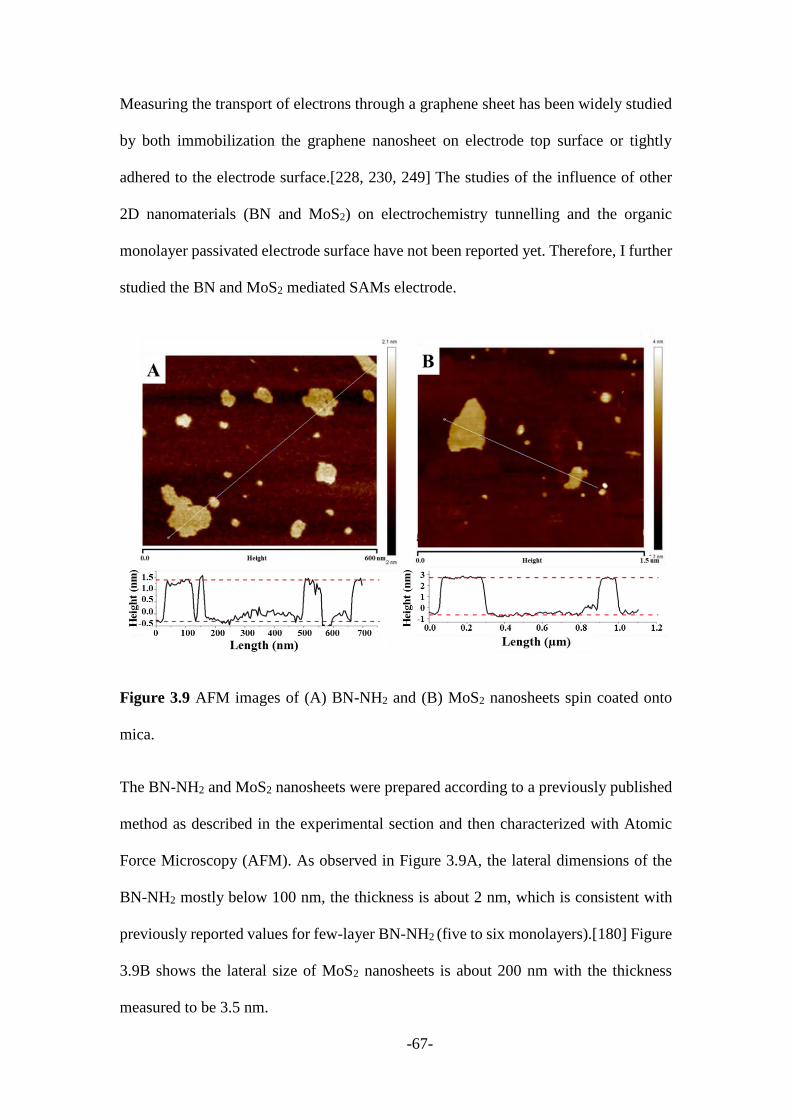
-67-
Measuring the transport of electrons through a graphene sheet has been widely studied
by both immobilization the graphene nanosheet on electrode top surface or tightly
adhered to the electrode surface.[228, 230, 249] The studies of the influence of other
2D nanomaterials (BN and MoS2) on electrochemistry tunnelling and the organic
monolayer passivated electrode surface have not been reported yet. Therefore, I further
studied the BN and MoS2 mediated SAMs electrode.
Figure 3.9 AFM images of (A) BN-NH2 and (B) MoS2 nanosheets spin coated onto
mica.
The BN-NH2 and MoS2 nanosheets were prepared according to a previously published
method as described in the experimental section and then characterized with Atomic
Force Microscopy (AFM). As observed in Figure 3.9A, the lateral dimensions of the
BN-NH2 mostly below 100 nm, the thickness is about 2 nm, which is consistent with
previously reported values for few-layer BN-NH2 (five to six monolayers).[180] Figure
3.9B shows the lateral size of MoS2 nanosheets is about 200 nm with the thickness
measured to be 3.5 nm.

-68-
Figure 3.10 (A) CVs and (B) EIS of bare, But4, Het6, Oct8, Unt11 thiol modified
electrode in 1 M KCl solution containing 10 mM Fe(CN)63-/4-. The scan rate is 100 mV/s.
Firstly, the gold electrodes were modified by four -CH3 groups terminated alkanethiol
molecules. Also CV and EIS techniques were used to characterize the bare and thiol
modified electrodes with Fe(CN)63-/4- worked as the redox couples. The voltammetry
and impedance responses of the electrode before and after SAMs modification prior to
the attachment of the BN-NH2 and MoS2 nanosheets were shown in Figure 3.10. Well-
characterized reverse ferricyanide electrochemistry was observed on the bare electrode
which was suppressed after modification with the -CH3 terminated self-assembly
monolayers. With increasing the number of methylene units in the alkyl chain, the
ability of alkanethiol monolayer to passivate the electrode also increased. For the But4
and Het6 modified electrodes, the characterized ferricyanide electrochemistry was only
partially blocked, while that of Oct8 and Unt11 modified electrodes were nearly
completely inhibited. As evident from STM and AFM techniques, there are some
defects such as pin-holes and vacancy Au islands on the alkanethiol monolayer
modified electrode surface, short hydrocarbon chain alkane thiolates maybe not well
ordered and will subsequently leave more defects on the electrode surface.[243, 250]
Additionally, higher order monolayers have shown to be impenetrable by some species

-69-
of interest, such as solvent molecules or ions and result in the high resistance to the
electron transfer through this layer.[245] The EIS results are consistent with the CVs
as shown in Figure 3.10B that measured in the same solution as used for the CV
measurement. With the increase of methylene units in the hydrocarbon chain, the
electron transfer resistance (Ret) determined by the size of the semicircle in the Nyquist
plots in Figure 3.10B increased.
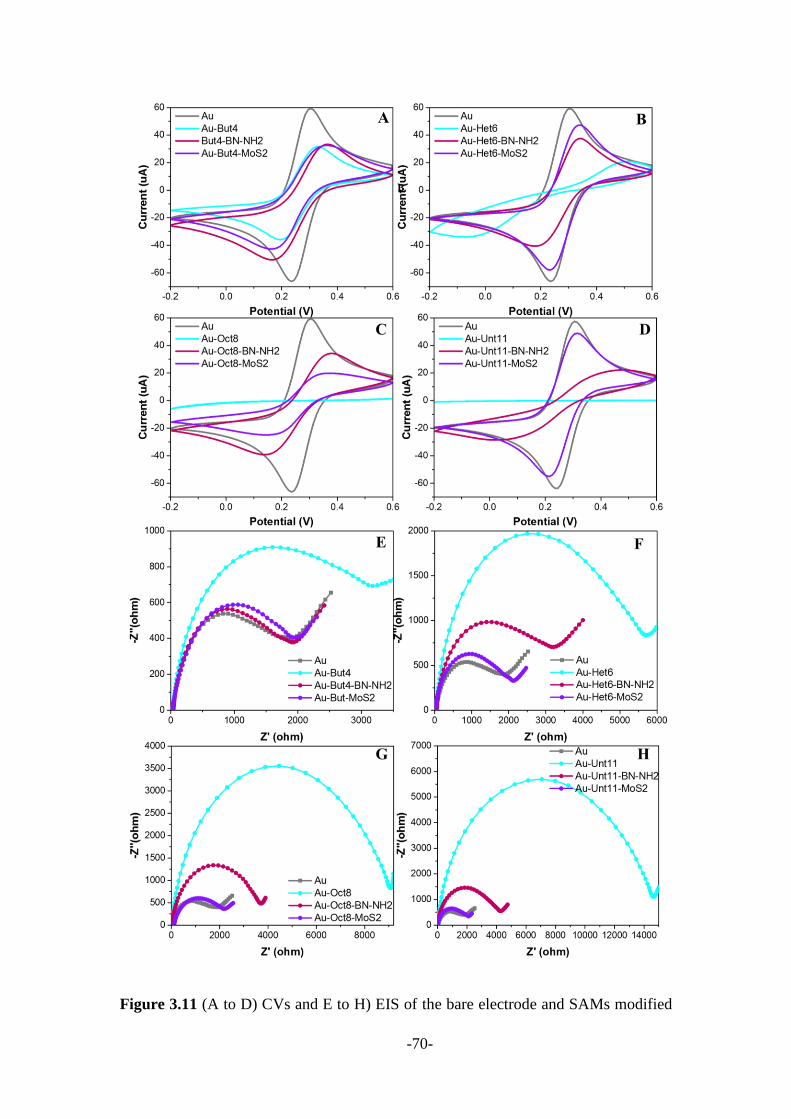
-70-
Figure 3.11 (A to D) CVs and E to H) EIS of the bare electrode and SAMs modified
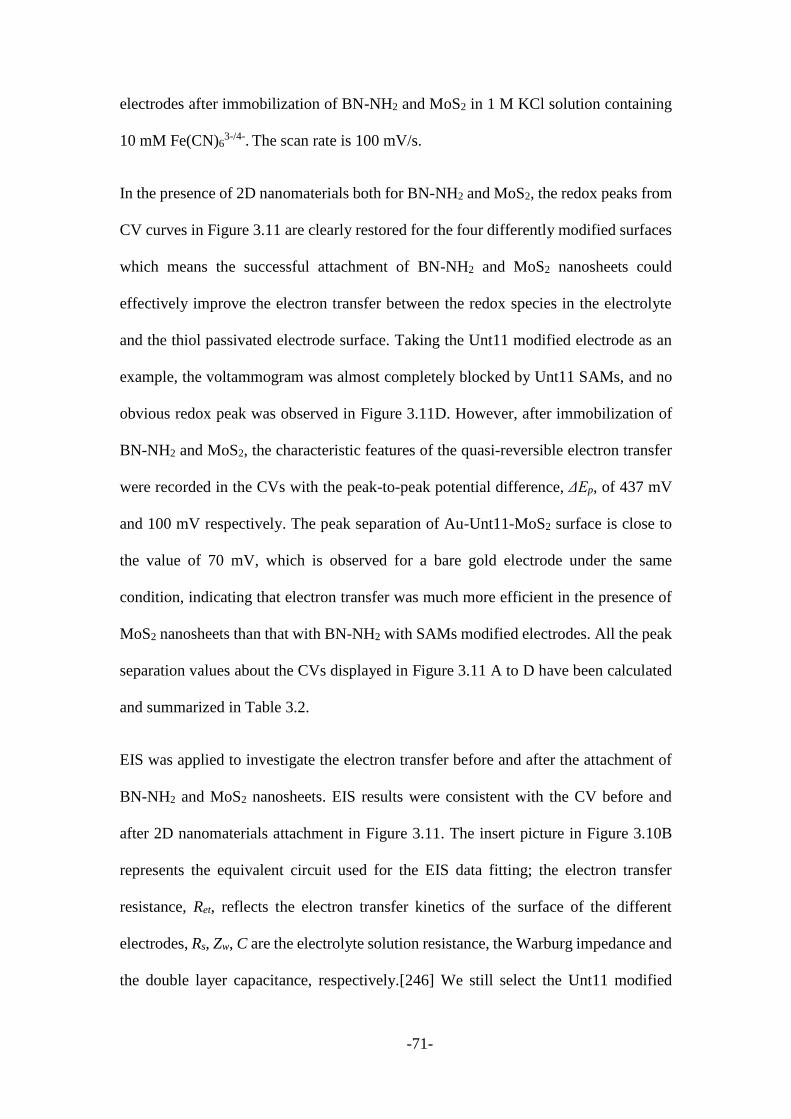
-71-
electrodes after immobilization of BN-NH2 and MoS2 in 1 M KCl solution containing
10 mM Fe(CN)63-/4-. The scan rate is 100 mV/s.
In the presence of 2D nanomaterials both for BN-NH2 and MoS2, the redox peaks from
CV curves in Figure 3.11 are clearly restored for the four differently modified surfaces
which means the successful attachment of BN-NH2 and MoS2 nanosheets could
effectively improve the electron transfer between the redox species in the electrolyte
and the thiol passivated electrode surface. Taking the Unt11 modified electrode as an
example, the voltammogram was almost completely blocked by Unt11 SAMs, and no
obvious redox peak was observed in Figure 3.11D. However, after immobilization of
BN-NH2 and MoS2, the characteristic features of the quasi-reversible electron transfer
were recorded in the CVs with the peak-to-peak potential difference, ΔEp, of 437 mV
and 100 mV respectively. The peak separation of Au-Unt11-MoS2 surface is close to
the value of 70 mV, which is observed for a bare gold electrode under the same
condition, indicating that electron transfer was much more efficient in the presence of
MoS2 nanosheets than that with BN-NH2 with SAMs modified electrodes. All the peak
separation values about the CVs displayed in Figure 3.11 A to D have been calculated
and summarized in Table 3.2.
EIS was applied to investigate the electron transfer before and after the attachment of
BN-NH2 and MoS2 nanosheets. EIS results were consistent with the CV before and
after 2D nanomaterials attachment in Figure 3.11. The insert picture in Figure 3.10B
represents the equivalent circuit used for the EIS data fitting; the electron transfer
resistance, Ret, reflects the electron transfer kinetics of the surface of the different
electrodes, Rs, Zw, C are the electrolyte solution resistance, the Warburg impedance and
the double layer capacitance, respectively.[246] We still select the Unt11 modified

-72-
electrode as the example as shown in Figure 3.11H. The Ret value of the Unt11
passivated electrode has increased to 14,600 , eight times larger than that of bare gold
electrode (1870 ). While, the value has decreased to 4300 and 3100 after the
attachment of BN-NH2 and MoS2 nanosheets. The decreased electron transfer
resistance value indicates that the BN-NH2 and MoS2 nanosheets enhanced the electron
transfer between the solution and the organic monolayer insulated electrode, which is
consistent with the CVs results discussed above. All electron transfer resistance (Ret)
values from Figure 3.11E to H also have been acquired and summarized in Table 3.2.
The attachment of 2D nanomaterials on the SAMs modified gold electrode was
characterised using AFM. Figure 3.12 shows the bare gold substrate (Figure 3.12A) and
UN11 monolayer assembled on the substrate surface (Figure 3.12B). After adsorption
of BN-NH2 and MoS2 nanosheets, we observed the nanosheets randomly landed onto
the substrate surface (Figure 3.12C and D).

-73-
Figure 3.12 AFM images of the bare gold substrate (A), UN11 assembled gold
substrate (B), and then BN-NH2 and MoS2 modified substrates (C and D), respectively.
(E) Surface roughness factor of various SAMs (carbon chain length = 4, 6, 8 and 11)
after immobilization of BN-NH2 (black) and MoS2 (red) nanosheets.
Table 3.2. Electrochemical data obtained for different SAMs modified gold electrodes
before and after modification with 2D nanomaterials from CVs and EIS plots from
Figure 3.11. (ND means not determined).
Specimens ΔEp (mV) Ret () k (s-1)
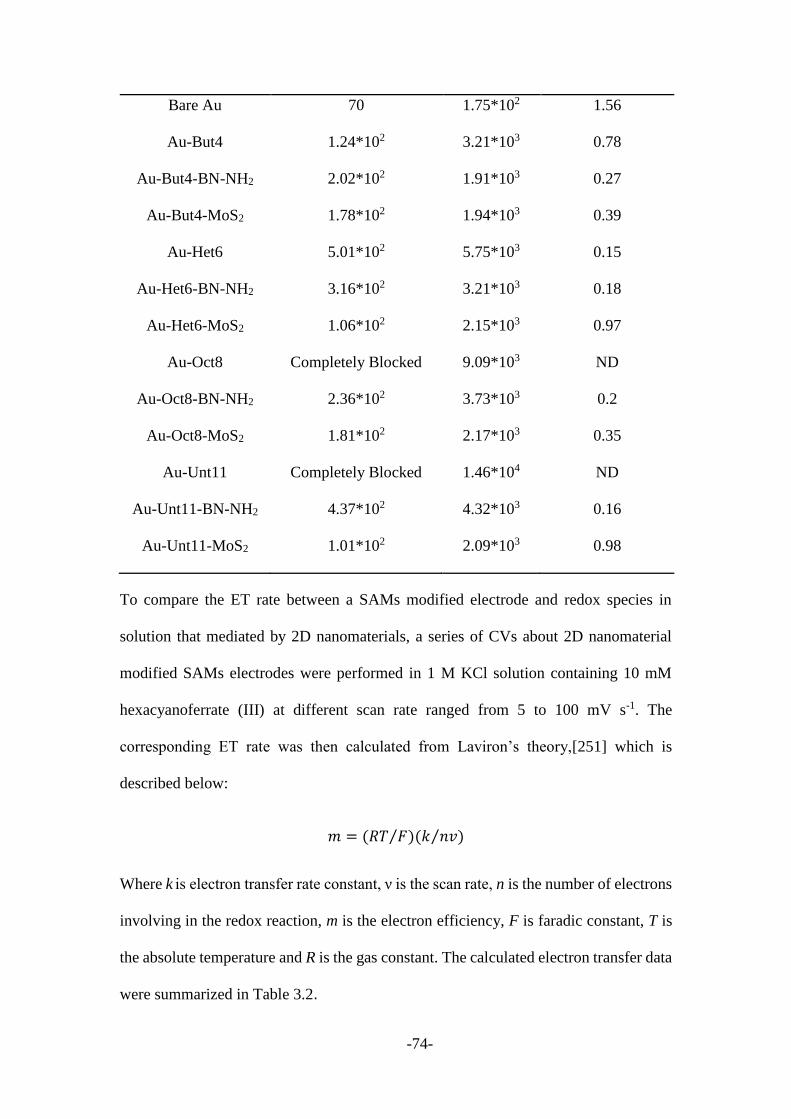
-74-
Bare Au 70 1.75*102 1.56
Au-But4 1.24*102 3.21*103 0.78
Au-But4-BN-NH2 2.02*102 1.91*103 0.27
Au-But4-MoS2 1.78*102 1.94*103 0.39
Au-Het6 5.01*102 5.75*103 0.15
Au-Het6-BN-NH2 3.16*102 3.21*103 0.18
Au-Het6-MoS2 1.06*102 2.15*103 0.97
Au-Oct8 Completely Blocked 9.09*103 ND
Au-Oct8-BN-NH2 2.36*102 3.73*103 0.2
Au-Oct8-MoS2 1.81*102 2.17*103 0.35
Au-Unt11 Completely Blocked 1.46*104 ND
Au-Unt11-BN-NH2 4.37*102 4.32*103 0.16
Au-Unt11-MoS2 1.01*102 2.09*103 0.98
To compare the ET rate between a SAMs modified electrode and redox species in
solution that mediated by 2D nanomaterials, a series of CVs about 2D nanomaterial
modified SAMs electrodes were performed in 1 M KCl solution containing 10 mM
hexacyanoferrate (III) at different scan rate ranged from 5 to 100 mV s-1. The
corresponding ET rate was then calculated from Laviron’s theory,[251] which is
described below:
𝑚 = (𝑅𝑇 𝐹)(𝑘 𝑛𝑣)⁄⁄
Where k is electron transfer rate constant, ν is the scan rate, n is the number of electrons
involving in the redox reaction, m is the electron efficiency, F is faradic constant, T is
the absolute temperature and R is the gas constant. The calculated electron transfer data
were summarized in Table 3.2.
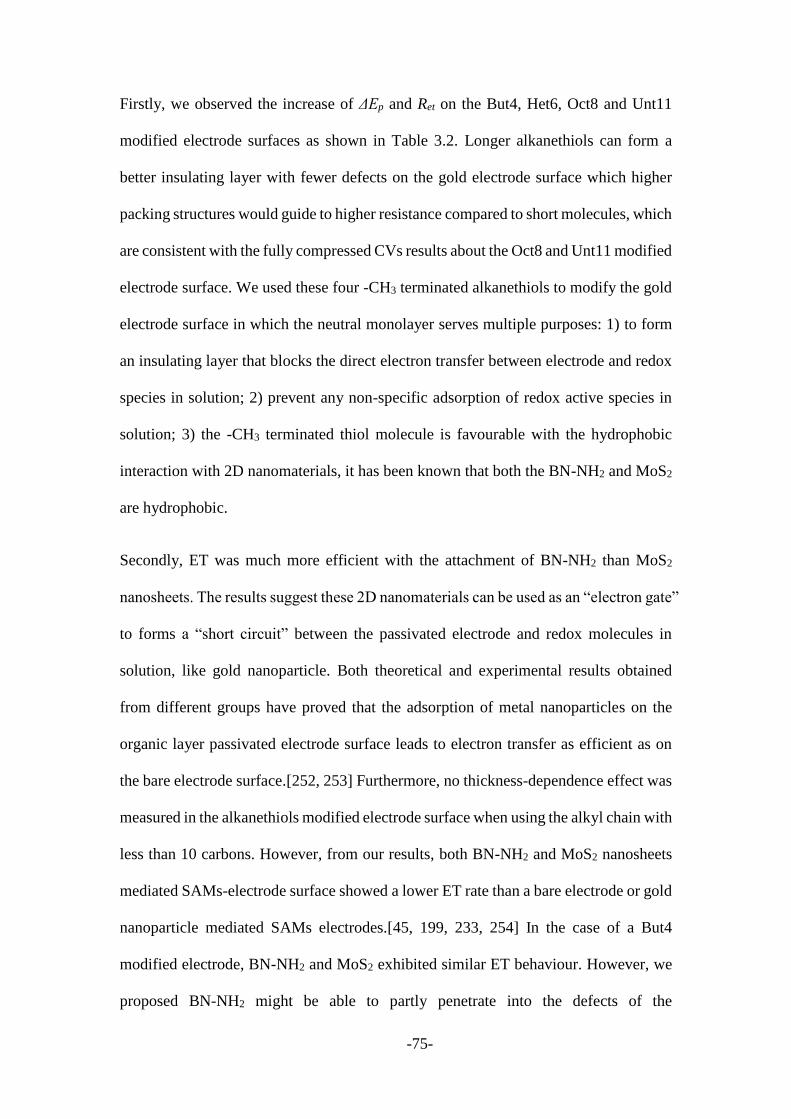
-75-
Firstly, we observed the increase of ΔEp and Ret on the But4, Het6, Oct8 and Unt11
modified electrode surfaces as shown in Table 3.2. Longer alkanethiols can form a
better insulating layer with fewer defects on the gold electrode surface which higher
packing structures would guide to higher resistance compared to short molecules, which
are consistent with the fully compressed CVs results about the Oct8 and Unt11 modified
electrode surface. We used these four -CH3 terminated alkanethiols to modify the gold
electrode surface in which the neutral monolayer serves multiple purposes: 1) to form
an insulating layer that blocks the direct electron transfer between electrode and redox
species in solution; 2) prevent any non-specific adsorption of redox active species in
solution; 3) the -CH3 terminated thiol molecule is favourable with the hydrophobic
interaction with 2D nanomaterials, it has been known that both the BN-NH2 and MoS2
are hydrophobic.
Secondly, ET was much more efficient with the attachment of BN-NH2 than MoS2
nanosheets. The results suggest these 2D nanomaterials can be used as an “electron gate”
to forms a “short circuit” between the passivated electrode and redox molecules in
solution, like gold nanoparticle. Both theoretical and experimental results obtained
from different groups have proved that the adsorption of metal nanoparticles on the
organic layer passivated electrode surface leads to electron transfer as efficient as on
the bare electrode surface.[252, 253] Furthermore, no thickness-dependence effect was
measured in the alkanethiols modified electrode surface when using the alkyl chain with
less than 10 carbons. However, from our results, both BN-NH2 and MoS2 nanosheets
mediated SAMs-electrode surface showed a lower ET rate than a bare electrode or gold
nanoparticle mediated SAMs electrodes.[45, 199, 233, 254] In the case of a But4
modified electrode, BN-NH2 and MoS2 exhibited similar ET behaviour. However, we
proposed BN-NH2 might be able to partly penetrate into the defects of the
-76-
monolayer,[16] and bonded to the electrode surface directly with the gold and -NH2
coupling.[200] Therefore, partly redox molecules would permeate through these
defects and directly reduced/oxidized on the electrode surface.[255] The ET on But4
modified electrode surface could not be only regarded as nanosheets mediated
tunnelling current, but also direct electrochemical activity through surface defects. For
longer alkanethiols, the dense monolayers are formed, which is evident from the totally
suppressed CVs in Figure 3.10. Herein, direct ET through crossing nanomaterials could
be disregarded on Het6, Oct8 and Unt11 modified electrode. The different
electrochemical kinetics observed from the BN-NH2 and MoS2 mediated longer
alkanethiol blocked SAMs electrodes may own to their own structure and compositions.
Nanomaterials mediated ET across a SAMs electrode is based on a charge relay in two-
step ET process, first across the metal–SAM–nanoparticle contact followed by ET
across the nanoparticle–redox junction or vice versa.[240, 256] Based on Chazalviel–
Allongue (C.A.) theory, the ET in the first step tunnelling across may be many orders
of magnitude more efficient than the second step ET between NPs and redox species in
solution.[253] Since tunnelling across the insulating layer and ET in the second step are
consecutive processes, the ET constant is determined by the second step. Herein, in our
case, the 2D nanomaterials work as a charge relay centre, charging from the redox
species and simultaneously mediate ET across the insulating layer. In the electrode-
SAM structure, the exchange current density across the SAM is followed to the
tunnelling factor ~exp(-βd), where d is the SAM thickness and the β is the attenuation
factor. There are two mostly accepted mechanisms to explain the nanoparticle mediated
electron transfer across a SAMs electrode that proposed by Fermin’s and Gooding’s
group, respectively.[65, 152, 233] According to Fermin’s interpretation, the enhanced
electron transfer is based on a resonant electron transfer step at the Fermin energy level
-77-
from the particle to the underlying electrode. The nanoparticle could increase the
density of states by confining the redox species on the organic layer surface, and then
the trapped redox species creates a narrow energetic path for charge transfer across the
insulating layer. Gooding’s group proposed alternatively enhanced electron transfer
pathway by the coherent tunnelling mechanism, the attached nanomaterials could
adsorb more redox species to the electrode surface and increase the electronic coupling
between the electrode surface and redox molecules. The electronic coupling will also
have the consequence of decreasing the β value.
For BN-NH2 nanosheets, the amino groups on its edges could attract more redox
molecules to its surface via the electrostatic attraction, therefore the increased electronic
coupling between the electrode surface and redox molecules could result in enhanced
ET, which is consistent with the charging process and mechanism reported by
Gooding’s group.[53] Even so, the observed electrochemistry of BN-NH2 mediated
SAM electrode is not able to restore to the bulk gold electrode performance, which
could be attributed to the lower ET rate in the first step. Due to the low electron transfer
ability of boron nitride nanosheets, the current density between electrode and BN-NH2
might be incomparable with that between the electrode and metal NPs. ET through BN-
NH2 mediated SAM electrode cannot restore to the bulk gold electrode or the metal
NPs mediated electrode surface. As observed, MoS2 nanosheets showed better electron
transfer performance and higher electron transfer rate than that from BN-NH2. MoS2
nanosheets that lying on the SAMs surface could deliver the produced redox electrons
across the SAM layer and follow by other redox molecules reacted on its surface.
Therefore, we believe the electrochemical kinetics behavior on the MoS2 nanosheets
mediated electron transfer through SAMs electrode could be illustrated with Fermin’s
interpretation.[65]
-78-
3.3 Conclusions
In summary, we studied 2D nanomaterials for the efficient electron transfer pathways
across the various alkanethiol monolayers insulated gold electrodes. The
electrochemical results showed that chemical reduced graphene oxide, BN-NH2 or
MoS2 nanosheets could enhance ET across the SAM-passivated surface. Our current
work studied fundamental electrochemistry behavior of electrode-organic layer-2D
nanomaterial assemblies which could promote the application of 2D nanomaterials as
a controllable electronics material for future nanotechnology.
-79-
Chapter 4: Real-time electrochemical monitoring covalent
bond formation in solution via nanoparticle-electrode
collisions
-80-
4.1 Introduction
In the past decades, work at the single-molecule level has attracted considerable
attention because single-molecule studies can lead to important new insights about the
effects of environment and configuration on the behaviour of these molecules and such
information is not available from ensemble studies.[257, 258] Researchers have
measured covalent bond force using atom force microspectroscopy (AFM).[259-261]
However, there is little progress which has been made on monitoring of covalent bond
formation in real-time.[62, 262, 263] Traditionally, covalent bonds can be monitored
by high-resolution electron energy loss spectroscopy (HREELS),[264] X-ray
photoelectron spectroscopy (XPS),[265] fluorescence,[266] scanning tunnelling
microscopy[267] and femtosecond X-ray scattering.[86] Collins and collaborators[268-
271] used point-functionalised carbon nanotubes device to continuously monitor a
single carboxylate group interacting with N-Ethyl-N´-(3-
dimethylaminopropyl)carbodiimidehydrochloride (EDC). This technique uses circuit
conductance to monitor and control covalent attachment to electrically connected
single-walled carbon nanotubes. Discrete changes in the circuit conductance revealed
chemical processes happening in real time. Although this progress has been made, there
are still challenges in high-resolution lithography and fabricating single-molecule
electronic devices, and facile and sensitive alternatives are required.
The nanoparticle-electrode collision, a more efficient and low-cost electrochemical
approach, is generally used for detecting various types of nanoparticles, such as metal
particles, oxide particles, organic nanoparticles, a few molecules or even single
molecule.[60, 150] Bard and co-workers[272-274] reported the detection of metal
nanoparticles (MNPs) through electrocatalytic amplification using a carbon
-81-
ultramicroelectrode (UME) with Pt NPs in solution that was held at a constant potential,
at which hydrogen evolution would occur on Pt but not on carbon. Previous studies
demonstrated that there are two distinct types of reactivity: a cumulative cascade of
current steps (“staircase”) and a series of transiently decaying current jumps (“spikes”).
A current staircase is expected for the permanent adsorption of nanoparticles. Current
spikes are attributed to the “Hit-and-Run” nanoparticles for the limited time of
residence.[60, 150] Previous studies also showed that a self-assembled monolayer
(SAM) on electrodes can block the electron transfer tunnelling to solution species.
However, in the presence of MNP, more facile electron transfer (ET) can completely
restore ET to solution species. The basis of this effect is that tunnelling from the UME
to the MNP is much more probable than tunnelling to molecules in solutions. Suitable
NPs might include, in addition to metals, semiconductor quantum dots, and carbon-
based nanomaterials, such as graphene-oxide.[61, 87, 200, 253] Crooks and co-workers
reported a method for real-time electrochemical monitoring of individual DNA
hybridization events by monitoring electrocatalytic current when a complementary
DNA strand labeled with a catalyst hybridizes to the working electrode modified with
single-stranded DNA.[275] In addition to detecting catalytic current associated with
single nanoparticle collisions, Compton’s group pioneered on the direct
electrochemistry of single electro-active nanoparticles. They detected the Ag NPs by
measuring the anodic current-time transient through a method coined anodic particle
coulometry. They observed the random collision of single electro-active indigo
nanoparticle onto a carbon microelectrode to generate a transient reductive Faradaic
current that depended on the size of the nanoparticles, allowing the measurements of
the size distribution of organic nanoparticles.[276, 277] Recently, we have developed
a new electrochemical monitoring approach for ultrasensitive detection of protein
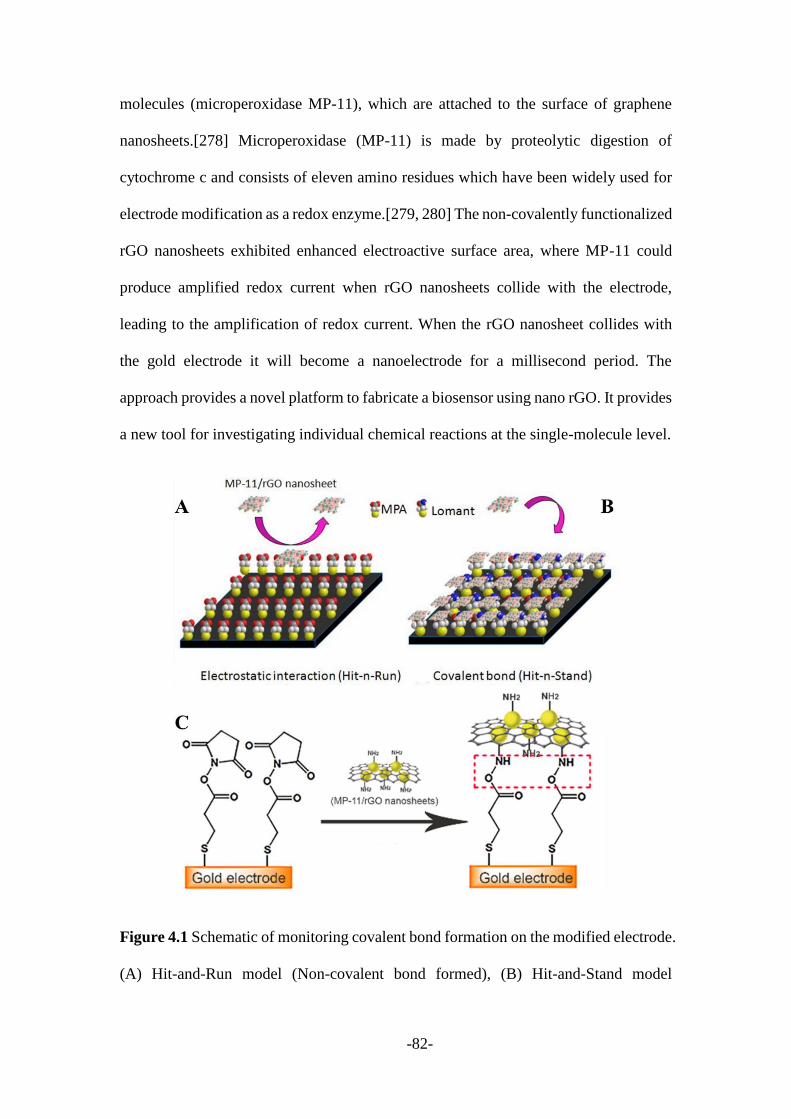
-82-
molecules (microperoxidase MP-11), which are attached to the surface of graphene
nanosheets.[278] Microperoxidase (MP-11) is made by proteolytic digestion of
cytochrome c and consists of eleven amino residues which have been widely used for
electrode modification as a redox enzyme.[279, 280] The non-covalently functionalized
rGO nanosheets exhibited enhanced electroactive surface area, where MP-11 could
produce amplified redox current when rGO nanosheets collide with the electrode,
leading to the amplification of redox current. When the rGO nanosheet collides with
the gold electrode it will become a nanoelectrode for a millisecond period. The
approach provides a novel platform to fabricate a biosensor using nano rGO. It provides
a new tool for investigating individual chemical reactions at the single-molecule level.
Figure 4.1 Schematic of monitoring covalent bond formation on the modified electrode.
(A) Hit-and-Run model (Non-covalent bond formed), (B) Hit-and-Stand model
-83-
(Covalent bond formed). (C) Schematic of covalent bond formation. The amide
covalent bonds form when MP-11 functionalised rGO nanosheets reach Lomant’s
reagent modified gold electrode and stick on the SAM.
Herein, the real-time monitoring of covalent bond formation in solution by
nanoparticle-electrode collisions was demonstrated in this chapter. To monitor covalent
bond formation, I designed two different nanoparticle-electrode collisions, “Hit-and-
Run” and “Hit-and-Stand” as shown in Figure 4.1. A single layer Lomant’s reagent (an
ester with NHS) was coated on the surface of the gold electrode. Once MP-11/rGO
nanosheets reach the surface of Lomant’s reagent coated gold electrode, an amide
covalent bond was formed via the NH2 group from the MP-11 and carboxyl from the
Lomant’s reagent. Then MP-11/rGO nanosheets stick onto the gold electrode surface,
rather than being repelled away. The collision process is a “Hit-and-Stand” one. As a
control experiment, the gold electrode was coated with a SAM of alkane thiols (3-
mercaptopropanoic acid, MPA) terminated with carboxyl groups. When MP-11/rGO
nanosheets were diffused to the surface of the gold electrode coated with SAM, it was
repelled away by the electrostatic repulsive force because MP-11/rGO nanosheets are
negatively charged and the SAMs are also negatively charged due to the carboxyl
groups. This collision is a “Hit-and-Run” process. The current changes during “Hit-
and-Stand” process show the collision behavior of MP-11/rGO when it reaches and
sticks on the electrode permanently through covalent bonds. This collision behavior of
MP-11/rGO is different from that on MPA modified electrode where MP-11/rGO is
repelled with electrostatic interaction. Therefore MP-11/rGO collision with Lomant’s
reagent modified electrode could be used to indirectly monitor covalent bond formation
(Figure 4.1C).
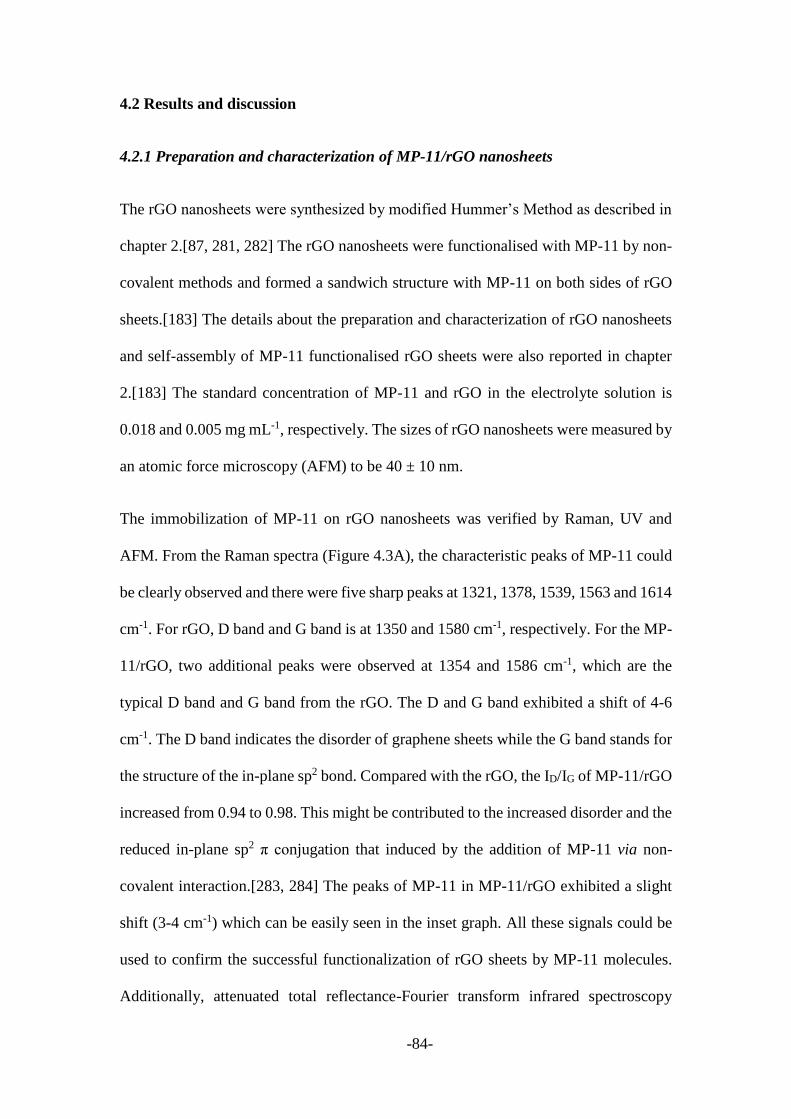
-84-
4.2 Results and discussion
4.2.1 Preparation and characterization of MP-11/rGO nanosheets
The rGO nanosheets were synthesized by modified Hummer’s Method as described in
chapter 2.[87, 281, 282] The rGO nanosheets were functionalised with MP-11 by non-
covalent methods and formed a sandwich structure with MP-11 on both sides of rGO
sheets.[183] The details about the preparation and characterization of rGO nanosheets
and self-assembly of MP-11 functionalised rGO sheets were also reported in chapter
2.[183] The standard concentration of MP-11 and rGO in the electrolyte solution is
0.018 and 0.005 mg mL-1, respectively. The sizes of rGO nanosheets were measured by
an atomic force microscopy (AFM) to be 40 ± 10 nm.
The immobilization of MP-11 on rGO nanosheets was verified by Raman, UV and
AFM. From the Raman spectra (Figure 4.3A), the characteristic peaks of MP-11 could
be clearly observed and there were five sharp peaks at 1321, 1378, 1539, 1563 and 1614
cm-1. For rGO, D band and G band is at 1350 and 1580 cm-1, respectively. For the MP-
11/rGO, two additional peaks were observed at 1354 and 1586 cm-1, which are the
typical D band and G band from the rGO. The D and G band exhibited a shift of 4-6
cm-1. The D band indicates the disorder of graphene sheets while the G band stands for
the structure of the in-plane sp2 bond. Compared with the rGO, the ID/IG of MP-11/rGO
increased from 0.94 to 0.98. This might be contributed to the increased disorder and the
reduced in-plane sp2 π conjugation that induced by the addition of MP-11 via non-
covalent interaction.[283, 284] The peaks of MP-11 in MP-11/rGO exhibited a slight
shift (3-4 cm-1) which can be easily seen in the inset graph. All these signals could be
used to confirm the successful functionalization of rGO sheets by MP-11 molecules.
Additionally, attenuated total reflectance-Fourier transform infrared spectroscopy
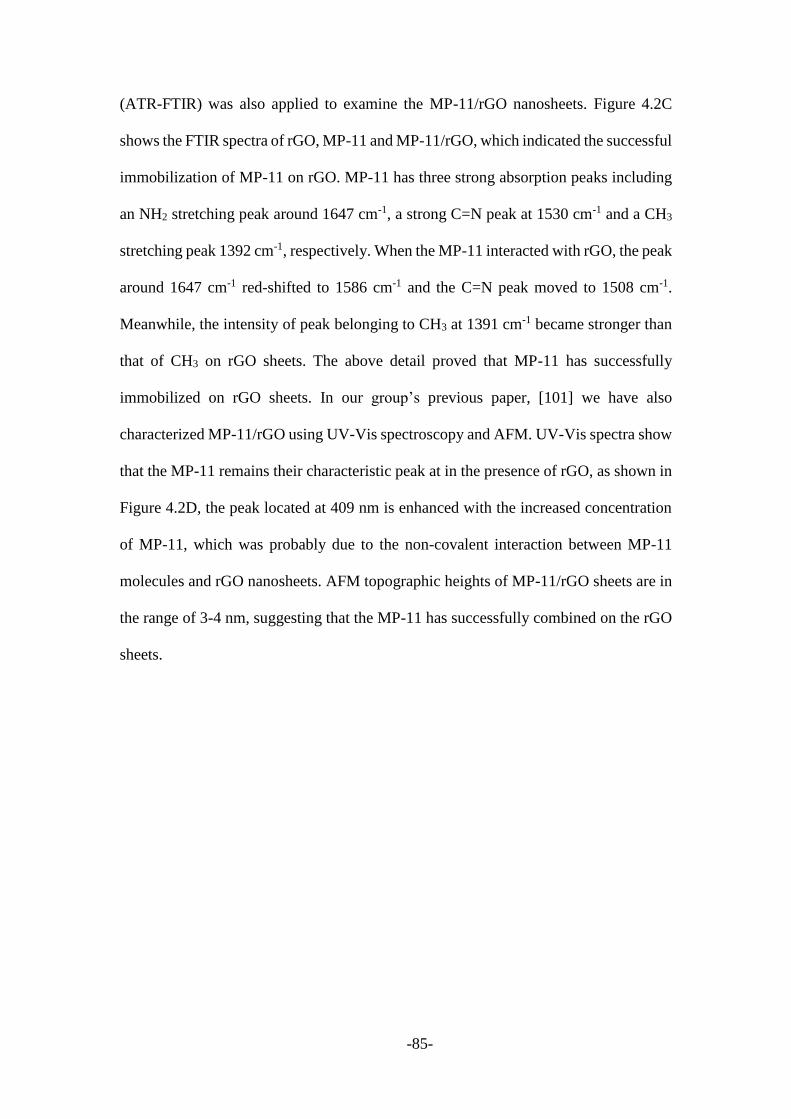
-85-
(ATR-FTIR) was also applied to examine the MP-11/rGO nanosheets. Figure 4.2C
shows the FTIR spectra of rGO, MP-11 and MP-11/rGO, which indicated the successful
immobilization of MP-11 on rGO. MP-11 has three strong absorption peaks including
an NH2 stretching peak around 1647 cm-1, a strong C=N peak at 1530 cm-1 and a CH3
stretching peak 1392 cm-1, respectively. When the MP-11 interacted with rGO, the peak
around 1647 cm-1 red-shifted to 1586 cm-1 and the C=N peak moved to 1508 cm-1.
Meanwhile, the intensity of peak belonging to CH3 at 1391 cm-1 became stronger than
that of CH3 on rGO sheets. The above detail proved that MP-11 has successfully
immobilized on rGO sheets. In our group’s previous paper, [101] we have also
characterized MP-11/rGO using UV-Vis spectroscopy and AFM. UV-Vis spectra show
that the MP-11 remains their characteristic peak at in the presence of rGO, as shown in
Figure 4.2D, the peak located at 409 nm is enhanced with the increased concentration
of MP-11, which was probably due to the non-covalent interaction between MP-11
molecules and rGO nanosheets. AFM topographic heights of MP-11/rGO sheets are in
the range of 3-4 nm, suggesting that the MP-11 has successfully combined on the rGO
sheets.
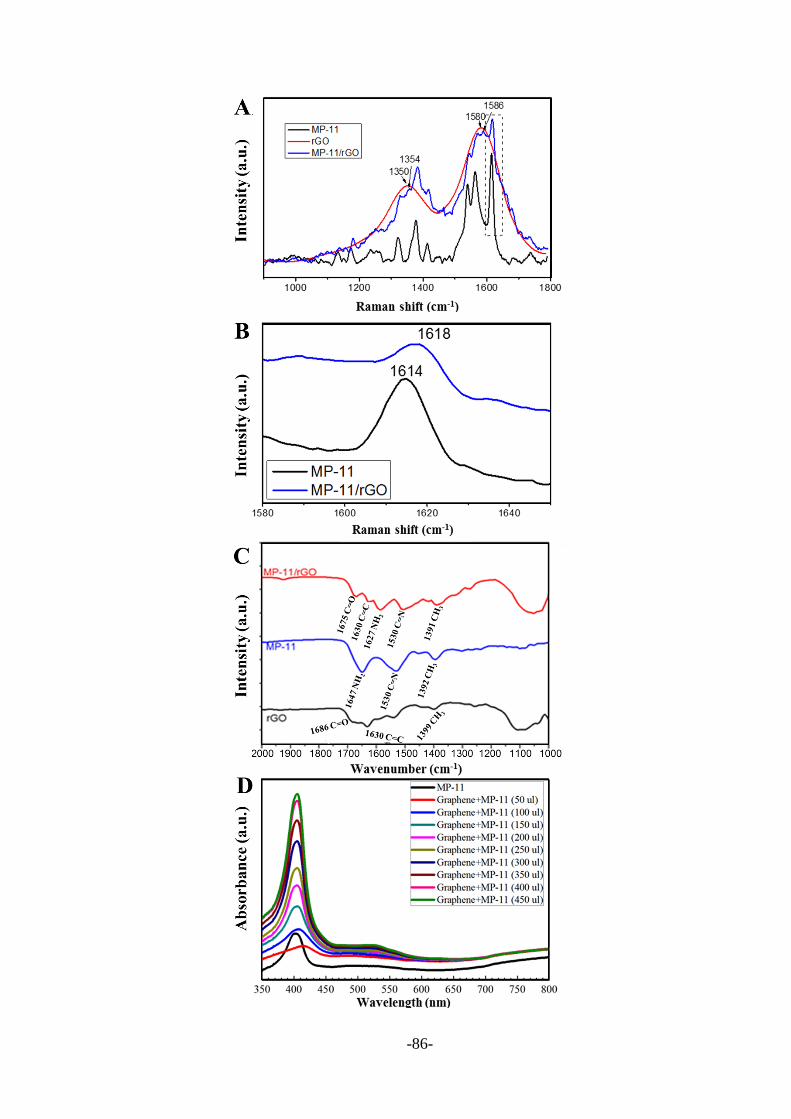
-86-
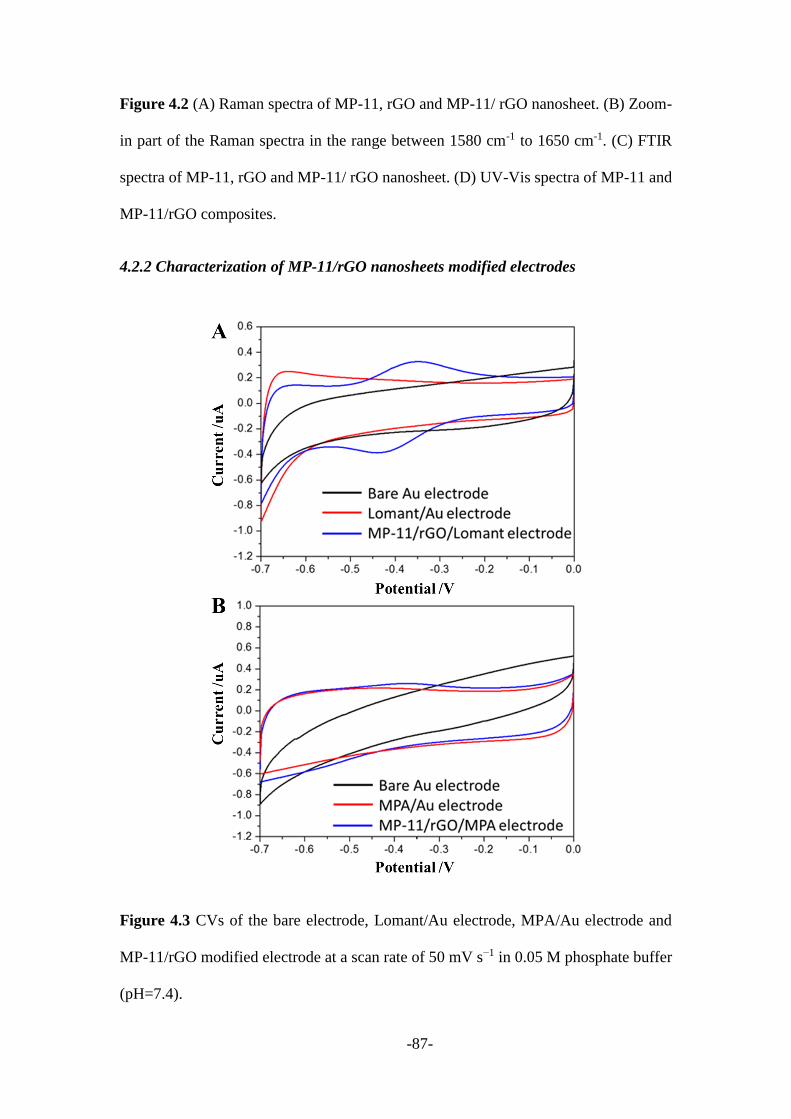
-87-
Figure 4.2 (A) Raman spectra of MP-11, rGO and MP-11/ rGO nanosheet. (B) Zoom-
in part of the Raman spectra in the range between 1580 cm-1 to 1650 cm-1. (C) FTIR
spectra of MP-11, rGO and MP-11/ rGO nanosheet. (D) UV-Vis spectra of MP-11 and
MP-11/rGO composites.
4.2.2 Characterization of MP-11/rGO nanosheets modified electrodes
Figure 4.3 CVs of the bare electrode, Lomant/Au electrode, MPA/Au electrode and
MP-11/rGO modified electrode at a scan rate of 50 mV s−1 in 0.05 M phosphate buffer
(pH=7.4).

-88-
The electrochemical characterization of the modified electrode was done by CV and
EIS by using an Au electrode (diameter 2 mm) as shown in Figure 4.3 and Figure 4.4.
It is noted that MP-11 is a redox species that undergoes redox reaction via an one
electron transfer process.[279] Therefore, the covalent bond formation between the
Lomant reagents and MP-11/rGO nanosheets can be evidenced by CVs. As shown in
Figure 4.3A, no obvious redox peaks can be observed in bare Au electrode and
Lomant/Au electrode in phosphate buffer solution (pH = 7.4). This means no covalent
bond is formed on the above two electrodes. However, after immersing the Lomant/Au
electrode in MP-11/rGO solution in the presence of EDC, well-defined redox peaks
cantered at -0.4 V was observed, indicating the attachment of MP-11/rGO nanosheets.
In Figure 4.3B, no obvious peaks after immersing the MPA/Au electrode in MP-11/rGO
solution proves that no MP-11/rGO nanosheet is immobilized on the electrode surface.
The electrochemistry of the electrode with different modification stages was also
studied in Fe(CN)63-/4- solution as shown in Figure 4.4. The pronounced ferricyanide
electrochemistry observed on the bare Au electrode was suppressed at different extent
after modification with Lomant reagent and MPA reagent (Figure 4.4A and C). The
incomplete current suppression and diversity between Lomant/Au and MPA/Au
electrode are due to the steric hindrance of Lomant and MPA molecules, leaving un-
densified monolayer on the electrode surface. Further immobilization of MP-11/rGO
nanosheets on Lomant/Au electrode surface via covalent bonds could “switch on” the
electrical communication that could be evidenced from the regained electrochemistry
in Figure 4.4A and the decreased charge transfer resistance in Figure 4.4B. However,
no obvious regained electrochemistry in Figure 4.4C and D after incubating the
MPA/Au electrode in MP-11/rGO solution indirectly demonstrated the un-attachment
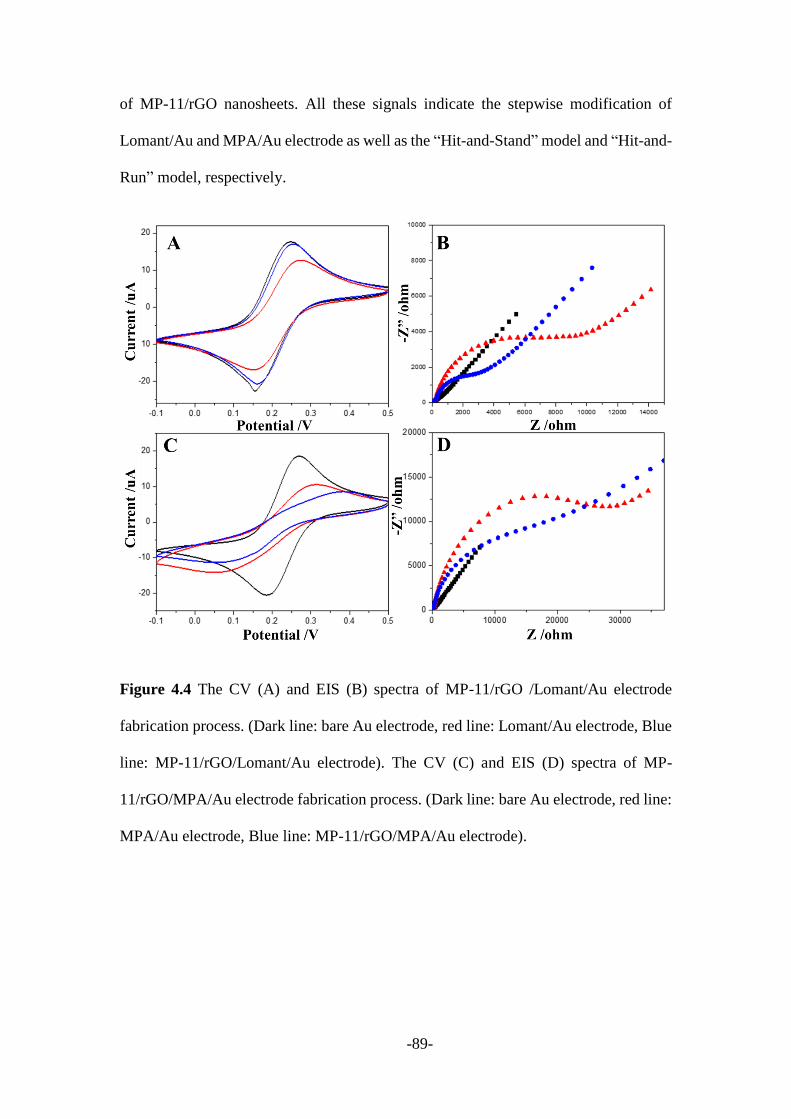
-89-
of MP-11/rGO nanosheets. All these signals indicate the stepwise modification of
Lomant/Au and MPA/Au electrode as well as the “Hit-and-Stand” model and “Hit-and-
Run” model, respectively.
Figure 4.4 The CV (A) and EIS (B) spectra of MP-11/rGO /Lomant/Au electrode
fabrication process. (Dark line: bare Au electrode, red line: Lomant/Au electrode, Blue
line: MP-11/rGO/Lomant/Au electrode). The CV (C) and EIS (D) spectra of MP-
11/rGO/MPA/Au electrode fabrication process. (Dark line: bare Au electrode, red line:
MPA/Au electrode, Blue line: MP-11/rGO/MPA/Au electrode).
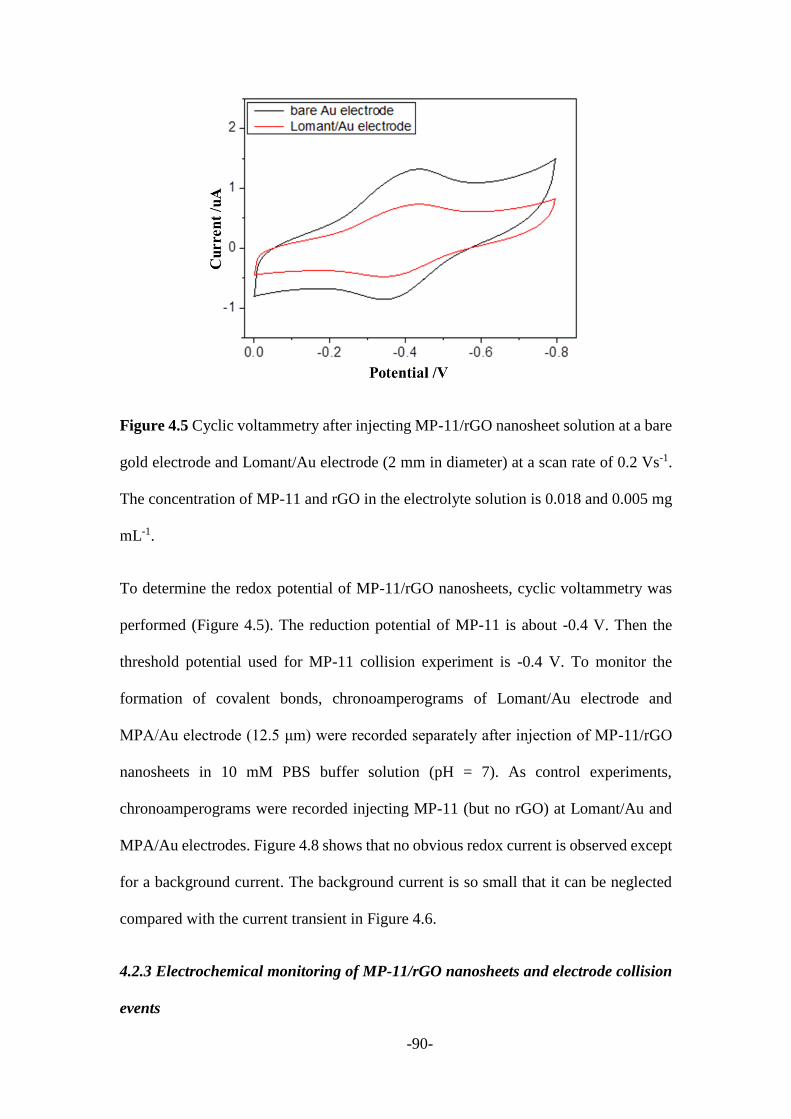
-90-
Figure 4.5 Cyclic voltammetry after injecting MP-11/rGO nanosheet solution at a bare
gold electrode and Lomant/Au electrode (2 mm in diameter) at a scan rate of 0.2 Vs-1.
The concentration of MP-11 and rGO in the electrolyte solution is 0.018 and 0.005 mg
mL-1.
To determine the redox potential of MP-11/rGO nanosheets, cyclic voltammetry was
performed (Figure 4.5). The reduction potential of MP-11 is about -0.4 V. Then the
threshold potential used for MP-11 collision experiment is -0.4 V. To monitor the
formation of covalent bonds, chronoamperograms of Lomant/Au electrode and
MPA/Au electrode (12.5 μm) were recorded separately after injection of MP-11/rGO
nanosheets in 10 mM PBS buffer solution (pH = 7). As control experiments,
chronoamperograms were recorded injecting MP-11 (but no rGO) at Lomant/Au and
MPA/Au electrodes. Figure 4.8 shows that no obvious redox current is observed except
for a background current. The background current is so small that it can be neglected
compared with the current transient in Figure 4.6.
4.2.3 Electrochemical monitoring of MP-11/rGO nanosheets and electrode collision
events
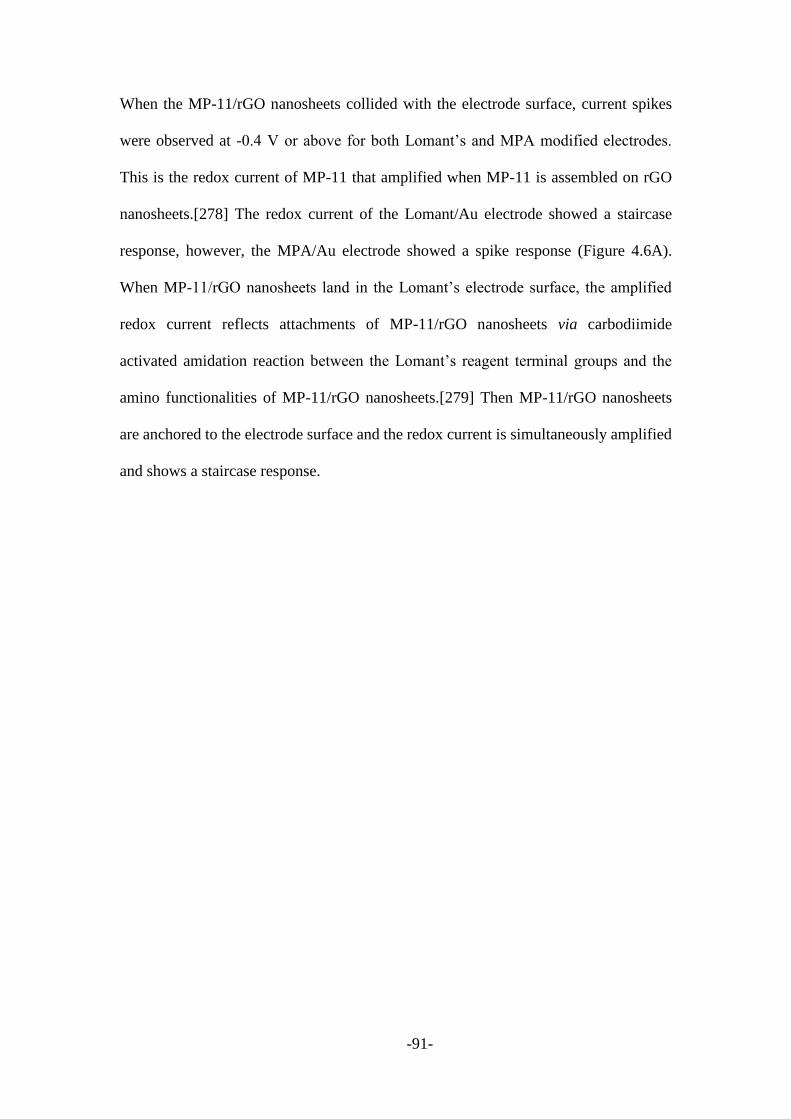
-91-
When the MP-11/rGO nanosheets collided with the electrode surface, current spikes
were observed at -0.4 V or above for both Lomant’s and MPA modified electrodes.
This is the redox current of MP-11 that amplified when MP-11 is assembled on rGO
nanosheets.[278] The redox current of the Lomant/Au electrode showed a staircase
response, however, the MPA/Au electrode showed a spike response (Figure 4.6A).
When MP-11/rGO nanosheets land in the Lomant’s electrode surface, the amplified
redox current reflects attachments of MP-11/rGO nanosheets via carbodiimide
activated amidation reaction between the Lomant’s reagent terminal groups and the
amino functionalities of MP-11/rGO nanosheets.[279] Then MP-11/rGO nanosheets
are anchored to the electrode surface and the redox current is simultaneously amplified
and shows a staircase response.
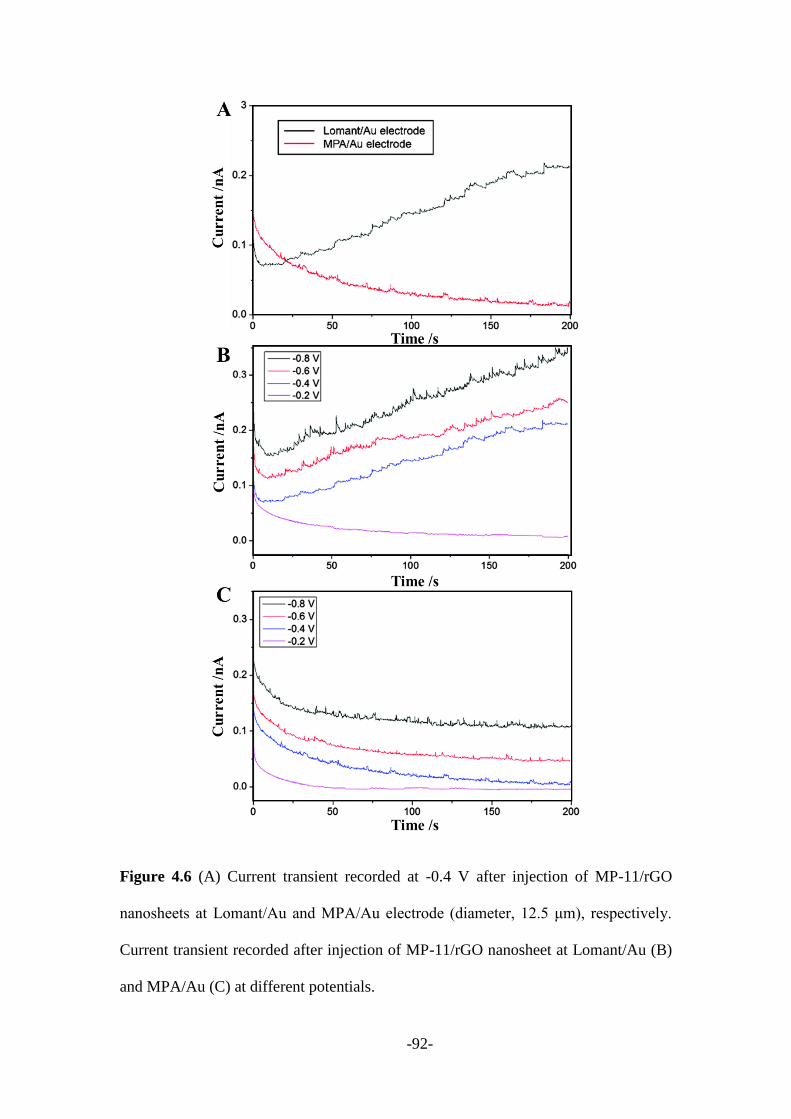
-92-
Figure 4.6 (A) Current transient recorded at -0.4 V after injection of MP-11/rGO
nanosheets at Lomant/Au and MPA/Au electrode (diameter, 12.5 μm), respectively.
Current transient recorded after injection of MP-11/rGO nanosheet at Lomant/Au (B)
and MPA/Au (C) at different potentials.

-93-
The stepwise current-time response indicated that MP-11 sticks to the electrode upon
contact, once MP-11/rGO nanosheets land in the Lomant’s electrode surface. Based on
control experiments, the permanent attachment of MP-11/rGO nanosheets strongly
suggested covalent bond formation via carbodiimide activated amidation reaction
between the Lomant’s reagent terminal groups and the amino functionalities of MP-
11/rGO nanosheets. The current increase is the synergetic results of MP-11/rGO
nanosheets. The number of staircase steps indicated the number of attached MP-11/rGO
nanosheets to the Lomant/Au electrode surface. The attached MP-11/rGO nanosheets
are held by covalent bonds between MP-11/rGO nanosheets the Lomant/Au electrode
surface. The total binding strength will depend on the number of covalent bonds. For
the MPA/Au electrode, only spike response was observed. The electrode surface is
negatively charged due to the terminated carboxyl group, while the MP-11/rGO
nanosheet is also negatively charged, and so there is electrostatic repulsion between
them. According to the electrochemical results shown in Figure 4.4, due to the steric
hindrance of –COOH and –NHS terminal group, some defects were produced on the
monolayer coated electrodes. Furthermore, please note when the MP-11/rGO
nanosheets collide with MPA/Au electrode, this collision process was the “Hit-and-Run”
case. In our previous work27, once MP-11/rGO nanosheets collide with the bare gold
electrode, current spikes were observed at potentials above -0.4 V, which also indicated
“Hit-and-Run” nanoparticles would contribute a current spike due to the limited time
of residence.
Figure 4.6A and C showed that current increases with the various potentials at both
Lomant/Au and MPA/Au electrodes. The current spikes were dependent on the
reduction potential. No spikes were found when the potential was below -0.4 V. As for
control experiments, no current spikes were observed for the Lomant’s reagent
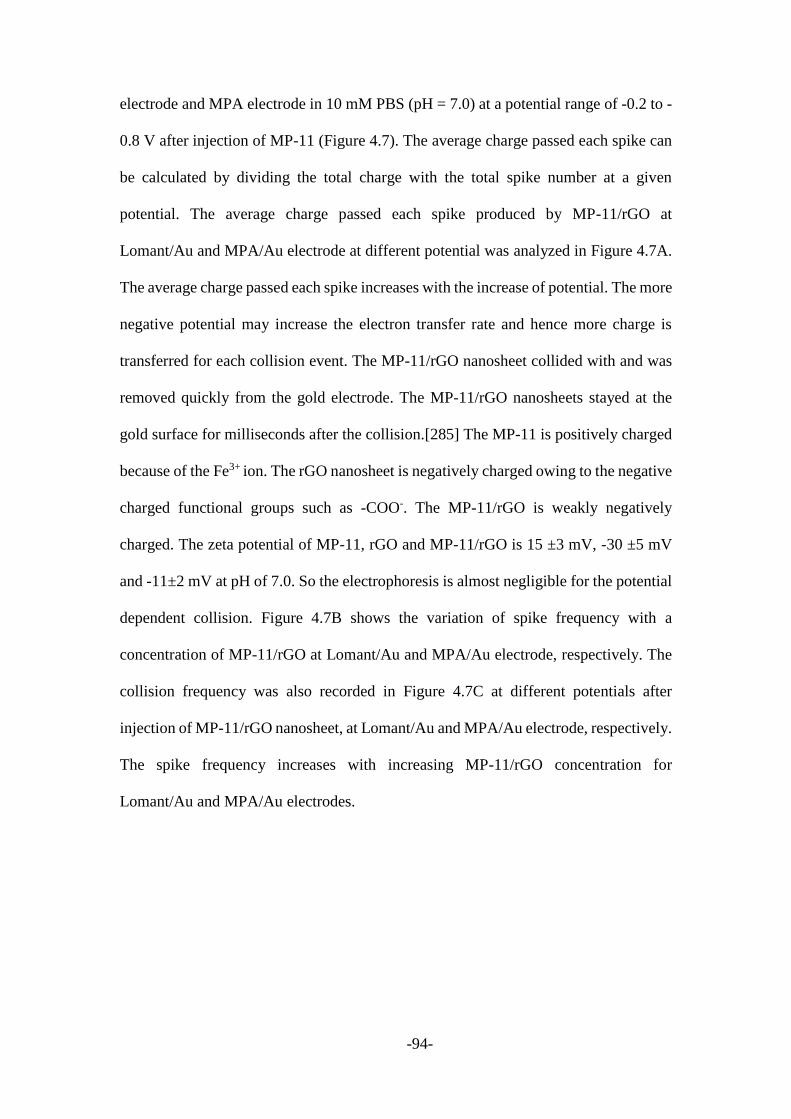
-94-
electrode and MPA electrode in 10 mM PBS (pH = 7.0) at a potential range of -0.2 to -
0.8 V after injection of MP-11 (Figure 4.7). The average charge passed each spike can
be calculated by dividing the total charge with the total spike number at a given
potential. The average charge passed each spike produced by MP-11/rGO at
Lomant/Au and MPA/Au electrode at different potential was analyzed in Figure 4.7A.
The average charge passed each spike increases with the increase of potential. The more
negative potential may increase the electron transfer rate and hence more charge is
transferred for each collision event. The MP-11/rGO nanosheet collided with and was
removed quickly from the gold electrode. The MP-11/rGO nanosheets stayed at the
gold surface for milliseconds after the collision.[285] The MP-11 is positively charged
because of the Fe3+ ion. The rGO nanosheet is negatively charged owing to the negative
charged functional groups such as -COO-. The MP-11/rGO is weakly negatively
charged. The zeta potential of MP-11, rGO and MP-11/rGO is 15 ±3 mV, -30 ±5 mV
and -11±2 mV at pH of 7.0. So the electrophoresis is almost negligible for the potential
dependent collision. Figure 4.7B shows the variation of spike frequency with a
concentration of MP-11/rGO at Lomant/Au and MPA/Au electrode, respectively. The
collision frequency was also recorded in Figure 4.7C at different potentials after
injection of MP-11/rGO nanosheet, at Lomant/Au and MPA/Au electrode, respectively.
The spike frequency increases with increasing MP-11/rGO concentration for
Lomant/Au and MPA/Au electrodes.
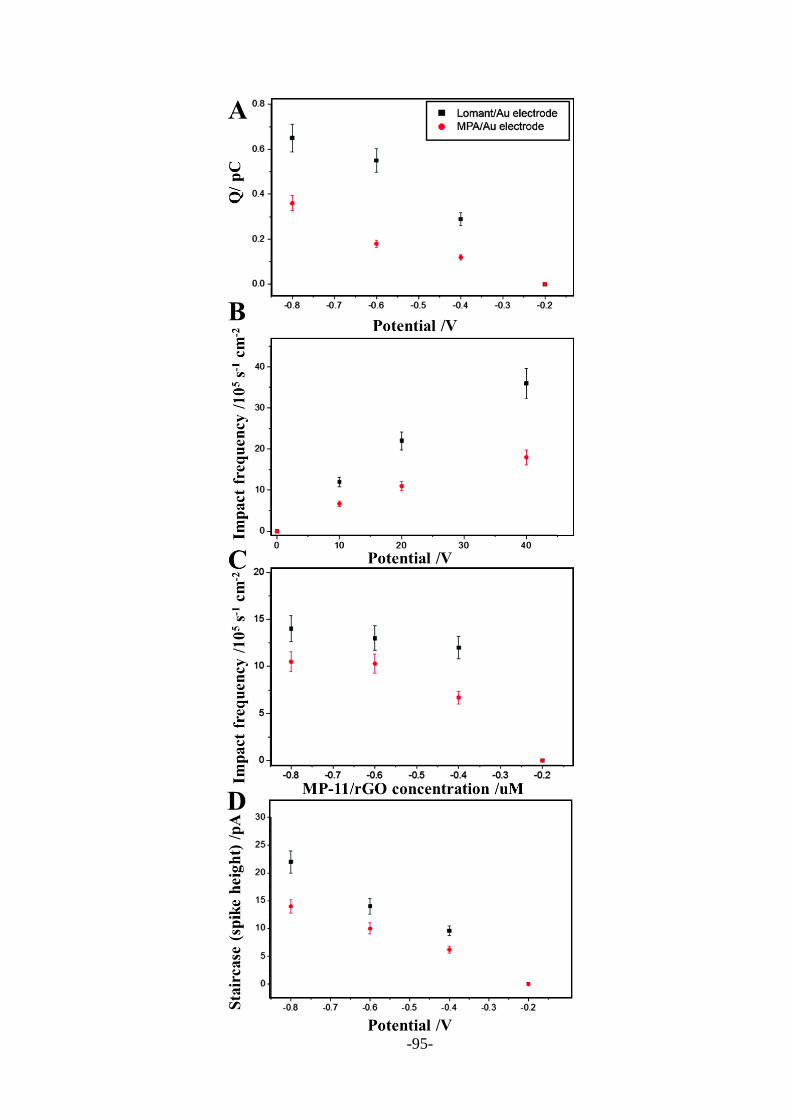
-95-
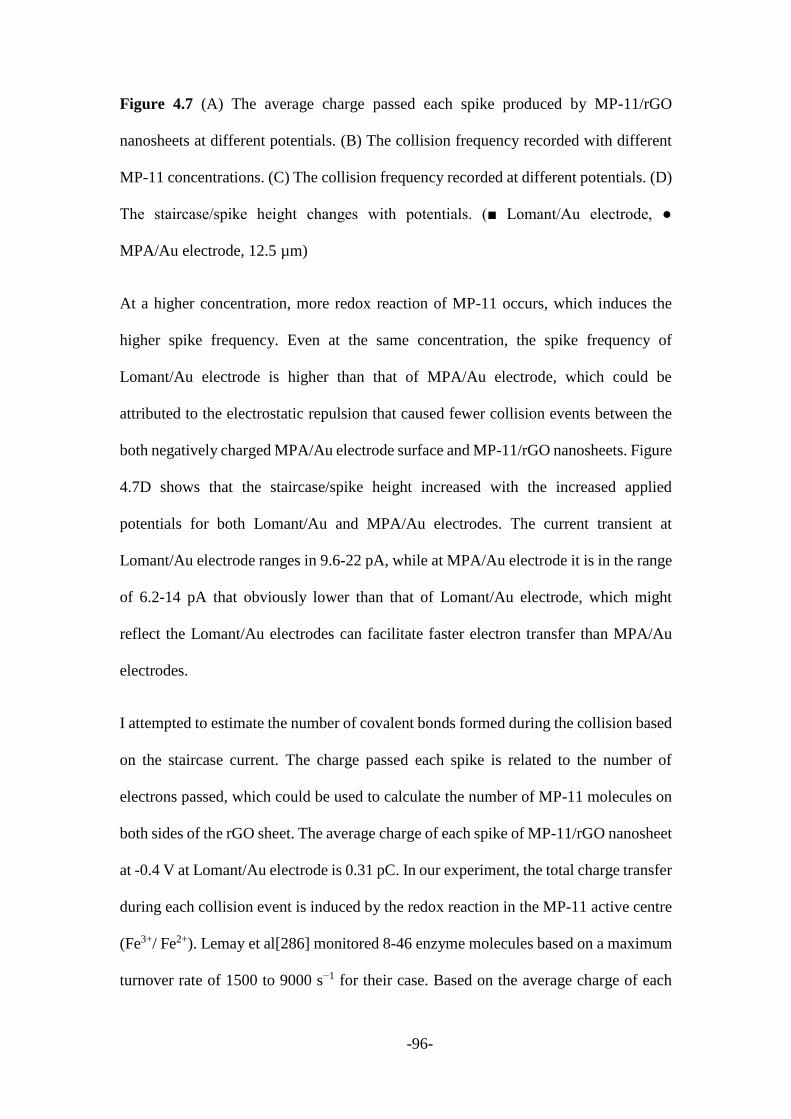
-96-
Figure 4.7 (A) The average charge passed each spike produced by MP-11/rGO
nanosheets at different potentials. (B) The collision frequency recorded with different
MP-11 concentrations. (C) The collision frequency recorded at different potentials. (D)
The staircase/spike height changes with potentials. ( Lomant/Au electrode,
MPA/Au electrode, 12.5 µm)
At a higher concentration, more redox reaction of MP-11 occurs, which induces the
higher spike frequency. Even at the same concentration, the spike frequency of
Lomant/Au electrode is higher than that of MPA/Au electrode, which could be
attributed to the electrostatic repulsion that caused fewer collision events between the
both negatively charged MPA/Au electrode surface and MP-11/rGO nanosheets. Figure
4.7D shows that the staircase/spike height increased with the increased applied
potentials for both Lomant/Au and MPA/Au electrodes. The current transient at
Lomant/Au electrode ranges in 9.6-22 pA, while at MPA/Au electrode it is in the range
of 6.2-14 pA that obviously lower than that of Lomant/Au electrode, which might
reflect the Lomant/Au electrodes can facilitate faster electron transfer than MPA/Au
electrodes.
I attempted to estimate the number of covalent bonds formed during the collision based
on the staircase current. The charge passed each spike is related to the number of
electrons passed, which could be used to calculate the number of MP-11 molecules on
both sides of the rGO sheet. The average charge of each spike of MP-11/rGO nanosheet
at -0.4 V at Lomant/Au electrode is 0.31 pC. In our experiment, the total charge transfer
during each collision event is induced by the redox reaction in the MP-11 active centre
(Fe3+/ Fe2+). Lemay et al[286] monitored 8-46 enzyme molecules based on a maximum
turnover rate of 1500 to 9000 s−1 for their case. Based on the average charge of each
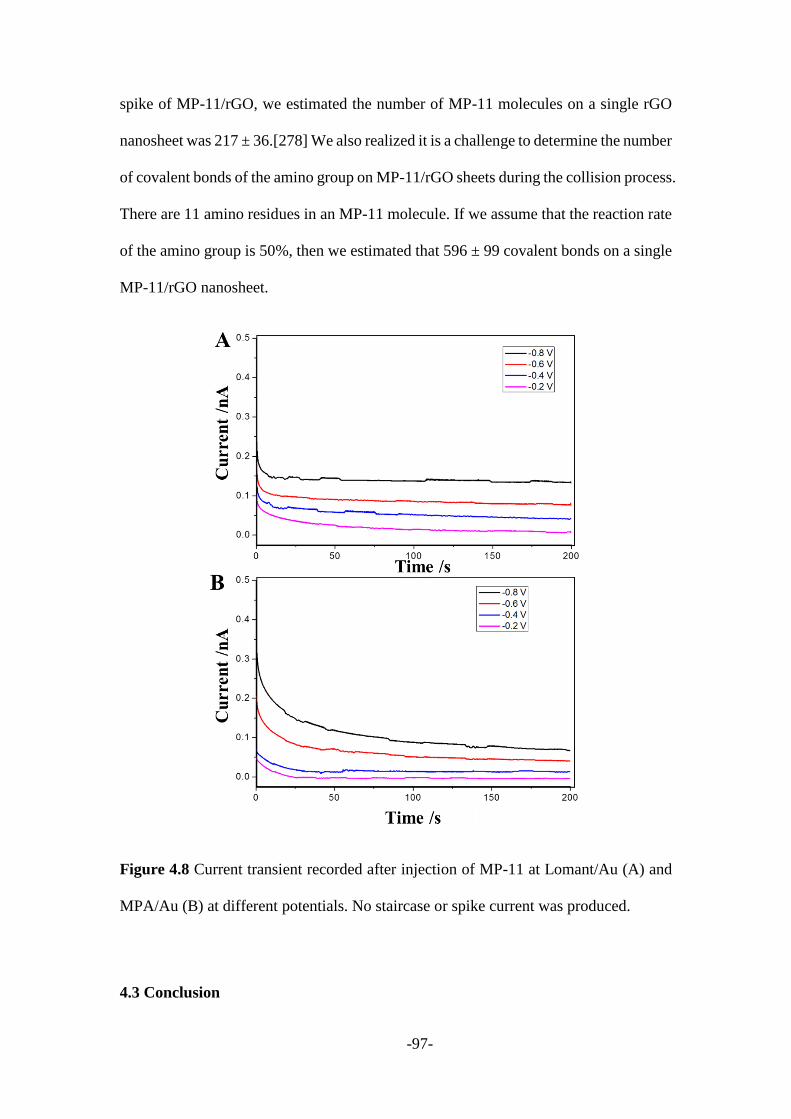
-97-
spike of MP-11/rGO, we estimated the number of MP-11 molecules on a single rGO
nanosheet was 217 ± 36.[278] We also realized it is a challenge to determine the number
of covalent bonds of the amino group on MP-11/rGO sheets during the collision process.
There are 11 amino residues in an MP-11 molecule. If we assume that the reaction rate
of the amino group is 50%, then we estimated that 596 ± 99 covalent bonds on a single
MP-11/rGO nanosheet.
Figure 4.8 Current transient recorded after injection of MP-11 at Lomant/Au (A) and
MPA/Au (B) at different potentials. No staircase or spike current was produced.
4.3 Conclusion
-98-
In conclusion, I have demonstrated a new electrochemical technique to monitor
covalent bond formation in real-time via nanoparticle-electrode collisions using the
amplified redox current MP-11 functionalized rGO nanosheet, which is anchored on
the electrode by covalently attachments of MP-11/rGO nanosheets via carbodiimide
activated amidation reaction between the Lomant’s reagent terminal groups and the
amino functionalities of MP-11/rGO nanosheets. This facile and highly sensitive
monitoring method could be useful for investigating the fundamental of single-
molecule reactions. However, this method only can be applied to estimate the covalent
bonds number that formed during the rGO/MP-11 nanoparticles collide with the
electrode surface. In our future work we plan to use a more direct methods to calculate
the bonds formation number.

-99-
Chapter 5: Sing-molecule covalent chemistry: real-time
direct observation of intermediates of the covalent bond
formation during single nanoparticle collisions
-100-
In the previous chapter, I have successfully observed the chemical bond formation
during the MP-11 functionalized graphene nanosheets and Lomant terminated
microelectrode collision process with electrochemical technique. However, due to the
electrochemical limitation, no specific structure revolution could be recorded with the
electrochemical measurement. In this chapter, I will use the electrochemical method
combined with surface-enhanced Raman spectroscopy technique to explore the
chemical bond formation process.
5.1 Introduction
Dynamic chemical activity investigation at a single-molecule level has been inspired
during the past decades, including directly or indirectly monitoring molecule
conformation switching, chemical bonding and chemical reaction.[22, 86, 287] For
example, individual reactant intermediates have been observed during the Cu(I)-
catalysed azide-alkyne cycloaddition (lifetime about 4.5 s) and bio-orthogonal
cycloaddition process (lifetime about 80 µs) by monitoring the ionic current flow
through a well-designed protein nanopore.[288, 289] Albert et al.[287] observed the
accelerated diels-alder reaction under external electric fields with the scanning
tunnelling microscopy break-junction approach. Significant progress has been made on
monitoring the current changing induced by the movement of electrons and/or nuclei
during the reaction process using high temporal resolution electrochemical techniques.
Taking the advantage of the single-molecule sensitivity of the nanoparticle-on-
nanoelectrode (NPoNE) geometry formed by the dynamic gold nanoparticle (GNP)
collision events,[92, 157, 290-292] the simultaneous electrochemistry and surface-
enhanced Raman spectroscopy (SERS) measurement system, designated as EC-SERS,
was employed to acquire potential-dependent Raman signal of the aromatic molecules
-101-
modified on the gold nanoelectrode (GNE).[12, 233] The subtle changes of molecular
fingerprints captured and recorded in the obtained EC-SERS results have provided
informative intermediate configuration changes for an in-depth understanding of the
reactions at the single-molecule level. In our previous work,[177] we have investigated
the molecule junction formation process in the NPoNE geometry and revealed the
evolution of interfacial chemical bonding during and after the GNP “Hit-and-Stand”
and “Hit-and-Run” collision events with the time-resolved EC-SERS technique. The
results lead to an in-depth understanding of the single NP motion and the associated
molecular level changes during the formation of the plasmonic molecular junctions in
a single NP collision event.
Observing the intricate chemical transformation that occurs during chemical reactions
is of great importance for exploring related reaction mechanisms and might lead to
dramatic optimization of industrially relevant processes.[21] Traditional reaction
identification techniques may be limited to sensitivity, selectivity, time-resolution and
critical analysis environment,[293] while the EC-SERS technique could satisfy the
required criteria for most chemical reactions. In this report, we monitored the
intermediates of amide formation between carboxylic acid and amine in aqueous media
through the single-molecule covalent chemical reaction with 10s of millisecond time
resolution. Firstly, we have observed the real-time formation of intermediates during
the amide bond formation process for the first time. Secondly, we revealed the evolution
of interfacial chemical bonds during the dynamic formation of the molecular junction.
Thirdly, the stability of the formed molecular junction and the charge transfer during
and after the amide bond formation process were also discussed in detail.
5.2 Results and discussion
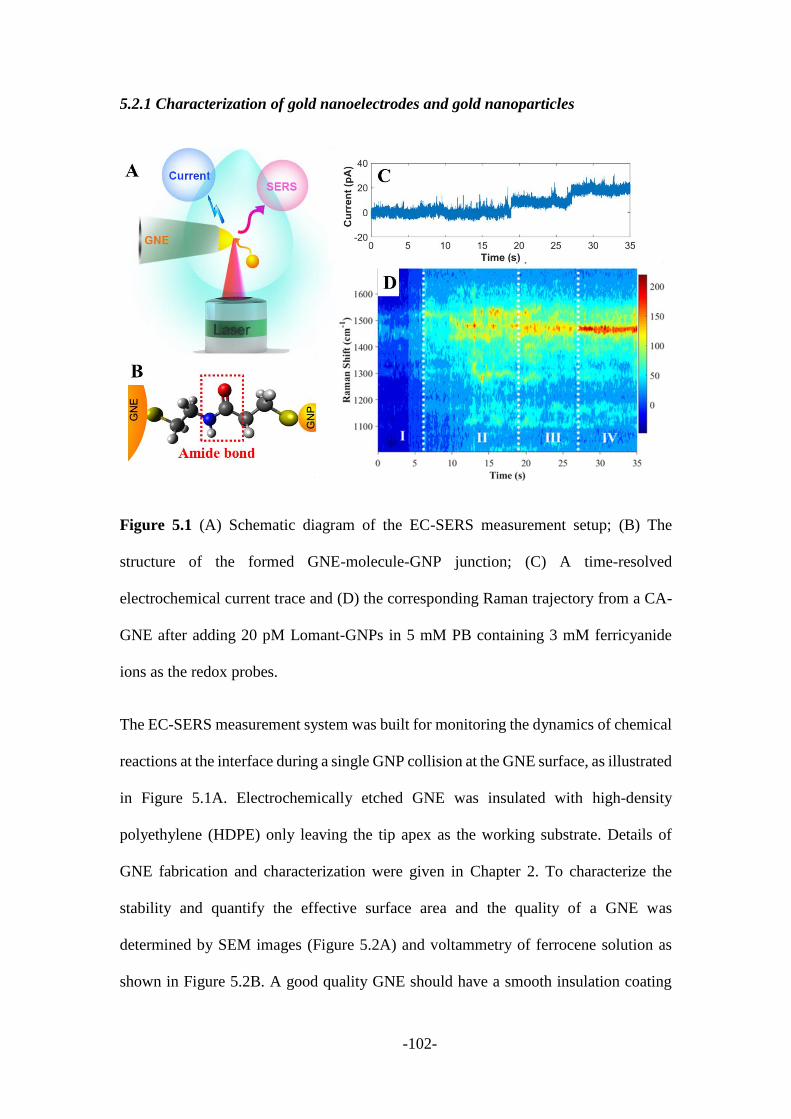
-102-
5.2.1 Characterization of gold nanoelectrodes and gold nanoparticles
Figure 5.1 (A) Schematic diagram of the EC-SERS measurement setup; (B) The
structure of the formed GNE-molecule-GNP junction; (C) A time-resolved
electrochemical current trace and (D) the corresponding Raman trajectory from a CA-
GNE after adding 20 pM Lomant-GNPs in 5 mM PB containing 3 mM ferricyanide
ions as the redox probes.
The EC-SERS measurement system was built for monitoring the dynamics of chemical
reactions at the interface during a single GNP collision at the GNE surface, as illustrated
in Figure 5.1A. Electrochemically etched GNE was insulated with high-density
polyethylene (HDPE) only leaving the tip apex as the working substrate. Details of
GNE fabrication and characterization were given in Chapter 2. To characterize the
stability and quantify the effective surface area and the quality of a GNE was
determined by SEM images (Figure 5.2A) and voltammetry of ferrocene solution as
shown in Figure 5.2B. A good quality GNE should have a smooth insulation coating
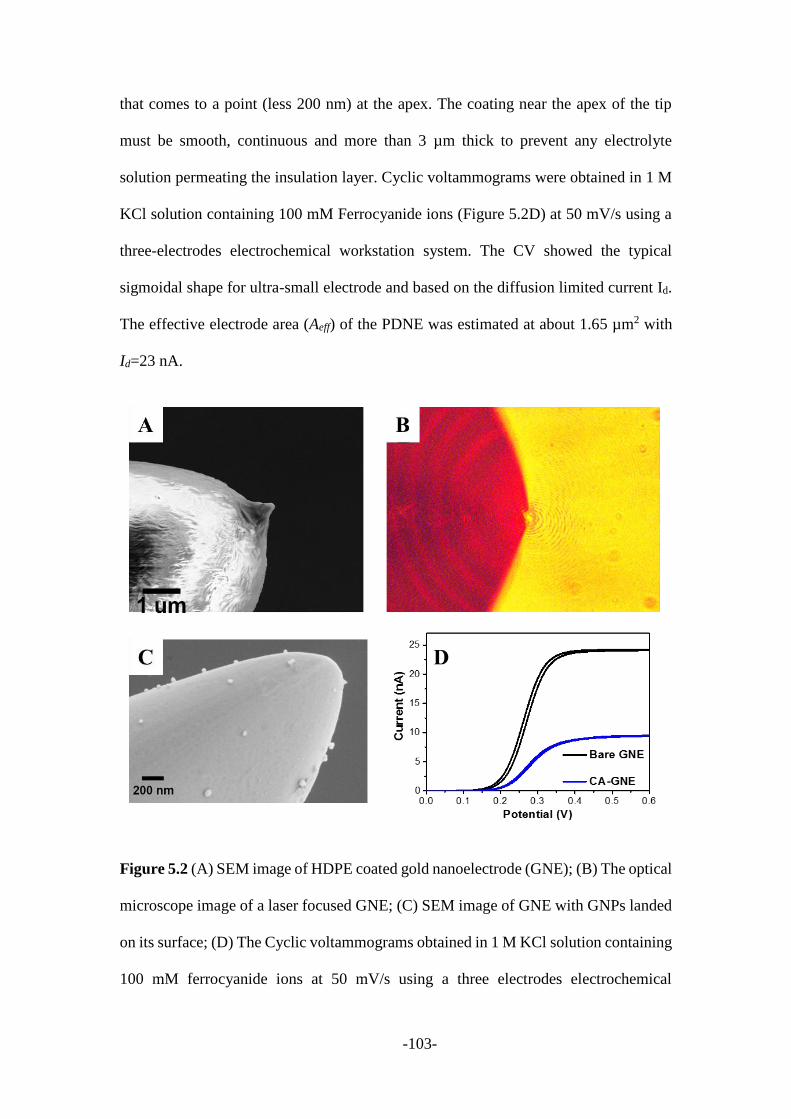
-103-
that comes to a point (less 200 nm) at the apex. The coating near the apex of the tip
must be smooth, continuous and more than 3 µm thick to prevent any electrolyte
solution permeating the insulation layer. Cyclic voltammograms were obtained in 1 M
KCl solution containing 100 mM Ferrocyanide ions (Figure 5.2D) at 50 mV/s using a
three-electrodes electrochemical workstation system. The CV showed the typical
sigmoidal shape for ultra-small electrode and based on the diffusion limited current Id.
The effective electrode area (Aeff) of the PDNE was estimated at about 1.65 µm2 with
Id=23 nA.
Figure 5.2 (A) SEM image of HDPE coated gold nanoelectrode (GNE); (B) The optical
microscope image of a laser focused GNE; (C) SEM image of GNE with GNPs landed
on its surface; (D) The Cyclic voltammograms obtained in 1 M KCl solution containing
100 mM ferrocyanide ions at 50 mV/s using a three electrodes electrochemical
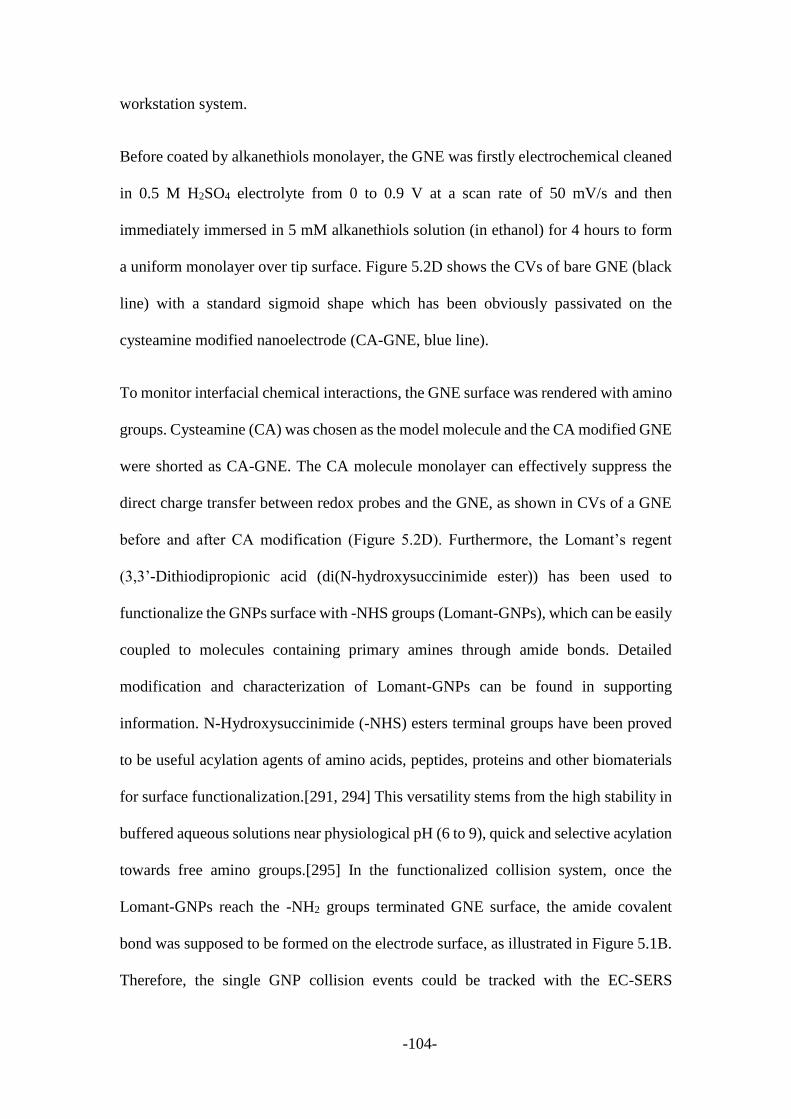
-104-
workstation system.
Before coated by alkanethiols monolayer, the GNE was firstly electrochemical cleaned
in 0.5 M H2SO4 electrolyte from 0 to 0.9 V at a scan rate of 50 mV/s and then
immediately immersed in 5 mM alkanethiols solution (in ethanol) for 4 hours to form
a uniform monolayer over tip surface. Figure 5.2D shows the CVs of bare GNE (black
line) with a standard sigmoid shape which has been obviously passivated on the
cysteamine modified nanoelectrode (CA-GNE, blue line).
To monitor interfacial chemical interactions, the GNE surface was rendered with amino
groups. Cysteamine (CA) was chosen as the model molecule and the CA modified GNE
were shorted as CA-GNE. The CA molecule monolayer can effectively suppress the
direct charge transfer between redox probes and the GNE, as shown in CVs of a GNE
before and after CA modification (Figure 5.2D). Furthermore, the Lomant’s regent
(3,3’-Dithiodipropionic acid (di(N-hydroxysuccinimide ester)) has been used to
functionalize the GNPs surface with -NHS groups (Lomant-GNPs), which can be easily
coupled to molecules containing primary amines through amide bonds. Detailed
modification and characterization of Lomant-GNPs can be found in supporting
information. N-Hydroxysuccinimide (-NHS) esters terminal groups have been proved
to be useful acylation agents of amino acids, peptides, proteins and other biomaterials
for surface functionalization.[291, 294] This versatility stems from the high stability in
buffered aqueous solutions near physiological pH (6 to 9), quick and selective acylation
towards free amino groups.[295] In the functionalized collision system, once the
Lomant-GNPs reach the -NH2 groups terminated GNE surface, the amide covalent
bond was supposed to be formed on the electrode surface, as illustrated in Figure 5.1B.
Therefore, the single GNP collision events could be tracked with the EC-SERS
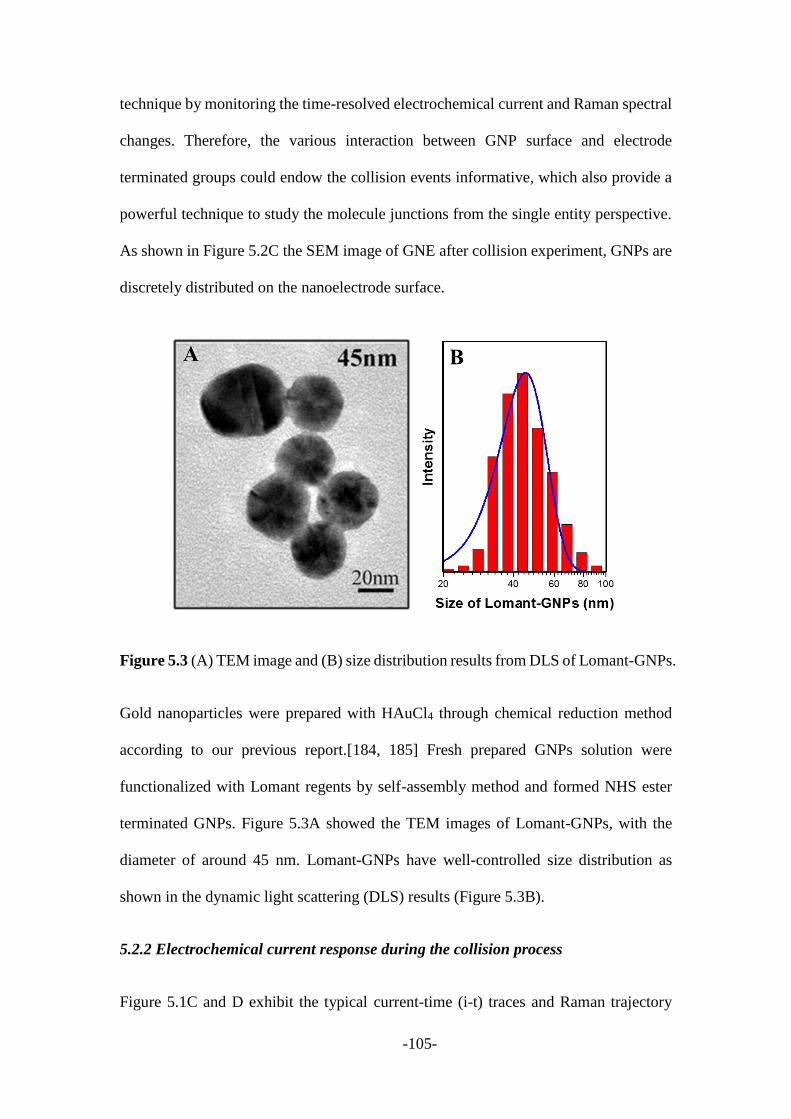
-105-
technique by monitoring the time-resolved electrochemical current and Raman spectral
changes. Therefore, the various interaction between GNP surface and electrode
terminated groups could endow the collision events informative, which also provide a
powerful technique to study the molecule junctions from the single entity perspective.
As shown in Figure 5.2C the SEM image of GNE after collision experiment, GNPs are
discretely distributed on the nanoelectrode surface.
Figure 5.3 (A) TEM image and (B) size distribution results from DLS of Lomant-GNPs.
Gold nanoparticles were prepared with HAuCl4 through chemical reduction method
according to our previous report.[184, 185] Fresh prepared GNPs solution were
functionalized with Lomant regents by self-assembly method and formed NHS ester
terminated GNPs. Figure 5.3A showed the TEM images of Lomant-GNPs, with the
diameter of around 45 nm. Lomant-GNPs have well-controlled size distribution as
shown in the dynamic light scattering (DLS) results (Figure 5.3B).
5.2.2 Electrochemical current response during the collision process
Figure 5.1C and D exhibit the typical current-time (i-t) traces and Raman trajectory
-106-
acquired simultaneously from a CA-GNE after adding 20 pM Lomant-GNPs in 5 mM
PBS solution containing 3 mM ferricyanide as redox probes. I first analysed the current
changes induced by the GNP collision events. Before adding Lomant-GNP in the
solution, no detectable current change could be observed at V = +600 mV vs. Ag/AgCl
quasi reference electrode, suggesting the stability of CA monolayer on the GNE surface.
After introducing Lomant-GNPs, obvious transient current changes were observed,
induced by the increased oxidation current of Fe(CN)63-/4- ions from the surface of
newly landed GNP. Three featured current change types have been observed: single
spike, cluster and stair signals (Figure 5.4). Notably, the current spikes are the dominate
changes appeared in the i-t trace, while the cluster events are much less, and the current
steps could only be observed at the beginning of the experiments.
Figure 5.4 Three types of current response: (A) single spike (black), (B) cluster of
current (brown), (C) step current (purple) with the related peak current height and
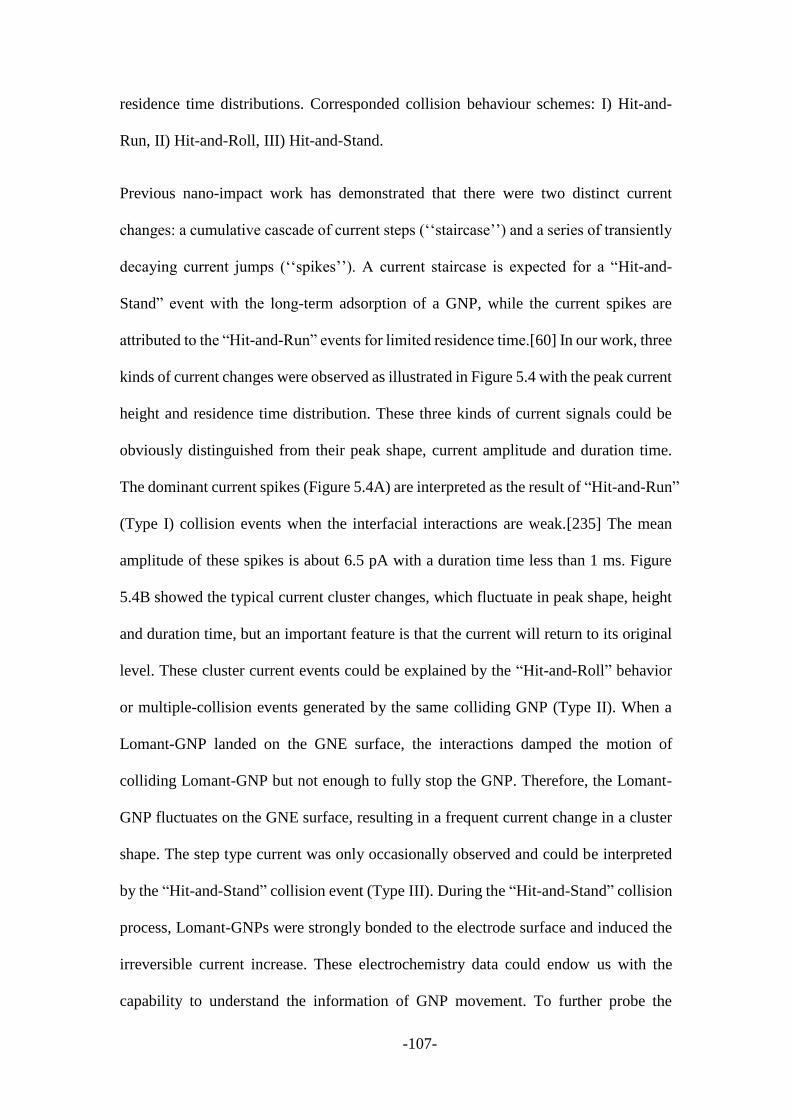
-107-
residence time distributions. Corresponded collision behaviour schemes: I) Hit-and-
Run, II) Hit-and-Roll, III) Hit-and-Stand.
Previous nano-impact work has demonstrated that there were two distinct current
changes: a cumulative cascade of current steps (‘‘staircase’’) and a series of transiently
decaying current jumps (‘‘spikes’’). A current staircase is expected for a “Hit-and-
Stand” event with the long-term adsorption of a GNP, while the current spikes are
attributed to the “Hit-and-Run” events for limited residence time.[60] In our work, three
kinds of current changes were observed as illustrated in Figure 5.4 with the peak current
height and residence time distribution. These three kinds of current signals could be
obviously distinguished from their peak shape, current amplitude and duration time.
The dominant current spikes (Figure 5.4A) are interpreted as the result of “Hit-and-Run”
(Type I) collision events when the interfacial interactions are weak.[235] The mean
amplitude of these spikes is about 6.5 pA with a duration time less than 1 ms. Figure
5.4B showed the typical current cluster changes, which fluctuate in peak shape, height
and duration time, but an important feature is that the current will return to its original
level. These cluster current events could be explained by the “Hit-and-Roll” behavior
or multiple-collision events generated by the same colliding GNP (Type II). When a
Lomant-GNP landed on the GNE surface, the interactions damped the motion of
colliding Lomant-GNP but not enough to fully stop the GNP. Therefore, the Lomant-
GNP fluctuates on the GNE surface, resulting in a frequent current change in a cluster
shape. The step type current was only occasionally observed and could be interpreted
by the “Hit-and-Stand” collision event (Type III). During the “Hit-and-Stand” collision
process, Lomant-GNPs were strongly bonded to the electrode surface and induced the
irreversible current increase. These electrochemistry data could endow us with the
capability to understand the information of GNP movement. To further probe the
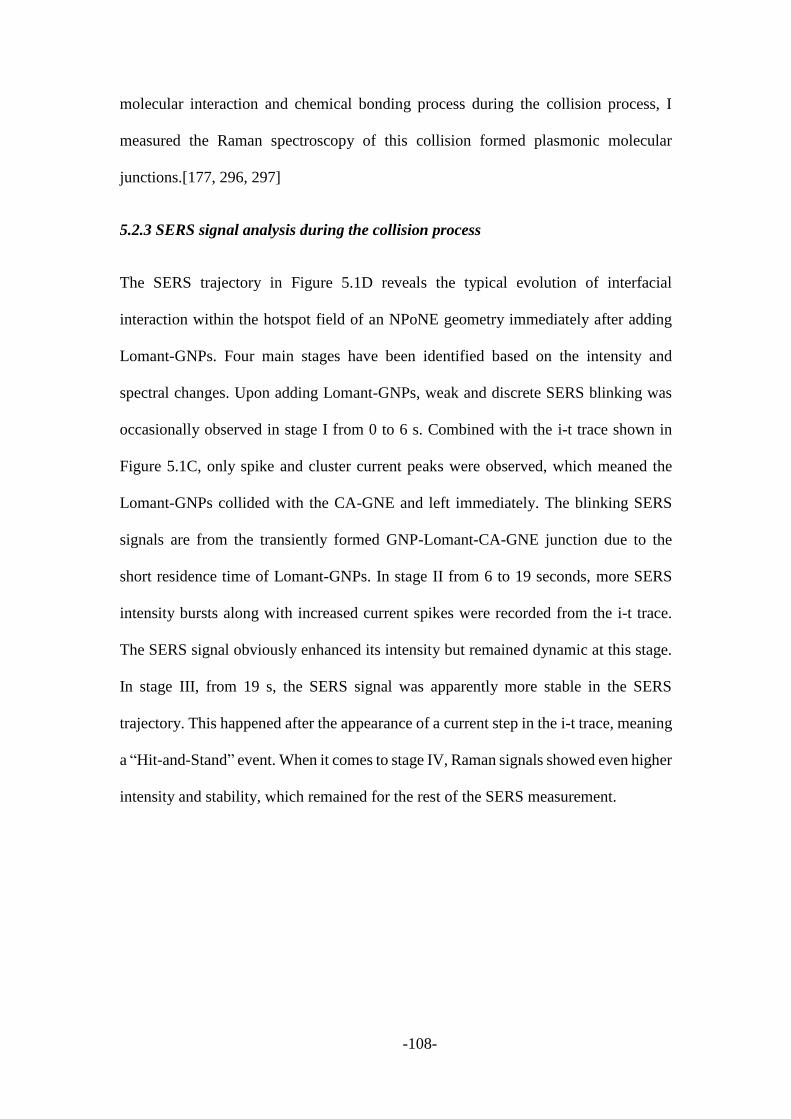
-108-
molecular interaction and chemical bonding process during the collision process, I
measured the Raman spectroscopy of this collision formed plasmonic molecular
junctions.[177, 296, 297]
5.2.3 SERS signal analysis during the collision process
The SERS trajectory in Figure 5.1D reveals the typical evolution of interfacial
interaction within the hotspot field of an NPoNE geometry immediately after adding
Lomant-GNPs. Four main stages have been identified based on the intensity and
spectral changes. Upon adding Lomant-GNPs, weak and discrete SERS blinking was
occasionally observed in stage I from 0 to 6 s. Combined with the i-t trace shown in
Figure 5.1C, only spike and cluster current peaks were observed, which meaned the
Lomant-GNPs collided with the CA-GNE and left immediately. The blinking SERS
signals are from the transiently formed GNP-Lomant-CA-GNE junction due to the
short residence time of Lomant-GNPs. In stage II from 6 to 19 seconds, more SERS
intensity bursts along with increased current spikes were recorded from the i-t trace.
The SERS signal obviously enhanced its intensity but remained dynamic at this stage.
In stage III, from 19 s, the SERS signal was apparently more stable in the SERS
trajectory. This happened after the appearance of a current step in the i-t trace, meaning
a “Hit-and-Stand” event. When it comes to stage IV, Raman signals showed even higher
intensity and stability, which remained for the rest of the SERS measurement.
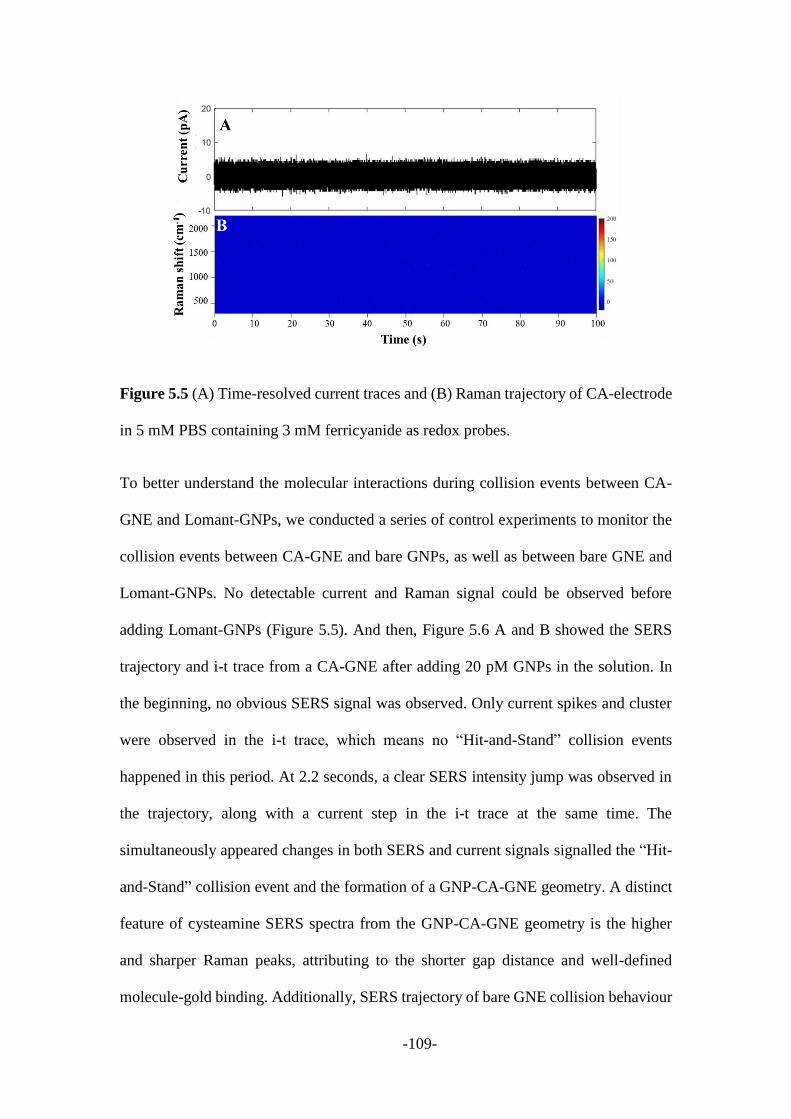
-109-
Figure 5.5 (A) Time-resolved current traces and (B) Raman trajectory of CA-electrode
in 5 mM PBS containing 3 mM ferricyanide as redox probes.
To better understand the molecular interactions during collision events between CA-
GNE and Lomant-GNPs, we conducted a series of control experiments to monitor the
collision events between CA-GNE and bare GNPs, as well as between bare GNE and
Lomant-GNPs. No detectable current and Raman signal could be observed before
adding Lomant-GNPs (Figure 5.5). And then, Figure 5.6 A and B showed the SERS
trajectory and i-t trace from a CA-GNE after adding 20 pM GNPs in the solution. In
the beginning, no obvious SERS signal was observed. Only current spikes and cluster
were observed in the i-t trace, which means no “Hit-and-Stand” collision events
happened in this period. At 2.2 seconds, a clear SERS intensity jump was observed in
the trajectory, along with a current step in the i-t trace at the same time. The
simultaneously appeared changes in both SERS and current signals signalled the “Hit-
and-Stand” collision event and the formation of a GNP-CA-GNE geometry. A distinct
feature of cysteamine SERS spectra from the GNP-CA-GNE geometry is the higher
and sharper Raman peaks, attributing to the shorter gap distance and well-defined
molecule-gold binding. Additionally, SERS trajectory of bare GNE collision behaviour
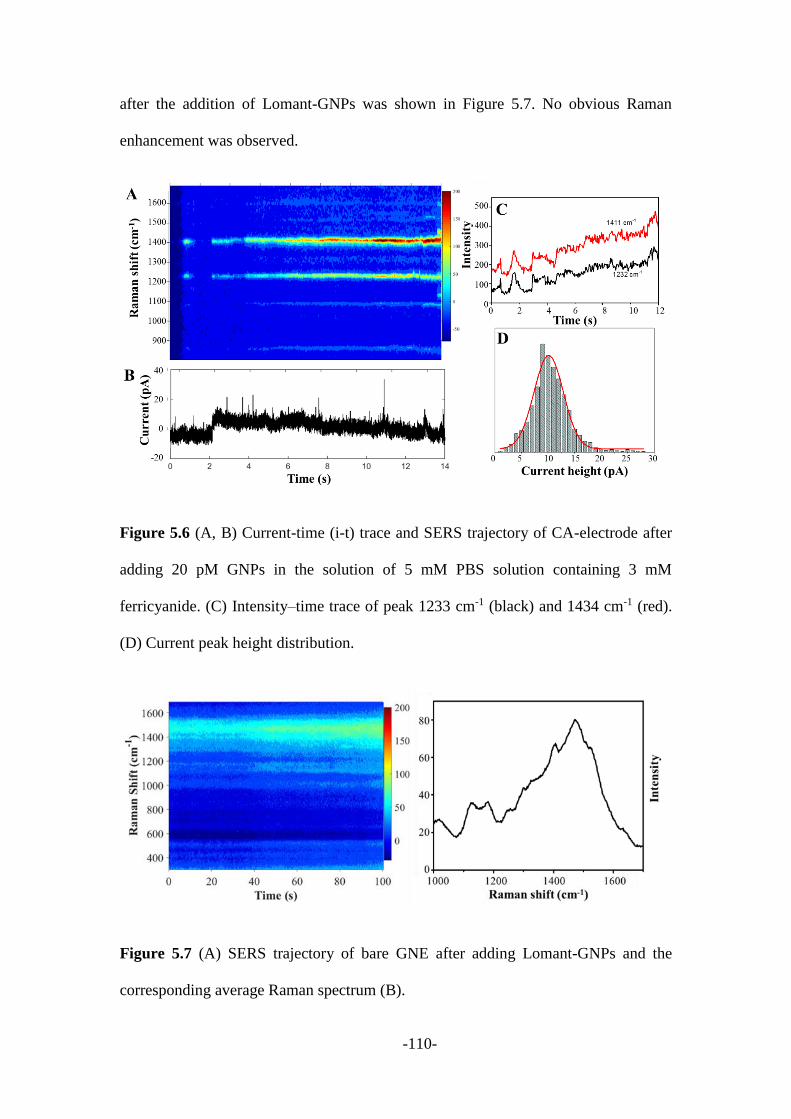
-110-
after the addition of Lomant-GNPs was shown in Figure 5.7. No obvious Raman
enhancement was observed.
Figure 5.6 (A, B) Current-time (i-t) trace and SERS trajectory of CA-electrode after
adding 20 pM GNPs in the solution of 5 mM PBS solution containing 3 mM
ferricyanide. (C) Intensity–time trace of peak 1233 cm-1 (black) and 1434 cm-1 (red).
(D) Current peak height distribution.
Figure 5.7 (A) SERS trajectory of bare GNE after adding Lomant-GNPs and the
corresponding average Raman spectrum (B).
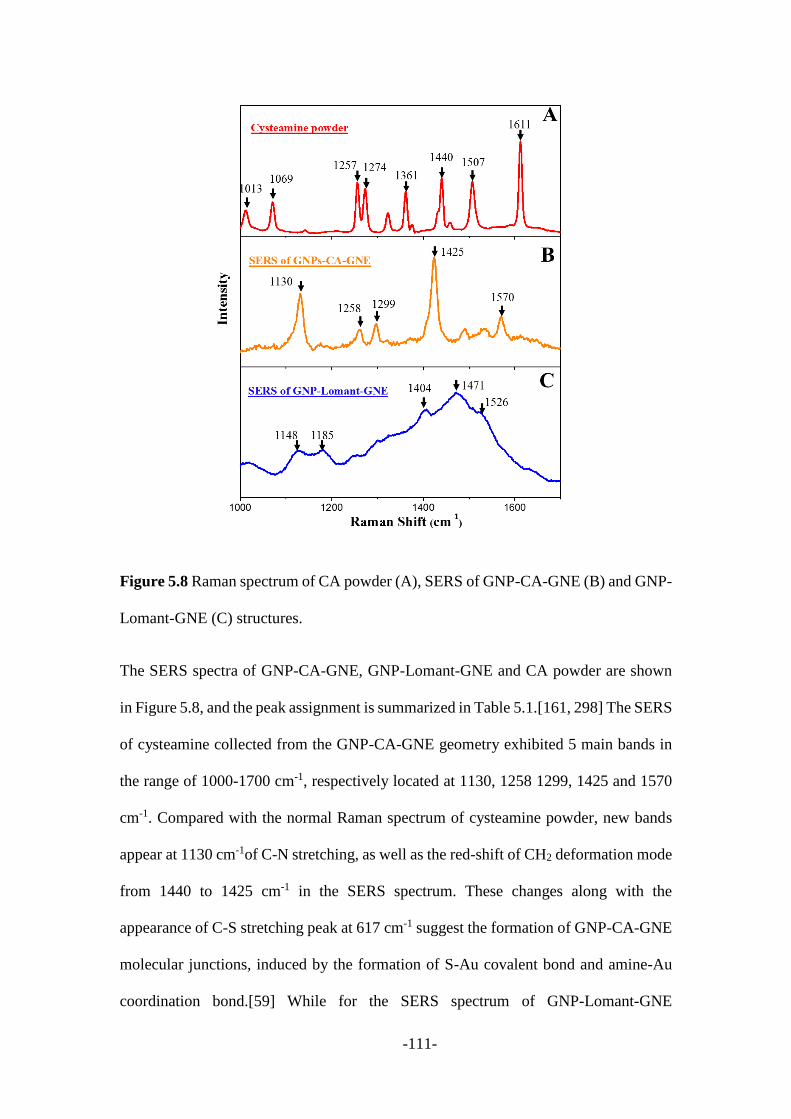
-111-
Figure 5.8 Raman spectrum of CA powder (A), SERS of GNP-CA-GNE (B) and GNP-
Lomant-GNE (C) structures.
The SERS spectra of GNP-CA-GNE, GNP-Lomant-GNE and CA powder are shown
in Figure 5.8, and the peak assignment is summarized in Table 5.1.[161, 298] The SERS
of cysteamine collected from the GNP-CA-GNE geometry exhibited 5 main bands in
the range of 1000-1700 cm-1, respectively located at 1130, 1258 1299, 1425 and 1570
cm-1. Compared with the normal Raman spectrum of cysteamine powder, new bands
appear at 1130 cm-1of C-N stretching, as well as the red-shift of CH2 deformation mode
from 1440 to 1425 cm-1 in the SERS spectrum. These changes along with the
appearance of C-S stretching peak at 617 cm-1 suggest the formation of GNP-CA-GNE
molecular junctions, induced by the formation of S-Au covalent bond and amine-Au
coordination bond.[59] While for the SERS spectrum of GNP-Lomant-GNE

-112-
nanostructure, a broadband between1400 and1500 cm-1 appeared, which could be
attributed to the non-specific interactions of Lomant molecules on GNP surface.
Table 5.1. Raman peak assignment.
Cysteamine
powder
SERS of GNP-
CA-GNE
SERS of GNP-
Lomant-GNE Assignments
1013 cm-1 νs(C-C-N) + wag(NH
2)
1069 cm-1 ν(C-N) + t(CH2)S
1130 cm-1 1148 cm-1 v(C-N)
1185 cm-1 δ(N-H)
1257 cm-1 1258 cm-1 t(CH2)N+t(NH
2)
1274 cm-1 1299 cm-1 t(CH2)s
1361 cm-1 wag(CH2)N
1440 cm-1 1425 cm-1 1404 cm-1 δ(CH2)s
1471 cm-1 v(C-N)
1507 cm-1 δ(CH2)N
1526 cm-1 v(C=O)
1611 cm-1 1570 cm-1 δ(NH2)
However, only for the SERS trajectory that obtained on CA-GNE after adding Lomant-
GNPs (Figure 5.1D), four main stages could be distinguished as indicated from I to IV.
Before 26 second, three bands around 1300, 1438 and 1510 cm-1 dominated the dynamic
spectrum induced by Lomant-GNP and CA-GNE collision events, which is
corresponded to the twisting, stretching mode of CH2 bands. A new peak at 1480 cm-1,
attributed to the N-C=O stretching mode of Lomant regent, emerged from 20 s, along
with the current change in the i-t trace. However, when a clear “Hit-and-Stand” signal
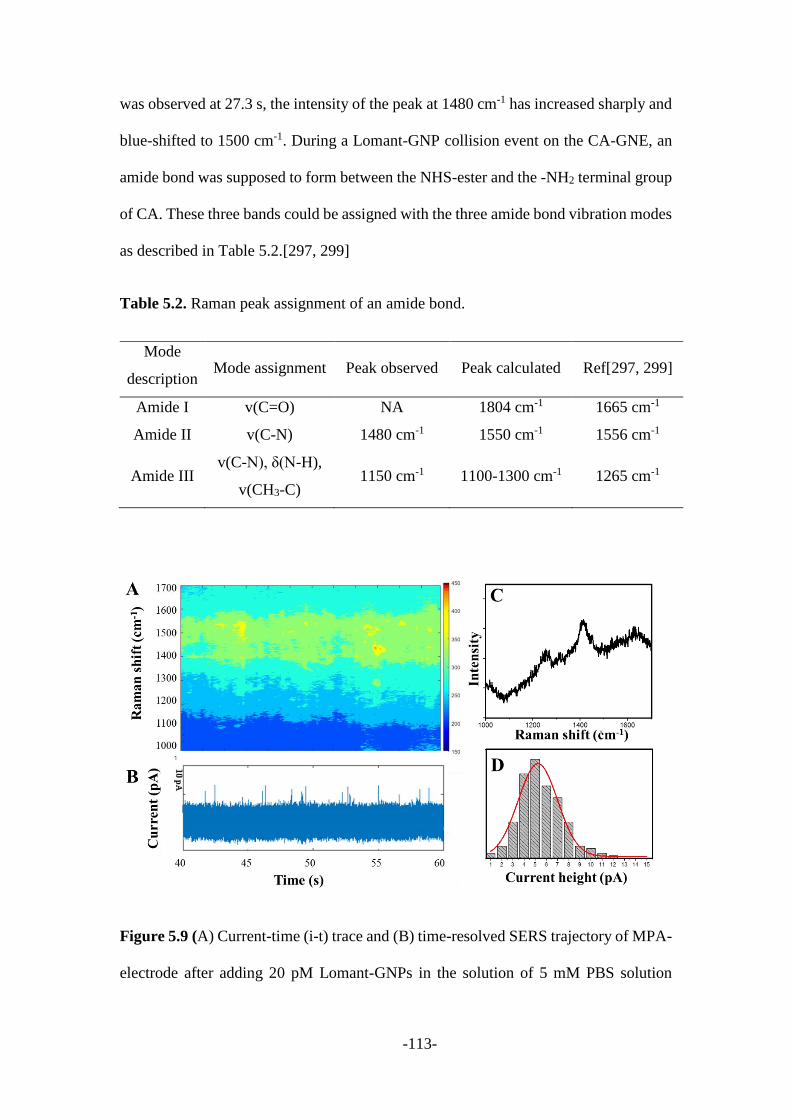
-113-
was observed at 27.3 s, the intensity of the peak at 1480 cm-1 has increased sharply and
blue-shifted to 1500 cm-1. During a Lomant-GNP collision event on the CA-GNE, an
amide bond was supposed to form between the NHS-ester and the -NH2 terminal group
of CA. These three bands could be assigned with the three amide bond vibration modes
as described in Table 5.2.[297, 299]
Table 5.2. Raman peak assignment of an amide bond.
Mode
description Mode assignment Peak observed Peak calculated Ref[297, 299]
Amide I v(C=O) NA 1804 cm-1 1665 cm-1
Amide II v(C-N) 1480 cm-1 1550 cm-1 1556 cm-1
Amide III v(C-N), δ(N-H),
v(CH3-C) 1150 cm-1 1100-1300 cm-1 1265 cm-1
Figure 5.9 (A) Current-time (i-t) trace and (B) time-resolved SERS trajectory of MPA-
electrode after adding 20 pM Lomant-GNPs in the solution of 5 mM PBS solution
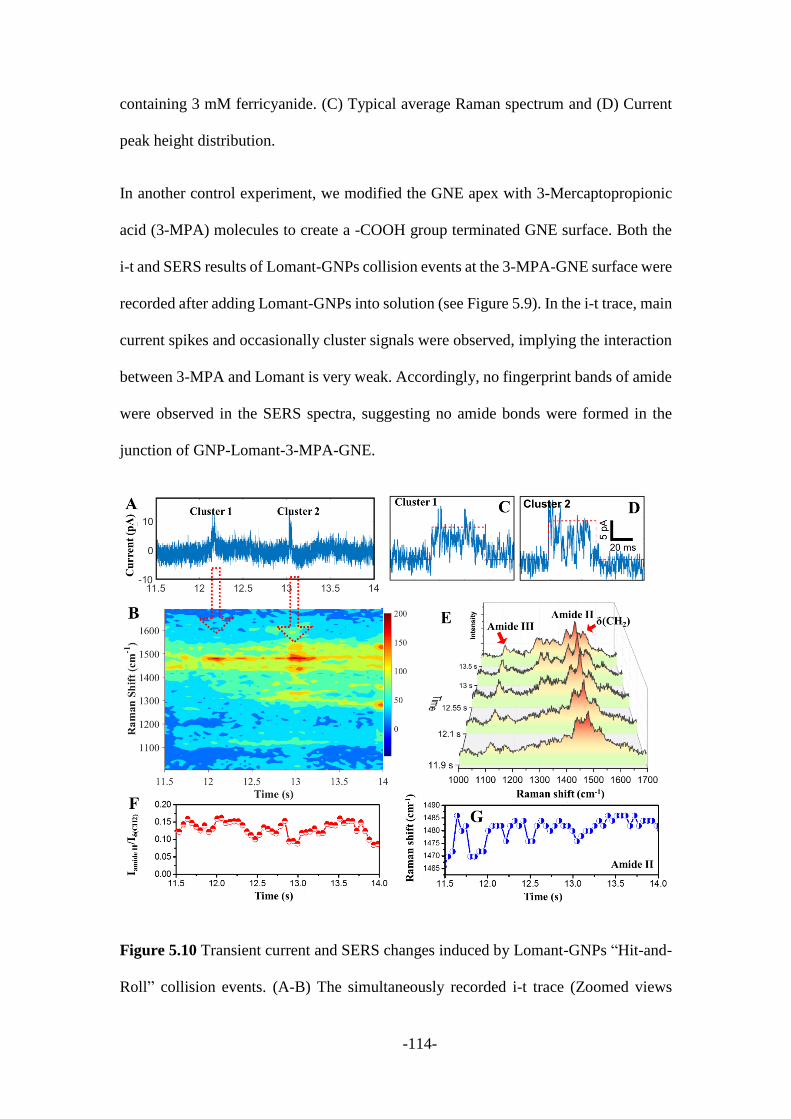
-114-
containing 3 mM ferricyanide. (C) Typical average Raman spectrum and (D) Current
peak height distribution.
In another control experiment, we modified the GNE apex with 3-Mercaptopropionic
acid (3-MPA) molecules to create a -COOH group terminated GNE surface. Both the
i-t and SERS results of Lomant-GNPs collision events at the 3-MPA-GNE surface were
recorded after adding Lomant-GNPs into solution (see Figure 5.9). In the i-t trace, main
current spikes and occasionally cluster signals were observed, implying the interaction
between 3-MPA and Lomant is very weak. Accordingly, no fingerprint bands of amide
were observed in the SERS spectra, suggesting no amide bonds were formed in the
junction of GNP-Lomant-3-MPA-GNE.
Figure 5.10 Transient current and SERS changes induced by Lomant-GNPs “Hit-and-
Roll” collision events. (A-B) The simultaneously recorded i-t trace (Zoomed views
-115-
about current cluster I, II) and SERS heatmap. (C) Progressive SERS spectra in the
range of 1000 to 1700 cm-1 from 11.9 to 13.5 s. (D) The intensity ratio-time traces of
v(N-C=O) and δ(CH2). (E) Raman shift-time traces of amide II peak at 1480 cm-1.
We have shown the main characteristic of SERS and current responses during the
collision events of Lomant-GNPs on CA-GNE. Now we will discuss in details the
changes induced by “Hit-and-Roll” and “Hit-and-Stand” events (Figure 5.10 and 5.11)
in i-t trace and SERS trajectory. Firstly, the typical current changes and transient SERS
induced by Lomant-GNPs “Hit-and-Roll’ collision events are displayed in Figure
5.10A and 5.10B. In the i-t trace, two cluster current signals appeared at 12.2 s and 13.0
s. Both clusters are zoomed-in in Figure 5.10C and 5.10D. Corresponding SERS signal
changes were observed, as shown in Figure 5.10E. The SERS spectra at 11.9, 12.1,
12.55, 13.0 and 13.5 s are displayed in Figure 5.10E, showing four main peaks near
1121, 1438, 1483 and 1510 cm-1, which mainly originated from the stretching of C-N,
deformation of CH2, stretching of N-C=O and bending of CH2, respectively. Because
the v (N-C=O) mode can only come from the Lomant-GNP, we can use the change of
this band to monitor the presence of Lomant-GNPs. As shown in the heatmap of Figure
5.10B, the intensity of the peak at 1483 cm-1 increased with the landing of Lomant-
GNP and decreased when it left. The intensity ratio between v (N-C=O) and δ (CH2)
could help us understand the structure-activity as shown in Figure 5.10F. The
magnitude of intensity ratio varied with Lomant-GNP landing and leaving in the range
of 1.0 to 1.75, the peak position also shifted from 1470 to 1483 cm-1 (Figure 5.10G),
which could be attributed to the Lomant-GNP induced movement on cysteamine
decorated electrode surface.
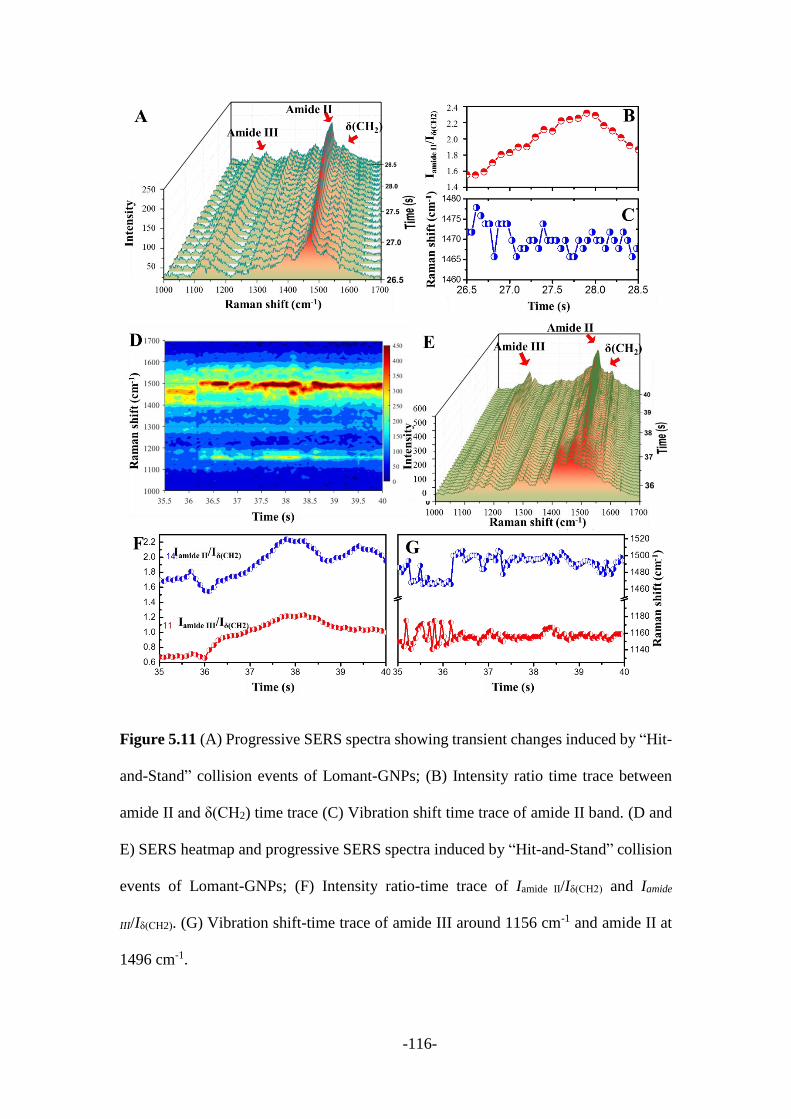
-116-
Figure 5.11 (A) Progressive SERS spectra showing transient changes induced by “Hit-
and-Stand” collision events of Lomant-GNPs; (B) Intensity ratio time trace between
amide II and δ(CH2) time trace (C) Vibration shift time trace of amide II band. (D and
E) SERS heatmap and progressive SERS spectra induced by “Hit-and-Stand” collision
events of Lomant-GNPs; (F) Intensity ratio-time trace of Iamide II/Iδ(CH2) and Iamide
III/Iδ(CH2). (G) Vibration shift-time trace of amide III around 1156 cm-1 and amide II at
1496 cm-1.

-117-
In contrast, the SERS intensity jumped and remained at a higher level after a “Hit-and-
Stand” collision event, as previously shown in the SERS heatmap in Figure 5.1D at
about 27 s with the progressive SERS spectra detailed shown in Figure 5.11A. The
amide II band at 1483 cm-1 increased with a current signal when a Lomant-GNP landed
on the GNE surface. After landing, the intensity of band 1483 cm-1 fluctuated while
increased to the maximum value at 27.29 s, and then slightly decreased at 27.60 s. The
intensity ratio trace of Iamide II/Iδ(CH2) is shown in Figure 5.11B. The band position blue
shift from 1483 cm-1 to 1475 cm-1 as shown in Figure 5.11C. In another case as shown
in Figure 4D, the Raman heatmap after GNP landed. As we can see, a clear shift from
1475 cm-1 towards 1500 cm-1 and one new band at 1165 cm-1 (amide III) were observed
at the same time. As shown in the progressive SERS spectra of Figure 5.11E, the
intensity of these three bands obviously increased and slightly decreased at 39 seconds.
The intensity ratio of Iamide II/Iδ(CH2) and Iamide III/Iδ(CH2) fluctuated in the range of 1.5 to
2.3 and 0.6 to 1.2, respectively, as shown in Figure 5.11F.
According to previous kinetics and mechanism study about the aminolysis of NHS
esters in aqueous solution, the tetrahedral intermediate mode was preequilibrium
formed during the reaction process.[295, 300] As indicated above, to monitor the
electrochemical current during the collision, we applied a positive 600 mV bias on the
GNE, therefore the amine groups are likely ionized. When abundant NHS ester groups
of the Lomant-GNPs physically contact with the ionized amine groups on the electrode
surface, tetrahedral intermediates can be quickly formed as illustrated in Figure 5.12A.
With the proton removed from the amine groups, the stretching vibration mode of -N-
H bond was enhanced and a new peak appeared at 1567 cm-1. The resonance
contributions from the alkoxy oxygen can stabilize both the transition state and the
product, therefore the -CH2 twisting and stretching modes gradually disappeared at
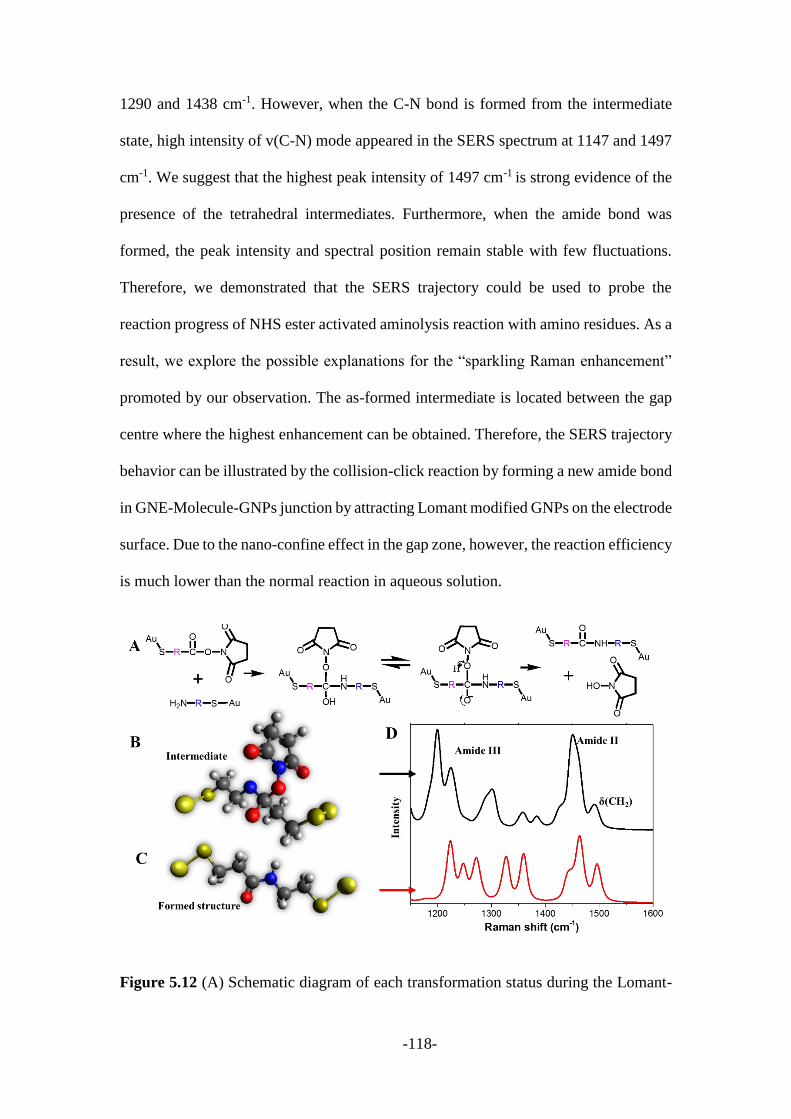
-118-
1290 and 1438 cm-1. However, when the C-N bond is formed from the intermediate
state, high intensity of v(C-N) mode appeared in the SERS spectrum at 1147 and 1497
cm-1. We suggest that the highest peak intensity of 1497 cm-1 is strong evidence of the
presence of the tetrahedral intermediates. Furthermore, when the amide bond was
formed, the peak intensity and spectral position remain stable with few fluctuations.
Therefore, we demonstrated that the SERS trajectory could be used to probe the
reaction progress of NHS ester activated aminolysis reaction with amino residues. As a
result, we explore the possible explanations for the “sparkling Raman enhancement”
promoted by our observation. The as-formed intermediate is located between the gap
centre where the highest enhancement can be obtained. Therefore, the SERS trajectory
behavior can be illustrated by the collision-click reaction by forming a new amide bond
in GNE-Molecule-GNPs junction by attracting Lomant modified GNPs on the electrode
surface. Due to the nano-confine effect in the gap zone, however, the reaction efficiency
is much lower than the normal reaction in aqueous solution.
Figure 5.12 (A) Schematic diagram of each transformation status during the Lomant-
-119-
GNP collision process. (B) The theoretical model of the intermediates and amide bond
formed structure. (C) The corresponding Raman spectra of intermediate and formed
structures.
To determine the metastable structures, we have carried out systematic density
functional theory (DFT) simulations to find possible configurations based on the NHS
induced amide reaction mechanism. Figure 5.12A illustrated the possible “collision-
click” reaction diagram. As an experimental observation of the Raman enhancement
during the reaction process, I used DFT simulations to systematically reproduce the
collision click reaction process. Figure 5.12B and 5.12C show the simulated structure
of the intermediate state and final state of the formed product. The corresponded
calculated SERS spectrum is shown in Figure 5.12D. Based on the calculated Raman
spectrum, both amide II and amide III band have slightly shifted toward high
wavenumber. Once the amide bond formed, the intensity ratio of amide II and δ(CH2)
band will greatly decrease which is consistent with our experimental results.
5.3 Conclusion
In this work, we successfully monitored and analysed the collision events happened
between GNPs surfaces and GNE, which surface was modified with designed single-
molecule layers through the simultaneous SERS trajectory and electrochemical current
measurement. The collision event type was determined based on the SERS and
electrochemical current changes. More importantly, the evolution of new amide bonds
at the intermolecular interface during the GNP collision process was successfully
monitored in millisecond time resolution.
-120-
Chapter 6: SAMs stability investigated through the
combined electrochemistry, atom probe tomography and
surface-enhanced Raman techniques
-121-
Through my Ph.D. project, the SAMs were prepared as the primary or initial step for
highly designed functionalized electrodes for various purposes. SAMs has attracted
significant attention because they provide a convenient, flexible and pretty simple
method to tailor the surface chemistry of metal, metal oxides and semiconductors. The
structure and stability of the formed SAMs play important roles for those research
projects, however, a lot of questions cannot be answered when I try to understand the
stability of SAM structure. Therefore, in this chapter, I intend to use the combined
electrochemical and atom probe tomography as well as SERS technique to study the
desorption process of SAMs and then to explore the nature of SAMs structure.
6.1 Introduction
SAMs of alkanethiolates have attracted significant attention as they have provided a
convenient, flexible and pretty simple method to tailor the surface chemistry of metal,
metal oxides and semiconductors.[50] The surface modification with various functional
alkanethiolates could afford the commonly used electrode such as gold, platinum and
palladium electrodes with arbitrary surfaces and superior interfacial properties, which
has played an important role in electrochemistry field. For example, Gooding and co-
workers have successfully aligned the chemical shortened single-walled carbon
nanotubes (with carboxylic groups on its end) to an amino group terminated electrode
surface that modified with cysteamine monolayer via the covalent interaction.[301] The
self-assembled monolayer is not only worked as the connecting wires to bind single-
walled carbon nanotubes but also reduce the background by suppressing direct charge
transfer by redox molecules to the electrode surface. Through innovative surface design,
the well-defined electrode structures could be applied in materials science as
catalysts,[301] in medicine as components of systems for drug delivery,[302] in
-122-
electronic and optical devices. [303]
Directly adsorb organosulfur compounds from solution or vapor phase is currently the
most common protocol to prepare SAMs-covered electrode surface.[50-52] The sulfur-
contained head groups tend to be absorbed on the bare surfaces of metals and metal
oxides with a specific affinity.[304] These alkanethiol molecules are capable to form
dense and highly oriented monolayers on top of the substrate. The structures of SAMs
regarding the composition, reconstruction, defects and the self-assembly mechanisms
of alkanethiol molecules on the metal surface have been extensively studied with series
of characterizing methods including scanning probe microscopes (such as AFM, STM)
and spectroscopic techniques (such as RAIRS and XPS).[53, 305-309]
The general understandings on SAMs of thiols on metals have been extensively
explored by previous researchers. In this chapter, however, I emphasize some of the
unresolved questions regarding the metal-sulfur bond-breaking dynamics of SAMs
during the desorption process with the Atom Probe Tomography (APT) under near-
vacuum conditions and electrochemical reductive method in aqueous solution,
respectively. As reported previously, the thiols undergo reversible reductive desorption
when a negative potential is applied in a neutral or basic electrolyte.[310, 311] Studies
about the mechanism of this process have suggested that the desorption occurs first at
defect sites and grain boundaries in the SAM and then randomly extended to nucleation
sites in the well-organized, crystalline regions of the SAM.[312] Meanwhile, APT is
still a new technique for SAMs analysis.[313] Under strong pulsed field evaporation,
SAMs would be disassembled to various species including single ions and molecule
fragments. The structural and compositional information of the sample could be
obtained by analysing the identity and location of recorded species. The unique
-123-
advantages of APT could achieve single atom sensitivity and make the SAMs atoms
available for us to insight its structure. Therefore, details associated with the nature of
the metal-sulfur bond and the spatial array of the alkanethiol groups on the underlying
substrate will be revealed which was impeded previously due to poor spatial resolution.
Another point is the SAMs stability in metal-molecular junction investigation within
the sub-nanometre gaps such as nano-transistors, nano-sensors, and nanoreactors.[314,
315]. The as-formed nanogap has proven to be highly effective as building blocks for
plasmonic systems, providing a wide tuning range of operating frequencies and large
near-field enhancements, which has important applications in surface-enhanced Raman
scattering (SERS) for single molecule detection.[316, 317] As described in Chapter 5,
monitoring the real-time construction of the nanoelectrode-molecule-nanoparticle
junction has been achieved with simultaneous electrochemical current and SERS
measurements. Meanwhile, the recorded tunnelling current and Raman intensity
fluctuation/switching told us the “story” about the formation process of a molecule
junction.[318] Electrochemical studies tracking Raman spectroscopy within nanogaps
indeed provide a wealth of information about the sandwiched molecule.[319, 320]
However, former theoretical studies and the followed experimental results suggested
that oriented electric fields could affect the outcomes of a range of chemical reactions,
stabilizes or destabilize chemical bonds by influencing the charge transfer
process.[321-323] As for the formed metal-molecule junction, the applied electric field
will affect SERS intensities and influence specific vibrational modes of the analyte,[324,
325] while the possible mechanism could be attributed to perturbing the analyte
bending and stretching or inducing the electron density switching within the nanogap
region.
-124-
The primary goal of the work reported here is to investigate the alkanethiol modified
metal surface through the APT and electrochemical characterization techniques.
Palladium-based tip and nanoelectrode specimens were firstly prepared and then self-
assembly coated by alkanethiol for further separate desorption process. Secondly, I
explored the nanoelectrode-molecule-nanoparticle (NE-M-NP) nanostructure with
SERS technique in the presence of the electric field and analysed the results obtained
by electrochemistry and SERS of the sandwiched molecule to obtain insights on the
alkanethiol adsorption and desorption process on the interfacial chemistry.
6.2 SAMs desorption results with different techniques
6.2.1 APT desorption of alkanethiol monolayers
Electrochemically etched palladium tip (PdT) was modified with SAMs to achieve as
an analysis substrate. SAMs decorated on the metal/metal oxide surface provide a
convenient, flexible and simple system to tailor the interfacial properties within the
nanoscale.[50] Figure 6.1A showed the SEM image of an electrochemical etched sharp
PDT with a radius less than 100 nm. Decanethiol monolayer was formed on PdT (Dec-
PdT) surface via strong Au-S bond by dipping PdT in decanethiol solution. The
following evaporation process using APT was conducted in a pulsed-voltage mode in
the range of 2000-8000 V. Thus, the field strength near the tip surface was about 10-40
V/nm during evaporation of the organic layer, which was high enough to cause
fragmentation of the organic chains.
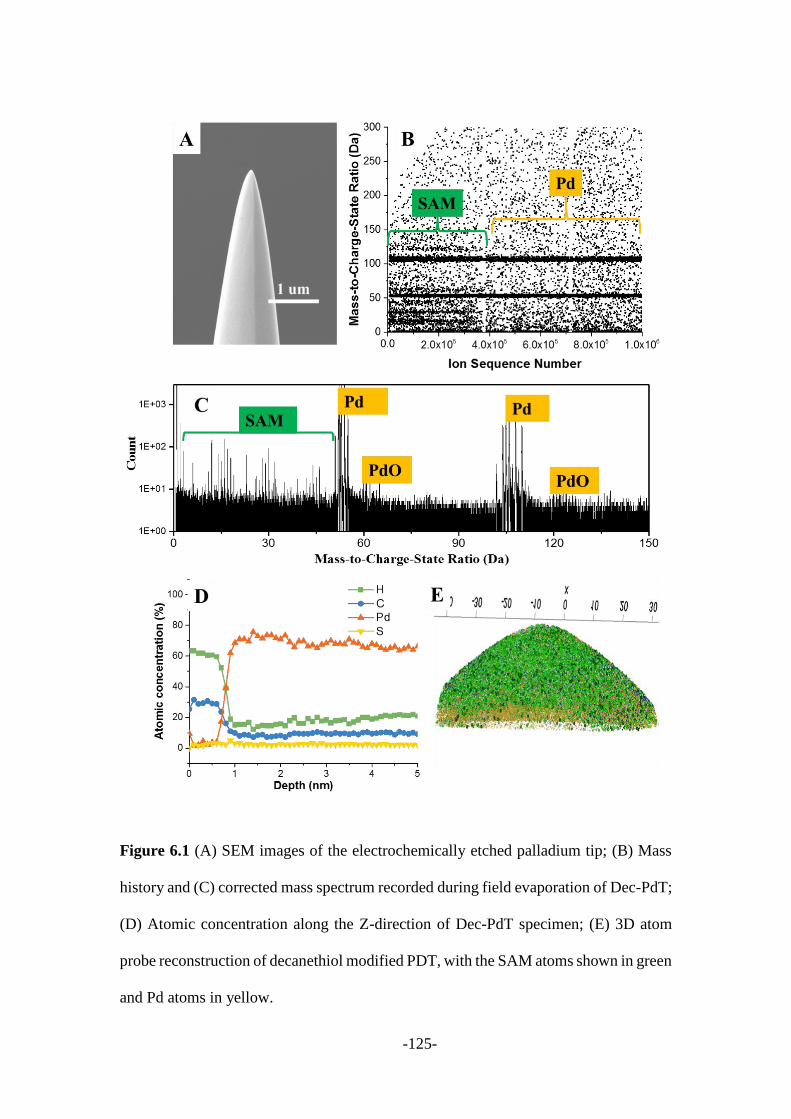
-125-
Figure 6.1 (A) SEM images of the electrochemically etched palladium tip; (B) Mass
history and (C) corrected mass spectrum recorded during field evaporation of Dec-PdT;
(D) Atomic concentration along the Z-direction of Dec-PdT specimen; (E) 3D atom
probe reconstruction of decanethiol modified PDT, with the SAM atoms shown in green
and Pd atoms in yellow.

-126-
Species information during the evaporation process was recorded in the mass history
curve, as shown in Figure 6.1B. It showed that the detected mass-to-charge ratios
changed as a function of the ion sequence. Two obvious evaporation stages could be
recognized from the mass history which is consistent with the SAM-Metal two-phase
structure. Enormous mass signals at 53 and 106 Da that corresponded to Pd+ and Pd2+
ions in both stages were recorded. In the early stage, however, a large number of mass
signals in the low-mass region (0 to 50 Da) were detected yet absent in the second stage.
These low mass fragments could be attributed to the decanethiol formed a monolayer
on the Pd surface. To better explore the low mass fragments information, the mass
spectrum obtained from Dec-PdT specimen was shown in Figure 6.1C. In this spectrum,
distinct peaks from H, C, S, Pd, O, Cl and associated molecular fragments have been
observed. For the atomic and molecular C, H, S and a series of CnHx molecular ions,
they are major result product from the evaporation of Dec monolayer and most appear
during the early evaporating stage. As the evaporation processed, their concentration
decreased significantly (Figure 6.1D). Once the surface layer was removed, subsequent
mass signals belong to Pd ions were dramatically increased. Additionally, peaks related
to Cl, O and related fragments were also seen from the spectrum. Those peaks are likely
from the electropolishing solution and air exposure that happens before moving
specimens to the APT chamber.[326] The structure of monolayer on the Pd surface was
spatial reconstrued as shown in Figure 6.1E. Similar results were obtained for the
octanethiol modified PDT (Oct-PdT).
More details of the monolayer desorption process under high voltage field could be
deduced from the mass spectrum and assignment of C, H, S as well as related CnHx
molecular fragments. At a high positive electric field, the alkanethiol chains were
broken into shorter fragments in the form of CnHx with losing one or more hydrogen
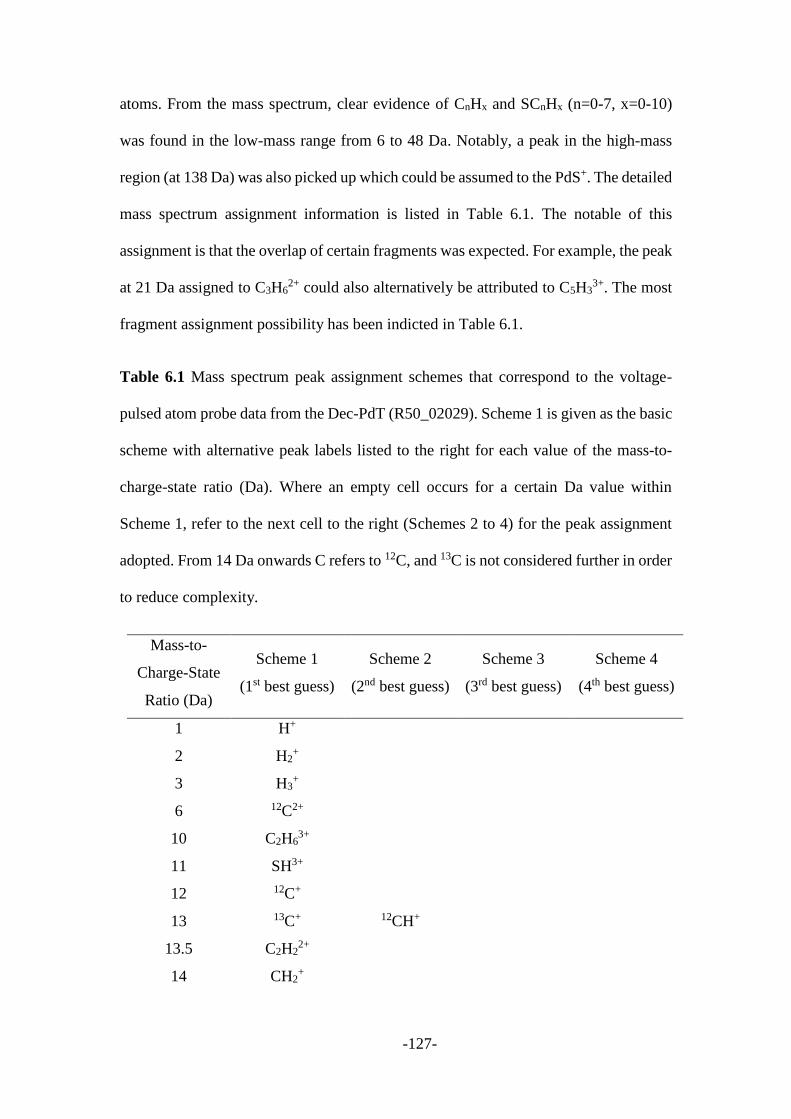
-127-
atoms. From the mass spectrum, clear evidence of CnHx and SCnHx (n=0-7, x=0-10)
was found in the low-mass range from 6 to 48 Da. Notably, a peak in the high-mass
region (at 138 Da) was also picked up which could be assumed to the PdS+. The detailed
mass spectrum assignment information is listed in Table 6.1. The notable of this
assignment is that the overlap of certain fragments was expected. For example, the peak
at 21 Da assigned to C3H62+ could also alternatively be attributed to C5H3
3+. The most
fragment assignment possibility has been indicted in Table 6.1.
Table 6.1 Mass spectrum peak assignment schemes that correspond to the voltage-
pulsed atom probe data from the Dec-PdT (R50_02029). Scheme 1 is given as the basic
scheme with alternative peak labels listed to the right for each value of the mass-to-
charge-state ratio (Da). Where an empty cell occurs for a certain Da value within
Scheme 1, refer to the next cell to the right (Schemes 2 to 4) for the peak assignment
adopted. From 14 Da onwards C refers to 12C, and 13C is not considered further in order
to reduce complexity.
Mass-to-
Charge-State
Ratio (Da)
Scheme 1
(1st best guess)
Scheme 2
(2nd best guess)
Scheme 3
(3rd best guess)
Scheme 4
(4th best guess)
1 H+
2 H2+
3 H3+
6 12C2+
10 C2H63+
11 SH3+
12 12C+
13 13C+ 12CH+
13.5 C2H22+
14 CH2+
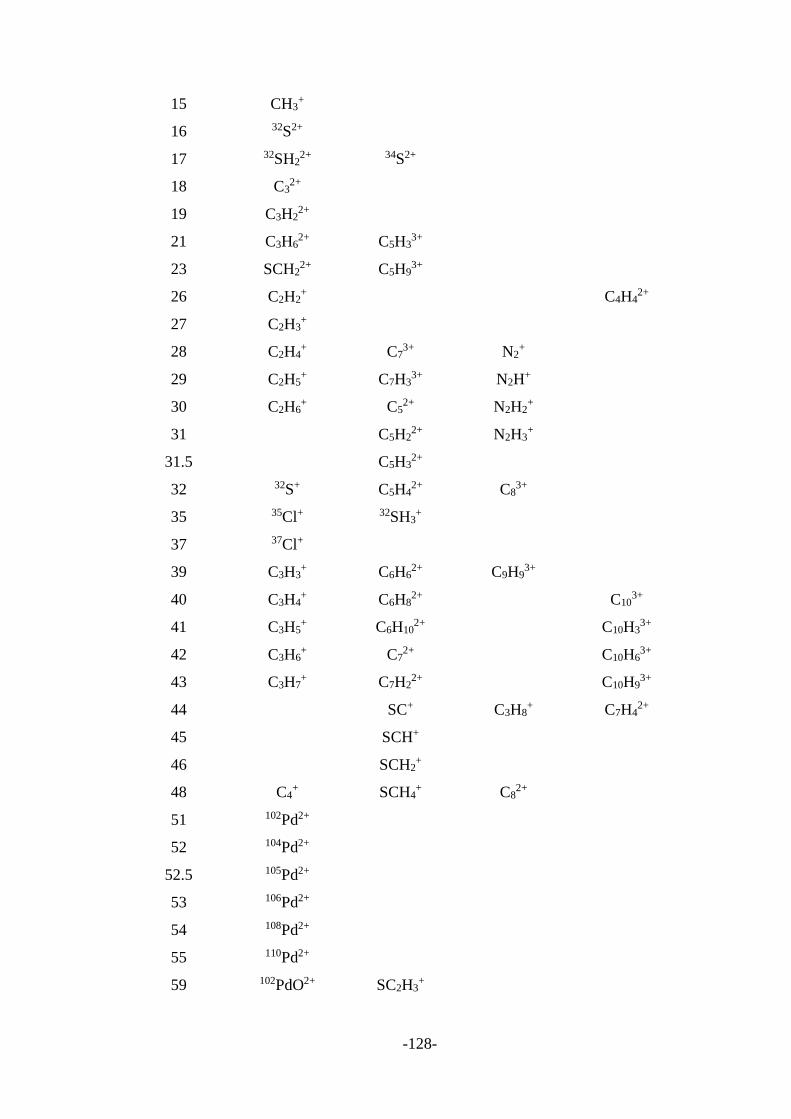
-128-
15 CH3+
16 32S2+
17 32SH22+ 34S2+
18 C32+
19 C3H22+
21 C3H62+ C5H3
3+
23 SCH22+ C5H9
3+
26 C2H2+ C4H4
2+
27 C2H3+
28 C2H4+ C7
3+ N2+
29 C2H5+ C7H3
3+ N2H+
30 C2H6+ C5
2+ N2H2+
31 C5H22+ N2H3
+
31.5 C5H32+
32 32S+ C5H42+ C8
3+
35 35Cl+ 32SH3+
37 37Cl+
39 C3H3+ C6H6
2+ C9H93+
40 C3H4+ C6H8
2+ C103+
41 C3H5+ C6H10
2+ C10H33+
42 C3H6+ C7
2+ C10H63+
43 C3H7+ C7H2
2+ C10H93+
44 SC+ C3H8+ C7H4
2+
45 SCH+
46 SCH2+
48 C4+ SCH4
+ C82+
51 102Pd2+
52 104Pd2+
52.5 105Pd2+
53 106Pd2+
54 108Pd2+
55 110Pd2+
59 102PdO2+ SC2H3+

-129-
59.5 102PdOH2+
60 104PdO2+ SC2H4+ C5
+ C102+
60.5 105PdO2+
61 106PdO2+ C5H+
62 108PdO2+ C5H2+
63 110PdO2+ C5H3+
64 110PdOH22+ C5H4
+
65 110PdOH42+ C5H5
+
80 C6H8+
102 102Pd+
104 104Pd+
105 105Pd+
106 106Pd+
107 106PdH+
108 108Pd+
109 108PdH+
110 110Pd+
111 110PdH+
112 110PdH2+
120 104PdO+
121 105PdO+
122 106PdO+
124 108PdO+
126 110PdO+
138 104PdS+
Once the alkanethiol surface layers were removed, the mass spectrum is dominated by
the peaks corresponding to bulk palladium ions. The mass fragments for bulk palladium
species are typically concentrated in the high-mass region. From the reconstructed 3D
model, we can find the tip apex is hemispherical and take geometry factor (m=1) to
estimate the PdT surface area (APdT). For the reconstructed PdT shown in Figure 6.1E,
the apparent radius is about 40 nm, therefore the APdT is calculated to 0.01 µm2. To
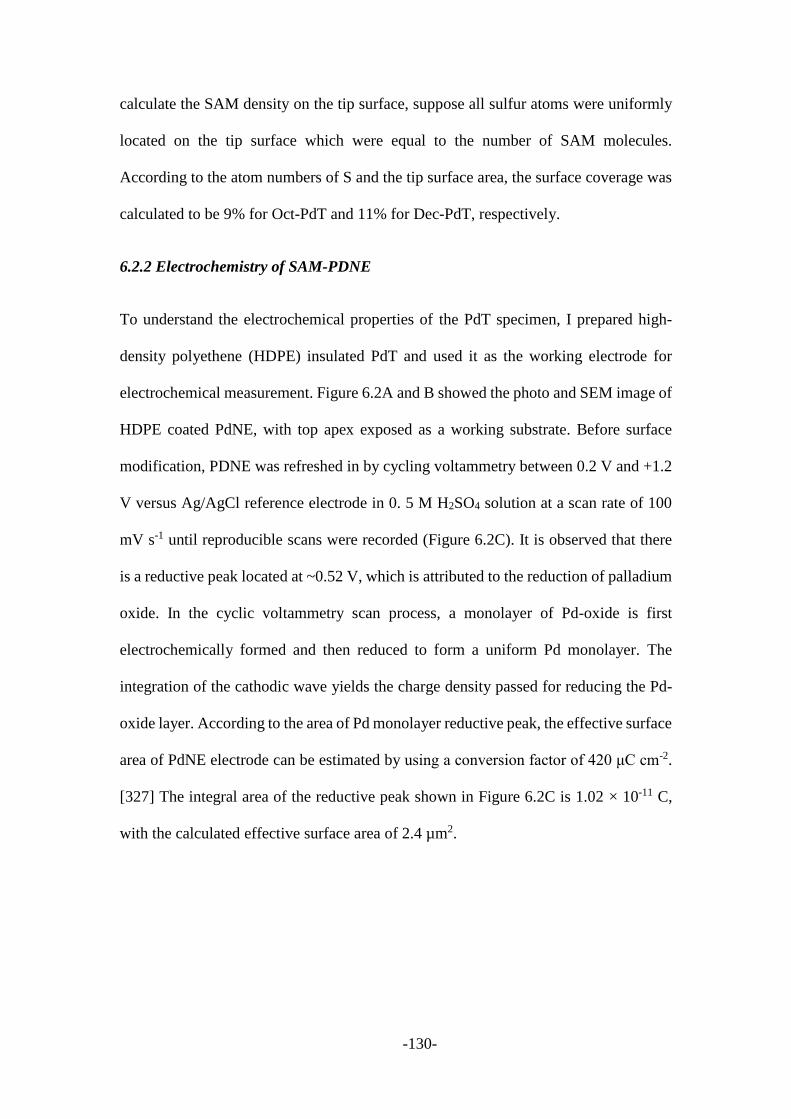
-130-
calculate the SAM density on the tip surface, suppose all sulfur atoms were uniformly
located on the tip surface which were equal to the number of SAM molecules.
According to the atom numbers of S and the tip surface area, the surface coverage was
calculated to be 9% for Oct-PdT and 11% for Dec-PdT, respectively.
6.2.2 Electrochemistry of SAM-PDNE
To understand the electrochemical properties of the PdT specimen, I prepared high-
density polyethene (HDPE) insulated PdT and used it as the working electrode for
electrochemical measurement. Figure 6.2A and B showed the photo and SEM image of
HDPE coated PdNE, with top apex exposed as a working substrate. Before surface
modification, PDNE was refreshed in by cycling voltammetry between 0.2 V and +1.2
V versus Ag/AgCl reference electrode in 0. 5 M H2SO4 solution at a scan rate of 100
mV s-1 until reproducible scans were recorded (Figure 6.2C). It is observed that there
is a reductive peak located at ~0.52 V, which is attributed to the reduction of palladium
oxide. In the cyclic voltammetry scan process, a monolayer of Pd-oxide is first
electrochemically formed and then reduced to form a uniform Pd monolayer. The
integration of the cathodic wave yields the charge density passed for reducing the Pd-
oxide layer. According to the area of Pd monolayer reductive peak, the effective surface
area of PdNE electrode can be estimated by using a conversion factor of 420 μC cm-2.
[327] The integral area of the reductive peak shown in Figure 6.2C is 1.02 × 10⁻¹¹ C,
with the calculated effective surface area of 2.4 µm2.
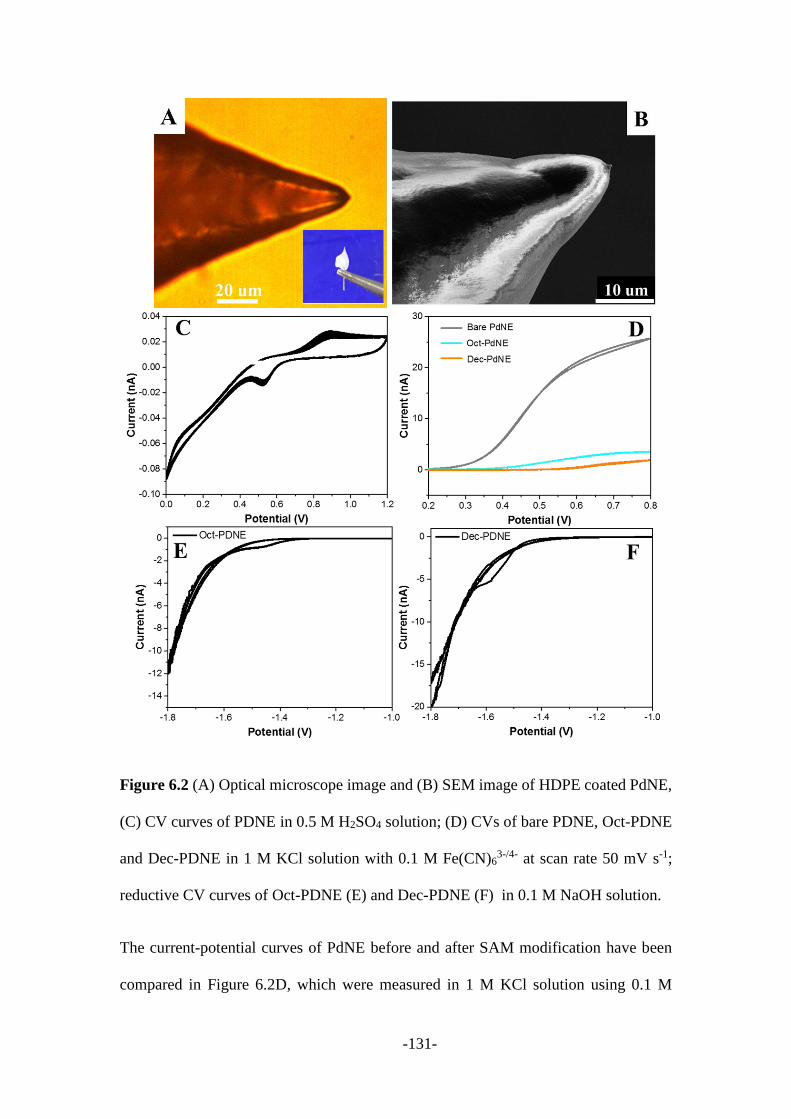
-131-
Figure 6.2 (A) Optical microscope image and (B) SEM image of HDPE coated PdNE,
(C) CV curves of PDNE in 0.5 M H2SO4 solution; (D) CVs of bare PDNE, Oct-PDNE
and Dec-PDNE in 1 M KCl solution with 0.1 M Fe(CN)63-/4- at scan rate 50 mV s-1;
reductive CV curves of Oct-PDNE (E) and Dec-PDNE (F) in 0.1 M NaOH solution.
The current-potential curves of PdNE before and after SAM modification have been
compared in Figure 6.2D, which were measured in 1 M KCl solution using 0.1 M
-132-
Fe(CN)63-/4- as a redox probe. The CV curves of bare PdNE showed a typical sigmoidal
shape for ultramicroelectrode with peak current about 25 nA (Figure 6.2D). After
surface modification with Oct and Dec alkanethiol separately, the redox activity on the
SAM electrodes has been greatly blocked due to the inert carbon chain on the electrode
surface. The blocking efficiency was estimated according to the peak current at 0.8 V.
The assembly of alkanethiol monolayer on the metal surface is a well-studied
spontaneous process, its stability varies at a different range of electrochemical
potentials. For example, a low negative potential can cause thiols to desorb from the
electrode surface. Electrochemical reductive desorption (ECRD) of self-assembled
alkanethiol monolayers is an important process that can be used to dynamically modify
its surface properties. For the well-studied reductive desorption of SAMs, they are
usually immersed in an aqueous or ethanolic solution with a basic electrolyte. Figure
6.2E and F showed CV curves performed on the Oct-PdNE and Dec-PdNE in 0.1 M
NaOH solution with a scan rate of 50 mV s-1. Obvious reductive peaks centered at -1.45
and -1.57 V were observed respectively from the first cycle, which could be attributed
to the reductive desorption of chemically bonded monolayer. The reductive desorption
process could be described as below:[328, 329]
𝐴𝑢 − 𝑆𝑅 + 𝑒− → 𝐴𝑢0 + 𝑅𝑆−
The thiolates diffuse from the surface, and they tend to remain on the electrode surface
and form a molecular assembly, preventing the residual SAM from desorbing.[330]
Generally, 70% of thiols could be removed after about 30 cycles.[328, 329] I have
summarized the surface area, surface coverage and desorption potential measured from
the APT and electrochemical method in Table 6.3 and will be discussed in the next
section.
-133-
Table 6.3 The summary of SAM electrode surface area, surface coverage and
desorption potential comparison.
Specimen
Surface area
(µm2)
Surface coverage
rate
Desorption potential
Oct-PdT 0.02 9% (S) ND
Dec-PdT 0.01 11% (S) ND
Oct-PDNE 1.8 73.9% -1.45 V
Dec-PDNE 2.4 85.1% -1.57 V
6.2.3 SERS measurements
Besides of the electrochemical and APT techniques mentioned above, I still use the
SERS technique to study the SAM desorption process. In this part, to have better Raman
signals Benzene-1,4-dithiol (BDT) is selected as a model probe to construct the gold
nanoelectrode-molecule-gold nanoparticle (GNE-M-GNP) junction model as shown in
Figure 6.3A. Organothiol SAMs bridged nanogap could guarantee the consistency and
repeatability of the preformed structure. The gold−sulfur supports the required
information for the SERS analysis. Our home-build EC-SERS measurement technique
has been applied to record the i-t curve and Raman revolution simultaneous in an
electrochemical electrolyte. The formed gold nanoelectrode-molecule-gold
nanoparticle (GNE-M-GNP) geometry provides unique possibilities to investigate the
isolated plasmonic junction while precisely control its electrochemical reactions with
an electrochemical workstation and results in high sensitivity to the changes occurring
in the nanogap field. The GNE-M-GNP junction structure was first achieved through
the benzene-1,4-dithiol (BDT) bridged gold nanoelectrode (GNE) and gold
-134-
nanoparticle (GNP). Figure 6.3B and 6.3C exhibited the i-t curve and Raman trajectory
after adding 20 pM GNPs with a bias at 600 mV in the solution of 5 mM PBS containing
3 mM ferricyanide as redox probes. No current and Raman signal was observed in the
absence of GNPs. When GNPs were added into the system, GNPs randomly diffused
to the -SH residues terminated electrode surface due to the Brownian movement and
bonded on the electrode surface via the strong gold-sulfur bond. The landed GNPs
could open an electron pathway across the BDT monolayer resulting in a current
increase at the i-t curve. Meanwhile, the formed GNE-BDT-GNP geometry support
high sensitivity and intensity for the molecular conformation, orientation, flexing, and
movement probing.[177, 296, 297] Typical current signals such as spikes, stair, and
clusters were observed from the i-t curve after adding GNPs as shown in Figure 6.3B.
As for the Raman trajectory, the obvious Raman enhancement signal was observed in
Figure 6.3C, which is consistent with the step current signal in Figure 6.3B suggesting
the successful attachment of gold nanoparticle. The peaks from ordinary Raman spectra
of BDT powder centered at 922 and 2565 cm-1 could be attributed to S-H stretching and
bending vibrations, respectively. However, those peaks disappeared in the Raman
spectrum of GNE-BDT-GNPs geometry, which implies that the dithiolate loses both
thiol proton with two sulfur atoms bonded to GNE and GNPs separately and BDT
mediated sandwich structure was formed.[331, 332] Five main peaks of GNE-BDT-
GNPs geometry from the Raman spectrum centered at 350, 728, 1064, 1180 and 1560
cm-1 could be ascribed to the 6a, 7a, 6a+7a, 9a and 8a vibration models
respectively.[333]
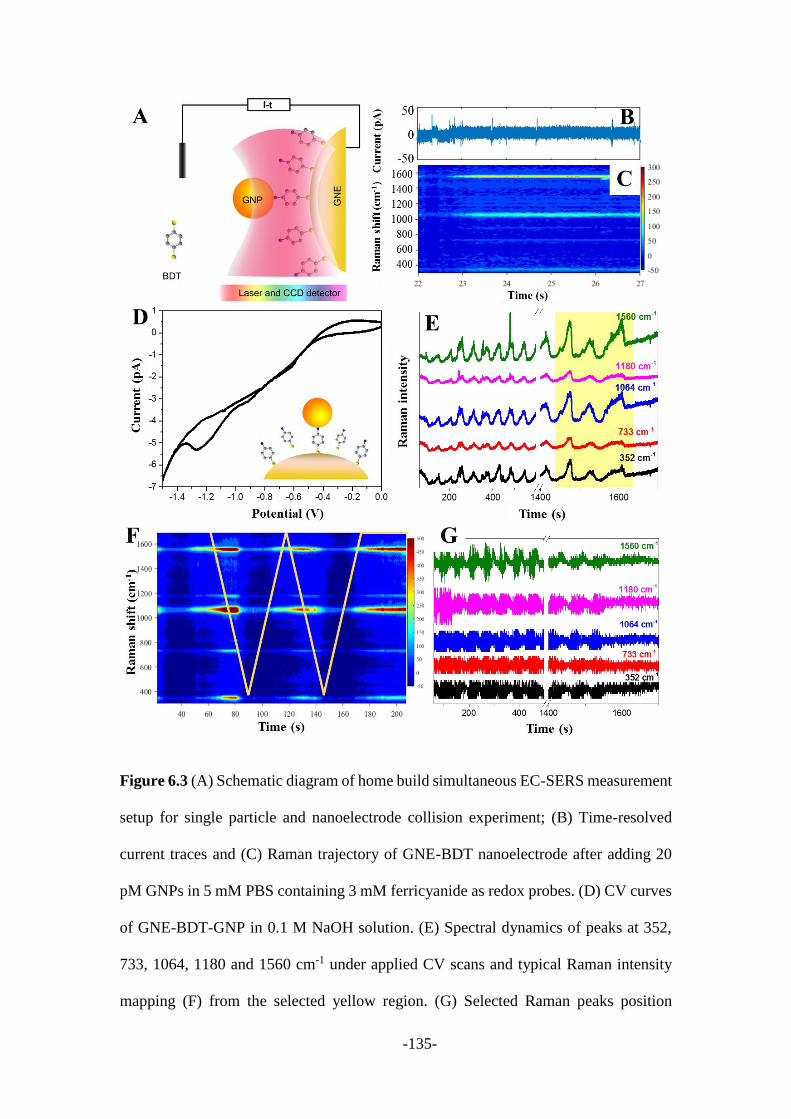
-135-
Figure 6.3 (A) Schematic diagram of home build simultaneous EC-SERS measurement
setup for single particle and nanoelectrode collision experiment; (B) Time-resolved
current traces and (C) Raman trajectory of GNE-BDT nanoelectrode after adding 20
pM GNPs in 5 mM PBS containing 3 mM ferricyanide as redox probes. (D) CV curves
of GNE-BDT-GNP in 0.1 M NaOH solution. (E) Spectral dynamics of peaks at 352,
733, 1064, 1180 and 1560 cm-1 under applied CV scans and typical Raman intensity
mapping (F) from the selected yellow region. (G) Selected Raman peaks position
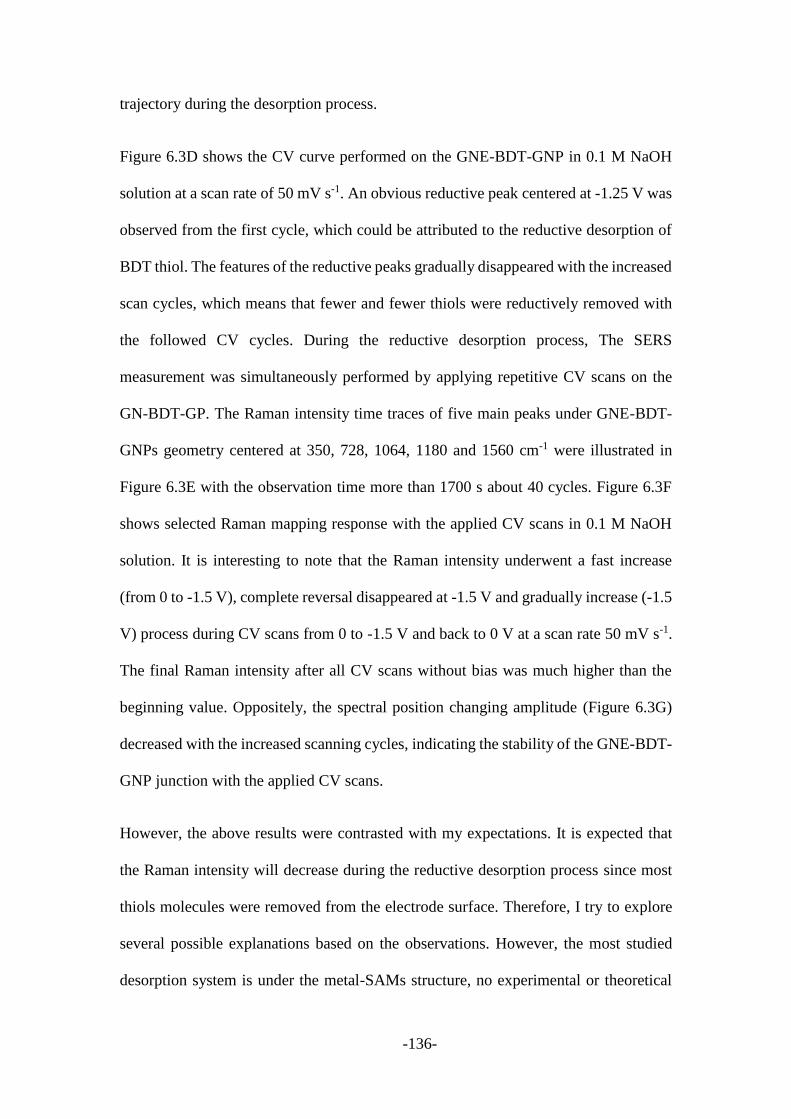
-136-
trajectory during the desorption process.
Figure 6.3D shows the CV curve performed on the GNE-BDT-GNP in 0.1 M NaOH
solution at a scan rate of 50 mV s-1. An obvious reductive peak centered at -1.25 V was
observed from the first cycle, which could be attributed to the reductive desorption of
BDT thiol. The features of the reductive peaks gradually disappeared with the increased
scan cycles, which means that fewer and fewer thiols were reductively removed with
the followed CV cycles. During the reductive desorption process, The SERS
measurement was simultaneously performed by applying repetitive CV scans on the
GN-BDT-GP. The Raman intensity time traces of five main peaks under GNE-BDT-
GNPs geometry centered at 350, 728, 1064, 1180 and 1560 cm-1 were illustrated in
Figure 6.3E with the observation time more than 1700 s about 40 cycles. Figure 6.3F
shows selected Raman mapping response with the applied CV scans in 0.1 M NaOH
solution. It is interesting to note that the Raman intensity underwent a fast increase
(from 0 to -1.5 V), complete reversal disappeared at -1.5 V and gradually increase (-1.5
V) process during CV scans from 0 to -1.5 V and back to 0 V at a scan rate 50 mV s-1.
The final Raman intensity after all CV scans without bias was much higher than the
beginning value. Oppositely, the spectral position changing amplitude (Figure 6.3G)
decreased with the increased scanning cycles, indicating the stability of the GNE-BDT-
GNP junction with the applied CV scans.
However, the above results were contrasted with my expectations. It is expected that
the Raman intensity will decrease during the reductive desorption process since most
thiols molecules were removed from the electrode surface. Therefore, I try to explore
several possible explanations based on the observations. However, the most studied
desorption system is under the metal-SAMs structure, no experimental or theoretical
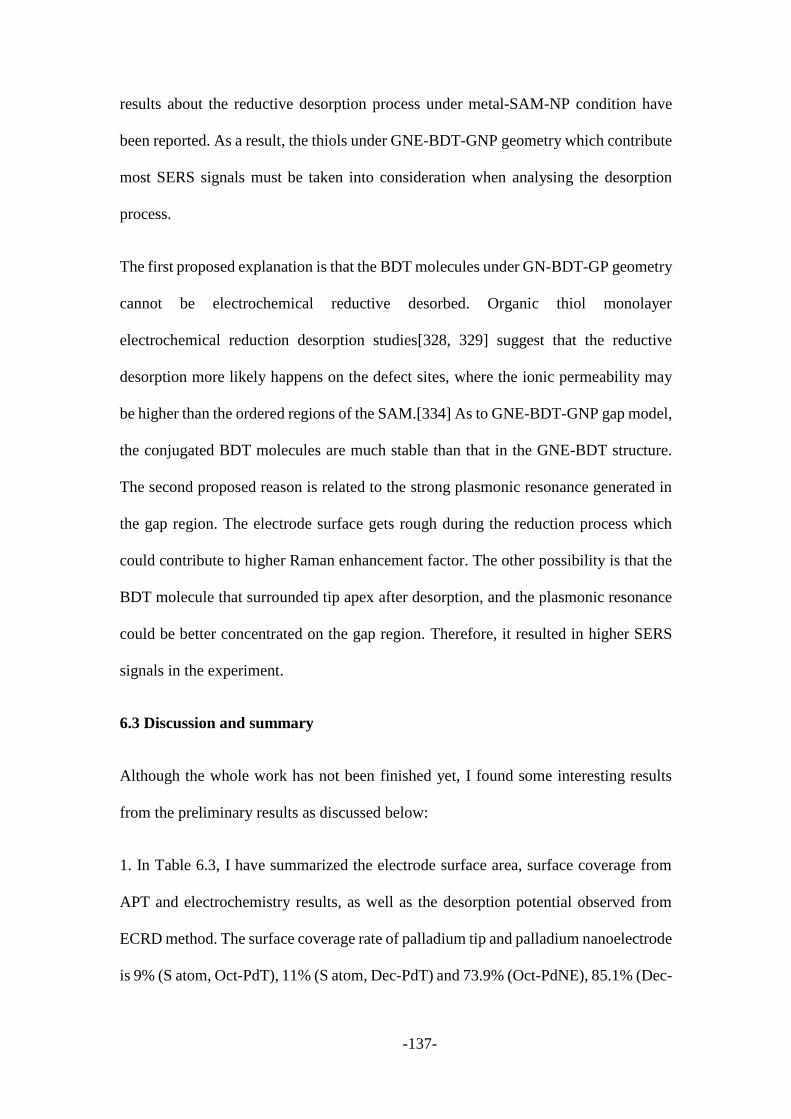
-137-
results about the reductive desorption process under metal-SAM-NP condition have
been reported. As a result, the thiols under GNE-BDT-GNP geometry which contribute
most SERS signals must be taken into consideration when analysing the desorption
process.
The first proposed explanation is that the BDT molecules under GN-BDT-GP geometry
cannot be electrochemical reductive desorbed. Organic thiol monolayer
electrochemical reduction desorption studies[328, 329] suggest that the reductive
desorption more likely happens on the defect sites, where the ionic permeability may
be higher than the ordered regions of the SAM.[334] As to GNE-BDT-GNP gap model,
the conjugated BDT molecules are much stable than that in the GNE-BDT structure.
The second proposed reason is related to the strong plasmonic resonance generated in
the gap region. The electrode surface gets rough during the reduction process which
could contribute to higher Raman enhancement factor. The other possibility is that the
BDT molecule that surrounded tip apex after desorption, and the plasmonic resonance
could be better concentrated on the gap region. Therefore, it resulted in higher SERS
signals in the experiment.
6.3 Discussion and summary
Although the whole work has not been finished yet, I found some interesting results
from the preliminary results as discussed below:
1. In Table 6.3, I have summarized the electrode surface area, surface coverage from
APT and electrochemistry results, as well as the desorption potential observed from
ECRD method. The surface coverage rate of palladium tip and palladium nanoelectrode
is 9% (S atom, Oct-PdT), 11% (S atom, Dec-PdT) and 73.9% (Oct-PdNE), 85.1% (Dec-
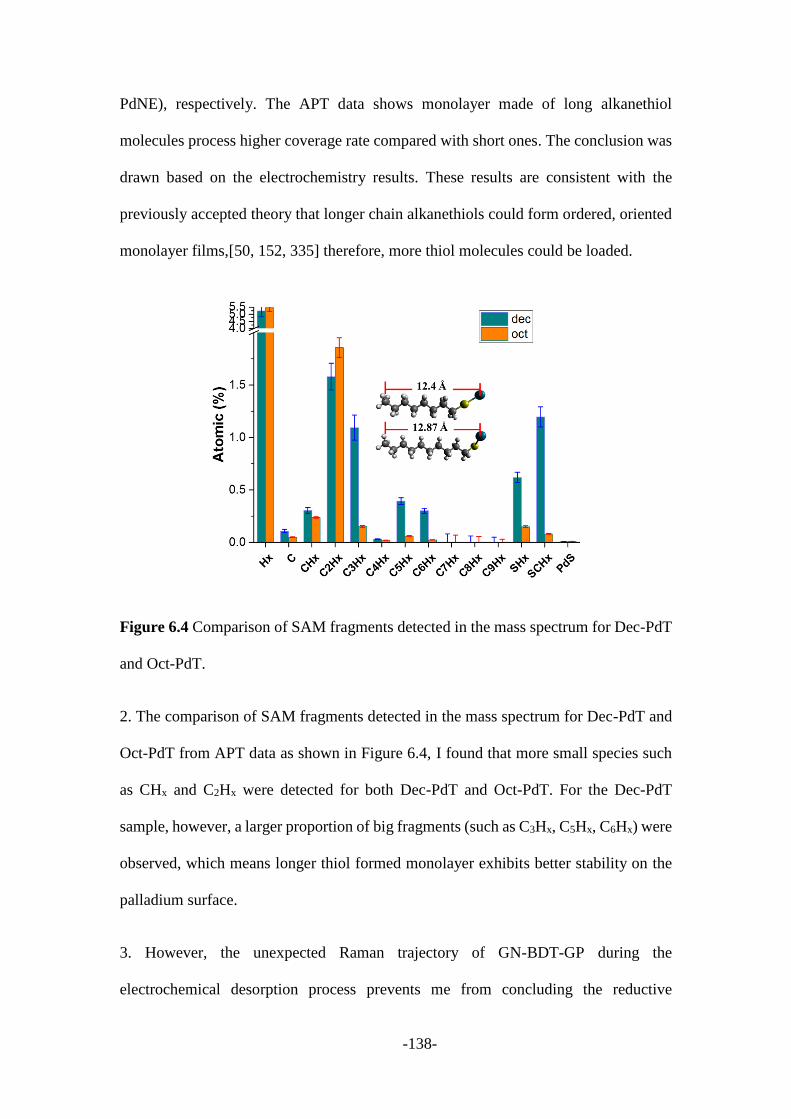
-138-
PdNE), respectively. The APT data shows monolayer made of long alkanethiol
molecules process higher coverage rate compared with short ones. The conclusion was
drawn based on the electrochemistry results. These results are consistent with the
previously accepted theory that longer chain alkanethiols could form ordered, oriented
monolayer films,[50, 152, 335] therefore, more thiol molecules could be loaded.
Figure 6.4 Comparison of SAM fragments detected in the mass spectrum for Dec-PdT
and Oct-PdT.
2. The comparison of SAM fragments detected in the mass spectrum for Dec-PdT and
Oct-PdT from APT data as shown in Figure 6.4, I found that more small species such
as CHx and C2Hx were detected for both Dec-PdT and Oct-PdT. For the Dec-PdT
sample, however, a larger proportion of big fragments (such as C3Hx, C5Hx, C6Hx) were
observed, which means longer thiol formed monolayer exhibits better stability on the
palladium surface.
3. However, the unexpected Raman trajectory of GN-BDT-GP during the
electrochemical desorption process prevents me from concluding the reductive

-139-
desorption process under metal-SAM-NP condition. Therefore, further measurements
such as SEM images and XPS analysis of GN-BDT-GP nanostructure before and after
electrochemical desorption treatment need be studied to help me find the most
reasonable desorption procedure of thiol in a nanoparticle and nanoelectrode confined
junction area. Also, this will be an important part of my future work.

-140-
Chapter 7: Summary and perspectives
-141-
Since the first report about Pt nanoparticle observing by monitoring the catalytic current
during the collisions of single metal nanoparticles (NPs) at an ultramicroelectrode in
2007, the nanoparticle-electrode collision analysis has drawn numerous attentions
during past years. The direct study of nanoparticle-electrode collision events could
serve as a bridge to study the transition in the fundamental physical, chemical,
electrochemical properties of materials from bulk materials to single particle even
single molecules and atoms.[150, 336-338] This method has been applied to study the
chemical compositions, atomic-scale structures, facets and reaction mechanism.[339-
343] It is noted that nanoparticles-electrode collision events could lead to more
important applications. For example, it could be used as a fast, easy handling and real-
time approach to detect molecule, to report spatial distribution and track the live
signature of biological molecules such as cells, proteins and other biomolecules.[239,
290, 344-348] However, it still needs a lot of effort to overcome the current challenges
before it achieves a more bright real application.
Directly monitoring the tunnelling or catalytic current generated during the collision
process is now the most common protocol to study nanoparticle-electrode collision
events. Surface passivating with alkanethiolates could afford the commonly used
electrode such as gold, platinum and palladium electrodes with arbitrary surfaces and
superior interfacial properties, which has played an important role in electrochemistry
field. The self-assembled SAM monolayer not only works as the connecting wires to
bind further nano-entities but also reduces the background by suppressing direct charge
transfer by redox molecules to the electrode surface. Through innovative surface design,
the well-defined electrode structures could be applied in materials science as
catalysts,[301] in medicine as components of systems for drug delivery,[302] in
electronic and optical devices. [303]
-142-
To better understand the electron transfer of the nanomaterials mediated SAMs
electrodes, I first used four alkanethiols with various carbon chain lengths (n=4, 6, 8
and 11) to modify the gold electrode and subsequently attach 2D nanomaterials
including chemically reduced graphene oxide sheets, boron nitride and molybdenum
disulfide nanosheets on SAMs surface via a hydrophobic and electrostatic interaction.
By using the potassium ferricyanide as a redox probe, I observed that these three kinds
2D nanomaterial could effectively enhance the heterogeneous electron transfer (ET) by
the SAMs due to the tunnelling effect. The electron transfer kinetics between the 2D
nanomaterials mediated SAM electrodes and redox species in solution is obtained from
the experimental measurements and theoretical calculating. The transfer mechanism is
attributed to the conductivity of 2D nanomaterials, and interaction between
nanomaterials and the SAMs terminate surface. Chapter 3 studied fundamental
electrochemistry behavior of electrode-organic layer-2D nanomaterial assemblies
which could promote the application of 2D nanomaterials as a controllable electronics
material for both fundamental and practical electrochemical applications.
In Chapter 4 and Chapter 5 of my Ph.D. thesis, I mainly worked on a new protocol to
real-time monitoring the formation of the covalent bond via nanoparticle-electrode
collision based on electrochemical and surface-enhanced Raman spectra (SERS)
techniques. To monitor the covalent bond formation, nanoparticle-electrode collision
models including “Hit-and-Run” and “Hit-and-Stand” were designed. For the “Hit-and-
Stand” model, once MP-11/rGO nanosheets reached the surface of Lomant’s reagent
coated gold electrode, an amide covalent bond formed between the NH2 group from the
MP-11 and carboxyl from the Lomant’s reagent. Afterward, the MP-11-rGO
nanosheets would stay on the electrode surface. As a control experiment, when MP-
11/rGO nanosheets were diffused to the surface of a gold electrode coated with SAM
-143-
without -NHS groups, it was repelled away by the electrostatic repulsive as called “Hit-
and-Run” model. The current steps suggested that Clear current spikes and current steps
were observed which were consistent with these two collision models. The stepwise
current-time response indicated the permanent attachment of MP-11/rGO nanosheets
which could contribute to the covalent bond formation via carbodiimide activated
amidation reaction between the Lomant’s reagent terminal groups and the amino
functionalities of MP-11/rGO nanosheets. The current increase is the synergetic results
of MP-11/rGO nanosheets. This facile and highly sensitive monitoring method could
be useful for investigating the fundamental of single-molecule reactions. According to
the electrochemical signal, no structure evidence could be achieved. SERS technique
has been successfully applied to capture the subtle changes of molecular fingerprints,
therefore, I have used the combined simultaneous electrochemistry and SERS
measurement system to study the chemical bond formation process in a single
nanoparticle collision event which happened between gold nanoparticles and
nanoelectrode modified with designed single-molecule layers. Based on the real-time
monitoring technique, I have observed the real-time formation of intermediates during
the amide bond formation process and we revealed the evolution of interfacial chemical
bonds.
In the final experimental chapter, I adopted three techniques, including Atom Probe
Tomography, electrochemical desorption and the surface-enhanced Raman
spectroscopy, to study the desorption process of alkanethiol and to acquire more
structure information about the formed SAMs. According to our preliminary APT and
electrochemistry results, I have confirmed that monolayers with longer alkanethiols are
denser and more stable than that of short alkanethiols. The combined SERS
measurement under the electrochemical reductive scanning condition offers two

-144-
possibilities to explain what happened of thiol in the nanoparticle and nanoelectrode
confined junction. Firstly, it is because BDT molecules under GN-BDT-GP geometry
cannot be desorbed via the electrochemical reductive method. Secondly, strong
plasmonic resonance may be generated in the gap region which contributed higher
Raman enhancement to residual BDT molecules. However, the obtained data up to now
cannot conclude one accurate description of the thiol molecule electrochemical
desorption in nano junction structure. I need to find more powerful evidence to confirm
this process in my future work.
Since the first report about nanoparticle-nanoelectrode collision system, the
nanoparticle-impact electrochemistry and combined techniques have drawn more and
more attention due to their high sensitivity and versatility that could be applied to
various fields including sensing, characterization, medical diagnosis and so on. Studies
the electrochemistry of the nanomaterials mediated SAMs electrode, will enrich the
basic electrochemical understanding about nanomaterial carried target nanostructures
for sensing application. Another hot point is to study the molecule interaction between
nanoparticle and electrode formed junction area with high time resolution techniques.
By tracking the structure revolution of the target molecule, we are capable to monitor
not only the interaction energies but also the chemical bond forming and breaking
process.
Although the nanoparticle-nanoelectrode collision system has proven fruitful in various
fields, there are still facing current challenges before practical applications, such as
background noise, time resolution, experimental repeatability, signal processing and
recognition. At the end of this thesis, I listed four proposed future works as below:

-145-
1. To develop a novel approach to distinguish chiral molecules such as L/D-
cysteine based on the recognition interaction across the formed nanoparticle-
chiral molecules-nanoelectrode junction through the combined EC-SERS
technique;
2. To develop an electrochemically driven SERS monitoring technique for
monitoring the chemical reaction processes such as electro-catalysis and
electro-reduction reaction;
3. To study the biological materials such as single RNAs using the highly
sensitive EC-SERS technique;
4. To explore the application of EC-SERS technique in sensing and medical
diagnosis fields.
-146-
References
1. Tetala, K.K.R. and M.A. Vijayalakshmi, A review on recent developments for
biomolecule separation at analytical scale using microfluidic devices. Anal.
Chim. Acta, 2016. 906: p. 7-21.
2. Zhou, X.F., W. Cheng, and R.G. Compton, Contrasts between Single
nanoparticle and Ensemble Electron Transfer: Oxidation and Reduction of
DPPH Nanoparticles in Aqueous Media. ChemElectroChem, 2015. 2(5): p.
691-699.
3. Feynman, R.P., There's plenty of room at the bottom. Eng Sci, 1960. 23(5): p.
22-36.
4. Roy, R., S. Hohng, and T. Ha, A practical guide to single-molecule FRET.
Nat. Methods, 2008. 5(6): p. 507-516.
5. Xiao, X., et al., Current transients in single nanoparticle collision events. J.
Am. Chem. Soc., 2008. 130(49): p. 16669-16677.
6. Kim, B.-K., J. Kim, and A.J. Bard, Electrochemistry of a Single Attoliter
Emulsion Droplet in Collisions. J. Am. Chem. Soc., 2015. 137(6): p. 2343-
2349.
7. Hill, C.M., J. Kim, and A.J. Bard, Electrochemistry at a Metal Nanoparticle
on a Tunneling Film: A Steady-State Model of Current Densities at a
Tunneling Ultramicroelectrode. J. Am. Chem. Soc., 2015. 137(35): p. 11321-
11326.
-147-
8. Du, M.S., et al., Mechanoelectrochemical Catalysis of the Effect of Elastic
Strain on a Platinum Nanofilm for the ORR Exerted by a Shape Memory Alloy
Substrate. J. Am. Chem. Soc., 2015. 137(23): p. 7397-7403.
9. Dick, J.E., C. Renault, and A.J. Bard, Observation of Single-Protein and DNA
Macromolecule Collisions on Ultramicroelectrodes. J Am Chem Soc, 2015.
137(26): p. 8376-9.
10. Dick, J.E., et al., Electrochemical detection of a single cytomegalovirus at an
ultramicroelectrode and its antibody anchoring. Proc. Natl. Acad. Sci. U. S.
A., 2015. 112(17): p. 5303-5308.
11. Dick, J.E. and A.J. Bard, Recognizing Single Collisions of PtCl6(2-) at
Femtomolar Concentrations on Ultramicroelectrodes by Nucleating
Electrocatalytic Clusters. J Am Chem Soc, 2015. 137(43): p. 13752-5.
12. Zeng, Z.-C., et al., Electrochemical tip-enhanced Raman spectroscopy. J. Am.
Chem. Soc., 2015. 137(37): p. 11928-11931.
13. Gaines, G., Insoluble Monolayers at Liquid-Gas Interfaces (Interscience, New
York, 1966). Google Scholar, 1917: p. 386.
14. Adamson, A.W. and A.P. Gast, Physical chemistry of surfaces. 1967.
15. Jiang, J., et al., Recent Advances in Metal Oxide-based Electrode Architecture
Design for Electrochemical Energy Storage. Adv. Mater., 2012. 24(38): p.
5166-5180.
16. Li, H., et al., Research on Advanced Materials for Li-ion Batteries. Adv.
Mater., 2009. 21(45): p. 4593-4607.
-148-
17. Arico, A.S., et al., Nanostructured materials for advanced energy conversion
and storage devices. Nat. Mater., 2005. 4(5): p. 366-377.
18. Haruta, M., Size-and support-dependency in the catalysis of gold. Catal.
Today, 1997. 36(1): p. 153-166.
19. Ouf, A., A.M.A. Elhafeez, and A. El-Shafei, Ethanol oxidation at metal–
zeolite-modified electrodes in alkaline medium. Part-1: gold–zeolite-modified
graphite electrode. J. Solid State Electrochem., 2008. 12(5): p. 601-607.
20. Rodriguez, P., Y. Kwon, and M.T. Koper, The promoting effect of adsorbed
carbon monoxide on the oxidation of alcohols on a gold catalyst. Nat. Chem.,
2012. 4(3): p. 177.
21. de Oteyza, D.G., et al., Direct imaging of covalent bond structure in single-
molecule chemical reactions. Science, 2013: p. 1238187.
22. Zhou, C., et al., Direct observation of single-molecule hydrogen-bond
dynamics with single-bond resolution. Nat. Comm., 2018. 9(1): p. 807.
23. Frisch, M., et al., Gaussian 09 package. Pittsburgh PA: Gaussian Inc, 2009.
24. Wu, D.-Y., et al., Chemical Enhancement Effects in SERS Spectra: A
Quantum Chemical Study of Pyridine Interacting with Copper, Silver, Gold
and Platinum Metals. J. Phys. Chem. C, 2008. 112(11): p. 4195-4204.
25. Herrer, L., et al., High surface coverage of a self-assembled monolayer by in
situ synthesis of palladium nanodeposits. Nanoscale, 2017. 9(35): p. 13281-
13290.
-149-
26. Virkar, A.A., et al., Organic semiconductor growth and morphology
considerations for organic thin‐film transistors. Adv. Mater., 2010. 22(34):
p. 3857-3875.
27. Rogers, J., M. Lagally, and R. Nuzzo, Synthesis, assembly and applications of
semiconductor nanomembranes. Nature, 2011. 477(7362): p. 45.
28. Youn, J., et al., Influence of Thiol Self‐Assembled Monolayer Processing on
Bottom‐Contact Thin‐Film Transistors Based on n‐Type Organic
Semiconductors. Adv. Funct. Mater., 2012. 22(9): p. 1856-1869.
29. Wei, R., et al., Stochastic sensing of proteins with receptor-modified solid-
state nanopores. Nat. Nanotechnol., 2012. 7(4): p. 257.
30. Tour, J.M., et al., Self-assembled monolayers and multilayers of conjugated
thiols,. alpha.,. omega.-dithiols, and thioacetyl-containing adsorbates.
Understanding attachments between potential molecular wires and gold
surfaces. J. Am. Chem. Soc., 1995. 117(37): p. 9529-9534.
31. El-Sayed, A.-R., et al., Protection of galvanized steel from corrosion in NaCl
solution by coverage with phytic acid SAM modified with some cations and
thiols. Corros. Sci., 2012. 55: p. 339-350.
32. Franzen, S., Density functional calculation of a potential energy surface for
alkane thiols on Au (1 1 1) as function of alkane chain length. Chem. Phys.
Lett., 2003. 381(3-4): p. 315-321.
-150-
33. Heimel, G., et al., Interface energetics and level alignment at covalent metal-
molecule junctions: π-conjugated thiols on gold. Phys. Rev. Lett., 2006.
96(19): p. 196806.
34. Poirier, G. and E. Pylant, The self-assembly mechanism of alkanethiols on Au
(111). Science, 1996. 272(5265): p. 1145-1148.
35. Gonçalves, R., et al., Bioactivity of immobilized EGF on self‐assembled
monolayers: Optimization of the immobilization process. J. Biomed. Mater.
Res., Part A, 2010. 94(2): p. 576-585.
36. Rong, Y.S., R.S. Li, and Z.X.S. ZHANG Jun Yan, Structure and Self-
assembly Mechanism of Self-assembled Monolayers [J]. Chem. Res. Chin.
Univ., 2001. 3: p. 030.
37. YU, H., et al., Applications of Self-assemble Techniques in Water Treatment
[J]. Journal of Wuhan University of Technology, 2006. 9: p. 012.
38. Wagner, E., D. Curiel, and M. Cotten, Delivery of drugs, proteins and genes
into cells using transferrin as a ligand for receptor-mediated endocytosis.
Adv. Drug Delivery Rev., 1994. 14(1): p. 113-135.
39. Lee, K.B., S. Park, and C.A. Mirkin, Multicomponent magnetic nanorods for
biomolecular separations. Angew. Chem., 2004. 116(23): p. 3110-3112.
40. Reich, D., et al., Biological applications of multifunctional magnetic
nanowires. J. Appl. Phys., 2003. 93(10): p. 7275-7280.
41. Taylor, R.W., et al., In situ SERS monitoring of photochemistry within a
nanojunction reactor. Nano Lett., 2013. 13(12): p. 5985-5990.
-151-
42. Tarlov, M.J., D.R. Burgess Jr, and G. Gillen, UV photopatterning of
alkanethiolate monolayers self-assembled on gold and silver. J. Am. Chem.
Soc., 1993. 115(12): p. 5305-5306.
43. Nakajima, N. and Y. Ikada, Mechanism of amide formation by carbodiimide
for bioconjugation in aqueous media. Bioconjugate Chem., 1995. 6(1): p. 123-
130.
44. Valeur, E. and M. Bradley, Amide bond formation: beyond the myth of
coupling reagents. Chem. Soc. Rev., 2009. 38(2): p. 606-631.
45. Gooding, J.J. and S. Ciampi, The molecular level modification of surfaces:
from self-assembled monolayers to complex molecular assemblies. Chem. Soc.
Rev., 2011. 40(5): p. 2704-2718.
46. Schoenfisch, M.H. and J.E. Pemberton, Air stability of alkanethiol self-
assembled monolayers on silver and gold surfaces. J. Am. Chem. Soc., 1998.
120(18): p. 4502-4513.
47. Sagiv, J. and E. Polymeropoulos, Adsorbed monolayers. Molecular
organization and electrical properties. Berichte der Bunsengesellschaft für
physikalische Chemie, 1978. 82(9): p. 883-883.
48. Steidtner, J. and B. Pettinger, Tip-enhanced Raman spectroscopy and
microscopy on single dye molecules with 15 nm resolution. Phys. Rev. Lett.,
2008. 100(23): p. 236101.
49. Zhang, R., et al., Chemical mapping of a single molecule by plasmon-
enhanced Raman scattering. Nature, 2013. 498(7452): p. 82.
-152-
50. Love, J.C., et al., Self-assembled monolayers of thiolates on metals as a form
of nanotechnology. Chem. Rev., 2005. 105(4): p. 1103-1170.
51. Hodneland, C.D., et al., Selective immobilization of proteins to self-assembled
monolayers presenting active site-directed capture ligands. Proc. Natl. Acad.
Sci. U. S. A.,, 2002. 99(8): p. 5048-5052.
52. Baghbanzadeh, M., et al., Odd–Even Effects in Charge Transport across n-
Alkanethiolate-Based SAMs. J. Am. Chem. Soc., 2014. 136(48): p. 16919-
16925.
53. Shein, J.B., et al., Formation of Efficient Electron Transfer Pathways by
Adsorbing Gold Nanoparticles to Self-Assembled Monolayer Modified
Electrodes. Langmuir, 2009. 25(18): p. 11121-11128.
54. Liu, X., et al., Probing Lewis acid–base interactions in single-molecule
junctions. Nanoscale, 2018. 10(38): p. 18131-18134.
55. Martín Sabanés, N., L.M.A. Driessen, and K.F. Domke, Versatile Side-
Illumination Geometry for Tip-Enhanced Raman Spectroscopy at Solid/Liquid
Interfaces. Anal. Chem., 2016. 88(14): p. 7108-7114.
56. Grabar, K.C., et al., Two-dimensional arrays of colloidal gold particles: a
flexible approach to macroscopic metal surfaces. Langmuir, 1996. 12(10): p.
2353-2361.
57. Bi, H., et al., Voltage-Driven Conformational Switching with Distinct Raman
Signature in a Single-Molecule Junction. J. Am. Chem. Soc., 2018. 140(14):
p. 4835-4840.
-153-
58. Rösicke, F., et al., Electrochemical functionalization of Au by aminobenzene
and 2-aminotoluene. J. Phys.: Condens. Matter, 2016. 28(9): p. 094004.
59. Hao, J., et al., Surface modification of silver nanofilms for improved
perchlorate detection by surface-enhanced Raman scattering. J. Colloid
Interface Sci., 2012. 377(1): p. 51-57.
60. Kleijn, S.E., et al., Electrochemistry of nanoparticles. Angew. Chem. Int. Ed.,
2014. 53(14): p. 3558-3586.
61. Kim, J., et al., Tunneling Ultramicroelectrode: Nanoelectrodes and
Nanoparticle Collisions. J. Am. Chem. Soc., 2014. 136(23): p. 8173-8176.
62. Kumar, M., et al., Amino-acid-encoded biocatalytic self-assembly enables the
formation of transient conducting nanostructures. Nat Chem, 2018. 10(7): p.
696-703.
63. Zhao, J., C.R. Bradbury, and D.J. Fermín, Long-range electronic
communication between metal nanoparticles and electrode surfaces separated
by polyelectrolyte multilayer films. J. Phys. Chem. C, 2008. 112(17): p. 6832-
6841.
64. Nakata, A., et al., Tip-enhanced Raman spectroscopy of lipid bilayers in water
with an alumina-and silver-coated tungsten tip. Anal. Sci., 2013. 29(9): p.
865-869.
65. Bradbury, C.R., J. Zhao, and D.J. Fermin, Distance-independent charge-
transfer resistance at gold electrodes modified by thiol monolayers and metal
nanoparticles. J. Phys. Chem. C, 2008. 112(27): p. 10153-10160.
-154-
66. Drummond, T.G., M.G. Hill, and J.K. Barton, Electrochemical DNA sensors.
Nat. Biotechnol., 2003. 21(10): p. 1192.
67. Pumera, M., et al., Electrochemical nanobiosensors. Sens. Actuators, B, 2007.
123(2): p. 1195-1205.
68. Kim, Y.-R., et al., Electrochemical detection of dopamine in the presence of
ascorbic acid using graphene modified electrodes. Biosens. Bioelectron.,
2010. 25(10): p. 2366-2369.
69. Polsky, R., et al., Diazonium-functionalized horseradish peroxidase
immobilized via addressable electrodeposition: direct electron transfer and
electrochemical detection. Langmuir, 2007. 23(2): p. 364-366.
70. Wang, J., Carbon‐nanotube based electrochemical biosensors: A review.
Electroanalysis: An International Journal Devoted to Fundamental and
Practical Aspects of Electroanalysis, 2005. 17(1): p. 7-14.
71. Kelley, S.O., et al., Long‐range electron transfer through DNA films.
Angew. Chem. Int. Ed., 1999. 38(7): p. 941-945.
72. Frew, J. and H.A.O. Hill, Electron-transfer biosensors. Philosophical
Transactions of the Royal Society of London. B, Biological Sciences, 1987.
316(1176): p. 95-106.
73. Rotman, B., Measurement of activity of single molecules of β-D-galactosidase.
Proc. Natl. Acad. Sci. U. S. A., 1961. 47(12): p. 1981.
-155-
74. Hirschfeld, T., Optical microscopic observation of single small molecules.
Appl. Opt., 1976. 15(12): p. 2965-2966.
75. Kneipp, K., et al., Single molecule detection using surface-enhanced Raman
scattering (SERS). Phys. Rev. Lett., 1997. 78(9): p. 1667.
76. Constantino, C.J., et al., Single-molecule detection using surface-enhanced
resonance Raman scattering and Langmuir-Blodgett monolayers. Anal.
Chem., 2001. 73(15): p. 3674-3678.
77. Nie, S. and S.R. Emory, Probing single molecules and single nanoparticles by
surface-enhanced Raman scattering. Science, 1997. 275(5303): p. 1102-1106.
78. Hinterdorfer, P. and Y.F. Dufrêne, Detection and localization of single
molecular recognition events using atomic force microscopy. Nat. Methods,
2006. 3(5): p. 347-355.
79. Bard, A.J. and F.-R.F. Fan, Electrochemical detection of single molecules.
Acc. Chem. Res., 1996. 29(12): p. 572-578.
80. Fan, F.-R.F., et al., Electrogenerated chemiluminescence of partially oxidized
highly oriented pyrolytic graphite surfaces and of graphene oxide
nanoparticles. J. Am. Chem. Soc., 2008. 131(3): p. 937-939.
81. Haram, S.K., B.M. Quinn, and A.J. Bard, Electrochemistry of CdS
nanoparticles: A correlation between optical and electrochemical band gaps.
J. Am. Chem. Soc., 2001. 123(36): p. 8860-8861.
-156-
82. Fan, F.R.F., et al., Determination of the molecular electrical properties of self-
assembled monolayers of compounds of interest in molecular electronics. J.
Am. Chem. Soc., 2001. 123(10): p. 2454-2455.
83. Amemiya, S. and A.J. Bard, Scanning electrochemical microscopy. 40.
Voltammetric ion-selective micropipet electrodes for probing ion transfer at
bilayer lipid membranes. Anal. Chem., 2000. 72(20): p. 4940-4948.
84. Fan, F.-R.F. and A.J. Bard, Electrochemical detection of single molecules.
Science, 1995: p. 871-871.
85. Akhterov, M.V., et al., Observing Lysozyme's Closing and Opening Motions
by High-Resolution Single-Molecule Enzymology. ACS Chem. Biol., 2015.
10(6): p. 1495-1501.
86. Kim, K.H., et al., Direct observation of bond formation in solution with
femtosecond X-ray scattering. Nature, 2015. 518(7539): p. 385-389.
87. Zhang, B., et al., Graphene nanoelectrodes: fabrication and size-dependent
electrochemistry. J. Am. Chem. Soc., 2013. 135(27): p. 10073-10080.
88. Michalet, X., S. Weiss, and M. Jäger, Single-molecule fluorescence studies of
protein folding and conformational dynamics. Chem. Rev., 2006. 106(5): p.
1785-1813.
89. Smiley, R.D. and G.G. Hammes, Single molecule studies of enzyme
mechanisms. Chem. Rev., 2006. 106(8): p. 3080-3094.
90. Zhuang, X., Single-molecule RNA science. Annu. Rev. Biophys. Biomol.
Struct., 2005. 34: p. 399-414.

-157-
91. Forster, T., Delocalized excitation and excitation transfer, Modern Quantum
Chemistry. Sinanoglu. Academic Press, New York, 1965. 3: p. 43.
92. Xiao, X. and A.J. Bard, Observing single nanoparticle collisions at an
ultramicroelectrode by electrocatalytic amplification. J. Am. Chem. Soc.,
2007. 129(31): p. 9610-9612.
93. Park, J.H., et al., Single particle detection by area amplification: single wall
carbon nanotube attachment to a nanoelectrode. J. Am. Chem. Soc., 2013.
135(14): p. 5258-5261.
94. Zhou, H., et al., Observation of single metal nanoparticle collisions by open
circuit (mixed) potential changes at an ultramicroelectrode. J. Am. Chem.
Soc., 2012. 134(32): p. 13212-13215.
95. Batchelor-McAuley, C., et al., In situ nanoparticle sizing with zeptomole
sensitivity. Analyst, 2015. 140(15): p. 5048-5054.
96. Li, X., et al., Ultra-small Palladium Nanoparticle Decorated Carbon
Nanotubes: Conductivity and Reactivity. ChemPhysChem, 2015. 16(11): p.
2322-2325.
97. Ngamchuea, K., et al., In Situ Detection of Particle Aggregation on Electrode
Surfaces. ChemPhysChem, 2015. 16(11): p. 2338-2347.
98. Plowman, B.J., et al., The fate of nano-silver in aqueous media. Nanoscale,
2015. 7(29): p. 12361-12364.
-158-
99. Nam, N.D., M.J. Kim, and J.G. Kim, Corrosion Behavior of Low Alloy Steels
Containing Manganese in Mixed Chloride Sulfate Solution. Metta. Mater.
Trans. A, 2014. 45(2): p. 893-905.
100. Mathwig, K., et al., Nanoscale Methods for Single-Molecule Electrochemistry.
Annu. Rev. Anal. Chem., 2014. 7: p. 383-404.
101. Li, D., et al., Protein electrochemistry using graphene-based nano-assembly:
an ultrasensitive electrochemical detection of protein molecules via
nanoparticle–electrode collisions. Chem. Commun., 2014. 50(60): p. 8197-
8200.
102. Perera, N., et al., Electrochemical Detection and Sizing of Colloidal ZnO
Nanoparticles. Anal. Chem., 2015. 87(1): p. 777-784.
103. Palecek, E., et al., Electrochemistry of Nonconjugated Proteins and
Glycoproteins. Toward Sensors for Biomedicine and Glycomics. Chem. Rev.,
2015. 115(5): p. 2045-2108.
104. Actis, P., et al., Highlights from the Faraday Discussion on Single Entity
Electrochemistry, York, UK, August–September 2016. Chem. Commun., 2016.
52(97): p. 13934-13940.
105. Wang, Y., X. Shan, and N. Tao, Emerging tools for studying single entity
electrochemistry. Faraday Discuss., 2016.
106. Fu, K., et al., Electrochemistry at single molecule occupancy in nanopore-
confined recessed ring-disk electrode arrays. Faraday Discuss., 2016. 193(0):
p. 51-64.
-159-
107. Xu, W., et al., Single Particle Electrochemistry of Collision. Small, 2019.
0(0): p. 1804908.
108. Patrice, F.T., et al., Single Nanoparticle Electrochemistry. Annu. Rev. Anal.
Chem., 2019. 12(1): p. 347-370.
109. Baker, L.A., Perspective and Prospectus on Single-Entity Electrochemistry. J.
Am. Chem. Soc., 2018. 140(46): p. 15549-15559.
110. Ying, Y.-L., et al., Nanopore-Based Sequencing and Detection of Nucleic
Acids. Angew. Chem., Int. Ed., 2013. 52(50): p. 13154-13161.
111. Fan, Y., T.J. Anderson, and B. Zhang, Single-molecule electrochemistry:
From redox cycling to single redox events. Curr. Opin. Electrochem., 2018. 7:
p. 81-86.
112. Oja, S.M., M. Wood, and B. Zhang, Nanoscale Electrochemistry. Anal.
Chem., 2013. 85(2): p. 473-486.
113. Robbs, P.H. and N.V. Rees, Nanoparticle electrochemistry. Phys. Chem.
Chem. Phys., 2016. 18(36): p. 24812-24819.
114. Shi, W.Q., A.K. Friedman, and L.A. Baker, Nanopore Sensing. Anal. Chem.,
2017. 89(1): p. 157-188.
115. Wang, H.Y., et al., Peering into Biological Nanopore: A Practical Technology
to Single-Molecule Analysis. Chem.-Asian J., 2010. 5(9): p. 1952-1961.
116. Ying, Y.L., C. Cao, and Y.T. Long, Single molecule analysis by biological
nanopore sensors. Analyst, 2014. 139(16): p. 3826-3835.

-160-
117. Peng, Y.Y., et al., Stochastic collision nanoelectrochemistry: a review of
recent developments. ChemElectroChem, 2017. 4(5): p. 977-985.
118. Hinterdorfer, P. and Y.F. Dufrêne, Detection and localization of single
molecular recognition events using atomic force microscopy. Nat. Meth.,
2006. 3(5): p. 347.
119. Taylor, A. and P. Zijlstra, Single-molecule plasmon sensing: current status
and future prospects. Acs Sensors, 2017. 2(8): p. 1103.
120. Cao, C. and Y.-T. Long, Biological Nanopores: Confined Spaces for
Electrochemical Single-Molecule Analysis. Acc. Chem. Res., 2018. 51(2): p.
331-341.
121. Cox, J.T. and B. Zhang, Nanoelectrodes: Recent Advances and New
Directions. Annu. Rev. Anal. Chem., 2012. 5: p. 253-272.
122. Shen, H., W. Xu, and P. Chen, Single-molecule nanoscale electrocatalysis.
Phys. Chem. Chem. Phys., 2010. 12(25): p. 6555-6563.
123. Lemay, S.G., et al., Single-molecule electrochemistry: present status and
outlook. Acc. Chem. Res., 2012. 46(2): p. 369-377.
124. Yu, R.J., et al., Confined Nanopipette Sensing: From Single Molecules, Single
Nanoparticles to Single Cells. Angew. Chem., 2019. 58(12): p. 3706-3714.
125. Long, Y. and J.J. Gooding, Nanopores for Sensing. ACS Sensors, 2018. 3(12):
p. 2471-2472.
-161-
126. Wang, Y., et al., Rationally Designed Sensing Selectivity and Sensitivity of an
Aerolysin Nanopore via Site-Directed Mutagenesis. Acs Sensors, 2018. 3(4):
p. 779-783.
127. Yu, J., C. Cao, and Y.T. Long, Selective and Sensitive Detection of
Methylcytosine by Aerolysin Nanopore under Serum Condition. Anal. Chem.,
2017. 89(21): p. 11685-11689.
128. Alzahrani, H., et al., Processes at nanopores and bio-nanointerfaces: general
discussion. Faraday Discuss., 2018. 210: p. 145-171.
129. Cao, C., et al., Construction of an aerolysin nanopore in a lipid bilayer for
single-oligonucleotide analysis. Nat. Protoc., 2017. 12: p. 1901.
130. Heinze, J., Ultramicroelectrodes in electrochemistry. Angew. Chem. Int. Ed.,
1993. 32(9): p. 1268-1288.
131. Demaille, C., et al., Fabrication and characterization of self-assembled
spherical gold ultramicroelectrodes. Anal. Chem., 1997. 69(13): p. 2323-
2328.
132. Zhang, Y., Three dimensional atom probe tomography of nanoscale thin films,
interfaces and particles. 2009.
133. Forrer, P., et al., Electrochemical preparation and surface properties of gold
nanowire arrays formed by the template technique. J. Appl. Electrochem.,
2000. 30(5): p. 533-541.
-162-
134. Ren, B., G. Picardi, and B. Pettinger, Preparation of gold tips suitable for tip-
enhanced Raman spectroscopy and light emission by electrochemical etching.
Rev. Sci. Instrum., 2004. 75(4): p. 837-841.
135. Ashruf, C., et al., A new contactless electrochemical etch-stop based on a
gold/silicon/TMAH galvanic cell. Sensors and Actuators A: Physical, 1998.
66(1-3): p. 284-291.
136. Gault, B., et al., Atom probe microscopy. Vol. 160. 2012: Springer Science &
Business Media.
137. Boika, A. and A.J. Bard, Time of first arrival in electrochemical collision
experiments as a measure of ultralow concentrations of analytes in solution.
Anal. Chem., 2015. 87(8): p. 4341-6.
138. Zhu, H., et al., Graphene nanodots-encaged porous gold electrode fabricated
via ion beam sputtering deposition for electrochemical analysis of heavy metal
ions. Sens. Actuators, B, 2015. 206(0): p. 592-600.
139. Zoski, C.G., Handbook of electrochemistry. 2006: Elsevier.
140. Brust, M., et al., Novel gold‐dithiol nano‐networks with non‐metallic
electronic properties. Adv. Mater., 1995. 7(9): p. 795-797.
141. Zhang, J., et al., A highly conductive porous graphene electrode prepared via
in situ reduction of graphene oxide using Cu nanoparticles for the fabrication
of high performance supercapacitors. RSC Advances, 2015. 5(67): p. 54275-
54282.
-163-
142. Boika, A., S.N. Thorgaard, and A.J. Bard, Monitoring the electrophoretic
migration and adsorption of single insulating nanoparticles at
ultramicroelectrodes. J. Phys. Chem. B, 2012. 117(16): p. 4371-4380.
143. Tschulik, K., et al., Core-Shell Nanoparticles: Characterizing Multifunctional
Materials beyond Imaging-Distinguishing and Quantifying Perfect and
Broken Shells. Adv. Funct. Mater., 2015. 25(32): p. 5149-5158.
144. Tanner, E.E.L., et al., Nanoparticle Capping Agent Dynamics and Electron
Transfer: Polymer-Gated Oxidation of Silver Nanoparticles. J. Phys. Chem.
C, 2015. 119(32): p. 18808-18815.
145. Sokolov, S.V., et al., Are Nanoparticles Spherical or Quasi-Spherical?
Chem.-Eur. J., 2015. 21(30): p. 10741-10746.
146. Ngamchuea, K., et al., Advancing from Rules of Thumb: Quantifying the
Effects of Small Density Changes in Mass Transport to Electrodes.
Understanding Natural Convection. Anal. Chem., 2015. 87(14): p. 7226-7234.
147. Lin, C., et al., Influence of Adsorption Kinetics upon the Electrochemically
Reversible Hydrogen Oxidation Reaction. J. Phys. Chem. C, 2015. 119(28): p.
16121-16130.
148. Lee, P.T. and R.G. Compton, Selective Thiol Detection in Authentic Biological
Samples with the Use of Screen-printed Electrodes. Anal. Sci., 2015. 31(7): p.
685-691.
-164-
149. Hellberg, D., et al., Bursting and spreading of liposomes on the surface of a
static mercury drop electrode. Electrochem. Commun., 2002. 4(4): p. 305-
309.
150. Wang, W. and N. Tao, Detection, counting, and imaging of single
nanoparticles. Anal. Chem., 2013. 86(1): p. 2-14.
151. Chen, C.-H., et al., Impact of Surface Chemistry on Nanoparticle–Electrode
Interactions in the Electrochemical Detection of Nanoparticle Collisions.
Langmuir, 2015. 31(43): p. 11932-11942.
152. Shein, J.B., et al., Formation of efficient electron transfer pathways by
adsorbing gold nanoparticles to self-assembled monolayer modified
electrodes. Langmuir, 2009. 25(18): p. 11121-11128.
153. Zhang, J., et al., Self-assembly of sidewall functionalized single-walled carbon
nanotubes investigated by scanning tunneling microscopy. J. Phys. Chem. C,
2008. 112(32): p. 12321-12325.
154. Fan, F.-R.F. and A.J. Bard, Observing single nanoparticle collisions by
electrogenerated chemiluminescence amplification. Nano Lett., 2008. 8(6): p.
1746-1749.
155. Wei, T., et al., Aggregation of Individual Sensing Units for Signal
Accumulation: Conversion of Liquid-Phase Colorimetric Assay into Enhanced
Surface-Tethered Electrochemical Analysis. J. Am. Chem. Soc., 2015.
156. Rodriguez-Manzo, J.A., et al., DNA Translocation in Nanometer Thick Silicon
Nanopores. ACS Nano, 2015. 9(6): p. 6555-64.

-165-
157. Jung, A.R., et al., Potential-Controlled Current Responses from Staircase to
Blip in Single Pt Nanoparticle Collisions on a Ni Ultramicroelectrode. J. Am.
Chem. Soc., 2015. 137(5): p. 1762-1765.
158. Holt, L.R., et al., The Electrochemical Characterization of Single Core–Shell
Nanoparticles. Angew. Chem. Int. Ed., 2015: p. n/a-n/a.
159. Fernandez, J.L., M. Wijesinghe, and C.G. Zoski, Theory and Experiments for
Voltammetric and SECM Investigations and Application to ORR
Electrocatalysis at Nanoelectrode Ensembles of Ultramicroelectrode
Dimensions. Anal. Chem., 2015. 87(2): p. 1066-1074.
160. Long, D.A., Raman spectroscopy. New York, 1977: p. 1-12.
161. Michota, A., A. Kudelski, and J. Bukowska, Molecular structure of
cysteamine monolayers on silver and gold substrates: Comparative studies by
surface-enhanced Raman scattering. Surf. Sci., 2002. 502-503: p. 214-218.
162. Perry, D., et al., Surface Charge Visualization at Viable Living Cells. J. Am.
Chem. Soc., 2016. 138(9): p. 3152-3160.
163. Blackie, E.J., E.C. Le Ru, and P.G. Etchegoin, Single-Molecule Surface-
Enhanced Raman Spectroscopy of Nonresonant Molecules. J. Am. Chem.
Soc., 2009. 131(40): p. 14466-14472.
164. Le Ru, E.C., et al., Surface Enhanced Raman Scattering Enhancement
Factors: A Comprehensive Study. J. Phys. Chem. C, 2007. 111(37): p. 13794-
13803.
-166-
165. Kurouski, D., M. Mattei, and R.P. Van Duyne, Probing Redox Reactions at
the Nanoscale with Electrochemical Tip-Enhanced Raman Spectroscopy.
Nano Lett., 2015. 15(12): p. 7956-7962.
166. Pozzi, E.A., et al., Tip-enhanced Raman imaging: an emergent tool for
probing biology at the nanoscale. ACS Nano, 2013. 7(2): p. 885-888.
167. Stadler, J., T. Schmid, and R. Zenobi, Nanoscale chemical imaging using top-
illumination tip-enhanced Raman spectroscopy. Nano Lett., 2010. 10(11): p.
4514-4520.
168. Carrier, S.L., C.M. Kownacki, and Z.D. Schultz, Protein–ligand binding
investigated by a single nanoparticle TERS approach. Chem. Commun., 2011.
47(7): p. 2065-2067.
169. Böhme, R., et al., Biochemical imaging below the diffraction limit–probing
cellular membrane related structures by tip‐enhanced Raman spectroscopy
(TERS). J. Biophotonics., 2010. 3(7): p. 455-461.
170. Chen, C., N. Hayazawa, and S. Kawata, A 1.7 nm resolution chemical analysis
of carbon nanotubes by tip-enhanced Raman imaging in the ambient. Nat.
Comm., 2014. 5: p. 3312.
171. Schmid, T., et al., Nanoscale chemical imaging using tip‐enhanced Raman
spectroscopy: a critical review. Angew. Chem. Int. Ed., 2013. 52(23): p.
5940-5954.
172. Inagaki, M., K. Motobayashi, and K. Ikeda, Electrochemical THz-SERS
Observation of Thiol Monolayers on Au(111) and (100) Using Nanoparticle-
-167-
assisted Gap-Mode Plasmon Excitation. J. Phys. Chem. Lett., 2017. 8(17): p.
4236-4240.
173. Kneipp, K., et al., Surface-Enhanced Raman Scattering (SERS) – A Tool for
Single Molecule Detection in Solution, in Single Molecule Detection in
Solution. 2003, Wiley-VCH Verlag GmbH & Co. KGaA. p. 121-144.
174. Zhang, Y., et al., New Gold Nanostructures for Sensor Applications: A
Review. Materials, 2014. 7(7): p. 5169-5201.
175. Taylor, R.W., et al., Watching individual molecules flex within lipid
membranes using SERS. Sci. Rep., 2014. 4.
176. Qiu, K., et al., Real-time monitoring of electrochemical reactions on single
nanoparticles by dark-field and Raman microscopy. Dalton Trans., 2019.
177. Guo, J., et al., Monitoring the Dynamic Process of Formation of Plasmonic
Molecular Junctions during Single Nanoparticle Collisions. Small, 2018.
14(15): p. e1704164.
178. Hummers Jr, W.S. and R.E. Offeman, Preparation of graphitic oxide. J. Am.
Chem. Soc., 1958. 80(6): p. 1339-1339.
179. Liu, Z., et al., Probing the tunable surface chemistry of graphene oxide.
Chem. Commun., 2015. 51(54): p. 10969-72.
180. Lei, W., et al., Boron nitride colloidal solutions, ultralight aerogels and
freestanding membranes through one-step exfoliation and functionalization.
Nat. Commun, 2015. 6: p. 8849.
-168-
181. Xie, S.-Y., et al., Solubilization of boron nitride nanotubes. Chem. Commun.,
2005(29): p. 3670-3672.
182. Qin, S., et al., In-situ and tunable nitrogen-doping of MoS 2 nanosheets. Sci.
Rep., 2014. 4: p. 7582.
183. Li, D., et al., Protein electrochemistry using graphene-based nano-assembly:
an ultrasensitive electrochemical detection of protein molecules via
nanoparticle-electrode collisions. Chem. Commun., 2014. 50(60): p. 8197-
8200.
184. Zhang, Y., et al., Self-Assembled Core–Satellite Gold Nanoparticle Networks
for Ultrasensitive Detection of Chiral Molecules by Recognition Tunneling
Current. ACS Nano, 2016. 10(5): p. 5096-5103.
185. Weng, Z., et al., Self-assembly of core-satellite gold nanoparticles for
colorimetric detection of copper ions. Anal. Chim. Acta, 2013. 803: p. 128-
134.
186. Tuchband, M., et al., Insulated gold scanning tunneling microscopy probes for
recognition tunneling in an aqueous environment. Rev. Sci. Instrum., 2012.
83(1): p. 015102.
187. Parvizi, R., et al., Atom Probe Tomography Study of the Nanoscale
Heterostructure around an Al20Mn3Cu2 Dispersoid in Aluminum Alloy 2024.
Langmuir, 2014. 30(49): p. 14817-14823.
188. Plesa, C. and C. Dekker, Data analysis methods for solid-state nanopores.
Nanotechnology, 2015. 26(8): p. 084003.
-169-
189. Chang, S., et al., Electronic signatures of all four DNA nucleosides in a
tunneling gap. Nano Lett., 2010. 10(3): p. 1070-1075.
190. Wu, D.-Y., et al., Chemical enhancement effects in SERS spectra: A quantum
chemical study of pyridine interacting with copper, silver, gold and platinum
metals. J. Phys. Chem. C, 2008. 112(11): p. 4195-4204.
191. Mo, Y., K.T. Turner, and I. Szlufarska, Friction laws at the nanoscale. Nature,
2009. 457(7233): p. 1116-1119.
192. Stöckle, R.M., et al., Nanoscale chemical analysis by tip-enhanced Raman
spectroscopy. Chem. Phys. Lett., 2000. 318(1): p. 131-136.
193. Kelly, K.F., et al., Nanoscale imaging of chemical interactions: Fluorine on
graphite. Proc. Natl. Acad. Sci. U. S. A.,, 2000. 97(19): p. 10318-10321.
194. Xing, Y., S. O'Shea, and S. Li, Electron transfer kinetics across a
dodecanethiol monolayer self assembled on gold. J. Electroanal. Chem., 2003.
542: p. 7-11.
195. Gooding, J.J., et al., Self‐assembled monolayers into the 21st century: recent
advances and applications. Electroanalysis, 2003. 15(2): p. 81-96.
196. Wink, T., et al., Self-assembled monolayers for biosensors. Analyst, 1997.
122(4): p. 43-50.
197. Hu, X. and S. Dong, Metal nanomaterials and carbon nanotubes—synthesis,
functionalization and potential applications towards electrochemistry. J.
Mater. Chem., 2008. 18(12): p. 1279-1295.
-170-
198. Lim, S.I. and C.-J. Zhong, Molecularly mediated processing and assembly of
nanoparticles: exploring the interparticle interactions and structures. Acc.
Chem. Res., 2009. 42(6): p. 798-808.
199. Zong, X., et al., The Influence of Graphene on the Electrical Communication
Through Organic Layers on Graphite and Gold Electrodes. Electroanalysis,
2014. 26(1): p. 84-92.
200. Chou, A., et al., Self-assembled carbon nanotube electrode arrays: effect of
length of the linker between nanotubes and electrode. J. Phys. Chem. C, 2009.
113(8): p. 3203-3211.
201. Eggers, P.K., et al., The effect of surface polarity on the electrochemical
double layer and its influence on the measurement of the standard rate
constant of electron transfer. J. Phys. Chem. C, 2009. 113(20): p. 8964-8971.
202. Subramanian, R. and V. Lakshminarayanan, A study of kinetics of adsorption
of alkanethiols on gold using electrochemical impedance spectroscopy.
Electrochim. Acta, 2000. 45(27): p. 4501-4509.
203. Mendes, R.K., et al., Characterization of self-assembled thiols monolayers on
gold surface by electrochemical impedance spectroscopy. J. Braz. Chem. Soc.,
2004. 15(6): p. 849-855.
204. Geim, A.K. and K.S. Novoselov, The rise of graphene. Nat. Mater., 2007.
6(3): p. 183-191.
205. Geim, A.K., Graphene: status and prospects. Science, 2009. 324(5934): p.
1530-1534.
-171-
206. Park, S. and R.S. Ruoff, Chemical methods for the production of graphenes.
Nat. Nanotechnol., 2009. 4(4): p. 217-224.
207. Pumera, M., Electrochemistry of graphene: new horizons for sensing and
energy storage. Chem. Rec., 2009. 9(4): p. 211-223.
208. Hass, J., et al., Why Multilayer Graphene on 4H−SiC (0001) Behaves Like a
Single Sheet of Graphene. Phys. Rev. Lett., 2008. 100(12): p. 125504.
209. Yoo, E., et al., Large reversible Li storage of graphene nanosheet families for
use in rechargeable lithium ion batteries. Nano Lett., 2008. 8(8): p. 2277-
2282.
210. Wang, D., et al., Self-assembled TiO2–graphene hybrid nanostructures for
enhanced Li-ion insertion. ACS Nano, 2009. 3(4): p. 907-914.
211. Seger, B. and P.V. Kamat, Electrocatalytically active graphene-platinum
nanocomposites. Role of 2-D carbon support in PEM fuel cells. J. Phys.
Chem. C, 2009. 113(19): p. 7990-7995.
212. Yoo, E., et al., Enhanced electrocatalytic activity of Pt subnanoclusters on
graphene nanosheet surface. Nano Lett., 2009. 9(6): p. 2255-2259.
213. Li, Y., L. Tang, and J. Li, Preparation and electrochemical performance for
methanol oxidation of pt/graphene nanocomposites. Electrochem. Commun.,
2009. 11(4): p. 846-849.
214. Chen, H., et al., Mechanically strong, electrically conductive, and
biocompatible graphene paper. Adv. Mater, 2008. 20(18): p. 3557-3561.

-172-
215. Wu, J., W. Pisula, and K. Müllen, Graphenes as potential material for
electronics. Chem. Rev., 2007. 107(3): p. 718-747.
216. Li, D. and R.B. Kaner, Graphene-based materials. Nat. Nanotechnol., 2008. 3:
p. 101.
217. Brownson, D.A., D.K. Kampouris, and C.E. Banks, Graphene
electrochemistry: fundamental concepts through to prominent applications.
Chem. Soc. Rev., 2012. 41(21): p. 6944-6976.
218. Schniepp, H.C., et al., Functionalized single graphene sheets derived from
splitting graphite oxide. J. Phys. Chem. B, 2006. 110(17): p. 8535-8539.
219. McCreery, R.L., Advanced carbon electrode materials for molecular
electrochemistry. Chem. Rev, 2008. 108(7): p. 2646-2687.
220. Dumitrescu, I., P.R. Unwin, and J.V. Macpherson, Electrochemistry at carbon
nanotubes: perspective and issues. Chem. Commun., 2009(45): p. 6886-6901.
221. Wang, J., Carbon-nanotube based electrochemical biosensors: a review.
Electroanalysis, 2005. 17(1): p. 7-14.
222. Shang, N.G., et al., Catalyst‐Free Efficient Growth, Orientation and
Biosensing Properties of Multilayer Graphene Nanoflake Films with Sharp
Edge Planes. Adv. Funct. Mater., 2008. 18(21): p. 3506-3514.
223. Alwarappan, S., et al., Probing the electrochemical properties of graphene
nanosheets for biosensing applications. J. Phys. Chem. C, 2009. 113(20): p.
8853-8857.
-173-
224. Zhou, M., Y. Zhai, and S. Dong, Electrochemical sensing and biosensing
platform based on chemically reduced graphene oxide. Anal. Chem., 2009.
81(14): p. 5603-5613.
225. Shan, C., et al., Direct electrochemistry of glucose oxidase and biosensing for
glucose based on graphene. Anal. Chem., 2009. 81(6): p. 2378-2382.
226. Zhou, X., et al., In situ synthesis of metal nanoparticles on single-layer
graphene oxide and reduced graphene oxide surfaces. J. Phys. Chem. C, 2009.
113(25): p. 10842-10846.
227. Chen, Z., et al., Electric-field-enhanced assembly of single-walled carbon
nanotubes on a solid surface. J. Phys. Chem. B, 2005. 109(12): p. 5473-5477.
228. Yang, S., et al., Controllable adsorption of reduced graphene oxide onto self-
assembled alkanethiol monolayers on gold electrodes: tunable electrode
dimension and potential electrochemical applications. J. Phys. Chem. C,
2010. 114(10): p. 4389-4393.
229. Bradbury, C.R., J. Zhao, and D.J. Fermin, Distance-independent charge-
transfer resistance at gold electrodes modified by thiol monolayers and metal
nanoparticles. J. Phys. Chem. C, 2008. 112(27): p. 10153-10160.
230. Xie, X., et al., Study of heterogeneous electron transfer on the graphene/self-
assembled monolayer modified gold electrode by electrochemical approaches.
J. Phys. Chem. C, 2010. 114(33): p. 14243-14250.
231. Gupta, A., T. Sakthivel, and S. Seal, Recent development in 2D materials
beyond graphene. Prog. Mater. Sci., 2015. 73: p. 44-126.
-174-
232. Pradhan, D. and K.T. Leung, Vertical Growth of Two-Dimensional Zinc Oxide
Nanostructures on ITO-Coated Glass: Effects of Deposition Temperature and
Deposition Time. The Journal of Physical Chemistry C, 2008. 112(5): p. 1357-
1364.
233. Barfidokht, A., et al., Distance-dependent electron transfer at passivated
electrodes decorated by gold nanoparticles. Anal. Chem., 2012. 85(2): p.
1073-1080.
234. Chen, L., et al., Direct electrodeposition of reduced graphene oxide on glassy
carbon electrode and its electrochemical application. Electrochem. Commun.,
2011. 13(2): p. 133-137.
235. Duan, G., et al., Graphene-Induced Pore Formation on Cell Membranes. Sci.
Rep., 2017. 7: p. 42767.
236. Deng, Q.M., et al., Toward high permeability, selectivity and controllability of
water desalination with FePc nanopores. Phys. Chem. Chem. Phys., 2016.
18(11): p. 8140-8147.
237. Hua, L.L. and C. Ying, Atomically Thin Boron Nitride: Unique Properties and
Applications. Adv. Funct. Mater., 2016. 26(16): p. 2594-2608.
238. Beheshtian, J., et al., A DFT study on the functionalization of a BN nanosheet
with PCX, (PC=phenyl carbamate, X=OCH3, CH3, NH2, NO2 and CN).
Appl. Surf. Sci., 2013. 268: p. 436-441.
239. Kasas, S., et al., Detecting nanoscale vibrations as signature of life. Proc.
Natl. Acad. Sci. U. S. A.,, 2015. 112(2): p. 378-381.

-175-
240. Schiffrin, D.J., Current topics in physical and nanoparticle electrochemistry.
Curr. Opin. Electrochem., 2017. 4(1): p. 112-117.
241. Tang, Z., et al., Noble‐metal‐promoted three‐dimensional macroassembly
of single‐layered graphene oxide. Angew. Chem., 2010. 122(27): p. 4707-
4711.
242. Mathesh, M., et al., Facile synthesis of graphene oxide hybrids bridged by
copper ions for increased conductivity. J. Mater. Chem. C, 2013. 1(18): p.
3084-3090.
243. Meuse, C.W., et al., Assessing the Molecular Structure of Alkanethiol
Monolayers in Hybrid Bilayer Membranes with Vibrational Spectroscopies.
Langmuir, 1998. 14(7): p. 1604-1611.
244. Peng, Z., et al., Formation of a supported hybrid bilayer membrane on gold: A
sterically enhanced hydrophobic effect. Langmuir, 2002. 18(12): p. 4834-
4839.
245. Che, G., et al., Voltammetry of defect sites at a self-assembled monolayer on a
gold surface. J. Electroanal. Chem., 1998. 453(1–2): p. 9-17.
246. Patolsky, F., Y. Weizmann, and I. Willner, Redox-active nucleic-acid replica
for the amplified bioelectrocatalytic detection of viral DNA. J. Am. Chem.
Soc., 2002. 124(5): p. 770-772.
247. Bain, C.D., J. Evall, and G.M. Whitesides, Formation of monolayers by the
coadsorption of thiols on gold: variation in the head group, tail group, and
solvent. J. Am. Chem. Soc., 1989. 111(18): p. 7155-7164.
-176-
248. Ganesh, V., M.P.C. Sanz, and J.C. Mareque-Rivas, Metal-mediated transport
of electrons across molecular films. Chem. Commun., 2007(8): p. 804-806.
249. Sanghavi, B.J., et al., Real-Time Electrochemical Monitoring of Adenosine
Triphosphate in the Picomolar to Micromolar Range Using Graphene-
Modified Electrodes. Anal. Chem., 2013. 85(17): p. 8158-8165.
250. Peng, Z., et al., Formation of a Supported Hybrid Bilayer Membrane on
Gold: A Sterically Enhanced Hydrophobic Effect. Langmuir, 2002. 18(12): p.
4834-4839.
251. Laviron, E., General expression of the linear potential sweep voltammogram
in the case of diffusionless electrochemical systems.
J.Electr.Chem.Interfa.Electrochem., 1979. 101(1): p. 19-28.
252. Adams, D.M., et al., Charge Transfer on the Nanoscale: Current Status. J.
Phys. Chem. B, 2003. 107(28): p. 6668-6697.
253. Chazalviel, J.-N. and P. Allongue, On the origin of the efficient nanoparticle
mediated electron transfer across a self-assembled monolayer. J. Am. Chem.
Soc., 2010. 133(4): p. 762-764.
254. Kong, N., et al., Controllable graphene oxide mediated efficient electron
transfer pathways across self-assembly monolayers: A new class of graphene
based electrodes. Electrochim. Acta, 2016. 210: p. 539-547.
255. Sugawara, M., et al., Ion-channel sensors. Anal. Chem., 1987. 59(24): p.
2842-2846.
-177-
256. Liu, F., et al., On the Hopping Efficiency of Nanoparticles in the Electron
Transfer across Self‐Assembled Monolayers. ChemPhysChem, 2013. 14(5):
p. 952-957.
257. Fang, Y., et al., Plasmonic imaging of electrochemical oxidation of single
nanoparticles. J Am Chem Soc, 2014. 136(36): p. 12584-12587.
258. Bard, A.J., Toward single enzyme molecule electrochemistry. ACS nano,
2008. 2(12): p. 2437-2440.
259. Hao, X., et al., Direct measurement and modulation of single-molecule
coordinative bonding forces in a transition metal complex. Nat Commun,
2013. 4: p. doi:10.1038/ncomms3121.
260. Wong, S.S., et al., Covalently functionalized nanotubes as nanometre-sized
probes in chemistry and biology. Nature, 1998. 394(6688): p. 52-55.
261. Grandbois, M., et al., How strong is a covalent bond? Science, 1999.
283(5408): p. 1727-1730.
262. Herder, M. and J.-M. Lehn, The Photodynamic Covalent Bond: Sensitized
Alkoxyamines as a Tool To Shift Reaction Networks Out-of-Equilibrium Using
Light Energy. J. Am. Chem. Soc., 2018.
263. Gao, Q., et al., Covalent Organic Framework with Frustrated Bonding
Network for Enhanced Carbon Dioxide Storage. Chem. Mater., 2018. 30(5): p.
1762-1768.

-178-
264. Yamada, T., et al., Detection of C-Si covalent bond in CH3 adsorbate formed
by chemical reaction of CH3MgBr and H: Si (111). J. Am. Chem. Soc., 2003.
125(26): p. 8039-8042.
265. Bell, K., et al., Evidence for covalent bonding of aryl groups to MnO 2
nanorods from diazonium-based grafting. Chem. Commun., 2014. 50(89): p.
13687-13690.
266. Klüter, S., et al., Characterization of irreversible kinase inhibitors by directly
detecting covalent bond formation: a tool for dissecting kinase drug
resistance. Chembiochem, 2010. 11(18): p. 2557-2566.
267. Ciesielski, A., et al., Dynamic covalent chemistry of bisimines at the
solid/liquid interface monitored by scanning tunnelling microscopy. Nat
Chem, 2014. 6(11): p. 1017-1023.
268. Goldsmith, B.R., et al., Conductance-controlled point functionalization of
single-walled carbon nanotubes. Science, 2007. 315(5808): p. 77-81.
269. Goldsmith, B.R., et al., Monitoring single-molecule reactivity on a carbon
nanotube. Nano Lett, 2008. 8(1): p. 189-194.
270. Choi, Y., et al., Dissecting single-molecule signal transduction in carbon
nanotube circuits with protein engineering. Nano Lett, 2013. 13(2): p. 625-
631.
271. Choi, Y., et al., Single-molecule lysozyme dynamics monitored by an
electronic circuit. Science, 2012. 335(6066): p. 319-324.
-179-
272. Xiao, X., et al., Single nanoparticle electrocatalysis: effect of monolayers on
particle and electrode on electron transfer. J. Phys. Chem. C, 2009. 113(33):
p. 14978-14982.
273. Dick, J.E., et al., Simultaneous Detection of Single Attoliter Droplet Collisions
by Electrochemical and Electrogenerated Chemiluminescent Responses.
Angew Chem, Int Ed,, 2014: p. DOI: 10.1002/ange. 201407937.
274. Kim, B.-K., et al., Characterizing Emulsions by Observation of Single Droplet
Collisions. J. Am. Chem. Soc., 2014. 136(13): p. 4849-4852.
275. Alligrant, T.M., E.G. Nettleton, and R.M. Crooks, Electrochemical detection
of individual DNA hybridization events. Lab Chip, 2013. 13(3): p. 349-354.
276. Zhou, Y.G., N.V. Rees, and R.G. Compton, The electrochemical detection and
characterization of silver nanoparticles in aqueous solution. Angew Chem, Int
Ed,, 2011. 50(18): p. 4219-4221.
277. Cheng, W., X.F. Zhou, and R.G. Compton, Electrochemical sizing of organic
nanoparticles. Angew Chem, 2013. 125(49): p. 13218-13220.
278. Li, D., et al., Protein Electrochemistry Using Graphene-Based Nano-
Assembly: An Ultrasensitive Electrochemical Detection of Protein Molecules
via Nanoparticle-Electrode Collisions. Chem Commun, 2014. 50: p. 8197-
8200.
279. Gooding, J.J., et al., Protein Electrochemistry Using Aligned Carbon
Nanotube Arrays. J. Am. Chem. Soc., 2003. 125(30): p. 9006-9007.
-180-
280. Ruzgas, T., A. Gaigalas, and L. Gorton, Diffusionless electron transfer of
microperoxidase-11 on gold electrodes. J. Electroanal. Chem., 1999. 469(2):
p. 123-131.
281. William, S., J. Hummers, and R. Offeman, Preparation of graphitic oxide. J
Am Chem Soc, 1958. 80(6): p. 1339.
282. Zhang, J., et al., Reduction of graphene oxide via L-ascorbic acid. Chem
Commun, 2010. 46(7): p. 1112-1114.
283. Liu, Z., Liu, J., Li, D., Francis, P. S., Barnett, N. W., Barrow, C. J., and Yang,
W. , Probing the tunable surface chemistry of graphene oxide. , 51(54),.
Chem. Commun., 2015. 51(54): p. 10969-10972.
284. Ferrari, A., et al., Raman spectrum of graphene and graphene layers. Phys.
Rev. Lett., 2006. 97(18): p. 187401.
285. Kahk, J.M., et al., Electron transfer kinetics at single nanoparticles. Nano
Today, 2012. 7(3): p. 174-179.
286. Hoeben, F.J., et al., Toward single-enzyme molecule electrochemistry:[NiFe]-
hydrogenase protein film voltammetry at nanoelectrodes. ACS nano, 2008.
2(12): p. 2497-2504.
287. Aragonès, A.C., et al., Electrostatic catalysis of a Diels–Alder reaction.
Nature, 2016. 531(7592): p. 88-91.
288. Qing, Y., et al., Bioorthogonal Cycloadditions with Sub‐Millisecond
Intermediates. Angew. Chem. Int. Ed., 2018.

-181-
289. Luchian, T., S.H. Shin, and H. Bayley, Single‐Molecule Covalent Chemistry
with Spatially Separated Reactants. Angew. Chem. Int. Ed., 2003. 42(32): p.
3766-3771.
290. Kang, M., et al., Time-Resolved Detection and Analysis of Single Nanoparticle
Electrocatalytic Impacts. J. Am. Chem. Soc., 2015. 137(34): p. 10902-5.
291. Li, D., et al., Real-time electrochemical monitoring of covalent bond
formation in solution via nanoparticle-electrode collisions. Chem. Commun.,
2015. 51(91): p. 16349-16352.
292. Park, W.-H. and Z.H. Kim, Charge transfer enhancement in the SERS of a
single molecule. Nano Lett., 2010. 10(10): p. 4040-4048.
293. Skoog, D.A., F.J. Holler, and S.R. Crouch, Principles of instrumental analysis.
2017: Cengage learning.
294. Neouze, M.-A. and U. Schubert, Surface modification and functionalization of
metal and metal oxide nanoparticles by organic ligands. Monatshefte für
Chemie-Chemical Monthly, 2008. 139(3): p. 183-195.
295. Yellin, N. and I.W. Levin, Hydrocarbon chain trans-gauche isomerization in
phospholipid bilayer gel assemblies. Biochemistry, 1977. 16(4): p. 642-647.
296. van Schrojenstein Lantman, E.M., et al., Catalytic processes monitored at the
nanoscale with tip-enhanced Raman spectroscopy. Nat. Nanotechnol., 2012.
7(9): p. 583.
-182-
297. Lim, C.Y., et al., Succinimidyl Ester Surface Chemistry: Implications of the
Competition between Aminolysis and Hydrolysis on Covalent Protein
Immobilization. Langmuir, 2014. 30(43): p. 12868-12878.
298. Riauba, L., et al., A Study of Cysteamine Ionization in Solution by Raman
Spectroscopy and Theoretical Modeling. J. Phys. Chem. A, 2006. 110(50): p.
13394-13404.
299. Kurouski, D., et al., Amide I vibrational mode suppression in surface (SERS)
and tip (TERS) enhanced Raman spectra of protein specimens. Analyst, 2013.
138(6): p. 1665-1673.
300. Cline, G.W. and S.B. Hanna, Kinetics and mechanisms of the aminolysis of N-
hydroxysuccinimide esters in aqueous buffers. J. Org. Chem., 1988. 53(15): p.
3583-3586.
301. Gooding, J.J., et al., Protein electrochemistry using aligned carbon nanotube
arrays. J. Am. Chem. Soc., 2003. 125(30): p. 9006-9007.
302. Cao, M., et al., Electrochemical and Theoretical Study of π–π Stacking
Interactions between Graphitic Surfaces and Pyrene Derivatives. J. Phys.
Chem. C, 2014. 118(5): p. 2650-2659.
303. Frackowiak, E. and F. Beguin, Carbon materials for the electrochemical
storage of energy in capacitors. Carbon, 2001. 39(6): p. 937-950.
304. Adamson, A., Gast.; AP Physical chemistry of surfaces. 1997, Wiley: New
York.
-183-
305. Allara, D.L. and R.G. Nuzzo, Spontaneously organized molecular assemblies.
1. Formation, dynamics, and physical properties of n-alkanoic acids adsorbed
from solution on an oxidized aluminum surface. Langmuir, 1985. 1(1): p. 45-
52.
306. Esplandiu, M.J., et al., Electrochemical STM investigation of 1,8-octanedithiol
monolayers on Au(1 1 1).: Experimental and theoretical study. Surf. Sci.,
2006. 600(1): p. 155-172.
307. Klein, H., et al., Self-assembled monolayers of decanethiol on Au (111)/mica.
Eur. Phys. J. B, 2000. 14(2): p. 371-376.
308. Naumann, R., et al., Tethered lipid bilayers on ultraflat gold surfaces.
Langmuir, 2003. 19(13): p. 5435-5443.
309. Duwez, A.-S., Exploiting electron spectroscopies to probe the structure and
organization of self-assembled monolayers: a review. J. Electron Spectrosc.
Relat. Phenom., 2004. 134(2): p. 97-138.
310. Munakata, H., D. Oyamatsu, and S. Kuwabata, Effects of ω-functional groups
on pH-dependent reductive desorption of alkanethiol self-assembled
monolayers. Langmuir, 2004. 20(23): p. 10123-10128.
311. Quinn, B.M. and K. Kontturi, Reductive desorption of thiolate from monolayer
protected gold clusters. J. Am. Chem. Soc., 2004. 126(23): p. 7168-7169.
312. Mulder, W.H., J.J. Calvente, and R. Andreu, A kinetic model for the reductive
desorption of self-assembled thiol monolayers. Langmuir, 2001. 17(11): p.
3273-3280.
-184-
313. Nickerson, B., M. Karahka, and H. Kreuzer, Disintegration and field
evaporation of thiolate polymers in high electric fields. Ultramicroscopy,
2015. 159: p. 173-177.
314. Jafri, S.H.M., et al., Nano-fabrication of molecular electronic junctions by
targeted modification of metal-molecule bonds. Scientific reports, 2015. 5: p.
14431.
315. Zhu, W., et al., Quantum mechanical effects in plasmonic structures with
subnanometre gaps. Nature communications, 2016. 7: p. 11495.
316. Song, H., M.A. Reed, and T. Lee, Single molecule electronic devices.
Advanced Materials, 2011. 23(14): p. 1583-1608.
317. Wallner, A., et al., Formation and NMR spectroscopy of ω-Thiol protected α,
ω-Alkanedithiol-coated gold nanoparticles and their usage in molecular
charge transport junctions. Langmuir, 2011. 27(14): p. 9057-9067.
318. Guo, J., et al., Monitoring the Dynamic Process of Formation of Plasmonic
Molecular Junctions during Single Nanoparticle Collisions. Small, 2018: p.
1704164.
319. Cui, L., et al., In situ gap-mode Raman spectroscopy on single-crystal Au
(100) electrodes: tuning the torsion angle of 4, 4′-biphenyldithiols by an
electrochemical gate field. Journal of the American Chemical Society, 2011.
133(19): p. 7332-7335.

-185-
320. Kong, D.D., et al., Conformational Tuning of the Intramolecular Electronic
Coupling in Molecular‐Wire Biruthenium Complexes Bridged by Biphenyl
Derivatives. Chem.-Eur. J., 2015. 21(27): p. 9895-9904.
321. Aragonès, A.C., et al., Electrostatic catalysis of a Diels–Alder reaction.
Nature, 2016. 531: p. 88.
322. Shaik, S., S.P. de Visser, and D. Kumar, External electric field will control the
selectivity of enzymatic-like bond activations. J. Am. Chem. Soc., 2004.
126(37): p. 11746-11749.
323. Gryn’ova, G. and M.L. Coote, Origin and scope of long-range stabilizing
interactions and associated SOMO–HOMO conversion in distonic radical
anions. J. Am. Chem. Soc., 2013. 135(41): p. 15392-15403.
324. Sriram, S., et al., Influence of electric field on SERS: frequency effects,
intensity changes, and susceptible bonds. J. Am. Chem. Soc., 2011. 134(10):
p. 4646-4653.
325. Di Martino, G., et al., Tracking Nanoelectrochemistry Using Individual
Plasmonic Nanocavities. Nano Lett., 2017. 17(8): p. 4840-4845.
326. Zhang, Y. and A.C. Hillier, Three-dimensional atom probe tomography of
oxide, anion, and alkanethiolate coatings on gold. Anal. Chem., 2010. 82(14):
p. 6139-6147.
327. Fang, L.-l., et al., Determination of the real surface area of palladium
electrode. Chinese Journal of Chemical Physics, 2010. 23(5): p. 543.
-186-
328. Lee, L.Y.S. and R.B. Lennox, Electrochemical desorption of n-alkylthiol
SAMs on polycrystalline gold: studies using a ferrocenylalkylthiol probe.
Langmuir, 2007. 23(1): p. 292-296.
329. Shon, Y.-S. and T.R. Lee, Desorption and exchange of self-assembled
monolayers (SAMs) on gold generated from chelating alkanedithiols. J. Phys.
Chem. B, 2000. 104(34): p. 8192-8200.
330. Sun, K., B. Jiang, and X. Jiang, Electrochemical desorption of self-assembled
monolayers and its applications in surface chemistry and cell biology. J.
Electroanal. Chem., 2011. 656(1-2): p. 223-230.
331. Cho, S.H., et al., Raman spectroscopic study of 1, 4-benzenedithiol adsorbed
on silver. The Journal of Physical Chemistry, 1995. 99(26): p. 10594-10599.
332. Joo, S.W., S.W. Han, and K. Kim, Adsorption of 1, 4-benzenedithiol on gold
and silver surfaces: Surface-enhanced Raman scattering study. Journal of
colloid and interface science, 2001. 240(2): p. 391-399.
333. Wilson Jr, E.B., The normal modes and frequencies of vibration of the regular
plane hexagon model of the benzene molecule. Physical Review, 1934. 45(10):
p. 706.
334. Hobara, D., et al., In-situ scanning tunneling microscopy imaging of the
reductive desorption process of alkanethiols on Au (111). Langmuir, 1998.
14(13): p. 3590-3596.
-187-
335. Bain, C.D., et al., Formation of monolayer films by the spontaneous assembly
of organic thiols from solution onto gold. J. Am. Chem. Soc., 1989. 111(1): p.
321-335.
336. Chen, Q., et al., Electrochemical Nucleation of Stable N2 Nanobubbles at Pt
Nanoelectrodes. J Am Chem Soc, 2015. 137(37): p. 12064-9.
337. Cai, W., et al., In-Depth Understanding of the Chemical Properties of Rarely
Explored Carbide Cluster Metallofullerenes: A Case Study of Sc2C2@C-
3v(8)-C-82 that Reveals a General Rule. Chem.-Eur. J., 2015. 21(8): p. 3449-
3454.
338. Brontvein, O., et al., Solar Synthesis of PbS-SnS2 Superstructure
Nanoparticles. ACS Nano, 2015. 9(8): p. 7831-9.
339. Zijlstra, P., P.M. Paulo, and M. Orrit, Optical detection of single non-
absorbing molecules using the surface plasmon resonance of a gold nanorod.
Nat. Nanotechnol., 2012. 7(6): p. 379-382.
340. Tang, M.L., et al., Observations of shape-dependent hydrogen uptake
trajectories from single nanocrystals. J. Am. Chem. Soc., 2011. 133(34): p.
13220-13223.
341. Eo, M., et al., Quantification of electron transfer rates of different facets on
single gold nanoparticles during catalytic reactions. Chem. Commun., 2013.
49(45): p. 5204-5206.
342. Zhou, X., et al., Quantitative super-resolution imaging uncovers reactivity
patterns on single nanocatalysts. Nat. Nanotechnol., 2012. 7(4): p. 237-241.
-188-
343. Andoy, N.M., et al., Single-molecule catalysis mapping quantifies site-specific
activity and uncovers radial activity gradient on single 2D nanocrystals. J.
Am. Chem. Soc., 2013. 135(5): p. 1845-1852.
344. Nanayakkara, S.U., J. van de Lagemaat, and J.M. Luther, Scanning Probe
Characterization of Heterostructured Colloidal Nanomaterials. Chem. Rev.,
2015.
345. Miyako, E., et al., In Vivo Remote Control of Reactions in Caenorhabditis
elegans by Using Supramolecular Nanohybrids of Carbon Nanotubes and
Liposomes. Angew Chem Int Ed Engl, 2015. 54(34): p. 9903-6.
346. Manna, S., et al., A Three-Arm Scaffold Carrying Affinity Molecules for
Multiplex Recognition Imaging by Atomic Force Microscopy: The Synthesis,
Attachment to Silicon Tips, and Detection of Proteins. J. Am. Chem. Soc.,
2015. 137(23): p. 7415-23.
347. Macazo, F.C., R.L. Karpel, and R.J. White, Monitoring Cooperative Binding
Using Electrochemical DNA-Based Sensors. Langmuir, 2015. 31(2): p. 868-
875.
348. Liu, Y., et al., Synthesis and applications of RNAs with position-selective
labelling and mosaic composition. Nature, 2015. 522(7556): p. 368.
-189-
Curriculum Vitae-Na KONG
Education and research
2015-2019 Ph.D. Candidature, Deakin University, Australia
Project: Single-molecule electrochemistry: from design of
nanostructured electrodes to the formation of chemical bonds
Supervisors: Dr. Wenrong Yang, Prof. Colin J. Barrow
2017.04-2017.12 Visiting Scholar in Florida International University, United States
Project: Electrochemistry and surface enhanced Raman
spectroscopy technique for single entity analysis
Supervisors: Ass. Prof. Jin He, Dr. Wenrong Yang,
2011-2014 Master degree, Qingdao University, China
Materials Science,
Supervisor: Prof. Jingquan Liu
2007-2011 Bachelor degree, Qingdao University, China
Polymer Materials Science and Engineering
Awards
1. 2017: Head of School HDR Research Award in the School of Life and
Environmental Sciences at Deakin University, Australia.

-190-
2. 2016: Nanoscale Horizons Poster Prize at Single Entity Electrochemistry:
Faraday Discussion York, UK;
3. 2015: Victoria International Research Scholarship, that support me studying in
Deakin University.
Conference and Presentations
1. International electrochemical conference “Single Entity Electrochemistry:
Faraday Discussion” at York UK from 31 August to 2 September in 2016 and
was awarded Nanoscale Horizons Poster Prize. Poster title: Real-Time
Electrochemically Monitoring Formation of Chemical Bonds in Solution.
2. 23rd Annual RACI R&D Topics Analytical and Environmental Chemistry
Conference, Melbourne, 6 - 9 of December 2015. Oral presentation: Real-time
electrochemical monitoring of covalent bond formation via nanoparticle–
electrode collisions.
Published papers
1. Kong, N.; Vaka, M.; Nam, N. D.; Barrow, C. J.; Liu, J.; Conlan, X. A.; Yang,
W., Controllable graphene oxide mediated efficient electron transfer pathways
across self-assembly monolayers: A new class of graphene based electrodes.
Electrochim. Acta 2016, 210, 539-547.
2. Li, D.*; Kong, N.*; Liu, J.; Wang, H.; Barrow, C. J.; Zhang, S.; Yang, W., Real-
time electrochemical monitoring of covalent bond formation in solution via
nanoparticle-electrode collisions. Chem Commun 2015, 51 (91), 16349-52.
*Equal contribution
-191-
3. Kong, N.; Zhang, S.; Liu, J.; Wang, J.; Liu, Z.; Wang, H.; Liu, J. and Yang, W.,
The influence of 2D nanomaterials on electron transfer across molecular thin
films. Molecular Systems Design & Engineering. 2019. 4, 431-436.
4. Zhang, Y.; Kong, N.; Zhang, Y.; Yang, W.; Yan, F., Size-dependent Effects of
Gold Nanoparticles on Osteogenic Differentiation of Human Periodontal
Ligament Progenitor Cells. Theranostics 2017, 7 (5), 1214.
5. Yang, F.; Kong, N.; Conlan, X. A.; Wang, H.; Barrow, C. J.; Yan, F.; Guo, J.;
Yang, W., Electrochemical Evidences of Chiral Molecule Recognition Using
L/D-Cysteine Modified Gold Electrodes. Electrochimica Acta 2017, 237, 22-28.
6. Guo, J.; Pan, J.; Chang, S.; Wang. X.W.; Kong, N.; Yang, W.R.; He, J., Single
molecule fluctuations in dynamic plasmonic molecular junctions formed by
single nanoparticle collisions. Small 2018, 14, 1704164
Manuscripts under preparation
1. Real-time direct observation of intermediates of covalent bond formation during
single nanoparticle collisions;
2. The Au-S bond stability analysis with the EC-TERS technique;
3. Atom Probe and electrochemical analysis of alkanethiols desorption from
palladium surface.