Embed Size (px)
Citation preview

Master of Public Administration Program
Managing Public Access:An Analysis of Beachgoers in
Wrightsville Beach, North Carolina
Mark T. Imperial, Ph.D.Master of Public Administration Program
University of North Carolina at Wilmington
http://people.uncw.edu/imperialm/
&
Chris Dumas, Ph.D.Department of Economics and Finance
University of North Carolina at Wilmington

Master of Public Administration Program
Objectives of the Study• Determine who the beachgoers are and where they
come from– Help argue for greater return of property tax revenue and services
from New Hanover County– Help argue for additional funds from the Tourism Development
Authority (TDA)
• Obtain information that can be used for planning and management purposes– Information incorporated into CAMA Land Use Plan– Help determine how to allocate services– Feedback on services and policy questions (e.g., cost of parking)
• Two samples– Typical summer weekday and weekend day

Master of Public Administration Program
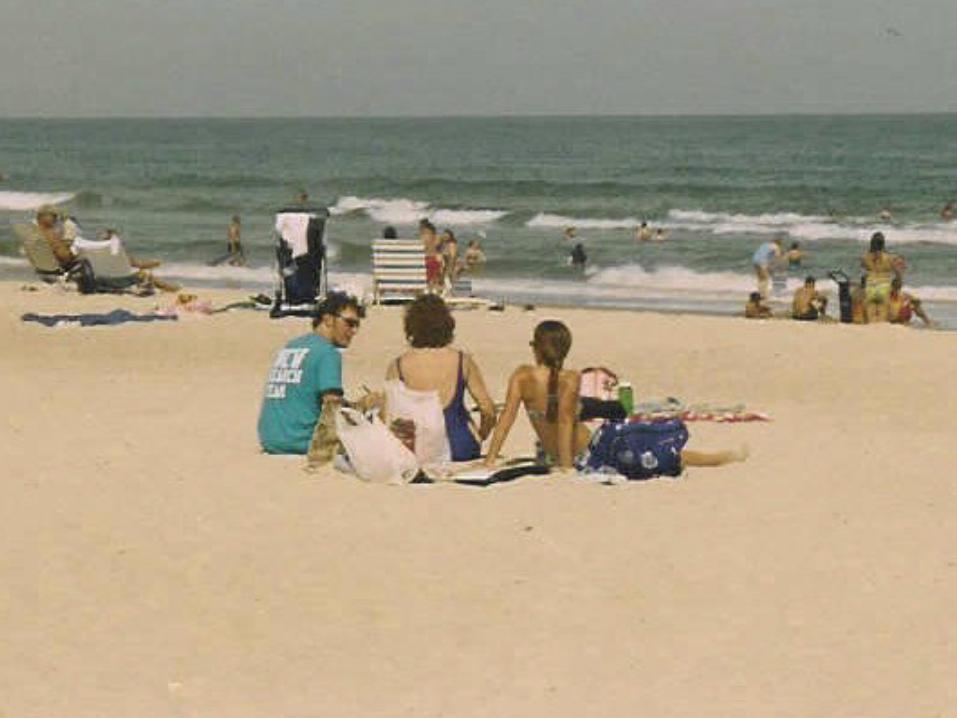
Wrightsville Beach, NC
Master of Public Administration Program
Wrightsville Beach, NC
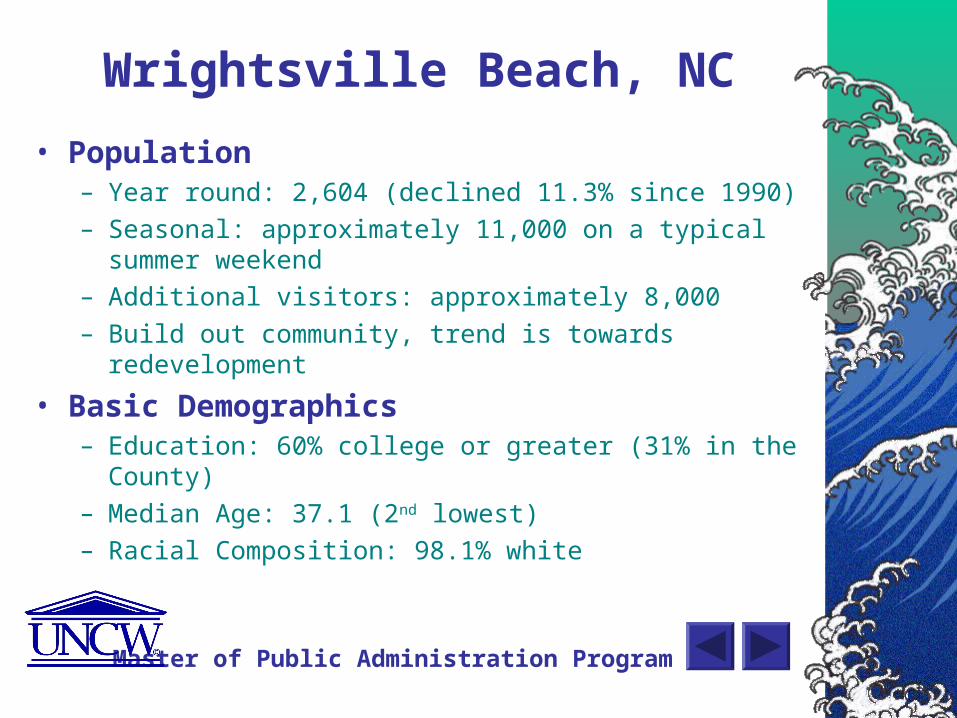
• Population– Year round: 2,604 (declined 11.3% since 1990)
– Seasonal: approximately 11,000 on a typical summer weekend
– Additional visitors: approximately 8,000
– Build out community, trend is towards redevelopment
• Basic Demographics– Education: 60% college or greater (31% in the County)
– Median Age: 37.1 (2nd lowest)
– Racial Composition: 98.1% white

Master of Public Administration Program
Wrightsville Beach, NC
• Income– Per Capita Income: $36,575 (4th highest among NC beaches)
– Median Household Income: $55,903 (6th)
– Median Family Income: $71,641 (1st)
• Housing– Median Value of Owner Occupied Housing: $480,600 (3rd)
– Rent: 80.8% is above $750/month (only 42.4% in County)
– Multi-family units: 58% of housing units
– 41.8% of Housing Units Occupied Year Round: 41.8% (7th)
– Trend towards greater seasonal housing

Master of Public Administration Program

Master of Public Administration Program
Master of Public Administration Program

Master of Public Administration Program
Public Access Facilities
• Beach accesses: 44 (8% of sites)– Length: 4 miles
– Public access points/mile: 10.9 (2nd in NC)
– CAMA signs: 43 (10.5%)
• Parking lot spaces: 605 (8.8%)– Parking spaces/mile: 150.1 (most in NC)
– Accesses w/uncounted parking: 38 (874 spaces)
– Uncounted parking spaces/mile: 218.5
• Dune walkways: 8 (2%)
• Overlook decks/gazebos: 6 (6.8%)

Master of Public Administration Program
Beach Access Facilities• Handicap Accesses
– To dune crest: 9 (7.6% of all NC)– To deck/gazebo: 6 (9/8%)– To beach: 6 (8.6%)– Handicap parking spaces: 20 (8.7%)
• Restroom facilities: 3 (6.7%)• Showers: 3 (5.4%)• Picnic tables: 0 (only 13 statewide)• Vehicle access: 6 (6.7%)• Bike racks: 3 (2.5%)• Lifeguards: 10 stands, down from 12

Master of Public Administration Program

Master of Public Administration Program

Master of Public Administration Program
Methodological Challenges
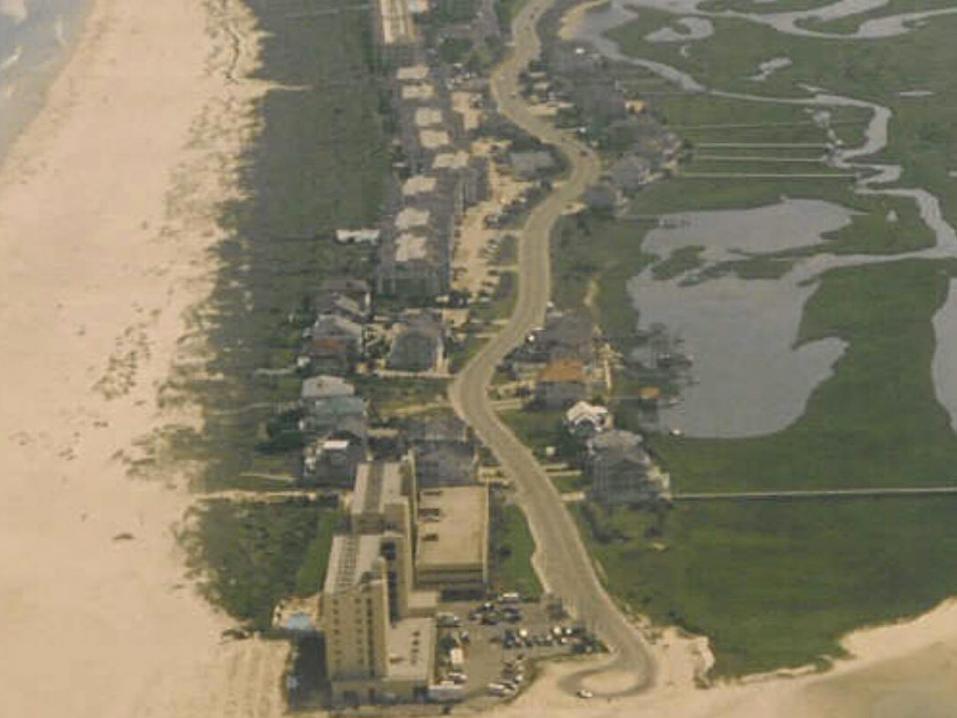
• Approximately 4 miles of beach
• Beachgoers are not normally distributed– Public access sites
– Parking availability
– Multi-unit, high density structures & hotels
• Need to randomly sample groups of beachgoers
• Need to randomly sample adult in a group of beachgoers
• Recruiting, training, and managing 20 to 30 surveyors working for 8 hours in 90 degree heat
Master of Public Administration Program
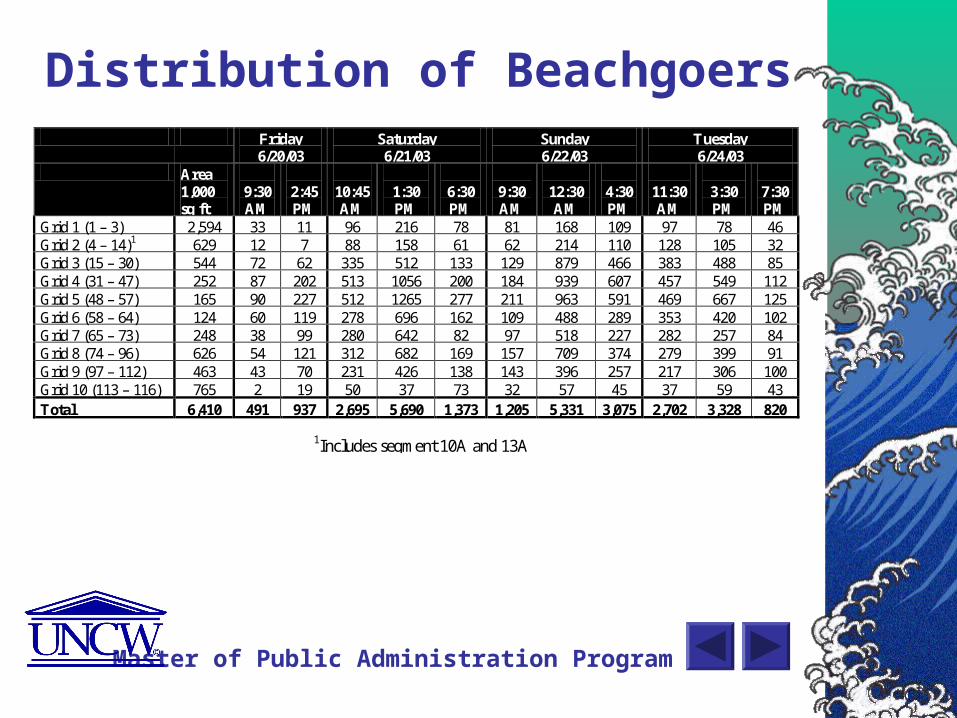
Distribution of Beachgoers
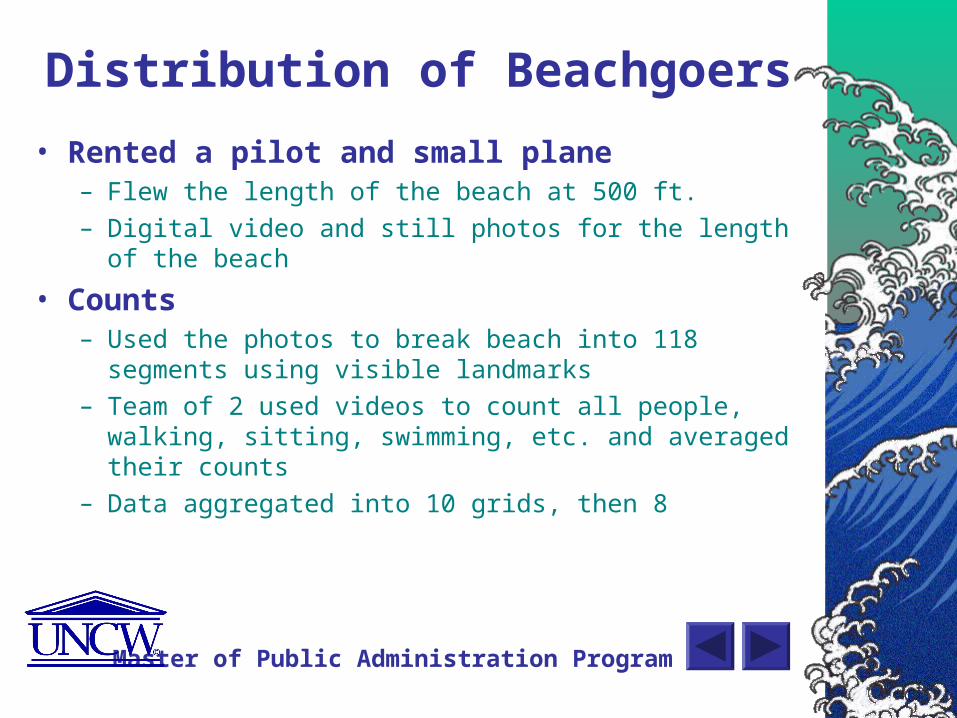
• Rented a pilot and small plane– Flew the length of the beach at 500 ft.
– Digital video and still photos for the length of the beach
• Counts– Used the photos to break beach into 118 segments using visible
landmarks
– Team of 2 used videos to count all people, walking, sitting, swimming, etc. and averaged their counts
– Data aggregated into 10 grids, then 8

Master of Public Administration Program

Master of Public Administration Program

Master of Public Administration Program

Master of Public Administration Program

Master of Public Administration Program

Master of Public Administration Program
Distribution of BeachgoersSaturday, June 21, 2003 @ 1:30 PM
Figure 2: Distribution of Beachgoers - Saturday, June 21, 2003 at 1:30 PM
0 20 40 60 80 100 120 140 160 180 200 220 240 260 280
1
11
21
31
41
51
61
71
81
91
101
111
Gri
d Se
gmen
t
Number of People

Master of Public Administration Program
Distribution of BeachgoersTuesday, June 21, 2003 @ 3:30 PM
Figure 3: Distribution of Beachgoers - Tuesday, June 24, 2003 at 3:30 PM
0 20 40 60 80 100 120 140
1
11
21
31
41
51
61
71
81
91
101
111
Bea
ch S
egm
ent
Number of People
Master of Public Administration Program
Distribution of Beachgoers Friday
6/20/03 Saturday 6/21/03
Sunday 6/22/03
Tuesday 6/24/03
Area 1,000 sq ft
9:30 AM
2:45 PM
10:45 AM
1:30 PM
6:30 PM
9:30 AM
12:30 AM
4:30 PM
11:30 AM
3:30 PM
7:30 PM
Grid 1 (1 – 3) 2,594 33 11 96 216 78 81 168 109 97 78 46 Grid 2 (4 – 14)1 629 12 7 88 158 61 62 214 110 128 105 32 Grid 3 (15 – 30) 544 72 62 335 512 133 129 879 466 383 488 85 Grid 4 (31 – 47) 252 87 202 513 1056 200 184 939 607 457 549 112 Grid 5 (48 – 57) 165 90 227 512 1265 277 211 963 591 469 667 125 Grid 6 (58 – 64) 124 60 119 278 696 162 109 488 289 353 420 102 Grid 7 (65 – 73) 248 38 99 280 642 82 97 518 227 282 257 84 Grid 8 (74 – 96) 626 54 121 312 682 169 157 709 374 279 399 91 Grid 9 (97 – 112) 463 43 70 231 426 138 143 396 257 217 306 100 Grid 10 (113 – 116) 765 2 19 50 37 73 32 57 45 37 59 43 Total 6,410 491 937 2,695 5,690 1,373 1,205 5,331 3,075 2,702 3,328 820
1Includes segment 10A and 13A

Master of Public Administration Program
Knowing DistributionProvides Useful Information
• It is unlikely that there are more than about 8,000 people on the beach at any one time– Much less than previously thought– Only 1,479 parking spaces
• Knowing distribution of beachgoers could improve service delivery:– Linear programming models can be used to optimize the
allocation of services like placement of lifeguard stands and trash barrels
– Information used to site new facilities (e.g., restrooms)

Master of Public Administration Program
Survey Instrument
• Questionnaire with open- and closed-ended question to find out such things as– Where people came from– How they traveled to the beach– Duration of stay– Factors affection choice of specific beach location– Demographic information
• Three versions with different section of questions on– Spending behavior– Contingent behavior on response to increased parking costs– Perceptions of service delivery to residents and visitors
• Questionnaires administered by surveyors

Master of Public Administration Program
Surveyors & Training• Surveyors allocated to 8 grids using a computer
algorithm– Ranged from 1 to 10
– Computer model also produced a skip pattern
– Made sure experienced surveyor in each grid to help supervise
• Training on– Reading questionnaire and collect data
– Randomly sampling groups and adults within groups
– Reading the informed consent and not interview people under 18
– Using GPS meters
• Research team kept in touch via cell phone and collected morning surveys at lunch

Master of Public Administration Program

Master of Public Administration Program
Sampling Strategy• Randomly sampling groups
– Start at beginning of grid and identify 1st group of beachgoers
– Count off systematically until reaching skip number
– Random number card used to pick first group and then counted off groups using skip number
– Moved systematically in different ways depending o density of groups
• Randomly sampling adult
– Picked an adult and counted off systematically giving each a number
– Used the next random number from the card to select the adult
– Asked to participate and read the informed consent
• Procedures used to ensure that everyone had an equal probability of getting sampled

Master of Public Administration Program
Master of Public Administration Program

Master of Public Administration Program
Data Entry
• At conclusion of AM/PM sessions data was checked to ensure it had appropriate identifying information
• Questionnaire coded using software identical to that used for telephone surveys to construct the computer database
• Multiple reference points used to identify incorrectly entered data using cross tabulations
• Data was checked a final time for potential errors and variables to assist in the analysis were created

Master of Public Administration Program
Response Rates
Tues. - AM Tues. - PM Sat. - AM Sat. - PM Totals Questionnaires 147 153 205 246 751 Refusals/non-English 16 17 33 25 91 N 163 170 238 271 842 Response Rate 90.2% 90% 86.1% 90.8% 89.2% Total - Questionnaires 751 Total – N 842 Total – Response Rate
300 333
90.1%
451 509
88.6% 89.2%

Master of Public Administration Program
Demographics of Beachgoers• Sex
– Male: 37.4%
– Female: 62.2%
• Race– White: 95.2%
• Education– High school: 9.5%
– Some college: 24.9%
– College or greater: 64.9%
• Income– 16.6% < $35,000
– 28.6% > $100,000

Master of Public Administration Program
Where do People Come From?• North Carolina: 75.4%
– Mostly New Hanover County, few from Brunswick and Pender Counties
– Raleigh metro area is biggest source of NC visitors
• Out of State: 24.5%– Virginia, Pennsylvania, Georgia, Maryland, New Jersey, New
York, Ohio, Illinois, Texas, etc.
– Out of state visitors come from all over
• How did they discover Wrightsville Beach?– Grew up here/local resident: 22.9%
– Family, friends, word of mouth: 57.4%

Master of Public Administration Program
Group Characteristics• Group size:
– Mean: 4.33
– Range: 1 to 31
• Years coming to Wrightsville Beach– Mean: 12.16
– Median: 8
– Range: 0 to 65
• When do you typically frequent the beach?– During the week: 16.2%
– Weekends: 31.8%
– Vacation: 32.1%
Master of Public Administration Program
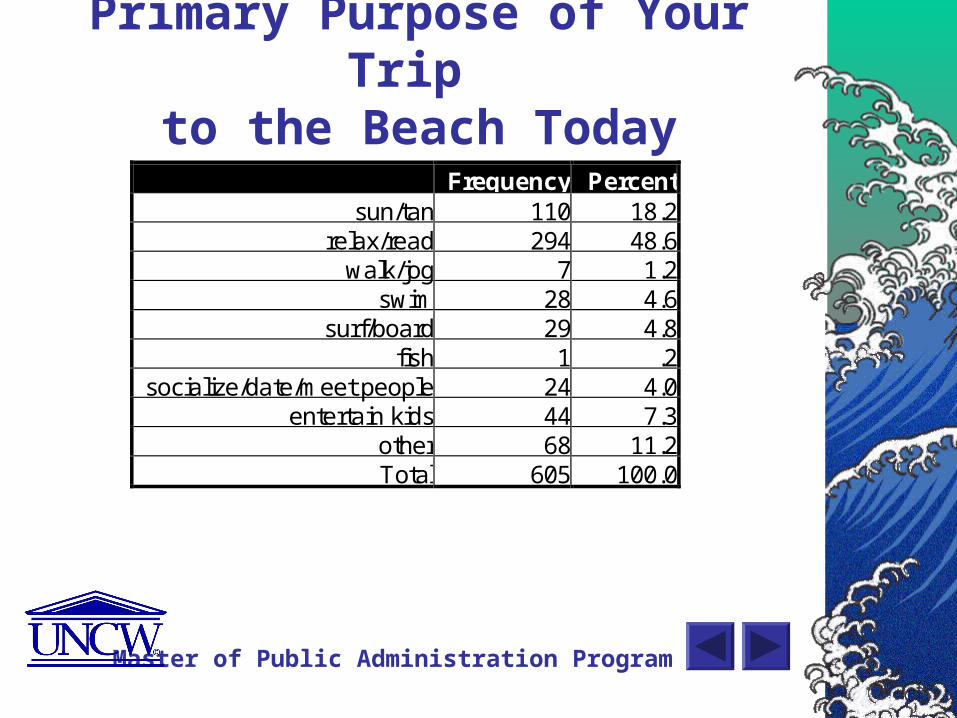
Primary Purpose of Your Trip to the Beach Today
Frequency Percent sun/tan 110 18.2
relax/read 294 48.6 walk/jog 7 1.2
swim 28 4.6 surf/board 29 4.8
fish 1 .2 socialize/date/meet people 24 4.0
entertain kids 44 7.3 other 68 11.2 Total 605 100.0

Master of Public Administration Program
Current Trip Characteristics• Number of expected trips in 2003
– Mean: 13.03 trips– Median: 3 trips
• Length of trip– Mean: 4.11days– Median: 3 days– Range: 1 to 90 days
• Total hours on beach– Mean: 4.59 hrs– Median: 4 hrs
• How did they travel to beach?– Drive/Passenger in car: 69%– Walk: 29.6%

Master of Public Administration Program
Where did they park?
Where did you park?
41%
19%
19%
11% 1%
9% public parking lot
unmetered roadside space metered roadside space
private driveway
unmarked/illegal/tow away location other

Master of Public Administration Program
Other Parking Questions
• How long to find a space?– Mean: 4.07 minutes.– Median: 1 minute– Range: 0 to 90 minutes.
• Did they park in the area they wanted?– Yes: 91.7%
• In the last year, did you try to visit but went elsewhere because there was no parking?– Yes: 31.1%
• Number of blocks to walk to the beach– Mean: .9– Range: 0 to 9

Master of Public Administration Program
Factors Used to Select Specific Location on Beach
Factors in Chosing Location on Beach
0102030405060
Near condo, cotta...
Near good swim
min.
Near Parking
good surfing
Lifeguards
Near good fishing...
Near public restroom
A lot of people here
Near a pier
Peaceful/few people
Near restaurants
Near people you...
Near Shopping

Master of Public Administration Program
Factors Used to Select Specific Location on Beach
• Have they been to same location before?– Yes: 79.9%
• Most important factors in choosing location?– Near where you parked: 27.6%
– Near condo: 20.3%
– Near few people: 7.9%
– Near good swimming: 3.9%
– Near people know/meet: 3.7%
– Near good surfing: 3.6%
– Near restrooms: 3%
– Near lifeguards: 2.4%
– Near a lot of people: 1.4%

Master of Public Administration Program
Spending Behavior• Looked at the total spent individually:
– Wrightsville Beach– Locally but off Wrightsville Beach– Outside the local area
• Spending by categories such as:– Parking– Gasoline– Restaurants– Groceries– Beach gear– Entertainment– Hotel/Model/Condo– Rental car/air travel
Master of Public Administration Program
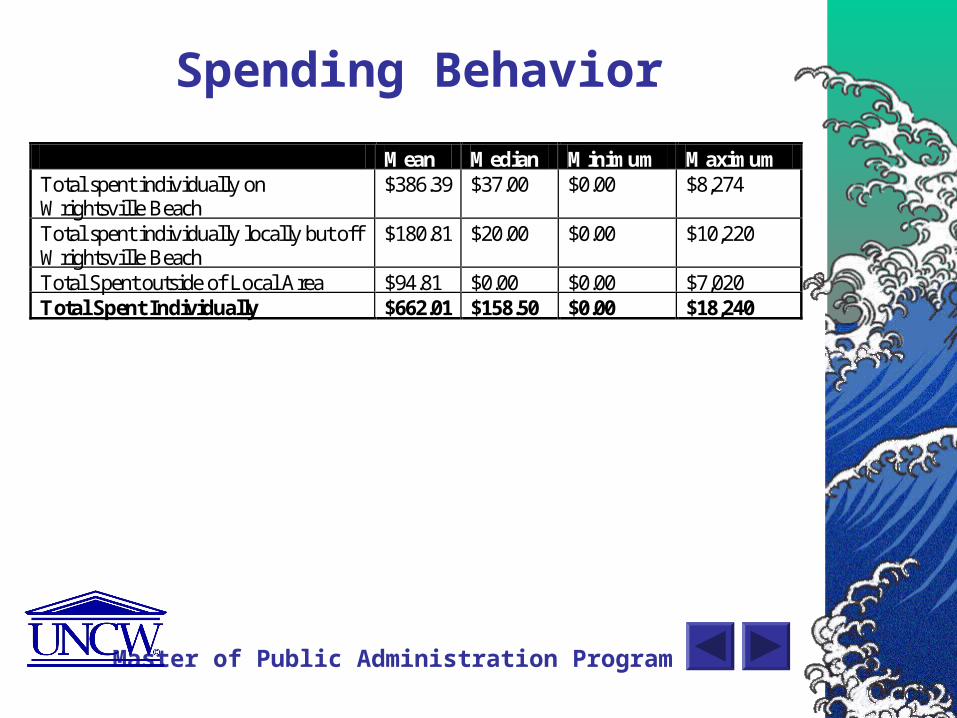
Spending Behavior
Mean Median Minimum Maximum Total spent individually on Wrightsville Beach
$386.39 $37.00 $0.00 $8,274
Total spent individually locally but off Wrightsville Beach
$180.81 $20.00 $0.00 $10,220
Total Spent outside of Local Area $94.81 $0.00 $0.00 $7,020 Total Spent Individually $662.01 $158.50 $0.00 $18,240
Master of Public Administration Program
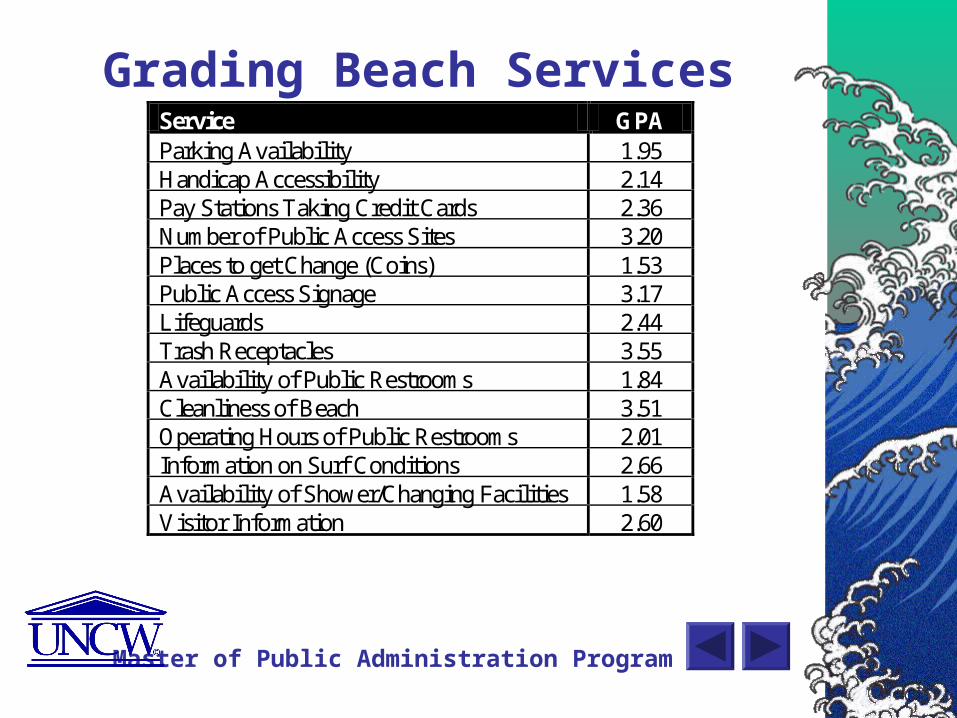
Grading Beach ServicesService GPA Parking Availability 1.95 Handicap Accessibility 2.14 Pay Stations Taking Credit Cards 2.36 Number of Public Access Sites 3.20 Places to get Change (Coins) 1.53 Public Access Signage 3.17 Lifeguards 2.44 Trash Receptacles 3.55 Availability of Public Restrooms 1.84 Cleanliness of Beach 3.51 Operating Hours of Public Restrooms 2.01 Information on Surf Conditions 2.66 Availability of Shower/Changing Facilities 1.58 Visitor Information 2.60

Master of Public Administration Program
Wrightsville Beach Compared to Other Beaches
Wrightsville Beach Compared to Other Beaches
21%
59%
19%
1%
0%
the best beach I havevisited
better than mostbeaches
about average
worse than mostbeaches
the worst beach I havevisited

Master of Public Administration Program
Overall SatisfactionSatisfaction with Beach Trip
42.4
51.3
4.7
1.3
0.3
extremely satisfied
satisfied
unsure
dissatisfied
extremely dissatisfied

Master of Public Administration Program
Directions for Future Research• Analyze the economic data collected
– Travel cost models
– Economic impact models
– Contingent valuation models
– Random utility models
• Analyze management data– Parking prices
– Provision of services
– Perceptions of services
– Better management of beach traffic
• Follow-up survey planned Summer ‘05

Master of Public Administration Program
Questions?

Master of Public Administration Program
Age of Respondents
Age Range of Interviewees
15
20.6
24.8
25.2
10.8 3.518 to 25
26 to 35
36 to 45
46 to 55
56 to 65
over 65

Master of Public Administration Program
Education
Education Completed
1% 10%
25%
64%
less than high school
high school
some college
college or greater

Master of Public Administration Program
IncomeIncome of Individual
6.34.3
6
10
1619.5
17.3
11.39.3
0
5
10
15
20
25
Und
er$1
5,00
0
$25,
000
to$3
5,00
0
$50,
000
to$7
5,00
0
$100
,000
to$1
50,0
00
refu
sed/
noan
swer
Per
cen
t