Embed Size (px)
Citation preview
Genotyping-by-Sequencing of sweet-stem and grain sorghum
for linkage mapping
Nare Ngoepe
(Student Number: 12382923)
Master of Science in Genetics Dissertation
Faculty of Natural and Agricultural Sciences
Department of Plant Sciences
University of Pretoria
Pretoria, South Africa
Supervisor: Dr B. Crampton
Dr D.A. Odeny
Dr D.J.G. Rees
1
Declaration
I declare that the dissertation hereby submitted to University of Pretoria for the
degree of Master of Science in Genetics has not previously been submitted
for the degree at this or any other university. All the assistance and
contribution received have been properly acknowledged.
_______________________ ___________________
Signature Date

2
Acknowledgements
First I would like to thank the National Research Foundation (NRF) and the
Agricultural Research Council (ARC) for funding of this project. I want to
express my heartfelt gratitude to Dr. Damaris Odeny who gave me a chance
to obtain this masters degree under her patient, professional and encouraging
supervision. I would also like to extend my gratitude to Dr Jasper Rees for his
endless support and Dr Bridget Crampton for her supportive role in the project
right through to the end.
I am grateful to Dr Nemera Shargie and his team for their technical assistance
in planting of the RILs and generation advancement. To all my colleagues,
thank you for words of encouragement, advises and sharing of ideas.
I would like to thank my parents, Dina Ngoepe and my late father Gilbert
Ngoepe for their unconditional support and love. To them I would like to say:
ke a leboga. A special thank you to my son Maitemogelo, for being such an
inspiration to me. I thank my siblings for their extraordinary moral support and
the love they gave to me throughout.
A special thank you to all my friends, with special dedication to Dipolelo,
Suzan/Mamzo, Tlou Masehela and Adeyemi, I got through a lot with your
unending support, advises, help and support. Finally, I would like to thank
God, the almighty, all of this couldn’t have been possible without your mercy.
3
Table of contents
Declaration 1
Acknowledgements 2
Abstract 5
Abbreviations and symbols 7
Index of figures 10
Index of tables 12
CHAPTER1: Introduction and literature review 13
1.1 General introduction to sorghum 13
1.2 Origin and distribution of sorghum 15
1.3 Classification and taxonomy of sorghum 17
1.4 Uses of Sorghum 18
1.5 Constraints to sorghum production 19
1.6 Genetics and genomics of sorghum 20
1.7 Sorghum breeding 22
1.8 Molecular makers 25
a) Restriction Fragment Length Polymorphisms (RFLPs) 26
b) Random Amplified Polymorphic DNAs (RAPDs) 27
c) Amplified Fragment Length Polymorphisms (AFLPs) 28
d) Simple Sequence Repeats/Microsatellites 29
e) Single Nucleotide Polymorphisms (SNPs) 30
f) Genotyping-by-Sequencing (GBS) 32
1.9 Bioinformatics analysis 37
1.10 Study rationale 38
1.11 Aim and Objectives: 40
4
CHAPTER 2: Materials and methods 41
2.1 Experimental Design 41
2.2 Plant material: 42
2.3 General protocols 44
2.4 Library Preparation 46
2.5 Data analysis and SNP identification 49
2.5.1 CLC Genomics Workbench 49
2.5.2 TASSEL (Trait Analysis by Association Evolution and Linkage) pipeline 52
CHAPTER 3: Results 54
3.1 DNA extraction 54
3.2 Library preparation 55
3.3 Sequence assembly 60
(a) CLC Genomics Workbench 60
(b) TASSEL pipeline 60
3.4 SNP discovery 61
3.5 Sequencing Associated Costs 65
CHAPTER 4: Discussion 67
CHAPTER 5: References 75
5
Abstract
Advances in next generation sequencing technologies have enabled
researchers to do in depth genome studies. The steadily decreasing cost of
sequencing has made it possible to conduct a Genotyping-by-Sequencing
(GBS) approach both in plants and animals. A reliable and efficient
genotyping protocol is crucial for studying and understanding the genetics and
genomics of sorghum. The current work aimed at investigating the
applicability of Genotyping-by-Sequencing techniques in a sorghum mapping
population generated between sweet stem and grain sorghum parents. Two
methods of Genotyping-by-Sequencing, whole genome shotgun (WGS) and
restriction-site associated DNA (RAD) methods were used to examine the
sorghum genome in this study. A total of 921 031 and 3 119 variants (SNPs
and INDELs) were identified in WGS and RAD sequencing approaches
respectively using CLC Genomics Workbench 6.0.1. The Trait Analysis by
aSSociation, Evolution and Linkage (TASSEL) pipeline identified a total of 2
701 814 and 17 012 in the WGS and the RAD sequencing approach
respectively. The TASSEL pipeline identified 1 456 253 and 3 435 variants
from the two parents in the WGS and the RAD sequencing approach
respectively. The results revealed the RAD method as the better Genotyping-
by-Sequencing approach for large populations and Trait Analysis by
aSSociation, Evolution and Linkage as the best data analysis tool as it
discovered more variations than CLC Genomics Workbench. The
development of a precise and inexpensive Genotyping-by-Sequencing
protocol serves as a robust framework to which sorghum populations can be
6
characterized. These results will contribute towards genetic mapping of the
markers and subsequent identification of quantitative trait loci (QTLs)
governing different traits of interest contributing towards breeding for
feedstock varieties that are optimized for biofuel production from sorghum.
7
Abbreviations and symbols
AFLP : Amplified Fragment Length Polymorphism
AluI : Arthrobacter luteus restriction enzyme
ARC : Agricultural Research Council
bp : Base Pair
BCL : Base Call Library
BC : Before Christ
C : Control
CA : California
CASAVA : Consensus Assessment of Sequence and Variation
CGIAR : Consultative Group on International Agricultural Research
Cm : centimeters
CTAB : Cetyl trimethylammonium bromide
C3 : 3-carbon
C4 : 4-carbon
DH : Double Haploid
DNA : Deoxyribose Nucleic Acid
dNTP : Deoxynucleotide triphosphate
EDTA : Ethylenediaminetetraacetic acid
EST : Expressed Sequence Tag
F : Filial generation after a cross
FAO : Food and Agriculture Organization
Fig. : Figure
g : Gram
8
Gb : Giga Base
GBS : Genotyping-by-Sequencing
h : Hour
HpaII : Haemophilus aegyptius restriction enzyme
ICRISAT : International Crops Research Institute for the Semi-Arid
Tropics
IGV : Intergrative Genome Viewer
INDEL : Insertions and Deletions
kbp : Kilo Base Pairs
Kg : Kilogram
m : Meter
M : Molar
MAB : Marker Assisted Breeding
MAS : Marker Assisted Selection
Mbp : Mega base pair
Mg : Magnesium
μl : Microliter
n : Nano
NaOH : Sodium hydroxide
NGS : Next Generation Sequencing
P : Phosphorus
p : Pico
P1 : Parent 1
P2 : Parent 2
Prog 1 : Progeny 1
9
Prog 2 : Progeny 2
PCR : Polymerase Chain Reaction
QTLs : Quantitative Trait Loci
RAD : Restriction site-associated DNA
RAPD : Random Amplified Polymorphic DNA
RILs : Recombinant Inbred Lines
RFLP : Restriction Fragment Length Polymorphism
SA : South Africa
SBS : Sequencing by Synthesis
SNP : Single Nucleotide Polymorphism
SSLP : Simple Sequence Length Polymorphism
SSR : Simple Sequence Repeat
STMS : Sequence-Tagged Microsatellite Sites
STR : Short Tandem Repeats
TAE : Tris-acetate-EDTA
TASSEL : Trait Analysis by aSSociation, Evolution and Linkage
UK : United Kingdom
USA : United States of America
WGS : Whole Genome Shotgun
μ : Micro
0C : Degrees Centrigrade
10
Index of figures
Fig. 1: A world map indicating sorghum cultivation.
Fig. 2: Overview of Genotyping-by-Sequencing using the restriction site
associated DNA method.
Fig. 3: Overview of Genotyping-by-Sequencing using the whole genome
shotgun method.
Fig. 4: The steps followed when using CLC Genomics Workbench 6.0.1 to
analyze the obtained sequence data.
Fig. 5: The steps followed for data analysis of the obtained sequence data
using the TASSEL pipeline.
Fig. 6: A schematic representation of the experimental design followed in this
project.
Fig. 7: Visualisation of DNA by electrophoresis on the parents and the two
progeny used for Genotyping-by-Sequencing.
Fig. 8: Excision of 500 to 700 bp DNA fragments for library preparation of the
two parents digested with a transposome.
11
Fig. 9: The use of visual software, Integrative Genome Browser (IGV) to view
the sequence data obtained using Whole Genome Shotgun (WGS)
sequencing method.
Fig. 10: Optimization of AluI digestion on two sorghum individuals.
Fig. 11: The use of visual software, Integrative Genome Browser (IGV) to
view the sequence data obtained using Restriction-site Associated DNA
(RAD) sequencing method.
Fig. 12: The percentage of each individual reads that mapped to the Sorghum
bicolor L.Moench reference genome publicly available on Phytozome
(www.phytozome.net).
Fig. 13: The total number of variations (SNPs and INDELs) discovered using
the TASSEL pipeline and CLC Genomics Workbench 6.0.1.
Fig. 14: A demonstration of a shared SNP between the parents.
Figure 15: A schematic representation illustrating the unique variations
between the two parents and the two progeny on different chromosomes.
12
Index of tables
Table 1: A range of traits represented in the RIL population generated at the
ARC by crossing M71 (male) and SS79 (female)
Table 2: The sequence output and genome coverage of Parent 1 (M71),
Parent 2 (SS79) and the two progeny using the Whole Genome Shotgun and
Restriction-site Associated DNA sequencing methods
Table 3: A comparison of performance of the TASSEL pipeline and CLC
Genomics Workbench based on the number of variants (SNPs and INDELs)
identified
Table 4: The total number of the variations, common variations and unique
variations discovered in Parent 1 and Parent 2 when mapped against the
sorghum reference genome using Whole genome shotgun (WGS) and
Restricted-site Associated DNA (RAD) sequencing approaches
Table 5: The average cost involved in library preparation and DNA
sequencing using WGS and RAD for the sorghum Parent 1 (M71) and Parent
2 (SS79) and progeny selected
13
CHAPTER1: Introduction and literature review
1.1 General introduction to sorghum
Sorghum (Sorghum bicolor L. Moench) is ranked as the fifth most important
cereal crop in the world, after maize (Zea mays L.), wheat (Triticum aestivum
L.), rice (Oryza sativa L.), and barley (Hordeum vulgare L.) based on the total
grain production (Paterson et al., 2008; Mace et al., 2009). In Africa, sorghum
is ranked the second most important cereal crop after maize (Borrell et al.,
2010). The crop is widely cultivated in warmer climates where the availability
of water is limited because it’s well adapted to harsh environments. The ability
of sorghum to withstand drought is largely attributed to the crop uses C4
photosynthetis mechanism. C4 photosynthetic plants use complex
biochemical and morphological specializations to improve carbon assimilation
at high temperatures (Paterson et al., 2008). In sorghum, both morphological
and physiological characteristics are specialized to adapt to unfavorable
conditions. For example, the crop has the ability to stop growth in periods of
drought and resume when conditions become favorable (Muui et al., 2013). It
also has an extensive root system and a waxy bloom on the leaves that
reduces water loss. However, sorghum can be grown in high rainfall areas
because it is tolerant to waterlogging (Pardales et al., 1991).
Sorghum is considered a primary staple food crop in the semi-arid tropics of
Asia, Africa and South America and continues to play a major role in food
security for millions of people. In the arid countries of northeast Africa such as
Sudan and Ethiopia, sorghum contributes about 40% of calories in the human
14
diet (Kresovich et al., 2005). According to the “Investigation by the Sorghum
Section 7 Committee into the South African sorghum industry” about 90% of
the total sorghum produced (200 000 tons of sorghum per annum) is
consumed locally as feed and food.
Sorghum grains are consumed in poor communities because of their high
levels of micronutrients, which contribute towards combating malnutrition (Rao
et al., 2006). Paterson (2008) further emphasizes that the growing importance
of sorghum is due to increasing population sizes that need more reliable feed
and food. Other factors include the increasing demand for limited water
supplies and global climatic concerns that affect food security. Sorghum
interests farmers not only because of its wide adaptation to harsh conditions
and drought tolerance, but also because of its rapid growth (Reddy et al.,
2005).
Besides its use as grain, sorghum is also increasingly gaining importance for
its potential use in bioethanol fuel production (Reddy et al., 2005; Prasad et
al., 2007; Laopaiboon et al., 2009; Zhang et al., 2010). Apart from sugarcane
(Saccharum spp.), a close relative to sorghum (Tarpley and Vietor, 2007),
which has been used traditionally for biofuel production (Limtong et al., 2007;
Goldemberg et al., 2008), other crops like maize (Torney et al., 2007) and
cassava (Manihot esculenta) (Papong and Malakul, 2010) have been utilized
as feedstock for bioethanol. However, there have been concerns over their
utilization towards biofuels at the expense of food, which may escalate food
insecurity concerns (Boddiger, 2007). As a result, there are global efforts to
15
come up with integrated solutions that include both food and biofuel
production in a way that does not compromise food security.
The main interest for utilizing sorghum as a source of bioethanol over
sugarcane is because sugarcane is resource intensive as compared with
sorghum. For example, sugarcane uses four times more water than sorghum
(Reddy et al., 2007). Furthermore, sugarcane takes 12-16 months before
harvest, as compared to sorghum which takes only four months (Reddy et al.,
2005). Sorghum can also be grown on marginal land where sugarcane cannot
be cultivated, but the genetic improvements of sugar content in sorghum have
not been intensively studied as compared to that of sugarcane.
1.2 Origin and distribution of sorghum
It is understood that sorghum originated in Africa, due to the high genetic
diversity and the wild distribution of the crop on the continent, especially in the
North-Eastern quadrant of Africa (Doggett, 1988). There is evidence that the
crop was first domesticated on a savanna between Chad and western
Ethiopia (Doggett, 1988). From the centre of origin, sorghum was dispersed
along trade and shipping routes throughout Africa and the Middle East, to
India approximately 3 000 years ago. Sorghum was later introduced into
eastern Africa from Ethiopia around 200 AD and subsequently, the Bantus
carried it to southern African countries (de Wet and Huckabay, 1967).
16
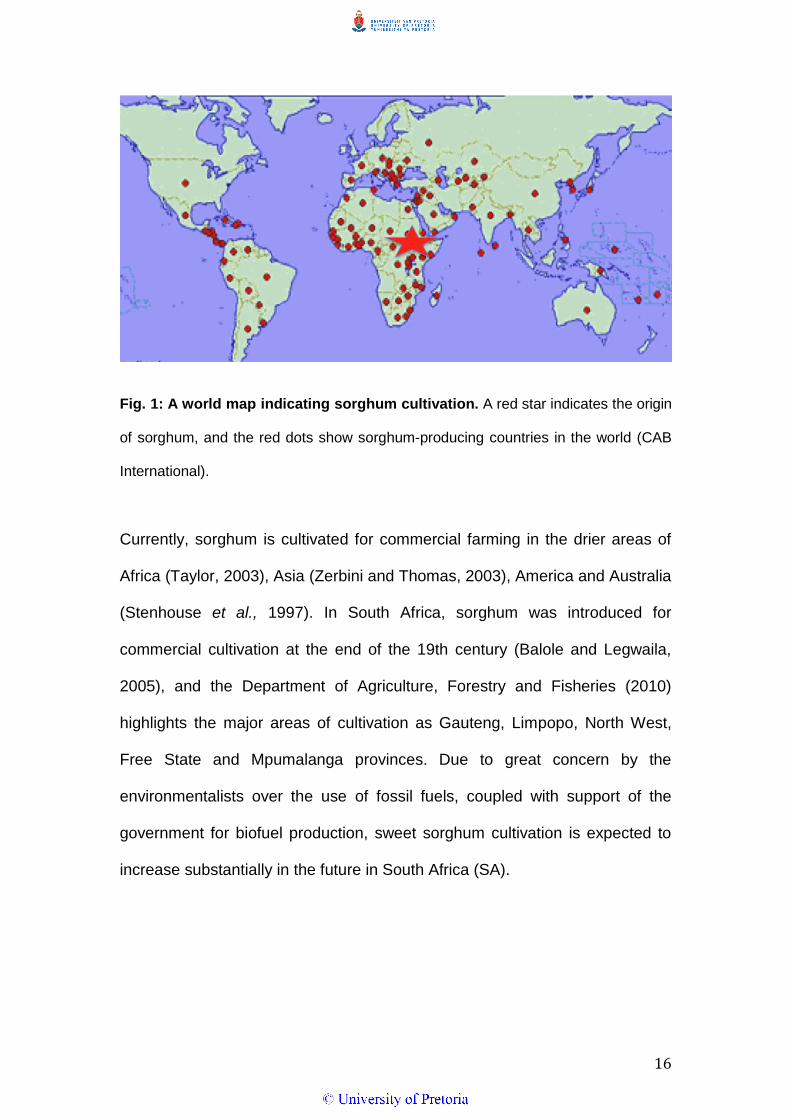
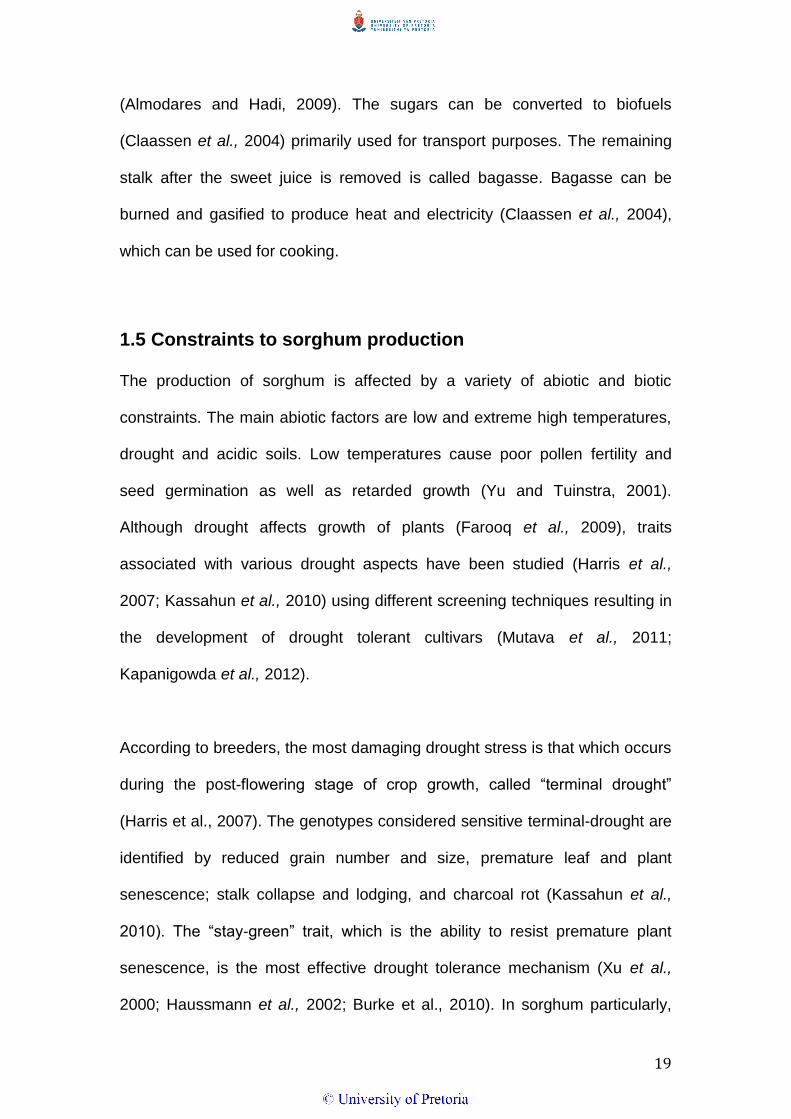
Fig. 1: A world map indicating sorghum cultivation. A red star indicates the origin
of sorghum, and the red dots show sorghum-producing countries in the world (CAB
International).
Currently, sorghum is cultivated for commercial farming in the drier areas of
Africa (Taylor, 2003), Asia (Zerbini and Thomas, 2003), America and Australia
(Stenhouse et al., 1997). In South Africa, sorghum was introduced for
commercial cultivation at the end of the 19th century (Balole and Legwaila,
2005), and the Department of Agriculture, Forestry and Fisheries (2010)
highlights the major areas of cultivation as Gauteng, Limpopo, North West,
Free State and Mpumalanga provinces. Due to great concern by the
environmentalists over the use of fossil fuels, coupled with support of the
government for biofuel production, sweet sorghum cultivation is expected to
increase substantially in the future in South Africa (SA).
17
1.3 Classification and taxonomy of sorghum
Sorghum belongs to the family Poaceae, the tribe Andropogoneae and
subtribe Sorghastrae. The genus Sorghum is separated into five taxonomic
sections, namely: chaetosorghum, heterosorghum, parasorghum, sorghum,
and stiposorghum. The section sorghum contains all the domesticated as well
as cultivated sorghum races and varieties (Harlan and de Wet, 1972; Doggett,
1988). Harlan and deWet (1972) further identified five basic races of sorghum
(bicolor, guinea, caudatum, durra, and kafir) and 10 intermediate races (based
on panicle and spikelet morphology).
The race guinea arose more than 2,000 years ago and is the dominant
sorghum of West Africa (House, 1995). The race caudatum is an important
agronomical race especially when combined with other races. Although the
races durra and kafir are widely cultivated, bicolor remains the most
domesticated species in the genus. Bicolor is a highly variable crop-weed
complex and contains wild, weedy and cultivated annual forms which are fully
inter-fertile (Hay et al., 2013).
Sorghum variants are further grouped into five agronomic types, namely: fiber,
broomcorn, forage/fodder, grain and sweet sorghum. All the variants are
closely similar, however, sweet sorghum can reach up to 6 m while the other
four can only attain up to 4.5 m in height. Sweet sorghum also accumulates
edible sugars in the stems (Vermerris, 2011). The sugar in sweet sorghum is
mainly composed of saccharose, fructose and glucose, which are similar to
the sugars found in sugar beet (Capareda, 2010). Studies have shown that a
18
mature sweet sorghum consists of approximately 75% cane, 10% leaves, 5%
seeds and 10% roots by weight (Grassi et al., 2002).
1.4 Uses of Sorghum
The sorghum plant is of great importance because the whole plant can be
used for different purposes. From antiquity, sorghum has been used for food
(Dicko et al., 2006; Taylor et al., 2006), beverage (McGovern, 2004; Bvochora
et al., 2005), feed (De Oliveira, 2007) and building materials (Reddy and
Yang, 2005). For example, in other parts of the world such as Japan and the
United States of America, white sorghum grains are processed into flour and
snacks (Rooney, 2001). But in Africa, sorghum serves as the main food and
feed especially in drought-stricken areas e.g Ethiopia (Meze-Hausken, 2004;
Cavatassi, 2011) and Zambia (Van Heerden and Schönfeldt, 2004).
The grains are used for the production of traditional foods such as ting (a
fermented porridge prepared using maize or sorghum grains), soft porridge
and pap (a traditional porridge prepared from maize or sorghum). Additionally
the grains are used for making commercial beer and non-traditional products,
such as animal fodder. After harvest, the grain sorghum stems can be used
for fencing and building huts while the roots are useful as fuel for cooking.
Sweet sorghum is used to make confectionery. On a commercial scale
though, sweet sorghum is used for production of biofuel and alcohol (Woods,
2001; Rooney et al., 2007; Yuan et al., 2008; Murray et al., 2008; Zhao et al.,
2009). The sweet juice from the stalk can be converted into sugar and syrup
19
(Almodares and Hadi, 2009). The sugars can be converted to biofuels
(Claassen et al., 2004) primarily used for transport purposes. The remaining
stalk after the sweet juice is removed is called bagasse. Bagasse can be
burned and gasified to produce heat and electricity (Claassen et al., 2004),
which can be used for cooking.
1.5 Constraints to sorghum production
The production of sorghum is affected by a variety of abiotic and biotic
constraints. The main abiotic factors are low and extreme high temperatures,
drought and acidic soils. Low temperatures cause poor pollen fertility and
seed germination as well as retarded growth (Yu and Tuinstra, 2001).
Although drought affects growth of plants (Farooq et al., 2009), traits
associated with various drought aspects have been studied (Harris et al.,
2007; Kassahun et al., 2010) using different screening techniques resulting in
the development of drought tolerant cultivars (Mutava et al., 2011;
Kapanigowda et al., 2012).
According to breeders, the most damaging drought stress is that which occurs
during the post-flowering stage of crop growth, called “terminal drought”
(Harris et al., 2007). The genotypes considered sensitive terminal-drought are
identified by reduced grain number and size, premature leaf and plant
senescence; stalk collapse and lodging, and charcoal rot (Kassahun et al.,
2010). The “stay-green” trait, which is the ability to resist premature plant
senescence, is the most effective drought tolerance mechanism (Xu et al.,
2000; Haussmann et al., 2002; Burke et al., 2010). In sorghum particularly,
20
stay-green properties have been associated with drought resistance trait
(Mutava et al., 2011; Tao et al., 2000; Vinodhana and Ganesamurthy, 2010).
On the other hand, aluminum toxicity in the soil has also been shown to
contribute to drought stress because it damages the root system (Magalhaes
et al., 2007). The resultant affected plants can be vulnerable to mineral
nutrient deficiencies.
Striga (Striga asiatica), a parasitic weed, is one of the major biotic pressures
affecting sorghum productivity. It reduces photosynthesis in sorghum as it
abstracts water and inorganic solutes from the host, generally affecting yields
by more than 50 percent (Lendzemo et al., 2007; Haussmann et al., 2004).
Other biotic constraints include, grain mold (Navi et al., 2005) caused by a
number fungi e.g. Fusarium moniliforme Sheld., Curvularia lunata etc., and
leaf diseases e.g. leaf blight caused by Exserohilum turcicum (TeBeest et al.,
2004). When the rains extend beyond normal duration, grain mold develops
resulting in reduced yield and seed quality (Navi et al., 2005). Pedigree and
backcross breeding techniques have been applied with moderate success to
breed cultivars that are resistant or tolerant to the above mentioned biotic
constraints (Bantilan et al. 2004). The germplasm lines and breeding lines
tolerant to specific stress have been identified and selected.
1.6 Genetics and genomics of sorghum
Sorghum is a diploid species (2n=20) with a relatively small genome size (750
Mbp) compared to other important cereals such as wheat (16 900 Mbp) and
maize (2 600 Mbp), although larger than that of rice (389 Mbp). It was the first
21
sequenced plant genome of African origin (Paterson et al., 2009) and a model
crop for studying tropical grasses using C4 photosynthesis. The small
genome of sorghum provides an attractive model for enhancing the
understanding of the evolution, structure and function of tropical cereals.
Sorghum remains an important target for plant genomics due to the high level
of inbreeding in the crop and lower level of gene duplication than in many
other tropical cereals such as rice (Paterson et al., 2009).
Sorghum genome mapping began in the early 1990s using morphological and
DNA markers, and several genetic maps have been developed. Pereira et al.,
(1994) reported the first complete sorghum map with 10 linkage groups.
Several other linkage maps have been reported since then, which Mace and
Jordan (2010) recently integrated onto a complete genome map. Sorghum
genetic maps have also been cross-referenced to other grass species as a
step towards cloning genes linked to marker loci and for comparative genome
analysis (Bhattramakki et al., 2000; Kong et al., 2000; Menz et al., 2002).
Quantitative Trait Loci (QTLs) responsible for traits of interest have also been
identified in sorghum. Quantitative traits are characters that are controlled by
a combination of many genes. The regions within genomes that contain genes
associated with a particular quantitative trait are termed quantitative trait loci
(QTLs). Different quantitative traits have been mapped in sorghum including
stay-green and drought tolerance (Xu et al., 2000; Sanchez et al., 2002), pest
tolerance e.g. shoot fly tolerance loci (Atherigona soccata Rond.) (Apotikar et
al., 2011), parasite resistance e.g. Striga (Klein et al., 2001; Mutengwa et al.,
22
2005) and disease resistance e.g. downy mildew caused by Sclerophthora
(Sclerospora) (Gowda et al., 1995). Grain quality and yield have always been
areas of interest to breeders to address the issue of food security. Genomic
regions controlling the grain yield and quality have been studied extensively
using molecular markers (Rami et al., 1998; Jordan et al., 2003). Most
recently, bioenergy traits (Guan et al., 2011), QTLs for sugar-related traits
(Shiringani et al., 2010), and cold tolerance (Burow et al., 2011) have been
studied and mapped using molecular markers to assist in MAS. The
identification of QTLs was not previously feasible using morphological
characters, but the development of molecular markers (Mohan et al., 1997)
made this practical.
1.7 Sorghum breeding
For a long time, morphological characterization has been used to select and
breed for sorghum plants with superior traits (Dahlberg et al., 2002; Kayodé et
al., 2006). However, morphological characters are often strongly influenced by
environmental factors and may not reflect true genetic composition of a plant
(Mandal et al., 2001; Koti et al., 2005; Luzuriaga et al., 2006). Moreover,
morphological markers used for phenotypic characters are limited in number
(Collard et al., 2005). Therefore, the most suitable method of selection is
molecular breeding or marker assisted selection (MAS)/marker-assisted
breeding (MAB).
Molecular breeding involves the use of molecular techniques to distinguish
different individuals at DNA variation level. Marker assisted selection refers to
23
the use of DNA markers to aid in choosing the preferred plant varieties with
desired traits. This is important because the main goal of plant breeding is to
assemble desirable combinations of genes in new plant varieties. Breeding for
desirable traits using the two methods have been exploited in important
cereals including maize (Eathington et al., 2007), wheat (William et al., 2007)
and sorghum (Vermerris et al., 2007) through a process called linkage
mapping.
Linkage is when the genes that are located close to each other on a
chromosome are inherited together during meiosis. Linkage maps are used to
determine the position and genetic distance of genes or markers relative to
each other in terms of recombination frequency. There are three main steps in
creating a linkage map. The first step involves developing a mapping
population, followed by identifying polymorphisms in the population, and
finally, the linkage analysis of the markers.
There are different types of mapping populations and its thus vital to select
the appropriate type of mapping population for the intended study. The
different types of mapping populations include recombinant inbred lines
(RILs), backcross (BC), double haploid (DH) and F2 populations. The F2
populations are derived from crossing F1 progeny, while backcross
populations are derived from crossing F1 hybrid to one of the parents. Double
haploids are developed by regenerating plants through the induction of
chromosome doubling from pollen grains. RILs are derived from crossing two
parents that are considered to be highly homozygous and advancing the
24
progeny to at least F7. An important prerequisite for choosing the two parents
is the possession of distinct traits of interest. This will support achieving a
segregating population for those traits.
The most common RIL population development method is called single seed
descent. The single seed descent method uses a single seed from each F2
offspring attained from crossing two parents to advance to the next generation
(Borojević, 1990). For instance, a cross from the two parents results in an F1
generation, which is then crossed (F1 X F1) to advance to F2. From F2
progeny, a single seed from each plant is randomly selected to advance to the
next generation (F3). Then from the F3 generation a single seed is also
randomly selected to advance to the next generation (F4). This will be
repeated until the seventh or eighth generation where more than 99%
average homozygosity will now be expected (Scheible et al., 2004).
There are drawbacks to each of the methods of creating mapping populations.
Although using an F2 or BC population is desirable because both populations
are easy to construct and generating them takes a short time, the populations
are ephemeral resulting in seed that will not breed true to the traits possibly
observed (Rakshit et al., 2012). The main disadvantage of using RILs is that it
takes a lot of time to establish the mapping population because six to eight
generations are required. The main advantage of DH and RILs is that they
produce homozygous lines that can be multiplied and reproduced without
genetic change occurring (Collard et al., 2005). Different kinds of mapping
populations, including F2 (Bian et al., 2006), Back-cross (Piper and Kulakow,
25
1994) and largely RIL (Bhattramakki et al., 2000; Taramino et al., 1997;
Carrari et al., 2003; Kong et al., 2000; Murray et al., 2008; Shiringani et al.,
2010; Apotikar et al., 2011; Burow et al., 2011; Jordan et al., 2011; Zou et al.,
2012; Mace et al., 2012; Kong et al., 2013) populations have been used in
sorghum for diverse studies.
Sorghum breeders’ interests have always been breeding for high grain yield
(Haussmann et al., 2000; Patidar et al., 2004; Yadav et al., 2005), forage
quality (Amigot et al., 2006), early maturity (Baumhardt et al., 2006),
increased water-use efficiency and drought tolerance (Kapanigowda et al.,
2012; Tesso et al., 2005; Ali et al., 2009), and disease resistance
(Chandrashekar and Satyanarayana, 2006; Nair et al., 2005). Although plant
breeders have made progress through conventional breeding and germplasm
screening to identify sources of resistance and tolerance, and backcrossing to
transfer resistant genes into elite backgrounds, the practice is highly time-
consuming and labor- and cost-intensive. Advances in biotechnology have
enabled breeders to follow MAB, which identifies genomic regions of a crop
and makes it feasible to select specific regions in elite varieties using
molecular markers.
1.8 Molecular makers
Molecular markers are polymorphisms found naturally in populations that
reveal neutral sites of variation at DNA sequence level (Semagn et al., 2006).
The technology of molecular markers allows plant breeders and geneticists to
locate and understand the basics of the numerous gene interactions
26
determining complex traits (Haussmann et al., 2000a). Gupta et al. (2001)
broadly classified the techniques developed in the last two decades into three
generations: the first generation molecular markers, which include Restriction
Fragment Length Polymorphisms (RFLPs), Random Amplified Polymorphic
DNAs (RAPDs) and their modifications. Second generation molecular markers
include Amplified Fragment Length Polymorphisms (AFLPs), Simple
Sequence Repeats (SSRs) and their modifications. Finally, the third
generation molecular markers include single nucleotide polymorphisms
(SNPs).
a) Restriction Fragment Length Polymorphisms (RFLPs)
Botstein et al. (1980) work on the construction of genetic maps in human
using RFLP was the first reported molecular marker technique used in the
detection of DNA polymorphisms. This technique requires that DNA is first
extracted and digested using restriction enzymes. The resulting restriction
fragments are separated according to their lengths using gel electrophoresis
and transferred on to a hybridization membrane, which later is incubated with
the DNA probe (Botstein et al., 1980). The unhybridized probe is washed off,
and the specifically hybridized probe detected by autoradiography. The bands
visible on the autoradiogram indicate the size of the digested DNA that has
the sequences similar to the cloned sequences used as the probe.
Although RFLPs are relatively highly polymorphic, co-dominantly inherited
and highly reproducible (Agarwal et al., 2008), the technique is time
consuming, costly and a large amount of DNA is required for analyses (Piola
27
et al., 1999). RFLPs have been extensively applied in sorghum (Hulbert et al.,
1990; Binelli et al., 1992; Whitkus et al., 1992; Berhan et al., 1993; Tao et al.,
1993; Witcombe and Duncan, 1993; Bennetzen and Melake-Berhan, 1994;
Chittenden et al., 1994; Deu et al., 1994; Pereira et al., 1994; Ragab et al.,
1994; Vierling et al., 1994; Xu et al., 1994a; Cui et al., 1995; White et al.,
1995; Ahnert et al., 1996; Bennetzen et al., 1996; De Oliveira et al., 1996;
Dufour et al., 1997; Peng et al., 1999). For example, Ahnert et al., (1996)
used RFLPs to assess the genetic diversity among elite sorghum inbred lines.
In that study, different patterns of RFLP bands were observed indicating
diversity amongst the lines and the data helped quantify the degree of
relatedness in elite sorghum germplasm.
b) Random Amplified Polymorphic DNAs (RAPDs)
Random Amplified Polymorphic DNA (RAPD) markers, on the other hand, are
the simplest version of PCR with arbitrary primers used for detecting DNA
variation ( Williams et al., 1990). They use short synthetic oligonucleotides of
about 10 bases long with random sequences as primers are used to amplify
nanogram amounts of total genomic DNA under low annealing temperatures
by PCR (Bardakci, 2001). Amplification products are separated on agarose
gels and stained with ethidium bromide. The presence or absence of bands
will mark the differences between the DNA templates and this occurs because
of sequence changes in the priming sites. RAPDs are useful for genetic
mapping, DNA fingerprinting and plant and animal breeding (Venkatachalam
et al., 2008). Although the RAPD technique has a lower reproducibility and is
less informative compared to other markers (Mulcahy et al., 1993, Vos et al.,
28
1995), it has been used to study agronomically important traits such as grain
yield and disease resistance in sorghum (Williams et al., 1990; Tao et al.,
1993; Mutengwa et al., 2005). For example, although the study of Mutengwa
et al. (2005) found no molecular marker linked to the locus of interest, the
analysis generated a molecular marker linkage map consisting of 45 markers
that were distributed over 13 linkage groups.
c) Amplified Fragment Length Polymorphisms (AFLPs)
One of the second-generation markers is AFLP. This is a technique that uses
selective amplification of a subset of restriction enzyme-digested DNA
fragments to generate a unique fingerprint for a particular genome. Usually
two restriction enzymes are used to digest the genomic DNA, and specific
adapters are ligated to both ends of all resulting fragments. PCR is then
performed using specific radioisotope or fluorochrome primer pairs. Another
PCR is also performed after the amplification products are separated on
sequencing gels. AFLPs represent the effective combination power of RFLP
and flexibility of PCR-based technology (Agarwal et al., 2008). Polymorphisms
between two or more genotypes may arise from insertions/deletions within an
amplified fragment, or due to sequence variation, or differences in the
nucleotide sequences immediately adjacent to the restriction enzyme site
(Vos et al., 1995).
The advantage of AFLP analysis is its ability to quickly generate large
numbers of marker fragments for any organism, without prior knowledge of
the genomic sequence. AFLP analysis requires only small amounts of starting
29
template and can be used for a variety of genomic DNA samples. The main
disadvantage of AFLPs is the high variability that reduces similarities between
distant taxa to the level of chance, hence technology is more suitable for
closely related lineages (Mueller and Wolfenbarger, 1999). AFLP markers can
be labor intensive, as they require an additional step of cloning into vectors.
Boivin et al. (1999) studied the distribution of AFLP markers within the
sorghum genome and their possible use in sorghum breeding. The
investigated distribution of the AFLPs along the genome was found not to be
uniform but the markers were used to construct a genetic linkage map.
d) Simple Sequence Repeats/Microsatellites
Microsatellites or SSRs are short DNA (2–6 base pairs) sequence motifs that
occur as interspersed repetitive elements in all eukaryotic (Tautz and Renz,
1984) as well as in many prokaryotes genomes (Van Belkum et al., 1998).
They are also known as short tandem repeats (STR) or sequence-tagged
microsatellite sites (STMS) or simple sequence length polymorphism (SSLP)
(Hautea et al., 2004). Microsatellite markers are widely used because in
contrast to all the PCR-based techniques explained above, which are
arbitrarily primed or non-specific, microsatellites-based marker techniques are
sequence targeted.
Microsatellite markers are found in non-coding (genomic-SSRs), or coding
(genic-SSRs or ST-SS s) regions of the genome. Although SS s are
generally much less abundant in coding regions than in the non-coding
regions (Barbar et al., 2007), both types of SSR markers are widely used.
30
Microsatellite markers are highly reproducible and have become popular
genetic markers due to their co-dominant inheritance, enormous extent of
allelic diversity as well as the ease of assessing microsatellite size variation
by PCR with pairs of flanking primers (Weising et al., 2005; Agarwal et al.,
2008). Although SSRs are considered the most efficient markers, their use is
still limited because of the long and laborious steps to develop them
(Rakoczy-Trojanowska and Bolibok, 2004).
For a long time microsatellites were developed from partial genomic libraries
of the species of interest by screening clones through colony hybridization
with repeat containing probes (Song et al., 2005). Although this method is
simple for microsatellite rich genomes, it is ineffective for species with low
microsatellite frequencies (Zane et al., 2002). Microsatellites are constantly
being isolated and characterized in a wide range of plants including sorghum
as genetic markers (Brown et al., 1996, Taramino et al., 1997). Haussmann et
al. (2004) explored the use of microsatellites to identify the genomic regions
influencing resistance to the parasitic weed Striga hermonthica in two
recombinant inbred populations of sorghum. The QTL for resistance was
found and was to be used to choose the populations for marker-assisted
selection.
e) Single Nucleotide Polymorphisms (SNPs)
A Single Nucleotide Polymorphism (SNP) is a genetic change or variation in
DNA sequence occurring when a single nucleotide in the genome or other
shared sequence differs between members of a biological species or paired
31
chromosomes in an individual. According to Gupta et al. (2001), SNPs are the
most abundant molecular markers with higher frequency and far more
prevalence than SSRs. This novel class of markers has a high level of
polymorphism and can even be found close or within a gene.
SNPs can be used to generate ultra high-density genetic maps, for mapping
traits, for phylogenetic analysis and for rapid identification of crop cultivars
(Agarwal et al., 2008). Although SNPs are biallelic in nature, which could
make them less informative, their abundance overcomes this difficulty (Jehan
and Lakhanpaul, 2006). Their usefulness has attracted scientists’ interest in
utilizing SNP markers to detect polymorphisms in many crops including major
crops such as barley (Rostoks et al., 2005), soybean (Glycine max) (Choi et
al., 2007) and also sorghum (Nelson et al., 2011).
SNPs can be identified using Expressed Sequence Tag (EST) data, arrays
analysis, amplicon resequencing, sequenced genomes, or next-generation
sequencing technologies (Ganal et al., 2009). Next-generation sequencing
has increased the chances of obtaining genome and transcriptome
sequences using the high-throughput technologies at relatively low costs. The
short reads or assembled transcripts are mapped to the reference genome
and the SNPs are then identified using different programs such as CLCBio
(http://www.clcbio.com/), TASSEL (Trait Analysis by aSSociation, Evolution
and Linkage) (Bradbury et al., 2007) and Maq (Li et al., 2008).
32
There are different methods used for SNP genotyping i.e Infinium® assays
(Gunderson, 2009), GoldenGate® (Yan et al., 2010) or TaqMan (Shen et al.,
2009). Giancola et al., (2006) conducted a study on the model crop
Arabidopsis thaliana using SNP genotyping methods Amplifluor and TaqMan.
GoldenGate has also been fully explored on different plants e.g maize (Yan et
al., 2010), soybean (Hyten et al., 2008) and barley (Close et al., 2009). The
advances in high throughput and continuously decreasing cost of sequencing
technologies led to genome-wide SNP genotyping using a fairly new method
called Genotyping-by-Sequencing (GBS) (Elshire et al., 2011).
f) Genotyping-by-Sequencing (GBS)
Genotyping-by-Sequencing is a genome wide analysis where the sequence
differences detected are used directly as markers. It is a newly developed
technique that is based on high-throughput next generation sequencing of
genomic subsets (Elshire et al., 2011). It explores the use of reduced genome
complexity for high-density SNP discovery and genotyping. It is suitable for
trait mapping in diverse populations, breeding, population studies, and
germplasm characterization. The advantages of using this system include
reduced sample handling and fewer PCR and purification steps. This
technology has been explored successfully in important cereal crops including
wheat (Poland et al., 2012), maize and barley (Elshire et al., 2011). For
example, Poland et al. (2012) developed high-density genetic maps for barley
and wheat using an enzyme approach of Genotyping-by-Sequencing.
33
GBS can be performed either through a reduced-representation called
restriction-site associated DNA (RAD) or a whole-genome resequencing
termed whole genome shotgun (WGS) approach.
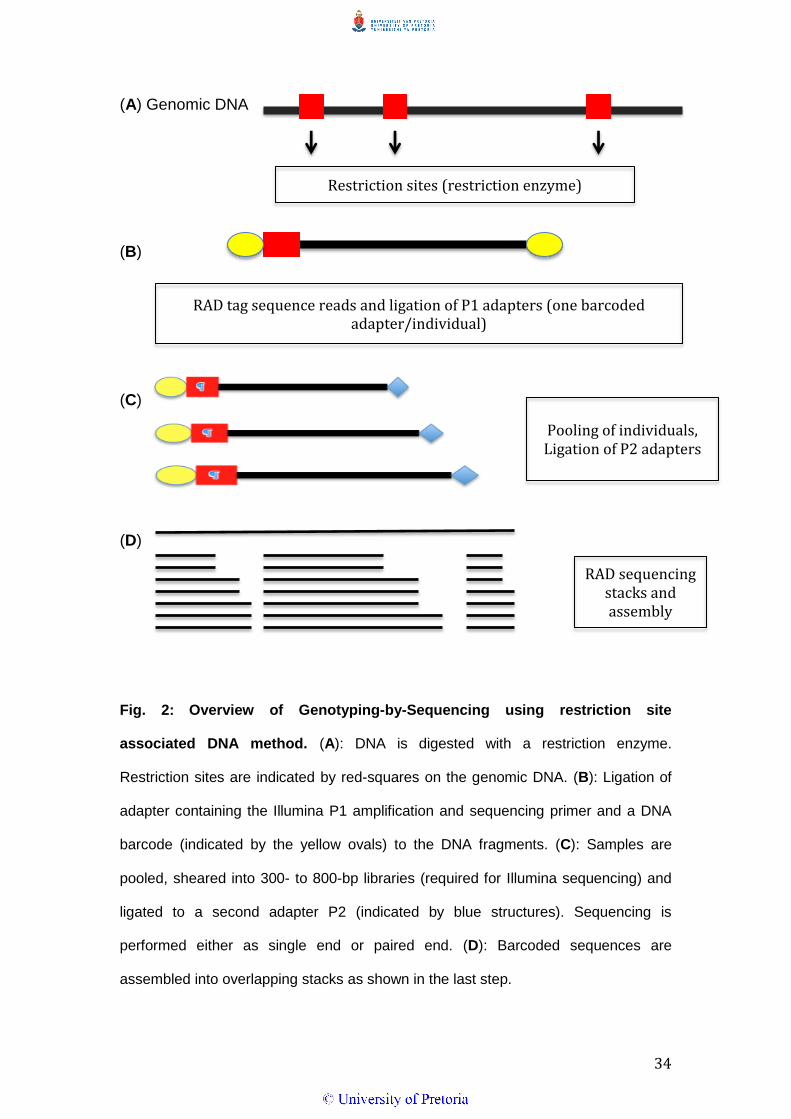
Restriction-site associated DNA (RAD)
In this method, restriction enzymes are employed to cut DNA and this allows
parallel screening of millions of DNA fragments flanking individual restriction
enzyme sites. This method permits over-sequencing of nucleotides next to the
restriction site enabling SNP detection in those areas. The number of markers
can be increased by the choice of restriction enzyme and additional enzymes
can be used to increase the number of markers further (Baird et al., 2008).
This method has been used successfully in many plants including barley
(Chutimanitsakun et al., 2011), rapeseed (Brassica napus) (Bus et al., 2012)
and eggplant (Solanum melongena L.) (Barchi et al., 2011). The RAD
sequencing approach utilizes a restriction enzyme to cut the DNA into
different sizes and thereafter sequencing adapters are ligated onto the pieces
of the DNA for sequencing (Fig. 2). All the sequences are later pooled
together, mapped and aligned simultaneously to detect variations.
34
(A) Genomic DNA
(B)
(C)
(D)
Fig. 2: Overview of Genotyping-by-Sequencing using restriction site
associated DNA method. (A): DNA is digested with a restriction enzyme.
Restriction sites are indicated by red-squares on the genomic DNA. (B): Ligation of
adapter containing the Illumina P1 amplification and sequencing primer and a DNA
barcode (indicated by the yellow ovals) to the DNA fragments. (C): Samples are
pooled, sheared into 300- to 800-bp libraries (required for Illumina sequencing) and
ligated to a second adapter P2 (indicated by blue structures). Sequencing is
performed either as single end or paired end. (D): Barcoded sequences are
assembled into overlapping stacks as shown in the last step.
Restriction sites (restriction enzyme)
RAD tag sequence reads and ligation of P1 adapters (one barcoded adapter/individual)
Pooling of individuals, Ligation of P2 adapters
RAD sequencing stacks and assembly
35
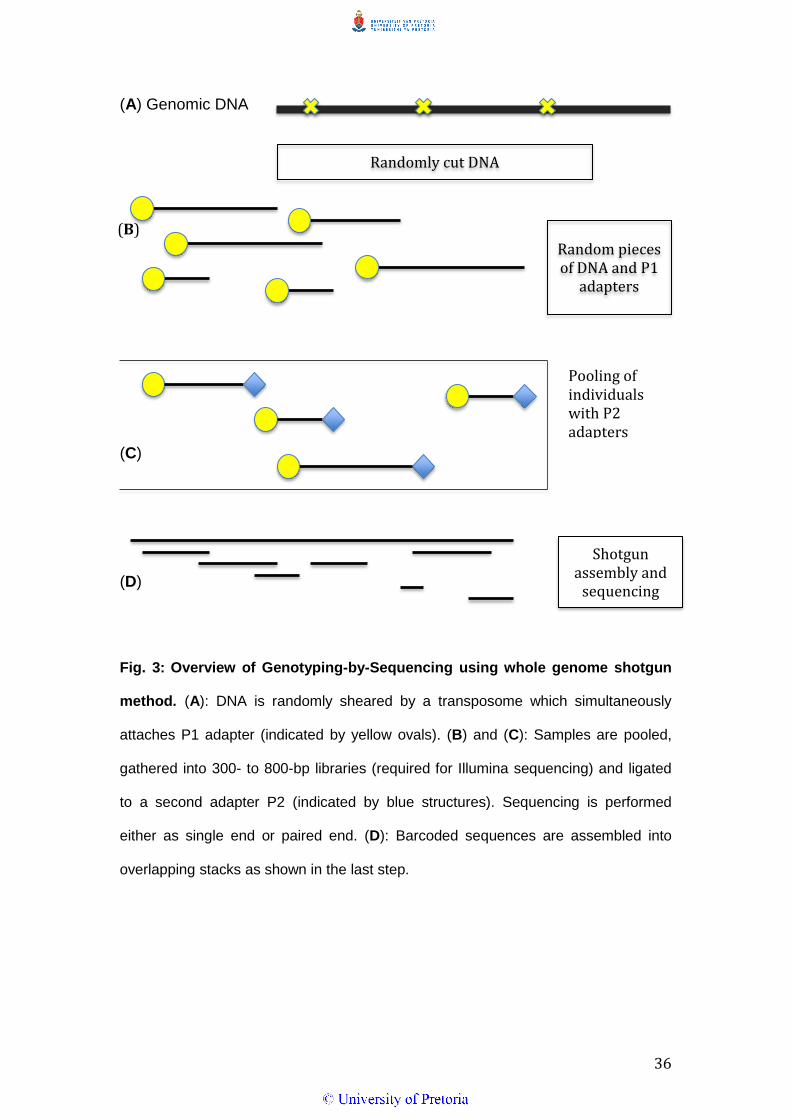
Whole genome shotgun (WGS)
This method uses random cutting of genomic DNA by sharing DNA
fragmentation or transposome, which followed by the attachment of adapters
to the ends of the DNA (Fig. 3). The adapters are used for PCR amplification
and later for sequencing. Fragmentation is then followed by size selection,
which allows for similar sizes of DNA to be obtained from a sample for
accurate sequencing and subsequent SNP discovery (Hyten et al., 2010).
Whole genome shotgun sequencing has been widely explored in microbial
populations (Venter et al., 2004), soybean (Hyten et al., 2010), and bread
wheat (Triticum aestivum) (Brenchley et al., 2012).
36
(A) Genomic DNA
(C)
(D)
Fig. 3: Overview of Genotyping-by-Sequencing using whole genome shotgun
method. (A): DNA is randomly sheared by a transposome which simultaneously
attaches P1 adapter (indicated by yellow ovals). (B) and (C): Samples are pooled,
gathered into 300- to 800-bp libraries (required for Illumina sequencing) and ligated
to a second adapter P2 (indicated by blue structures). Sequencing is performed
either as single end or paired end. (D): Barcoded sequences are assembled into
overlapping stacks as shown in the last step.
Randomly cut DNA
Random pieces of DNA and P1
adapters
Pooling of individuals with P2 adapters
Shotgun assembly and
sequencing
(B)
37
1.9 Bioinformatics analysis
Bioinformatics is a set of tools used to analyze, manipulate and store
biological data using algorithms and computational resources (Attwood et al.,
2011). The advancement in next-generation platforms has led to increased
production of sequence data. Analyzing this enormous amount of data needs
suitable bioinformatics tools. There is constant upgrading of software and
algorithms, data storage approaches, and new computer architectures to
better meet the computation requirements for NGS projects (Kumar et al.,
2012). Selecting the best suitable software for NGS data analysis includes the
following considerations; the sequencing platform used, the availability of a
reference genome, the computing and storage resources necessary, and the
bioinformatics expertise available.
Once the sequence data is generated from a sequencing platform e.g
Illumina, Roche 454 etc., appropriate software for bioinformatics analysis is
then selected. There is both commercial and noncommercial sequence
analysis software for bioinformatics analysis. The noncommercial software are
usually linux based and are often free and includes Bowtie (Langmead, 2010),
Bowtie2 (Langmead and Salzberg, 2012), BWA (Li et al., 2009), SOAP2 (Li et
al., 2009) and SOAP3 (Liu et al., 2012). For species that have no reference
genome (de novo assembly), software programs such as Velvet (Zerbino and
Birney, 2008), SOAPdenovo (Li et al., 2010) and ABySS (Simpson et al.,
2009) are widely used.
Commercially available software includes CLC-Bio (http://www.clcbio.com/)
38
and SeqMan NGen (http://www.dnastar.com/t-sub-products-genomics-
seqman-ngen.aspx). Although the programs provide a user-friendly interface,
they tend to be relatively expensive. However, they are compatible with
different operating systems and they are capable of performing multiple
downstream analyses. The major drawback is they require locally available
high computing power and have narrow customizability.
1.10 Study rationale
The increasing importance of sorghum due to the escalating need for food
and the interest in utilizing the crop as a biofuel feedstock, has led to
molecular research towards improving traits of interest in the crop. Although
much has been achieved in sorghum improvement using traditional or
conventional breeding, sorghum development still lags behind those of major
cereals such as maize, rice and wheat. If sorghum is to contribute
successfully to food security and as a source of alternative energy, it is
important to enhance its breeding resources.
Maize and sugarcane are two major crops currently grown for both food
production and as preferred sources as feedstock for the production of
biofuel. The increased use of maize in particular, as an alternative source of
bioethanol, has raised concerns as it threatens food security in the country. In
South Africa alone, maize is a major staple food source with an average
South African family feeding on maize or maize-related product at least once
a day. Intensifying its use for bioethanol production is therefore likely to
compromise its food security role. Sugarcane, on the other hand, is produced
39
under intensive production systems, requires a lot of water and takes 12 to 18
months to mature, in contrast to sorghum which only requires up to 4 months
to mature. The effects of climate change, for example, the increasing water
scarcity due to erratic rainfall patterns discourage cultivating water intensive
plants like sugarcane.
Recent advances in biotechnology and molecular breeding promise to
facilitate the breeding progress through the use of cutting edge technologies,
equipments and tools. Genetic linkage mapping is an example of a
biotechnology tool that is considered valuable in pre-breeding but has not
been fully exploited for the improvement of sorghum in SA. Global research
efforts over the last decade have resulted in the complete genome
sequencing of sorghum (Paterson et al., 2009). Molecular markers have been
particularly used in sorghum for localizing both quantitative and qualitative
traits of interest (Deu et al., 2005; Nagaraj et al., 2005; Srinivas et al., 2009;
Yu et al., 2009). Such molecular advances, however, have not been
implemented within the breeding program initiated at the Agricultural
Research Council (ARC), South Africa.
Selection of sorghum traits at the ARC has been achieved using
morphological means resulting in slow cultivar development. An efficient
protocol to genotype sorghum is crucial to help understand the genetic make-
up of sorghum and eventually the production of a grain/sweet stem sorghum.
This dual-purpose sorghum will ideally be a plant with sweet-stem to be used
for biofuels and enough grains to be used for food. To enhance the value of
40
the most recent linkage map of sorghum, there is a need to further saturate it
with recent and more informative molecular markers such as SNPs. There is
also need to study new state-of-the-art technologies and discover effective
genotyping methods in sorghum. Effective genotyping will play a vital role in
future marker-assisted selection and breeding of the crop.
The current work aimed at investigating the applicability of Genotyping-by-
Sequencing techniques in a sorghum mapping population generated between
sweet stem and grain sorghum parents. The outcome of this work is expected
to contribute significantly towards more efficient cultivar selection in the future
at the ARC and in other sorghum breeding programs elsewhere. A reliable
and efficient genotyping protocol is crucial for studying and understanding the
genetics and genomics of sorghum.
1.11 Aim:
To explore Genotyping-by-Sequencing (GBS) methods and establish an
efficient protocol for genotyping in a sorghum mapping population, by
identifying variants (SNPs and INDELs) in sorghum parental lines and the
progeny.
Objectives:
• Develop a robust set of molecular markers (SNPs) for genetic
characterization in F8 sorghum RILs using Whole Genome Shotgun
(WGS) and Restriction-site Associated DNA (RAD) methods.
• Assess and compare the WGS and RAD sequencing approaches.
• List variants from the parental lines for future mapping studies.
41
CHAPTER 2: Materials and methods
2.1 Experimental Design
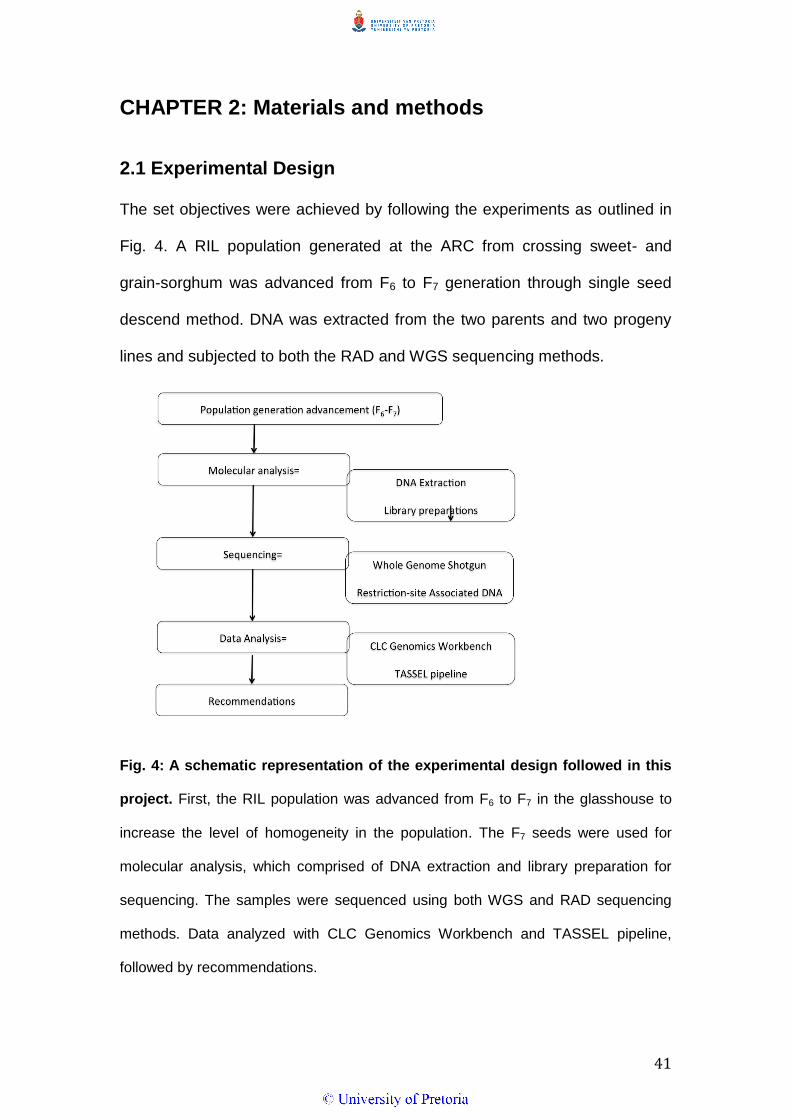
The set objectives were achieved by following the experiments as outlined in
Fig. 4. A RIL population generated at the ARC from crossing sweet- and
grain-sorghum was advanced from F6 to F7 generation through single seed
descend method. DNA was extracted from the two parents and two progeny
lines and subjected to both the RAD and WGS sequencing methods.
Fig. 4: A schematic representation of the experimental design followed in this
project. First, the RIL population was advanced from F6 to F7 in the glasshouse to
increase the level of homogeneity in the population. The F7 seeds were used for
molecular analysis, which comprised of DNA extraction and library preparation for
sequencing. The samples were sequenced using both WGS and RAD sequencing
methods. Data analyzed with CLC Genomics Workbench and TASSEL pipeline,
followed by recommendations.
42
2.2 Plant material:
Two parental lines SS79 (sweet sorghum) and M71 (grain sorghum) were
crossed to generate a 187 Recombinant Inbred Lines (RILs) mapping
population. This mapping population was developed at the Agricultural
Research Council (ARC) Grain Crops Institute, Potchefstroom, South Africa.
The female parent (SS79) was collected from a traditional farmer in Limpopo
province (South Africa). It has long internodes and is approximately 300 cm
tall, and has thin but sweet juicy stalks. The male parent (M71) originates from
ICRISAT-Bulawayo in Zimbabwe bred under Sorghum and Millet
improvement program. It is characterized by early maturity and high grain
yield, with white grains. It has short internodes and is approximately 140 cm
tall, has juicy stems but the juice is not sweet.
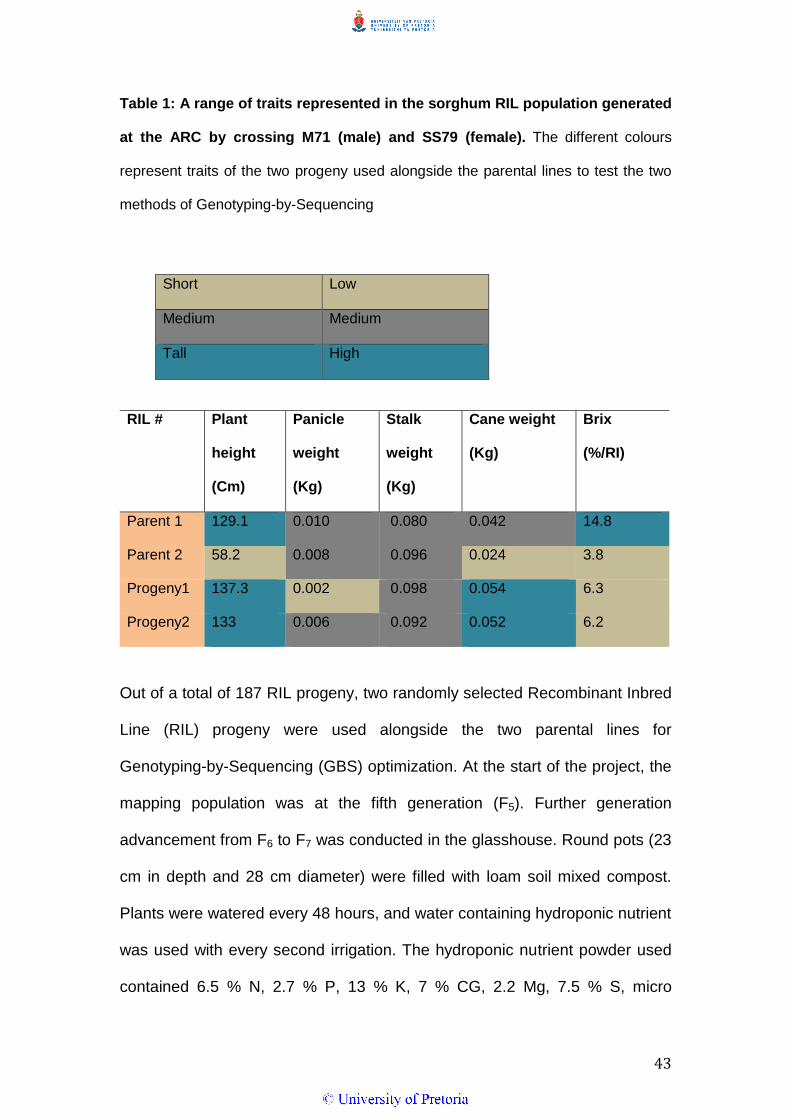
The traits of the two parents and the two selected progeny are shown in table
1. The traits includes panicle weight, plant height, stalk weight, Brix and cane
weight. A clear presentation of all traits represented by different colours in
table 1.
43
Table 1: A range of traits represented in the sorghum RIL population generated
at the ARC by crossing M71 (male) and SS79 (female). The different colours
represent traits of the two progeny used alongside the parental lines to test the two
methods of Genotyping-by-Sequencing
RIL #
Plant
height
(Cm)
Panicle
weight
(Kg)
Stalk
weight
(Kg)
Cane weight
(Kg)
Brix
(%/RI)
Parent 1 129.1 0.010 0.080 0.042 14.8
Parent 2 58.2 0.008 0.096 0.024 3.8
Progeny1 137.3 0.002 0.098 0.054 6.3
Progeny2 133 0.006 0.092 0.052 6.2
Out of a total of 187 RIL progeny, two randomly selected Recombinant Inbred
Line (RIL) progeny were used alongside the two parental lines for
Genotyping-by-Sequencing (GBS) optimization. At the start of the project, the
mapping population was at the fifth generation (F5). Further generation
advancement from F6 to F7 was conducted in the glasshouse. Round pots (23
cm in depth and 28 cm diameter) were filled with loam soil mixed compost.
Plants were watered every 48 hours, and water containing hydroponic nutrient
was used with every second irrigation. The hydroponic nutrient powder used
contained 6.5 % N, 2.7 % P, 13 % K, 7 % CG, 2.2 Mg, 7.5 % S, micro
Short Low
Medium Medium
Tall High
44
elements 0.15 % Fe, 0.024 % Mn, 0.024 % B, 0.005 % Zn, 0.002 % Cu, 0.001
% Mo. Three level table spoons (~10 g) were dissolved in five litres of water,
stirred well and poured onto the plants. The temperature was controlled, with
a minimum of 18 0C and maximum of 30 0C. Insects were controlled by
spraying an insecticide Hunter spray (Cyanamid, Northern Cape, South
Africa) once a week, and two ml of the insecticide was added to one litre of
water. To avoid cross-pollination, plant heads were covered with a bag for two
to three weeks to ensure self-fertilization.
2.3 General protocols
DNA extraction protocol
DNA extraction was performed from one-week-old sorghum leaves using
standard protocol of plant DNA extraction (Macherey-Nagel®, Düren,
Germany). The plant samples were homogenized using mechanical
treatment, and then DNA extracted using a CTAB (Cetyl trimethylammonium
bromide) based procedure designed and optimized in the kit. The DNA was
bound to a silica membrane and contaminants washed away using wash
buffers. Finally DNA was eluted using low salt elution buffer and stored at 4
0C. The DNA was visualized by staining with ethidium bromide following
electrophoresis through 0.8 % agarose gel, and illumination with UV. DNA
concentration was measured fluormetrically using a Qubit flourometer
(Invitrogen®, Oregon, USA).
45
PCR protocol
The DNA was amplified by using PCR primer cocktail (Illumina, San Diego,
USA), Nextera PCR master mix (Illumina, San Diego, USA), and index 1
primers and index primers 2 were also added to the reaction (Illumina, San
Diego, USA). The thermal cycler (Applied Biosystems, Foster City, USA) was
used for PCR amplification and conditions were set as follows: initiation step
(98 0C for 30 seconds), followed by denaturation (98 0C for 10 seconds),
annealing step (60 0C for 30 seconds), extension (72 0C for 30 seconds), and
then final elongation step (72 0C for five minutes). The DNA products were
then stored at 4 0C.
Gel electrophoresis protocol
A 1 % agarose gel was prepared by 1 g of agarose powder added into 500 ml
flask, together with 100 ml of TAE buffer. Then 5 μl of ethidium bromide was
added to the solution. The solution was poured in the casting tray where the
gel combs were set and the gel was allowed to cool until it was solid. The
samples were loaded onto the gel by adding 5 μl of 6X loading dye to each 2
μl DNA. Then 5 μl of the DNA ladder standard was added into at least one
well of each row on the gel. The samples were electrophoried 10 volts per cm.
Gels were then photographed with a Bio-Rad Gel Doc 1000 system (Bio-Rad
Laboratories).
46
2.4 Library Preparation
2.4.1 Whole Genome Shotgun sequencing
The sequencing library was prepared following the Nextera protocol (Illumina,
San Diego, USA). The Nextera protocol uses a transposome to fragment DNA
while simultaneously tagging the DNA with Illumina sequencing primer sites to
be used during PCR. A total of 1 μg genomic DNA of each of the two parents
and the two-selected recombinant inbred lines was exposed to the
transposome. A total reaction volume of 50 μl was prepared consisting of 5 μl
of Nextera tagment DNA enzyme (Illumina, San Diego, USA) and 25 μl
tagment DNA buffer (Illumina, San Diego, USA) and 1 μg of DNA template
made to a final volume of 50 μl. It was incubated for five minutes at 55 0C and
was followed by DNA purification using Qiaquick spin columns (QIAGEN,
Valencia, CA) to remove the small DNA pieces. A total of 25 μl was eluted
from the column. Thereafter nine cycles of PCR were performed in a total
reaction of 50 μl and the PCR products were cleaned using the QIAquick PCR
purification kit (QIAGEN, Valencia, CA). The PCR amplified the tagmented
DNA fragments and also added specific adapters and bar codes to the
sequencing library for sample identification. The index N702 (CTAGTACG)
and N704 (GCTCAGGA) were used for Parent 1 and Parent 2 respectively.
The DNA fragments were then size selected for sequencing. Since the
Illumina HiScanSQ, which sequences 100 bp in each direction was to be
used, it was ideal to select DNA fragments from 400 to 500 bp (including the
~120-bp adaptor) for paired-end sequencing technology. The DNA fragments
were separated on a 1.0 % agarose gel, using the 1 kb ladder as reference.
47
Four hundred to 500 bp size fragments were cut from the agarose gel using
gel-excision tip, and then purified using a MiniElute gel extraction kit
(QIAGEN, Valencia, CA). Libraries were normalized to 2 nM, denatured using
0.1 M of NaOH and diluted with 10 pM hybridization buffer (HT1). Individual
samples (600 μl of library) were sequenced on separate lanes of an Illumina
HiScanSQ DNA sequencer (Illumina, San Diego, USA). DNA templates were
added to the C-bot (Illumina, San Diego, USA) for cluster generation followed
by hybridization of the clusters. Sequencing by synthesis (SBS) technology
was used, which uses four fluorescently-labeled nucleotides to sequence the
tens of millions of clusters on the flow cell surface in parallel. During each
sequencing cycle, a single labeled deoxynucleoside triphosphate (dNTP) is
added to the nucleic acid chain. The nucleotide label serves as a terminator
for polymerization, so after each dNTP incorporation, the fluorescent dye is
imaged to identify the base and then enzymatically cleaved to allow
incorporation of the next nucleotide. Base calls are made directly from signal
intensity measurements during each cycle, reducing raw error rates compared
to other technologies. The sequencer generated BCL files, then CASAVA
(Illumina, San Diego, USA) was used to convert the files into fastq files and
bin the sequences based on the indexing. All of these experiments were
performed at the Agricultural Research Council-Biotechnology Platform
(South Africa).
48
2.4.2 Restriction-site Associated DNA (RAD) sequencing
Optimum digestion of genomic DNA with restriction enzyme AluI was initially
determined using different incubation times and enzyme concentrations. The
reaction tube contained 2 μg DNA, 2 units of AluI enzyme, 10X FastDigest
buffer (2 μl) (Fermentas, Inqaba, Pretoria, South Africa) and nuclease free
water, in a total reaction volume of 50 μl. Then 10 μl aliquots were taken into
a new tube after deactivating the reaction by incubating at 65 0C 20 minutes.
Aliquots were taken at 15 minutes, 60 minutes, four hours and eight hours
and stored at 4 0C. The DNA digestions were analyzed by electrophoresis.
The optimized digestion time and DNA concentration was selected for the
remaining experiments. A total of 2 μg of DNA from parents and selected
progeny was digested for 60 minutes at 37 0C. The enzyme activity was then
inactivated with a 65 0C incubation of the samples for 20 minutes. The
digested DNA were separated on gel and then purified using MiniElute gel
extraction kit (QIAGEN, Valencia, CA). DNA was bound to silica membrane
and the contaminants washed away with a buffer. The DNA was then eluted
using low salt elution buffer and concentration determined using Qubit
instrument (Invitrogen®, Oregon, USA).
The 3’ ends of the digested DNA were adenylated to prevent self-ligation by
adding the A-tailing mix (Illumina, San Diego, USA) and incubating at 37 0C
for 30 minutes. A ligation reaction was carried out at 30 0C for 20 minutes, to
repair any double strand breaks of DNA. Sample purification to remove the
small DNA fragments (less than 100 base pairs) was done using Qiaquick
spin columns (QIAGEN, Valencia, CA). DNA fragments ranging in size from
49
600 bp to 800 bp (including the ~120-bp adaptor) were analyzed by
electrophoresis on agarose gel and recovered from the gel and prepared for
sequencing. The Illumina Miseq, which sequences up to 250 bp in each
direction, was the chosen sequencing platform. The adapter/indexes were
Parent 1 (ATCACG), Parent 2 (TTAGGC), Progeny 1 (ACTTGA) and Progeny
2 (GATCAG). The DNA fragments were separated on a 1.0 % agarose gel
containing 0.04 μl/mL ethidium bromide in 1 X TAE electrophoresis buffer
using the 1kb ladder as size reference (Fermentas, Inqaba, Pretoria, South
Africa). Fragments were purified using a MiniElute gel extraction kit (QIAGEN,
Valencia, CA). Libraries were normalized to 2 nM by either diluting or
concentrating depending on the template, then denatured by 0.2 M NaOH and
diluted with 8 pM HT1. Then 600 μl of sample was loaded on the Illumina
Miseq sequencer. The Illumina Miseq uses a sequencing by synthesis method
described for the Illumina HiScan instrument and the sequence data was
produced within eight hours. Raw data was obtained from the machine within
24 hours.
2.5 Data analysis and SNP identification
2.5.1 CLC Genomics Workbench
The raw data was imported into the CLC Genomics Workbench software
(http://www.clcbio.com) and filtered for quality. The data quality control
assesses and visualizes statistics on quality scores, sequence-read lengths
and base-coverages. The over-represented sequences and hints suggesting
contamination events and nucleotide-contributions and base-ambiguities are
50
checked. The data quality check was followed by adapter trimming, quality
trimming and length trimming. Reads were then mapped onto the sorghum
genome (www.phytozome.net) with allowance of two mismatches and the
non-specific sequences were ignored. Probabilistic Variant Caller was used to
call variants as it can detect variants in a wide variety of data sets with a high
sensitivity and specificity. The non-specific and broken pairs were ignored in
the variant calling. A minimum coverage of ten was used for the WGS and
four for the RAD in calling of variants, with the 90.0 variant probability. Once
the variations are detected the table files are exported into Excel where it was
easier to perform SNP and INDEL counting and filtering. A diagram of the
steps followed is outlined on the figure below (Fig.5).
51
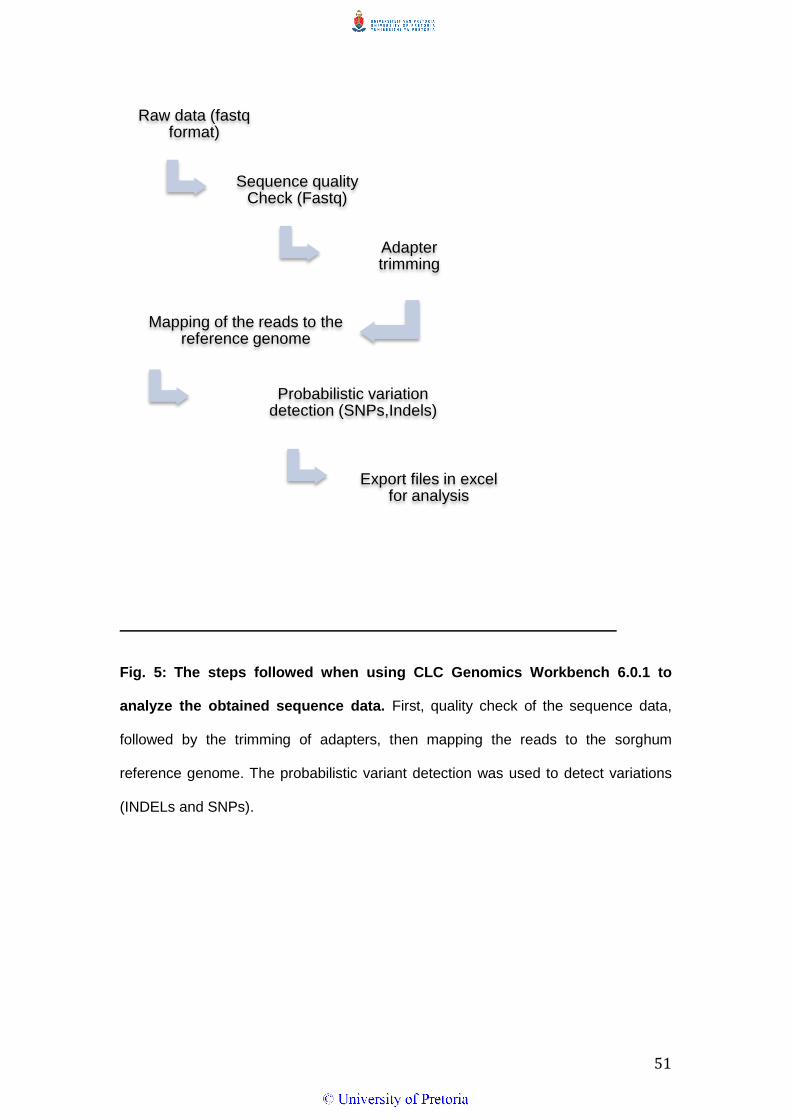
Fig. 5: The steps followed when using CLC Genomics Workbench 6.0.1 to
analyze the obtained sequence data. First, quality check of the sequence data,
followed by the trimming of adapters, then mapping the reads to the sorghum
reference genome. The probabilistic variant detection was used to detect variations
(INDELs and SNPs).
Raw data (fastq format)
Sequence quality Check (Fastq)
Adapter trimming
Mapping of the reads to the reference genome
Probabilistic variation detection (SNPs,Indels)
Export files in excel for analysis
52
2.5.2 TASSEL (Trait Analysis by Association Evolution and Linkage)
pipeline
The TASSEL pipeline, implemented in perl programming language, was used
for the processing of the sequence read data. The steps involved in the
pipeline were executed in separate scripts. The pipeline uses different publicly
available software tools i.e Fastq-mcf (http://code.google.com/p/ea-
utils/wiki/FastqMcf), Bowtie2 (Langmead and Salzberg, 2012), SAMtools (Li et
al., 2009), BCFtools (Xu et al., 2012) (Fig. 6). The first step involved the
quality check and trimming of adapters using Fastq-mcf. Fastq-mcf detects
and removes sequencing adapters and primer from the raw sequencing data.
Fastq-mcf then removes the poor quality reads (the reads that contain N’s)
and discard sequences that are too short (less than 50 bp). The reads were
then mapped to the sorghum reference genome using Bowtie2. Bowtie2 is
suitable for aligning long genomes and supports paired-end alignment modes.
SAMtools was then used to view, sort and index the sequences thereof.
Bcftools was then used to call for variations (SPNs and Indels). The raw SNPs
that were obtained were then filtered using VCFtools based quality score of
30. The steps followed are outlined in the figure below (Fig. 6).
53
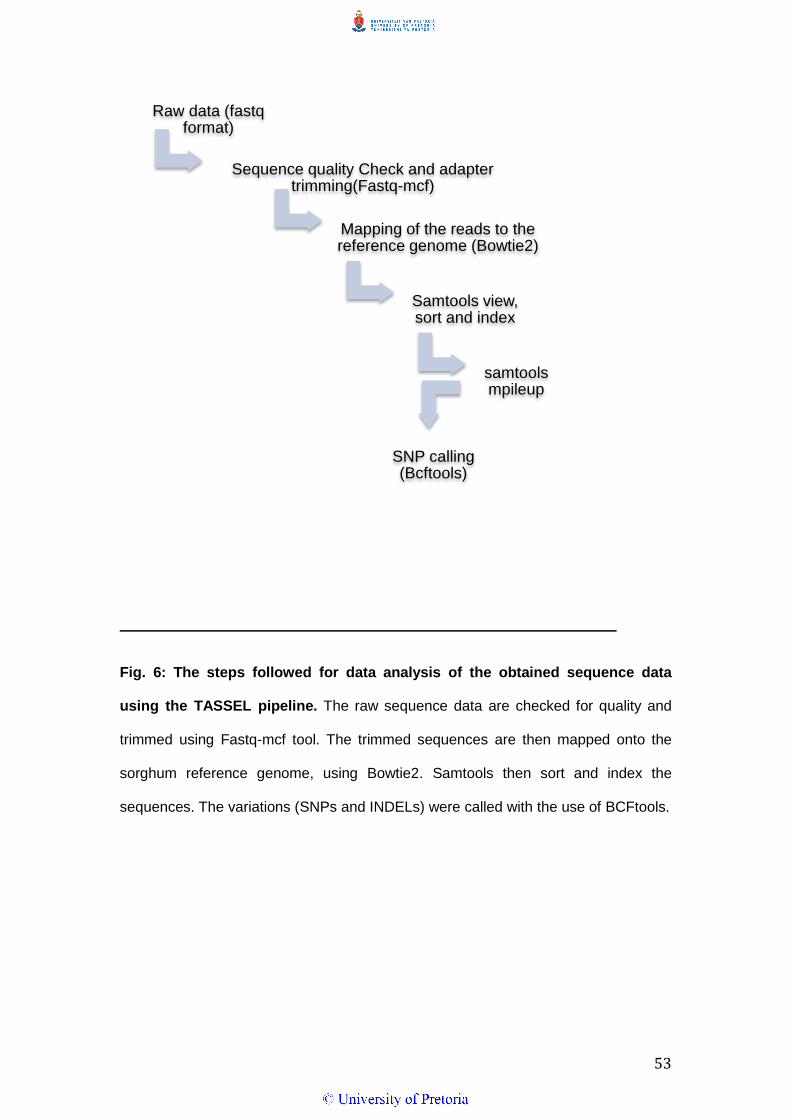
Fig. 6: The steps followed for data analysis of the obtained sequence data
using the TASSEL pipeline. The raw sequence data are checked for quality and
trimmed using Fastq-mcf tool. The trimmed sequences are then mapped onto the
sorghum reference genome, using Bowtie2. Samtools then sort and index the
sequences. The variations (SNPs and INDELs) were called with the use of BCFtools.
Raw data (fastq format)
Sequence quality Check and adapter trimming(Fastq-mcf)
Mapping of the reads to the reference genome (Bowtie2)
Samtools view, sort and index
samtools mpileup
SNP calling (Bcftools)
54
CHAPTER 3: Results
Genotyping-by-Sequencing (GBS) allows for portions of the genome to be
sequenced and compared between different individuals and is not reliant on
any previous genomic information. The selected four individuals (2 parents
and 2 progeny) were sequenced using two methods of GBS (WGS and RAD).
The sequence data was analyzed using CLC Genomics Workbench and
TASSEL pipeline and this was followed by recommendation of the best GBS
method and best data analysis method.
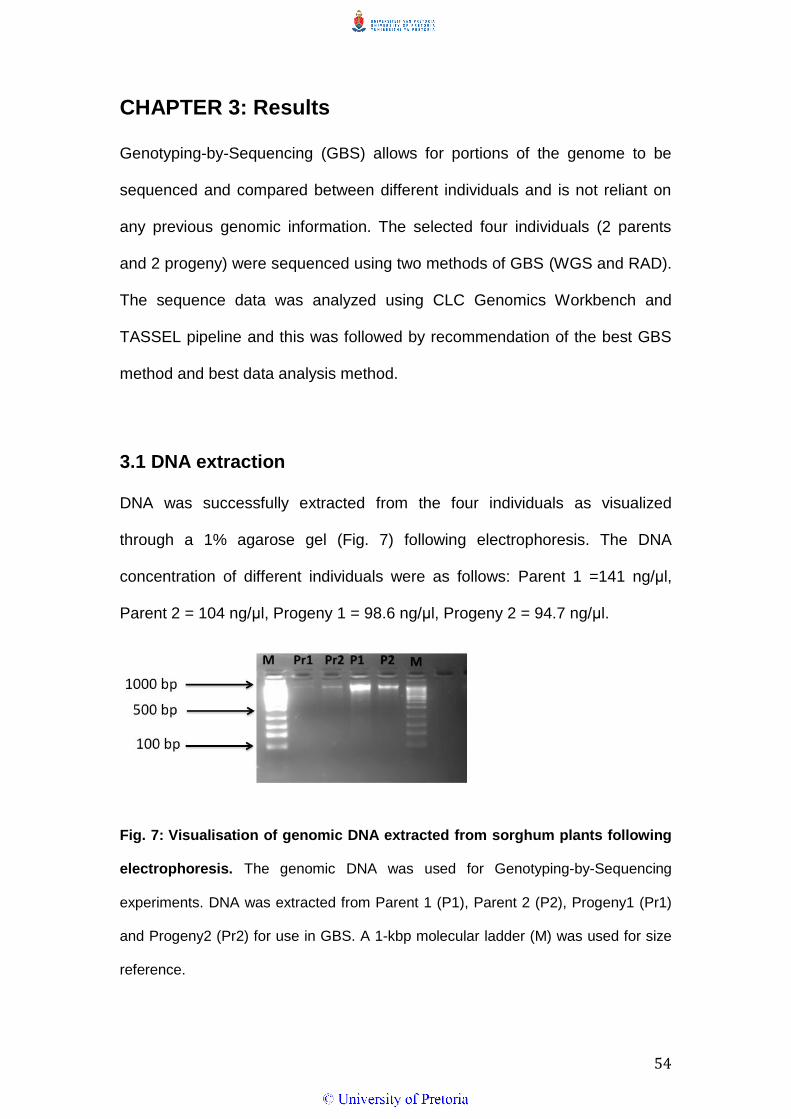
3.1 DNA extraction
DNA was successfully extracted from the four individuals as visualized
through a 1% agarose gel (Fig. 7) following electrophoresis. The DNA
concentration of different individuals were as follows: Parent 1 =141 ng/μl,
Parent 2 = 104 ng/μl, Progeny 1 = 98.6 ng/μl, Progeny 2 = 94.7 ng/μl.
Fig. 7: Visualisation of genomic DNA extracted from sorghum plants following
electrophoresis. The genomic DNA was used for Genotyping-by-Sequencing
experiments. DNA was extracted from Parent 1 (P1), Parent 2 (P2), Progeny1 (Pr1)
and Progeny2 (Pr2) for use in GBS. A 1-kbp molecular ladder (M) was used for size
reference.
55
3.2 Library preparation
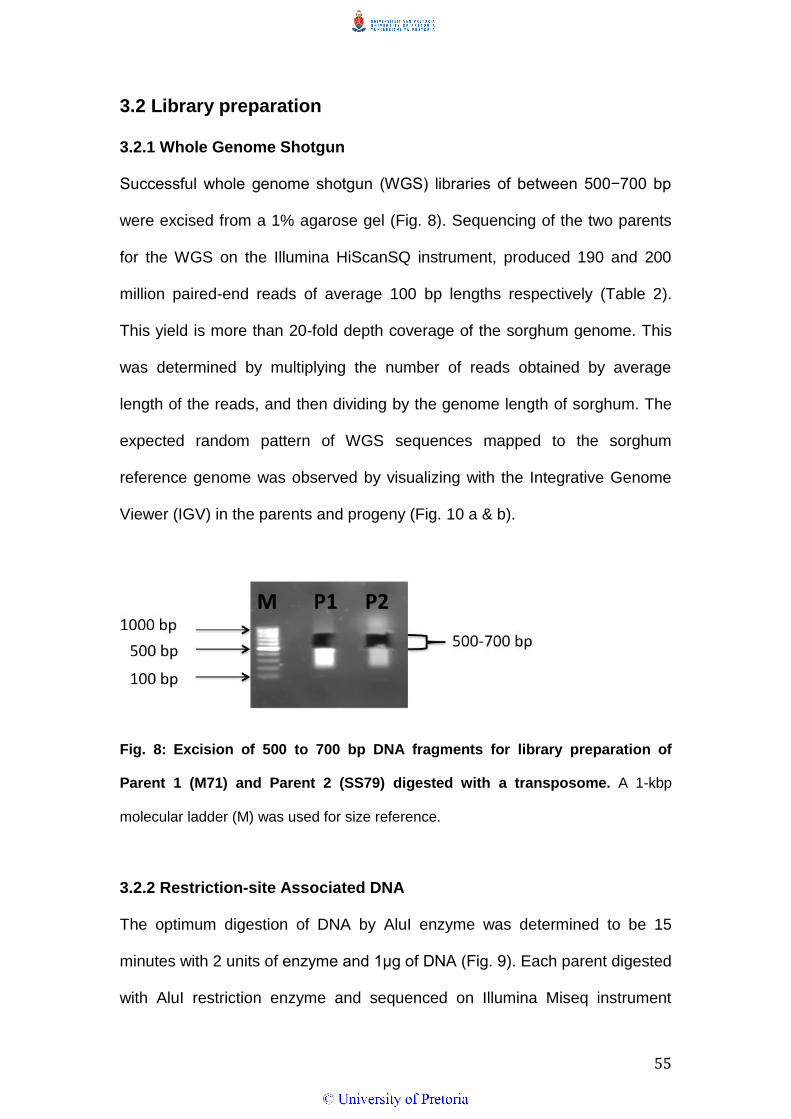
3.2.1 Whole Genome Shotgun
Successful whole genome shotgun (WGS) libraries of between 500−700 bp
were excised from a 1% agarose gel (Fig. 8). Sequencing of the two parents
for the WGS on the Illumina HiScanSQ instrument, produced 190 and 200
million paired-end reads of average 100 bp lengths respectively (Table 2).
This yield is more than 20-fold depth coverage of the sorghum genome. This
was determined by multiplying the number of reads obtained by average
length of the reads, and then dividing by the genome length of sorghum. The
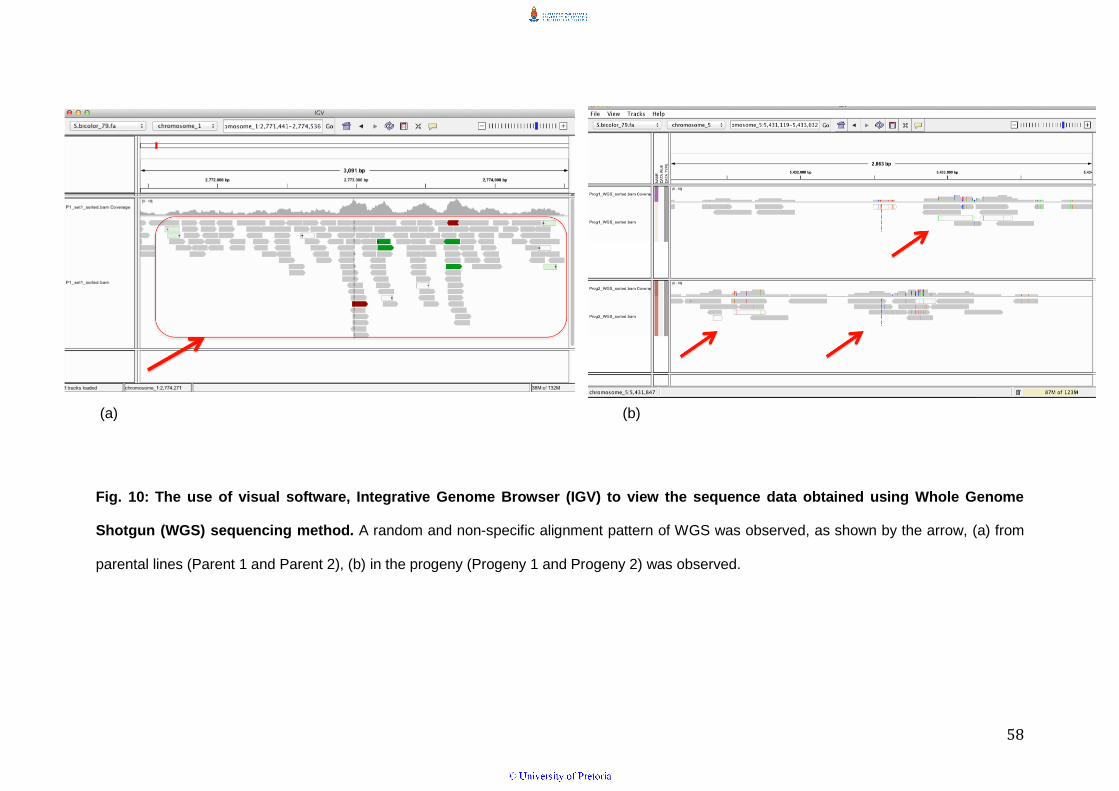
expected random pattern of WGS sequences mapped to the sorghum
reference genome was observed by visualizing with the Integrative Genome
Viewer (IGV) in the parents and progeny (Fig. 10 a & b).
Fig. 8: Excision of 500 to 700 bp DNA fragments for library preparation of
Parent 1 (M71) and Parent 2 (SS79) digested with a transposome. A 1-kbp
molecular ladder (M) was used for size reference.
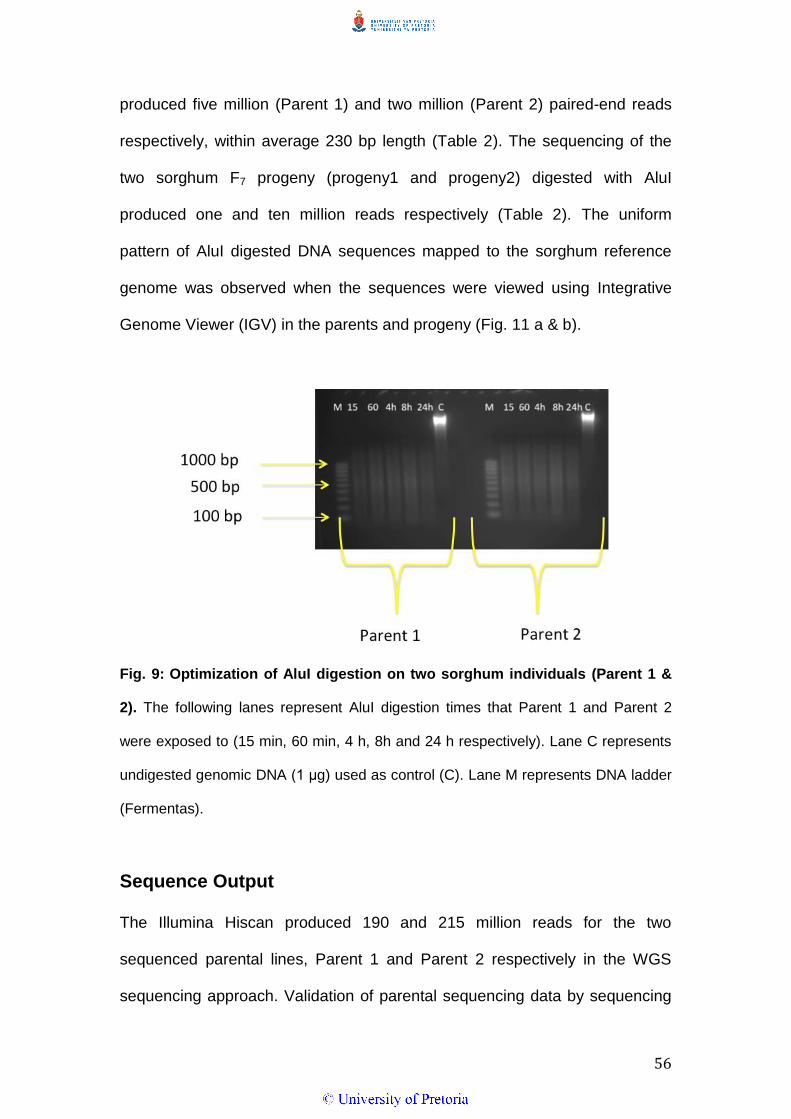
3.2.2 Restriction-site Associated DNA
The optimum digestion of DNA by AluI enzyme was determined to be 15
minutes with 2 units of enzyme and 1μg of DNA (Fig. 9). Each parent digested
with AluI restriction enzyme and sequenced on Illumina Miseq instrument
56
produced five million (Parent 1) and two million (Parent 2) paired-end reads
respectively, within average 230 bp length (Table 2). The sequencing of the
two sorghum F7 progeny (progeny1 and progeny2) digested with AluI
produced one and ten million reads respectively (Table 2). The uniform
pattern of AluI digested DNA sequences mapped to the sorghum reference
genome was observed when the sequences were viewed using Integrative
Genome Viewer (IGV) in the parents and progeny (Fig. 11 a & b).
Fig. 9: Optimization of AluI digestion on two sorghum individuals (Parent 1 &
2). The following lanes represent AluI digestion times that Parent 1 and Parent 2
were exposed to (15 min, 60 min, 4 h, 8h and 24 h respectively). Lane C represents
undigested genomic DNA (1 μg) used as control (C). Lane M represents DNA ladder
(Fermentas).
Sequence Output
The Illumina Hiscan produced 190 and 215 million reads for the two
sequenced parental lines, Parent 1 and Parent 2 respectively in the WGS
sequencing approach. Validation of parental sequencing data by sequencing
57
two F7 progeny generated more than 200 million reads for the two sequenced
progeny in WGS. The Illimuna Miseq generated five million reads from Parent
1 and two million reads from Parent 2 using the RAD sequencing approach.
The progeny generated over a million sequences for each prior any
processing in RAD (Table 2).
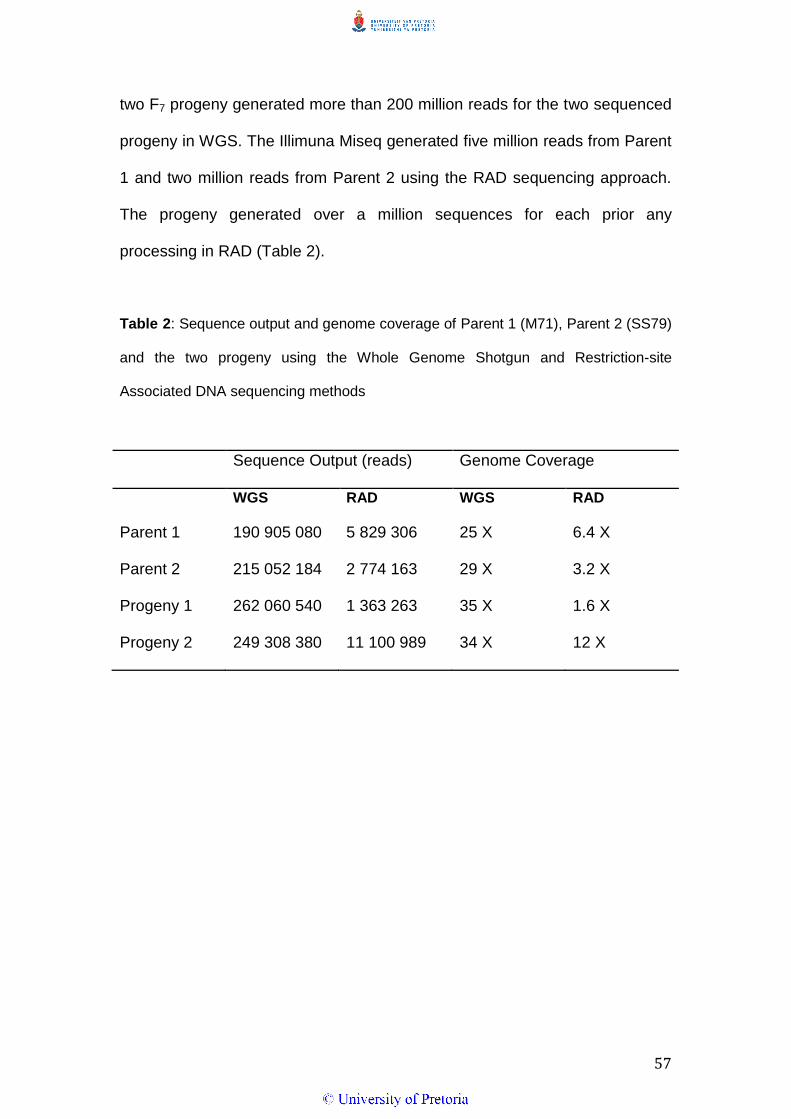
Table 2: Sequence output and genome coverage of Parent 1 (M71), Parent 2 (SS79)
and the two progeny using the Whole Genome Shotgun and Restriction-site
Associated DNA sequencing methods
Sequence Output (reads) Genome Coverage
WGS RAD WGS RAD
Parent 1 190 905 080 5 829 306 25 X 6.4 X
Parent 2 215 052 184 2 774 163 29 X 3.2 X
Progeny 1 262 060 540 1 363 263 35 X 1.6 X
Progeny 2 249 308 380 11 100 989 34 X 12 X
58
(a) (b)
Fig. 10: The use of visual software, Integrative Genome Browser (IGV) to view the sequence data obtained using Whole Genome
Shotgun (WGS) sequencing method. A random and non-specific alignment pattern of WGS was observed, as shown by the arrow, (a) from
parental lines (Parent 1 and Parent 2), (b) in the progeny (Progeny 1 and Progeny 2) was observed.
59
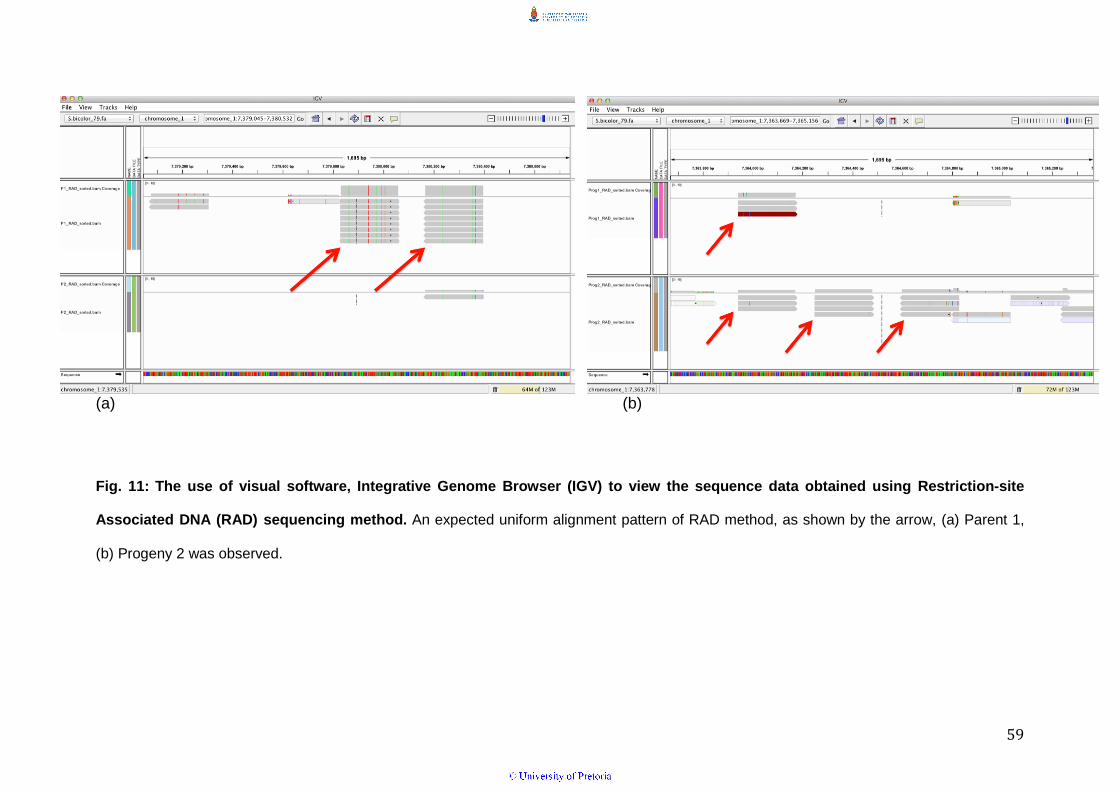
(a) (b)
Fig. 11: The use of visual software, Integrative Genome Browser (IGV) to view the sequence data obtained using Restriction-site
Associated DNA (RAD) sequencing method. An expected uniform alignment pattern of RAD method, as shown by the arrow, (a) Parent 1,
(b) Progeny 2 was observed.
60
3.3 Sequence assembly
(a) CLC Genomics Workbench
After de-multiplexing all libraries and counting the number of reads assigned
to each sample, the CLC Genomics Workbench quality report was created for
all the individuals (Parent 1, Parent 1, Progeny 1 and Progeny 2). The report
revealed the average length of the raw sequences as 100 bp. There were no
ambiguous bases and the sequence duplication levels were less than 10%.
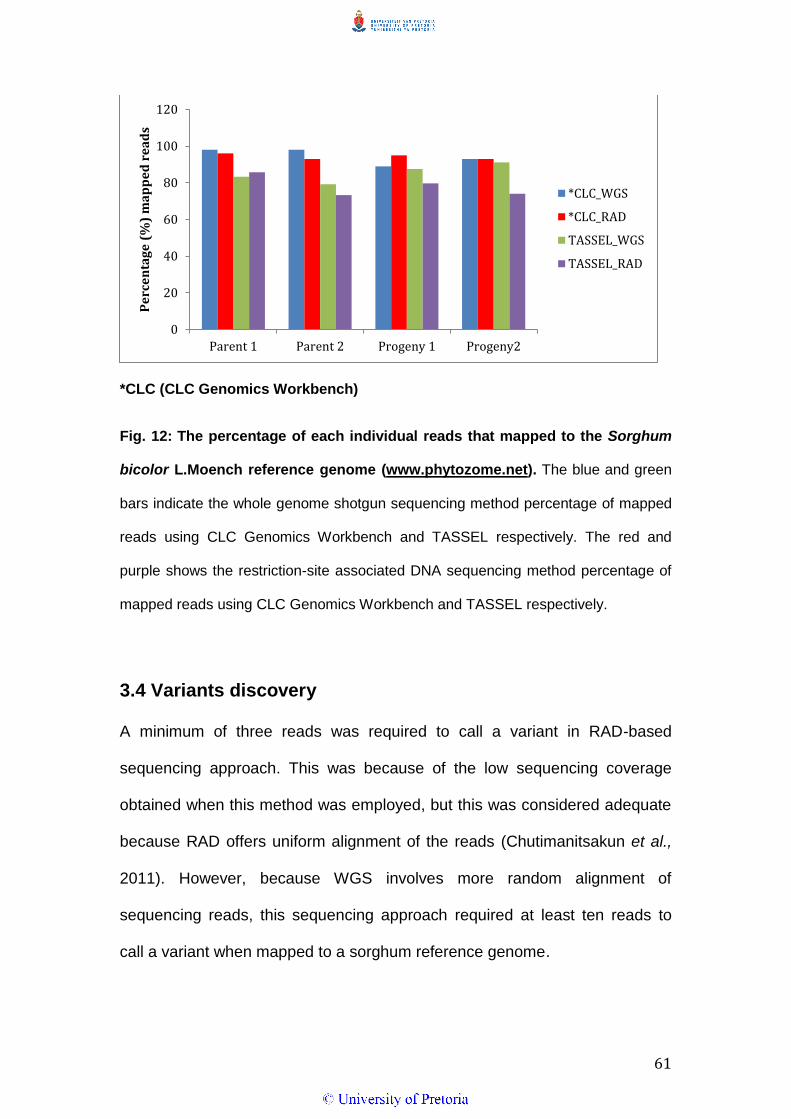
The trimming of low quality sequences and the sequencing adapters removed
2% of the total sequence reads from the two parents in WGS and less than
1% in RAD. The remaining reads (100 bp length) were mapped to the
sorghum reference genome. Both parents in WGS had the highest mapping
percentage compared to the progeny, whilst in RAD; Parent 1 had the highest
mapping percentage of all individuals (Fig. 12).
(b) TASSEL pipeline
The quality check and trimming of adapters removed between 2,5% and
17.9% of the total sequence reads in WGS and less than 1% of the reads
after the de-multiplexing in RAD. The remaining reads of average 100 bp
were mapped to the reference genome using Bowtie2. The mapping
percentage was more than 70% in all the individuals with both the WGS and
the RAD sequencing approaches (Fig. 12).
61
*CLC (CLC Genomics Workbench)
Fig. 12: The percentage of each individual reads that mapped to the Sorghum
bicolor L.Moench reference genome (www.phytozome.net). The blue and green
bars indicate the whole genome shotgun sequencing method percentage of mapped
reads using CLC Genomics Workbench and TASSEL respectively. The red and
purple shows the restriction-site associated DNA sequencing method percentage of
mapped reads using CLC Genomics Workbench and TASSEL respectively.
3.4 Variants discovery
A minimum of three reads was required to call a variant in RAD-based
sequencing approach. This was because of the low sequencing coverage
obtained when this method was employed, but this was considered adequate
because RAD offers uniform alignment of the reads (Chutimanitsakun et al.,
2011). However, because WGS involves more random alignment of
sequencing reads, this sequencing approach required at least ten reads to
call a variant when mapped to a sorghum reference genome.
0
20
40
60
80
100
120
Parent 1 Parent 2 Progeny 1 Progeny2
Pe
rce
nta
ge
(%
) m
ap
pe
d r
ea
ds
*CLC_WGS
*CLC_RAD
TASSEL_WGS
TASSEL_RAD
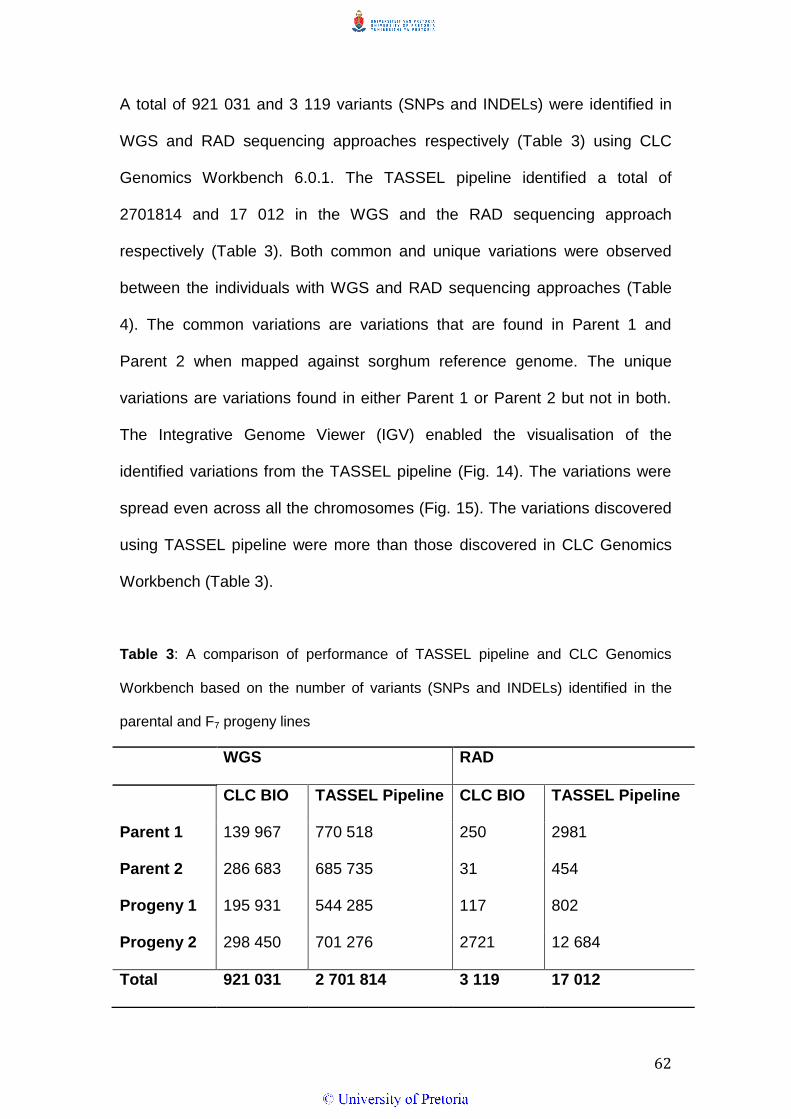
62
A total of 921 031 and 3 119 variants (SNPs and INDELs) were identified in
WGS and RAD sequencing approaches respectively (Table 3) using CLC
Genomics Workbench 6.0.1. The TASSEL pipeline identified a total of
2701814 and 17 012 in the WGS and the RAD sequencing approach
respectively (Table 3). Both common and unique variations were observed
between the individuals with WGS and RAD sequencing approaches (Table
4). The common variations are variations that are found in Parent 1 and
Parent 2 when mapped against sorghum reference genome. The unique
variations are variations found in either Parent 1 or Parent 2 but not in both.
The Integrative Genome Viewer (IGV) enabled the visualisation of the
identified variations from the TASSEL pipeline (Fig. 14). The variations were
spread even across all the chromosomes (Fig. 15). The variations discovered
using TASSEL pipeline were more than those discovered in CLC Genomics
Workbench (Table 3).
Table 3: A comparison of performance of TASSEL pipeline and CLC Genomics
Workbench based on the number of variants (SNPs and INDELs) identified in the
parental and F7 progeny lines
WGS RAD
CLC BIO TASSEL Pipeline CLC BIO TASSEL Pipeline
Parent 1 139 967 770 518 250 2981
Parent 2 286 683 685 735 31 454
Progeny 1 195 931 544 285 117 802
Progeny 2 298 450 701 276 2721 12 684
Total 921 031 2 701 814 3 119 17 012
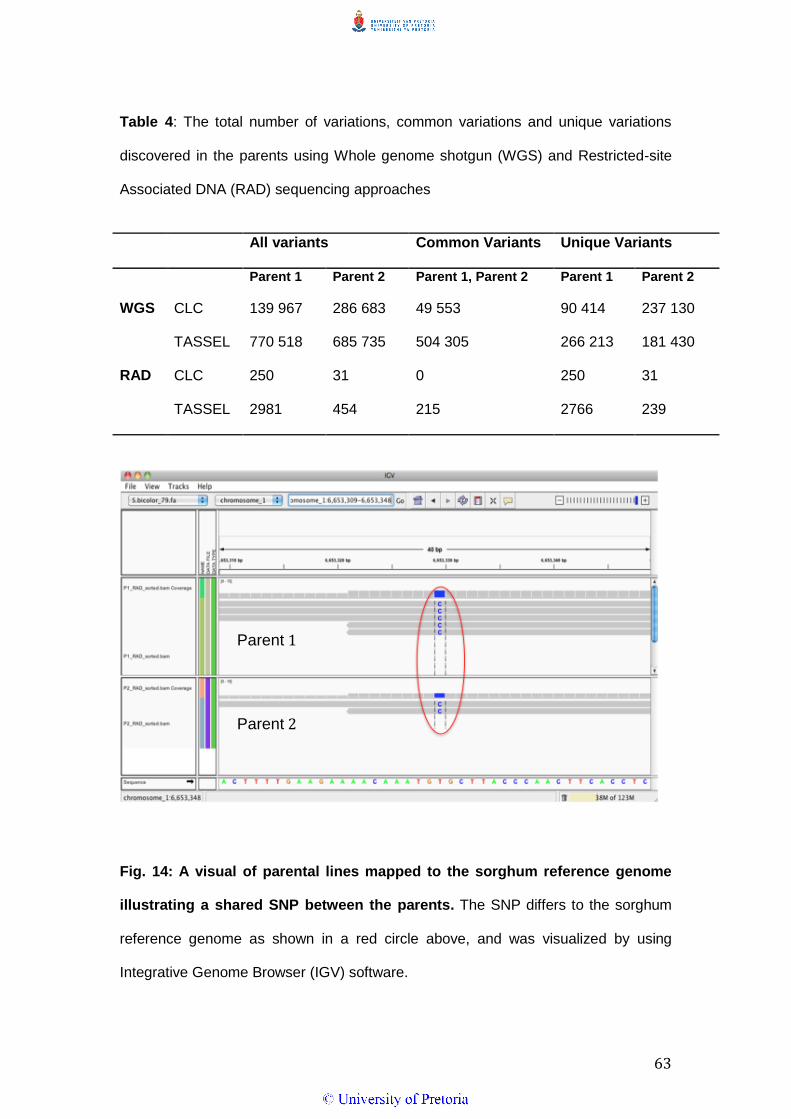
63
Table 4: The total number of variations, common variations and unique variations
discovered in the parents using Whole genome shotgun (WGS) and Restricted-site
Associated DNA (RAD) sequencing approaches
All variants Common Variants Unique Variants
Parent 1 Parent 2 Parent 1, Parent 2 Parent 1 Parent 2
WGS CLC 139 967 286 683 49 553 90 414 237 130
TASSEL 770 518 685 735 504 305 266 213 181 430
RAD CLC 250 31 0 250 31
TASSEL 2981 454 215 2766 239
Fig. 14: A visual of parental lines mapped to the sorghum reference genome
illustrating a shared SNP between the parents. The SNP differs to the sorghum
reference genome as shown in a red circle above, and was visualized by using
Integrative Genome Browser (IGV) software.
Parent 1
Parent 2
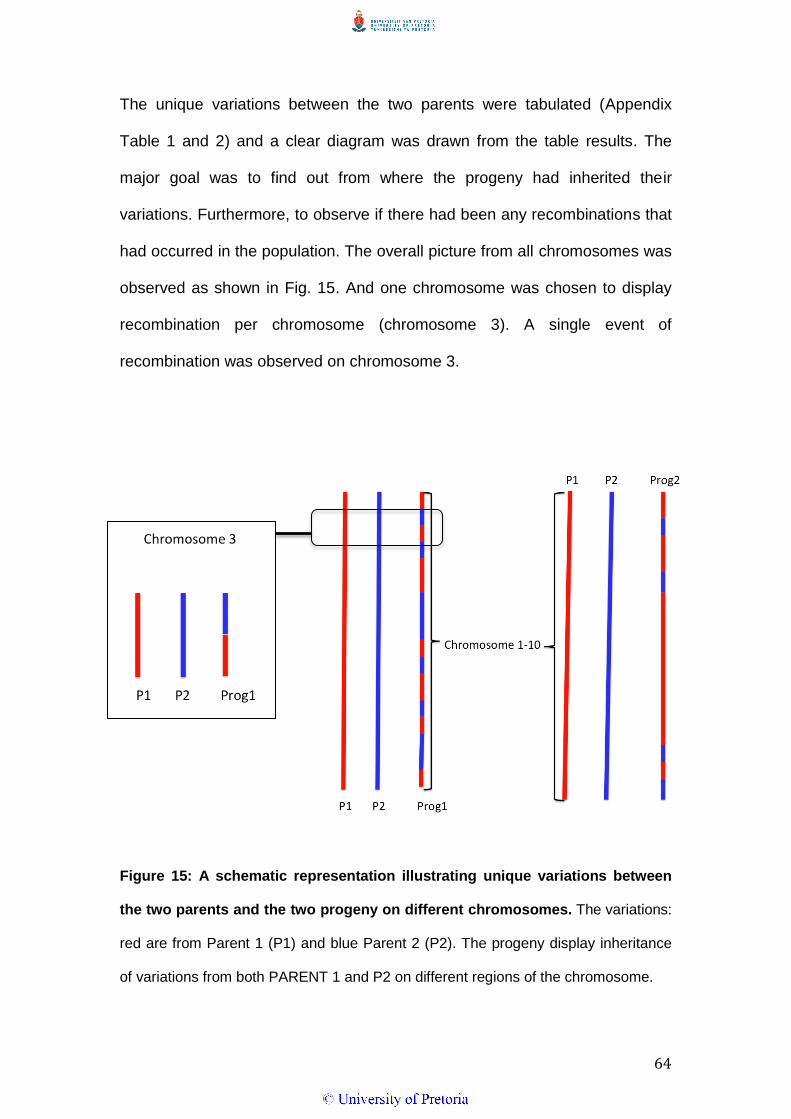
64
The unique variations between the two parents were tabulated (Appendix
Table 1 and 2) and a clear diagram was drawn from the table results. The
major goal was to find out from where the progeny had inherited their
variations. Furthermore, to observe if there had been any recombinations that
had occurred in the population. The overall picture from all chromosomes was
observed as shown in Fig. 15. And one chromosome was chosen to display
recombination per chromosome (chromosome 3). A single event of
recombination was observed on chromosome 3.
Figure 15: A schematic representation illustrating unique variations between
the two parents and the two progeny on different chromosomes. The variations:
red are from Parent 1 (P1) and blue Parent 2 (P2). The progeny display inheritance
of variations from both PARENT 1 and P2 on different regions of the chromosome.
65
3.5 Sequencing Associated Costs
The costs of library preparation using the Nextera kit are higher than using the
Truseq (Illumina) protocol kit (Table 5). A large proportion of data is crucial to
execute a whole genome shotgun (WGS) approach at a practical certainty
level, but it still proved to be cheaper than restriction-site associated DNA
(RAD) per base as reflected in Table 5. Sequencing using the RAD method is
expensive if more data is generated, but can be affordable at low coverage.
The data analysis methods costs were also considered. The CLC Genomics
Workbench license cost is immense, but this is a once off payment and the
same license is used to analyze countless genome sequencing data. For
instance in the current study the software was used on four sorghum lines,
which were subjected to two different sequencing methods. TASSEL pipeline
data analysis method is publicly available, and in these experiments
discovered more variations than CLC Genomics.
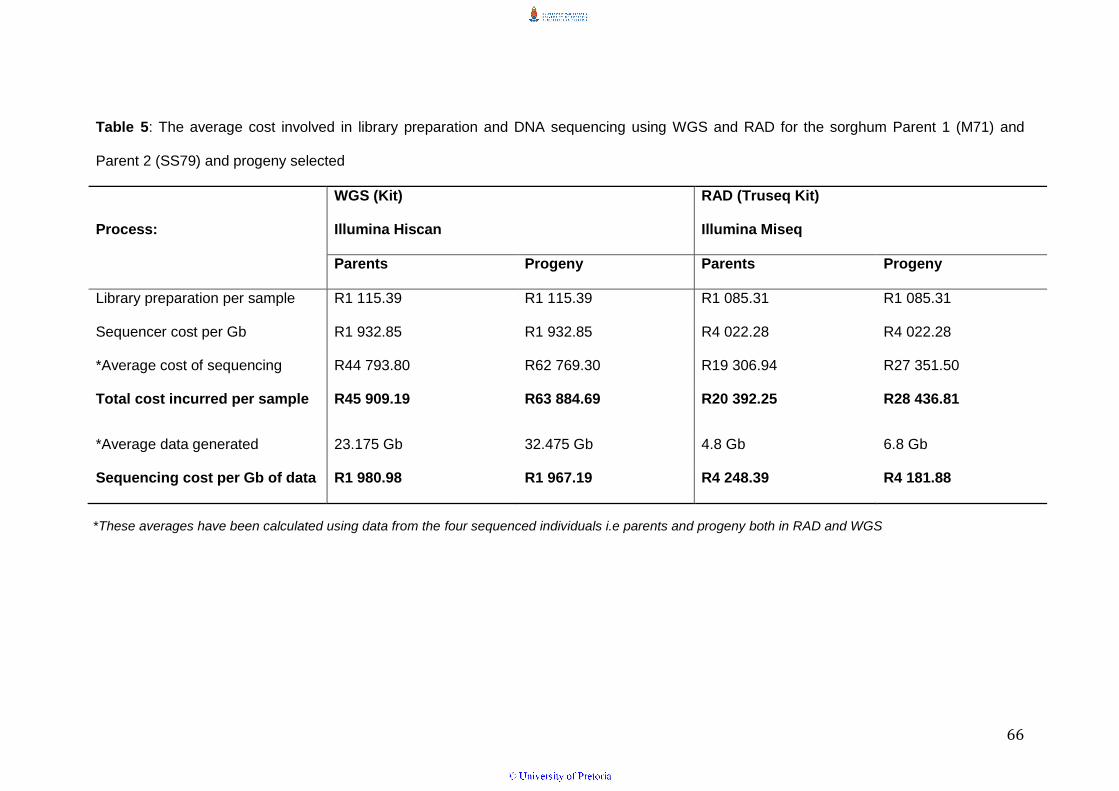
66
Table 5: The average cost involved in library preparation and DNA sequencing using WGS and RAD for the sorghum Parent 1 (M71) and
Parent 2 (SS79) and progeny selected
Process:
WGS (Kit)
Illumina Hiscan
RAD (Truseq Kit)
Illumina Miseq
Parents Progeny Parents Progeny
Library preparation per sample R1 115.39 R1 115.39 R1 085.31 R1 085.31
Sequencer cost per Gb R1 932.85 R1 932.85 R4 022.28 R4 022.28
*Average cost of sequencing R44 793.80 R62 769.30 R19 306.94 R27 351.50
Total cost incurred per sample R45 909.19 R63 884.69 R20 392.25 R28 436.81
*Average data generated 23.175 Gb 32.475 Gb 4.8 Gb 6.8 Gb
Sequencing cost per Gb of data R1 980.98 R1 967.19 R4 248.39 R4 181.88
*These averages have been calculated using data from the four sequenced individuals i.e parents and progeny both in RAD and WGS
CHAPTER 4: Discussion
This was the first study to use the blunt end restriction enzyme in a RAD-
based sequencing approach. The AluI enzyme was successfully used and a
smear indicating complete digestion of the DNA was obtained. After
sequencing, the overlapping RAD reads were visualized and variants were
detected when mapped to the reference sorghum genome. Additionally, the
WGS sequencing approach was employed and directly compared to the RAD
sequencing method. A random distribution of the WGS method was observed
and following the sequence assembly, the variants were detected. Of the two
sequencing approaches RAD emerged as a better technique for our current
mapping population. This is because RAD had the potential to call variants
even at a low coverage as opposed to the WGS which required deep
sequencing coverage.
Genotyping-by-Sequencing (GBS) is rapidly becoming the new state-of-the-
art tool commonly used by researchers as it unravels the genetic variation and
diversity of individuals at the genome level (Narum et al., 2013). Nevertheless,
the main challenge still lies in selecting the best GBS approach for genotyping
a sorghum mapping population developed at the Agricultural Research
Council (Potchefstroom). In sorghum, both RAD and WGS sequencing
approaches have been used to discover SNPs, but the two methods were not
directly compared and the best method was not selected (Nelson et al., 2011).
In essence, the RAD sequencing approach in the particular sorghum study
was only adopted after the WGS approach became inadequate for
68
simultaneous SNP discovery and genotyping. The differences between the
GBS methods are largely based on the potential biases and features
associated with resultant GBS data (Narum et al., 2013). The major
advantage of GBS is the markers discovered are directly relevant to the
population at hand.
The sequencing, data output and variations
The Illumina sequencing platform was selected for this study mainly because
of its relatively low cost, high throughput and availability (Ansorge, 2009;
Metzker, 2010; Scholz et al., 2012). The cost of sequencing using the Illumina
is amongst the cheapest in the sequencing industry (Hudson, 2007). This
platform has been widely used in GBS studies in several plants (Elshire et al.,
2011; Chutimanitsakun et al., 2011; Hyten et al., 2010; Poland et al., 2012;
Spindel et al., 2013; Beissinger et al., 2013) including sorghum (Nelson et al.,
2011). The two different platforms of the Illumina (Miseq and HiScan) were
used because the HiScan is suitable for producing large datasets for deep
coverage sequencing and the Miseq largely used for low coverage. The
MiSeq generates 1.5 Gb paired-end reads per run and each run takes one
day (Coparaso et al., 2012), while the Hiscan produces up to almost 30 Gb
per day, with a total of 200 Gbp per run and each run takes seven days
(Zhang et al., 2011).
The RAD sequencing approach optimally exploits low coverage sequencing
as the reads align uniformly on the reference sequence regions (Miller et al.,
2012; Rowe et al., 2011). For instance, Chutimanitsakun et al. (2011)
69
acknowledged low sequence coverage of less than 5× could be used to
accurately genotype individuals. In the current study, variations were
accurately determined from an average of 3× sequence coverage under the
RAD further confirming the reliability of RAD for genotyping even at low
coverage. The WGS approach on the other hand, requires deep sequencing
because the reads align uniquely when assembled and this might result in
shallow coverage of the sequenced regions (Nelson et al., 2011). In a study
on cattle, an average of 16× was demonstrated to be adequate for variant
identification with WGS (Zhan et al., 2011), while a similar study on white
spruce (Picea glauca) used deep coverage of 64× (Birol et al., 2013). In the
current study an average coverage of 30× was achieved with WGS.
High genome coverage provides the backbone for implementing approaches
for individuals that are sequenced at lower genome coverage (McCouch et al.,
2010). The reason for that is because once the markers are identified and
validated at high coverage, the lower coverage individual’s markers can be
scored. The WGS approach would therefore be attractive for initial marker
identification and development especially for arraying in SNP chips.
Generally, studies developing SNP chips take advantage of deep sequencing
and this was observed both in animals, e.g chickens (Groenen et al., 2011),
and plants e.g rice (McCouch et al., 2010). For example, the development of a
60K SNP chip in chicken was achieved at 12x genome sequencing coverage
depth. The RAD sequencing approach is best suited for genotyping large
population sizes as it uncovers variations with low sequence coverage. The
RAD approach excels in the scoring of markers following the initial discovery
70
phase of mining markers from a small pool of individuals. For example, the
two parents in a barley mapping population were genotyped using RAD and
93 individuals of the mapping population scored at low coverage by
comparing the variants to those obtained with the parents (Chutimanitsakun et
al., 2011). The parents were deeply sequenced at 72× and 128× respectively,
while the lowest coverage on the progeny was 8×.
Different types of restriction enzymes have been used for a range of
genotyping studies in sorghum. For example, Morishige et al., (2013) used
three different enzymes FseI, NgoMIV and HpaII in a digital genotyping study
targeting the non-repetitive regions of sorghum. In the current study the
choice of enzyme for the RAD sequencing approach was based on the fact
that AluI, is a four base cutter producing numerous genomic DNA fragments,
and it produces blunt ends eliminating the end-blunting step. The enzyme is
predicted to cut at every 256 bases resulting in sufficient cuts for the RAD
experiment. The Illumina protocol for adapter ligation requires all the DNA
fragments to be blunt-ended (Son and Taylor, 2012). Enzymes producing
sticky-end have been largely exploited in GBS studies (Elshire et al., 2011;
Miller et al., 2007; Poland et al., 2012). However, the sticky-end digestion
requires the additional step of blunting the DNA. Although AluI has been
previously used in sorghum for an RFLP study (Debener et al., 1990), the
current study was the first to successfully use the enzyme in a RAD-based
GBS approach.
71
In this study, there were more variations generated using the WGS compared
to the RAD sequencing approach as a result of the deep coverage
accomplished in the WGS. The rate of variation discovery was 1.05 variations
per Kbp on the two deeply sequenced the WGS parents. Although the current
observation is similar to sweet pepper (1.0 per Kbp) (Park et al., 2010), it was
lower than maize (11.5 per Kbp) (Barker and Edwards, 2009) and higher than
flax (Linum usitatissimum L.) (0.17 per Kbp) (Kumar et al., 2012). The
variation rate of the current study is comparable with a sorghum study (1.4 per
Kbp), which looked at the Genome-wide patterns of genetic variation in sweet
and grain sorghum (Zheng et al., 2011). The RAD variation rate was 0.001
per Kbp, and this low rate may be a reflection of the low sequence coverage
achieved using this sequence approach. Nonetheless, this rate was higher
than the variation rate discovered in barley using the RAD (Chutimanitsakun
et al., 2011), but less than the 15× sequence coverage enzyme digested RAD
variation previously obtained in sorghum (Nelson et al., 2011).
Data analysis procedures
Although recent advances in next-generation sequencing have led to
production of massive sequence data per run, the need for cutting-edge data
analysis pipelines remains crucial to filter, sort and align the generated data
(Narum et al., 2013). The advantages and disadvantages of the various
software often used for alignment and analysis of the next-generation data
has been critically reviewed by Kumar et al., (2012). The comparison of these
different approaches has been demonstrated for data analysis (Zhan et al.,
2011). Generally, CLC Genomics Workbench discovers more variations as
72
compared to other software (Zhan et al., 2011). Zhan and co-workers (2011)
used four different pipelines (SAMtools, CLC Genomics Workbench, SMALT
+ SAMtools and Mosaik + GigaBayes) for SNP calling, and CLC Genomics
Workbench uncovered more SNPs. In contrast, in the current study on
sorghum the variations discovered using CLC Genomics Workbench were
less than those discovered using TASSEL pipeline in the deeply sequenced
WGS individuals. Furthermore, TASSEL noticeably discovered more
variations in the RAD sequencing approach, making it the preferred method
over the CLC Genomics Workbench.
Recommendations for future experiments
This study demonstrates the suitability of RAD as the best Genotyping-by-
Sequencing approach for large populations. RAD demonstrates applicability
using low coverage data saving both cost and requires less computing. The
main interest for scientists to use WGS is the even genome coverage
achieved by this approach. The current study demonstrated an even
distribution of variations on the genome achieved using AluI enzyme in RAD
approach in sorghum (Fig. 12). Therefore RAD is a desirable method for
genotyping large populations because it results in a uniform and
representative reduction of the sorghum genome at a relatively low cost. The
most suitable data analysis method for the analysis of large populations is
TASSEL pipeline. This is because the TASSEL discovered more variations
overall than CLC Genomics Workbench. Thus, the mapping population
generated at the ARC will now be subjected to the RAD sequencing approach
and analyzed with the TASSEL pipeline. Although the study variations were
73
discovered by mapping with the sorghum reference genome, a future study on
the sorghum mapping population would map against each consensus
sequences i.e Parent 1 mapped to Parent 2 and the progeny against the
parental lines.
Concluding Remarks
The main aim of the study was to explore Genotyping-by-Sequencing (GBS)
and establish an efficient protocol for genotyping in sorghum. This was
achieved by developing a robust set of molecular markers (SNPs) that will be
used for genetic characterization in F8 sorghum RILs using both the Whole
Genome Shotgun and the Restriction-site Associated DNA sequencing
approach methods. Furthermore by assessing and comparing the WGS and
the RAD sequencing approaches based on the number of variations
discovered, the cost and reliability of each method. The three set objectives:
developing a robust set of markers (SNPs) for genetic characterization in F8
sorghum RILs using Whole Genome Shotgun (WGS) and Restriction-site
Associated DNA (RAD) methods; and to assess and compare the WGS and
RAD sequencing approaches, were achieved and the results of the
polymorphic markers will be explored further for mapping and QTL
identification for traits of interest. The traits of interest include sugar-related
traits and grain yield, which will contribute towards the biofuel industry. The
development of a precise and inexpensive GBS protocol serves as a robust
framework to which other sorghum populations can be characterized. Once
the variations are discovered, the unique or polymorphic ones can be used as
markers in genetic trait mapping, association studies, diversity analysis and
74
marker assisted selection. The SNPs identified in this study will be specifically
used on a mapping population developed at the ARC Grains Crops Institute
for the genetic trait mapping study. The study will look at the traits associated
with biofuel production.
The variation detection rate and accuracy are crucial quality indicators that
are affected by the depth of genome sequencing. This study has only
sequenced a total of four individuals, but sequencing of more individuals
would increase the confidence and accuracy of the results. The methodology
used here and resources generated for this study will be used as a resource
for future genome sequencing studies on larger datasets. The results of the
study will be applicable to the sorghum mapping population generated at the
Agricultural Research Council (Potchefstroom, South Africa), of which the two
parents were tested.
75
CHAPTER 5: References
Agarwal, M., Shrivastava, N., Padh, H., 2008. Advances in molecular marker
techniques and their applications in plant sciences. Plant Cell Reports
27:617-631.
Ahnert, D., Lee, M., Austin, D. F., Livini, C., Woodman, W. L., Openshaw, S.
J., Smith, J. S. C., Porter, K., Dalton, G., 1996. Genetic diversity
among elite sorghum inbred lines assessed with DNA markers and
pedigree information. Crop Science 36:1385-1392.
Ali, M. A., Niaz, S., Abbas, A., Sabir, W., Jabran, K., 2009. Genetic diversity
and assessment of drought tolerant sorghum landraces based on
morph-physiological traits at different growth stages. Plant Omics 2:
214-227.
Amigot, S. L., Fulgueira, C. L., Bottai, H., Basílico, J. C., 2006. New
parameters to evaluate forage quality. Postharvest Biology and
Technology 41: 215-224.
Almodares, A. and Hadi, M. R., 2009. Production of bioethanol from sweet
sorghum: A review. African Journal of Agricultural Research 4:772-780.
Ansorge, W. J., 2009. Next-generation DNA sequencing techniques. New
Biotechnology 25: 195-203.
Apotikar, D.B., Venkateswarlu, D., Ghorade, R.B., Wadaskar, R.M., Patil, J.V.,
Kulwal, P.L., 2011. Mapping of shoot fly tolerance loci in sorghum
using SSR markers. Journal of Genetics 90: 59-66.
Arai-Kichise, Y., Shiwa, Y., Nagasaki, H., Ebana, K., Yoshikawa, H., Yano,
M., Wakasa, K., 2011. Discovery of genome-wide DNA polymorphisms
76
in a landrace cultivar of japonica rice by whole-genome sequencing.
Plant and Cell Physiology 52: 274-282.
Aronesty, E., 2011. Ea-utils: Command-line tools for processing biological
sequencing data. http://code.google.com/p/ea-utils.
Attwood, T. K., Gisel, A., Eriksson, N. E., Bongcam-Rudloff, E., 2011.
Concepts, historical milestones and the central place of bioinformatics
in modern biology: A european perspective. Bioinformatics-Trends and
Methodologies, Mahmood A. Mahdavi (Ed.), ISBN: 978-953-307-282-1,
InTech.
Balole, T.V., and Legwaila, G.M., 2005. Sorghum bicolor (L.) oench
Internet ecord from rotabase. ansen, . . ., ardon, D. ( ds).
TA ( lant esources of Tropical Africa essources v g tales de
l’Afrique tropicale), Wageningen, Netherlands.
Baird, N. A., Etter, P. D., Atwood, T. S., Currey, M. C., Shiver, A. L., Lewis, Z.
A., Selker, E.U., Cresko, W.A., Johnson, E. A., 2008. Rapid SNP
discovery and genetic mapping using sequenced RAD markers. PloS
One 3: 3376.
Bantilan, M.C.S., Deb, U.K., Gowda, C.L.L., Reddy, B.V.S., Obilana, A.B.,
Evenson, R.E., 2004. Sorghum genetic enhancement: research
process, dissemination and impacts. International Crops Research
Institute for the Semi-Arid Tropics.
Barbar , T., alma-Silva, C., Paggi, G.M., Bered, F., Fay, M.F., Lexer, C.,
2007. Cross-species transfer of nuclear microsatellite markers:
potential and limitations. Molecular Ecology 16:3759-3767.
77
Barchi, L., Lanteri, S., Portis, E., Acquadro, A., Vale, G., Toppino, L., Rotino,
G.L., 2011. Identification of SNP and SSR markers in eggplant using
RAD tag sequencing. BMC Genomics 12:304.
Bardakci, F., 2001. Random amplified polymorphic DNA (RAPD) markers.
Turkish Journal of Biology 25:185-196.
Barker, G. L., and Edwards, K. J., 2009. A genome‐ wide analysis of single
nucleotide polymorphism diversity in the world's major cereal crops.
Plant Biotechnology Journal 7: 318-325.
Baumhardt, R. L., and Howell, T. A., 2006. Seeding practices, cultivar
maturity, and irrigation effects on simulated grain sorghum yield.
Agronomy Journal 98: 462-470.
Beissinger, T. M., Hirsch, C. N., Sekhon, R. S., Foerster, J. M., Johnson, J.
M., Muttoni, G., .Vaillancourt, B., Buell, C.R., Kaeppler, S.M., de Leon,
N., 2013. Marker Density and Read Depth for Genotyping Populations
Using Genotyping-by-Sequencing. Genetics 193: 1073-1081.
Bennetzen, J. L., and Melake-Berhan, A., 1994. Generation of a genetic map
for Sorghum bicolor. In: Phillips, R. L., Vasil, I. K. (Eds). Advances in
cellular and molecular biology of plants. pp. 291-298.
Bennetzen, J. L., Liu, C. N., San Miguel, P., Springer, P. S., Jin, Y. K., Zanta,
C. A., Avramova, Z., 1996. Commonalities and contrasts in the
organization of the maize and sorghum nuclear genomes. Genomes of
plants and animals. In: Gustafson, J. P. and Flavell, R., (Eds). 21st
Stadler Genetics Symposium. pp: 103-113.
78
Berhan, A. M., Hulbert, S. H., Butler, L. G., Bennetzen, J. L., 1993. Structure
and evolution of the genomes of Sorghum bicolor and Zea mays.
Theoretical and Applied Genetics 86:598-604.
Bhattramakki, D., Dong, J., Chhabra, A.K., Hart, G.E., 2000. An integrated
SSR and RFLP linkage map of Sorghum bicolor (L.) Moench. Genome
43: 988-1002.
Bian, Y. L., Yazaki, S., Inoue, M., Cai, H. W., 2006. QTLs for Sugar Content of
Stalk in Sweet Sorghum (Sorghum bicolor L. Moench). Agricultural
Sciences in China 5: 736-744.
Binelli, G., Ginafranceschi, L., Pe, M. E., Taramino, G., Busso, C., Stenhouse,
J., Ottavino, E., 1992. Similarity of maize and sorghum genomes as
revealed by maize RFLP probes. Theoretical and Applied Genetics
84:10-16.
Birol, I., Raymond, A., Jackman, S. D., Pleasance, S., Coope, R., Taylor, G.
A., Yuen, M.N.S., Keeling, C.I., Brand, D., Vandervalk, B.P., Kirk., H.,
Pandoh, P., Moore, R.A., Zhao, Y., Mungall, A.J., Jaquish, V.,
Yanchuk, A., Ritland, C., Boyle, B., Bousquet, J., Ritland, K., MacKay,
J., Bohlmann, J., Jones, S. J., 2013. Assembling the 20 Gb white
spruce (Picea glauca) genome from whole-genome shotgun
sequencing data. Bioinformatics 29: 1492-1497.
Boddiger, D., 2007. Boosting biofuel crops could threaten food security. The
Lancet 370: 923-924.
Botstein, D., White, R.L., Skolnick, M., Davis, R.W., 1980. Construction of a
genetic linkage map in man using restriction fragment length
polymorphisms. American Journal of Human Genetics 32:314-331.
79
Boivin, K., Deu, M., Rami, J. F., Trouche, G., Hamon, P., 1999. Towards a
saturated sorghum map using RFLP and AFLP markers. Theoretical
and Applied Genetics 98:320-328.
Borrell, A., Paterson, A. H., Hash, C., Tom, B., Claire, J., David R.,
Lespinasse, D., Weltzien, E., Rattunde, H. F. W., Upadhyaya, H. D.,
Glaszmann, J. R., Jean-Francois, V., Michel, T., Niaba, N., Oumar, R.,
Punna, S. S., Deshpande, S. P., Bouchet, S., Kresovich, S., 2010. A
GCP Challenge Initiative: Drought Tolerance Improvement for
Sorghum in Africa. In: Abstracts for the Plant & Animal Genome XVIII
Conference. Plant & Animal Genome XVIII Conference: 9-13.
Borojević. S., 1990. rinciples and methods of plant breeding. lsevier
science publishers 17: 122-164.
Bradbury, P. J., Zhang, Z., Kroon, D. E., Casstevens, T. M., Ramdoss, Y.,
Buckler, E. S., 2007. TASSEL: software for association mapping of
complex traits in diverse samples. Bioinformatics 23: 2633-2635.
Brenchley, R., Spannagl, M., Pfeifer, M., Barker, G. L., D’Amore, ., Allen, A.
M., Hall, N., 2012. Analysis of the bread wheat genome using whole-
genome shotgun sequencing. Nature 491: 705-710.
Brown, S.M., Hopkins, M.S., Mitchell, S.E., Senior, M.L., Wang, T.Y., Duncan,
Gonzaez-Candelas, Kresovich, S., 1996. Multiple methods for the
identification of polymorphic simple sequence repeats (SSRs) in
sorghum (Sorghum bicolor (L.) Moench.). Theoretical and Applied
Genetics 93:190-198.
80
Burke, J. J., Franks, C. D., Burow, G., Xin, Z., 2010. Selection system for the
stay-green drought tolerance trait in sorghum germplasm. Agronomy
Journal 102: 1118-1122.
Burow, G., Burke, J.J., Xin, Z., Franks, C.D., 2011. Genetic dissection of
early-season cold tolerance in sorghum (Sorghum bicolor (L.) Moench.
Molecular Breeding 28:391–402.
Bus, A., Hecht, J., Huettel, B., Reinhardt, R., Stich, B., 2012. High-throughput
polymorphism detection and genotyping in Brassica napus using next-
generation RAD sequencing. BMC Genomics 13: 281.
Bvochora, J. M., Danner, H., Miyafuji, H., Braun, R., Zvauya, R., 2005.
Variation of sorghum phenolic compounds during the preparation of
opaque beer. Process Biochemistry 40: 1207-1213.
Capareda, S., 2010. Ethanol Fermentation from Sweet Sorghum Juice.
Carrari, F., Benech-Arnold, R., Osuna-Fernandez, R., Hopp, E., Sanchez, R.,
Iusem, N., Lijavetzky, D., 2003. Genetic mapping of the Sorghum
bicolor vp1 gene and its relationship with preharvest sprouting
resistance. Genome 46: 253-258.
Cavatassi, R., Lipper, L., Narloch, U., 2011. Modern variety adoption and risk
management in drought prone areas: insights from the sorghum
farmers of eastern Ethiopia. Agricultural Economics 42: 279-292.
Chandrashekar, A., and Satyanarayana, K. V., 2006. Disease and pest
resistance in grains of sorghum and millets. Journal of Cereal Science
44: 287-304.
Chutimanitsakun, Y., Nipper, R.W., Cuesta-Marcos, A., Cistué, L., Corey, A.,
Filichkina, T., Johnson, E.A., Hayes, P.M., 2011. Construction and
81
application for QTL analysis of a restriction site associated DNA (RAD)
linkage map in barley. BMC Genomics 12: 4.
Chittenden, L. M., Schertz, K. F., Lin, Y. R., Wing, R. A., Patterson, A. H.,
1994. A detailed RFLP map of Sorghum bicolor S. propinquum,
suitable for high-density mapping suggests ancestral duplication of
sorghum chromosomes or chromosomal segments. Theoretical and
Applied Genetics 87:925-933.
Choi. I.Y., Hyten. D.L., Matukumalli. L.K., Song. Q., Chaky. J.M., Quigley.
C.V., Chase. K., Lark. K.G., Reiter. R.S., Yoon. M.S., 2007. A soybean
transcript map: gene distribution, haplotype and single-nucleotide
polymorphism analysis. Genetics 176: 686-696.
Claassen, P.A.M., de Vrije, T., Budde, M.A.W., 2004. Biological hydrogen
production from sweet sorghum by thermophilic bacteria. 2nd World
Conference on Biomass for Energy, Industry and Climate Protection.
Close, T. J., Bhat, P. R., Lonardi, S., Wu, Y., Rostoks, N., Ramsay, L., Druka,
A., Waugh, R., 2009. Development and implementation of high-
throughput SNP genotyping in barley. BMC Genomics 10: 582.
Collard, B.C.Y., Jahufer, M.Z.Z., Brouwer, J.B., Pang, E.C.K., 2005. An
introduction to markers, quantitative trait loci (QTL) mapping and
marker-assisted selection for crop improvement: The basic concepts.
Euphytica 142:169-196.
Caporaso, J. G., Lauber, C. L., Walters, W. A., Berg-Lyons, D., Huntley, J.,
Fierer, N., Knight, R., 2012. Ultra-high-throughput microbial community
analysis on the Illumina HiSeq and MiSeq platforms. The
Multidisciplinary Journal of Microbiology Ecology 6: 1621-1624.
82
Cui, Y. X., Xu, G. W., Magill, C. W., Schertz, K. F., Hart, G. E., 1995. RFLP-
based assay of Sorghum bicolor (L.) Moench genetic diversity.
Theoretical and Applied Genetics 90:787-796.
Dahlberg, J. A., Zhang, X., Hart, G. E., Mullet, J. E., 2002. Comparative
assessment of variation among sorghum germplasm accessions using
seed morphology and RAPD measurements. Crop Science 42: 291-
296.
De Oliveira, A. C., Richter, T., Bennetzen, J. L., 1996. Regional and racial
specificities in sorghum germplasm assessed with DNA markers.
Genome 39:579-587.
De Oliveira, S. G., Berchielli, T. T., Pedreira, M. D. S., Primavesi, O.,
Frighetto, R., Lima, M. A., 2007. Effect of tannin levels in sorghum
silage and concentrate supplementation on apparent digestibility and
methane emission in beef cattle. Animal Feed Science and Technology
135: 236-248.
Department of Agriculture, Forestry and Fisheries, 2010. Sorghum production
guidelines. Compiled by Agricultural Research Council: Grains and
Crops Institute.
Deu, M., Gonzalez-de-Leon, D., Glazmann, J. C., Degremont, I., Chantereau,
J., Lanaud, C., Hamon, P., 1994. RFLP diversity in cultivated sorghum
in relation to racial differentiation. Theoretical and Applied Genetics
88:838-844.
Deu, M., Ratnadass, A., Hamada, M. A., Noyer, J. L., Diabate, M.,
Chantereau, J., 2005. Quantitative trait loci for head-bug resistance in
sorghum. African Journal of Biotechnology 4:247-250.
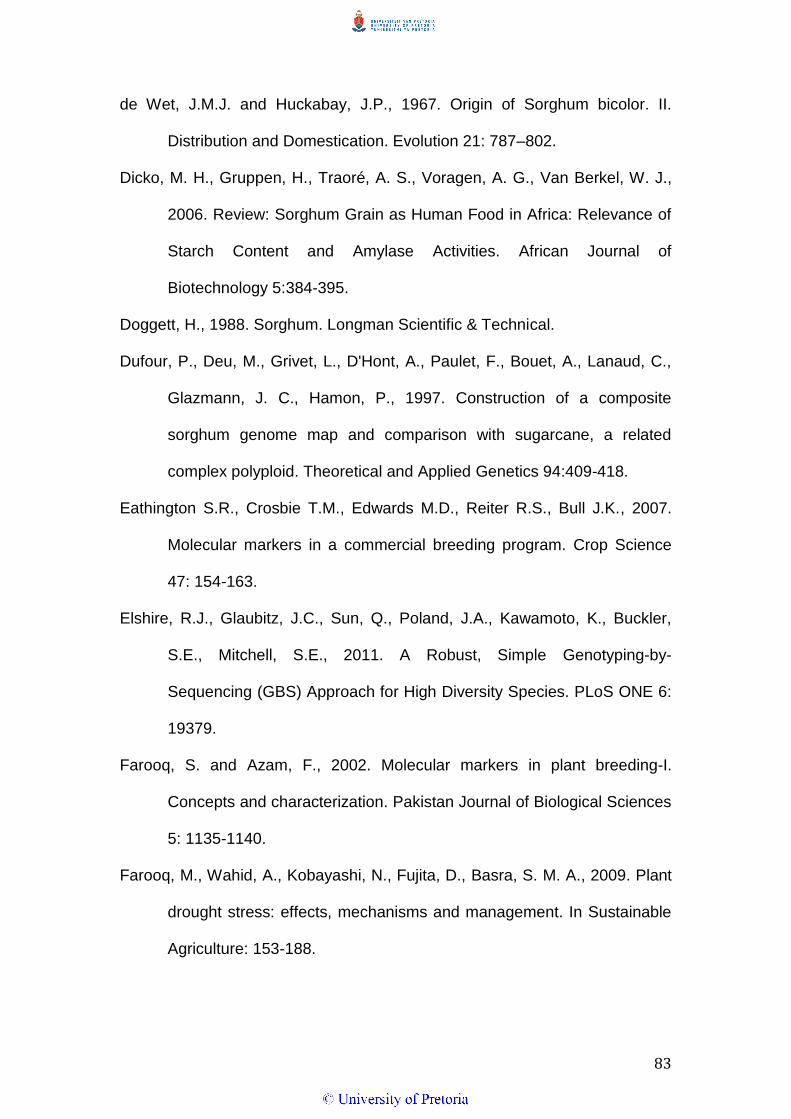
83
de Wet, J.M.J. and Huckabay, J.P., 1967. Origin of Sorghum bicolor. II.
Distribution and Domestication. Evolution 21: 787–802.
Dicko, M. H., Gruppen, H., Traoré, A. S., Voragen, A. G., Van Berkel, W. J.,
2006. Review: Sorghum Grain as Human Food in Africa: Relevance of
Starch Content and Amylase Activities. African Journal of
Biotechnology 5:384-395.
Doggett, H., 1988. Sorghum. Longman Scientific & Technical.
Dufour, P., Deu, M., Grivet, L., D'Hont, A., Paulet, F., Bouet, A., Lanaud, C.,
Glazmann, J. C., Hamon, P., 1997. Construction of a composite
sorghum genome map and comparison with sugarcane, a related
complex polyploid. Theoretical and Applied Genetics 94:409-418.
Eathington S.R., Crosbie T.M., Edwards M.D., Reiter R.S., Bull J.K., 2007.
Molecular markers in a commercial breeding program. Crop Science
47: 154-163.
Elshire, R.J., Glaubitz, J.C., Sun, Q., Poland, J.A., Kawamoto, K., Buckler,
S.E., Mitchell, S.E., 2011. A Robust, Simple Genotyping-by-
Sequencing (GBS) Approach for High Diversity Species. PLoS ONE 6:
19379.
Farooq, S. and Azam, F., 2002. Molecular markers in plant breeding-I.
Concepts and characterization. Pakistan Journal of Biological Sciences
5: 1135-1140.
Farooq, M., Wahid, A., Kobayashi, N., Fujita, D., Basra, S. M. A., 2009. Plant
drought stress: effects, mechanisms and management. In Sustainable
Agriculture: 153-188.
84
FAO (1995) www.faostat.fao.org (Food and Agriculture Organization)
Accessed 12 September 2011.
Feltus, A., Wan, J., Schulze, S.R. Estill, J.C., Jiang, N., Paterson, A.H. 2004
An SNP resource for rice genetics and breeding based on subspecies
indica and japonica genome alignments. Genome Research 14: 1812–
1819
Funnell-Harris, D. L., Sattler, S. E., Pedersen, J. F., 2013. Characterization of
fluorescent Pseudomonas spp. associated with roots and soil of two
sorghum genotypes. European Journal of Plant Pathology: 1-13.
Ganal, M.W., Altmann, T., Röder, M.S., 2009. SNP identification in crop
plants. Current Opinion Plant Biology 12: 211–217.
Giancola, S., McKhann, H. I., Berard, A., Camilleri, C., Durand, S., Libeau, P.,
Roux, F., Reboud, X., Gut, I.V., Brunel, D., 2006. Utilization of the three
high-throughput SNP genotyping methods, the GOOD assay,
Amplifluor and TaqMan, in diploid and polyploid plants. TAG
Theoretical and Applied Genetics 112: 1115-1124.
Goldemberg, J., Coelho, S. T., Guardabassi, P., 2008. The sustainability of
ethanol production from sugarcane. Energy Policy 36: 2086-2097.
Gowda, P.S.B., Xu, G.W., Frederiksen, R.A, Magill, C.W., 1995. DNA markers
for downy mildew resistance genes in sorghum. Genome 38: 823-826.
Grassi, G., Qiong, Z., Grassi, A., Fjällström, T., Helm, P., 2002. Small-scale
modern autonomous bioenergy complexes: Development instrument
for fighting poverty and social exclusion in rural villages. Proceedings
of the 12th European Conference on Biomass for Energy, Industry and
Climate Change Amsterdam, The Netherlands.
85
Groenen, M.A., Megens, H.J., Zare, Y., Warren, W.C., Hillier, L.W.,
Crooijmans, R.P., Vereijken, A., Okimoto, R., Muir, W.M., Cheng, H.H.,
2011. The development and characterization of a 60K SNP chip for
chicken. BMC Genomics 12: 274.
Guan, Y., Wang, H., Qin, L., Zhang, H., Yang, Y., Gao, F., Li, R., Wang, H.,
2011. QTL mapping of bio-energy related traits in Sorghum. Euphytica
182: 431–440.
Gunderson, K.L., 2009. Whole-genome genotyping on bead arrays. Methods
Molecular Biology 529: 197–213.
Gupta, P.K., Roy, J.K., and Prasad, M., 2001. Single nucleotide
polymorphisms: A new paradigm for molecular marker technology and
DNA polymorphism detection with emphasis on their use in plants.
Current Science 80: 524-535.
Harris, K., Subudhi, P.K., Borrel, A., Jordan, D., Rosenow, D., Nguyen, H.,
Klein, P., Klein, R., Mullet, J., 2007. Sorghum stay-green QTL
individually reduce post-flowering drought-induced leaf senescence.
Journal of Experimental Botany 58: 327-338.
Harlan, J.R., deWet, J.W.J., 1972. A simplified classification of sorghum. Crop
Science 12:127-176.
Haussmann, B. I. G., Obilana, A. B., Ayiecho, P. O., Blum, A., Schipprack, W.,
Geiger, H. H., 2000. Yield and yield stability of four population types of
grain sorghum in a semi-arid area of Kenya. Crop Science 40: 319-
329.
86
Haussmann, B.I.G., Hess, D.E., Welz, H.G., Geiger, H.H., 2000a. Improved
methodologies for breeding striga-resistant sorghums (review article).
Field Crops Research 66:195–201.
Haussmann, B. I. G., Mahalakshmi V., Reddy, B. V. S., Seetharama, N., Hash
C. T., Geiger H. H., 2002. QTL mapping of stay-green in two sorghum
recombinant inbred populations. Theoretical and Applied Genetics 106:
133–142.
Haussmann, B. I. G., Hess, D. E., Omanya, G. O., Folkertsma, R. T., Reddy,
B. V. S., Kayentao, M., Welz, H.G., Geiger, H. H., 2004. Genomic
regions influencing resistance to the parasitic weed Striga hermonthica
in two recombinant inbred populations of sorghum. Theoretical and
Applied Genetics 109: 1005-1016.
Hautea, D.M., Molina, G.C., Balatero, C.H., Coronado, N.B., Perez, E.B.,
Alvarez, M.T.H., Canama, A.O., Akuba, R.H., Quilloy, R.B., Frankie,
R.B., Caspillo, C.S., 2004. Analysis of induced mutants of Philippine
bananas with molecular markers. In: Jain, S.M., Swennen, R. (Eds.),
Banana Improvement: Cellular, Molecular Biology, and Induced
Mutations, Science Publishers. pp: 45-58.
Hay, F. R., Hamilton, N. R. S., Furman, B. J., Upadhyaya, H. D., Reddy, K. N.,
& Singh, S. K., 2013. Cereals. In Conservation of Tropical Plant
Species. pp: 293-315.
House, L.R., 1995. Sorghum: one of the world's great cereals. African Crop
Science Journal 3:135-142.
87
Huang, X., Wei, X., Sang, T., Zhao, Q., Feng, Q., Zhao, Y., Li, C., Han, B.,
2010. Genome-wide association studies of 14 agronomic traits in rice
landraces. Nature Genetics 42: 961-967.
Hudson, M. E., 2008. Sequencing breakthroughs for genomic ecology and
evolutionary biology. Molecular Ecology Resources 8: 3-17.
Hulbert, S. H., Richter, T. E., Axtell, J. D., Bennetzen, J. L., 1990. Genetic
mapping and characterization of sorghum and related crops by means
of maize DNA probes. Proceedings of the National Academy of
Sciences of the United States of America 87:4251-4255.
Hyten, D. L., Song, Q., Choi, I. Y., Yoon, M. S., Specht, J. E., Matukumalli, L.
K., Nelson, R.L., Shoemaker, R.C., Young, N.D., Cregan, P. B., 2008.
High-throughput genotyping with the GoldenGate assay in the complex
genome of soybean. Theoretical and Applied Genetics 116: 945-952.
Hyten, D.L., Cannon, S.B., Song, Q., Weeks, N., Fickus, E.W., Shoemaker,
R.C., Specht, J.E., Farmer, A.D., May, G.D., Cregan, P.B., 2010. High-
throughput SNP discovery through deep resequencing of a reduced
representation library to anchor and orient scaffolds in the soybean
whole genome sequence. BMC Genomics 11:38.
Indap, A. R., Cole, R., Marth, G. T., Olivier, M., 2013. Variant discovery in
targeted resequencing using whole genome amplified DNA. BMC
Genomics 14: 468.
Jehan, T., and Lakhanpaul. S., 2006. Single nucleotide polymorphism (SNP)–
Methods and applications in plant genetics: A review. Indian Journal of
Biotechnology 5:435-459.
88
Jordan, D.R., Tao, Y., Godwin, I.D., Henzell, R.G., Cooper, M., McIntyre, C.L.,
2003. Prediction of hybrid performance in grain sorghum using RFLP
markers. Theoretical and Applied Genetics 106: 559–567.
Jordan, D. R., Klein, R. R., Sakrewski, K. G., Henzell, R. G., Klein, P. E.,
Mace, E. S., 2011. Mapping and characterization of Rf 5: a new gene
conditioning pollen fertility restoration in A1 and A2 cytoplasm in
sorghum (Sorghum bicolor (L.) Moench). Theoretical and Applied
Genetics 123: 383-396.
Park, S. W., Jung, J. K., Liu, W. Y., & Kang, B. C., 2010. Discovery of single
nucleotide polymorphism in Capsicum and SNP markers for cultivar
identification. Euphytica 175: 91-107.
Kapanigowda, M. H., Payne, W. A., Rooney, L. W., Mullet, J. E., 2012.
Transpiration Ratio in Sorghum [Sorghum bicolor (L.) Moench] for
Increased Water-use Efficiency and Drought Tolerance. Journal of Arid
Land Studies 21: 175-178.
Kassahun, B., Bidinger, F. R., Hash, C. T., Kuruvinashetti, M. S., 2010. Stay-
green expression in early generation sorghum [Sorghum bicolor (L.)
Moench] QTL introgression lines. Euphytica 172: 351-362.
Kayodé, A. P., Linnemann, A. R., Nout, M. J., Hounhouigan, J. D., Stomph, T.
J., Smulders, M. J., 2006. Diversity and food quality properties of
farmers' varieties of sorghum from Bénin. Journal of the Science of
Food and Agriculture 86: 1032-1039.
Klein, R.R., Rodriguez-Herrera, R., Schlueter, J.A., Klein, P.E., Yu, Z.H.
Rooney, W.L., 2001b. Identification of genomic regions that affect grain
89
mold incidence and other traits of agronomic importance in sorghum.
Theoretical and Applied Genetics 102: 307–319.
Kong. L., Dong, J., Hart. G.E., 2000. Characteristics, linkage-map positions,
and allelic differentiation of Sorghum bicolor (L.) Moench DNA simple-
sequence repeats (SSRs). Theoretical and Applied Genetics 101:438-
448.
Koti, S., Reddy, K. R., Reddy, V. R., Kakani, V. G., Zhao, D., 2005. Interactive
effects of carbon dioxide, temperature, and ultraviolet-B radiation on
soybean (Glycine max L.) flower and pollen morphology, pollen
production, germination, and tube lengths. Journal of Experimental
Botany 56: 725-736.
Kresovich. S., Barbazuk. B. Bedell. J.A., 2005. Toward sequencing the
sorghum genome. A US National Science Foundation-sponsored
Workshop Report. Plant Physiology 138:1898–1902.
Kumar, S., Banks, T. W., Cloutier, S., 2012. SNP discovery through next-
generation sequencing and its applications. International Journal of
Plant Genomics.
Langmead, B., 2010. Aligning short sequencing reads with Bowtie. Current
Protocols in Bioinformatics 11-7.
Langmead, B., and Salzberg, S. L., 2012. Fast gapped-read alignment with
Bowtie 2. Nature Methods 9: 357-359.
Laopaiboon, L., Nuanpeng, S., Srinophakun, P., Klanrit, P., Laopaiboon, P.,
2009. Ethanol production from sweet sorghum juice using very high
gravity technology: Effects of carbon and nitrogen supplementations.
Bioresource Technology 100: 4176-4182.
90
Lendzemo, V. W., Kuyper, T. W., Matusova, R., Bouwmeester, H. J., Van Ast,
A., 2007. Colonization by arbuscular mycorrhizal fungi of sorghum
leads to reduced germination and subsequent attachment and
emergence of Striga hermonthica. Plant Signaling & Behavior 2: 58-62.
Li, H., Ruan, J. and Durbin, R., 2008. Mapping short DNA sequencing reads
and calling variants using mapping quality scores. Genome Research
18:1851-1858.
Li, R., Yu, C., Li, Y., Lam, T. W., Yiu, S. M., Kristiansen, K., Wang, J., 2009.
SOAP2: an improved ultrafast tool for short read alignment.
Bioinformatics 25: 1966-1967.
Li, Y., Hu, Y., Bolund, L., & Wang, J., 2010. State of the art de novo assembly
of human genomes from massively parallel sequencing data. Human
Genomics 4: 271-7.
Liu, C.M., Wong, T., Wu, E., Luo, R., Yiu, S.M., Li, Y., Wang, B., Yu, C., Chu,
X., Zhao, K., Li, R., Lam, T.W., 2012. SOAP3: ultra-fast GPU-based
parallel alignment tool for short reads. Bioinformatics 28: 878-879.
Limtong, S., Sringiew, C., Yongmanitchai, W., 2007. Production of fuel
ethanol at high temperature from sugar cane juice by a newly isolated
Kluyveromyces marxianus. Bioresource Technology 98: 3367-3374.
Luzuriaga, A. L., Escudero, A., PÉREZ‐ GARCÍA, F., 2006. Environmental
maternal effects on seed morphology and germination in Sinapis
arvensis (Cruciferae). Weed Research 46: 163-174.
Mace, E. S., Rami, J. F., Bouchet, S., Klein, P. E., Klein, R. R., Kilian, A.,
Wenzl, P., Xia, L., Halloran, K., Jordan, D. R., 2009. A consensus
genetic map of sorghum that integrates multiple component maps and
91
high-throughput Diversity Array Technology (DArT) markers. BMC
Plant Biology 9: 13.
Mace, E. S., Singh, V., Van Oosterom, E. J., Hammer, G. L., Hunt, C. H.,
Jordan, D. R., 2012. QTL for nodal root angle in sorghum (Sorghum
bicolor L. Moench) co-locate with QTL for traits associated with drought
adaptation. Theoretical and Applied Genetics 124: 97-109.
Magalhaes, J. V., Liu, J., Guimaraes, C. T., Lana, U. G., Alves, V. M., Wang,
Y. H., Schaffert, R.E., Hoekenga, O.A., Pineros, M.A., Shaff, J.E.,
Klein, P.E., Carneiro, N.P., Coelho, C.M., Trick, H.N., Kochian, L. V.,
2007. A gene in the multidrug and toxic compound extrusion (MATE)
family confers aluminum tolerance in sorghum. Nature Genetics 39:
1156-1161.
Mandal, A., Maiti, A., Chowdhury, B., Elanchezhian, R., 2001. Isoenzyme
markers in varietal identification of banana. In Vitro Cellular and
Developmental Biology - Plant 37:599-604.
McCouch, S. R., Zhao, K., Wright, M., Tung, C. W., Ebana, K., Thomson, M.,
Reynolds, A., Wang, D., DeClerck, G., Ali, M.L., McClung, A., Eizenga,
G., Bustamante, C., 2010. Development of genome-wide SNP assays
for rice. Breeding Science 60: 524-535.
McGovern, P. E., Zhang, J., Tang, J., Zhang, Z., Hall, G. R., Moreau, R. A.,
Nuñez, A., Butrym, E.D., Richards, M.P., Wang, C.S., Cheng, G.,
Zhao, Z., Bar-Yosef, O., 2004. Fermented beverages of pre-and proto-
historic China. Proceedings of the National Academy of Sciences of the
United States of America 101: 17593-17598.
92
Menz, M. A., Klein, R. R., Mullet, J. E., Obert, J. A., Unruh, N. C., 2002. A
high-density genetic map of Sorghum bicolor (L.) Moench based on
2926 AFLP, RFLP and SSR markers. Plant Molecular Biology 48: 483–
499.
Metzker, M. L., 2009. Sequencing technologies—the next generation. Nature
Reviews Genetics 11: 31-46.
Meze-Hausken, E., 2004. Contrasting climate variability and meteorological
drought with perceived drought and climate change in northern
Ethiopia. Climate Research 27: 19-31.
Miller, M. R., Dunham, J. P., Amores, A., Cresko, W. A., Johnson, E. A., 2007.
Rapid and cost-effective polymorphism identification and genotyping
using restriction site associated DNA (RAD) markers. Genome
Research 17: 240-248.
Mohan, M., Nair, S., Bhagwat, A., Krishna, T. G., Yano, M., Bhatia, C. R., &
Sasaki, T., 1997. Genome mapping, molecular markers and marker-
assisted selection in crop plants. Molecular Breeding 3: 87-103.
Morishige, D. T., Klein, P. E., Hilley, J. L., Sahraeian, S. M., Sharma, A.,
Mullet, J. E., 2013. Digital genotyping of sorghum - a diverse plant
species with a large repeat-rich genome. BMC Genomics 14: 448.
Mueller, U.G., and Wolfenbarger, L.L., 1999. AFLP genotyping and
fingerprinting. Tree 14:389-394.
Mulcahy, D.L., Cresti, M., Sansavini, S., Douglas, G.C., Linskens, H.F.,
Mulcahy, G.B., Vignani, R., Pancaldi, M., 1993. The use of random
amplified polymorphic DNAs to fingerprint apple genotypes. Scientia
Horticulturae 54:89-96.
93
Murray, S. C., Rooney, W. L., Mitchell, S. E., Sharma, A., Klein, P. E., Mullet,
J. E., Kresovich, S., 2008. Genetic improvement of sorghum as a
biofuel feedstock: II. QTL for stem and leaf structural carbohydrates.
Crop Science 48: 2180-2193.
Mutava, R. N., Prasad, P. V. V., Tuinstra, M. R., Kofoid, K. D., Yu, J., 2011.
Characterization of sorghum genotypes for traits related to drought
tolerance. Field Crops Research 123: 10-18.
Mutengwa, C.S., Tongoona, P.B., Sithole-Niang, I., 2005. Genetic studies and
search for molecular markers that are linked to Striga asiatica
resistance in sorghum. African Journal of Biotechnology 4: 1355-1361.
Muui, C. W., Muasya, R. M., Kirubi, D. T., 2013. Baseline survey on factors
affecting sorghum production and use in eastern Kenya. African
Journal of Food, Agriculture, Nutrition and Development 13: 7339-
7353.
Nagaraj, N., Reese, J. C., Tuinstra, M. R., Smith, C. M., St. Amand, P.,
Kirkham, M. B., Kofoid, K.D., Campbell, L.R., Wilde, G., 2005.
Molecular mapping of sorghum genes expressing tolerance to damage
by greenbug (Homoptera: Aphididae). Journal of Economic
Entomology 98: 595-602.
Nair, S. K., Prasanna, B. M., Garg, A., Rathore, R. S., Setty, T. A. S., Singh,
N. N., 2005. Identification and validation of QTLs conferring resistance
to sorghum downy mildew (Peronosclerospora sorghi) and Rajasthan
downy mildew (P. heteropogoni) in maize. Theoretical and Applied
Genetics 110: 1384-1392.
94
Narum, S. R., Buerkle, C. A., Davey, J. W., Miller, M. R., Hohenlohe, P. A.,
2013. Genotyping-by-Sequencing in ecological and conservation
genomics. Molecular Ecology.
Navi, S. S., Bandyopadhyay, R., Reddy, R. K., Thakur, R. P., Yang, X. B.,
2005. Effects of wetness duration and grain development stages on
sorghum grain mold infection. Plant Disease 89: 872-878.
Nelson. J., Wang, S., Wu, Y., Li, X., Antony, G., 2011. Single-nucleotide
polymorphism discovery by high-throughput sequencing in sorghum.
BMC Genomics 12: 352.
Papong, S., and Malakul, P., 2010. Life-cycle energy and environmental
analysis of bioethanol production from cassava in Thailand.
Bioresource Technology 101: 112-118.
Pardales, J. R., Kono, Y., Yamauchi, A., 1991. Response of the different root
system components of sorghum to incidence of waterlogging.
Environmental and Experimental Botany 31: 107-115.
Paterson, A. H., 2008. Genomics of Sorghum. International Journal of Plant
Genomics 10:1155.
Paterson, A. H., Bowers, J. E., Feltus, F. A., 2008. Genomics of sorghum, a
semi-arid cereal and emerging model for tropical grass genomics. In
Genomics of Tropical Crop Plants 469-482
Paterson. A.H., Bowers. J.E., Bruggmann. R., Dubchak. I., Grim-wood. J.,
Gundlach. H., Haberer. G., Hellsten. U., Mitros. T., Poliakov. A.,
Schmutz. J., Spannagl. M., Tang. H., Wang. X., Wicker. T., Bharti.
A.K., Chapman. J., Feltus. F.A., Gowik. U., Grigoriev. I.V., Lyons. E.,
Maher. C.A., Martis. M., Narechania. A., Otillar. R.P., Penning. B.W.,
95
Salamov. A.A., Wang. Y., Zhang. L., Carpita. N.C., Freeling M., Gingle.
A.R., Hash. C.T., Keller. B., Klein. P., Kresovich. S., McCann. M.C.,
Ming. R., Peterson. D.G., Mehboob-ur-Rahman. Ware. D., Westhoff.
P., Mayer. K.F.X., Messing. J., Rokhsar. D..S, 2009. The Sorghum
bicolor genome and the diversification of grasses. Nature 457:551-556.
Patidar, M., and Mali, A. L., 2004. Effect of farmyard manure, fertility levels
and bio-fertilizers on growth, yield and quality of sorghum (Sorghum
bicolor). Indian Journal of Agronomy 49: 117-120.
Peng, Y., Schertz, K. F., Cartinhour, S., Hart, G. E., 1999. Comparative
genome mapping of Sorghum bicolor (L.) Moench using an RFLP map
constructed in a population of recombinant inbred lines. Plant Breeding
118:225-235.
Pereira, M. G., Lee, M., Bramel-Cox, P., Woodman, W., Doebley, J., Whitkus,
R., 1994. Construction of an RFLP map in sorghum and comparative
mapping in maize. Genome 37: 236-243.
Piola, F., Rohr, R., Heizmann, P., 1999. Rapid detection of genetic variation
within and among in vitro propagated cedar (Cedrus libani Loudon)
clones. Plant Science 141: 159-163.
Piper, J. K., and Kulakow, P. A., 1994. Seed yield and biomass allocation in
Sorghum bicolor and F1 and backcross generations of S. bicolor× S.
halepense hybrids. Canadian Journal of Botany 72: 468-474.
Poland, J.A., Brown. P.J., Sorrells, M.E., Jannink, J.L., 2012. Development of
high-density genetic maps for barley and wheat using a novel two-
enzyme Genotyping-by-Sequencing approach. PLoS ONE 7: 32253.
96
Poland, J., Endelman, J., Dawson, J., Rutkoski, J., Wu, S., Manes, Y.,
Dreisigacker, S., Crossa, J., Sánchez-Villeda, H., Sorrells, M., Jannink,
J. L., 2012. Genomic selection in wheat breeding using Genotyping-by-
Sequencing. The Plant Genome 5: 103-113.
Prasad, S., Singh, A., Jain, N., Joshi, H. C., 2007. Ethanol production from
sweet sorghum syrup for utilization as automotive fuel in India. Energy
& Fuels 21: 2415-2420.
Ragab, R. A., Dronavalli, S., Saghai Maroof, M. A., Yu, Y. G., 1994.
Construction of a sorghum RFLP linkage map using sorghum and
maize DNA probes. Genome 37:590-594.
Rakoczy-trojanowska, M. and Bolibok, H., 2004. Characteristics and a
comparison of three classes of microsatellite-based markers and their
application in plants. Cellular and Molecular Biology Letters: 221–238.
Rakshit, S., Rakshit, A., Patil, J. V., 2012. Multiparent intercross populations
in analysis of quantitative traits. Journal of Genetics 91: 111-117.
Rami, J.F., Dufour P., Trouche, G., Fliedel, G., Mestres, C., Davrieux, F.,
Blanchard, P., Hamon, P., 1998. Quantitative trait loci for grain quality,
productivity, morphological and agronomical traits in sorghum
(Sorghum bicolor L. Moench). Theoretical and Applied Genetics 97:
605-616.
Rao, P. P., Birthal, P. S., Reddy, B. V., Rai, K. N., Ramesh, S., 2006.
Diagnostics of sorghum and pearl millet grains-based nutrition in India.
International Sorghum and Millets Newsletter 47: 93-96.
Reddy, N., and Yang, Y., 2005. Biofibers from agricultural byproducts for
industrial applications. TRENDS in Biotechnology 23: 22-27.
97
Reddy, B.V.S., Ramesh, S., Sanjana Reddy, P., Ramaih, B., Salimath, P.M.,
Kachapur, R., 2005. Sweet sorghum – a potential alternative raw
material for bio-ethanol and bio-energy. International Sorghum Millets
Newsletter 46: 79-86.
Reddy, B. V., Ashok Kumar, A., Ramesh, S., 2007. Sweet sorghum: A water
saving bio-energy crop.
Report On The Investigation Into The South African Sorghum Industry, 2007.
A Report By The Sorghum Section 7 Committee Appointed By The
National Agricultural Marketing Council.
Rooney, L.W., 2001. Food and nutritional quality of sorghum and millet.
INTSORMIL 2001 Annual Report, Project TAM-226: 105–114.
Rooney, W. L., Blumenthal, J., Bean, B., Mullet, J. E., 2007. Designing
sorghum as a dedicated bioenergy feedstock. Biofuels, Bioproducts
and Biorefining 1: 147-157.
Rostoks, N., Borevitz. J.O., Hedley. P.E., Russell. J., Mudies. S., Morris. J.,
Cardie. L., Marshall. D.F., Waugh. R., 2005. Single-feature
polymorphism discovery in the barley transcriptome. Genome Biology
6: 54.
Rowe, H. C., Renaut, S., Guggisberg, A., 2011. RAD in the realm of next‐
generation sequencing technologies. Molecular Ecology 20: 3499-
3502.
Sanchez, A.C., Subudhi, P.K., Rosenow, D.T., Nguyen, H.T., 2002. Mapping
QTLs associated with drought resistance in sorghum (Sorghum bicolor
L. Moench). Plant Molecular Biology 48: 713–726.
98
Scheible, W.R., Törjek. O., Altmann. T., 2004. From markers to cloned genes:
map-based cloning. In: Nagata. T., Lörz. H., and Widholm. J.M.,
Biotechnology in Agriculture and Forestry 55: 55-86
Scholz, M. B., Lo, C. C., Chain, P. S., 2012. Next generation sequencing and
bioinformatic bottlenecks: the current state of metagenomic data
analysis. Current Opinion in Biotechnology 23: 9-15.
Semagn, K., Bjornstad. A., Ndjiondjop. M.N., 2006. An overview of molecular
marker methods for plants. African Journal of Biotechnology 5: 2540–
2568.
Shen, G. Q., Abdullah, K. G., Wang, Q. K., 2009. The TaqMan method for
SNP genotyping. Technology 34: 36.
Shiringani, A.L., Frisch M., Friedt. W., 2010. Genetic mapping of QTLs for
sugar-related traits in a RIL population of Sorghum bicolor L. Moench.
Theoretical and Applied Genetics 121: 323-336.
Simpson, J. T., Wong, K., Jackman, S. D., Schein, J. E., Jones, S. J., Birol, İ.,
2009. ABySS: a parallel assembler for short read sequence data.
Genome research 19: 1117-1123.
Singhal, D., Gupta, P., Sharma, P., Kashyap, N., Anand, S., Sharma, H.,
2011. In-silico single nucleotide polymorphisms (SNP) mining of
Sorghum bicolor genome. African Journal of Biotechnology 10: 580-
583.
Son, M. S., and Taylor, R. K., 2011. Preparing DNA Libraries for Multiplexed
Paired‐ End Deep Sequencing for Illumina GA Sequencers. Current
Protocols in Microbiology 1E-4.
99
Song, Q. J., Shi, J. R., Singh, S., Fickus, E. W., Costa, J. M., Lewis, J., Gill...
B. S Ward. R., Cregan, P. B., 2005. Development and mapping of
microsatellite (SSR) markers in wheat. Theoretical and Applied
Genetics 110: 550-560.
Spindel, J., Wright, M., Chen, C., Cobb, J., Gage, J., Harrington, S., Lorieux,
M., Ahmadi, N., McCouch, S., 2013. Bridging the genotyping gap:
using genotyping by sequencing (GBS) to add high-density SNP
markers and new value to traditional bi-parental mapping and breeding
populations. Theoretical and Applied Genetics: 1-18.
Srinivas, G., Satish, K., Madhusudhana, R., Reddy, R. N., Mohan, S. M.,
Seetharama, N., 2009. Identification of quantitative trait loci for
agronomically important traits and their association with genic-
microsatellite markers in sorghum. Theoretical and Applied Genetics
118: 1439-1454.
Stenhouse, J.W., Rao, K.E., Reddy, G.V., Pao, K.D., 1997. Sorghum. In:
Biodiversity in Trust. Conservation and use of plant genetic resources
in CGIAR centres: 292– 308.
Tao, Y., Manners, J. M., Ludlow, M. M., Henzell, R. G., 1993. DNA
polymorphisms in grain sorghum (Sorghum bicolor (L.) Moench).
Theoretical and Applied Genetics 86:679-688.
Tao, Y. Z., Henzell, R. G., Jordan, D. R., Butler, D. G., Kelly, A. M., McIntyre,
C. L., 2000. Identification of genomic regions associated with stay
green in sorghum by testing RILs in multiple environments. Theoretical
and Applied Genetics 100: 1225-1232.
100
Taramino, G., Tarchini, R., Ferrario, S., Lee, M., and Pe, M.E., 1997.
Characterization and mapping of simple sequence repeats (SSRs) in
Sorghum bicolor. Theoretical and Applied Genetics 95: 66–72.
Tarpley, L., and Vietor, D.M., 2007. Compartmentation of sucrose during
radial transfer in mature sorghum culm. BMC Plant Biology 7: 33
Tautz, D., and Renz, M., 1984. Simple sequences are ubiquitous repetitive
components of eukaryotic genomes. Nucleic Acids Research 12: 4127-
4138.
Taylor, J. R. N., 2003. Overview: Importance of sorghum in Africa.
Taylor, J., Schober, T. J., Bean, S. R., 2006. Novel food and non-food uses
for sorghum and millets. Journal of Cereal Science 44: 252-271.
TeBeest, D., Kirkpatrick, T., Cartwright, R., 2004. Common and important
diseases of grain sorghum. Grain sorghum production handbook. Univ.
Ark. Coop. Ext., USA MP297.
Tesso, T. T., Claflin, L. E., Tuinstra, M. R., 2005. Analysis of stalk rot
resistance and genetic diversity among drought tolerant sorghum
genotypes. Crop Science 45: 645-652.
Torney, F., Moeller, L., Scarpa, A., Wang, K., 2007. Genetic engineering
approaches to improve bioethanol production from maize. Current
opinion in Biotechnology 18: 193-199.
van Belkum, A., Scherer, S., Van Alphen, L., Verbrugh, H., 1998. Short-
sequence DNA repeats in prokaryotic genomes. Microbiology and
Molecular Biology Reviews 62:275-293.
101
van Heerden, S. M., & Schönfeldt, H. C., 2004. The need for food composition
tables for southern Africa. Journal of Food Composition and Analysis
17: 531-537.
Venkatachalam, L., Sreedhar, R.V., Bhagyalakshmi, N., 2008. The use of
genetic markers for detecting DNA polymorphism, genotype
identification and phylogenetic relationships among banana cultivars.
Molecular Phylogenetics and Evolution 47:974-985.
Venter,J.C., Remington, K., Heidelberg, J.F., Halpern, A.L., Rusch, D., Eisen,
J.A., Wu, D., Paulsen, I., Nelson, K.E., Nelson, W., Fouts, D.E., Levy,
S., Knap, A.H., Lomas, M.W., Nealson, K., White, O., Peterson, J.,
Hoffman, J., Parsons, R., Baden-Tillson, H., Pfannkoch, C., Rogers, Y.,
Smith, H.O., 2004. Environmental genome shotgun sequencing of the
Sargasso Sea. Science 304: 66-74.
Vermerris, W., Saballos, A., Ejeta, G., Mosier, N. S., Ladisch, M. R., &
Carpita, N. C., 2007. Molecular breeding to enhance ethanol
production from corn and sorghum stover. Crop Science 47: 142.
Vermerris, W., 2011. Survey of genomics approaches to improve bioenergy
traits in maize, sorghum and sugarcane. Journal of Integrative Plant
Biology 53:105-116.
Vierling, R. A., Xiang, Z., Joshi, C. P., Gilbert, M. L., Nguyen, H. T., 1994.
Genetic diversity among elite sorghum lines revealed by restriction
fragment length polymorphisms and random amplified polymorphic
DNAs. Theoretical and Applied Genetics 87:816-820.
Vinodhana, N. K., and Ganesamurthy, K., 2010. Evaluation of morpho-
physiological characters in sorghum (Sorghum bicolor L. Moench)
102
genotypes under post-flowering drought stress. Electronic Journal of
Plant Breeding 1: 585-589.
Vos, P., Hogers, R., Bleeker, M., Reijans, M., Lee, T.v.d., Hornes, M., Friters,
A., Pot, J., Paleman, J., Kuiper, M., Zabeau, M., 1995. AFLP: A new
technique for DNA fingerprinting. Nucleic Acids Research 23: 4407-
4414.
Weising, K., Nybom, H., Wolff, K., Kahl, G., 2005. DNA Fingerprinting in
Plants: Principles, Methods, and Applications. CRC Press, New York,
USA.
White, P. S., Gilbert, M. L., Nguyen, H. T., Vierling, R. A., 1995. Maximum
parsimony accurately reconstructs relationships of elite sorghum lines.
Crop Science 35:1560-1565.
Whitkus, K., Doebly, J., Lee, M., 1992. Comparative genome mapping of
sorghum and maize. Genetics 132: 1119-1130.
William, H. M., Trethowan, R., Crosby-Galvan, E. M., 2007. Wheat breeding
assisted by markers: I YT’s experience. uphytica 157: 307-319.
Williams. J.G.K., Kubelik. A.R., Livak, K.J., Rafalski, J.A., Tingey, S., 1990.
DNA polymorphisms amplified by arbitrary primers are useful as
genetic markers. Nucleic Acids Research 18: 6531-6535.
Witcombe, J. R., Duncan, R. R., 1993. Use of molecular markers in sorghum
and pearl millet breeding for developing countries. In: Witcombe, J. R.,
Duncan, R. R. (Eds). Proceedings of an ODA Plant Sciences Research
Programme Conference. pp:126.
Woods, J., 2001. The potential for energy production using sweet sorghum in
southern Africa. Energy for Sustainable Development 5: 31-38.
103
Xu, G. W., Magill, C. W., Schertz, K. F., Hart, G. E., 1994a. A RFLP linkage
map of Sorghum bicolor (L.) Moench. Theoretical and Applied Genetics
89: 139-145.
Xu, W., Rosenow, D.T., Nguyen, H.T., 2000. Stay green trait in grain
sorghum: Relationship between visual rating and leaf chlorophyll
concentration. Plant Breeding 119: 365-367.
Xu, F., Wang, W., Wang, P., Li, M. J., Sham, P. C., Wang, J., 2012. A fast
and accurate SNP detection algorithm for next-generation sequencing
data. Nature Communications 3: 1258.
Yadav, S. K., Jyothi Lakshmi, N., Maheswari, M., Vanaja, M., Venkateswarlu,
B., 2005. Influence of water defict at vegetative, anthesis and grain
filling stages on water relation and grain yield in sorghum. Indian
Journal of Plant Physiology 10: 20-24.
Yan, J., Yang, X., Shah, T., Sánchez-Villeda, H., Li, J., Warburton, M., Xu, Y.,
2010. High-throughput SNP genotyping with the GoldenGate assay in
maize. Molecular Breeding 25: 441-451.
Yu, J.M., Tuinstra, M.R., 2001. Genetic analysis of seedling growth under cold
temperature stress in grain sorghum. Crop Science 41: 1438– 43.
Yu, S., Zhang, F., Yu, R., Zou, Y., Qi, J., Zhao, X., Yu, Y., Zhang D., Li, L.,
2009. Genetic mapping and localization of a major QTL for seedling
resistance to downy mildew in Chinese cabbage (Brassica rapa ssp.
pekinensis). Molecular Breeding 23: 573-590.
Yuan, J. S., Tiller, K. H., Al-Ahmad, H., Stewart, N. R., & Stewart Jr, C. N.,
2008. Plants to power: bioenergy to fuel the future. Trends in Plant
Science 13: 421-429.
104
Zane, L., Bargelloni L, Patarnello T., 2002. Strategies for microsatellite
isolation: a review. Molecular Ecology 11:1-16.
Zerbini, E., and Thomas, D., 2003. Opportunities for improvement of nutritive
value in sorghum and pearl millet residues in South Asia through
genetic enhancement. Field Crops Research 84: 3-15.
Zerbino, D. R., and Birney, E., 2008. Velvet: algorithms for de novo short read
assembly using de Bruijn graphs. Genome Research 18: 821-829.
Zhan, B., Fadista, J., Thomsen, B., Hedegaard, J., Panitz, F., Bendixen, C.,
2011. Global assessment of genomic variation in cattle by genome
resequencing and high-throughput genotyping. BMC Genomics 12:
557.
Zhang, C., Xie, G., Li, S., Ge, L., He, T., 2010. The productive potentials of
sweet sorghum ethanol in China. Applied Energy 87: 2360-2368.
Zhang, J., Chiodini, R., Badr, A., & Zhang, G., 2011. The impact of next-
generation sequencing on genomics. Journal of Genetics and
Genomics 38: 95-109.
Zhao, Y.L., Dolat, A., Steinberger, Y., Wang, X., Osman, A., Xie, G.H., 2009.
Biomass yield and changes in chemical composition of sweet sorghum
cultivars grown for biofuel. Field Crops Research 111: 55–64.
Zheng, L. Y., Guo, X. S., He, B., Sun, L. J., Peng, Y., Dong, S. S., ... & Jing,
H. C., 2011. Genome-wide patterns of genetic variation in sweet and
grain sorghum (Sorghum bicolor). Genome Biology 12: 114.
Zou, G., Zhai, G., Feng, Q., Yan, S., Wang, A., Zhao, Q., ... & Tao, Y., 2012.
Identification of QTLs for eight agronomically important traits using an
ultra-high-density map based on SNPs generated from high-throughput
105
sequencing in sorghum under contrasting photoperiods. Journal of
Experimental Botany 63: 5451-5462.
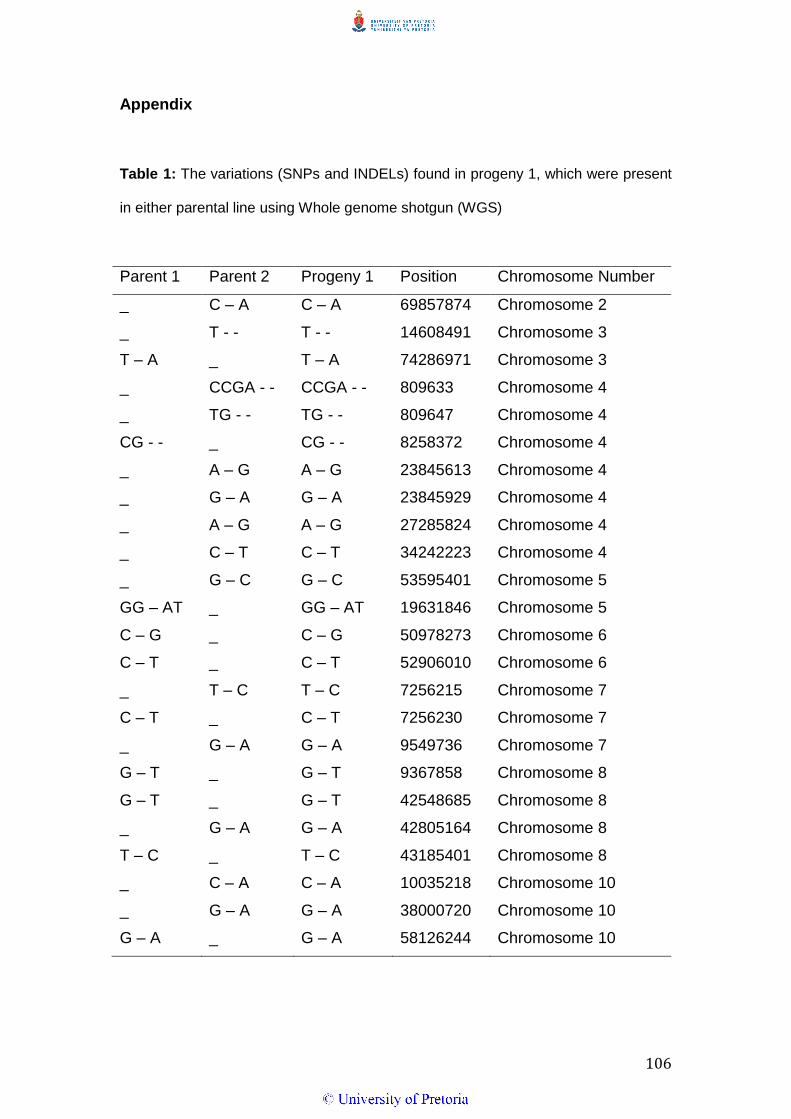
106
Appendix
Table 1: The variations (SNPs and INDELs) found in progeny 1, which were present
in either parental line using Whole genome shotgun (WGS)
Parent 1 Parent 2 Progeny 1 Position Chromosome Number
_ C – A C – A 69857874 Chromosome 2
_ T - - T - - 14608491 Chromosome 3
T – A _ T – A 74286971 Chromosome 3
_ CCGA - - CCGA - - 809633 Chromosome 4
_ TG - - TG - - 809647 Chromosome 4
CG - - _ CG - - 8258372 Chromosome 4
_ A – G A – G 23845613 Chromosome 4
_ G – A G – A 23845929 Chromosome 4
_ A – G A – G 27285824 Chromosome 4
_ C – T C – T 34242223 Chromosome 4
_ G – C G – C 53595401 Chromosome 5
GG – AT _ GG – AT 19631846 Chromosome 5
C – G _ C – G 50978273 Chromosome 6
C – T _ C – T 52906010 Chromosome 6
_ T – C T – C 7256215 Chromosome 7
C – T _ C – T 7256230 Chromosome 7
_ G – A G – A 9549736 Chromosome 7
G – T _ G – T 9367858 Chromosome 8
G – T _ G – T 42548685 Chromosome 8
_ G – A G – A 42805164 Chromosome 8
T – C _ T – C 43185401 Chromosome 8
_ C – A C – A 10035218 Chromosome 10
_ G – A G – A 38000720 Chromosome 10
G – A _ G – A 58126244 Chromosome 10
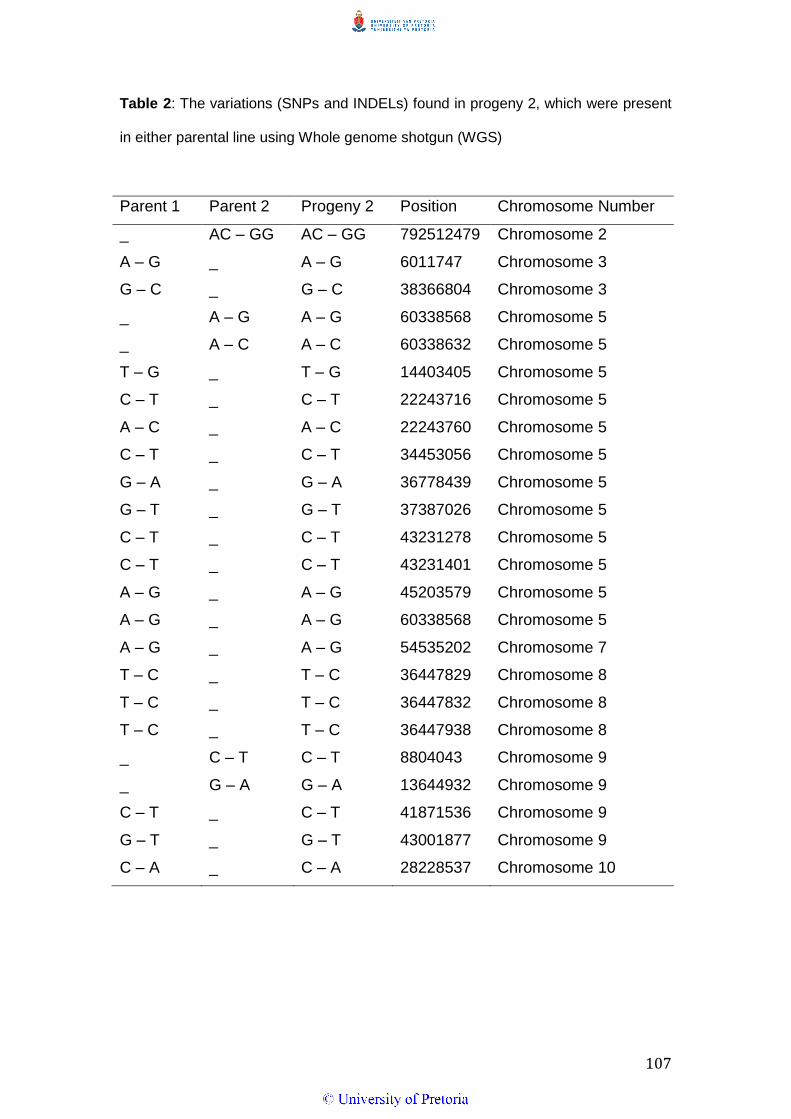
107
Table 2: The variations (SNPs and INDELs) found in progeny 2, which were present
in either parental line using Whole genome shotgun (WGS)
Parent 1 Parent 2 Progeny 2 Position Chromosome Number
_ AC – GG AC – GG 792512479 Chromosome 2
A – G _ A – G 6011747 Chromosome 3
G – C _ G – C 38366804 Chromosome 3
_ A – G A – G 60338568 Chromosome 5
_ A – C A – C 60338632 Chromosome 5
T – G _ T – G 14403405 Chromosome 5
C – T _ C – T 22243716 Chromosome 5
A – C _ A – C 22243760 Chromosome 5
C – T _ C – T 34453056 Chromosome 5
G – A _ G – A 36778439 Chromosome 5
G – T _ G – T 37387026 Chromosome 5
C – T _ C – T 43231278 Chromosome 5
C – T _ C – T 43231401 Chromosome 5
A – G _ A – G 45203579 Chromosome 5
A – G _ A – G 60338568 Chromosome 5
A – G _ A – G 54535202 Chromosome 7
T – C _ T – C 36447829 Chromosome 8
T – C _ T – C 36447832 Chromosome 8
T – C _ T – C 36447938 Chromosome 8
_ C – T C – T 8804043 Chromosome 9
_ G – A G – A 13644932 Chromosome 9
C – T _ C – T 41871536 Chromosome 9
G – T _ G – T 43001877 Chromosome 9
C – A _ C – A 28228537 Chromosome 10