Embed Size (px)
Citation preview
Pollution Reduction and No-Regrets Options in the Iron/Steel andPulp/Paper Manufacturing Sectors
by
Prashant Soral
B.Tech., Metallurgical Engineering, Indian Institute of Technology, Bombay (1995)
S.M., Materials Science and Engineering, Massachusetts Institute of Technology (1998)
Submitted to the Technology and Policy Programin partial fulfillment of the requirements for the degree of
Master of Science in Technology and Policy
at the
MASSACHUSETTS INSTITUTE OF TECHNOLOGY
June 1998
© Massachusetts Institute of Technology 1998. All rights reserved.
A uthor ............ .. .....- ... ............. .... ... ....... ..................................... .
Technology and Policy ProgramMay 8, 1998
C ertified by ......... .... .. .. ....... ................................................................. ......................
Uday B. PalAssociate Professor
Thesis Supervisor
A ccepted by........../. ......................... .............................................
Richard de NeufvilleChairman, Technology and Policy Program
JUiN 1219ARCHM,
LIBRASRIM
Pollution Reduction and No-Regrets Options in the Iron/Steel and Pulp/PaperManufacturing Sectors
by
Prashant Soral
Submitted to the Technology and Policy Program on May 8, 1998,in partial fulfillment of the requirements for the degree of
Master of Science in Technology and Policy
Abstract
The existence of No-Regrets options, in terms of a trade-off between economic growth andpollution reduction, has been established. The investigation has been conducted for themanufacturing industry in the United States of America, specifically concentrating on theiron/steel and pulp/paper sectors.
A detailed description of the technology that is currently in widespread use in each sector hasbeen provided. The emission points in the industrial processes have been identified. Effort hasalso been devoted towards a concise enumeration of the pollutants generated by each industry. Inorder to further establish the context, the current regulatory atmosphere in the U.S. has beendescribed.
Proof of existence of no-regrets options is then provided by citing several examples of noveltechnologies in each industry that have been implemented world-wide on an industrial or pilot-scale. The pollution reduction achieved during practical implementation of these technologies,their energy consumption, and their operating/maintenance costs have been compared with thosefor the conventional technologies. This comparison has been used to demonstrate the existence ofno-regrets options that can enable manufacturing processes to operate more efficiently, reducepollutant emissions, and environmental compliance costs, while improving profitability andcompetitiveness.
Thesis Supervisor: Uday B. PalTitle: Associate Professor

Acknowledgements
I take this opportunity to extend my sincere gratitude towards my advisor, Prof. Uday B. Pal. He
has been a constant source of encouragement all through my three years at M.I.T. The advice he
has provided will be invaluable to me in my future career. I am especially thankful to him for
understanding my time constraints during the last semester. Receiving this second masters would
not have been possible without his support.
I would also like to thank Dr. Richard Tabors for advising me through my tumultuous last
semester in Technology and Policy. But for his help, I would have found it difficult to graduate in
time.
I am thankful to my officemates, Ashish Agarwal, Dr. David Woolley and Dr. Stephen
Britten for making my stay at M.I.T all the more exciting and enjoyable. I consider myself
extremely fortunate to have met David and hope our relationship only gets better.
Finally, I would like to acknowledge the financial support received from the National
Institute of Standards and Technology.
Contents
1 Introduction.............................................................................................................. 12
2 Conventional Technology: Pulp/Paper ....................... ........... 16
2.1 Introduction and Role in the U.S. Economy ................................... .................. 16
2.2 Fiber Furnish Preparation and Handling ................... ....... ...................... 17
2.3 Pulping ......................... ...................... 18
2.3.1 Chemical Pulping ............................................................... ..... .......... 18
2.3.2 Pulp Processing .................... ........................................ ............20
2.3.3 Kraft Chemical Recovery System ...................... ................................................. 21
2.3.4 Bleaching 1...... ................................................ 22
2.4 Stock Preparation ............................................................... 24
2.5 Paper Making ................... ............................ ......................... 25
2.5.1 W et End Operations ..................... ..................... ... ..................... 25
2.5.2 Dry End Operations...................................... ......... .............................. ........... 26
3 Pollution Profile and Regulations ........................................................................ 29
3.1 W ater Pollution ........................... .......................................... . 29
3. 1.1 Water Use and Sources of Wastewater ....................................... ..................... 29
3.1.2 Wastewater Characterization: Conventional Pollutants .......................................... 31
3.1.3 Wastewater Characterization: Priority and Nonconventional Pollutants ................... 31
3.2 Effluent Limitations Guidelines (Clean Water Act) ........................................ 32
3.2.1 Best Practicable Control Technology Currently Available .................................... 33
3.2.2 Best Available Technology Economically Achievable (BAT) ........................ ........ 33
3.2.3 New Source Performance Standards (NSPS) ...................... ........ 35
3.3 A ir Pollution ............................................................................................................... 35
3.4 Clean Air Act ....................................................... 38
3.4.1 New Source Performance Standards ....................................... ...................... 38
3.4.2 Pending and Proposed Regulations ........................................ ............ ......... 39
4 No Regrets Pollution Prevention: Pulp/Paper................... .......... 40
4.1 Extended Delignification ....................................................... 40
4.2 Oxygen Delignification ............................................................ 43
4.3 Ozone Delignification ........................ .............. ...................... 48
4.4 Improved Brownstock Washing ......................... ....................................... 51
4.5 Peroxide-Enhanced Extraction ....................................... .................. 57
5 Conventional Technology: Iron and Steel ...................................... ......... 61
5.1 Cokem aking ........................................... ....... .. ........ ...... ................. 63
5.2 Ironm aking in the Blast Furnace ................................................................................ .. 70
6 Regulations ............................................................................................................... 75
6.1 C lean A ir A ct ...................... .. . .............................. ..... ................. 75
6.1.1 National Primary and Secondary Ambient Air Quality Standards 40CFR50............ 75
6.1.2 National Emission Standards for hazardous Air Pollutants (NESHAPs) .................. 76
National Emission Standards for Coke Oven Batteries 40CFR63 Subpart L................................ 77
National Emission Standard for Benzene Emissions from Coke Byproduct Recovery Plants40CFR61 Subpart L................................................. ........... ........... 78
National Emission Standards for Halogenated Solvent Cleaning 40CFR63 Subpart T ............... 78
National Emission Standards for Hazardous Air Pollutants for Industrial Process Cooling Towers40CFR63 Subpart Q ....................................................................... ............ ........... 79
6.1.3 Pending and Proposed Regulations ................................................. 79
6.2 Clean Water Act ............... ... ........................................ 79
6.2.1 Effluent Limitations Guidelines and Standards 40CFR420 ....................................... 80
6.2.2 Regulations Governing Storm Water Discharges ......................... 82
6.2.3 Pending and Proposed Regulations .................................................... 82
6.3 Resource Conservation and Recovery Act .................................................................. 82
7 No Regrets Pollution Prevention: Iron/Steel ......................................................... 87
7.1 Sm elt R eduction .................... ................................................. ... .......... 87
7.2 A lternative Fuels ............................................................................................. ............... ....97
8 Summary and Conclusion ...................................... 109
Bibliography ................................................. 110
Appendix A ................................................ 113
List of Figures
1-1 Total releases of toxic chemicals by the U.S. manufacturing industry (summary of 1993
TR I data) [1 ]. .. ......................................... .................... ............. .......... ............ 14
1-2 Manufacturing industry shipments for the top ten manufacturing industries, total industry
shipments are 2821 billion dollars [2] .............................. ......... ............ 15
2-1 Simplified flow diagram of an integrated mill (chemical pulping, bleaching, and paper
production). ....................................................... .. ................. 17
2-2 Schematic of the Kraft pulping process..... ................................................. ............. 19
2-3 Flow diagram of a typical bleach plant ............................................................ 23
2-4 Fourdrinier paper machine ........................................ .................. 27
2-5 Schematic of a headbox illustrating (1) flow spreader with (2) tapered laterals, (3)
rectifier rolls, (4) slice assembly, and (5) slice profile adjustment ............................... 27
2-6 Diagram of fourdrinier wet end. ............................................................ 28
2-7 Schematic of a cylinder-drying configuration............................ ................ 28
4-1 Rapid displacement heating cycle for batch digester systems ...................................... 41
4-2 Electricity consumption for ozone production........................... ................. 49
4-3 Alternative methods to rotary vacuum washing........................... .................. 52
4-4 Effect of organic carry-over on formation of 2,3,7,8-TCDF, tetrachlorinated phenolics,
and AOX in C- and E-stage filtrates [13]......................................................53
4-5 Effect of carry-over on relative bleaching costs in C and E stages [131 ....................... 56
4-6 Results using hydrogen peroxide enhanced extraction - bleaching strategy [ 15]...........58
5-1 Schematic process flowsheet for integrated and mini-mill steel production. ................ 62
5-2 Sequence of operations involved in charging, leveling, and pushing of a byproduct coke
oven ....................... ................... ... .............................. ....................................... 64
5-3 Firing method employed in byproduct coke ovens ..................... ..... 65
5-4 Schematic diagram of a primary cooler. .......................................................... 66
5-5 Essential parts and operation of an ammonia still.............................. ........... 67
5-6 Energy/materials balance for the coke oven works [211. ........................................... 69
5-7 Schematic of a blast-furnace plant 122]. .................................................................... 71
5-8 Blast-furnace gas cleaning equipment (dustcatcher and venturi washer) ..................... 73
5-9 Blast furnace material balance (all quantities in amount/metric thm) [19] ................... 74
7-1 CO REX process [28]. ................................................................. 88
7-2 Investment costs for COREX and conventional coke-oven/BF facilities 127]. ...............92
7-3 Cost of hot metal produced by COREX process and BF for I million tonne/year
operation [271 ......................................................................................................... ...... 92
7-4 Process route at Jindal-Vijayanagar Steel, India ......................................... ... 93
7-5 Relative costs of different steelmaking routes (annual capacity, 800,000 tons) [27j. ..... 95
7-6 Process route at HANBO, South Korea 1281. ................... ..........................96
7-7 U.S. prices of crude oil and coal supply to industry 134, 351 ........................................ 98
7-8 Diagram of a coal preparation and pulverization system 1361. ...................................... 98
7-9 Processed-coal size ranges and the types of injection systems ................................ 99
7-10 Comparison of the types of coal injection systems: (a) Individual tuyere supply and (b)
Uniform tuyere supply [36].............. ................................ 99
7- 11 Effect of coke and coal on hot metal cost. ........................................... 100
7-12 Influence of an all-coke operation and PCI operation on energy ................................ 106
7-13 Influence of an all-coke operation and PCI operation on costs.................................... 106
7-14 Comparison of hot metal costs for pulverized coal, oil and natural gas injection 1361..107
List of Tables
2-1 Pulp production in the U.S. (1990) [5]........................ ...... ..................... 18
2-2 Chemicals used in pulp bleaching ......................... ............................. 23
3-1 Production normalized flow discharged to treatment (m3/metric ton of final product) [4].
..........................................................................................................................................2 9
3-2 Wastewater sources and recycling paths for kraft chemical pulping mills .................... 30
3-3 Industry-wide discharge of conventional pollutants (billion kg/yr.) [4] .......................... 31
3-4 Total discharges for priority and nonconventional pollutants (as of 1992). .................. 34
3-5 Proposed BPT effluent limitations guidelines (kg/kkg of product) .............................. 34
3-6 Proposed BAT limitations for papergrade kraft subcategory................................34
3-7 Proposed NSPS for bleached kraft subcategory................. .... ........ 35
3-8 Typical emissions for kraft pulping facilities [7].......................................................... 36
3-9 Air pollution outputs from chemical recovery in a kraft pulp mill [6] ......................... 37
3-10 SLmmary of typical air emissions for kraft bleach plant facilities [7] .......................... 37
3-11 Summary of NSPS regulations for emissions from kraft pulping facilities [7]. .............. 38
4-1 Characteristics of conventional vs. MCC and RDH pulping 18]....................................42
4-2 Electricity use in the manufacture of major bleaching chemicals [3] ........................... 43
4-3 Effluent summary for kraft softwood [9]..... ................................ 44
4-4 Comparison of energy consumption for a high consistency oxygen reactor using
softwood kraft pulp at 50% oxygen delignification [9] .................... ... 45
4-5 Typical chemical consumption for bleaching to 90% ISO brightness 191 .................... 46
4-6 Differences in variable operational costs in $/metric ton (in relation to a conventional
system , a 600-m etric ton/day m ill) [10] ................................................... ..................... 47
4-7 Difference in total costs for oxygen bleaching in a kraft mill in relation to a conventional
system, a 600-metric ton/day mill ($/ton. except where noted) [10 ............................. 47
4-8 Percent reduction in emissions for OZEoD bleaching of kraft pulp [ 12] ..................... 49
4-9 Chemical usage for CEDED and OZEoD bleaching [ I ].......................................... 50
4-10 Bleaching chemical costs of ozone versus conventional sequences at Union Camp's
Franklin V irginia m ill [8]...................................................... ........... 50
4-11 Impacts of improved washing practices on formation of 2,3,7,8-TCDD (concentration in
ppt) [8]. ..................................................................... 54
4-12 Key operating parameters for three proposed washing systems and the existing line at
case study linerboard m ill [14].........................................................5........55
4-13 Operating cost items for existing washing line vs. three modern systems [141 ............... 55
4-14 Annual operating cost savings (x 1,000$) for each proposed washer system vs. the mill's
existing w asher line [14]............................................... ............................. .............. 56
4-15 Implementing peroxide extraction [15] ....................................................... ............... 57
5-1 Typical composition of coke-plant waste water after treatment [ 191. ............................. 68
5-2 Blast furnace energy balance [191 ....................................................... ....................... 74
6-1 National ambient air quality standards for criteria pollutants ............................. ....... 76
6-2 National emission standards for coke oven batteries .................... ....................... 77
6-3 Effluent limitations and standards for by-product cokemaking (maximum for one day,
kg/kkg of product)................................. 8.1....................81
6-4 Effluent limitations and standards for ironmaking in the blast furnace (maximurn for one
day, kg/kkg of product) ................................................. .................................. ........... 81
6-5 RCRA wastes generated during coke, iron and steelmaking operations [25] ................. 83
6-6 Generic exclusion levels for K061 HTMR residues [26].............................................85
7-1 Typical emissions from traditional and COREX processes [30]. .................................... ....... 89
7-2 Analyses of process water from different ironmaking facilities 130].. ............................. 90
7-3 Comparison of liquid iron made by the COREX and BF processes [32] ..................... 91
7-4 Effect of coal injection on blast furnace performance ...................................... 101
7-5 Comparison of energy balance between all-coke and PCI operation........................... 102
7-6 Data for comparing energy and cost of the all-coke and PCI practice at Hoogovens .... 103
7-7 Operating data for pulverized coal injection at Armco [33]....................................... 107
7-8 Operational data for PCI operation at VSZ Steel Ltd. [21 ]............................ 108
7-9 Pollution reduction through installation of pulverized coal injection [21] .................... 108
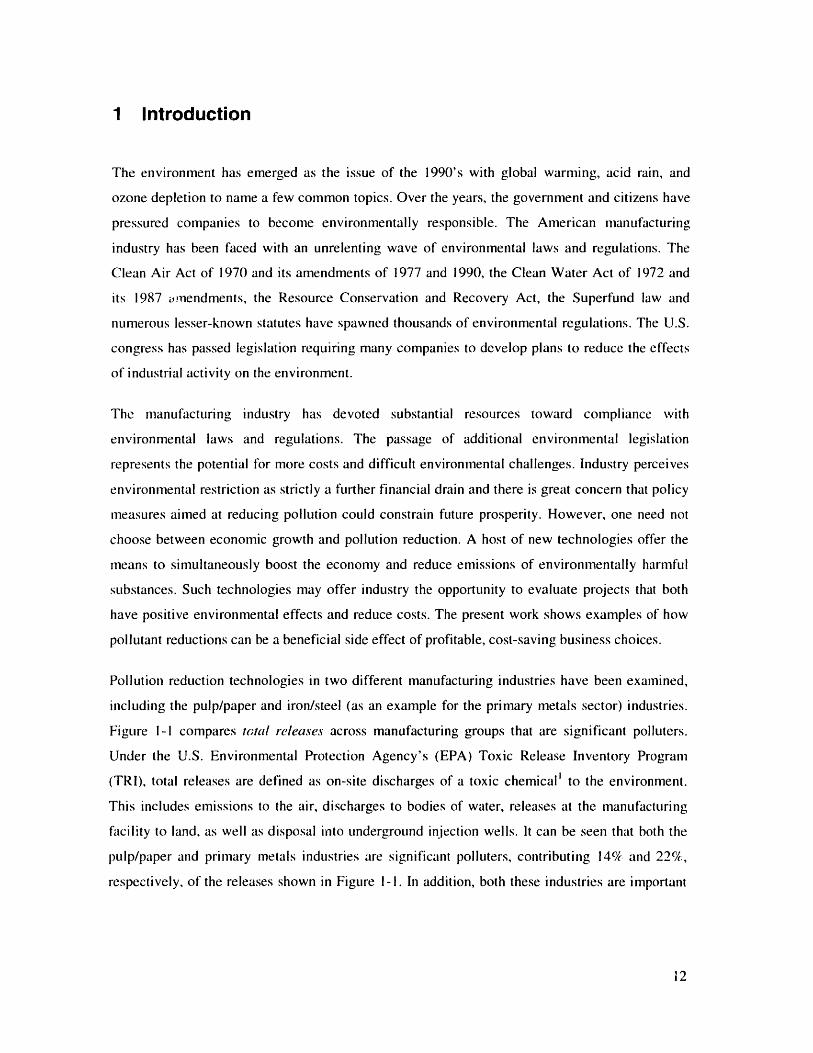
1 Introduction
The environment has emerged as the issue of the 1990's with global warming, acid rain, and
ozone depletion to name a few common topics. Over the years, the government and citizens have
pressured companies to become environmentally responsible. The American nianufacturing
industry has been faced with an unrelenting wave of environmental laws and regulations. The
Clean Air Act of 1970 and its amendments of 1977 and 1990, the Clean Water Act of 1972 and
its 1987 amendments, the Resource Conservation and Recovery Act, the Superfund law and
numerous lesser-known statutes have spawned thousands of environmental regulations. The U.S.
congress has passed legislation requiring many companies to develop plans to reduce the effects
of industrial activity on the environment.
The manufacturing industry has devoted substantial resources toward compliance with
environmental laws and regulations. The passage of additional environmental legislation
represents the potential for more costs and difficult environmental challenges. Industry perceives
environmental restriction as strictly a further financial drain and there is great concern that policy
measures aimed at reducing pollution could constrain future prosperity. However, one need not
choose between economic growth and pollution reduction. A host of new technologies offer the
means to simultaneously boost the economy and reduce emissions of environmentally harmful
substances. Such technologies may offer industry the opportunity to evaluate projects that both
have positive environmental effects and reduce costs. The present work shows examples of how
pollutant reductions can be a beneficial side effect of profitable, cost-saving business choices.
Pollution reduction technologies in two different manufacturing industries have been examined,
including the pulp/paper and iron/steel (as an example for the primary metals sector) industries.
Figure 1-1 compares total releases across manufacturing groups that are significant polluters.
Under the U.S. Environmental Protection Agency's (EPA) Toxic Release Inventory Program
(TRI), total releases are defined as on-site discharges of a toxic chemical' to the environment.
This includes emissions to the air, discharges to bodies of water, releases at the manufacturing
facility to land, as well as disposal into underground injection wells. It can be seen that both the
pulp/paper and primary metals industries are significant polluters, contributing 14% and 22%,
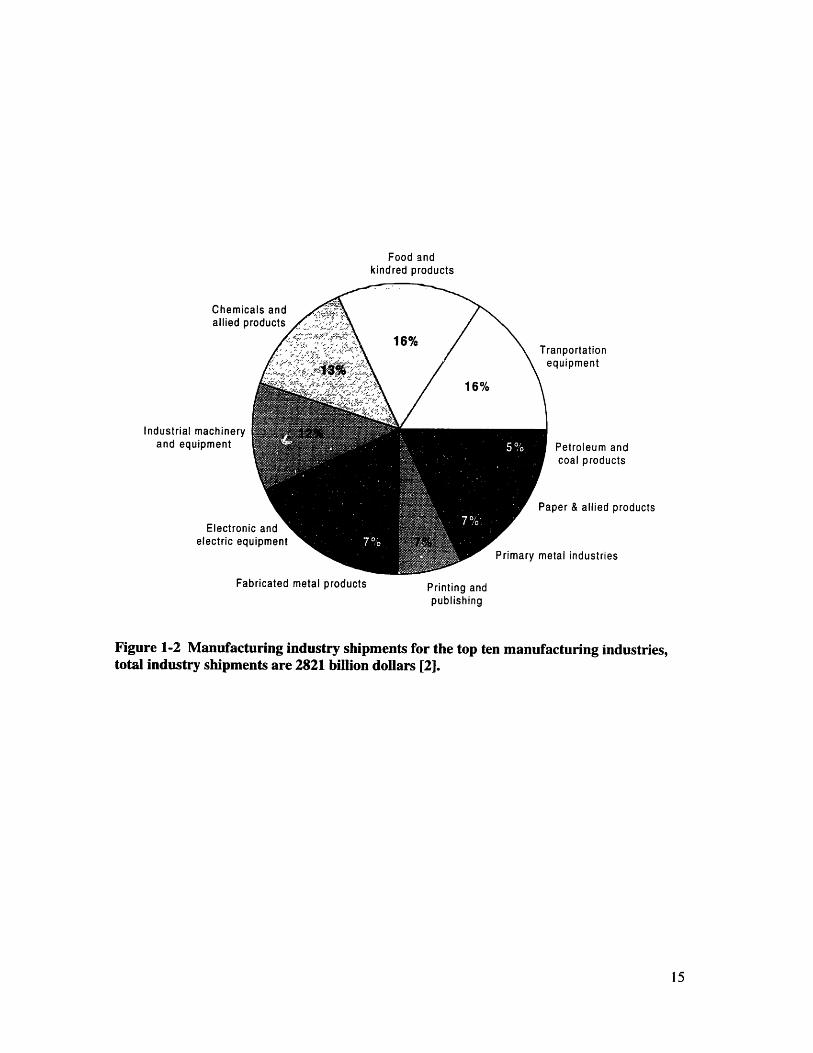
respectively, of the releases shown in Figure 1-1. In addition, both these industries are important
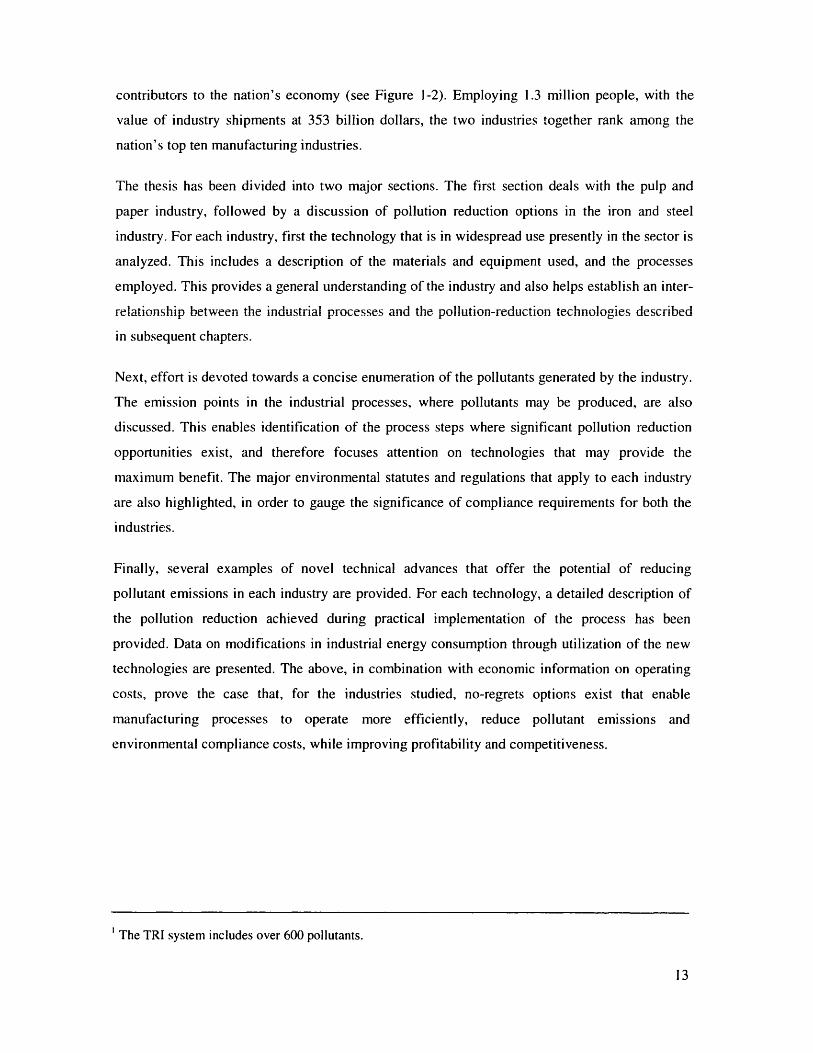
contributors to the nation's economy (see Figure 1-2). Employing 1.3 million people, with the
value of industry shipments at 353 billion dollars, the two industries together rank among the
nation's top ten manufacturing industries.
The thesis has been divided into two major sections. The first section deals with the pulp and
paper industry, followed by a discussion of pollution reduction options in the iron and steel
industry. For each industry, first the technology that is in widespread use presently in the sector is
analyzed. This includes a description of the materials and equipment used, and the processes
employed. This provides a general understanding of the industry and also helps establish an inter-
relationship between the industrial processes and the pollution-reduction technologies described
in subsequent chapters.
Next, effort is devoted towards a concise enumeration of the pollutants generated by the industry.
The emission points in the industrial processes, where pollutants may be produced, are also
discussed. This enables identification of the process steps where significant pollution reduction
opportunities exist, and therefore focuses attention on technologies that may provide the
maximum benefit. The major environmental statutes and regulations that apply to each industry
are also highlighted, in order to gauge the significance of compliance requirements for both the
industries.
Finally, several examples of novel technical advances that offer the potential of reducing
pollutant emissions in each industry are provided. For each technology, a detailed description of
the pollution reduction achieved during practical implementation of the process has been
provided. Data on modifications in industrial energy consumption through utilization of the new
technologies are presented. The above, in combination with economic information on operating
costs, prove the case that, for the industries studied, no-regrets options exist that enable
manufacturing processes to operate more efficiently, reduce pollutant emissions and
environmental compliance costs, while improving profitability and competitiveness.
'The TRI system includes over 600 pollutants.
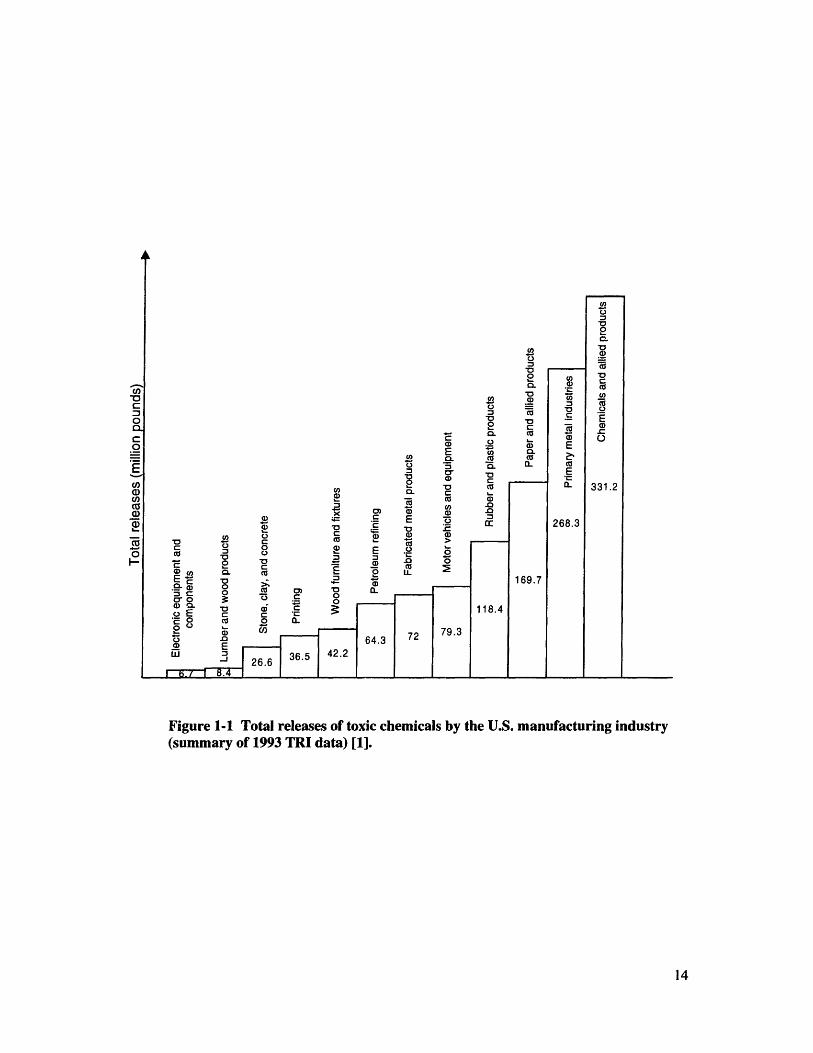
Figure 1-1 Total releases of toxic chemicals by the U.S. manufacturing industry(summary of 1993 TRI data) [1].
14
Food andkindred products
Chemicallied p
)ortationpment
Industrial machineryand equipment
Electronelectric eq
troleum andoal products
& allied products
industries
Fabricated metal products Printing andpublishing
Figure 1-2 Manufacturing industry shipments for the top ten manufacturing industries,total industry shipments are 2821 billion dollars [2].
2 Conventional Technology: Pulp/Paper
2.1 Introduction and Role in the U.S. Economy
The United States has the world's largest installed pulp, paper, and paperboard production
capacity, approximately 86 million air-dry2 metric tons (ADMT) per year in 1994, or 30% of
world capacity [3]. Based upon responses to the Environmental Protection Agency's 1990
National Census of the pulp and paper industry, the Agency estimates that there are
approximately 565 manufacturing facilities located in 42 states [4]. The Bureau of the Census
estimates that in 1995, 629,500 people were employed in the paper and allied products sector,
with a payroll of $22 billion [2].
The paper and allied products sector is described under Standard Industrial Classification (SIC)
code 26. Manufacturing facilities in this sector can be classified as market pulp facilities that
produce pulp only, non-integrated facilities that only manufacture primary paper products from
pulp, and integrated facilities that produce the pulp they use for primary paper manufacture on-
site.
Paper is manufactured by applying a watery suspension of cellulose fibers to a screen which
allows the water to drain and leaves the fibrous particles in the form of a sheet. The watery
fibrous substrate which is formed into paper sheets is called pulp. A pulp mixture is produced by
digesting a material into its fibrous constituents via chemical, mechanical or a combination of
chemical or mechanical means. The pulp is then transferred to a plant complex for manufacture
into paper products. On a tonnage basis, chemical pulping methods produced approximately 85%
of the pulp manufactured domestically in 1991, mechanical pulp 10% and semi-chemical (i.e.
combined chemical and mechanical) 5% [5]. Due to its dominance, the present study concentrates
on paper manufacture via chemical pulping means. In order to place the environmental profile of
the industry in perspective, this chapter describes the manufacturing processes used in chemical
pulping and subsequently, paper manufacture.
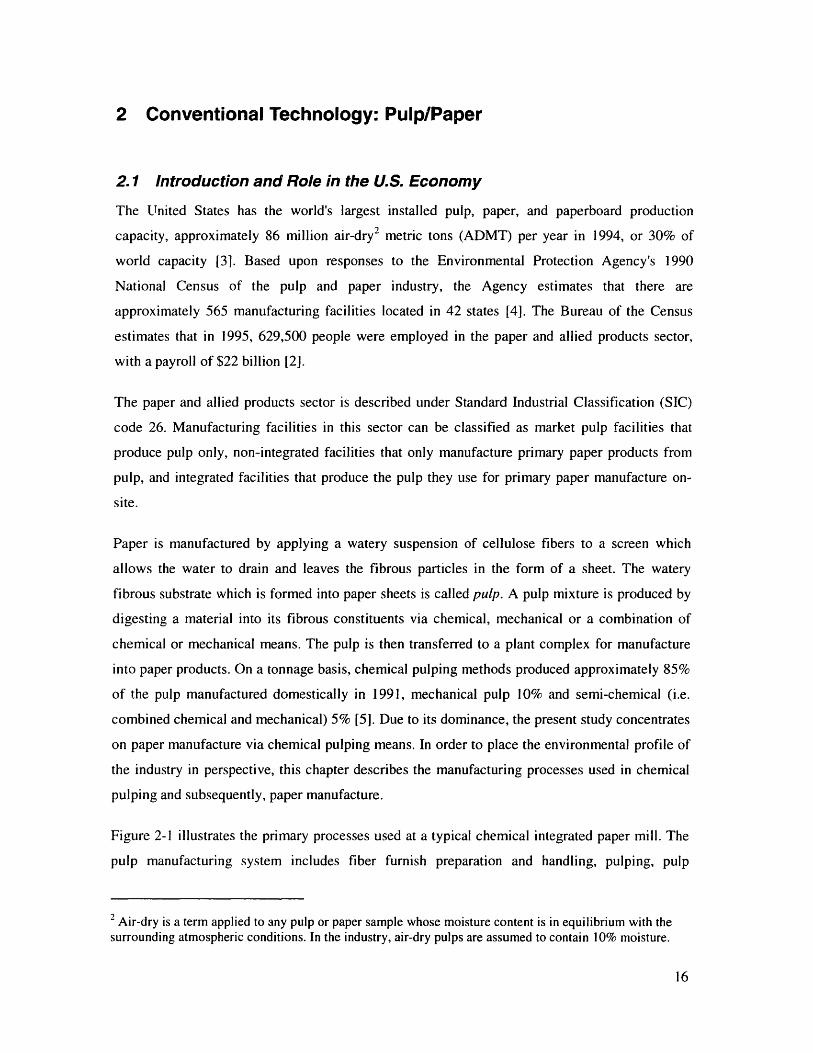
Figure 2-1 illustrates the primary processes used at a typical chemical integrated paper mill. The
pulp manufacturing system includes fiber furnish preparation and handling, pulping, pulp
2 Air-dry is a term applied to any pulp or paper sample whose moisture content is in equilibrium with thesurrounding atmospheric conditions. In the industry, air-dry pulps are assumed to contain 10% moisture.
processing, chemical recovery, bleaching and stock preparation. Paper-making processes consist
of wet-end operations, dry-end operations, paper drying, and finishing. All of these processes are
briefly discussed in the following sections (details can be found in [5]).
Figure 2-1 Simplified flow diagram of an integrated mill (chemical pulping, bleaching, and paperproduction).
2.2 Fiber Furnish Preparation and Handling
Furnish is the blend of fibrous materials used to make pulp. A wide variety of fiber furnish types
are used in the industry, but the most widely used is wood. According to the 1990 EPA Census,
wood furnish averages approximately 50% of pulp content industry-wide. Wood preparation
entails converting wood into a form amenable to pulping. Tree-length logs are generally cut to
manageable lengths using a slasher, followed by log washing and debarking. Debarked logs are
generally chipped using blades mounted on a rotating disk. After chipping, wood chips are passed
over vibratory screens to remove oversized chips and fines (the process is known as chip
refining). After screening, chips are moved to subsequent operations via conveyors. Chip bins or
silos may also be used to facilitate metering and blending of chips prior to pulping.
2.3 Pulping
2.3.1 Chemical Pulping
Pulping processes convert raw materials into fibers that can be formed into a sheet. In the case of
wood furnish, the fibrous particles used to make paper are made of cellulose, a primary
component of the cell walls of vascular plant tissues. The objective of chemical pulping is to
degrade and dissolve away the lignin that binds the cellulose fibers together. In chemical pulping,
the wood chips are cooked with the appropriate chemicals in an aqueous solution at elevated
temperature (115 to 170 0 C) and pressure. The two principal methods are the kraft process and the
sulfite process. Annual pulp production in the U.S. by each major process is shown in Table 2-1.
Kraft pulping processes produced approximately 80% of all U.S. pulp tonnage during 1993
according to the American Forest and Paper Association (AFPA). The kraft process has come to
occupy the dominant position because of advantages in recovery of pulping chemicals, pulp
strength and is described below.
Table 2-1 Pulp production in the U.S. (1990) [5].
Pulping method Production (million
short tons)
Total sulfite 1,416
Total kraft 45,143
Semi-mechanical 3,828
Mechanical 5,854
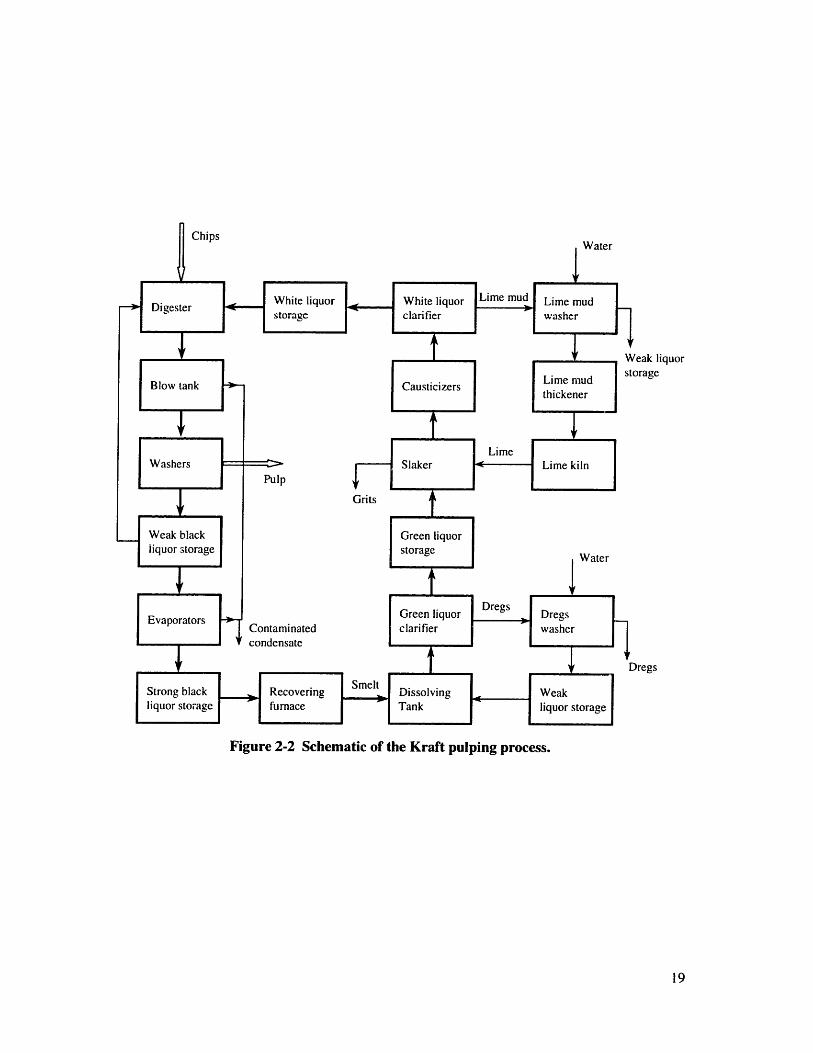
The sequential steps in the kraft pulping process are shown schematically in Figure 2-2. The kraft
process uses a sodium-based alkaline pulping solution (white liquor) consisting of Na2S and
NaOH. The white liquor is mixed with wood chips in a reaction pressure vessel known as a
digester. The digester process is called cooking and can be either batch or continuous. In batch
cooking, the digester vessel is filled with chips and enough liquor is added to cover the chips. A
eak liquororage
)regs
Figure 2-2 Schematic of the Kraft pulping process.
modern batch digester is provided with a circulation system and heat exchanger for bringing the
contents to pulping temperature. A common circulation design draws liquor from the midpoint of
the digester, through a heat exchanger, and distributes the return flow to the top and bottom of the
digester vessel. Air and other non-condensible gases are relieved through a pressure control valve
at the top of the vessel. The output products are separated fibers and residual black liquor that
contains the dissolved lignin solids in a solution of reacted and unreacted pulping chemicals.
After digestion, the contents are discharged into a blow3 tank. Steam released during the blow
flashes4 from the liquor, while the cook spontaneously cools. A blow heat recovery system is
used to recover the heat from the flash steam in a usable form. The flash steam from the liquor
carries over to the top of the blow-tank accumulator, where it enters a direct-contact condenser
along with cool water pumped from the bottom of the tank. The steam condenses, producing hot
"contaminated" water. This "dirty" water is pumped through a heat exchanger to heat fresh, clean
water for pulp washing; after which it is returned in a cold condition to the bottom of the
accumulator.
The most widely utilized continuous digester is the Kamyr vertical downflow type. In continuous
cooking, the chips are preheated in a steaming vessel before entering the digester to remove air
and other non-condensibles. The preheated chips are soaked in the cooking liquor and are then
deposited inside the continuous reaction vessel. The chip mass travels downward through the
digester via gravity. After entering the digester, the mixture of chips and white liquor is heated as
in batch digesters. The pulping reaction is stopped by extracting the hot residual liquor into a
flash tank that supplies steam to the steaming vessel. The hot liquor is displaced by upward-
flowing brown stock washer filtrate (see Section 2.3.2) which is injected near the bottom of the
vessel and moves countercurrent to the chip flow to provide "diffusion washing".
2.3.2 Pulp Processing
The primary pulp processing operations include defibering, deknotting, brown stock washing,
pulp screening, and centrifugal cleaning. Defibering is akin to chip refining and is used to
separate the fibers. Knots are generally defined as the fraction of pulp that is retained (as wood
chips or fiber bundles) on a 3/8" perforated plate. Knots are removed prior to pulp washing. The
cooked pulp from the digesters is then washed with the objective to:
3 Blow stands for discharge under pressure from a digester.
1. remove residual liquor that would contaminate the pulp during subsequent bleaching, and
2. maximize return of spent cooking liquor to chemical recovery.
The most common washing technology is rotary vacuum washing. The vacuum washer is a wire-
or cloth-covered cylinder that rotates in a vat containing the pulp slurry. By means of internal
valving, a vacuum is applied as the rotating drum enters the stock. A thick layer of pulp builds up
and adheres to the wire surface as it emerges from the vat. Wash water is applied to displace the
black liquor in the sheet as the drum continues to rotate. Finally, the vacuum is cut off and the
washed pulp is removed from the mold.
In most pulp and paper processes, a pulp screening operation is required to remove oversized or
unwanted particles from good papermaking fibers. Many types of screens are available, but they
all depend on some form of perforated barrier to pass acceptable fiber and reject the unwanted
material. All screens are equipped with a mechanism to continuously or intermittently clean the
openings in the perforated barrier. In open screen rooms, wastewater from the screening process
goes to wastewater treatment prior to discharge. In closed-loop screen rooms, wastewater from
the process is reused in other pulping operations and ultimately enters the mill's chemical
recovery system. Rejects from the screening process are either repulped or disposed of as solid
waste. Centrifugal cleaning is used after screening to remove high specific gravity contaminants
such as sand and dirt. Following low-consistency5 operations such as cleaning and screening, the
stock is thickened, i.e. it's consistency is increased, prior to the next process operation
(bleaching).
2.3.3 Kraft Chemical Recovery System
The recovery of chemicals from the spent cooking liquor and the reconstitution of these
chemicals to form fresh cooking liquor is necessary for viable economic operation of chemical
pulp mills. These objectives are achieved through a series of steps, starting with the weak black
liquor recovered from brown stock washing, screening, and de-knotting (see Figure 2-2).
Residual weak black liquor is concentrated by evaporation to form "strong black liquor". Water
removal is usually carried out in multiple-effect evaporators, a series of evaporators operated at
4 Flashing is defined as the spontaneous boiling or cooling of a liquid caused by reduction of pressurebelow the vapor pressure of the liquid.5 Consistency is defined as the weight percent of pulp in a pulp and water mixture.
different pressures so that the vapor from one evaporator body becomes the steam supply to the
next evaporator. The strong black liquor from the evaporators is burned in a Tomlinson recovery
boiler. Combustion air in the recovery furnace is used to evaporate residual moisture from the
liquor solids and to burn the organic constituents in the liquor with maximum combustion
efficiency. Carbon and carbon monoxide generated act as reducing agents to convert oxidized
sulfur compounds to sulfides. The heat released during combustion of the organic fuel is used for
steam generation and is also sufficient to melt the sodium salts. The product of the recovery
furnace is a molten inorganic process smelt, consisting of Na 2S and Na 2CO3. The smelt flows by
gravity through water-cooled spouts to a dissolving tank.
Recausticizing starts with the dissolving of furnace smelt in "weak wash" to form green liquor.
The green liquor is then clarified to remove unburned carbon and inorganic impurities (dregs).
The clarifying operation essentially consists of settling and decantation. The dregs are mixed with
wash water and settled again in a dregs washer. The clear liquor containing the recovered soda
chemical is known as weak wash. The clarified green liquor is subsequently reacted with CaO to
form Ca(OH) 2, which in turn reacts with Na 2CO3 precipitating CaCO 3 and leaving an aqueous
solution of NaOH and Na 2S (fresh white liquor). The white liquor is clarified to remove
precipitated lime mud (CaCO 3), and is then ready to be used for cooking. The lime mud is
converted to quick lime via calcination in a lime kiln for reuse in the recausticizing cycle.
2.3.4 Bleaching
Bleaching is defined as any process that chemically alters pulp to increase its brightness.
Bleached pulps create papers that are whiter, brighter, softer, and more absorbent than unbleached
pulps. Of the approximately 72 million tons of pulp used in paper production in the U.S. in 1993,
50% was bleached [6]. A bleach plant consists of multiple alternating stages of chemical
bleaching and washing with water (see Figure 2-3). Typically, the chemical bleaching stages
alternate acid and alkaline conditions. Cellulose is inherently white and does not contribute to
color. It is generally agreed that lignin is principally responsible for imparting color to paper.
The early stages of bleaching may be considered as a continuation of the delignification 6 process
started by cooking. The later stages employ oxidizing agents to scavenge and destroy the residual
color. The most common bleaching chemicals used are elemental chlorine, chlorine dioxide,
6 Delignification is the process of dissolving lignin that binds the cellulose fibers together.
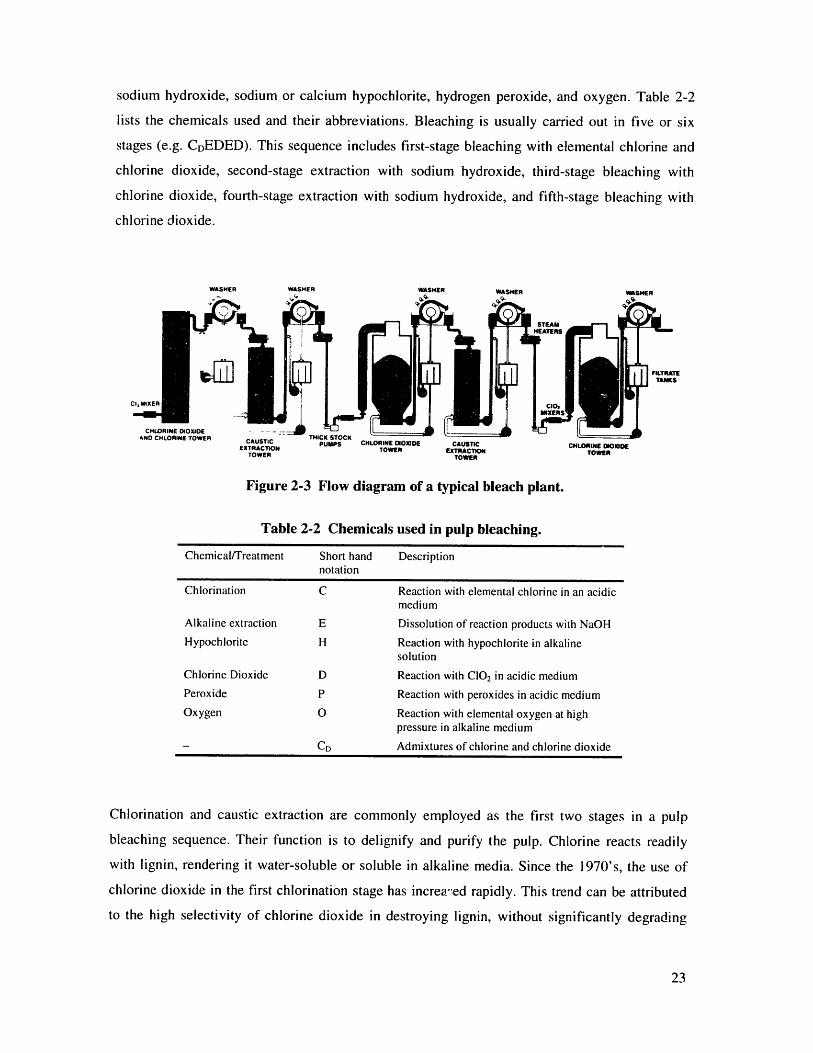
sodium hydroxide, sodium or calcium hypochlorite, hydrogen peroxide, and oxygen. Table 2-2
lists the chemicals used and their abbreviations. Bleaching is usually carried out in five or six
stages (e.g. CDEDED). This sequence includes first-stage bleaching with elemental chlorine and
chlorine dioxide, second-stage extraction with sodium hydroxide, third-stage bleaching with
chlorine dioxide, fourth-stage extraction with sodium hydroxide, and fifth-stage bleaching with
chlorine dioxide.
WASHER
Ltý/h
CI,
CHLORINE DIOXIDEAND CHLORINE TOWER
WASHER WASHER WASHER WASHER
] FILTRATETANKS
CAUSTIC CHLORINE DIO)OEEXTRACTION TOWER
TOWER
Figure 2-3 Flow diagram of a typical bleach plant.
Table 2-2 Chemicals
Chemical/Treatment Short handnotation
used in pulp bleaching.
Description
Chlorination C Reaction with elemental chlorine in an acidicmedium
Alkaline extraction E Dissolution of reaction products with NaOH
Hypochlorite H Reaction with hypochlorite in alkalinesolution
Chlorine Dioxide D Reaction with C10 2 in acidic medium
Peroxide P Reaction with peroxides in acidic medium
Oxygen O Reaction with elemental oxygen at highpressure in alkaline medium
CD Admixtures of chlorine and chlorine dioxide
Chlorination and caustic extraction are commonly employed as the first two stages in a pulp
bleaching sequence. Their function is to delignify and purify the pulp. Chlorine reacts readily
with lignin, rendering it water-soluble or soluble in alkaline media. Since the 1970's, the use of
chlorine dioxide in the first chlorination stage has increa':ed rapidly. This trend can be attributed
to the high selectivity of chlorine dioxide in destroying lignin, without significantly degrading
i;3s
cellulose. Efficient washing following the chlorination stage is important to minimize carry-over
of acid effluent to the next stage. In the alkaline extraction stage, removal of chlorinated and
oxidized lignin is accomplished by solubilization. The purpose of the latter acidic stages is to
remove the color imparting groups on any remaining lignin. Caustic extraction in the later stages
serves to remove the colored products. A significant bleaching development of the past decade is
the oxygen-enriched extraction stage. This refers to the use of elemental oxygen in the first
alkaline extraction stage of a conventional bleaching sequence. The oxygen selectively reacts
with residual lignin on the pulp, thereby enhancing the removal of lignin and providing additional
bleaching power. Wher oxygen is used in extraction, the bleaching stage is denoted as Eo.
Pulp bleaching is generally conducted in upflow or downflow bleach towers to provide retention
time for the bleaching reactions, followed by vacuum washers to remove residual chemicals.
Major auxiliary equipment includes various types of pumps for moving the stock and mixers for
blending in steam and chemicals.
2.4 Stock Preparation
Stock preparation is the interface between the pulp mill and the paper machine. The basic
objectives in stock preparation are to take the required fibrous raw materials (pulp) and non-
fibrous additives, treat and modify each constituent as required, and then combine all the
ingredients continuously and uniformly into the napermaking stock. The first step in stock
preparation is repulping and it refers to any mechanical action that disperses pulp fibers into a
water suspension. Typical devices for this purpose are called fiberizers, or deflakers. The pulp
fibers are further "developed" or modified for formation into paper by a mechanical treatment
called refining. Refining makes the finished paper stronger, more uniform, dense, opaque, and
less porous. Refining refers to the mechanical action of rotating bars, opposing a stationary
bedplate, on a circulating fiber suspension. The most common stock preparation refiners are those
equipped with a two-sided rotating disc sandwiched between two stationary refiner plates. The
gap between the plate surfaces determines the amount of work done on the pulp.
A wide variety of mineral and chemical agents are added to the stock, either to impart specific
properties to the paper product or to facilitate the papermaking process. Most paper manufactured
is sized to resist penetration by fluids. The action of a sizing agent is to provide the fiber surfaces
with a hydrophobic coating. Rosin, a resin obtained from pines, is the traditional sizing agent
applied. Starches, gums, and latexes are admixed with the stock to reinforce the fiber-to-fiber
bonds and thereby improve the paper strength. Wet-strength resins (e.g. urea-formaldehyde) can
be added for making papers that must retain strength when wet, such as paper towels. Finely-
divided white mineral fillers are added to papermaking furnishes to fill in the crevices between
fibers, thus producing a denser, softer, brighter, smoother and more opaque sheet. The common
papermaking fillers are clay, calcium carbonate, talc and titanium dioxide. Many papers are
colored by the addition of inorganic and organic synthetic dyes and pigments.
2.5 Paper Making
Paper making consists of wet end operations, including the formation of paper sheet from wet
pulp, and dry end operations, including the drying of paper product, application of surface
treatments, and spooling for storage.
2.5.1 Wet End Operations
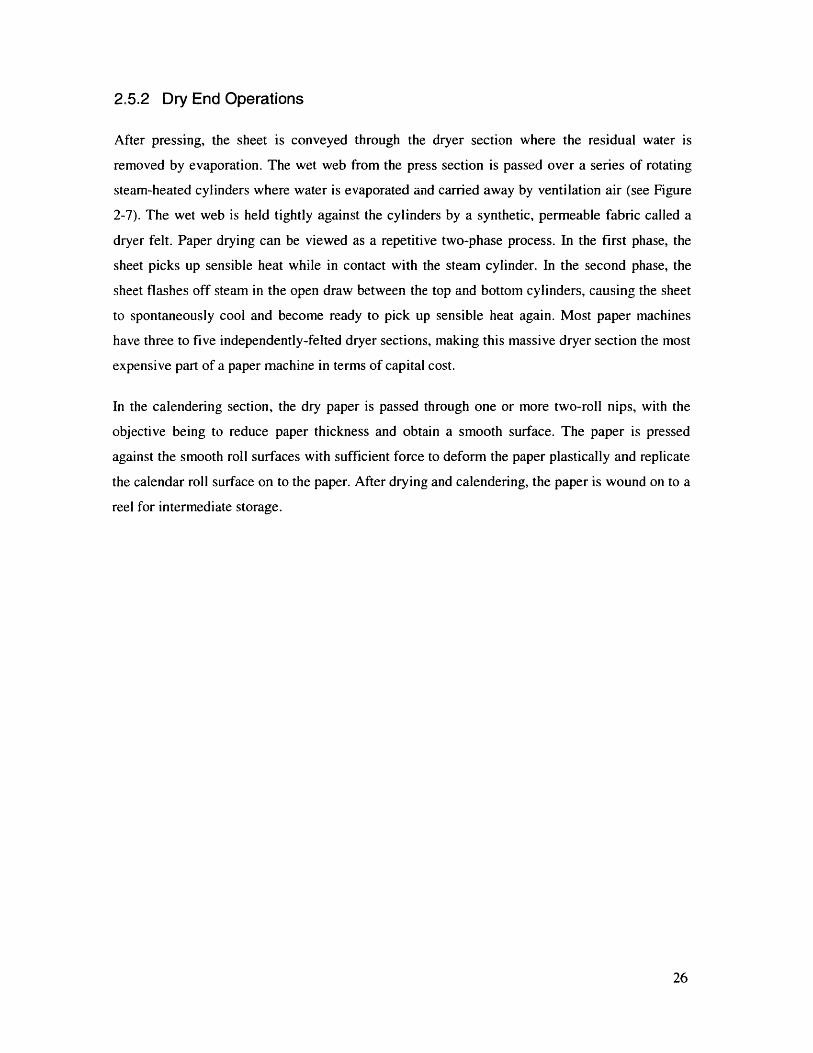
The processed pulp is converted into a paper product via a paper production machine, the most
common of which is the Fourdrinier paper machine (see Figure 2-4). Wet end operations begin
with the approach system, wherein, a fan pump serves to mix the stock with white water (white
water is the drainage from wet stock, in pulping and papermaking operations) and deliver the
blend to the flowspreader. The flowspreader takes the incoming flow from the fan pump and
distributes it evenly across the width of the headbox. The function of the headbox is to discharge
a jet of papermaking stock equal in width to the paper machine and at uniform velocity on to the
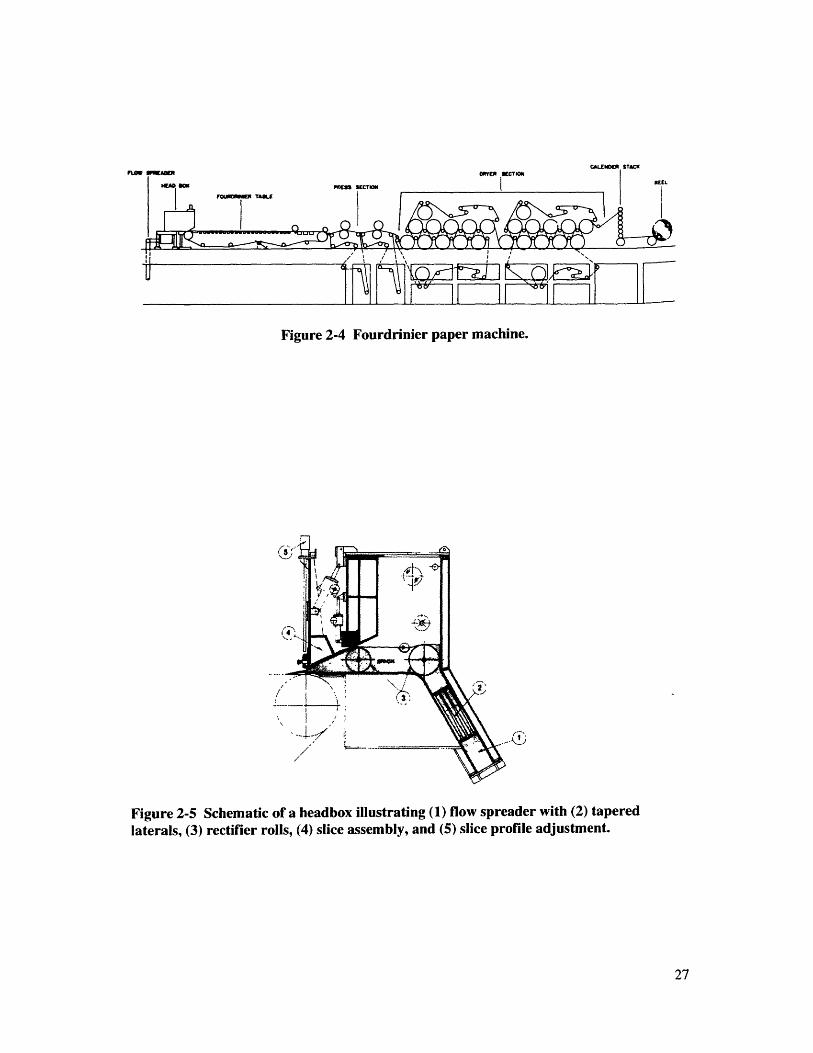
moving forming fabric. A design of a modern headbox is illustrated in Figure 2-5. Shear forces
applied through hollow perforated rolls (rectifier rolls) in the headbox are used to even out flow
irregularities and to create turbulence to break up the fiber network. The headbox slice is a nozzle
with an adjustable opening to give the desired rate of flow. A paper machine forming fabric is
basically a cloth woven from polyester filaments. The meshes of the fabric permit the drainage of
water while retaining the fibers. The fabric travels between two large rolls (see Figure 2-6), and
various elements between the rolls (hydrofoils, vacuum rolls and vacuum boxes) serve the dual
functions of wire support and water removal. Drainage, shear forces and turbulence along the
fourdrinier wire form the fibers into a continuous matted web.
The paper web is transferred from the forming wire section and conveyed on specially
constructed felts through a series of roll press nips and into the dryer section. The pressing
operation may be considered as an extension of the water-removal process that was started on the
wire. It is here that the fibers are forced into intimate contact so that fiber-to-fiber bonding
develops during drying.
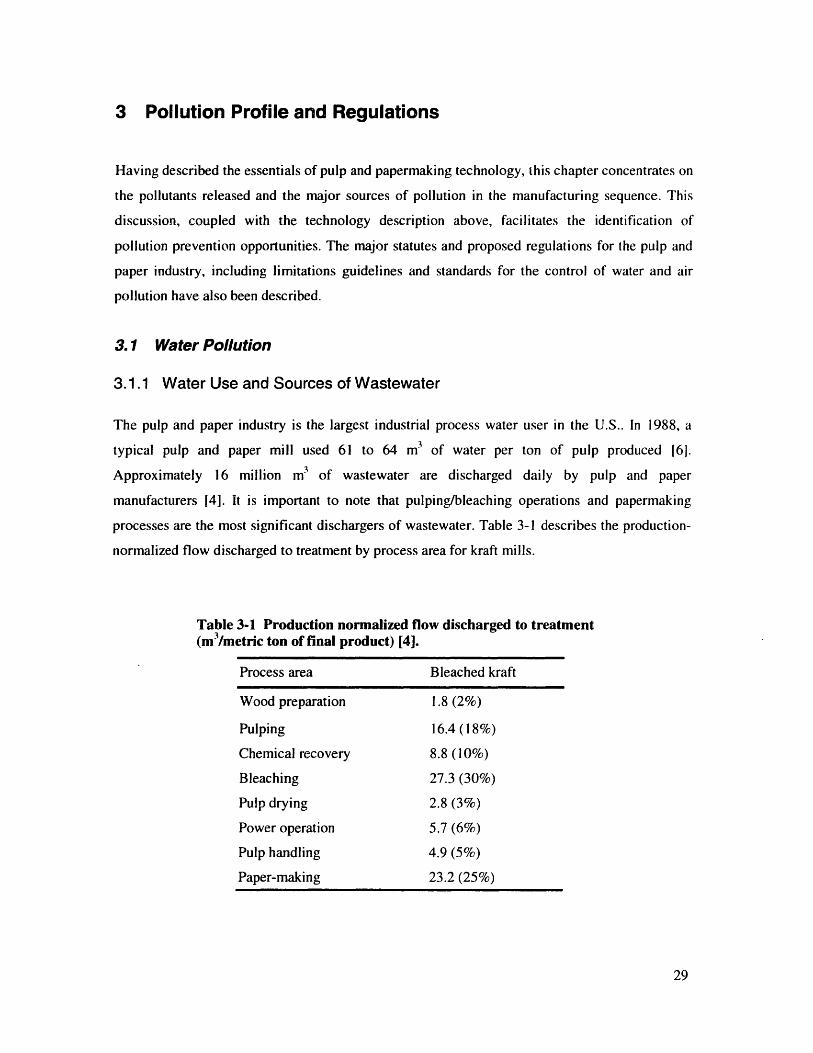
2.5.2 Dry End Operations
After pressing, the sheet is conveyed through the dryer section where the residual water is
removed by evaporation. The wet web from the press section is passed over a series of rotating
steam-heated cylinders where water is evaporated and carried away by ventilation air (see Figure
2-7). The wet web is held tightly against the cylinders by a synthetic, permeable fabric called a
dryer felt. Paper drying can be viewed as a repetitive two-phase process. In the first phase, the
sheet picks up sensible heat while in contact with the steam cylinder. In the second phase, the
sheet flashes off steam in the open draw between the top and bottom cylinders, causing the sheet
to spontaneously cool and become ready to pick up sensible heat again. Most paper machines
have three to five independently-felted dryer sections, making this massive dryer section the most
expensive part of a paper machine in terms of capital cost.
In the calendering section, the dry paper is passed through one or more two-roll nips, with the
objective being to reduce paper thickness and obtain a smooth surface. The paper is pressed
against the smooth roll surfaces with sufficient force to deform the paper plastically and replicate
the calendar roll surface on to the paper. After drying and calendering, the paper is wound on to a
reel for intermediate storage.
FLOW
Figure 2-4 Fourdrinier paper machine.
Figure 2-5 Schematic of a headbox illustrating (1) flow spreader with (2) taperedlaterals, (3) rectifier rolls, (4) slice assembly, and (5) slice profile adjustment.
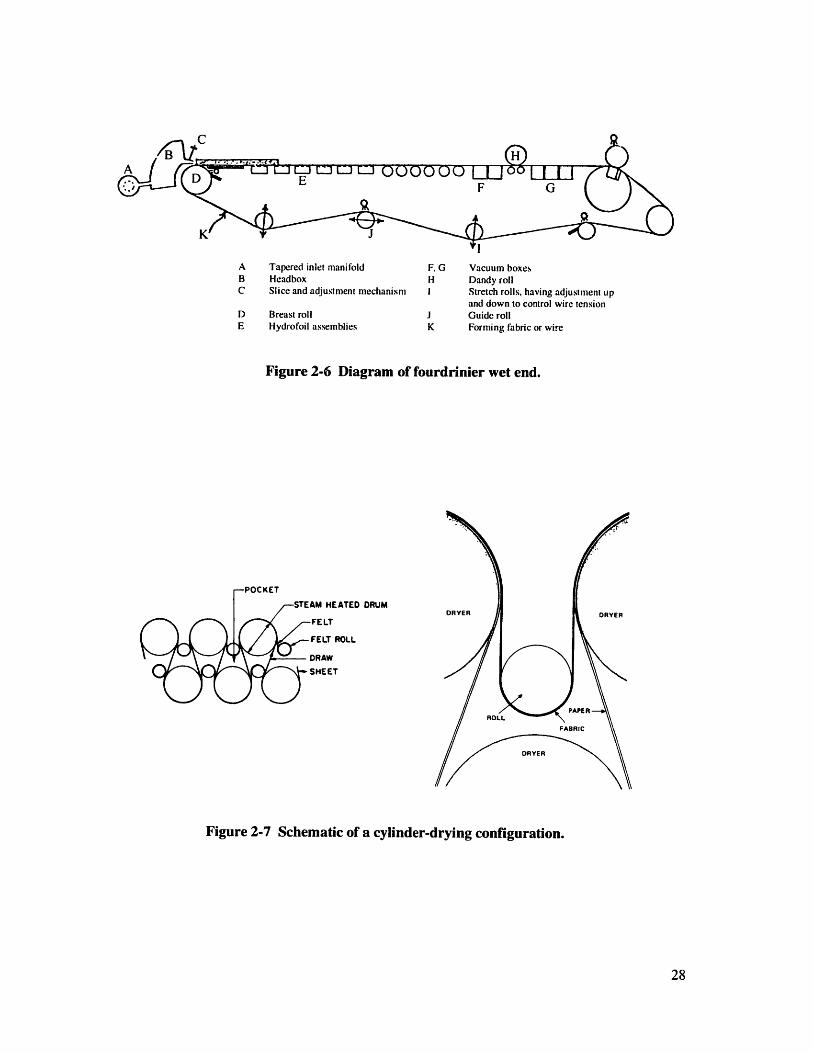
A Tapered inlet manifoldB HeadboxC Slice and adjustment mechanism
D Breast rollE Hydrofoil assemblies
F, G Vacuum boxesH Dandy rollI Stretch rolls, having adjustment up
and down to control wire tensionJ Guide rollK Forming fabric or wire
Figure 2-6 Diagram of fourdrinier wet end.
HEATED DRUM
LT
LT ROLL
AW
EET
Figure 2-7 Schematic of a cylinder-drying configuration.
3 Pollution Profile and Regulations
Having described the essentials of pulp and papermaking technology, this chapter concentrates on
the pollutants released and the major sources of pollution in the manufacturing sequence. This
discussion, coupled with the technology description above, facilitates the identification of
pollution prevention opportunities. The major statutes and proposed regulations for the pulp and
paper industry, including limitations guidelines and standards for the control of water and air
pollution have also been described.
3.1 Water Pollution
3.1.1 Water Use and Sources of Wastewater
The pulp and paper industry is the largest industrial process water user in the U.S.. In 1988, a
typical pulp and paper mill used 61 to 64 m3 of water per ton of pulp produced 161.
Approximately 16 million m of wastewater are discharged daily by pulp and paper
manufacturers [4]. It is important to note that pulping/bleaching operations and papermaking
processes are the most significant dischargers of wastewater. Table 3-1 describes the production-
normalized flow discharged to treatment by process area for kraft mills.
Table 3-1 Production normalized flow discharged to treatment(m3/metric ton of final product) [4].
Process area
Wood preparation
Pulping
Chemical recovery
Bleaching
Pulp drying
Power operation
Pulp handling
Paper-making
Bleached kraft
1.8 (2%)
16.4(18%)
8.8(10%)27.3 (30%)
2.8 (3%)
5.7 (6%)
4.9 (5%)
23.2 (25%)
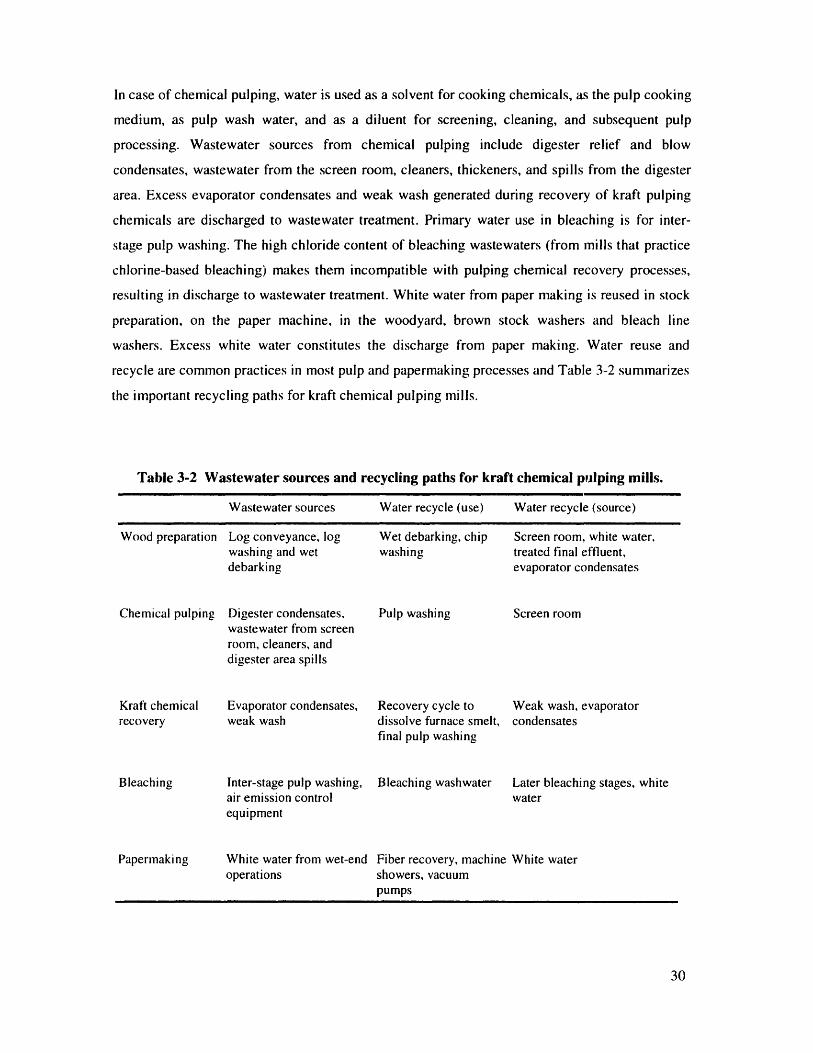
In case of chemical pulping, water is used as a solvent for cooking chemicals, as the pulp cooking
medium, as pulp wash water, and as a diluent for screening, cleaning, and subsequent pulp
processing. Wastewater sources from chemical pulping include digester relief and blow
condensates, wastewater from the screen room, cleaners, thickeners, and spills from the digester
area. Excess evaporator condensates and weak wash generated during recovery of kraft pulping
chemicals are discharged to wastewater treatment. Primary water use in bleaching is for inter-
stage pulp washing. The high chloride content of bleaching wastewaters (from mills that practice
chlorine-based bleaching) makes them incompatible with pulping chemical recovery processes,
resulting in discharge to wastewater treatment. White water from paper making is reused in stock
preparation, on the paper machine, in the woodyard, brown stock washers and bleach line
washers. Excess white water constitutes the discharge from paper making. Water reuse and
recycle are common practices in most pulp and papermaking processes and Table 3-2 summarizes
the important recycling paths for kraft chemical pulping mills.
Table 3-2 Wastewater sources and
Wastewater sources
recycling paths for kraft chemical pulping mills.
Water recycle (use) Water recycle (source)
Wood preparation
Chemical pulping
Kraft chemicalrecovery
Bleaching
Log conveyance, logwashing and wetdebarking
Digester condensates,wastewater from screenroom, cleaners, anddigester area spills
Evaporator condensates,weak wash
Inter-stage pulp washing,air emission controlequipment
Wet debarking, chipwashing
Pulp washing
Recovery cycle todissolve furnace smelt,final pulp washing
Bleaching washwater
Screen room, white water,treated final effluent,evaporator condensates
Screen room
Weak wash, evaporatorcondensates
Later bleaching stages, whitewater
White water from wet-end Fiber recovery, machine White wateroperations showers, vacuum
pumps
Papermaking
--
3.1.2 Wastewater Characterization: Conventional Pollutants
Conventional pollutants have been defined under the Clean Water Act (CWA) of 1977. EPA has
identified the conventional pollutants, 5-day biochemical oxygen demand (BODs) and total
suspended solids (TSS), to be of concern in the pulp and paper industry [4].
BOD5 is a measure of the tendency of an effluent to consume dissolved oxygen from receiving
waters. High levels of BODS in the effluent stream can deprive non-photosynthetic organisms of
the oxygen they need to survive. High BOD 5 effluent is produced at many stages including:
debarking, washing, cooking, condensing of spent liquors, and bleaching.
TSS consist of the non-filterable residue retained by a glass fiber filter. In a conventional
integrated kraft mill, the solids load in untreated effluent consists mainly of: (1) dirt, grit, and
fiber from wood preparation stages, (2) screen rejects and spills from the pulping area, (3) fiber
and dissolved lignin solids from the pulp bleaching stages, and (4) fiber and additives washed
from the early stages of papermaking.
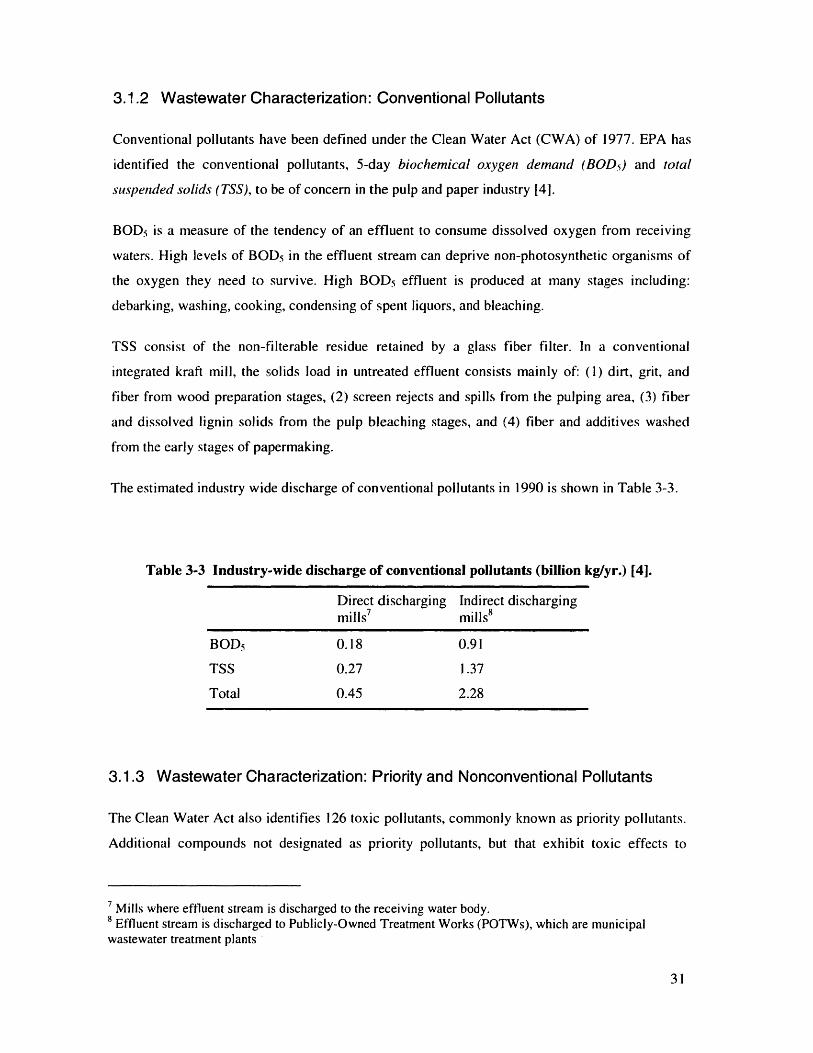
The estimated industry wide discharge of conventional pollutants in 1990 is shown in Table 3-3.
Table 3-3 Industry-wide discharge of conventional pollutants (billion kg/yr.) [4].
Direct dischargingmills7
0.18
0.27
0.45
Indirect dischargingmills8
0.91
1.37
2.28
3.1.3 Wastewater Characterization: Priority and Nonconventional Pollutants
The Clean Water Act also identifies 126 toxic pollutants, commonly known as priority pollutants.
Additional compounds not designated as priority pollutants, but that exhibit toxic effects to
7 Mills where effluent stream is discharged to the receiving water body.8 Effluent stream is discharged to Publicly-Owned Treatment Works (POTWs), which are municipalwastewater treatment plants
BOD5
TSS
Total
aquatic life and the environment are considered as nonconventional pollutants. Priority and
nonconventional pollutants of concern in the pulp and paper industry include 2,3,7,8-
tetrachlorodibenzo-p-dioxin (2,3,7,8-TCDD), 2,3,7,8-tetrachlorodibenzofuran (2,3,7,8-TCDF),
chlorinated phenolic compounds, volatile organic compounds (VOCs), adsorbable organic halides
(AOX), chemical oxygen demand (COD), and color 141.
Chlorinated dibenzo-p-dioxins (CDDs) and chlorinated dibenzofurans (CDFs) are families of
highly toxic and persistent chlorinated organic chemicals. In the pulp and paper industry, CDDs
and CDFs are formed during pulp bleaching where chlorine and chlorine derivatives are used.
2,3,7,8-TCDD and 2,3,7,8-TCDF are CDDs and CDFs with chlorine substituted at the 2,3,7, and
8 positions and are considered more biologically active and more toxic than other CDDs and
CDFs. VOCs are organic species that participate in the formation of photochemical oxidants.
Derived from lignin and carbohydrates in the pulp, typical VOC emissions include terpenes,
J;lcohols, phenols, acetone, and chloroform. Certain VOCs, including acetone and methyl ethyl
ketone (MEK), are attributable to chemical pulping operations, while others, such as chloroform,
are associated with bleach plant operations.
AOX is a measure of the total amount of halogens bound to dissolved or suspended organic
ir-atter in a wastewater sample. For pulp and paper mills bleaching with chlorine or chlorine-
containing compounds, virtually all of the AOX present can be attributed to bleach plant
operations. COD is a measure of the oxygen equivalent of the organic matter in a sample, as
measured through sample oxidation using strong chemical oxidants. For chemical pulp and paper
mills, COD is associated with pulping and bleaching operations. Color interferes with aquatic life
by limiting light transmittance. For kraft pulp and paper mills, most of the effluent color is
attributable to losses of black liquor and bleach plant extraction stage filtrates.
Table 3-4 summarizes total discharges (1992 levels) for the priority and nonconventional
pollutants that EPA has selected for regulation.
3.2 Effluent Limitations Guidelines (Clean Water Act)
Existing effluent guidelines for different subcategories within the pulp and paper industry were
promulgated by the EPA in 1982 and 1986. These regulations mainly focused on reducing
conventional pollutants and are covered by 40 CFR9 Part 430. As part of a consent decree with
9 CFR - Code of Federal Regulations.
the Environmental Defense Fund and the National Wildlife Federation, EPA was to review the
need for revised rulemaking applicable to dioxins and furans for the pulp and paper industry. The
revised effluent guidelines are a key follow-up effort to implement this decree and have been
summarized in this section. Reference [4] describes the guidelines in detail.
3.2.1 Best Practicable Control Technology Currently Available
Best Practicable Control Technology Currently Available (BPT) effluent limitations guidelines
are based upon the average of the best existing performance, in terms of treated effluent
discharged by facilities in an industry. BPT focuses on end-of-pipe treatment technology and such
process changes and internal controls that are common industry practice. In establishing BPT,
EPA considers the cost of achieving effluent reductions in relation to the effluent reduction
benefits. The propesed BPT effluent guidelines apply to dischargers of conventional pollutants
from existing sources to wa:ers of the United States and are based on the average performance
level of the best 50% of mills in an industry. Table 3-5 presents the BPT effluent limitations that
EPA is proposing for the bleached kraft subcategory.
3.2.2 Best Available Technology Economically Achievable (BAT)
BAT effluent limitations guidelines represent the best existing economically achievable
performance of plants in the industry. The factors considered in assessing BAT are the same as
for BPT. However, BAT may include process changes or internal controls, even when these
technologies are not common industry practice. The CWA establishes BAT as the principal
national means of controlling the direct discharge of priority and nonconventional pollutants.
Table 3-6 presents the BAT effluent limitations guidelines that the Agency is proposing for the
bleached kraft industry. BAT limitations for 2,3,7,8-TCDD, 2,3,7,8-TCDF, VOCs, and
chlorinated phenolics will be applied at the effluent from the bleach plant, whereas guidelines for
AOX, COD, and color are applicable to the final end-of-pipe effluent.
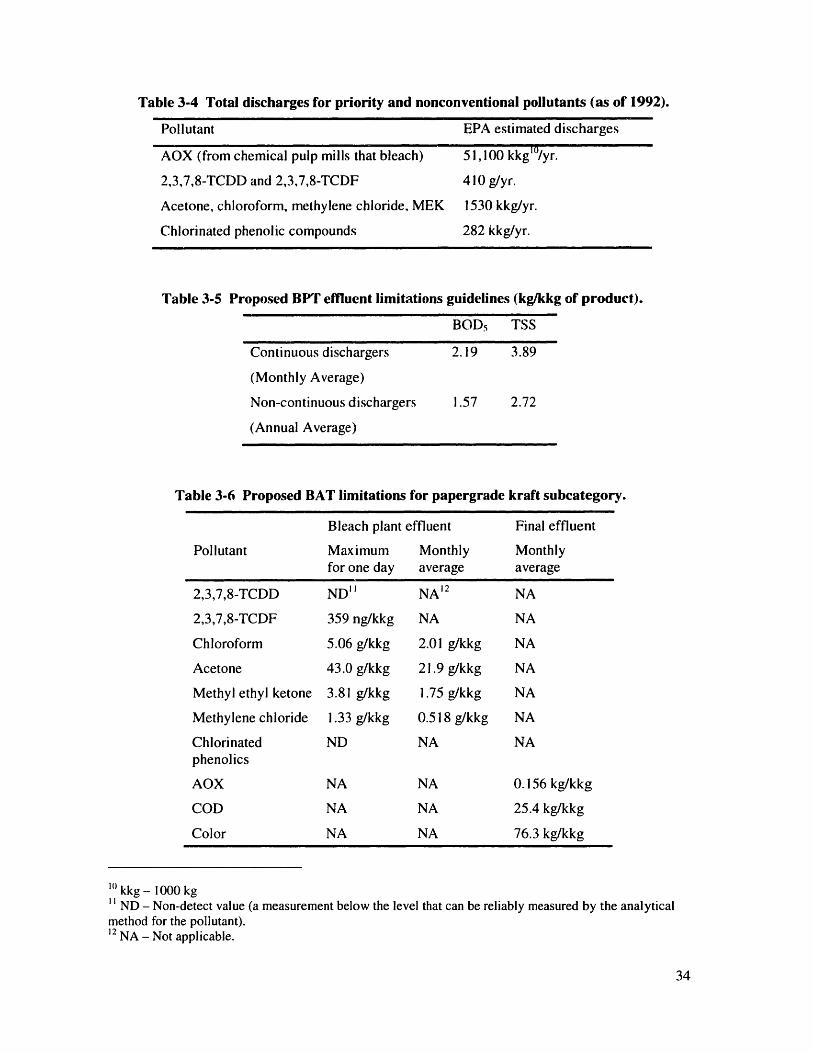
Table 3-4 Total discharges for priority and nonconventional pollutants (as of 1992).
Pollutant EPA estimated discharges
AOX (from chemical pulp mills that bleach) 51,100 kkg'o/yr.
2,3,7,8-TCDD and 2,3,7,8-TCDF 410 g/yr.
Acetone, chloroform, methylene chloride, MEK 1530 kkg/yr.
Chlorinated phenolic compounds 282 kkg/yr.
Table 3-5 Proposed BPT effluent limitations guidelines (kg/kkg of product).
BODS TSS
Continuous dischargers 2.19 3.89
(Monthly Average)
Non-continuous dischargers 1.57 2.72
(Annual Average)
Table 3-6 Proposed BAT limitations for papergrade
Pollutant
2,3,7,8-TCDD
2,3,7,8-TCDF
Chloroform
Acetone
Methyl ethyl ketone
Methylene chloride
Chlorinatedphenolics
AOX
COD
Color
Bleach plant effluent
Maximum Monthlyfor one day average
ND'" NA' 2
359 ng/kkg NA
5.06 g/kkg 2.01 g/kkg
43.0 g/kkg 21.9 g/kkg
3.81 g/kkg 1.75 g/kkg
1.33 g/kkg 0.518 g/kkg
ND NA
NA
NA
NA
NA
NA
NA
kraft subcategory.
Final effluent
Monthlyaverage
NA
NA
NA
NA
NA
NA
NA
0.156 kg/kkg
25.4 kg/kkg
76.3 kg/kkg
"o kkg - 1000 kg" ND - Non-detect value (a measurement below themethod for the pollutant).12 NA - Not applicable.
level that can be reliably measured by the analytical
J
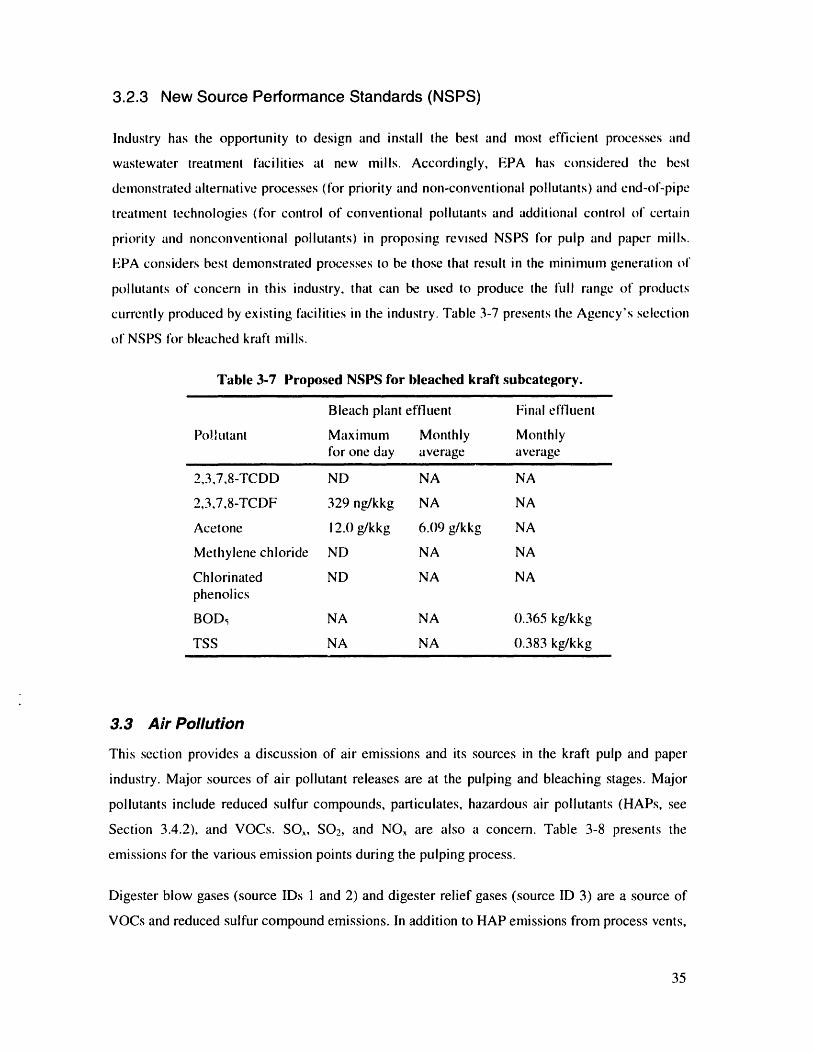
3.2.3 New Source Performance Standards (NSPS)
Industry has the opportunity to design and install the best and most efficient processes and
wastewater treatment facilities at new mills. Accordingly, EPA has considered the best
demonstrated alternative processes (for priority and non-conventional pollutants) and end-of-pipe
treatment technologies (for control of conventional pollutants and additional control of certain
priority and nonconventional pollutants) in proposing revised NSPS for pulp and paper mills.
EPA considers best demonstrated processes to be those that result in the minimum generation of
pollutants of concern in this industry, that can be used to produce the full range of products
currently produced by existing facilities in the industry. Table 3-7 presents the Agency's selection
of NSPS for bleached kraft mills.
Table 3-7 Proposed NSPS for bleached kraft subcategory.
Bleach plant effluent Final effluent
Pollutant Maximum Monthly Monthlyfor one day average average
2,3,7,8-TCDD ND NA NA
2,3,7,8-TCDF 329 ng/kkg NA NA
Acetone 12.0 g/kkg 6.09 g/kkg NA
Methylene chloride ND NA NA
Chlorinated ND NA NAphenolics
BODs NA NA 0.365 kg/kkg
TSS NA NA 0.383 kg/kkg
3.3 Air Pollution
This section provides a discussion of air emissions and its sources in the kraft pulp and paper
industry. Major sources of air pollutant releases are at the pulping and bleaching stages. Major
pollutants include reduced sulfur compounds, particulates, hazardous air pollutants (HAPs, see
Section 3.4.2), and VOCs. SO,, SO 2, and NO, are also a concern. Table 3-8 presents the
emissions for the various emission points during the pulping process.
Digester blow gases (source IDs 1 and 2) and digester relief gases (source ID 3) are a source of
VOCs and reduced sulfur compound emissions. In addition to HAP emissions from process vents,
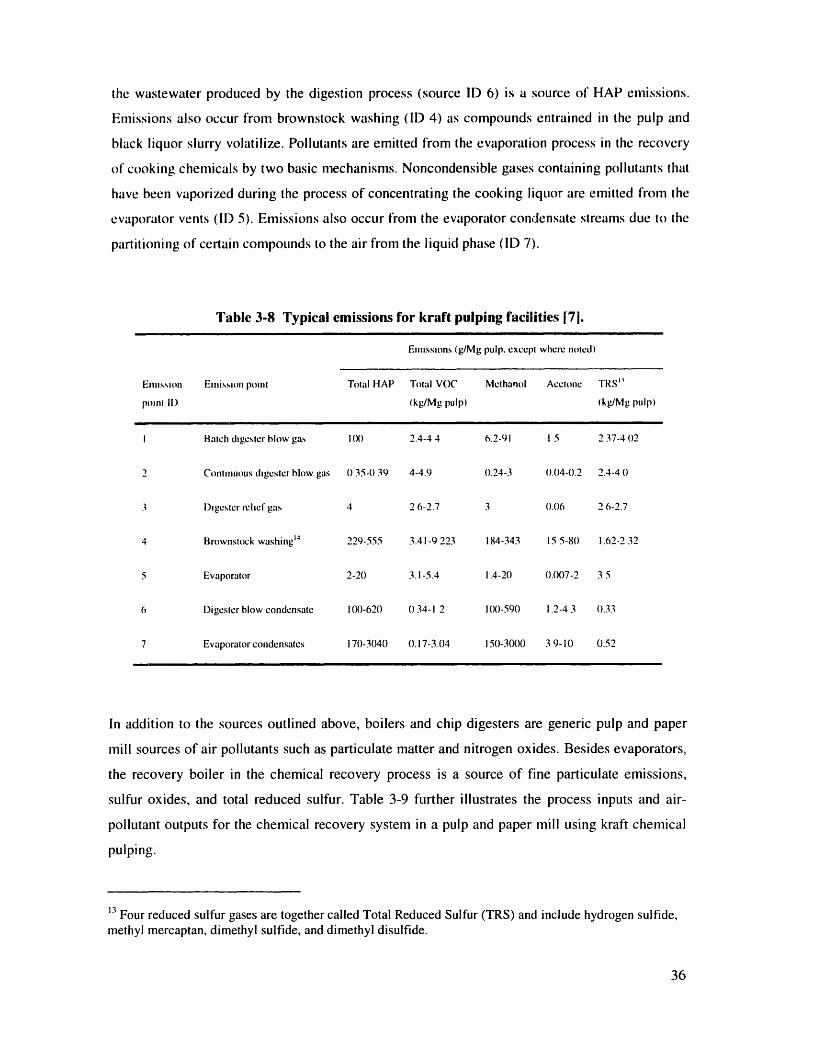
the wastewater produced by the digestion process (source ID 6) is a source of HAP emissions.
Emissions also occur from brownstock washing (ID 4) as compounds entrained in the pulp and
black liquor slurry volatilize. Pollutants are emitted from the evaporation process in the recovery
of cooking chemicals by two basic mechanisms. Noncondensible gases containing pollutants that
have been vaporized during the process of concentrating the cooking liquor are emitted from the
evaporator vents (ID 5). Emissions also occur from the evaporator condensate streams due to the
partitioning of certain compounds to the air from the liquid phase (ID 7).
Table 3-8 Typical emissions for kraft pulping facilities 171.
Enmissions (g/Mg pulp. except where noted)
Enmission Emission point Total HAP Total VOC Methanol Acetone TRS"
point II) (kg/Mg pulp) (kg/Mg pulp)
I Batch digester blow gas 1(00 2.4-4 4 6.2-91 1 5 2 37-4 02
2 Continuous digester blow gas 0 35-0 39 4-4.9 0.24-3 0.04-0.2 2.4-4 0
3 I)lgestr relief gas 4 2 6-2.7 3 0.06 2 6-2.7
4 Brownstock washing"4 229-555 3.41-9 223 184-343 15 5-80 1.62-2 32
5 Evaporator 2-20 3.1-5.4 1.4-20 0.007-2 3 5
6 Digester blow condensate 100-620 034-1 2 1(X)-590 1.2-43 0.33
7 Evaporator condensates 170-3040 0.17-3.04 150-3000 3 9-10 0.52
In addition to the sources outlined above, boilers and chip digesters are generic pulp and paper
mill sources of air pollutants such as particulate matter and nitrogen oxides. Besides evaporators,
the recovery boiler in the chemical recovery process is a source of fine particulate emissions,
sulfur oxides, and total reduced sulfur. Table 3-9 further illustrates the process inputs and air-
pollutant outputs for the chemical recovery system in a pulp and paper mill using kraft chemical
pulping.
13 Four reduced sulfur gases are together called Total Reduced Sulfur (TRS) and include hydrogen sulfide,methyl mercaptan, dimethyl sulfide, and dimethyl disulfide.
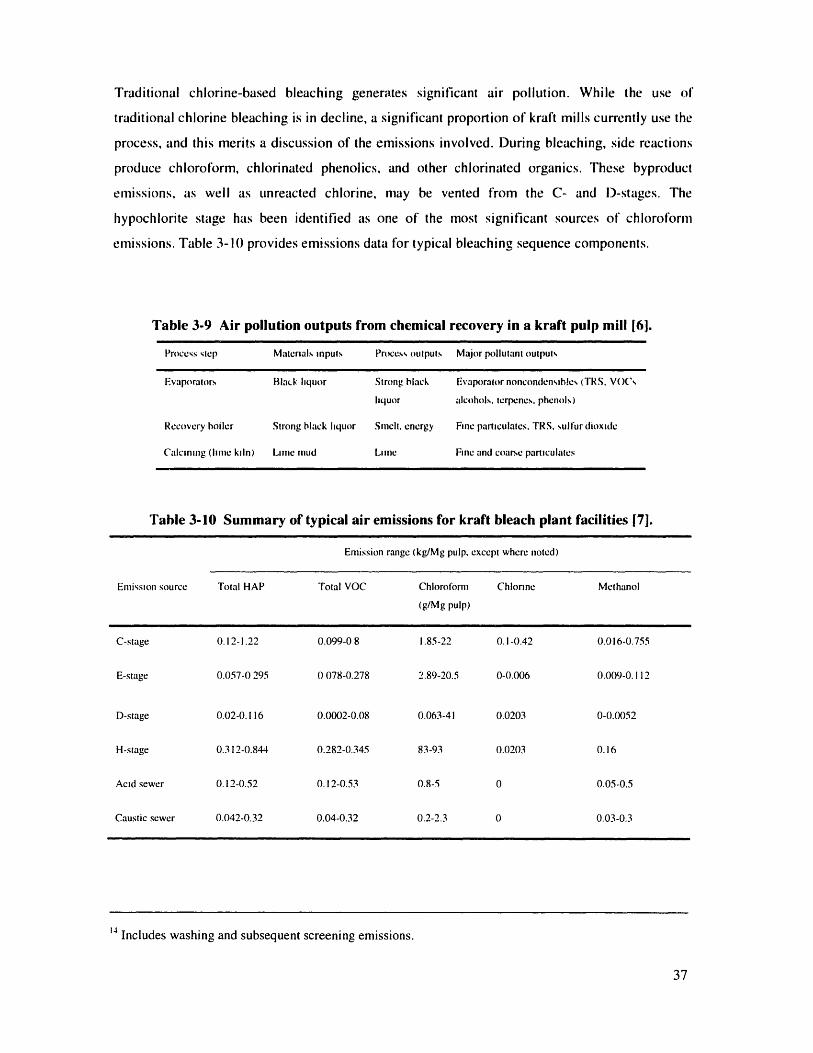
Traditional chlorine-based bleaching generates significant air pollution. While the use of
traditional chlorine bleaching is in decline, a significant proportion of kraft mills currently use the
process, and this merits a discussion of the emissions involved. During bleaching, side reactions
produce chloroform, chlorinated phenolics, and other chlorinated organics. These byproduct
emissions, as well as unreacted chlorine, may be vented from the C- and D-stages. The
hypochlorite stage has been identified as one of the most significant sources of chloroform
emissions. Table 3-10 provides emissions data for typical bleaching sequence components.
Table 3-9 Air pollution outputs from chemical recovery in a kraft pulp mill [6].
Process step Material. inputs Process outputs Major pollutant outputs
Evaporatoators Black liquor Strong black Evaporator noncondensib!e% (TRS. VOCs
liquor alcohols. terpenes, phenols)
Recovery boiler Strong black liquor Smelt, energy Fine particulates. TRS. sulfur dioxide
Calcining (IIme kiln) Lime mud Lime Fine and coarse particulates
Table 3-10 Summary of typical air emissions for kraft bleach plant facilities [7].
Emission range (kg/Mg pulp, except where noted)
Emission source Total HAP Total VOC Chloroform Chlonne Methanol
(g/Mg pulp)
C-stage 0.12-1.22 0.099-0 8 1.85-22 0. 1-0.42 0.016-0.755
E-stage 0.057-0 295 0 078-0.278 2.89-20.5 0-0.006 0.009-0.112
D-stage 0.02-0.116 0.0002-0.08 0.063-41 0.0203 0-0.0052
H-stage 0.312-0.844 0.282-0.345 83-93 0.0203 0.16
Acid sewer 0.12-0.52 0.12-0.53 0.8-5 0 0.05-0.5
Caustic sewer 0.042-0.32 0.04-0.32 0.2-2.3 0 0.03-0.3
14 Includes washing and subsequent screening emissions.
3.4 Clean Air Act
3.4.1 New Source Performance Standards
Kraft pulp mills that have been constructed or modified after September 24, 1976 are subject to
NSPS emission limitations at 40CFR60 Subpart BB. The NSPS establish emission limits for TRS
compounds and particulate matter from sources that include digester systems, multiple-effect
evaporators, brownstock washers, recovery furnaces, smelt dissolving tanks, lime kilns, and
condensate strippers ( a condensate stripper system means a column used to strip, with air or
steam, TRS compounds from condensate streams from various processes within a kraft pulp
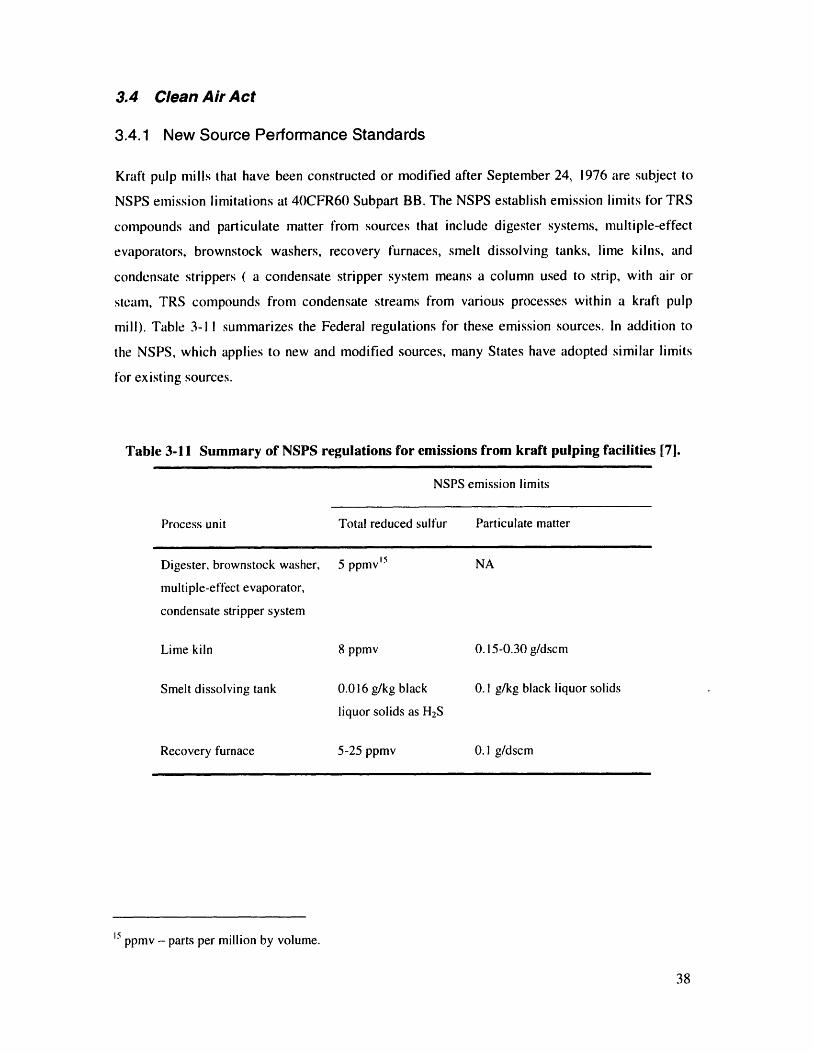
mill). Table 3-1 1 summarizes the Federal regulations for these emission sources. In addition to
the NSPS, which applies to new and modified sources, many States have adopted similar limits
for existing sources.
Table 3-11 Summary of NSPS regulations for emissions from kraft pulping facilities [7].
NSPS emission limits
Process unit Total reduced sulfur Particulate matter
Digester, brownstock washer, 5 ppmv 15 NA
multiple-effect evaporator,
condensate stripper system
Lime kiln 8 ppmv 0.15-0.30 g/dscm
Smelt dissolving tank 0.016 g/kg black 0.1 g/kg black liquor solids
liquor solids as H2S
Recovery furnace 5-25 ppmv 0.1 g/dscm
Isppmv - parts per million by volume.
3.4.2 Pending and Proposed Regulations
Title III of the Clean Air Act Amendments (CAAA) lists a minimum of 189 Hazardous Air
Pollutants (HAPs) (now known as air toxics) that will be subject to technology-based emission
limitations, commonly known as National Emission Standards for Hazardous Pollutants, or
NESHAPs. NESHAPs are based on the use of Maximum Achievable Control Technology
(MACT), which is defined as the technology achieving the maximum degree of reduction in the
emission of HAPs, taking into account cost and other factors 16]. MACT is intended to reduce the
1991 estimated 2 billion pounds of total industrial toxic air pollutant emissions by as much as
90% by 2003. Proposed NESHAPs for the pulp and paper industry will control emissions of the
HAPs identified in Table A-I, from all significant emission points in the pulping, bleaching,
wastewater collection/treatment systems.
4 No Regrets Pollution Prevention: Pulp/Paper
Having discussed the state-of-the-art for the chemical pulping industry and the relevant
environmental legislation, technical innovations that can help combat pollution have been
described in the present chapter'. Reference [8] provides a good overview of the technology
involved.
4.1 Extended Delignification
The amount of bleaching chemicals required in the bleach plant to bring the pulp to the target
brightness level is directly related to the kappa number'6 of the brownstock pulp i.e. the amount
of lignin that remains in the pulp following chemical cooking. The mill can reduce bleaching
chemical demands and subsequent environmental effects by adopting techniques that reduce the
brownstock kappa number. Extended delignification or extended cooking is a method developed
over the last decade that allows the pulp cooking time to be extended, enabling further
delignification to occur before the pulp moves on to the bleach plant. Longer residence times in
conventional pulping will similarly increase bleachability, but will also lead to a loss in pulp yield
and strength, as the pulping chemicals become less selective and begin to attack the cellulose
material. However, extended cooking protects the pulp from detrimental effects that would
normally accompany increased cooking time.
The technique involves charging the cooking chemicals at several points throughout the cook.
Improved selectivity is also obtained by minimizing the concentration of dissolved lignin at the
end of the cooking process and by maintaining low temperatures at the beginning and end of the
cook. The alkali profile in the pulp is leveled out, permitting more lignin to be dissolved in the
latter stages of the process. The lignin content of the brownstock pulp is reduced by 20-50%
compared to conventional digesters.
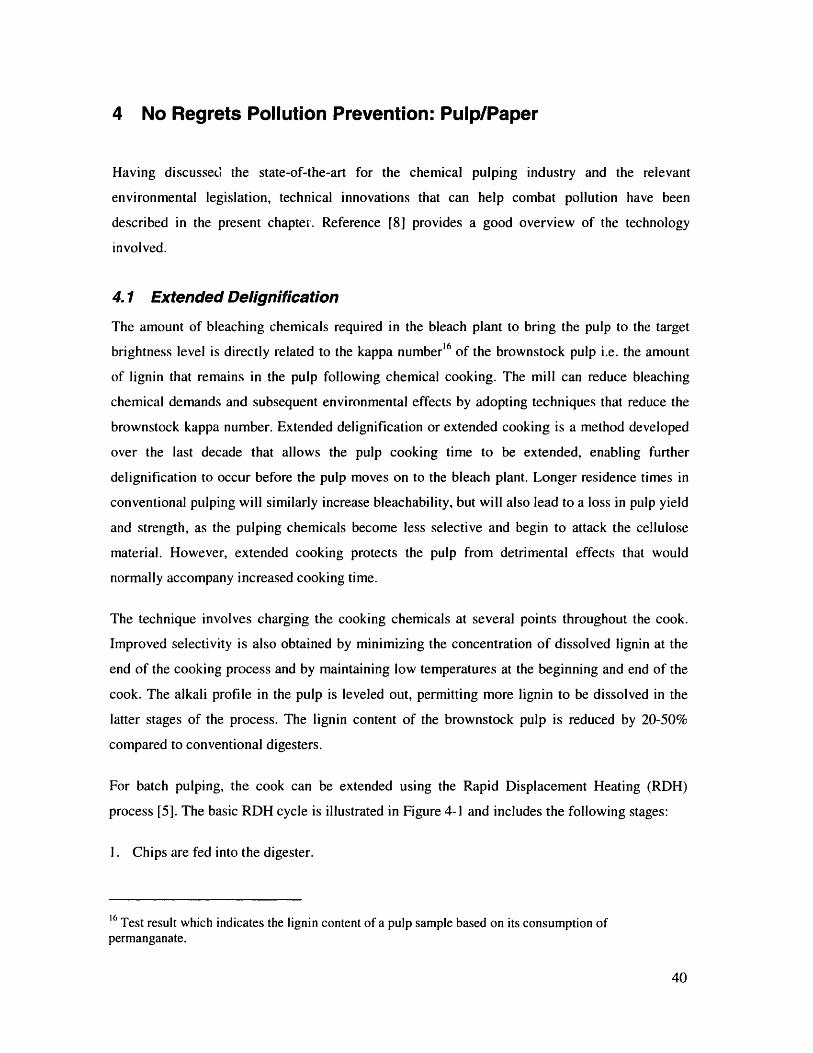
For batch pulping, the cook can be extended using the Rapid Displacement Heating (RDH)
process [5]. The basic RDH cycle is illustrated in Figure 4-1 and includes the following stages:
1. Chips are fed into the digester.
16 Test result which indicates the lignin content of a pulp sample based on its consumption ofpermanganate.
2. Warm black liquor is used to impregnate the chips.
3. The warm liquor is displaced with hot black and hot white liquor. The digester is brought up
to temperature by adding steam.
4. After time at temperature, the hot spent cooking liquor is displaced using brownstock washer
filtrate, thereby ending the cook and cooling the chip mass. The displaced hot and warm
liquor is stored and used in subsequent cooks.
5. The cooled chip mass is pumped or air blown out of the digester vessel.
I~EEI~II'El'
PUMPED DISCHARGEOR AIR BLOW
DISPLACEMENT
CHIPS
CIP FMLL
LIQUORDISPLIACEMENTTECHNOLOGY
FOR BATCHDIGESTERS
WARM BLACKLIOUOR FILL
r-)FiI1I
nUIr TLACLIQUOR FILL
DISPLACEMENT TIME AT -IME TOTEMPERATURE TEMPERATURE
Figure 4-1 Rapid displacement heating cycle for batch digester systems.
6. Hot black liquor is passed through a heat exchanger and is used to heat white liquor.
Application of extended delignification to the continuous digester has led to the development of
Extended Modified Continuous Cooking (MCC)[5]. In MCC, the normal continuous cooking
process is altered as follows:
-
illI
Rb
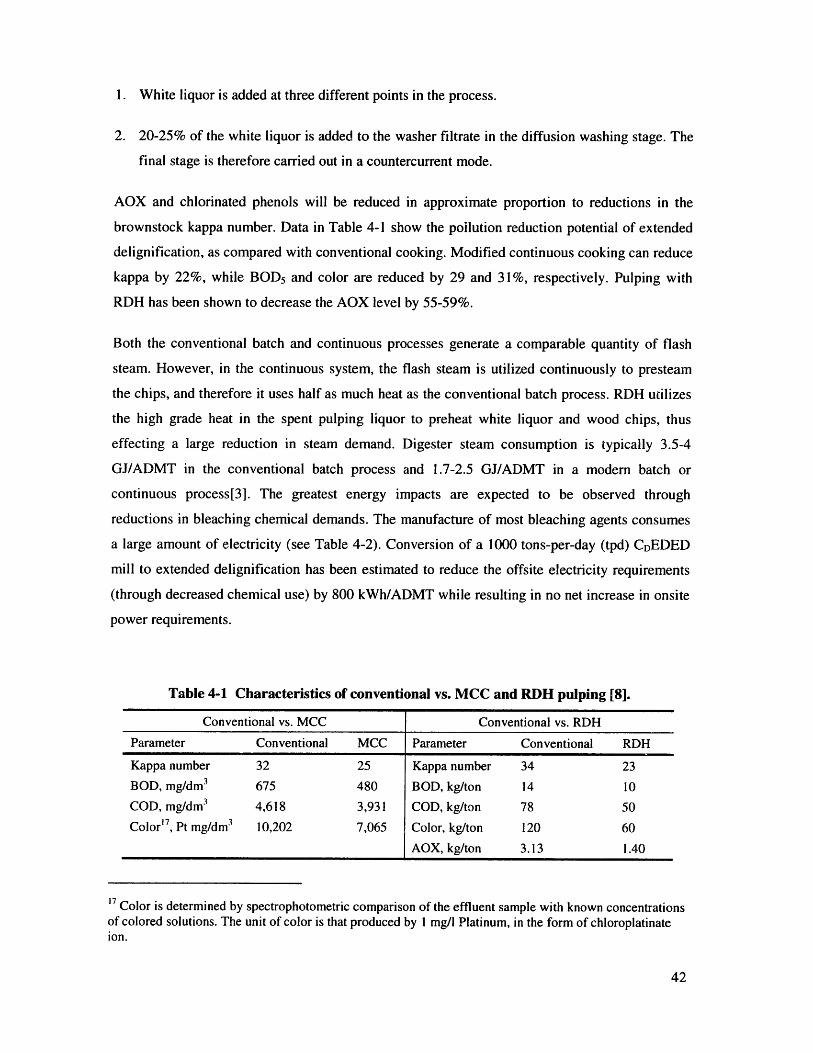
1. White liquor is added at three different points in the process.
2. 20-25% of the white liquor is added to the washer filtrate in the diffusion washing stage. The
final stage is therefore carried out in a countercurrent mode.
AOX and chlorinated phenols will be reduced in approximate proportion to reductions in the
brownstock kappa number. Data in Table 4-1 show the pollution reduction potential of extended
delignification, as compared with conventional cooking. Modified continuous cooking can reduce
kappa by 22%, while BOD 5 and color are reduced by 29 and 31%, respectively. Pulping with
RDH has been shown to decrease the AOX level by 55-59%.
Both the conventional batch and continuous processes generate a comparable quantity of flash
steam. However, in the continuous system, the flash steam is utilized continuously to presteam
the chips, and therefore it uses half as much heat as the conventional batch process. RDH utilizes
the high grade heat in the spent pulping liquor to preheat white liquor and wood chips, thus
effecting a large reduction in steam demand. Digester steam consumption is typically 3.5-4
GJ/ADMT in the conventional batch process and 1.7-2.5 GJ/ADMT in a modern batch or
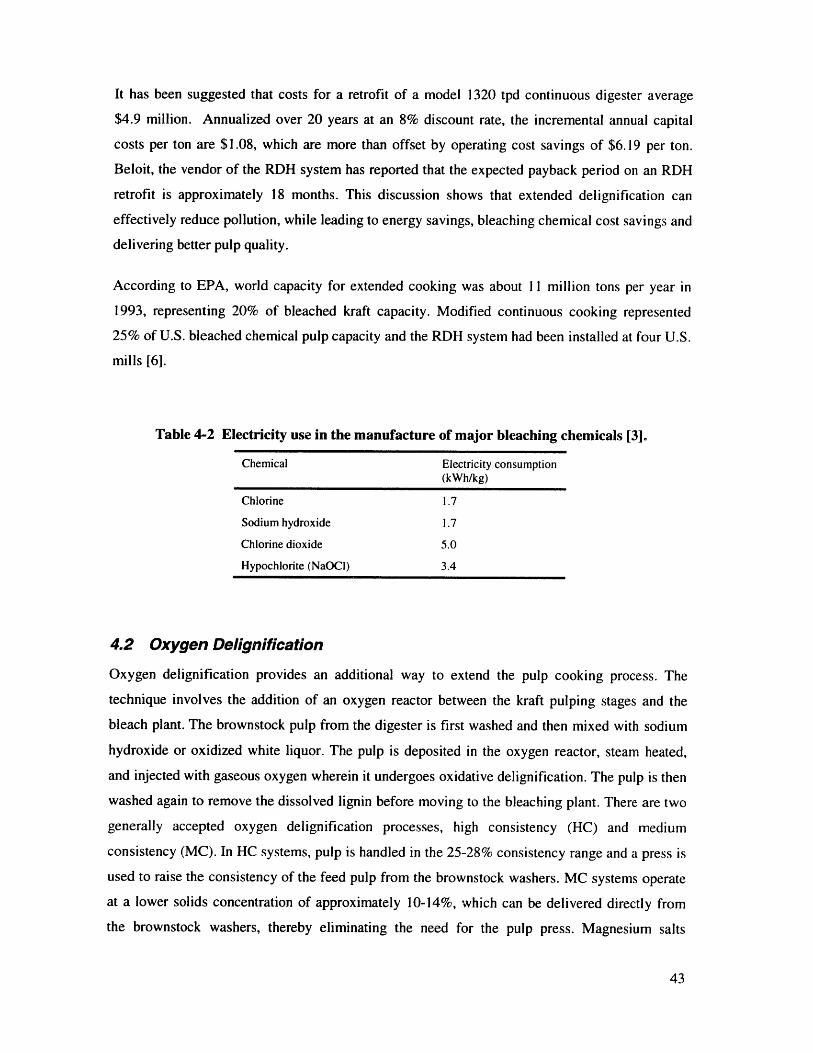
continuous process[3]. The greatest energy impacts are expected to be observed through
reductions in bleaching chemical demands. The manufacture of most bleaching agents consumes
a large amount of electricity (see Table 4-2). Conversion of a 1000 tons-per-day (tpd) CDEDED
mill to extended delignification has been estimated to reduce the offsite electricity requirements
(through decreased chemical use) by 800 kWh/ADMT while resulting in no net increase in onsite
power requirements.
Table 4-1 Characteristics of conventional vs. MCC and RDH pulping [8].
Conventional vs. MCC Conventional vs. RDHParameter Conventional MCC Parameter Conventional RDH
Kappa number 32 25 Kappa number 34 23BOD, mg/dm3 675 480 BOD, kg/ton 14 10COD, mg/dm3 4,618 3,931 COD, kg/ton 78 50Color", Pt mg/dm' 10,202 7,065 Color, kg/ton 120 60
AOX, kg/ton 3.13 1.40
17 Color is determined by spectrophotometric comparison of the effluent sample with known concentrationsof colored solutions. The unit of color is that produced by 1 mg/i Platinum, in the form of chloroplatinateion.
It has been suggested that costs for a retrofit of a model 1320 tpd continuous digester average
$4.9 million. Annualized over 20 years at an 8% discount rate, the incremental annual capital
costs per ton are $1.08, which are more than offset by operating cost savings of $6.19 per ton.
Beloit, the vendor of the RDH system has reported that the expected payback period on an RDH
retrofit is approximately 18 months. This discussion shows that extended delignification can
effectively reduce pollution, while leading to energy savings, bleaching chemical cost savings and
delivering better pulp quality.
According to EPA, world capacity for extended cooking was about 11 million tons per year in
1993, representing 20% of bleached kraft capacity. Modified continuous cooking represented
25% of U.S. bleached chemical pulp capacity and the RDH system had been installed at four U.S.
mills [6].
Table 4-2 Electricity use in the manufacture of major bleaching chemicals [3].
Chemical Electricity consumption(kWh/kg)
Chlorine 1.7
Sodium hydroxide 1.7
Chlorine dioxide 5.0
Hypochlorite (NaOCI) 3.4
4.2 Oxygen Delignification
Oxygen delignification provides an additional way to extend the pulp cooking process. The
technique involves the addition of an oxygen reactor between the kraft pulping stages and the
bleach plant. The brownstock pulp from the digester is first washed and then mixed with sodium
hydroxide or oxidized white liquor. The pulp is deposited in the oxygen reactor, steam heated,
and injected with gaseous oxygen wherein it undergoes oxidative delignification. The pulp is then
washed again to remove the dissolved lignin before moving to the bleaching plant. There are two
generally accepted oxygen delignification processes, high consistency (HC) and medium
consistency (MC). In HC systems, pulp is handled in the 25-28% consistency range and a press is
used to raise the consistency of the feed pulp from the brownstock washers. MC systems operate
at a lower solids concentration of approximately 10-14%, which can be delivered directly from
the brownstock washers, thereby eliminating the need for the pulp press. Magnesium salts
(MgSO 4) are used in both systems to protect the cellulose fibers from degradation that may occur
in pockets of high oxygen concentration.
From an environmental standpoint, oxygen delignification offers the following advantages:
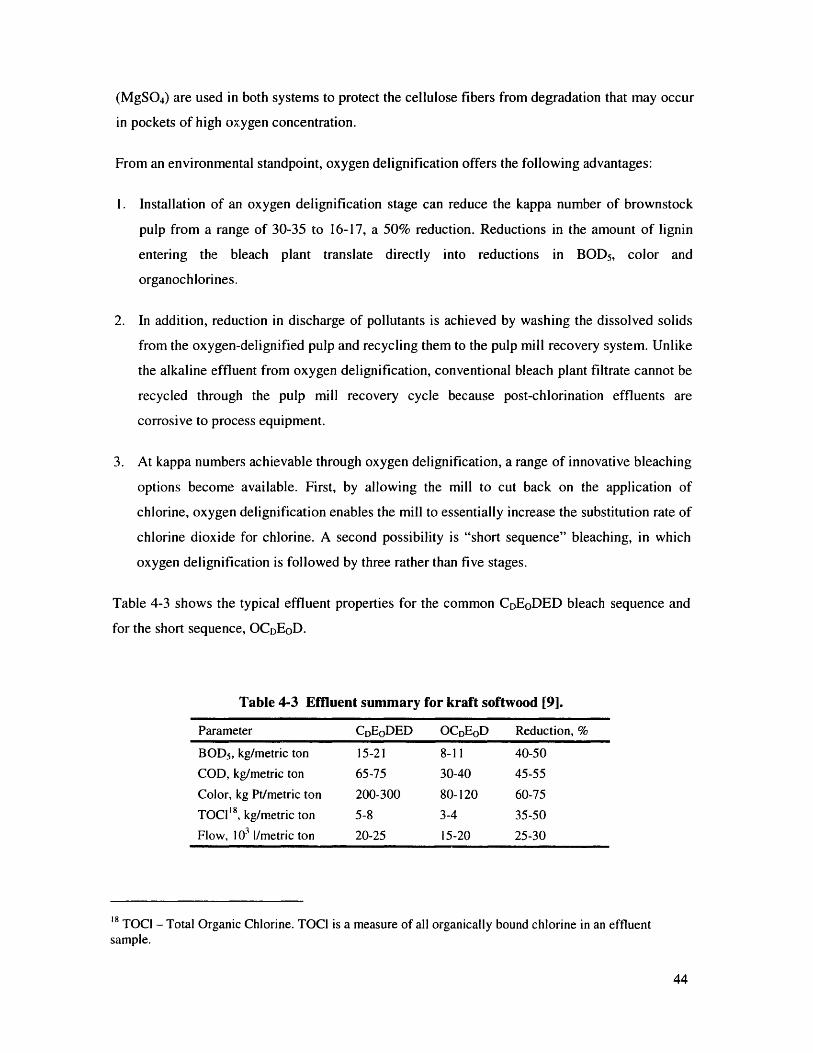
1. Installation of an oxygen delignification stage can reduce the kappa number of brownstock
pulp from a range of 30-35 to 16-17, a 50% reduction. Reductions in the amount of lignin
entering the bleach plant translate directly into reductions in BODs, color and
organochlorines.
2. In addition, reduction in discharge of pollutants is achieved by washing the dissolved solids
from the oxygen-delignified pulp and recycling them to the pulp mill recovery system. Unlike
the alkaline effluent from oxygen delignification, conventional bleach plant filtrate cannot be
recycled through the pulp mill recovery cycle because post-chlorination effluents are
corrosive to process equipment.
3. At kappa numbers achievable through oxygen delignification, a range of innovative bleaching
options become available. First, by allowing the mill to cut back on the application of
chlorine, oxygen delignification enables the mill to essentially increase the substitution rate of
chlorine dioxide for chlorine. A second possibility is "short sequence" bleaching, in which
oxygen delignification is followed by three rather than five stages.
Table 4-3 shows the typical effluent properties for the common CDEoDED bleach sequence and
for the short sequence, OCDEoD.
Table 4-3 Effluent summary for kraft softwood [9].
Parameter CDEoDED OCDEoD Reduction, %
BODs, kg/metric ton 15-21 8-11 40-50
COD, kg/metric ton 65-75 30-40 45-55
Color, kg Pt/metric ton 200-300 80-120 60-75
TOCI' 8, kg/metric ton 5-8 3-4 35-50
Flow, 103 I/metric ton 20-25 15-20 25-30
18 TOCI - Total Organic Chlorine. TOCI is a measure of all organically bound chlorine in an effluentsample.
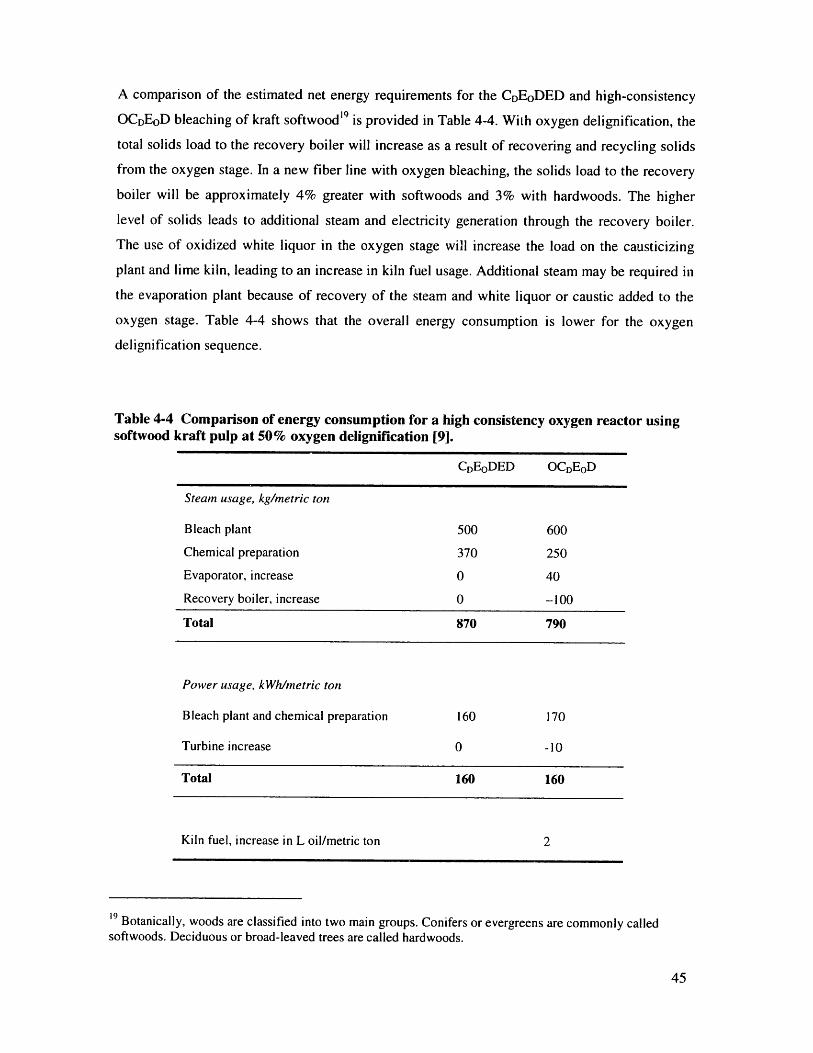
A comparison of the estimated net energy requirements for the CDEoDED and high-consistency
OCDEoD bleaching of kraft softwood' 9 is provided in Table 4-4. With oxygen delignification, the
total solids load to the recovery boiler will increase as a result of recovering and recycling solids
from the oxygen stage. In a new fiber line with oxygen bleaching, the solids load to the recovery
boiler will be approximately 4% greater with softwoods and 3% with hardwoods. The higher
level of solids leads to additional steam and electricity generation through the recovery boiler.
The use of oxidized white liquor in the oxygen stage will increase the load on the causticizing
plant and lime kiln, leading to an increase in kiln fuel usage. Additional steam may be required in
the evaporation plant because of recovery of the steam and white liquor or caustic added to the
oxygen stage. Table 4-4 shows that the overall energy consumption is lower for the oxygen
delignification sequence.
Table 4-4 Comparison of energy consumption for a high consistency oxygen reactor usingsoftwood kraft pulp at 50% oxygen delignification [9].
CDEoDED OCDEoD
Steam usage, kg/metric ton
Bleach plant 500 600
Chemical preparation 370 250
Evaporator, increase 0 40
Recovery boiler, increase 0 -100
Total 870 790
Power usage, kWh/netric ton
Bleach plant and chemical preparation 160 170
Turbine increase 0 -10
Total 160 160
Kiln fuel, increase in L oil/metric ton 2
" Botanically, woods are classified into two main groups. Conifers or evergreens are commonly calledsoftwoods. Deciduous or broad-leaved trees are called hardwoods.
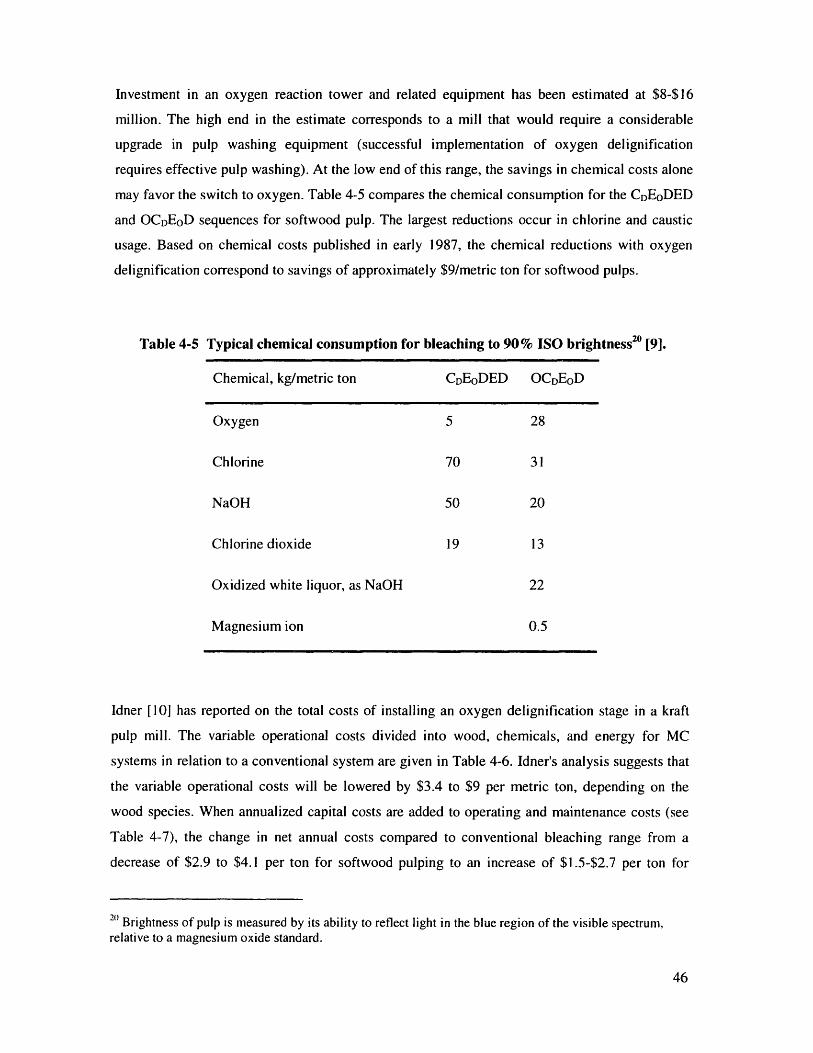
Investment in an oxygen reaction tower and related equipment has been estimated at $8-$16
million. The high end in the estimate corresponds to a mill that would require a considerable
upgrade in pulp washing equipment (successful implementation of oxygen delignification
requires effective pulp washing). At the low end of this range, the savings in chemical costs alone
may favor the switch to oxygen. Table 4-5 compares the chemical consumption for the CDEoDED
and OCDEoD sequences for softwood pulp. The largest reductions occur in chlorine and caustic
usage. Based on chemical costs published in early 1987, the chemical reductions with oxygen
delignification correspond to savings of approximately $9/metric ton for softwood pulps.
Table 4-5 Typical chemical consumption for bleaching to 90% ISO brightness20 [9].
Chemical, kg/metric ton CDEoDED OCDEoD
Oxygen 5 28
Chlorine 70 31
NaOH 50 20
Chlorine dioxide 19 13
Oxidized white liquor, as NaOH 22
Magnesium ion 0.5
Idner [10] has reported on the total costs of installing an oxygen delignification stage in a kraft
pulp mill. The variable operational costs divided into wood, chemicals, and energy for MC
systems in relation to a conventional system are given in Table 4-6. Idner's analysis suggests that
the variable operational costs will be lowered by $3.4 to $9 per metric ton, depending on the
wood species. When annualized capital costs are added to operating and maintenance costs (see
Table 4-7), the change in net annual costs compared to conventional bleaching range from a
decrease of $2.9 to $4.1 per ton for softwood pulping to an increase of $1.5-$2.7 per ton for
20 Brightness of pulp is measured by its ability to reflect light in the blue region of the visible spectrum,relative to a magnesium oxide standard.
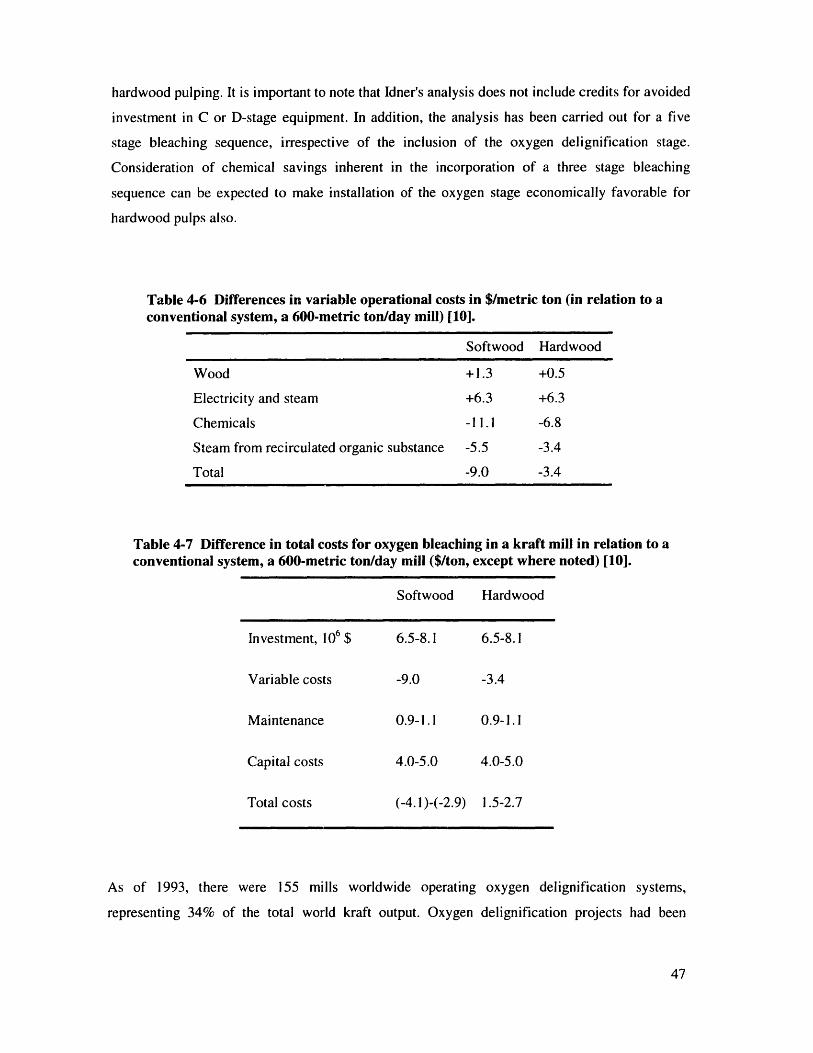
hardwood pulping. It is important to note that Idner's analysis does not include credits for avoided
investment in C or D-stage equipment. In addition, the analysis has been carried out for a five
stage bleaching sequence, irrespective of the inclusion of the oxygen delignification stage.
Consideration of chemical savings inherent in the incorporation of a three stage bleaching
sequence can be expected to make installation of the oxygen stage economically favorable for
hardwood pulps also.
Table 4-6 Differences in variable operational costs in $/metric ton (in relation to aconventional system, a 600-metric ton/day mill) [10].
Softwood Hardwood
Wood +1.3 +0.5
Electricity and steam +6.3 +6.3
Chemicals -11.1 -6.8
Steam from recirculated organic substance -5.5 -3.4
Total -9.0 -3.4
Table 4-7 Difference in total costs for oxygen bleaching in a kraft mill in relation to aconventional system, a 600-metric ton/day mill ($/ton, except where noted) [10].
Softwood Hardwood
Investment, 106 $
Variable costs
Maintenance
Capital costs
Total costs
6.5-8.1
-9.0
0.9-1.1
4.0-5.0
(-4.1)-(-2.9)
6.5-8.1
-3.4
0.9-1.1
4.0-5.0
1.5-2.7
As of 1993, there were 155 mills worldwide operating oxygen delignification systems,
representing 34% of the total world kraft output. Oxygen delignification projects had been
c'
I
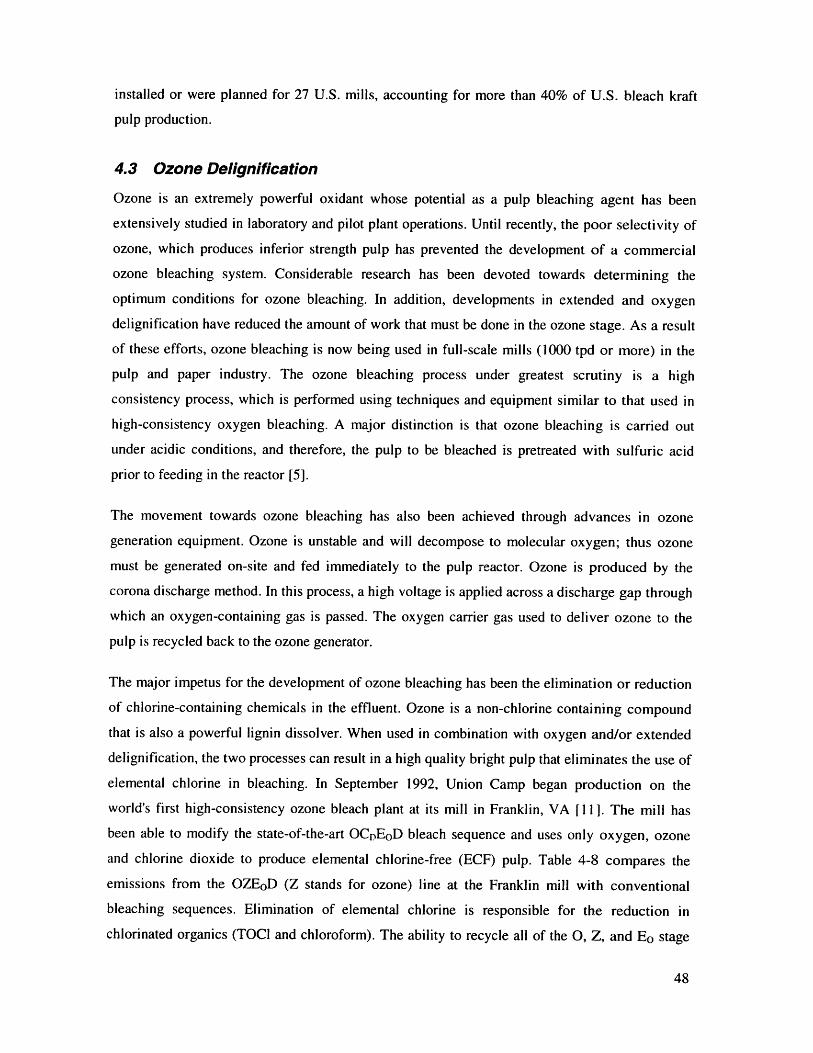
installed or were planned for 27 U.S. mills, accounting for more than 40% of U.S. bleach kraft
pulp production.
4.3 Ozone Delignification
Ozone is an extremely powerful oxidant whose potential as a pulp bleaching agent has been
extensively studied in laboratory and pilot plant operations. Until recently, the poor selectivity of
ozone, which produces inferior strength pulp has prevented the development of a commercial
ozone bleaching system. Considerable research has been devoted towards determining the
optimum conditions for ozone bleaching. In addition, developments in extended and oxygen
delignification have reduced the amount of work that must be done in the ozone stage. As a result
of these efforts, ozone bleaching is now being used in full-scale mills (1000 tpd or more) in the
pulp and paper industry. The ozone bleaching process under greatest scrutiny is a high
consistency process, which is performed using techniques and equipment similar to that used in
high-consistency oxygen bleaching. A major distinction is that ozone bleaching is carried out
under acidic conditions, and therefore, the pulp to be bleached is pretreated with sulfuric acid
prior to feeding in the reactor [5].
The movement towards ozone bleaching has also been achieved through advances in ozone
generation equipment. Ozone is unstable and will decompose to molecular oxygen; thus ozone
must be generated on-site and fed immediately to the pulp reactor. Ozone is produced by the
corona discharge method. In this process, a high voltage is applied across a discharge gap through
which an oxygen-containing gas is passed. The oxygen carrier gas used to deliver ozone to the
pulp is recycled back to the ozone generator.
The major impetus for the development of ozone bleaching has been the elimination or reduction
of chlorine-containing chemicals in the effluent. Ozone is a non-chlorine containing compound
that is also a powerful lignin dissolver. When used in combination with oxygen and/or extended
delignification, the two processes can result in a high quality bright pulp that eliminates the use of
elemental chlorine in bleaching. In September 1992, Union Camp began production on the
world's first high-consistency ozone bleach plant at its mill in Franklin, VA [II]. The mill has
been able to modify the state-of-the-art OCDE oD bleach sequence and uses only oxygen, ozone
and chlorine dioxide to produce elemental chlorine-free (ECF) pulp. Table 4-8 compares the
emissions from the OZEoD (Z stands for ozone) line at the Franklin mill with conventional
bleaching sequences. Elimination of elemental chlorine is responsible for the reduction in
chlorinated organics (TOCI and chloroform). The ability to recycle all of the O, Z, and Eo stage
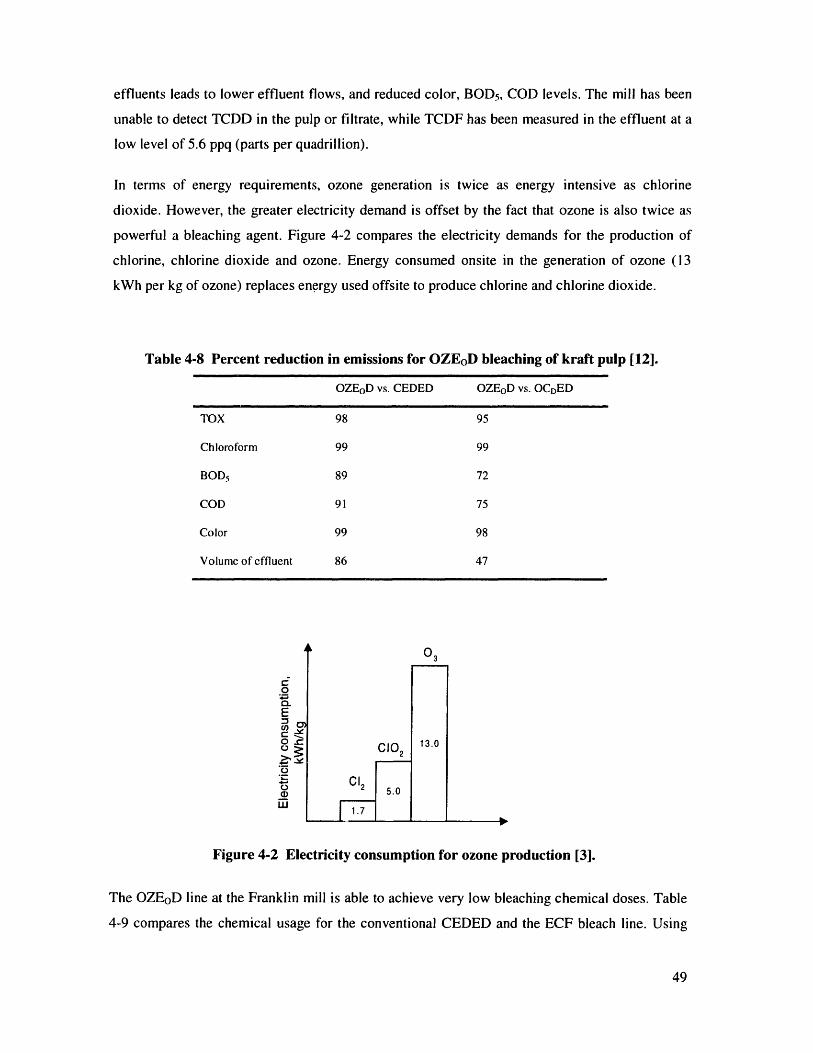
effluents leads to lower effluent flows, and reduced color, BOD s, COD levels. The mill has been
unable to detect TCDD in the pulp or filtrate, while TCDF has been measured in the effluent at a
low level of 5.6 ppq (parts per quadrillion).
In terms of energy requirements, ozone generation is twice as energy intensive as chlorine
dioxide. However, the greater electricity demand is offset by the fact that ozone is also twice as
powerful a bleaching agent. Figure 4-2 compares the electricity demands for the production of
chlorine, chlorine dioxide and ozone. Energy consumed onsite in the generation of ozone (13
kWh per kg of ozone) replaces energy used offsite to produce chlorine and chlorine dioxide.
Table 4-8 Percent reduction in emissions for OZEoD bleaching of kraft pulp [12].
OZEoD vs. CEDED OZEoD vs. OCDED
TOX 98 95
Chloroform 99 99
BOD 5 89 72
COD 91 75
Color 99 98
Volume of effluent 86 47
CIO2
Figure 4-2 Electricity consumption for ozone production [3].
The OZEoD line at the Franklin mill is able to achieve very low bleaching chemical doses. Table
4-9 compares the chemical usage for the conventional CEDED and the ECF bleach line. Using
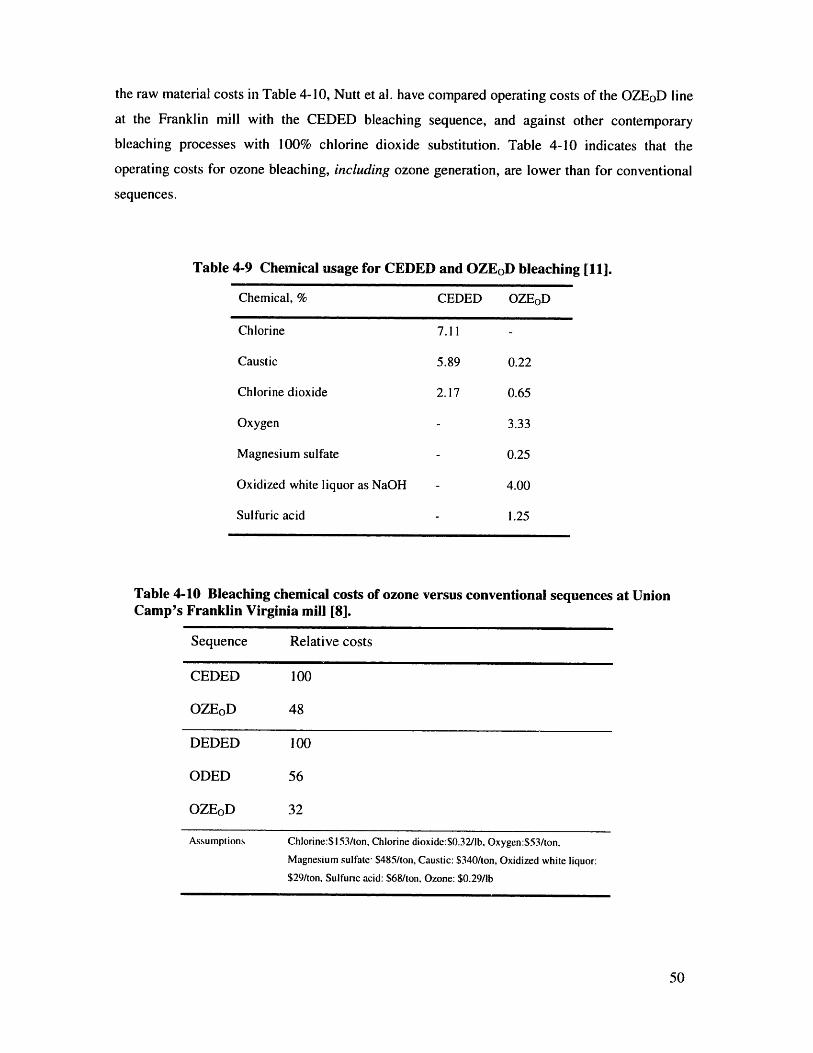
the raw material costs in Table 4-10, Nutt et al. have compared operating costs of the OZEoD line
at the Franklin mill with the CEDED bleaching sequence, and against other contemporary
bleaching processes with 100% chlorine dioxide substitution. Table 4-10 indicates that the
operating costs for ozone bleaching, including ozone generation, are lower than for conventional
sequences.
Table 4-9 Chemical usage for CEDED and OZEoD bleaching [11].
Chemical, % CEDED OZEoD
Chlorine
Caustic
Chlorine dioxide
Oxygen
Magnesium sulfate
Oxidized white liquor as NaOH
Sulfuric acid
Table 4-10 Bleaching chemical costs of ozone versus conventional sequences at UnionCamp's Franklin Virginia mill [8].
Sequence Relative costs
CEDED 100
OZEoD 48
DEDED 100
ODED 56
OZEoD 32
Assumptions Chlorine:$153/ton, Chlorine dioxide:$0.32/lb. Oxygen:$53/ton,
Magnesium sulfate $485/ton, Caustic: $340/ton, Oxidized white liquor:
$29/ton, Sulfunc acid: $68/ton. Ozone: $0.29/lb
7.11
5.89
2.17
0.22
0.65
3.33
0.25
4.00
1.25-
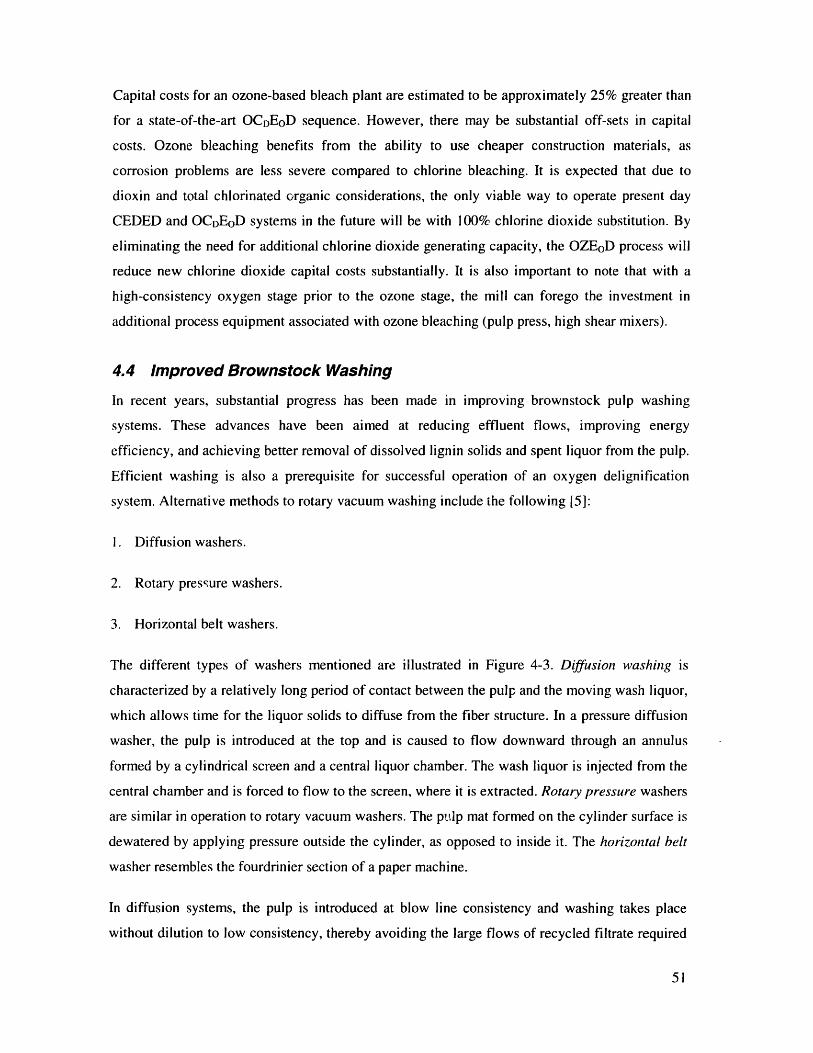
Capital costs for an ozone-based bleach plant are estimated to be approximately 25% greater than
for a state-of-the-art OCDEoD sequence. However, there may be substantial off-sets in capital
costs. Ozone bleaching benefits from the ability to use cheaper construction materials, as
corrosion problems are less severe compared to chlorine bleaching. It is expected that due to
dioxin and total chlorinated organic considerations, the only viable way to operate present day
CEDED and OCDEoD systems in the future will be with 100% chlorine dioxide substitution. By
eliminating the need for additional chlorine dioxide generating capacity, the OZEoD process will
reduce new chlorine dioxide capital costs substantially. It is also important to note that with a
high-consistency oxygen stage prior to the ozone stage, the mill can forego the investment in
additional process equipment associated with ozone bleaching (pulp press, high shear mixers).
4.4 Improved Brownstock Washing
In recent years, substantial progress has been made in improving brownstock pulp washing
systems. These advances have been aimed at reducing effluent flows, improving energy
efficiency, and achieving better removal of dissolved lignin solids and spent liquor from the pulp.
Efficient washing is also a prerequisite for successful operation of an oxygen delignification
system. Alternative methods to rotary vacuum washing include the following [5]:
1. Diffusion washers.
2. Rotary pressure washers.
3. Horizontal belt washers.
The different types of washers mentioned are illustrated in Figure 4-3. Diffusion washing is
characterized by a relatively long period of contact between the pulp and the moving wash liquor,
which allows time for the liquor solids to diffuse from the fiber structure. In a pressure diffusion
washer, the pulp is introduced at the top and is caused to flow downward through an annulus
formed by a cylindrical screen and a central liquor chamber. The wash liquor is injected from the
central chamber and is forced to flow to the screen, where it is extracted. Rotary pressure washers
are similar in operation to rotary vacuum washers. The pulp mat formed on the cylinder surface is
dewatered by applying pressure outside the cylinder, as opposed to inside it. The horizontal belt
washer resembles the fourdrinier section of a paper machine.
In diffusion systems, the pulp is introduced at blow line consistency and washing takes place
without dilution to low consistency, thereby avoiding the large flows of recycled filtrate required
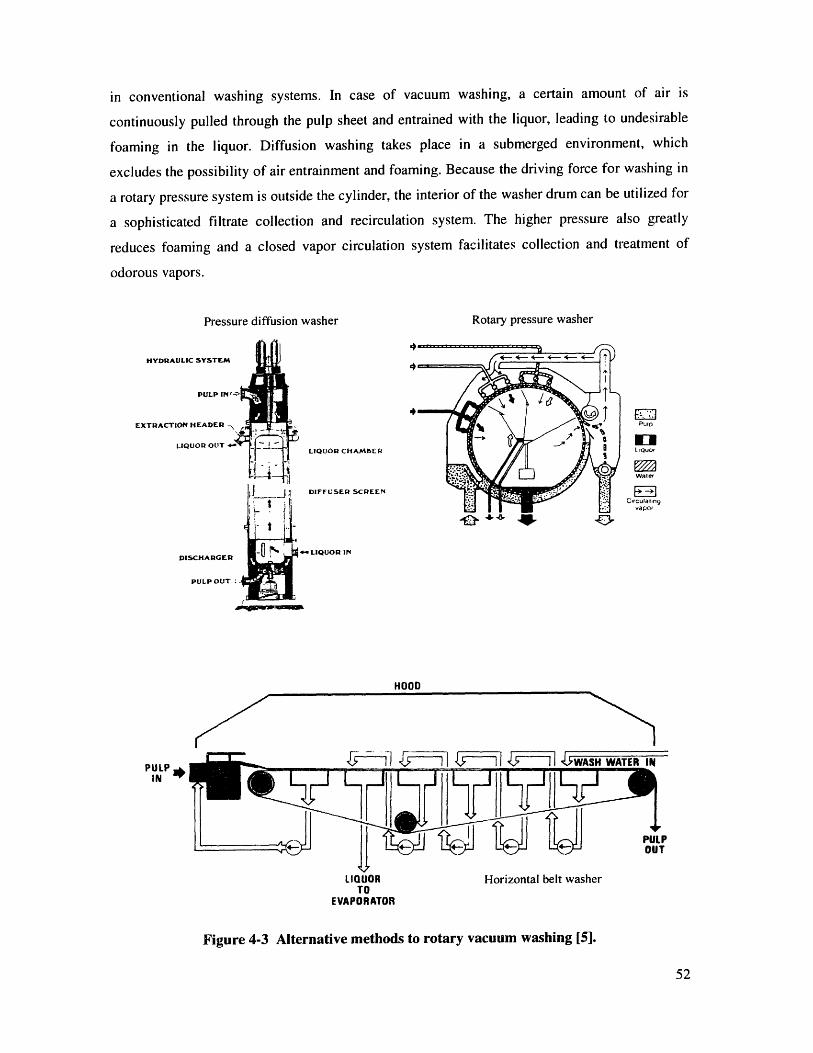
in conventional washing systems. In case of vacuum washing, a certain amount of air is
continuously pulled through the pulp sheet and entrained with the liquor, leading to undesirable
foaming in the liquor. Diffusion washing takes place in a submerged environment, which
excludes the possibility of air entrainment and foaming. Because the driving force for washing in
a rotary pressure system is outside the cylinder, the interior of the washer drum can be utilized for
a sophisticated filtrate collection and recirculation system. The higher pressure also greatly
reduces foaming and a closed vapor circulation system facilitates collection and treatment of
odorous vapors.
Pressure diffusion washer Rotary pressure washer
Pulo
LiQuo,
Water
COrculairrgvapos
LIQUOR CHAMBER
DIFFUSER SCREEN
- LIQUOR IN
HOOD
PULPIN
LIQUOR Horizontal belt washerTO
EVAPORATOR
Figure 4-3 Alternative methods to rotary vacuum washing [5].
HYDRAULIC SYSTEM
LIQUOR OUT
DISCHARGER
PULP OUT :
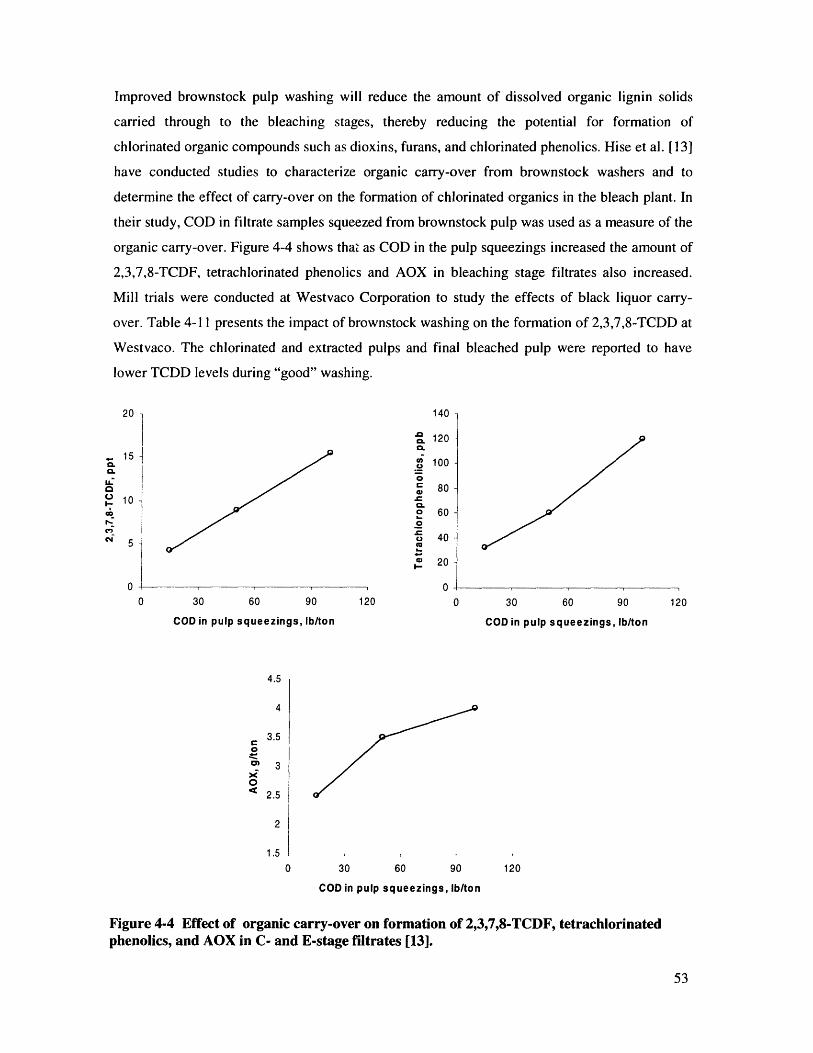
Improved brownstock pulp washing will reduce the amount of dissolved organic lignin solids
carried through to the bleaching stages, thereby reducing the potential for formation of
chlorinated organic compounds such as dioxins, furans, and chlorinated phenolics. Hise et al. [13]
have conducted studies to characterize organic carry-over from brownstock washers and to
determine the effect of carry-over on the formation of chlorinated organics in the bleach plant. In
their study, COD in filtrate samples squeezed from brownstock pulp was used as a measure of the
organic carry-over. Figure 4-4 shows that as COD in the pulp squeezings increased the amount of
2,3,7,8-TCDF, tetrachlorinated phenolics and AOX in bleaching stage filtrates also increased.
Mill trials were conducted at Westvaco Corporation to study the effects of black liquor carry-
over. Table 4-11 presents the impact of brownstock washing on the formation of 2,3,7,8-TCDD at
Westvaco. The chlorinated and extracted pulps and final bleached pulp were reported to have
lower TCDD levels during "good" washing.
0 2 1A
120
S15
10U-,
co06 10
• 100 -
" 80
o 600
u 40
Q! 200 -4
0 30 60 90 120 0 30 60 90 120
COD in pulp squeezings, Ib/ton COD in pulp squeezings, Ib/ton
A r4.5
4
3.5o
0 3
2.5
2
1.5
0 30 60 90 120
COD in pulp squeezings, Ib/ton
Figure 4-4 Effect of organic carry-over on formation of 2,3,7,8-TCDF, tetrachlorinatedphenolics, and AOX in C- and E-stage filtrates [13].
(C,
Ci 5
0
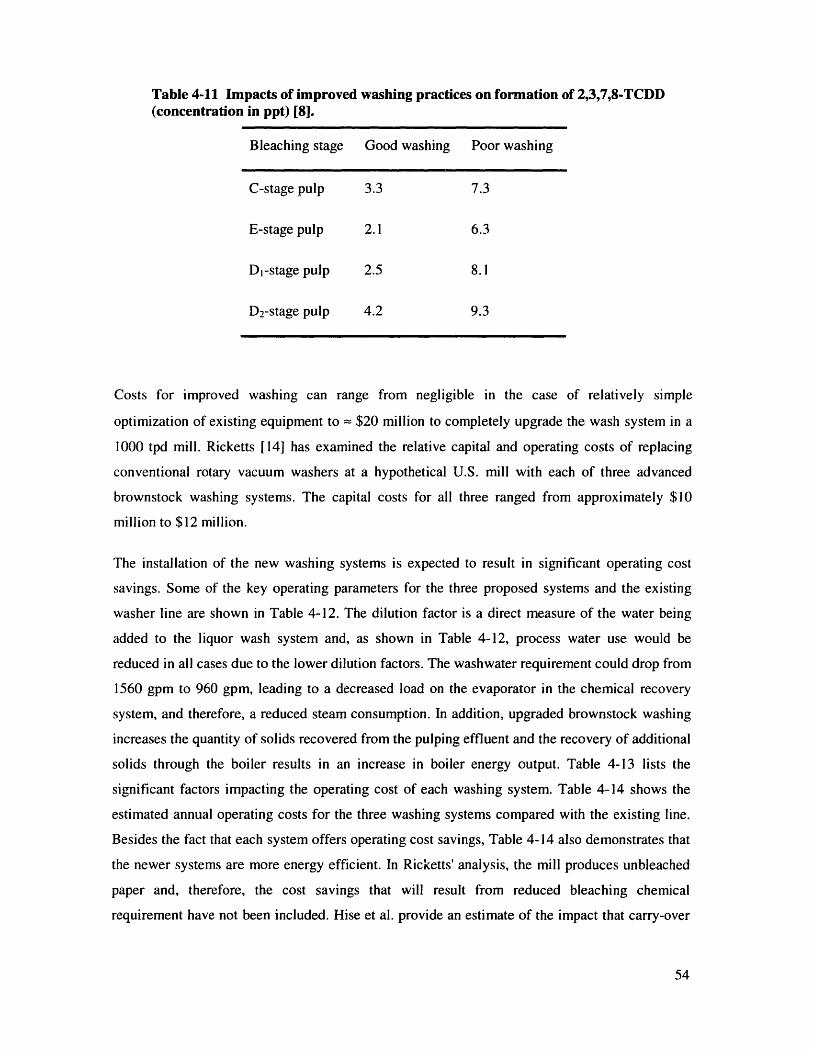
Table 4-11 Impacts of improved washing practices on formation of 2,3,7,8-TCDD(concentration in ppt) [8].
Bleaching stage Good washing Poor washing
C-stage pulp 3.3 7.3
E-stage pulp 2.1 6.3
DI-stage pulp 2.5 8.1
D2-stage pulp 4.2 9.3
Costs for improved washing can range from negligible in the case of relatively simple
optimization of existing equipment to = $20 million to completely upgrade the wash system in a
1000 tpd mill. Ricketts [14] has examined the relative capital and operating costs of replacing
conventional rotary vacuum washers at a hypothetical U.S. mill with each of three advanced
brownstock washing systems. The capital costs for all three ranged from approximately $10
million to $12 million.
The installation of the new washing systems is expected to result in significant operating cost
savings. Some of the key operating parameters for the three proposed systems and the existing
washer line are shown in Table 4-12. The dilution factor is a direct measure of the water being
added to the liquor wash system and, as shown in Table 4-12, process water use would be
reduced in all cases due to the lower dilution factors. The washwater requirement could drop from
1560 gpm to 960 gpm, leading to a decreased load on the evaporator in the chemical recovery
system, and therefore, a reduced steam consumption. In addition, upgraded brownstock washing
increases the quantity of solids recovered from the pulping effluent and the recovery of additional
solids through the boiler results in an increase in boiler energy output. Table 4-13 lists the
significant factors impacting the operating cost of each washing system. Table 4-14 shows the
estimated annual operating costs for the three washing systems compared with the existing line.
Besides the fact that each system offers operating cost savings, Table 4-14 also demonstrates that
the newer systems are more energy efficient. In Ricketts' analysis, the mill produces unbleached
paper and, therefore, the cost savings that will result from reduced bleaching chemical
requirement have not been included. Hise et al. provide an estimate of the impact that carry-over
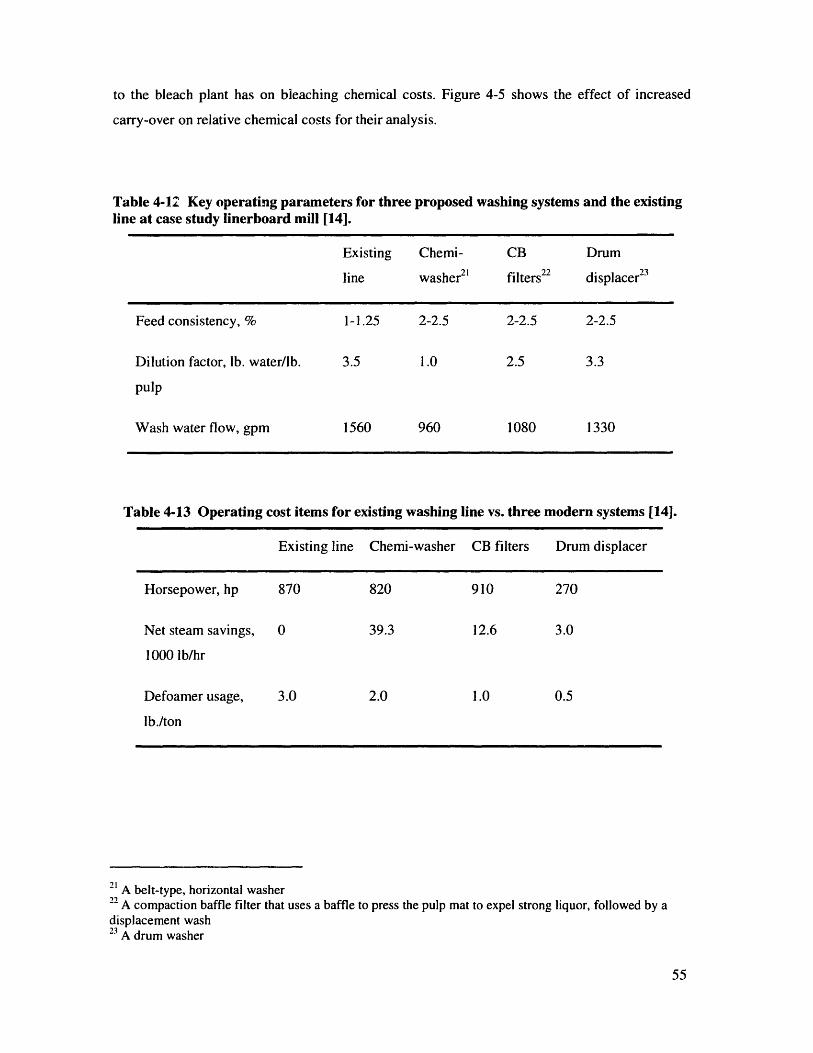
to the bleach plant has on bleaching chemical costs. Figure 4-5 shows the effect of increased
carry-over on relative chemical costs for their analysis.
Table 4-12 Key operating parameters for three proposed washing systemsline at case study linerboard mill [14].
and the existing
Existing Chemi- CB Drum
line washer21 filters22 displacer23
Feed consistency, % 1-1.25 2-2.5 2-2.5 2-2.5
Dilution factor, lb. water/lb. 3.5 1.0 2.5 3.3
pulp
Wash water flow, gpm 1560 960 1080 1330
Table 4-13 Operating cost items for existing washing line vs. three modern systems [14].
Existing line Chemi-washer CB filters Drum displacer
Horsepower, hp 870 820 910 270
Net steam savings, 0 39.3 12.6 3.0
1000 lb/hr
Defoamer usage, 3.0 2.0 1.0 0.5
lb./ton
21 A belt-type, horizontal washer22 A compaction baffle filter that uses a baffle to press the pulp mat to expel strong liquor, followed by adisplacement wash23 A drum washer
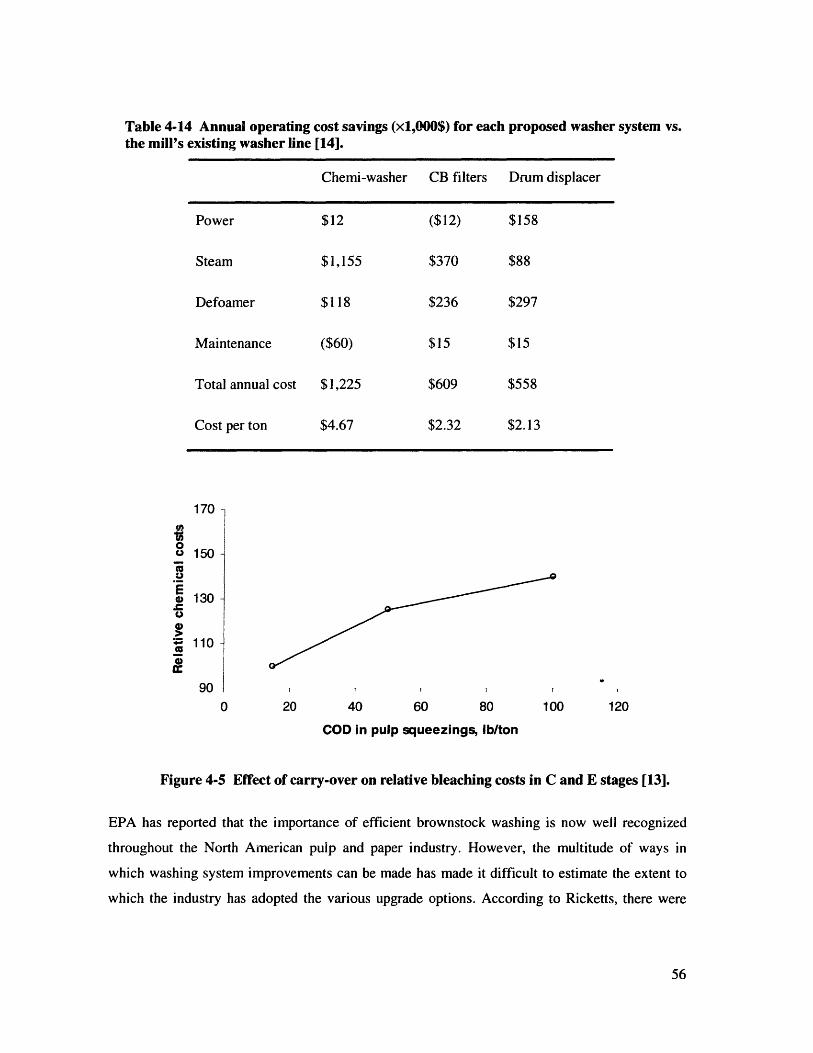
Table 4-14 Annual operating cost savings (xl,000$) for eachthe mill's existing washer line [14].
proposed washer system vs.
Chemi-washer CB filters Drum displacer
Power $12 ($12) $158
Steam $1,155 $370 $88
Defoamer $118 $236 $297
Maintenance ($60) $15 $15
Total annual cost $1,225 $609 $558
Cost per ton $4.67 $2.32 $2.13
1 7n
150 -
130 -
110 -
40 60 80
COD in pulp squeezings, Ib/ton
100 120
Figure 4-5 Effect of carry-over on relative bleaching costs in C and E stages [13].
EPA has reported that the importance of efficient brownstock washing is now well recognized
throughout the North American pulp and paper industry. However, the multitude of ways in
which washing system improvements can be made has made it difficult to estimate the extent to
which the industry has adopted the various upgrade options. According to Ricketts, there were
I
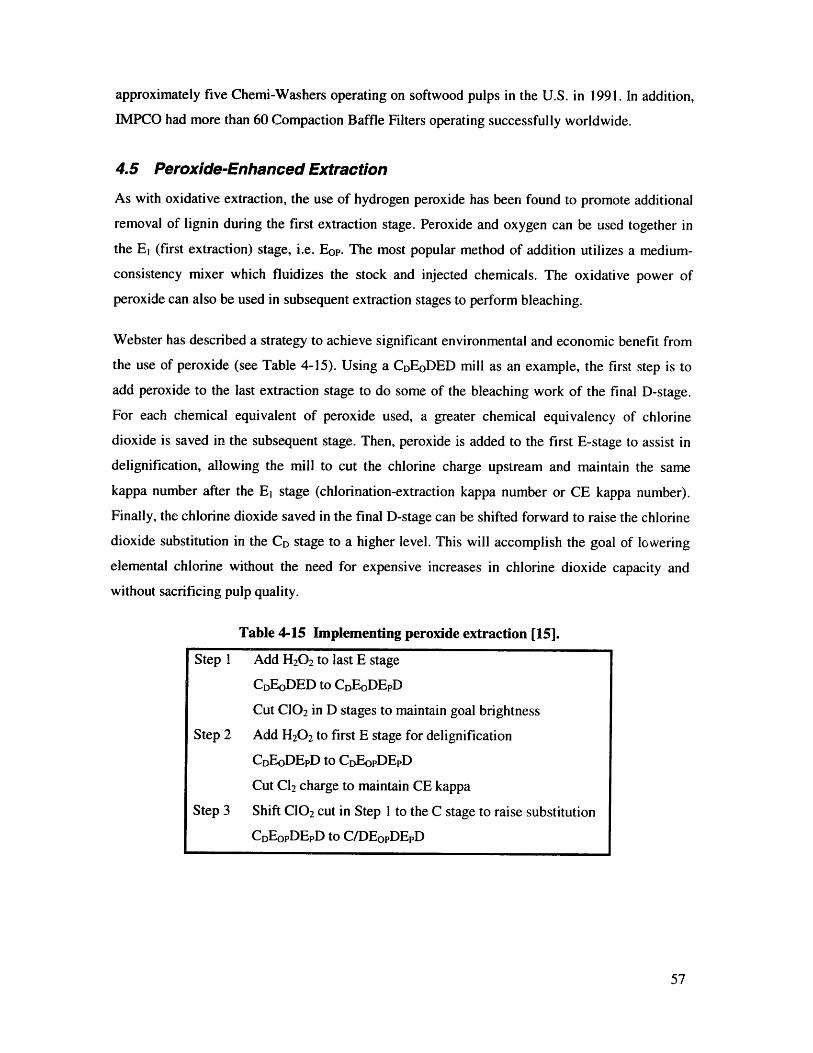
approximately five Chemi-Washers operating on softwood pulps in the U.S. in 1991. In addition,
IMPCO had more than 60 Compaction Baffle Filters operating successfully worldwide.
4.5 Peroxide-Enhanced Extraction
As with oxidative extraction, the use of hydrogen peroxide has been found to promote additional
removal of lignin during the first extraction stage. Peroxide and oxygen can be used together in
the E, (first extraction) stage, i.e. Eop. The most popular method of addition utilizes a medium-
consistency mixer which fluidizes the stock and injected chemicals. The oxidative power of
peroxide can also be used in subsequent extraction stages to perform bleaching.
Webster has described a strategy to achieve significant environmental and economic benefit from
the use of peroxide (see Table 4-15). Using a CDEoDED mill as an example, the first step is to
add peroxide to the last extraction stage to do some of the bleaching work of the final D-stage.
For each chemical equivalent of peroxide used, a greater chemical equivalency of chlorine
dioxide is saved in the subsequent stage. Then, peroxide is added to the first E-stage to assist in
delignification, allowing the mill to cut the chlorine charge upstream and maintain the same
kappa number after the E1 stage (chlorination-extraction kappa number or CE kappa number).
Finally, the chlorine dioxide saved in the final D-stage can be shifted forward to raise the chlorine
dioxide substitution in the CD stage to a higher level. This will accomplish the goal of lowering
elemental chlorine without the need for expensive increases in chlorine dioxide capacity and
without sacrificing pulp quality.
Table 4-15 Implementing peroxide extraction [15].
Step 1 Add H20 2 to last E stage
CDEoDED to CDEoDEpD
Cut C10 2 in D stages to maintain goal brightness
Step 2 Add H20 2 to first E stage for delignification
CDEoDEpD to CDEOPDEpD
Cut Cl 2 charge to maintain CE kappa
Step 3 Shift C10 2 cut in Step I to the C stage to raise substitution
CDEOPDEpD to C/DEopDEpD
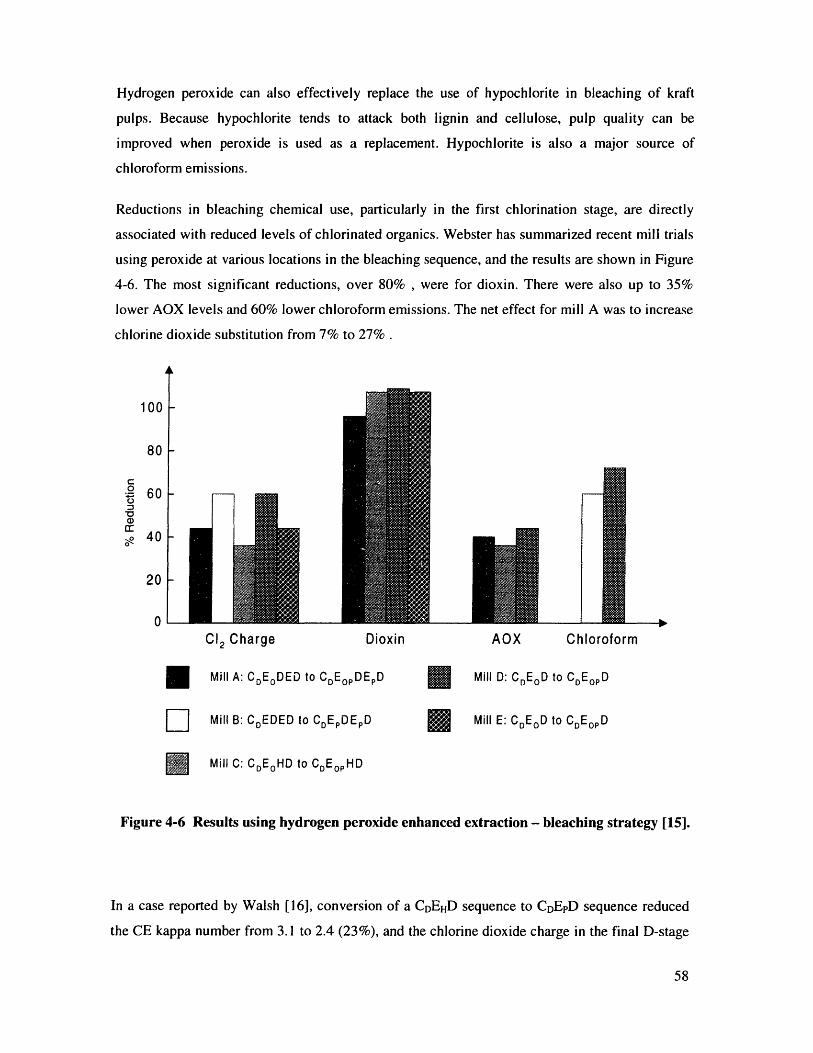
Hydrogen peroxide can also effectively replace the use of hypochlorite in bleaching of kraft
pulps. Because hypochlorite tends to attack both lignin and cellulose, pulp quality can be
improved when peroxide is used as a replacement. Hypochlorite is also a major source of
chloroform emissions.
Reductions in bleaching chemical use, particularly in the first chlorination stage, are directly
associated with reduced levels of chlorinated organics. Webster has summarized recent mill trials
using peroxide at various locations in the bleaching sequence, and the results are shown in Figure
4-6. The most significant reductions, over 80% , were for dioxin. There were also up to 35%
lower AOX levels and 60% lower chloroform emissions. The net effect for mill A was to increase
chlorine dioxide substitution from 7% to 27% .
100
80
60
40
20
A
Cl2 Charge Dio
Mill A: CDEDED to CDEOPDED
Mill B: CDEDED to CDEPDEpD
xin AOX Chloroform
Mill D:CDEoD to CDEOpD
Mill E: CDEoD to CDEOPD
Mill C: CDEoHD to CDEOPHD
Figure 4-6 Results using hydrogen peroxide enhanced extraction - bleaching strategy [15].
In a case reported by Walsh [16], conversion of a CDEHD sequence to CDEpD sequence reduced
the CE kappa number from 3.1 to 2.4 (23%), and the chlorine dioxide charge in the final D-stage
ULII
A41
E
E
I-
II 10
!-
L- -
was reduced by 7.2 lb./ton. Hydrogen peroxide replaced hypochlorite at a ratio of 1:3.5. The final
brightness increased 1.4 points. In another study, conversion of a CEHD sequence to CEpHD
sequence led to AOX and chloroform reductions of 27.5% and 49.4%, respectively.
Webster notes that compared to other options, such as modifying chlorine stage operations or
increasing chlorine dioxide generating capacity, hydrogen peroxide substitution presents a low
capital option. Permanent installations, including the storage tank, mix tank, and process piping,
typically cost less than $100,000, and no major construction or significant modification of
existing facilities is needed. In terms of operating costs, the main impact is the change in overall
chemical consumption. Helmling et al. [17] have reported on the benefits of replacing the Eo
stage of a CDEoHD sequence with hydrogen peroxide at a U.S. kraft pulp mill. While maintaining
the D-stage washer brightness, the hypochlorite and the chlorine dioxide charges could be
reduced by 20% and 35%, respectively. These reductions led to a savings in bleaching costs of
approximately $2/ton of pulp.
A mill can also apply hydrogen peroxide economically in the Eo stage of a shortened bleaching
sequence. Helmling et al. [17] report on attempts to reduce a five-step bleach sequence,
CDEoDED, into a three-step CDEopD sequence. Bleaching steps require steam in order to reach
desired reaction temperatures in the bleach towers. Most of the bleach plant electricity use is for
pumping and mixing. Fewer steps result in lower electricity and steam demands. Althouse [18]
reported that shortening the bleach sequence enabled a pulp mill to realize the following savings:
i. Electrical Costs: $1 to $3 per ton of pulp or $175,000 to $525,000 per year.
2. Steam Costs: $3 to $5 per ton of pulp or $525,000 to $875,000 per year.
3. Maintenance Costs: $2 to $5 per ton of pulp or $375,000 to $875,000 per year.
The percentage of all bleach lines in North America using hydrogen peroxide in the extraction
stage was estimated in 1987 to be 25%. Walsh reported a 30% increase in peroxide use in the
pulp and paper industry between 1989 and 1990 and about half of the U.S. consumption was
accounted for by kraft bleaching.
Iron and Steel
This section follows the same general outline as the discussion for the pulp/paper industry.
Chapter 5 describes conventional iron and steelmaking technology. Emphasis has been placed on
process steps that are of most concern to the industry from the standpoint of environmental
regulations. Sources of air and water pollution have also been identified. This is followed by
Chapter 6, that provides an introduction to environmental legislation relevant to the iron/steel
sector. Finally, in Chapter 7, novel technical advances that offer economic benefits along with
pollution reduction have been described.
5 Conventional Technology: Iron and Steel
Steel is an important material of any modern economy. Its versatile range of physical properties
and chemical resistance make it the main structural and engineering material today. It is an
indispensable component in the manufacture of cars, trucks, ships, oil and gas installations,
electrical and mechanical machines, environmental control equipment, household appliances,
buildings, factories, roads and bridges.
The iron and steel industry is categorized by the Bureau of the Census under the SIC code 33,
primary metal industries. SIC 3312 is the most significant class under SIC code 33, and includes
blast furnaces, steel works, and rolling mills [1]. The 1995 Census data reported 247
establishments under SIC 3312, with an estimated 153,000 employees, a payroll of $7.5 billion,
and a value of shipments totaling $54 billion [2].
Currently, there are two process routes that dominate steel manufacture. These are the integrated
and the electric arc furnace or EAF routes, the latter sometimes referred to as the mini-mill route.
The key difference between the two is the type of iron bearing feedstock they consume. In an
integrated works, this is predominantly iron ore, with a smaller quantity of scrap, while the EAF
works use mainly scrap, or other sources of metallic iron such as directly reduced iron. Figure 5-1
is a flowsheet for the production of molten steel via the integrated and mini-mill routes.
The production of steel in an integrated works involves the processes of cokemaking, ironmaking
and finally, steelmaking. Coke, which functions as the fuel and the reducing agent for iron ore, is
produced by heating coal in coke ovens. Pig iron is then produced by heating the coke, iron ore
and limestone in a blast furnace. Finally, iron from the blast furnace is converted to steel in the
Basic Oxygen Furnace (BOF). Molten iron from the blast furnace, flux, alloying materials, and
scrap are placed in the BOF, melted and refined by injecting high purity oxygen. Reaction of
oxygen with carbon and silica in the iron generates the heat necessary to melt the scrap. The
oxidized impurities are captured in the slag formed from the flux. The alloying elements are used
to achieve the desired steel composition.
About one-quarter of the world's steel is produced by the electric-arc method, which uses high-
current electric arcs to melt steel scrap and convert it into liquid steel. During melting, oxidation
of impurities occurs and a slag is formed on top of the molten metal. Since scrap metal is used
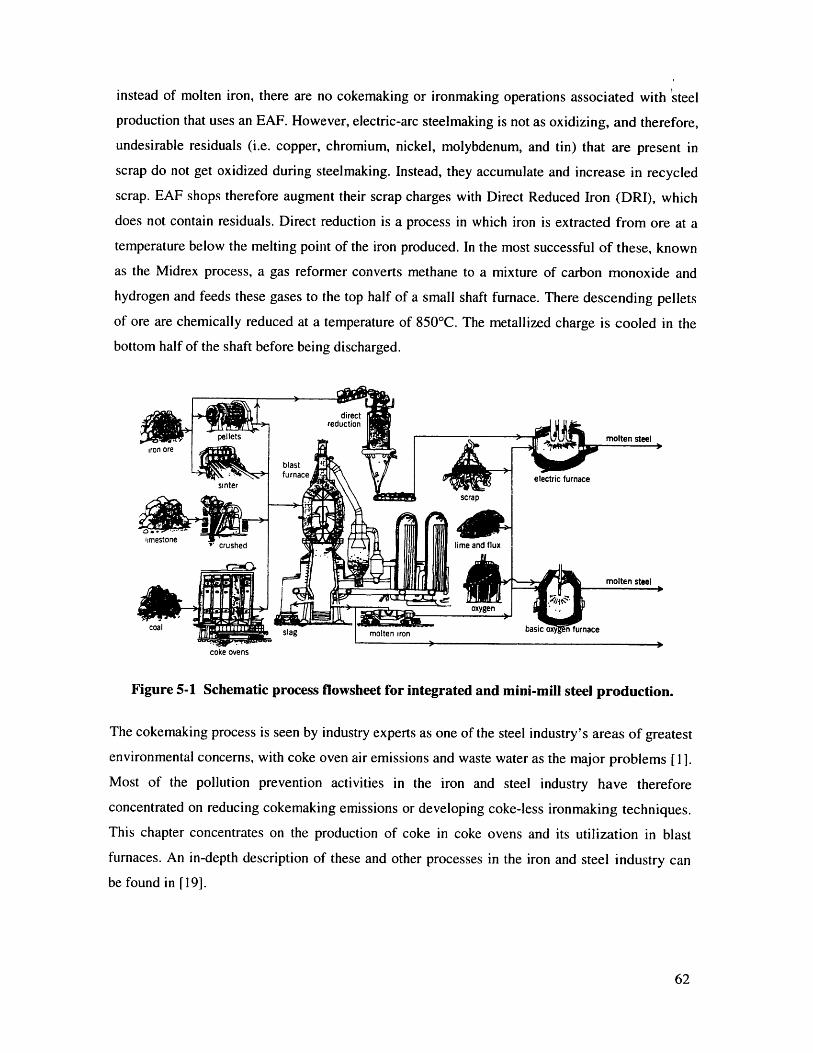
instead of molten iron, there are no cokemaking or ironmaking operations associated with steel
production that uses an EAF. However, electric-arc steelmaking is not as oxidizing, and therefore,
undesirable residuals (i.e. copper, chromium, nickel, molybdenum, and tin) that are present in
scrap do not get oxidized during steelmaking. Instead, they accumulate and increase in recycled
scrap. EAF shops therefore augment their scrap charges with Direct Reduced Iron (DRI), which
does not contain residuals. Direct reduction is a process in which iron is extracted from ore at a
temperature below the melting point of the iron produced. In the most successful of these, known
as the Midrex process, a gas reformer converts methane to a mixture of carbon monoxide and
hydrogen and feeds these gases to the top half of a small shaft furnace. There descending pellets
of ore are chemically reduced at a temperature of 850'C. The metallized charge is cooled in the
bottom half of the shaft before being discharged.
coke ovens
Figure 5-1 Schematic process flowsheet for integrated and mini-mill steel production.
The cokemaking process is seen by industry experts as one of the steel industry's areas of greatest
environmental concerns, with coke oven air emissions and waste water as the major problems [1].
Most of the pollution prevention activities in the iron and steel industry have therefore
concentrated on reducing cokemaking emissions or developing coke-less ironmaking techniques.
This chapter concentrates on the production of coke in coke ovens and its utilization in blast
furnaces. An in-depth description of these and other processes in the iron and steel industry can
be found in [19].
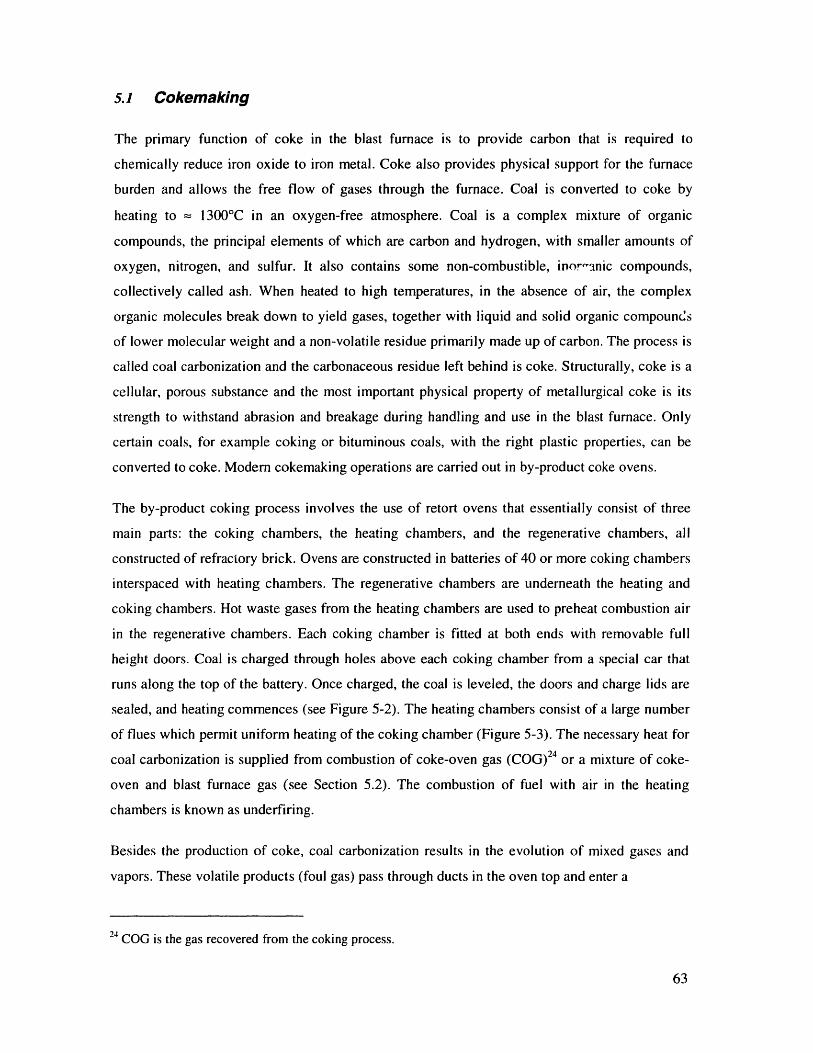
5.1 Cokemaking
The primary function of coke in the blast furnace is to provide carbon that is required to
chemically reduce iron oxide to iron metal. Coke also provides physical support for the furnace
burden and allows the free flow of gases through the furnace. Coal is converted to coke by
heating to = 1300'C in an oxygen-free atmosphere. Coal is a complex mixture of organic
compounds, the principal elements of which are carbon and hydrogen, with smaller amounts of
oxygen, nitrogen, and sulfur. It also contains some non-combustible, inor'-anic compounds,
collectively called ash. When heated to high temperatures, in the absence of air, the complex
organic molecules break down to yield gases, together with liquid and solid organic compounds
of lower molecular weight and a non-volatile residue primarily made up of carbon. The process is
called coal carbonization and the carbonaceous residue left behind is coke. Structurally, coke is a
cellular, porous substance and the most important physical property of metallurgical coke is its
strength to withstand abrasion and breakage during handling and use in the blast furnace. Only
certain coals, for example coking or bituminous coals, with the right plastic properties, can be
converted to coke. Modern cokemaking operations are carried out in by-product coke ovens.
The by-product coking process involves the use of retort ovens that essentially consist of three
main parts: the coking chambers, the heating chambers, and the regenerative chambers, all
constructed of refractory brick. Ovens are constructed in batteries of 40 or more coking chambers
interspaced with heating chambers. The regenerative chambers are underneath the heating and
coking chambers. Hot waste gases from the heating chambers are used to preheat combustion air
in the regenerative chambers. Each coking chamber is fitted at both ends with removable full
height doors. Coal is charged through holes above each coking chamber from a special car that
runs along the top of the battery. Once charged, the coal is leveled, the doors and charge lids are
sealed, and heating commences (see Figure 5-2). The heating chambers consist of a large number
of flues which permit uniform heating of the coking chamber (Figure 5-3). The necessary heat for
coal carbonization is supplied from combustion of coke-oven gas (COG) 24 or a mixture of coke-
oven and blast furnace gas (see Section 5.2). The combustion of fuel with air in the heating
chambers is known as underfiring.
Besides the production of coke, coal carbonization results in the evolution of mixed gases and
vapors. These volatile products (foul gas) pass through ducts in the oven top and enter a
24 COG is the gas recovered from the coking process.
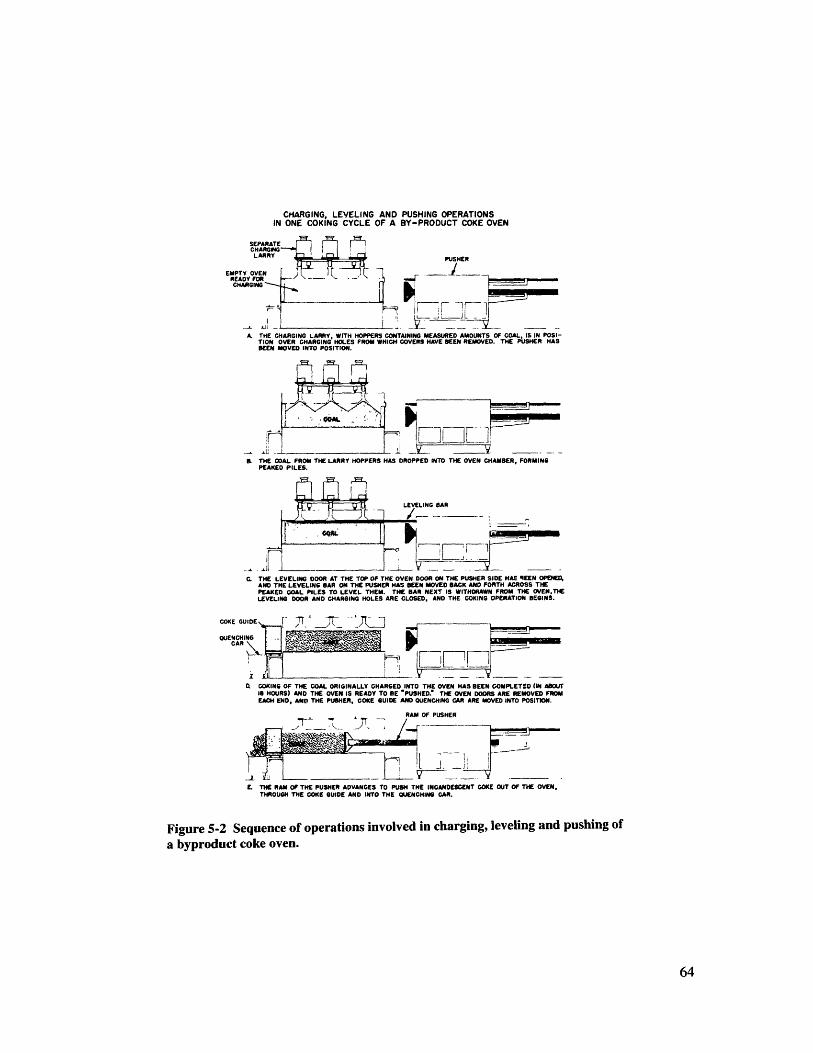
CHARGING, LEVELING AND PUSHING OPERATIONSIN ONE COKING CYCLE OF A BY-PRODUCT COKE OVEN
A. THE CHARGING LARRY, WITH HOPPERS CONTAINING MEASURED AMOUNTS OF COAL, IS IN POSI-TION OVER CHARGING HOLES FROM WHICH COVERS HAVE SEEN REMOVED. THE PUSHER HASBEEN MOVED INTO POSITION.
a THE COAL FROM THE LARRY HOPPERS HAS DROPPED INTO THE OVEN CHAMBER, FORMINGPEAKED PILES.
C. THE LEVELING DOOR AT THE TOP OF THE OVEN DOOR ON THE PUSHER SIDE HAE SEEN OPENEqAND THE LEVELING BAR ON THE PUSHER HAS BEEN MOVED BACK AND FORTH ACROSS THEPEAKED COAL PILES TO LEVEL THEM. THE BAR NEXT IS WITHDRAWN FROM THE OVENTHELEVELING DOOR AND CHARGING HOLES ARE CLOSED, AND THE COKING OPERATION BEGINS.
COKE GUIDEQUENCHING
D COKING OF THE COAL ORIGINALLY CHARGED INTO THE OVEN HAS BEEN COMPLETED (IN ABOUTIS HOURS) AND THE OVEN IS READY TO BE "PUSHED. THE OVEN DOORS ARE REMOVED FROMEACH END, AND THE PUSHER, COKE GUIDE AND QUENCHING CAR ARE MOVED INTO POSITION.
RAM OF PUSHER
--L -
E. THE RAM OF THE PUSHER ADVANCES TO PUSH THE INCANDESCENT COKE OUT OF THE OVEN,THROUGH THE COKE GUIDE AND INTO THE QUENCHING GAR.
Figure 5-2 Sequence of operations involved in charging, leveling and pushing ofa byproduct coke oven.
64
I
i
: i1
refractory lined pipe (ascension pipe), which in turn is connected to a collecting main. The
condensate from the volatile products driven off in the coking process is known as flushing
liquor. The flushing liquor serves as a carrying medium for the condensable compounds formed
in the cokemaking operations and is delivered to a collecting unit customarily called a flushing
liquor decanter tank. The decanter tank functions as a settling basin to permit separation of tar,
carbonaceous and other finely divided material that is carried along with liquor from the
collecting main. The liquor from the decanter is recirculated back to the collector main and the tar
is pumped to storage. The gas passing from the ascension pipe to the collecting main is shock-
cooled with the recirculated flushing liquor spray to precipitate tar from the gas and to cool the
gas to the desired temperature. The virgin tar as it comes from the coke-ovens contains valuable
oils which can be extracted and the residue used as a fuel.
When the heating cycle is complete, the oven is isolated from the collecting main, the end doors
are removed and solid coke is pushed into a coke car (Figure 5-2). The coke car travels to the
quench tower where fresh or recycled water is sprayed on the hot coke to reduce its temperature
to - 2000C.
Figure 5-3 Firing method employed in byproduct coke ovens.
The non-condensed gas and vapors leaving the collecting main are further cooled in a primary
cooler. This results in the formation of ammonia liquor25 and condenses additional tar. The
functioning of a primary cooler is shown in Figure 5-4. The gas enters the bottom of the tower
and the cooling water (or cooling liquor) is pumped into the top of the tower through a spray
system. This provides a downward flow of cooling liquor in countercurrent flow to the gas
25 Ammonia liquor is the water condensate from the gas cooled in the primary cooler.
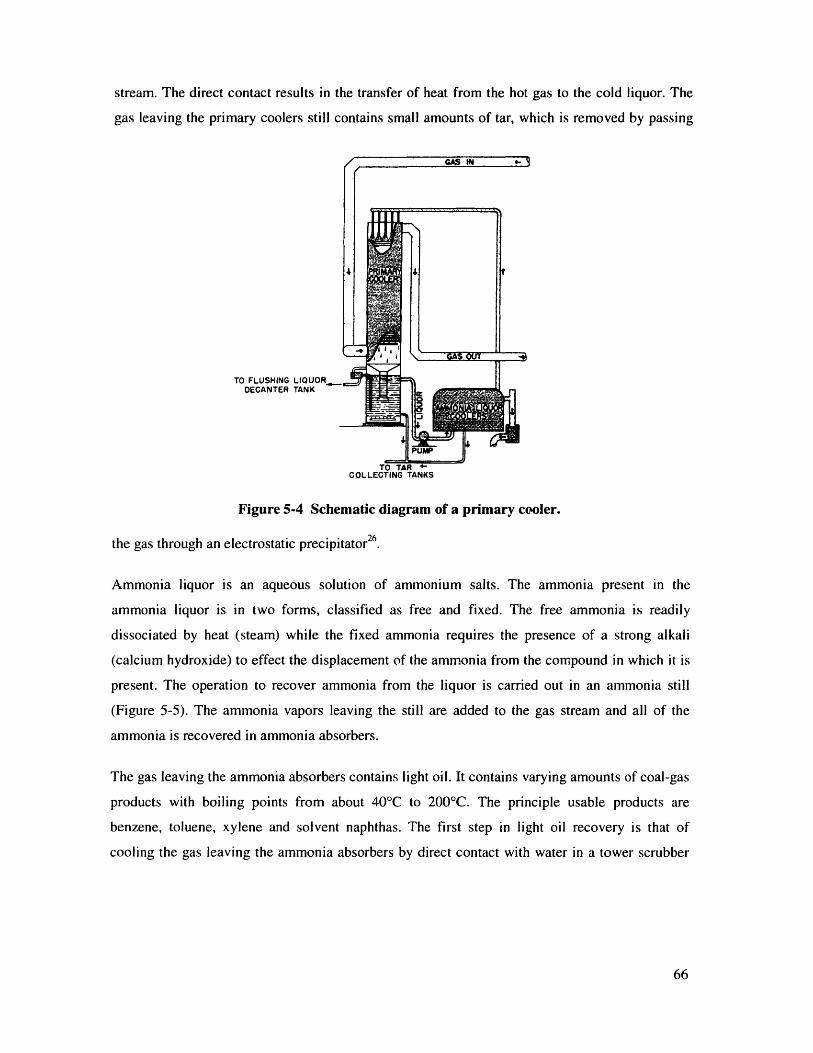
stream. The direct contact results in the transfer of heat from the hot gas to the cold liquor. The
gas leaving the primary coolers still contains small amounts of tar, which is removed by passing
TO FLUSHING LIQUORDECANTER TANK
Figure 5-4 Schematic diagram of a primary cooler.
the gas through an electrostatic precipitator 26
Ammonia liquor is an aqueous solution of ammonium salts. The ammonia present in the
ammonia liquor is in two forms, classified as free and fixed. The free ammonia is readily
dissociated by heat (steam) while the fixed ammonia requires the presence of a strong alkali
(calcium hydroxide) to effect the displacement of the ammonia from the compound in which it is
present. The operation to recover ammonia from the liquor is carried out in an ammonia still
(Figure 5-5). The ammonia vapors leaving the still are added to the gas stream and all of the
ammonia is recovered in ammonia absorbers.
The gas leaving the ammonia absorbers contains light oil. It contains varying amounts of coal-gas
products with boiling points from about 40'C to 2000C. The principle usable products are
benzene, toluene, xylene and solvent naphthas. The first step in light oil recovery is that of
cooling the gas leaving the ammonia absorbers by direct contact with water in a tower scrubber
i
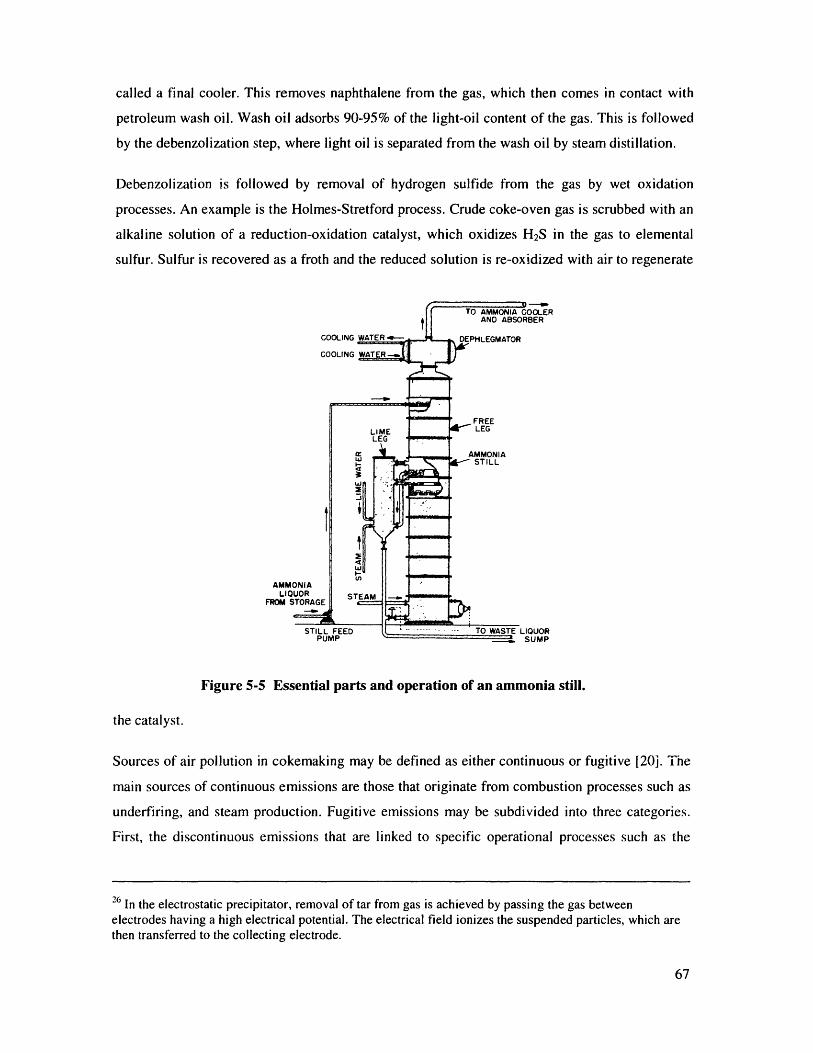
called a final cooler. This removes naphthalene from the gas, which then comes in contact with
petroleum wash oil. Wash oil adsorbs 90-95% of the light-oil content of the gas. This is followed
by the debenzolization step, where light oil is separated from the wash oil by steam distillation.
Debenzolization is followed by removal of hydrogen sulfide from the gas by wet oxidation
processes. An example is the Holmes-Stretford process. Crude coke-oven gas is scrubbed with an
alkaline solution of a reduction-oxidation catalyst, which oxidizes H2S in the gas to elemental
sulfur. Sulfur is recovered as a froth and the reduced solution is re-oxidized with air to regenerate
COOLING
COOLING
STILL FEEDPUMP
PHLEGMATOR
FREELEG
LIQUORSUMP
Figure 5-5 Essential parts and operation of an ammonia still.
the catalyst.
Sources of air pollution in cokemaking may be defined as either continuous or fugitive [20j. The
main sources of continuous emissions are those that originate from combustion processes such as
underfiring, and steam production. Fugitive emissions may be subdivided into three categories.
First, the discontinuous emissions that are linked to specific operational processes such as the
26 In the electrostatic precipitator, removal of tar from gas is achieved by passing the gas betweenelectrodes having a high electrical potential. The electrical field ionizes the suspended particles, which arethen transferred to the collecting electrode.
charging and pushing of ovens and the wet quenching of hot coke. Second, the diffuse emissions
that arise from leakage at the charging holes, ascension pipes and oven doors, or from vents on
storage tanks in the byproducts plant. The final category includes the fugitive emissions that
occur from open sources, such as stockpiles, under windy conditions. The main pollutants present
in the underfiring gases are SO2, NOx, and particulates (PMlo) 27. Particulate matter in stack
emissions is mainly soot arising from incomplete combustion. Particulate emissions arise from
underfiring, charging, pushing, and quenching operations. Fugitive emissions from the battery
operations contain polycyclic aromatic hydrocarbons (PAHs), benzene, toluene, and xylene
(BTX), and odoriferous substances such as H2S.
Coke-plant waste water is made up of discharges from the flushing liquor system, from the
primary and final coolers, decanted water from the light-oil decanters, and discharges from the
tar-recovery/chemicals-recovery operations [19]. The treatment of coke-oven waste water is a
three stage process, involving prztreatment for separation of oils and tar, steam stripping for the
removal of ammonia, H2 S, and HCN, and finally biological oxidation in a biological effluent
treatment plant (BETP) for the destruction of phenols, thiocyanates, cyanides, and thiosulphates
that contribute to the chemical oxygen demand of the effluent. Table 5-1 gives the typical
composition of the waste water stream from a coke plant following the treatment steps outlined
above.
Table 5-1 Typical composition of coke-plant waste water after treatment [19].
Constituent Concentration
Ammonia < 10 ml/m3 (ppm)
Phenol < 0.1 ml/m 3 (ppm)
Thiocyanate < 1.0 ml/m 3 (ppm)
Total Cyanide < 1.0 ml/m 3 (ppm)
Oil < 15 ml/m 3 (ppm)
Total Suspended Solids < 25 ml/m3 (ppm)
Figure 5-6 presents an energy/material balance for the coke oven works.
27 PM10 is a designation for particulate matter with an aerodynamic diameter less than or equal to 0I m.
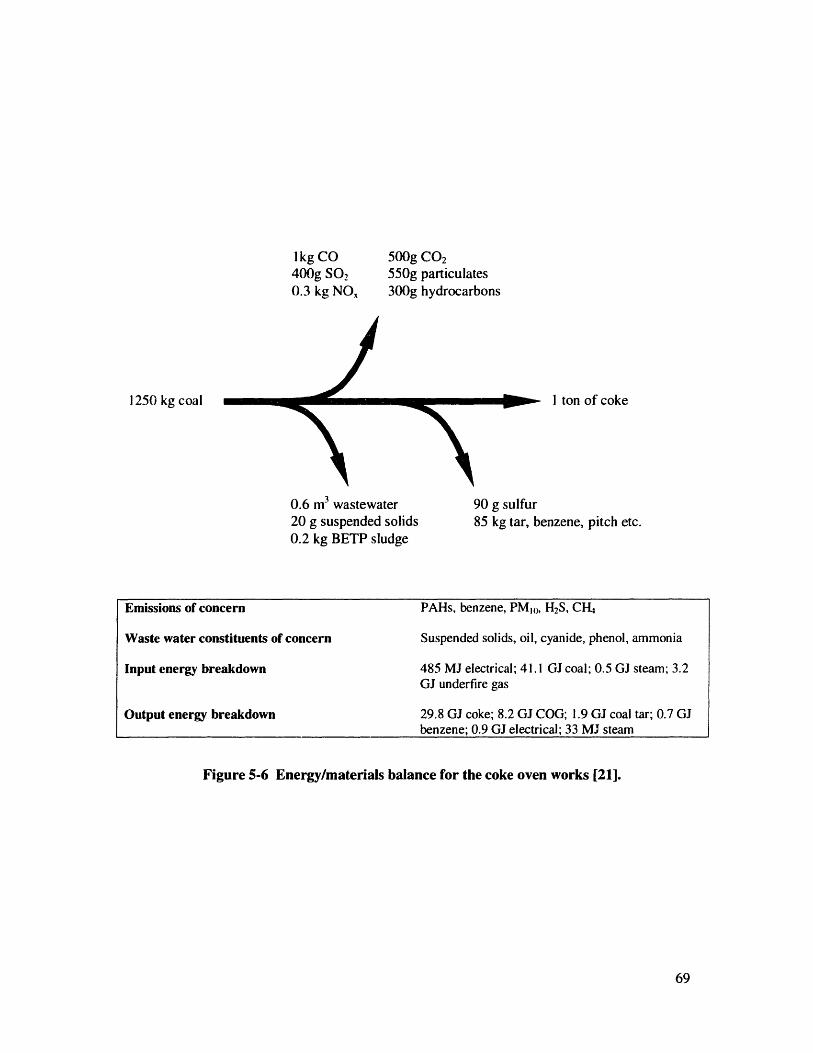
500g CO2550g particulates300g hydrocarbons
- I ton of coke
0.6 m3 wastewater20 g suspended solids0.2 kg BETP sludge
90 g sulfur85 kg tar, benzene, pitch etc.
Figure 5-6 Energy/materials balance for the coke oven works [21].
1kg CO400g SO 2
0.3 kg NOx
1250 kg coalJ-
Emissions of concern PAHs, benzene, PMlo, H2S, CH4
Waste water constituents of concern Suspended solids, oil, cyanide, phenol, ammonia
Input energy breakdown 485 MJ electrical; 41.1 GJ coal; 0.5 GJ steam; 3.2GJ underfire gas
Output energy breakdown 29.8 GJ coke; 8.2 GJ COG; 1.9 GJ coal tar; 0.7 GJbenzene; 0.9 GJ electrical; 33 MJ steam
L, -- LI I~__am-
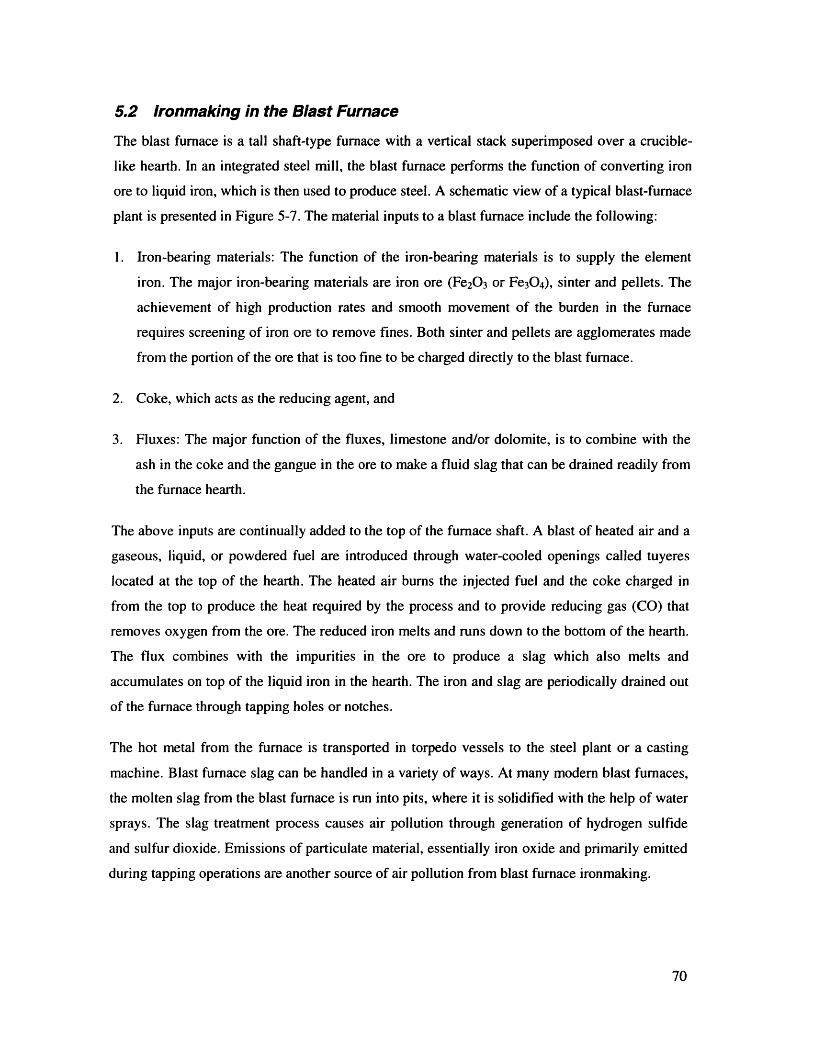
5.2 Ironmaking in the Blast Furnace
The blast furnace is a tall shaft-type furnace with a vertical stack superimposed over a crucible-
like hearth. In an integrated steel mill, the blast furnace performs the function of converting iron
ore to liquid iron, which is then used to produce steel. A schematic view of a typical blast-furnace
plant is presented in Figure 5-7. The material inputs to a blast furnace include the following:
1. Iron-bearing materials: The function of the iron-bearing materials is to supply the element
iron. The major iron-bearing materials are iron ore (Fe 20 3 or Fe 30 4), sinter and pellets. The
achievement of high production rates and smooth movement of the burden in the furnace
requires screening of iron ore to remove fines. Both sinter and pellets are agglomerates made
from the portion of the ore that is too fine to be charged directly to the blast furnace.
2. Coke, which acts as the reducing agent, and
3. Fluxes: The major function of the fluxes, limestone and/or dolomite, is to combine with the
ash in the coke and the gangue in the ore to make a fluid slag that can be drained readily from
the furnace hearth.
The above inputs are continually added to the top of the furnace shaft. A blast of heated air and a
gaseous, liquid, or powdered fuel are introduced through water-cooled openings called tuyeres
located at the top of the hearth. The heated air burns the injected fuel and the coke charged in
from the top to produce the heat required by the process and to provide reducing gas (CO) that
removes oxygen from the ore. The reduced iron melts and runs down to the bottom of the hearth.
The flux combines with the impurities in the ore to produce a slag which also melts and
accumulates on top of the liquid iron in the hearth. The iron and slag are periodically drained out
of the furnace through tapping holes or notches.
The hot metal from the furnace is transported in torpedo vessels to the steel plant or a casting
machine. Blast furnace slag can be handled in a variety of ways. At many modern blast furnaces,
the molten slag from the blast furnace is run into pits, where it is solidified with the help of water
sprays. The slag treatment process causes air pollution through generation of hydrogen sulfide
and sulfur dioxide. Emissions of particulate material, essentially iron oxide and primarily emitted
during tapping operations are another source of air pollution from blast furnace ironmaking.
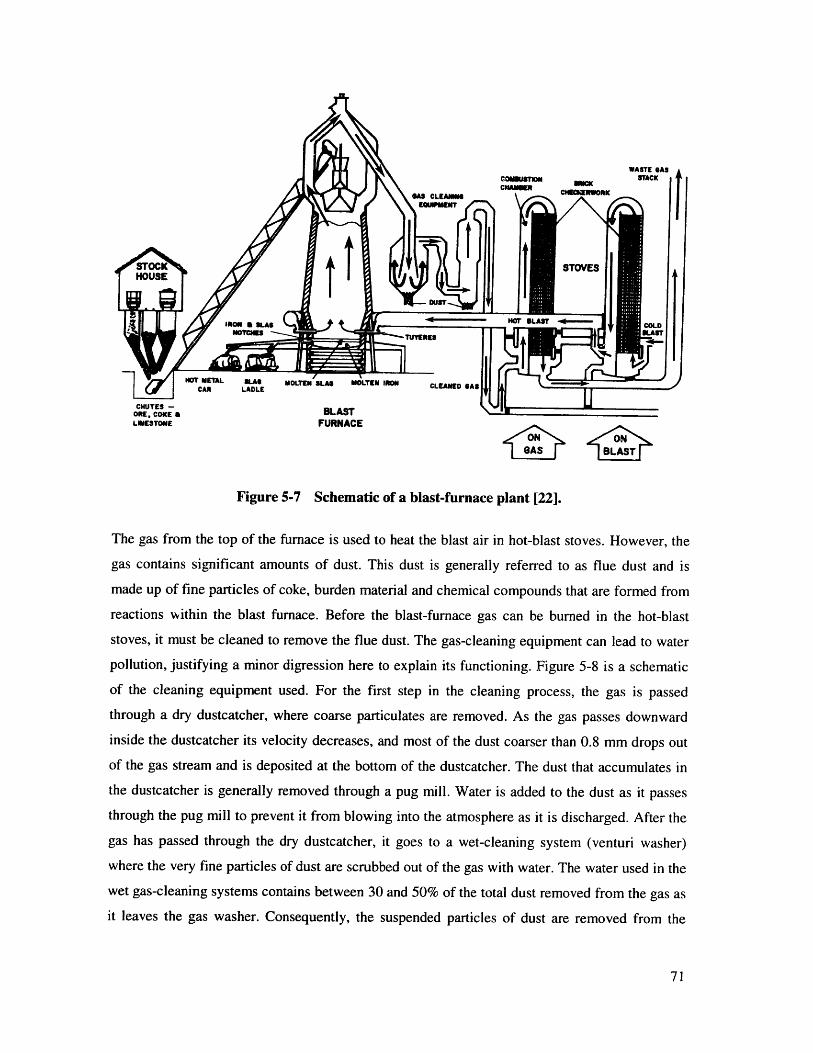
LmESTOWE FURNACE
~ONS BLON
Figure 5-7 Schematic of a blast-furnace plant [22].
The gas from the top of the furnace is used to heat the blast air in hot-blast stoves. However, the
gas contains significant amounts of dust. This dust is generally referred to as flue dust and is
made up of fine particles of coke, burden material and chemical compounds that are formed from
reactions within the blast furnace. Before the blast-furnace gas can be burned in the hot-blast
stoves, it must be cleaned to remove the flue dust. The gas-cleaning equipment can lead to water
pollution, justifying a minor digression here to explain its functioning. Figure 5-8 is a schematic
of the cleaning equipment used. For the first step in the cleaning process, the gas is passed
through a dry dustcatcher, where coarse particulates are removed. As the gas passes downward
inside the dustcatcher its velocity decreases, and most of the dust coarser than 0.8 mm drops out
of the gas stream and is deposited at the bottom of the dustcatcher. The dust that accumulates in
the dustcatcher is generally removed through a pug mill. Water is added to the dust as it passes
through the pug mill to prevent it from blowing into the atmosphere as it is discharged. After the
gas has passed through the dry dustcatcher, it goes to a wet-cleaning system (venturi washer)
where the very fine particles of dust are scrubbed out of the gas with water. The water used in the
wet gas-cleaning systems contains between 30 and 50% of the total dust removed from the gas as
it leaves the gas washer. Consequently, the suspended particles of dust are removed from the
water before it is reused or discharged. In addition to using water to remove flue dust, efficient
operation of a blast furnace requires considerable amounts of water for cooling various parts of
the furnace. As mentioned above, water is also used for slag processing operations.
An integral part of blast furnace operation are the hot-blast stoves. The stoves are tall, cylindrical
steel structures lined with insulation and almost completely filled with checker brick. In the
operation of the hot-blast system, the checkerwork of a stove is first heated by combustion of
blast-furnace gas, and then the cold blast air is passed through the stove and is heated by the hot
checkerwork. The combustion products generated in the hot-blast stoves are released to the waste
gas stack.
The dust removed from the gas in the cleaning system is sintered for recycling back into the blast
furnace. A better appreciation of the quantity of material and the amount of energy required for
producing hot metal in the blast furnace can be obtained by referring to the material balance in
Figure 5-9 and the energy balance in Table 5-2.
This technological description provides a framework for assessing the impact of environmental
regulations that have been enumerated in the following chapter.
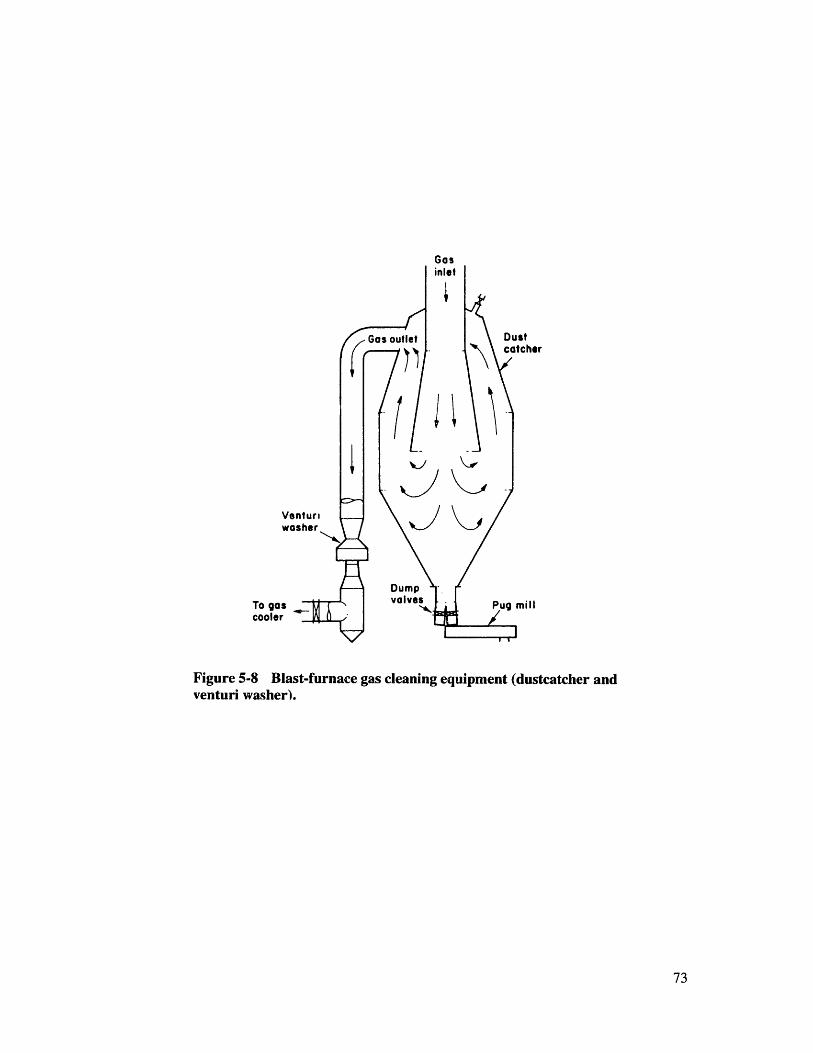
VeWI
To gascooler
sttcher
mill
Figure 5-8 Blast-furnace gas cleaning equipment (dustcatcher andventuri washer).
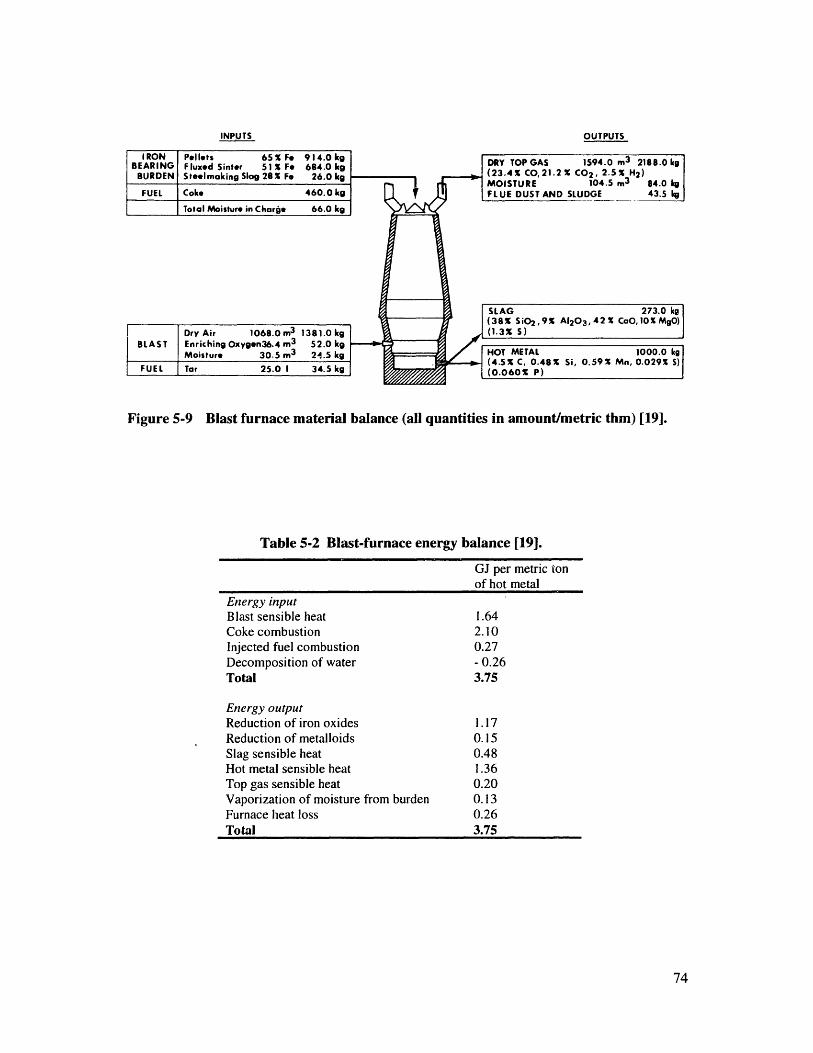
INPUTS OUTPUTS
2188.0 kgH2)
84.0 ko43.5 kg
Blast furnace material balance (all quantities in amount/metric thmn
Table 5-2 Blast-furnace energy balance [19].
GJ per metric tonof hot metal
Energy inputBlast sensible heat 1.64Coke combustion 2.10Injected fuel combustion 0.27Decomposition of water - 0.26Total 3.75
Energy outputReduction of iron oxides 1.17Reduction of metalloids 0.15Slag sensible heat 0.48Hot metal sensible heat 1.36Top gas sensible heat 0.20Vaporization of moisture from burden 0.13Furnace heat loss 0.26Total 3.75
Figure 5-9 ) [19].
6 Regulations
The present chapter discusses the major federal environmental statutes that affect the iron and
steel industry. Emphasis is placed on the more significant changes over the last few years. Over
the past 25 years, the U.S. iron and steel industry has invested approximately $6 billion in
pollution control systems. In a typical year, 15% of the industry's capital investments go toward
environmental projects. Costs for operating and maintaining these facilities amount to $10 to $20
per ton of steel shipped [23]. In 1994 alone, the iron and steel industry had capital expenditures of
$231 million for pollution abatement, including $45 million on water pollution control, $20
million for solid/contained waste, and $166 million for air pollution control. The figure for air
pollution control (72% of total environmental expenditure) is primarily a result of operating coke
ovens in compliance with the Clean Air Act (CAA) [1].
6.1 Clean Air Act
6.1.1 National Primary and Secondary Ambient Air Quality Standards 40CFR50
Title I of CAA addresses requirements for the attainment and maintenance of the National
Ambient Air Quality Standards (NAAQS). The general idea behind the NAAQS program is that
it is to be based on scientific determinations of threshold levels of air pollution. These standards
establish numerical criteria to be applied uniformly throughout the country through State
Implementation Plans (SIPs). National primary ambient air quality standards (NPAAQS) define
levels of air quality which the EPA Administrator judges are necessary, with an adequate margin
of safety, to protect the public health. National secondary ambient air quality standards
(NSAAQS) define levels of air quality which the Administrator judges necessary to protect the
public welfare from any known or anticipated adverse effects of a pollutant. EPA has set NAAQS
for six criteria pollutants: SOx, PM10, CO, ozone, NOx, and Pb. The methods for sampling and
analyzing ambient air for these air pollutants are specified as reference methods in Part 50. Here,
we provide brief information on the threshold levels set by EPA (see Table 6-1).
The levels of the annual and 24-hour NPAAQS for sulfur oxides are 0.03 ppm (annual arithmetic
mean) and 0.14 ppm (24-hour average concentration), respectively. The level of the 3-hour
NSAAQS for SO, is 0.5 ppm (3-hour average concentration). The level of the national primary as
well as secondary annual and 24-hour ambient air quality standards for particulate matter is 50
gg/m3 and 150 gg/m3, respectively. The NPAAQS for CO are:
1. 9 ppm (10 mg/m 3) for an 8-hour average concentration.
2. 35 ppm (40 mg/m3) for a 1-hour average concentration.
The annual NPAAQS and NSAAQS for nitrogen dioxide are 0.053 ppm (100 gg/m 3 ). For Pb, the
standard is 1.5 gg/m 3, arithmetic mean averaged over a calendar quarter.
Table 6-1 National ambient air quality standards for criteria pollutants.
Pollutant
SO, (ppm)
PM10 (p~g/m 3)
CO (ppm)
NAA,
NPAAQS
0.03 Annual
0.14 24-hr
QS
NSAAQS
0.5 3-hr
50 Annual
150 24-hr
9 8-hr
35 1-hr
NO 2 (ppm)
Pb (gg/m3)
0.053 Annual
1.5 Quarterly
6.1.2 National Emission Standards for Hazardous Air Pollutants (NESHAPs)
In a manner similar to the pulp and paper industry, EPA has promulgated standards to control the
emission of Hazardous Air Pollutants generated in the iron and steel sector. These standards are
again based on the use of MACT. However, if a technology-based standard does not result in
acceptable ambient concentration levels, the EPA is required to set stricter limitations based on
risk estimations. These risk-based standards rely on the determination of an ample margin of
safety. The EPA has interpreted ample margin of safety as that standard which protects the most
exposed individual in the population to a risk of cancer below 1 in 10,000 and the majority of the
population to less than I in I million.
-
National Emission Standards for Coke Oven Batteries 40CFR63 Subpart L
In 1992, the EPA released its new proposed rule on CAA standards for toxic emissions from coke
ovens. Coke emissions are listed as a hazardous air pollutant under the Clean Air Act. Emission
points associated with byproduct coke oven batteries that are subject to NESHAP limitations
include charging operations, coke oven doors, topside port lids and offtake systems on the top
side of the battery, and collecting mains. Operators may choose from two options. Under a
standard time line, MACT must be achieved by 1995 and a risk-based standard by 2003.
The standard time line restrictions require that, by December 31, 1995, coke oven emissions from
each existing byproduct coke oven battery not exceed: (1) 5.5% leaking doors for short batteries28
and 6% for tall batteries29; (2) 0.6% leaking topside port lids; (3) 3% leaking offtake systems; (4)
12 seconds of visible emissions per charge. Leaks from doors, lids, and offtake systems are
measured as a percentage of doors, lids etc. in a coke oven battery that are leaking over some time
interval. On and after January 1, 2003, leaking door limitations would be reduced to 5.5% for tall
and 5% for short batteries. Visible emission limitations for a new byproduct coke oven battery are
0% leaking doors, topside port lids and offtake systems, and up to 34 seconds of visible emissions
per charge. Table 6-2 summarizes these restrictions.
Table 6-2 National emission standards for coke oven batteries.
Standard time line Extended time line
Emission point Compliance date
Dec. 31, 1995 Jan. 1.2003 Nov. 15, 1993 Jan. 1, 1998 2010
5.5% (short) 5% (short) 7% 3.8% (short) 3.3% (short)Oven door6% (tall) 5.5% (tall) 4.3% (tall) 4% (tall)
Topside port lids 0.6% 0% (new) 0.83% 0.4%
Offtake system 3% 0% (new) 4.2% 2.5%
Duration of visible 12 sec 34 sec (new) 12 sec 12 sec
emissions per charge
28Short coke oven battery means a battery with ovens less than 6m in height.ShorTall coke oven battery means a battery with ovens less than 6m or more in height.
29Tall coke oven battery means a battery with ovens less than 6in or more in height.
The other choice allows for postponing the risk-based standards until 2020, but to qualify for the
extension, progressively tighter standards must be met in 1998 and 2010. The batteries were
expected to meet initial MACT emission limiting standards (7% leaking doors, 0.83% leaking top
side port lids, 4.2% leaking offtake systems, and 12 seconds of visible charges) by November 15,
1993. In addition to meeting the initial MACT standards, coke batteries must meet even more
stringent limits (known as Lowest Achievable Emission Rate or LAER limits) by January 1, 1998
(4.3% leaking doors for tall, 3.8% for short, 0.4% topside port lids, 2.5% off-takes, and 12
seconds of emissions per charge). The Act allows for promulgation of a new LAER standard (4%
leaking doors for tall, 3.3% for short) in 2007 that batteries would have to meet by 2010.
National Emission Standard for Benzene Emissions from Coke Byproduct RecoveryPlants 40CFR61 Subpart L
The provisions of this subpart apply to each of the following sources at coke byproduct recovery
plants: tar decanters and storage tanks; tar-intercepting sumps 30; flushing liquor circulation tanks;
light-oil condensers, decanters, sumps 3 , and storage tanks; wash-oil decanters 32 and circulation
tanks; naphthalene processing; BTX and excess ammonia-liquor storage tanks; final coolers and
related equipment that is intended to operate in benzene service. Gases from each process vessel,
tar storage tank and tar-intercepting sump need to be ducted to the gas collection system in the
byproduct recovery process, where the benzene in the gas will be recovered or destroyed. The
liquid surface in case of light-oil sumps should be enclosed and sealed to contain the emissions.
These control systems will be designed and operated for no detectable emissions, as indicated by
a concentration of less than 500 ppm above background levels. No emissions are allowed from
naphthalene processing and final coolers.
National Emission Standards for Halogenated Solvent Cleaning 40CFR63 SubpartT
The provisions of this subpart apply to solvent cleaning machines that use any solvent containing
methylene chloride, perchloroethylene, trichloroethylene, 1,1,1 -trichloroethane, carbon
tetrachloride, or chloroform, in a concentration greater than 5 wt. %. Of these, 1,1,1-
3" A tar-intercepting sump means any tank, pit or enclosure that serves to receive or separate tars andaqueous condensate discharged from the primary cooler.3 Light-oil condenser means any unit in the light-oil recovery operation that functions to condensebenzene-containing vapors. A light-oil decanter functions to separate light oil from water downstream ofthe condenser. A light-oil sump serves to separate hydrocarbon liquids on the surface of the water in light-oil recovery.32 Wash-oil decanter is a vessel that uses gravity to separate condensed water from wash-oil.
trichloroethane and trichloroethylene are among the top chemicals (by weight) that facilities
within the iron and steel sector self reported as released to the environment based upon 1993 TRI
data.
National Emission Standards for Hazardous Air Pollutants for Industrial ProcessCooling Towers 40CFR63 Subpart Q
The provisions of this subpart apply to all new and existing industrial process cooling towers33
(IPCTs) that are operated with chromium-based water treatment chemicals. IPCTs have been
identified as potentially significant sources of chromium air emissions and chromium compounds
are among the substances listed as HAPs in the CAA. The standard required the owner or
operator of any affected IPCT to eliminate the use of chromium-based water treatment chemicals
by 1994.
6.1.3 Pending and Proposed Regulations
Coke oven batteries face unknown but likely tighter technology-based standards in 2010 and risk-
based ones in 2020. Although coke ovens are considered by many industry experts to be the
biggest environmental problem of the iron and steel industry, proposed environmental regulations
(such as those mentioned below) will affect other processes within the industry. MACT standards
for emissions of compounds of Cr, Ni, Mn, Cd, and other heavy metals are expected to be
established in 2000. Because many of these metals are routinely found in iron ore, scrap, and
alloying materials that are processed in iron and steel plants, most steelmaking processes will be
affected in some way. Hydrochloric acid and chlorine are among the pollutants listed as HAPs.
Steel pickling processes that use hydrochloric acid have been identified as potentially significant
sources of HCI and Cl 2 air emissions.
6.2 Clean Water Act
The primary objective of the Clean Water Act is to restore the chemical, physical, and biological
integrity of the nation's surface waters. Pollutants regulated under the CWA include priority,
conventional and non-conventional pollutants. The CWA regulates both direct and indirect
discharges. Direct discharges or "point source" discharges are from sources such as pipes and
sewers. The National Pollutant Discharge Elimination System (NPDES) program controls direct
33 A cooling tower is a water recirculating device that uses fans or natural draft to draw or force ambient airthrough the device to cool warm water by direct contact.
discharges. A facility that intends to discharge into the nation's waters must obtain a NPDES
permit prior to initiating its discharge. A permit applicant must provide quantitative analytical
data identifying the types of pollutants present in the facility's effluent. The permit will then set
forth the conditions and effluent limitations under which a facility may make a discharge [1].
NPDES permits, issued by either EPA or an authorized State contain industry specific
technology-based and/or water-quality based limits. Water-quality based standards, unlike
technological standards, generally do not take into account technological feasibility or costs and
are designed to protect designated uses of surface waters, such as supporting aquatic life or
recreation.
Another type of discharge that is regulated by the CWA is the indirect discharge of industrial
pollutants to publicly-owned treatment works (POTWs) [1]. The national pretreatment program
controls such indirect discharge. The goal of the pretreatment program is to protect municipal
wastewater treatment plants from damage that may occur when wastes are discharged into a
sewer system and to protect the quality of sludge generated by these plants. Many steel mills
discharge industrial waste water through sewers to POTWs.
40CFR420 contains the technology-based effluent limitations guidelines and standards that EPA
has developed for the iron and steel industry. These are implemented through the NPDES permit
program and through pretreatment programs.
6.2.1 Effluent Limitations Guidelines and Standards 40CFR420
The pollutants regulated by 40CFR420 include the following:
1. Conventional pollutants: TSS, oil and grease, pH
2. Non-conventional pollutants: Ammonia, phenols
3. Priority or toxic pollutants: Cyanide, Chromium, lead, nickel, zinc, benzene, benzo-a-pyrene,
naphthalene, tetrachloroethylene.
The regulation contains 12 subparts for 12 distinct manufacturing processes in the iron and steel
industry, including cokemaking, sintering, ironmaking, steelmaking, continuous casting etc. The
provisions of Part 420 for the by-product cokemaking and blast-furnace ironmaking processes
have been summarized in Tables 6-3 and 6-4.
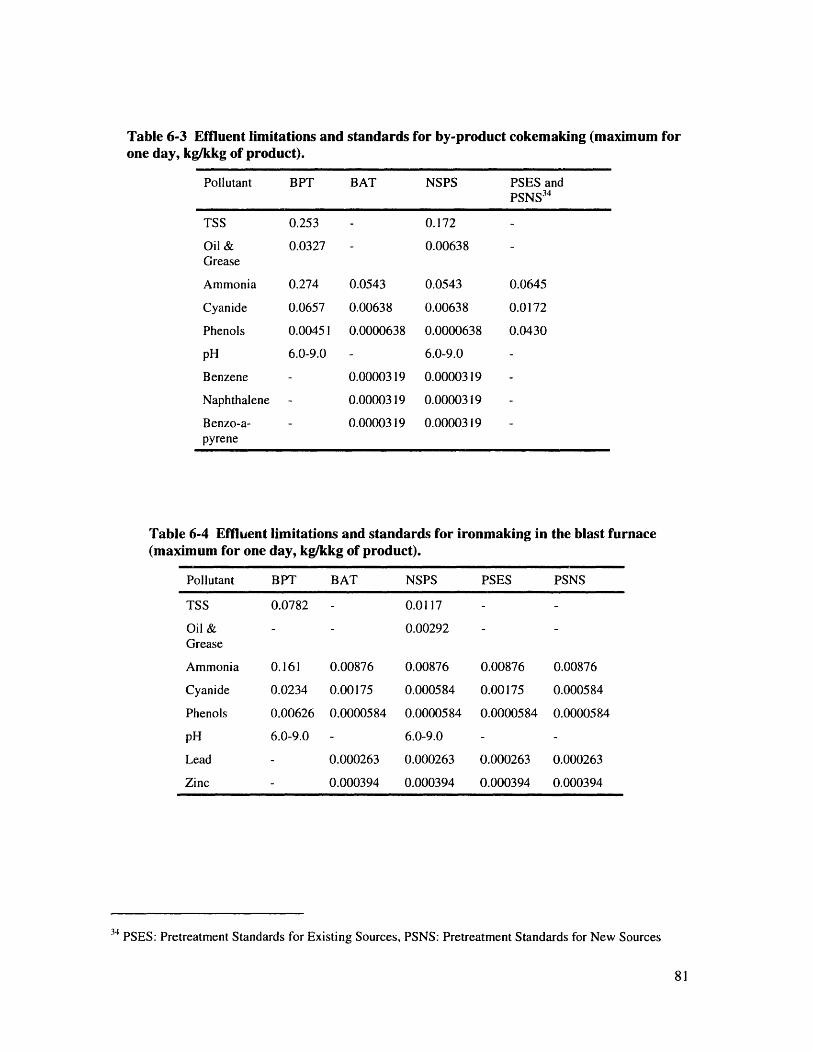
Table 6-3 Effluent limitations andone day, kg/kkg of product).
standards for by-product cokemaking (maximum for
Pollutant BPT BAT NSPS PSES andPSNS 34
TSS 0.253 - 0.172
Oil & 0.0327 - 0.00638Grease
Ammonia 0.274 0.0543 0.0543 0.0645
Cyanide 0.0657 0.00638 0.00638 0.0172
Phenols 0.00451 0.0000638 0.0000638 0.0430
pH 6.0-9.0 -6.0-9.0 -
Benzene 0.0000319 0.0000319 -
Naphthalene 0.0000319 0.0000319 -
Benzo-a- 0.0000319 0.0000319 -pyrene
Table 6-4 Effluent limitations and standards for ironmaking in the blast furnace(maximum for one day, kg/kkg of product).
Pollutant BPT BAT NSPS PSES PSNS
TSS 0.0782 0.0117
Oil & - 0.00292Grease
Ammonia 0.161 0.00876 0.00876 0.00876 0.00876
Cyanide 0.0234 0.00175 0.000584 0.00175 0.000584
Phenols 0.00626 0.0000584 0.0000584 0.0000584 0.0000584
pH 6.0-9.0 - 6.0-9.0 -
Lead - 0.000263 0.000263 0.000263 0.000263
Zinc - 0.000394 0.000394 0.000394 0.000394
34 PSES: Pretreatment Standards for Existing Sources, PSNS: Pretreatment Standards for New Sources
6.2.2 Regulations Governing Storm Water Discharges
The 1987 amendments to the CWA included a provision that required EPA to establish
regulations for industrial storm water runoff. In response to this statutory command, EPA
promulgated the NPDES storm water permit regulations to address storm water discharges
associated with industrial activity. A "storm water discharge associated with industrial activity" is
a discharge from any conveyance that is used for collecting and conveying storm water and that is
directly related to manufacturing, processing, or raw materials storage areas at an industrial plant.
Under this storm water permit program, discharges must comply with the applicable effluent
limitations in Section 6.2.1 above. The regulations are of major concern to the iron and steel
industry because of the nature of materials typically located on iron and steel manufacturing sites.
6.2.3 Pending and Proposed Regulations
In 1989, in recognition of the vulnerability of the Great Lakes to bioaccumulative chemicals, EPA
and the states began the Great Lakes Water Quality Initiative (GLI), an effort to establish
common regulatory practices for the Great Lakes waters. Under this initiative EPA has been
involved in proposing uniform, water-quality based standards in the Great Lakes States.
Approximately 80% of the U.S. integrated steelmaking capacity is located in the Great Lakes
region and therefore, the initiative may have a significant impact on the industry [23]. The main
concern the steel industry has with the GLI is the establishment of uniform water quality
standards for all waters in the basin without regard to the multiple uses of water bodies in this
region. Setting standards for the entire region on the basis of the most sensitive ecosystem, while
at the same time disregarding the water-quality impacts of non-point sources such as urban or
agricultural runoff, have the effect of imposing huge costs. To assess the impact of GLI rules, the
American Iron and Steel Institute commissioned an engineering study to develop estimates of
treatment facilities to meet the GLI standards. GLI compliance for the entire integrated
steelmaking capacity in the region is estimated to amount to $2.7 billion..
6.3 Resource Conservation and Recovery Act
The Resource Conservation and Recovery Act (RCRA) provides a cradle-to-grave regulatory
scheme to track hazardous wastes from the point of generation to the point of disposal or
treatment [24]. The basic components of the cradle-to-grave management system are: (1)
identification and permitting system allowing the EPA and the states to regulate all facilities
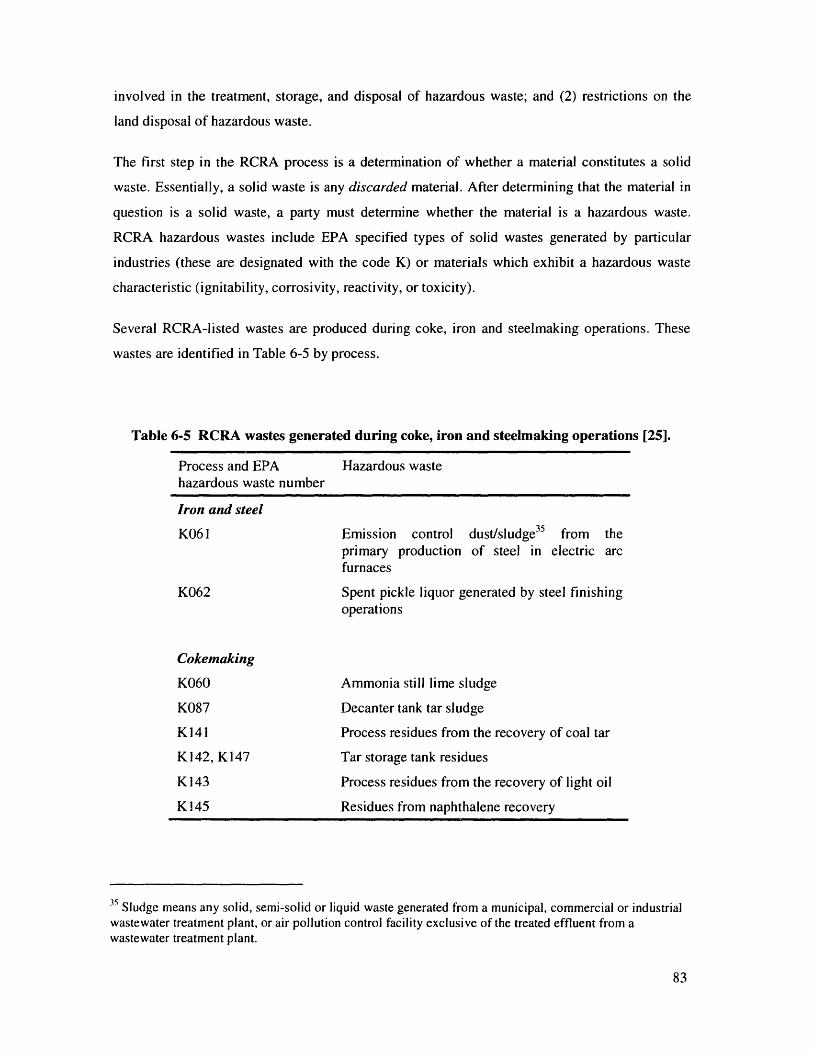
involved in the treatment, storage, and disposal of hazardous waste; and (2) restrictions on the
land disposal of hazardous waste.
The first step in the RCRA process is a determination of whether a material constitutes a solid
waste. Essentially, a solid waste is any discarded material. After determining that the material in
question is a solid waste, a party must determine whether the material is a hazardous waste.
RCRA hazardous wastes include EPA specified types of solid wastes generated by particular
industries (these are designated with the code K) or materials which exhibit a hazardous waste
characteristic (ignitability, corrosivity, reactivity, or toxicity).
Several RCRA-listed wastes are produced during coke, iron and steelmaking operations. These
wastes are identified in Table 6-5 by process.
Table 6-5 RCRA wastes generated during coke, iron and steelmaking operations [25].
Process and EPA Hazardous wastehazardous waste number
Iron and steel
K061
K062
Cokemaking
K060
K087
K141
K142, K147
K143
K145
Emission control dust/sludge 35 from theprimary production of steel in electric arcfurnaces
Spent pickle liquor generated by steel finishingoperations
Ammonia still lime sludge
Decanter tank tar sludge
Process residues from the recovery of coal tar
Tar storage tank residues
Process residues from the recovery of light oil
Residues from naphthalene recovery
35 Sludge means any solid, semi-solid or liquid waste generated from a municipal, commercial or industrialwastewater treatment plant, or air pollution control facility exclusive of the treated effluent from awastewater treatment plant.
RCRA was amended in 1984 by the Hazardous and Solid Waste Amendments (HSWA). These
amendments establish Land Disposal Restrictions (LDRs), that are regulations prohibiting the
disposal of hazardous waste on land without prior treatment. Under the LDRs, materials must
meet LDR treatment standards prior to placement in a land disposal unit (landfill, land treatment
unit, or waste pile).
EAF dust has been the subject of particular regulatory attention by EPA. EAF dust is a listed
hazardous waste and is subject to land disposal restrictions under RCRA. For EAF dust
containing less than 15% zinc LDR treatment standards establish concentration limits for dust
constituents including cadmium, chromium, lead, and nickel. For dust containing greater amounts
of zinc, the standard is expressed as "no land disposal".
Major concerns of the industry with respect to EAF dust rules are the limitations that are placed
on the ultimate disposal or uses of non-hazardous residuals from the High Temperature Metals
Recovery (HTMR) processes. These restrictions might serve to discourage metals recovery
practices. Residues, such as slag, generated during high temperature metals recovery processing
of K061, K062 waste are excluded from hazardous waste regulations only when they meet the
generic exclusion levels identified in Table 6-6 for all constituents, and provided the residues do
not exhibit hazardous waste characteristics.
The definition of a solid waste within RCRA includes materials that are recycled. The iron and
steel industry has a special and unique interest in the recycling aspect of RCRA because of the
huge amount of material handled between the time iron ore is removed from the ground until the
steel product is made [23]. Commercial markets have been developed for secondary materials
such as blast furnace slag and steelmaking slags. Other secondary materials such as iron-bearing
dusts and sludge generated from a variety of sources within steel plants are returned to the
steelmaking processes. Coke-oven waste materials are also commonly returned to the coke ovens,
and used oils are reclaimed for reuse.
In accordance with 40CFR266 Subpart H, industrial furnaces that burn hazardous waste are
subject to Boiler and Industrial Furnace36 (BIF) regulations. For this subpart, burn means burning
for energy recovery or processing for materials recovery. The BIF rules control emissions of toxic
organic compounds, toxic metals, and particulate matter from industrial furnaces burning
hazardous waste. To the degree iron and steel manufacturing facilities perform recycling in a
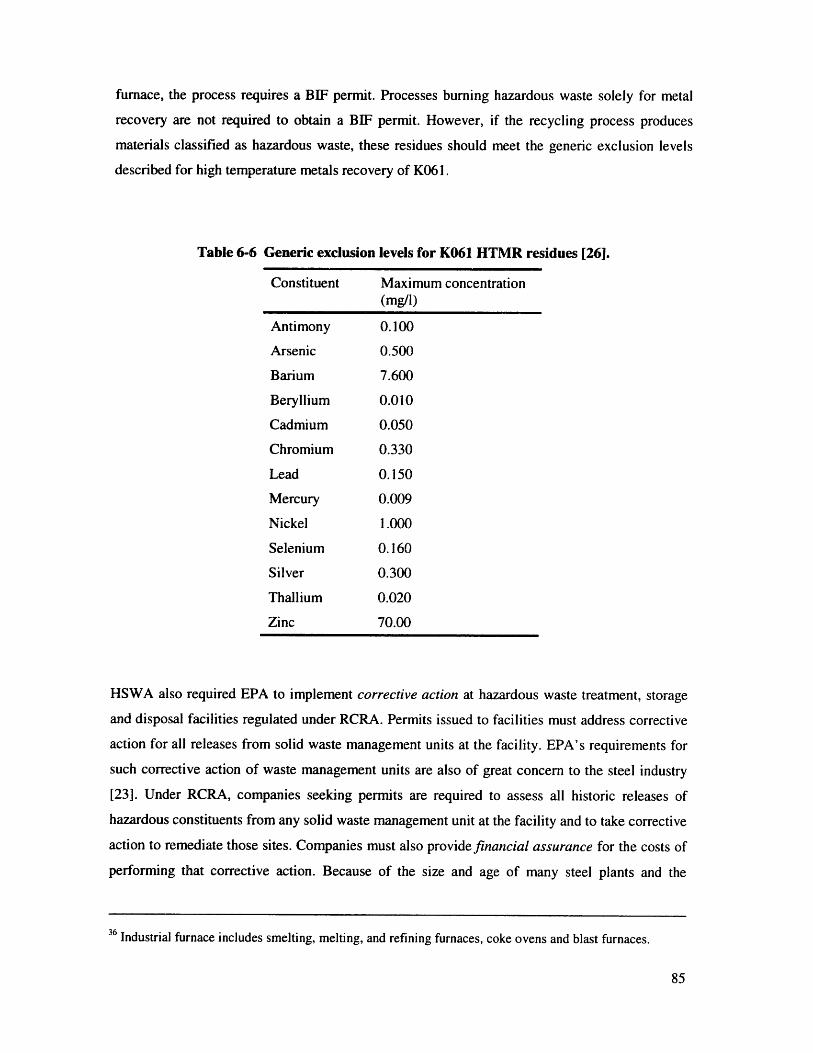
furnace, the process requires a BIF permit. Processes burning hazardous waste solely for metal
recovery are not required to obtain a BIF permit. However, if the recycling process produces
materials classified as hazardous waste, these residues should meet the generic exclusion levels
described for high temperature metals recovery of K061.
Table 6-6 Generic exclusion levels for K061 HTMR residues [26].
Constituent Maximum concentration
Antimony
Arsenic
Barium
Beryllium
Cadmium
Chromium
Lead
Mercury
Nickel
Selenium
Silver
Thallium
Zinc
(mg/l)
0.100
0.500
7.600
0.010
0.050
0.330
0.150
0.009
1.000
0.160
0.300
0.020
70.00
HSWA also required EPA to implement corrective action at hazardous waste treatment, storage
and disposal facilities regulated under RCRA. Permits issued to facilities must address corrective
action for all releases from solid waste management units at the facility. EPA's requirements for
such corrective action of waste management units are also of great concern to the steel industry
[23]. Under RCRA, companies seeking permits are required to assess all historic releases of
hazardous constituents from any solid waste management unit at the facility and to take corrective
action to remediate those sites. Companies must also provide financial assurance for the costs of
performing that corrective action. Because of the size and age of many steel plants and the
36 Industrial furnace includes smelting, melting, and refining furnaces, coke ovens and blast furnaces.
diversity of operations and waste management practices over the life of those plants, there are
commonly dozens or even hundreds of solid waste management units subject to corrective action
requirements. An analysis of the cost exposure at integrated iron and steel plants has shown the
potential cleanup costs to be approximately $3 billion for the industry. Because of the magnitude
of costs involved for corrective action, most steel companies will be unable to make the necessary
demonstrations.
Having discussed the conventional technology in use in ironmaking, and the pertinent
environmental regulations, the next chapter illustrates two technologies that have been used to
combat pollution, while providing economic benefits.
7 No Regrets Pollution Prevention: Iron/Steel
7.1 Smelt Reduction
Smelt reduction processes combine coal gasification with the direct reduction of iron oxides. New
smelting reduction processes are in various stages of development and include the following: the
COREX process, the Japanese Direct Iron-Ore Smelting Reduction or DIOS process, and the
HISmelt process. This report concentrates on the COREX process, as it is the only commercial
process.
The COREX process (Figure 7-1) separates the iron-ore reduction and melting into two reactors
that accomplish the following processing steps [27]:
1. Reduction of iron ore in a shaft furnace.
2. Generation of reducing gas and liberation of energy from coal for melting in a melter gasifier.
The lower portion of the melter gasifier is a fluidized bed, where reduction gas is generated by
partial oxidation of coal. The gas temperature in the fluidized bed is in the range of 1600 to
1700'C. Coal is charged into the melter gasifier through a lock-hopper system. The coal then falls
by gravity through the gasifier where it comes in contact with the reduction gas at a temperature
of 1000 to 12000 C. Instantaneous drying and degasification of the coal particles occur in the
upper portion of the melter gasifier.
The reduction gas generated in the melter gasifier mainly consists of CO and H2, and is laden
with coal, ash and iron dust. After leaving the gasifier, the reduction gas is cooled and the fine
dust is separated in a hot-gas cyclone. By the addition of cooling gas, as shown in Figure 7-1, the
reduction gas temperature is set to an optimum operating range between 8000 C and 850'C.
Downstream of the hot-gas cyclone, the reduction gas is fed into a reduction shaft furnace and
ascends through the iron-ore burden. The iron ore, charged into the shaft through a lock-hopper
system, descends by gravity. The top gas from the reduction shaft is cooled and cleaned in a
scrubber and is available as export gas.
The Direct Reduced Iron (DRI) produced in the reduction shaft is charged continuously to the
melter gasifier. The velocity of fall of the sponge iron particles is reduced in the fluidized bed of
the gasifier so that complete reduction, heating and melting occurs. Liquid hot metal and slag
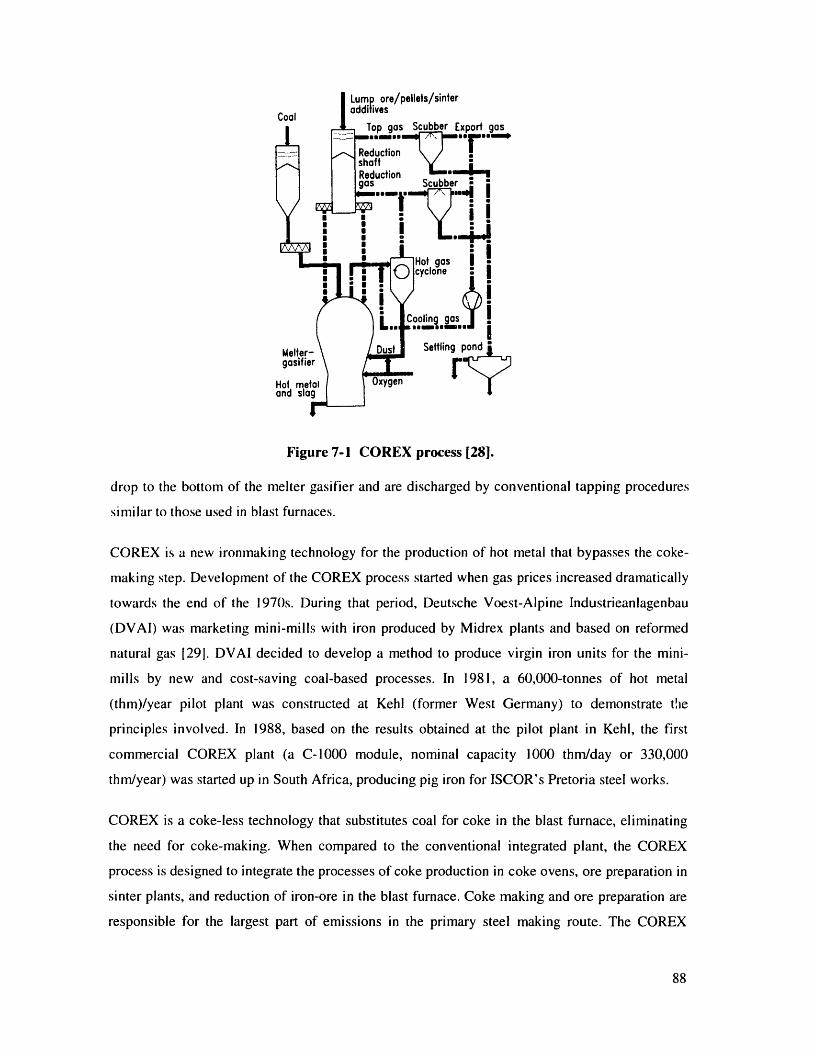
Figure 7-1 COREX process [28].
drop to the bottom of the melter gasifier and are discharged by conventional tapping procedures
similar to those used in blast furnaces.
COREX is a new ironmaking technology for the production of hot metal that bypasses the coke-
making step. Development of the COREX process started when gas prices increased dramatically
towards the end of the 1970s. During that period, Deutsche Voest-Alpine Industrieanlagenbau
(DVAI) was marketing mini-mills with iron produced by Midrex plants and based on reformed
natural gas [291. DVAI decided to develop a method to produce virgin iron units for the mini-
mills by new and cost-saving coal-based processes. In 1981, a 60,000-tonnes of hot metal
(thm)/year pilot plant was constructed at Kehl (former West Germany) to demonstrate the
principles involved. In 1988, based on the results obtained at the pilot plant in Kehl, the first
commercial COREX plant (a C-1000 module, nominal capacity 1000 thm/day or 330,000
thm/year) was started up in South Africa, producing pig iron for ISCOR's Pretoria steel works.
COREX is a coke-less technology that substitutes coal for coke in the blast furnace, eliminating
the need for coke-making. When compared to the conventional integrated plant, the COREX
process is designed to integrate the processes of coke production in coke ovens, ore preparation in
sinter plants, and reduction of iron-ore in the blast furnace. Coke making and ore preparation are
responsible for the largest part of emissions in the primary steel making route. The COREX
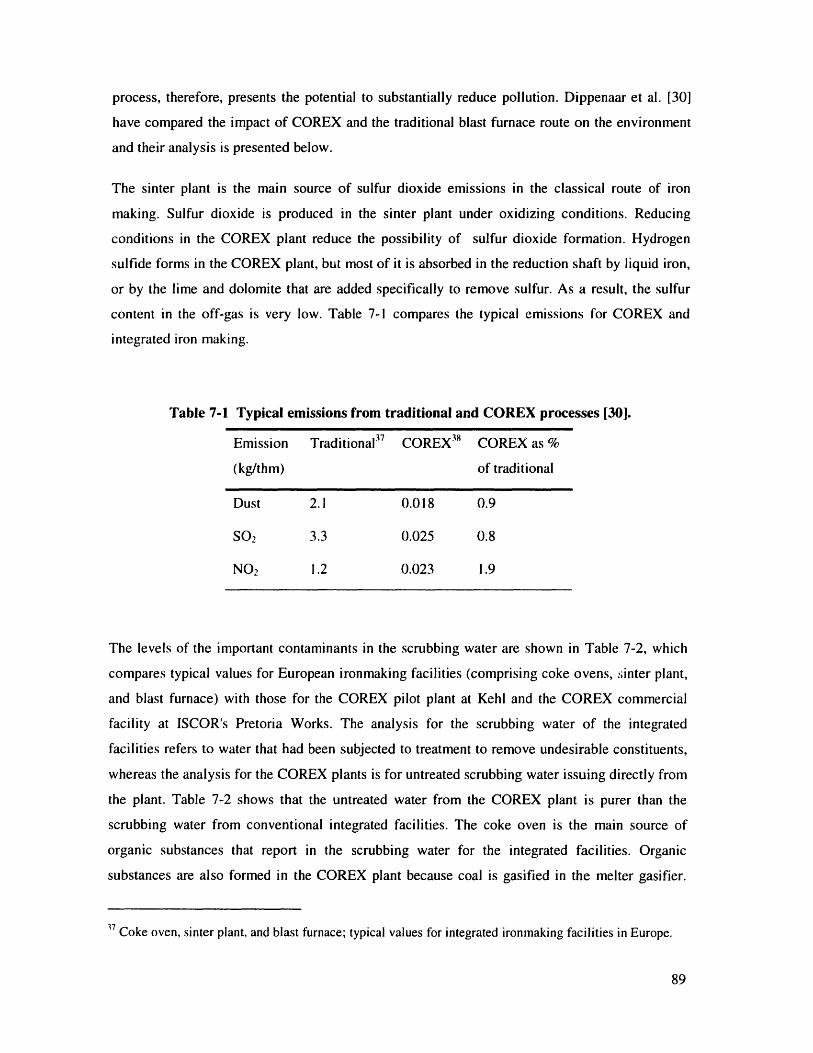
process, therefore, presents the potential to substantially reduce pollution. Dippenaar et al. [30]
have compared the impact of COREX and the traditional blast furnace route on the environment
and their analysis is presented below.
The sinter plant is the main source of sulfur dioxide emissions in the classical route of iron
making. Sulfur dioxide is produced in the sinter plant under oxidizing conditions. Reducing
conditions in the COREX plant reduce the possibility of sulfur dioxide formation. Hydrogen
sulfide forms in the COREX plant, but most of it is absorbed in the reduction shaft by liquid iron,
or by the lime and dolomite that are added specifically to remove sulfur. As a result, the sulfur
content in the off-gas is very low. Table 7-1 compares the typical emissions for COREX and
integrated iron making.
Table 7-1 Typical emissions from traditional and COREX processes [30].
Emission Traditional37 COREX"8 COREX as %
(kg/thm) of traditional
Dust 2.1 0.018 0.9
SO 2 3.3 0.025 0.8
NO 2 1.2 0.023 1.9
The levels of the important contaminants in the scrubbing water are shown in Table 7-2, which
compares typical values for European ironmaking facilities (comprising coke ovens, sinter plant,
and blast furnace) with those for the COREX pilot plant at Kehl and the COREX commercial
facility at ISCOR's Pretoria Works. The analysis for the scrubbing water of the integrated
facilities refers to water that had been subjected to treatment to remove undesirable constituents,
whereas the analysis for the COREX plants is for untreated scrubbing water issuing directly from
the plant. Table 7-2 shows that the untreated water from the COREX plant is purer than the
scrubbing water from conventional integrated facilities. The coke oven is the main source of
organic substances that report in the scrubbing water for the integrated facilities. Organic
substances are also formed in the COREX plant because coal is gasified in the melter gasifier.
17 Coke oven, sinter plant, and blast furnace; typical values for integrated ironmaking facilities in Europe.
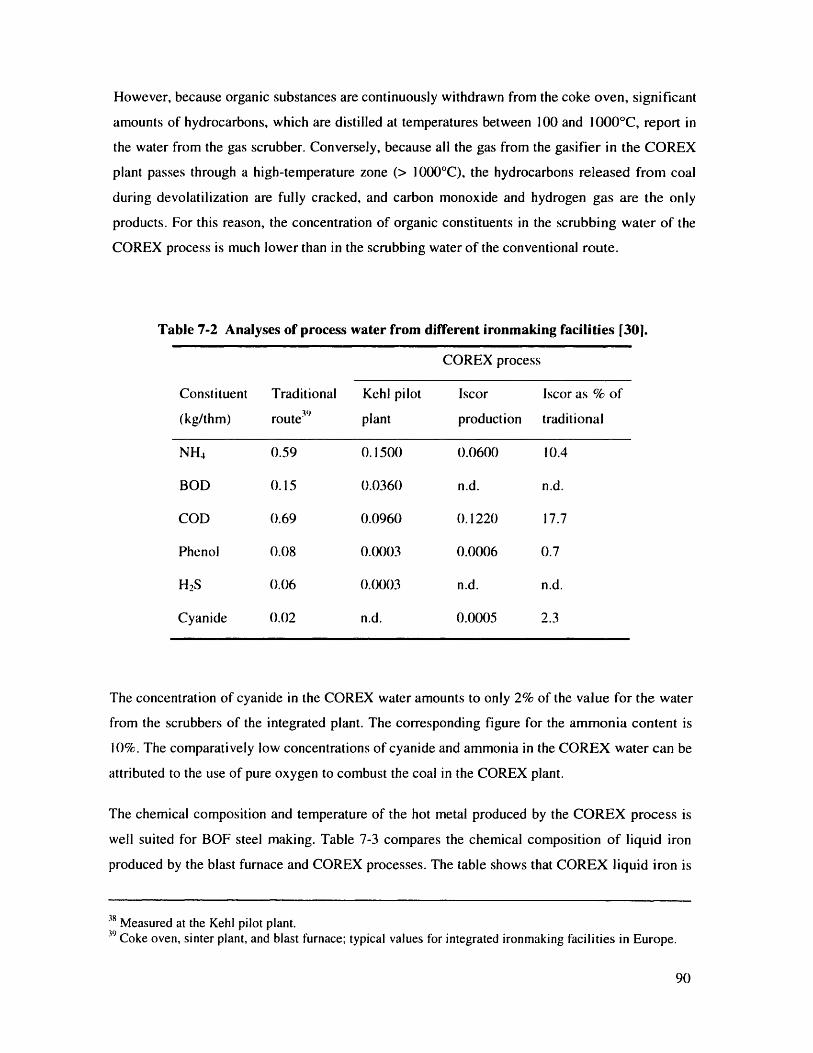
However, because organic substances are continuously withdrawn from the coke oven, significant
amounts of hydrocarbons, which are distilled at temperatures between 100 and 100 0 oC, report in
the water from the gas scrubber. Conversely, because all the gas from the gasifier in the COREX
plant passes through a high-temperature zone (> 100 0oC), the hydrocarbons released from coal
during devolatilization are fully cracked, and carbon monoxide and hydrogen gas are the only
products. For this reason, the concentration of organic constituents in the scrubbing water of the
COREX process is much lower than in the scrubbing water of the conventional route.
Table 7-2 Analyses of process water from different ironmaking facilities [30].
COREX process
Constituent Traditional Kehl pilot Iscor Iscor as % of
(kg/thm) route3 ') plant production traditional
NH4 0.59 0.1500 0.0600 10.4
BOD 0.15 0.0360 n.d. n.d.
COD 0.69 0.0960 0.1220 17.7
Phenol 0.08 0.0003 0.0006 0.7
H2S 0.06 0.0003 n.d. n.d.
Cyanide 0.02 n.d. 0.0005 2.3
The concentration of cyanide in the COREX water amounts to only 2% of the value for the water
from the scrubbers of the integrated plant. The corresponding figure for the ammonia content is
10%. The comparatively low concentrations of cyanide and ammonia in the COREX water can be
attributed to the use of pure oxygen to combust the coal in the COREX plant.
The chemical composition and temperature of the hot metal produced by the COREX process is
well suited for BOF steel making. Table 7-3 compares the chemical composition of liquid iron
produced by the blast furnace and COREX processes. The table shows that COREX liquid iron is
38 Measured at the Kehi pilot plant.39 Coke oven, sinter plant, and blast furnace; typical values for integrated ironmaking facilities in Europe.
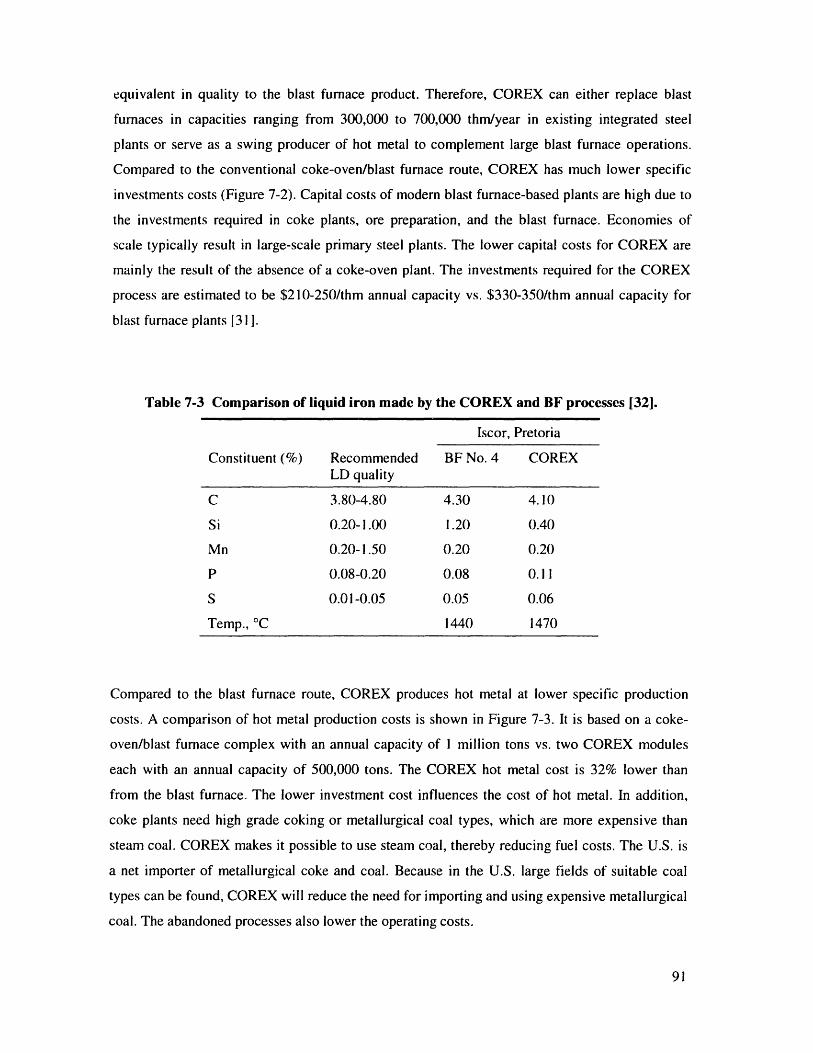
equivalent in quality to the blast furnace product. Therefore, COREX can either replace blast
furnaces in capacities ranging from 300,000 to 700,000 thm/year in existing integrated steel
plants or serve as a swing producer of hot metal to complement large blast furnace operations.
Compared to the conventional coke-oven/blast furnace route, COREX has much lower specific
investments costs (Figure 7-2). Capital costs of modern blast furnace-based plants are high due to
the investments required in coke plants, ore preparation, and the blast furnace. Economies of
scale typically result in large-scale primary steel plants. The lower capital costs for COREX are
mainly the result of the absence of a coke-oven plant. The investments required for the COREX
process are estimated to be $210-250/thm annual capacity vs. $330-350/thm annual capacity for
blast furnace plants 131].
Table 7-3 Comparison of liquid iron made by the COREX and BF processes [32].
Iscor, Pretoria
Constituent (%) Recommended BF No. 4 COREXLD quality
C 3.80-4.80 4.30 4.10
Si 0.20-1.00 1.20 0.40
Mn 0.20-1.50 0.20 0.20
P 0.08-0.20 0.08 0.11
S 0.01-0.05 0.05 0.06
Temp., 'C 1440 1470
Compared to the blast furnace route, COREX produces hot metal at lower specific production
costs. A comparison of hot metal production costs is shown in Figure 7-3. It is based on a coke-
oven/blast furnace complex with an annual capacity of I million tons vs. two COREX modules
each with an annual capacity of 500,000 tons. The COREX hot metal cost is 32% lower than
from the blast furnace. The lower investment cost influences the cost of hot metal. In addition,
coke plants need high grade coking or metallurgical coal types, which are more expensive than
steam coal. COREX makes it possible to use steam coal, thereby reducing fuel costs. The U.S. is
a net importer of metallurgical coke and coal. Because in the U.S. large fields of suitable coal
types can be found, COREX will reduce the need for importing and using expensive metallurgical
coal. The abandoned processes also lower the operating costs.
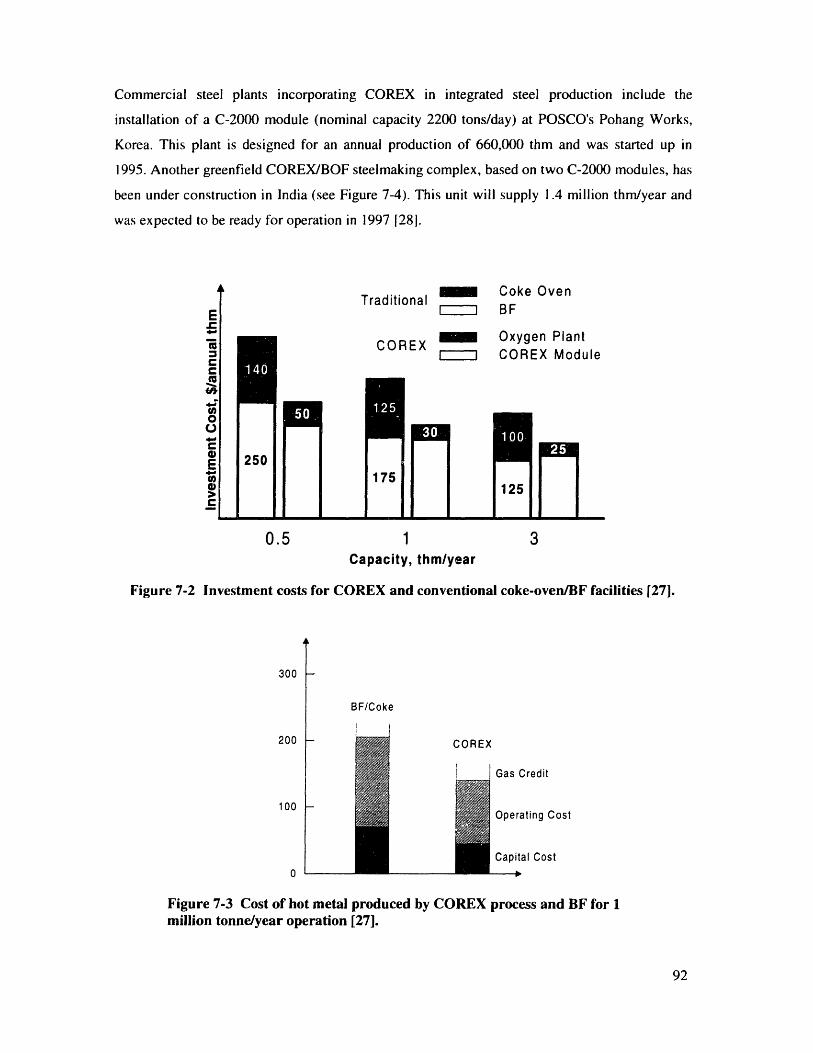
Commercial steel plants incorporating COREX in integrated steel production include the
installation of a C-2000 module (nominal capacity 2200 tons/day) at POSCO's Pohang Works,
Korea. This plant is designed for an annual production of 660,000 thm and was started up in
1995. Another greenfield COREX/BOF steelmaking complex, based on two C-2000 modules, has
been under construction in India (see Figure 7-4). This unit will supply 1.4 million thm/year and
was expected to be ready for operation in 1997 [281.
Coke OvenBF
Oxygen PlantCOREX Module
0.5 1 3Capacity, thml/year
Figure 7-2 Investment costs for COREX and conventional coke-oven/BF facilities [27].
300
200
100
0
BF/Coke
I iCOREX
i IGas
Credit
Operating Cost
Capital Cost
Figure 7-3 Cost of hot metal produced by COREX process and BF for 1million tonne/year operation [27].
A
I-
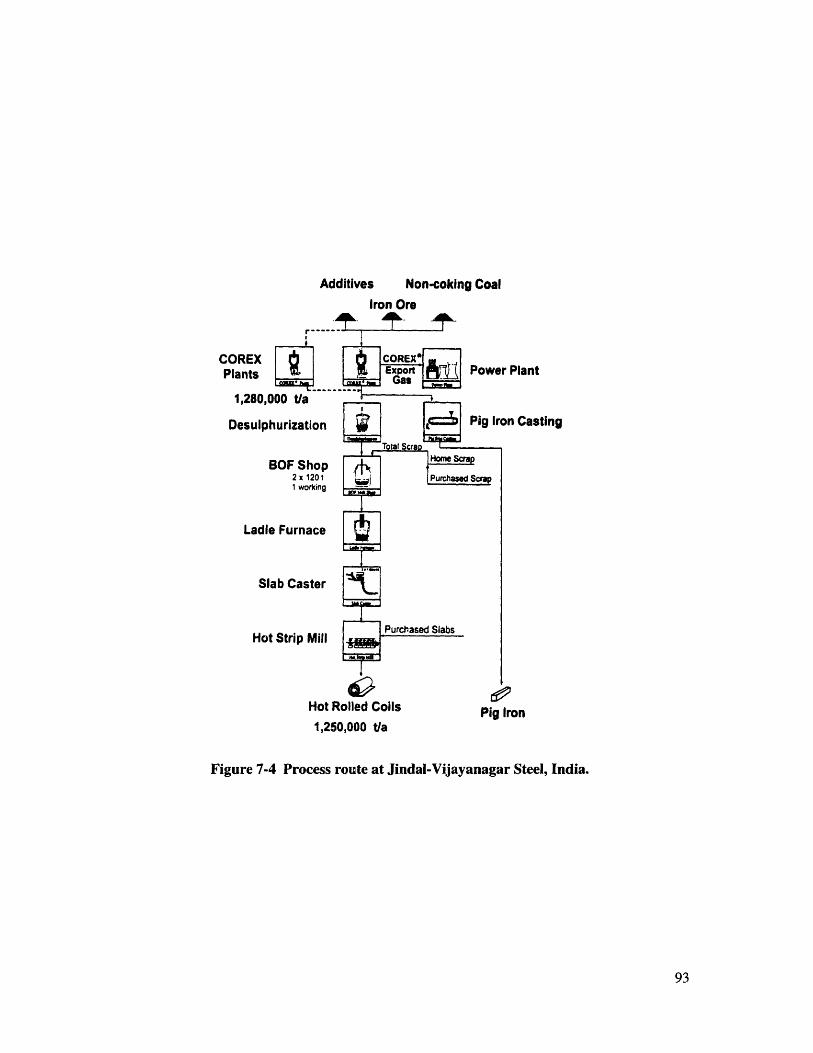
Additives Non-coking CoalIron Ore
CORPlai
1,
De
Hot Rolled Coils1,250,000 t/a
Figure 7-4 Process route at Jindal-Vijayanagar Steel, India.
r Plant
on Casting
Pig Iron
For mini-mills, COREX provides the possibility of producing hot metal at low cost even in small
capacities [27]. The success of mini-mills is based on the low cost production of long products,
that do not need high quality steel. Electric arc furnace production is now extending into flat
products as a result of the technological breakthrough in continuous casting. With this trend, steel
makers are faced with steel quality requirements that will be difficult to meet with scrap-based
electric arc furnace steelmaking. Residual elements, such as Mo, Cu, Ni, Sn, Cr, and As, which
are increasing in scrap iron, cannot be removed during refining and remain in the steel. These
residual elements affect the chemistry of steel making and the resultant properties of the finished
product. For this reason, it is necessary to dilute the scrap by virgin iron and COREX hot metal
can be used to meet the demands for high quality steel grades. Steel producers are also facing the
long-term problems of variation in scrap price together with a short-fall in supply of scrap with
low residuals. Another important factor in the production of high quality flat products is the
elevated nitrogen content that occurs with scrap-based electric furnace steelmaking. While the
nitrogen content of steel sheet is limited to 0.002 to 0.006% (nitrogen increases sensitivity to
aging and brittle fracture), the nitrogen content from electric arc steelmaking exceeds 0.01% in
most cases. The nitrogen content of COREX hot metal is only 0.002 to 0.003% and remains at
this level during steelmaking.
In order to be independent from fluctuating scrap prices, for quality reasons, or due to a lack of
scrap, mini-mills have used DRI in the charge. Figure 7-5 compares the economics of different
steelmaking routes for mini-mills, including electric arc furnace operation using 100% scrap, with
50% scrap and 50% DRI, and 30-50% addition of COREX hot metal. Steelmaking costs for the
first two options are almost the same because the increased cost for energy and capital when
using DRI is compensated for by higher scrap costs. Savings are, however, achieved by
substituting COREX hot metal for scrap. As compared to the scrap/DRI route, raw material costs
are lower for the scrap/COREX option because coal is less expensive than natural gas. If DRI is
charged in the electric arc furnace, the power consumption increases because of the gangue
content and the remaining unreduced iron in the DRI. In contrast, the addition of hot metal in the
charge lowers the power consumption because the hot metal added is already liquid and contains
approximately 4% carbon, which generates additional heat during oxidation.
In addition to the production of high quality hot metal, the exported top gas of the COREX
process has a lower heating value of approximately 7 MJ/Nm 3 and can be used for the generation
of electrical energy and/or the production of DRI. The application of the process export gas in an
adjacent direct reduction plant is illustrated in Figure 7-6, which is a schematic process route for a
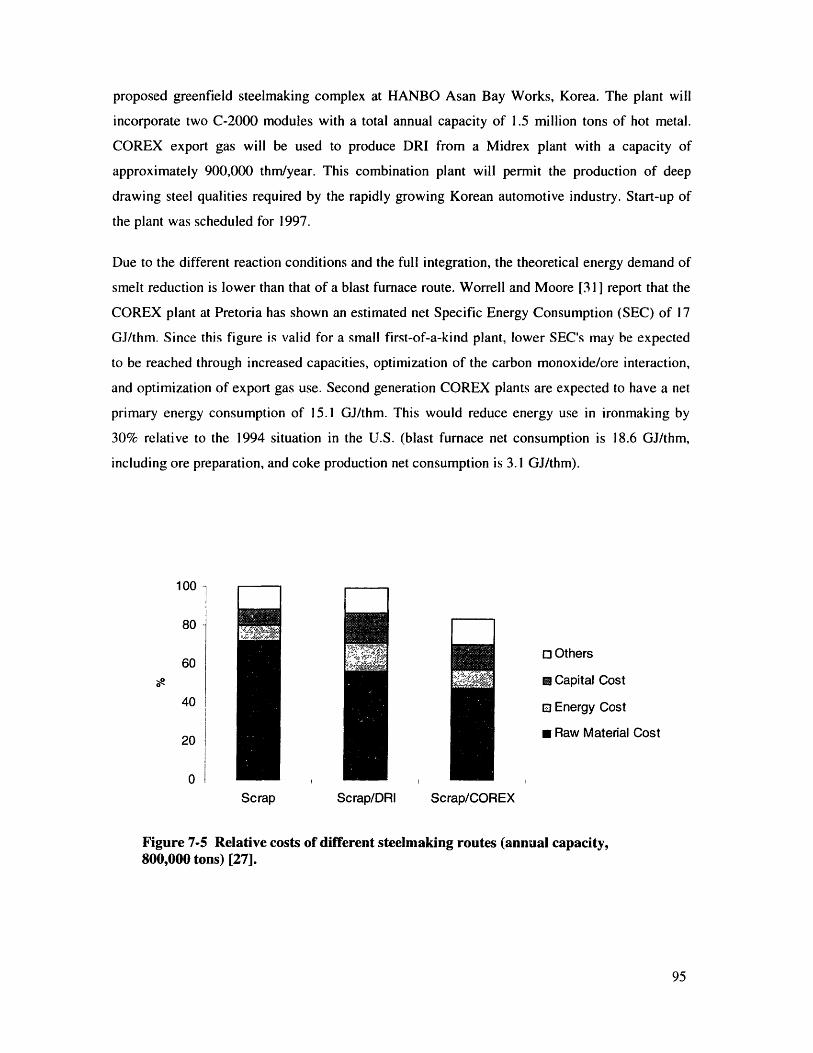
proposed greenfield steelmaking complex at HANBO Asan Bay Works, Korea. The plant will
incorporate two C-2000 modules with a total annual capacity of 1.5 million tons of hot metal.
COREX export gas will be used to produce DRI from a Midrex plant with a capacity of
approximately 900,000 thm/year. This combination plant will permit the production of deep
drawing steel qualities required by the rapidly growing Korean automotive industry. Start-up of
the plant was scheduled for 1997.
Due to the different reaction conditions and the full integration, the theoretical energy demand of
smelt reduction is lower than that of a blast furnace route. Worrell and Moore [31 ] report that the
COREX plant at Pretoria has shown an estimated net Specific Energy Consumption (SEC) of 17
GJ/thm. Since this figure is valid for a small first-of-a-kind plant, lower SEC's may be expected
to be reached through increased capacities, optimization of the carbon monoxide/ore interaction,
and optimization of export gas use. Second generation COREX plants are expected to have a net
primary energy consumption of 15.1 GJ/thm. This would reduce energy use in ironmaking by
30% relative to the 1994 situation in the U.S. (blast furnace net consumption is 18.6 GJ/thm,
including ore preparation, and coke production net consumption is 3.1 GJ/thm).
100o I I II I
o Others
m Capital Cost
o Energy Cost
m Raw Material Cost
Scrap Scrap/DRI Scrap/COREX
Figure 7-5 Relative costs of different steelmaking routes (annual capacity,800,000 tons) [27].
80
60
40
20
0 I
F I
I
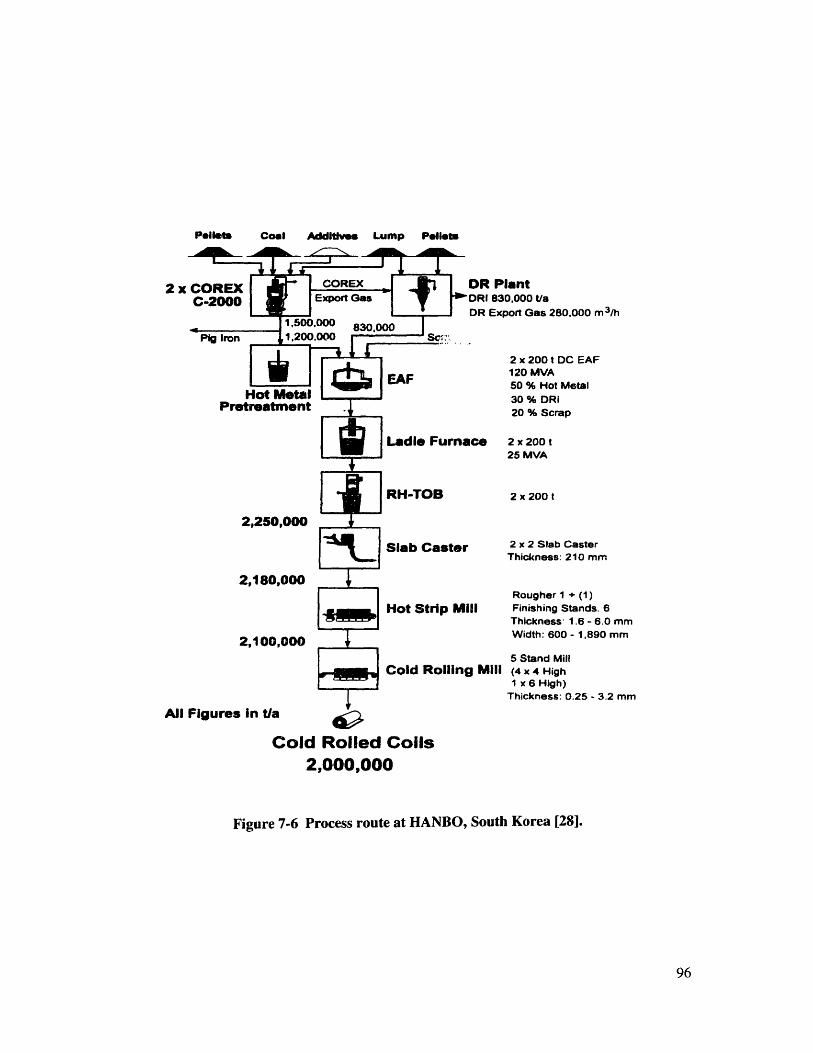
Pellets Coal Additives Lump Pellets
DR Plant'DRI 830.000 t/aDR Export Gas 280.000 m3 /h
2x
Hot MetalPretreatment
Ice
2,250,000
2 x 200 t DC EAF120 MVA50 % Hot Metal30 % DRI20 % Scrap
2 x 200 t25 MVA
2 x 200 t
2 x 2 Slab CasterThickness: 210 mm
2,180,000
2,100,000
ill
g Mill
Rougher 1 + (1)Finishing Stands. 6Thickness 1.6 -6.0 mmWidth: 600 - 1,890 mm
5 Stand Mill(4 x 4 HighI x 6 High)
Thickness: 0.25 - 3.2 mm
All Figures in tia
:old Rolled Coils2,000,000
Figure 7-6 Process route at HANBO, South Korea [28].
Am m
7.2 Alternative Fuels
The blast furnace is the major producer of liquid hot metal that is refined into steel in the basic
oxygen furnace process. Integrated steel producers can also inject other fuels, such as natural gas,
oil, and coal instead of coke into the blast furnace, thus substituting a portion of the coke
requirement. Motivation for injection of alternative fuels into the tuyere area of a blast furnace
has historically been the cost or availability of metallurgical-grade coke [33]. The injection of
fuel oil into blast furnaces was a regular practice until 1980, when the oil crisis resulted in a
complete restructuring of the price level for fuels. The injection of fuel oil into blast furnaces
became uneconomical due to rising prices and blast furnace operators adopted an all-coke
operation.
In addition to reducing coke consumption, alternative fuel injection also leads to improved
control over furnace reactions. It minimizes variation in hot metal composition by better control
of raceway flame temperature. Many modern blast furnaces were designed and constructed
assuming tuyere-level fuel injection, and conversion to all-coke operation often caused a
reduction in iron quality and production rates. Such unstable conditions can be improved by
lowering the blast temperature and increasing the blast humidity, but such adjustments result in
an increase in coke consumption rate and a decrease in the blast furnace productivity. To
effectively counteract these problems, integrated producers have developed coal injection
systems. Of all the fuels injected into the blast furnace, coal has several advantages. Coal of
suitable quality for injection is available in nearly all parts of the world. The supply is also not
subject to unpredictable political pressures, as a~e petroleum products. This availability of coal
promotes a more stable market with a favorable price compared to alternative fuels (Figure 7-7
shows the price differential between crude oil and coal).
Carbon from coal is consumed in the tuyere raceway zone of the blast furnace to form the hot
reducing gases required to reduce iron oxides, preheat the burden materials, and produce molten
metal and slag. A modern coal injection system consists of two sections:
1. Coal preparation system.
2. Transport and distribution system.
The coal preparation system (shown in Figure 7-8) consists of raw coal storage bins, a coal
grinding, collection system and coal storage. Raw coal is fed to a grinding mill, where it is dried
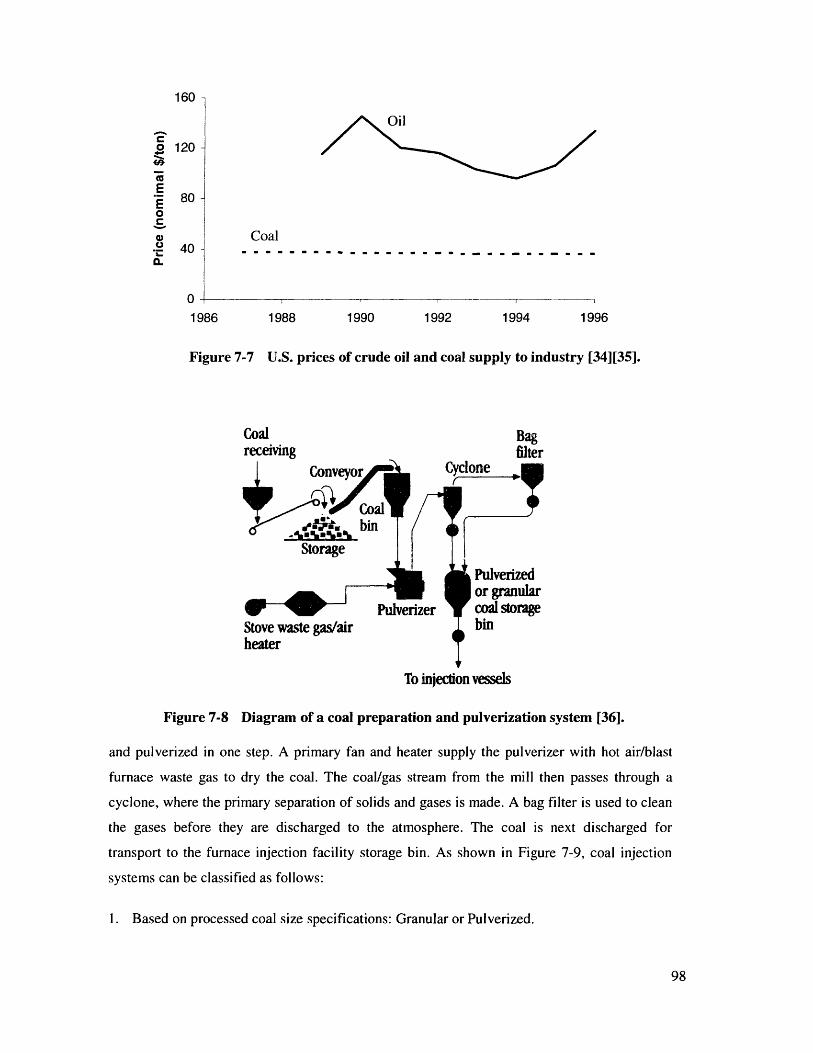
Oil
Coal
------------ --- - --------
1986 1988 1990 1992 1994 1996
Figure 7-7 U.S. prices of crude oil and coal supply to industry [34][35].
Coal Bagreceiving filter
Conveyor
binStorage
Stove waste gas/air Dmheater T
To injection vessels
Figure 7-8 Diagram of a coal preparation and pulverization system [36].
and pulverized in one step. A primary fan and heater supply the pulverizer with hot air/blast
furnace waste gas to dry the coal. The coal/gas stream from the mill then passes through a
cyclone, where the primary separation of solids and gases is made. A bag filter is used to clean
the gases before they are discharged to the atmosphere. The coal is next discharged for
transport to the furnace injection facility storage bin. As shown in Figure 7-9, coal injection
systems can be classified as follows:
I. Based on processed coal size specifications: Granular or Pulverized.
160
o 120-
E" 80o
40
0
I
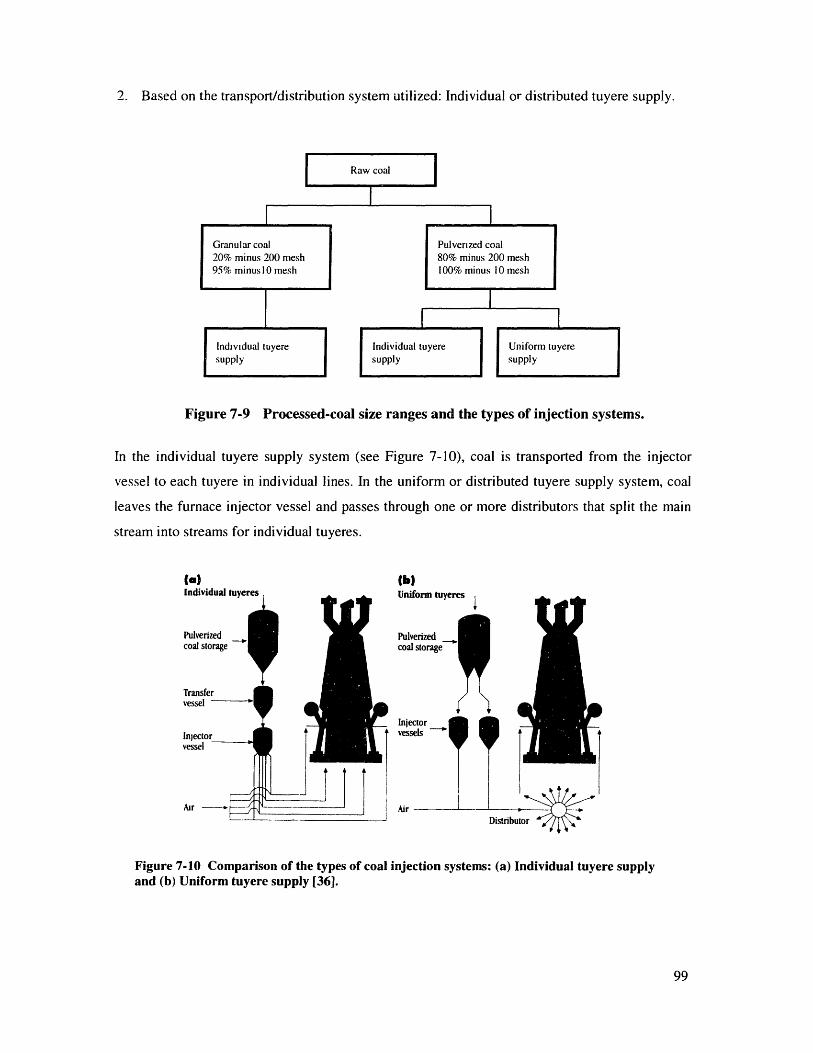
2. Based on the transport/distribution system utilized: Individual or distributed tuyere supply.
Figure 7-9 Processed-coal size ranges and the types of injection systems.
In the individual tuyere supply system (see Figure 7-10), coal is transported from the injector
vessel to each tuyere in individual lines. In the uniform or distributed tuyere supply system, coal
leaves the furnace injector vessel and passes through one or more distributors that split the main
stream into streams for individual tuyeres.
(a) (b)
Figure 7-10 Comparison of the types of coal injection systems: (a) Individual tuyere supplyand (b) Uniform tuyere supply [36].
!lninrm Itvero-
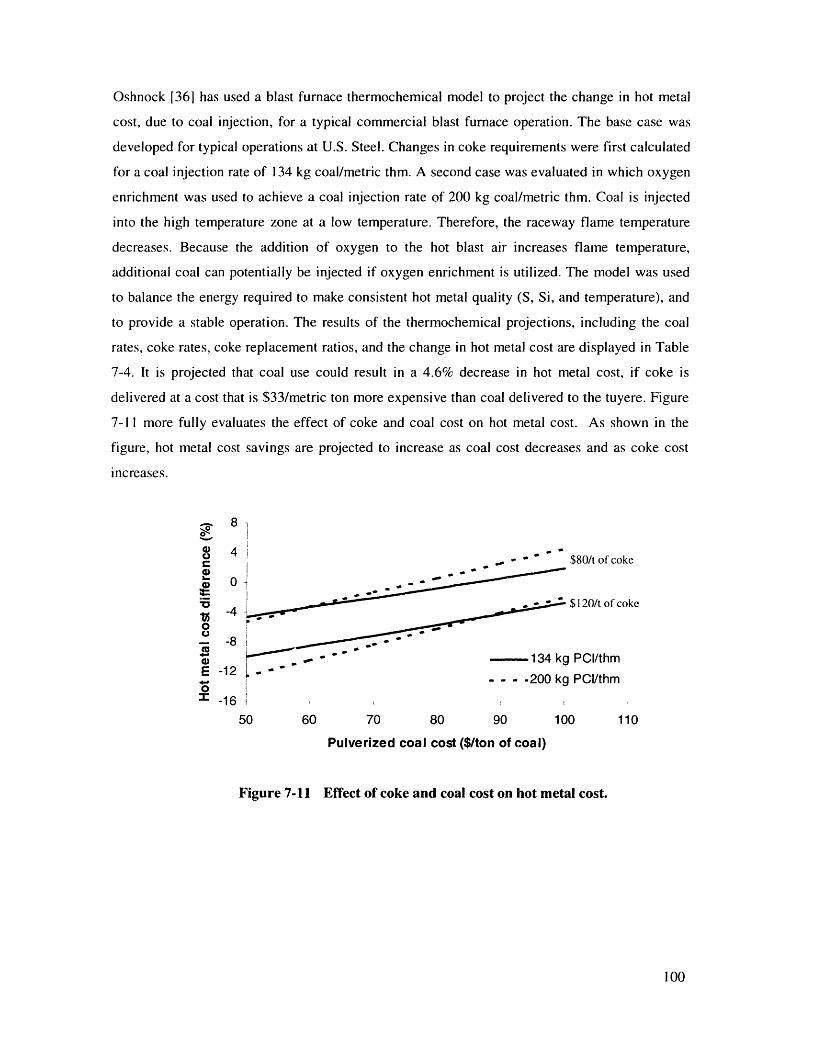
Oshnock [36] has used a blast furnace thermochemical model to project the change in hot metal
cost, due to coal injection, for a typical commercial blast furnace operation. The base case was
developed for typical operations at U.S. Steel. Changes in coke requirements were first calculated
for a coal injection rate of 134 kg coal/metric thm. A second case was evaluated in which oxygen
enrichment was used to achieve a coal injection rate of 200 kg coal/metric thm. Coal is injected
into the high temperature zone at a low temperature. Therefore, the raceway flame temperature
decreases. Because the addition of oxygen to the hot blast air increases flame temperature,
additional coal can potentially be injected if oxygen enrichment is utilized. The model was used
to balance the energy required to make consistent hot metal quality (S, Si, and temperature), and
to provide a stable operation. The results of the thermochemical projections, including the coal
rates, coke rates, coke replacement ratios, and the change in hot metal cost are displayed in Table
7-4. It is projected that coal use could result in a 4.6% decrease in hot metal cost, if coke is
delivered at a cost that is $33/metric ton more expensive than coal delivered to the tuyere. Figure
7-11 more fully evaluates the effect of coke and coal cost on hot metal cost. As shown in the
figure, hot metal cost savings are projected to increase as coal cost decreases and as coke cost
increases.
S81
U 4 ;S$80/t of coke
$120/t of coke-4 "
o8 -
-1 - 134 kg PCI/thmE -12- -• . . -200 kg PCI/thm0oI -16
50 60 70 80 90 100 110
Pulverized coal cost ($/ton of coal)
Figure 7-11 Effect of coke and coal cost on hot metal cost.
100
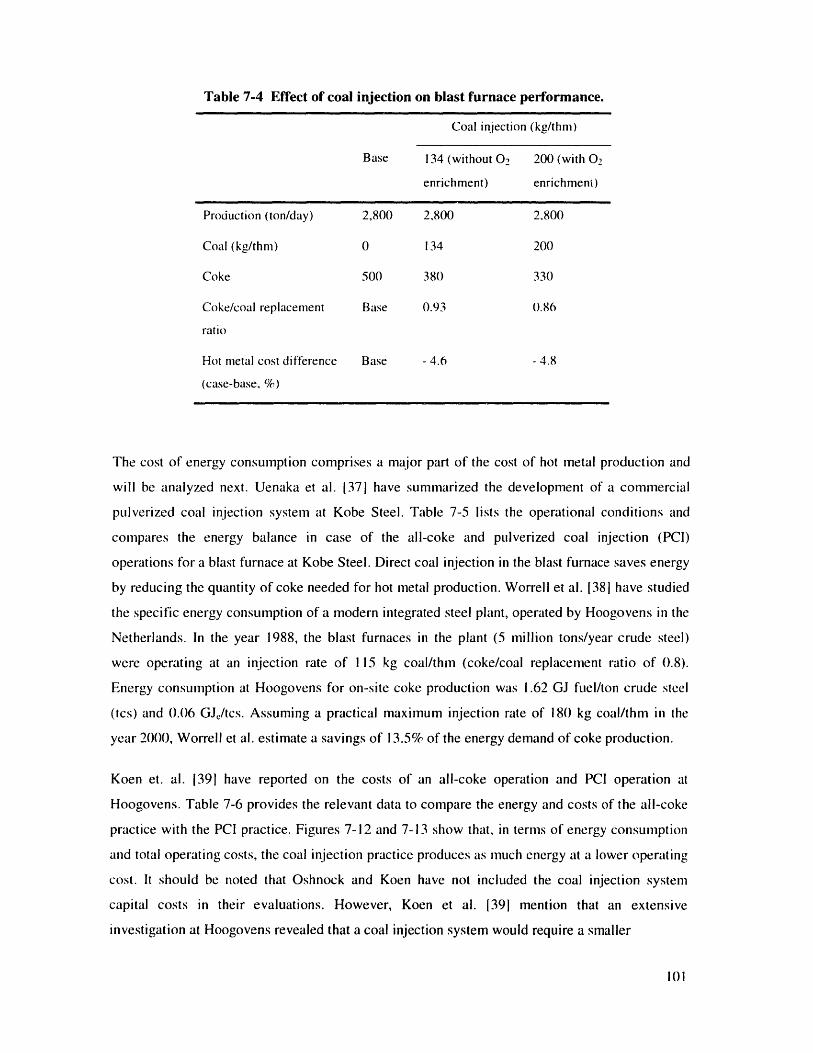
Table 7-4 Effect of coal injection on blast furnace performance.
Coal injection (kg/thm)
Base 134 (without 02 200 (with 02
enrichment) enrichment)
Production (ton/day) 2,800 2,800 2,800
Coal (kg/thm) 0 134 200
Coke 500 380 330
Coke/coal replacement Base 0.93 0.86
ratio
Hot metal cost difference Base - 4.6 - 4.8
(case-base, %)
The cost of energy consumption comprises a major part of the cost of hot metal production and
will be analyzed next. Uenaka et al. 1371 have summarized the development of a commercial
pulverized coal injection system at Kobe Steel. Table 7-5 lists the operational conditions and
compares the energy balance in case of the all-coke and pulverized coal injection (PCI)
operations for a blast furnace at Kobe Steel. Direct coal injection in the blast furnace saves energy
by reducing the quantity of coke needed for hot metal production. Worrell et al. 1381 have studied
the specific energy consumption of a modern integrated steel plant, operated by Hoogovens in the
Netherlands. In the year 1988, the blast furnaces in the plant (5 million tons/year crude steel)
were operating at an injection rate of 115 kg coal/thm (coke/coal replacement ratio of 0.8).
Energy consumption at Hoogovens for on-site coke production was 1.62 GJ fuel/ton crude steel
(tcs) and 0.06 GJ,/tcs. Assuming a practical maximum injection rate of 180 kg coal/thm in the
year 2000, Worrell et al. estimate a savings of 13.5% of the energy demand of coke production.
Koen et. al. 1391 have reported on the costs of an all-coke operation and PCI operation at
Hoogovens. Table 7-6 provides the relevant data to compare the energy and costs of the all-coke
practice with the PCI practice. Figures 7-12 and 7-13 show that, in terms of energy consumption
and total operating costs, the coal injection practice produces as much energy at a lower operating
cost. It should be noted that Oshnock and Koen have not included the coal injection system
capital costs in their evaluations. However, Koen et al. [391 mention that an extensive
investigation at Hoogovens revealed that a coal injection system would require a smaller
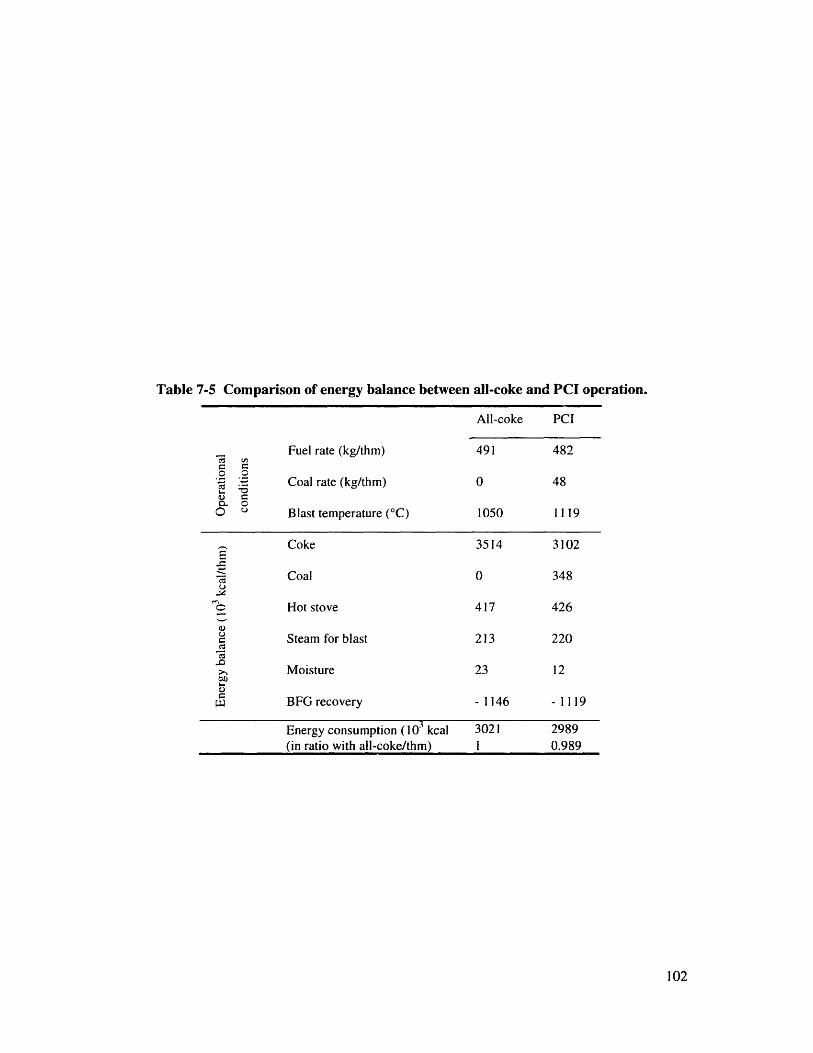
Table 7-5 Comparison of energy balance between all-coke and PCI operation.
All-coke PCI
Fuel rate (kg/thm) 491 482
o 0"= Coal rate (kg/thm) 0 48
O U Blast temperature (°C) 1050 1119
Coke 3514 3102E
9 Coal 0 348
Hot stove 417 426
Steam for blast 213 220
-0; Moisture 23 12
BFG recovery - 1146 - 1119
Energy consumption (103 kcal 3021 2989(in ratio with all-coke/thm) 1 0.989
102
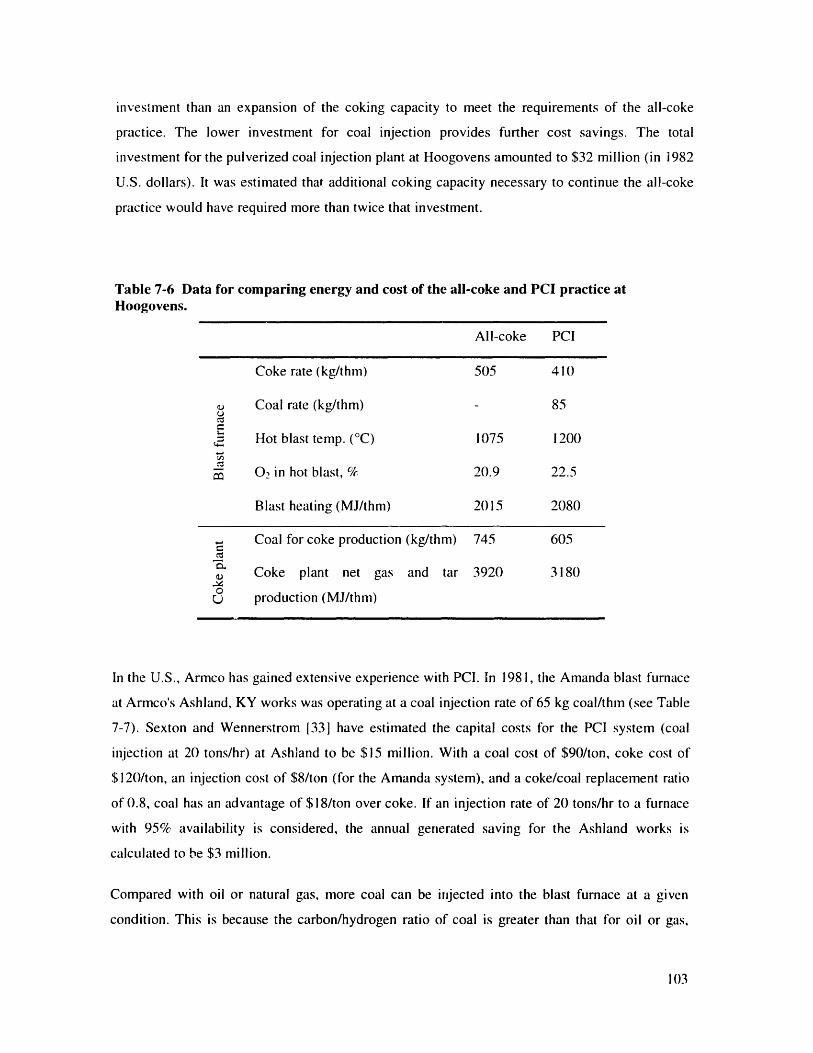
investment than an expansion of the coking capacity to meet the requirements of the all-coke
practice. The lower investment for coal injection provides further cost savings. The total
investment for the pulverized coal injection plant at Hoogovens amounted to $32 million (in 1982
U.S. dollars). It was estimated that additional coking capacity necessary to continue the all-coke
practice would have required more than twice that investment.
Table 7-6 Data for comparing energy and cost of the all-coke and PCI practice atHoogovens.
All-coke PCI
Coke rate (kg/thm) 505 410
a Coal rate (kg/thm) - 85
Hot blast temp. (oC) 1075 1200
0, in hot blast, % 20.9 22.5
Blast heating (MJ/thm) 2015 2080
Coal for coke production (kg/thm) 745 605
S Coke plant net gas and tar 3920 3180
U production (MJ/thm)
In the U.S., Armco has gained extensive experience with PCI. In 1981, the Amanda blast furnace
at Armco's Ashland, KY works was operating at a coal injection rate of 65 kg coal/thin (see Table
7-7). Sexton and Wennerstrom [33] have estimated the capital costs for the PCI system (coal
injection at 20 tons/hr) at Ashland to be $15 million. With a coal cost of $90/ton, coke cost of
$120/ton, an injection cost of $8/ton (for the Amanda system), and a coke/coal replacement ratio
of 0.8, coal has an advantage of $18/ton over coke. If an injection rate of 20 tons/hr to a furnace
with 95% availability is considered, the annual generated saving for the Ashland works is
calculated to be $3 million.
Compared with oil or natural gas, more coal can be injected into the blast furnace at a given
condition. This is because the carbon/hydrogen ratio of coal is greater than that for oil or gas,
103
while still retaining sufficient flammability for combustion in the tuyere zone of the furnace.
Flame temperature in the furnace raceway is diminished less by coal, permitting higher levels of
injection. Oshnock has shown that coal injection has the potential to replace more tons of coke
and lead to greater savings than other injectants. The relative economic effects of using different
injectants with and without oxygen enrichment are shown in Figure 7-14.40 Based on Oshnock's
assumptions, coal has the potential to provide the largest cost savings when compared with oil
and natural gas.
The injection of pulverized coal into the blast furnace tuyeres as a means to lower the coke rate
and hot metal cost has been practiced for a long time. A commercial prototype coal injection
system was installed at U.S. Steel's (now closed) South Works, near Chicago, IL, as early as
1969. Since 1973, the Amanda and Bellefonte furnaces at Armco's Ashland works have been
operating with PCI rates averaging between 75 to 100 kg/metric thm. After the second oil crisis in
1979, application of PCI technology has progressed rapidly in both Europe and Japan. By the
early 1990s, injection rates of nearly 200 kg coal/metric thin had been achieved by companies
such as Thyssen, British Steel, and Hoogovens in Europe, and Kobe in Japan. By 1994, 26 of 32
operating blast furnaces in Japan had coal injection. However, in the U.S., the number of
installations using pulverized coal was limited to three in 1995. Besides Armco's Ashland plant,
coal injection systems in the U.S. include those at U.S. Steel's Gary, IN, mill, and the other at the
Indiana Harbor Works of Inland Steel. Both facilities are designed to supply coal rates of 200 kg
coal/metric thm, and were started up in 1993. In 1995, plans had been made to install this process
in three other plants, namely Bethlehem Steel's Burns Harbor Division, the U.S. Steel/Kobe joint
venture plant at Lorain, OH, and U.S. Steel's Fairfield, AL plant. The Lorain system is capable of
injecting 250 kg coal/metric thm. Finally, the Canadian steelmaker Stelco has announced plans to
build a $60 million facility for the injection of pulverized coal at its blast furnace at the Hilton
Works and thus reduce its coke requirement [3311[36][40.
VSZ Steel Ltd. operates an integrated site in the Slovak Republic producing 4 million tons of
steel per year. In 1991, work began on a project to decrease the consumption of coke in the two
operational blast furnaces at the Kosice site by replacement with injected pulverized coal 121]. As
indicated in Table 7-8, the coke consumption fell from 510-388 kg/thm and 514-415 kg/thm for
BF2 and BF3, respectively. The advantages of coal injection were that a coke oven battery could
4" Economics for Figure 7-14 are based on the following: coke-to-coal cost differential of $33/ton, oil at$0.40/gal., natural gas at $2.61/GJ, oxygen at $1.26/Mscf.
104
be closed down, without jeopardizing the coke supply to the blast furnaces, resulting in reduced
emissions to air and water. The volume of phenol/ammonia laden waste water requiring treatment
was reduced by 96.200 m3/yr, and air emissions were reduced as indicated in Table 7-9. The total
investment cost for the project was $35,000 and direct economic savings resulted from the
reduced cost of waste water treatment and fees for air emissions, which amounted to $13,500/yr
and $17,400/yr, respectively.
In general, Europeans have aimed for coal injection, as well as higher rates, sooner than the rest
of the world because of aging coke-oven batteries and the stringent emission standards associated
with them. Use of coal injection can replace 25-40% of coke in the blast furnace, and the
subsequent reduction in coke production proportionally reduces the coking emissions. The value
of coal injection will increase in the U.S., as the availability of metallurgical-grade coals
decreases, as coke-oven productivity deteriorates, and as coke-oven environmental emission
standards become more stringent.
105
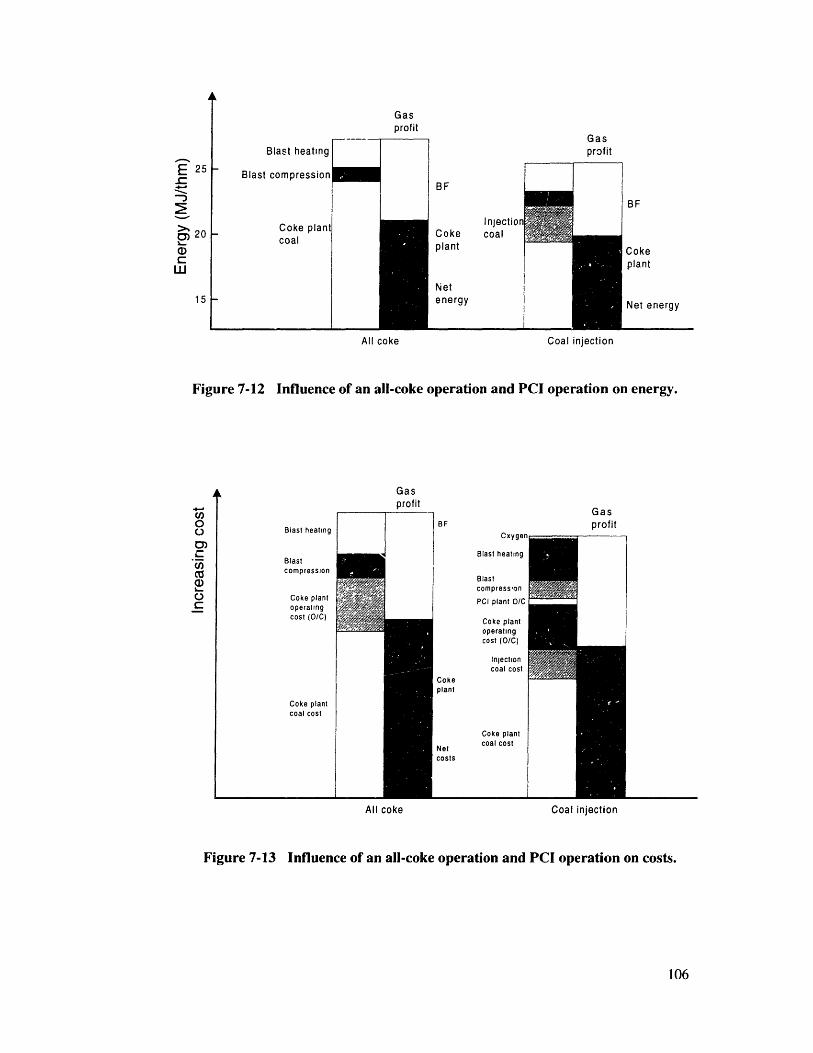
Figure 7-12
Cokenl nt
Injectiocoal
Netenergy
Influence of an all-coke operation and PCI operation on energy.
Cxyger
Blast heating
Blastcompresson
Coke plantoperatingcost (O/C)
Injectioncoal cost
Coke plantcoal costNets
costs
Figure 7-13 Influence of an all-coke operation and PCI operation on costs.
106
E 25
CD 20-.
cw
15
Gasprofit
BF
Cokeplant
Net energy
All coke Coal injection
Gasprofit
GasprofitBlast heating
Blastcompression
Coke plantoperatingcost (O/C)
Coke plantcoal cost
All coke Coal injection
I
PCI plant
O/
-
C
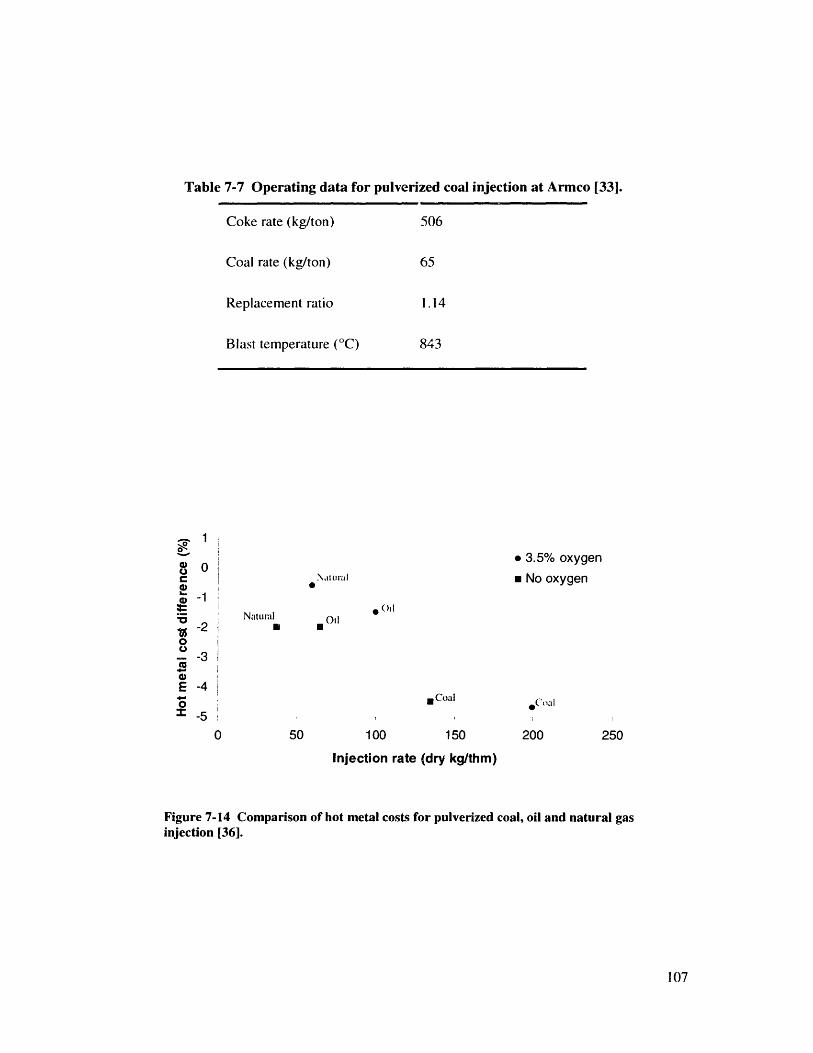
Table 7-7 Operating data for pulverized coal injection at Armco [33].
Coke rate (kg/ton) 506
Coal rate (kg/ton) 65
Replacement ratio 1.14
Blast temperature ('C) 843
* 3.5% oxygen
* No oxygen
Natural0
OilU
SOil
0 Coal
100 150 200 250
Injection rate (dry kg/thm)
Figure 7-14 Comparison of hot metal costs for pulverized coal, oil and natural gasinjection [36].
107
1
0
-1
-2
-3
-4
-5
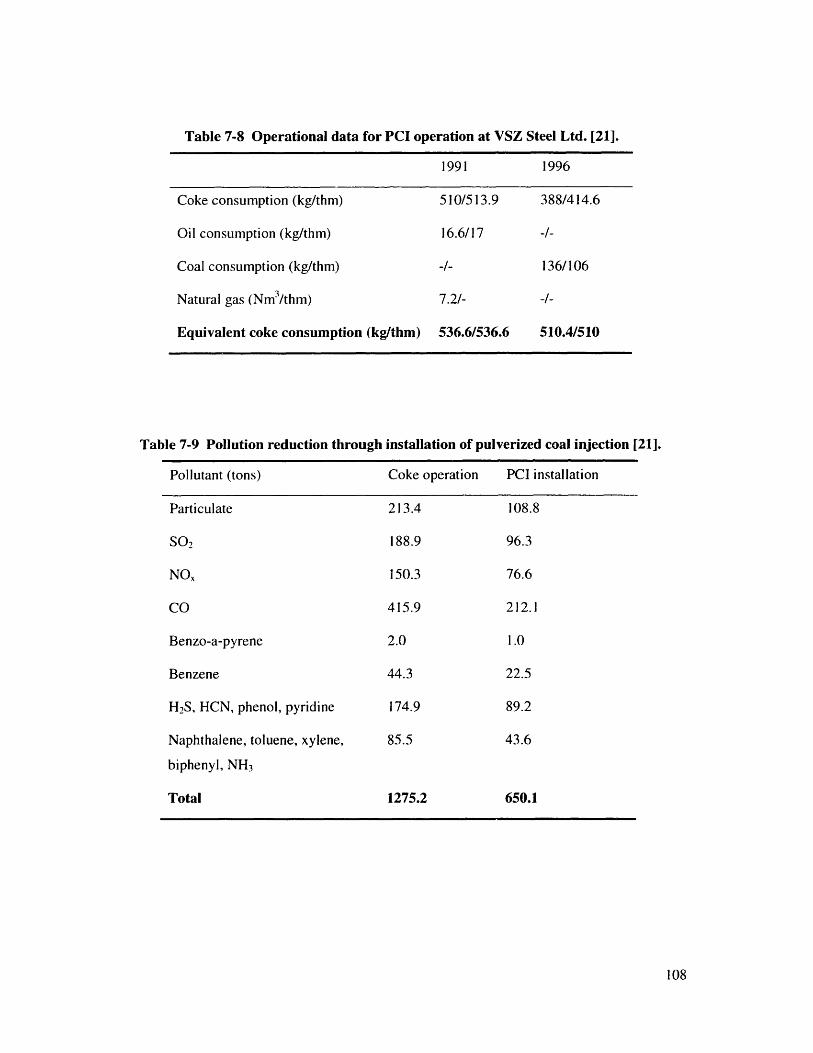
Table 7-8 Operational data for PCI operation at VSZ Steel Ltd. [21].
1991 1996
Coke consumption (kg/thm) 510/513.9 388/414.6
Oil consumption (kg/thm) 16.6/17 -/-
Coal consumption (kg/thm) -/- 136/106
Natural gas (Nm3/thm) 7.2/- -/-
Eouivalent coke consumntion (kg/thm) 536.6/536.6 510.4/510
Table 7-9 Pollution reduction through
Pollutant (tons)
Particulate
SO 2
NOx
CO
Benzo-a-pyrene
Benzene
H2S, HCN, phenol, pyridine
Naphthalene, toluene, xylene,
biphenyl, NH 3
Total
installation of pulverized coal injection [21].
Coke operation PCI installation
213.4 108.8
188.9 96.3
150.3 76.6
415.9 212.1
2.0 1.0
44.3 22.5
174.9 89.2
85.5 43.6
1275.2 650.1
108
- 1--1 .. . ... . . . .. . ... .. IF -- ... .. • . ... .." --- --
8 Summary and Conclusion
The present investigation began by proposing the existence of no-regrets options in
manufacturing processes. It was stipulated that, through recent technical advances, it should be
possible to enable manufacturing processes to reduce pollutant emissions while retaining a net
economic benefit. The case was demonstrated by focusing effort on two sectors within the
manufacturing industry - pulp and paper and the iron and steel industries.
The conventional process route in each industry was elaborated to facilitate the placement of the
pollution prevention technologies within the perspective of present day industry structure. The
pollutants generated during conventional processing, as well as emission points, were identified
so that the pollution reduction benefits offered by the novel technologies could be emphasized.
The urgency of the need for industry to investigate pollution reduction opportunities was stressed
by providing an update of environmental legislation in the U.S.
Finally, the technical and economic aspects of several pollution reduction technologies were
studied for each industrial sector. Care was exercised in selecting those technologies that have
already been implemented by industries to some extent. Discussion of the pollution reduction
achieved for each technology, with the energy consumption, as well as operating/maintenance
costs clearly demonstrates that these no-regrets options can allow the two sectors to reduce
pollutant generation, while improving profitability and competitiveness.
The task ahead is not simple, however. While the industry has captured a few of the pollution
reduction technologies, a host of market barriers to such efficiency investments persist. For
example, although such technologies are cheaper on a life-cycle basis, they do involve up-front
investments. Because of the need for up-front capital, public policies that promote financing and
technical assistance are needed to facilitate investment. Although the focus of this investigation is
on pollution reduction success stories, given such market hurdles to investments, public policy
incentives are crucial to encourage adoption of these advances. The effects of tighter
environmental regulations will increasingly make such investments a prudent pursuit for all
manufacturing businesses.
109
Bibliography
[1]. EPA Office of Compliance Sector Notebook Project: Profile of the Iron and Steel Industry.U.S. Environmental Protection Agency, Office of Enforcement and ComplianceAssurance, Washington, D.C. September 1995 (EPA/310-R-95-005).
121]. Statistics for Industry Groups and Industries: 1995 Annual Survey of Manufacturers. U.S.Department of Commerce, Bureau of the Census, Washington, D.C. February 1997(M95(AS)-I).
131. L.J. Nilsson, E.D. Larson, K.R. Gilbreath, and A. Gupta. Energy Efficiency and the Pull.and Paper hIdustrv. American Council for an Energy-Efficient Economy, Washington,D.C., September 1995.
141. Development Document for Proposed Effluent Limitations Guidelines and Standards forthe Pulp. Paper and Paperboard Point Source Category. U.S. Environmental ProtectionAgency, Office of Water, Washington, D.C. October 1993 (EPA/82 1-R-93-019).
151. G.A. Smook. Handbook for Pulp and Paper Technologists. Angus Wilde Publications.Vancouver, 2
"n edition, 1992.
161. EPA Office of Compliance Sector Notebook Project: Profile of the Pulp and PaperIndustry. U.S. Environmental Protection Agency, Office of Enforcement and ComplianceAssurance, Washington, D.C. September 1995 (EPA/3 I0-R-95-015).
171. Pulp, Paper, and Paperboard Industry - Background Information for Proposed AirEmission Standards: Manufacturing Processes at Kraft, Sulfite, Soda, and Semi-ChemicalMills. U.S. Environmental Protection Agency, Office of Air Quality Planning andStandards, Research Triangle Park, N.C. April 1993 (A-92-40, II-A-13).
181. Pollution Prevention Technologies for the Bleached Kraft Segment of the U.S. Pulp andPaper Industry. U.S. Environmental Protection Agency, Office of Pollution Prevention andToxics, Washington, D.C. August 1993 (EPA/600/R-93/110).
191. L. Tench and S. Harper. Oxygen-bleaching practices and benefits: an overview. TappiJournal, 70 (11):55-61, 1987.
I 10. K. Idner. Oxygen-bleaching of kraft pulp: high consistency vs. medium consistency. TappiJournal, 71 (2):47-50, 1988.
I111. W.E. Nutt, B.F. Griggs, S.W. Eachus, and M.A. Pikulin. Developing an ozone bleachingprocess. Tappi Journal, 76 (3): 11 5-123, 1993.
1121. P.M. Gottlieb, W.E. Nutt, S.R. Miller, and T.S. Macas. Mill experience in high-consistencyozone bleaching of southern pine pulp. Tappi Journal, 77 (6): 117-124, 1994.
1131. R. G. Hise, R.C. Streisel, and A.M. Bills. The effect of brownstock washing, split additionof chlorine, and pH control in the C stage on formation of AOX and chlorophenols duringbleaching. Tappi Journal, 75 (2):57-62, 1992.
110
[14]. D. Ricketts. Three BSW systems studied to find best fit for mill upgrade project. Pulp andPaper, 65 (9):94-100, 1991.
115]. J. Webster. H20 2-enhanced bleaching strategy cuts TOCI levels in mill effluent. Pulp andPaper, 64 (4):141-144, 1990.
[16]. P.B. Walsh. Hydrogen peroxide: innovations in chemical pulp bleaching. Tappi Journal,74 (1):81-83, 1991.
117]. O. Helmling, H.U. Suess, J. Meier, and M. Berger. Mill experience with oxygen andhydrogen peroxide bleaching stages. Tappi Journal, 72 (7):55-61, 198).
118]. E.B. Althouse. Hydrogen peroxide addition to Eo stages is beneficial. Pulp and Paper, 62(6), 1988.
1191. W.T. Lankford Jr., N.L. Samways, R.F. Cravern, and H.E. McGannon, editors, TheMaking, Shaping, and Treating of Steel. Association of Iron and Steel Engineers,Pittsburgh, PA, 10 h' edition, 1985.
120]. R. Fisher. Progress in pollution abatement in European cokemaking industry. Ironmakingand Steelmaking, 19 (6):449-456, 1992.
[21]. Steel Industry and the Environment: Technical and Management Issues. International Ironand Steel Institute, Brussels, Belgium. 1997 (United Nations Environment Programme,Industry and Environment Technical Report No. 38).
[221. J.G. Peacey and W.G. Davenport. The Iron Blast Furnace: Theory and Practice. PergamonPress, 1979.
[23]. B.A. Steiner. Environmental issues facing the iron and steel industry. In 12/ ' ProcessTechnology Conference Proceedings: Environmental Concerns in the Iron and SteelIndustry, pages 45-49. The Iron and Steel Society, Inc., Warrendale, P.A., 1994.
124]. J.C. Morriss, III. S.D. Deatherage, and S.L. Hearne. The ever changing environmentalhorizon: an update of federal environmental law. In 12"' Process Technology ConferenceProceedings: Environmental Concerns in the Iron and Steel Industry, pages 17-44. TheIron and Steel Society, Inc., Warrendale, P.A., 1994.
1251. 40 C.F.R. §261.32
1261. 40 C.F.R. §261.3
[27]. W. Maschlanka. Corex technology for steelmaking. Iron and St'el Engineer, 67 (6):21-25,1990.
1281. A.J. Flickenschild, F. Reufer, A. Eberle, and D. Siuka. Combined Corex/DRI technology.Iron and Steel Engineer, 73 (8):25-29, 1996.
1291. H.M.W. Delport. The COREX process. Ironmaking and Steelmaking, 19 (3):183-189,1992.
111
[30]. R.J. Dippenaar, R. Hauk, and W. Kepplinger. Impact of the Corex process on theenvironment: a comparative study. In H.M.W. Delport and P.J. Holaschke, editors, COREXSymposium 1990, pages 77-90. The South African Institute of Mining and Metallurgy,Johannesburg, 1990.
[31]. E. Worrell and C. Moore. Energy efficiency and advanced technologies in the iron andsteel industry. In 1997 ACEEE Summer Study on Energy Efficiency in Industry, pages 135-145. American Council for an Energy-Efficient Economy, Washington, D.C., 1997.
[32]. E. Eichberger and W. Schiffer. Corex liquid iron for small-to-medium steel mills. InH.M.W. Delport and P.J. Holaschke, editors, COREX Symposium 1990, pages 69-76. TheSouth African Institute of Mining and Metallurgy, Johannesburg, 1990.
[33]. J.R. Sexton. Blast furnace coal injection: long proven, now economical. Iron and SteelEngineer, 60 (1):38-41, 1983.
[34]. Coal Industry Annual 1996. U.S. Department of Energy, Energy InformationAdministration, Washington, D.C. 1996 (DOE/EIA-0584(96)).
[35]. Petroleum Marketing Annual 1996. U.S. Department of Energy, Energy InformationAdministration, Washington, D.C. October 1997 (DOE/EIA-0487(96)).
[36]. T.W. Oshnock. Pulverized coal injection for blast furnace operation. Iron and Steelmaker,21 (11,12), 22 (1-4), 1994, 1995.
[37]. T. Uenaka, S. Tamura, K. Kuwano, T. Yabata, and F. Noma. Pulverized coal injection(PCI) in a blast furnace. In Proceedings of the 44 th Ironmaking Conference, pages 417-424. Iron and Steel Society, Warrendale, P.A., 1985.
[38]. E. Worrell, J.D. Beer, K. Blok. Energy conservation in the iron and steel industry. In P.A.Pilavachi, editors, Energy Efficiency in Process Technology, pages 91-100. ElsevierScience Publishers, Essex, England, 1992.
[39]. W. Koen, R.B. Vogel, H.L. Toxopeus, and G.A. Flierman. Injection of coal into the blastfurnaces at Hoogovens. Iron and Steelmaker, 13 (1):29-36, 1986.
[40]. G.J. McManus. Replacing coke with pulverized coal. Iron Age New Steel, 10 (6):40-42,1994.
112
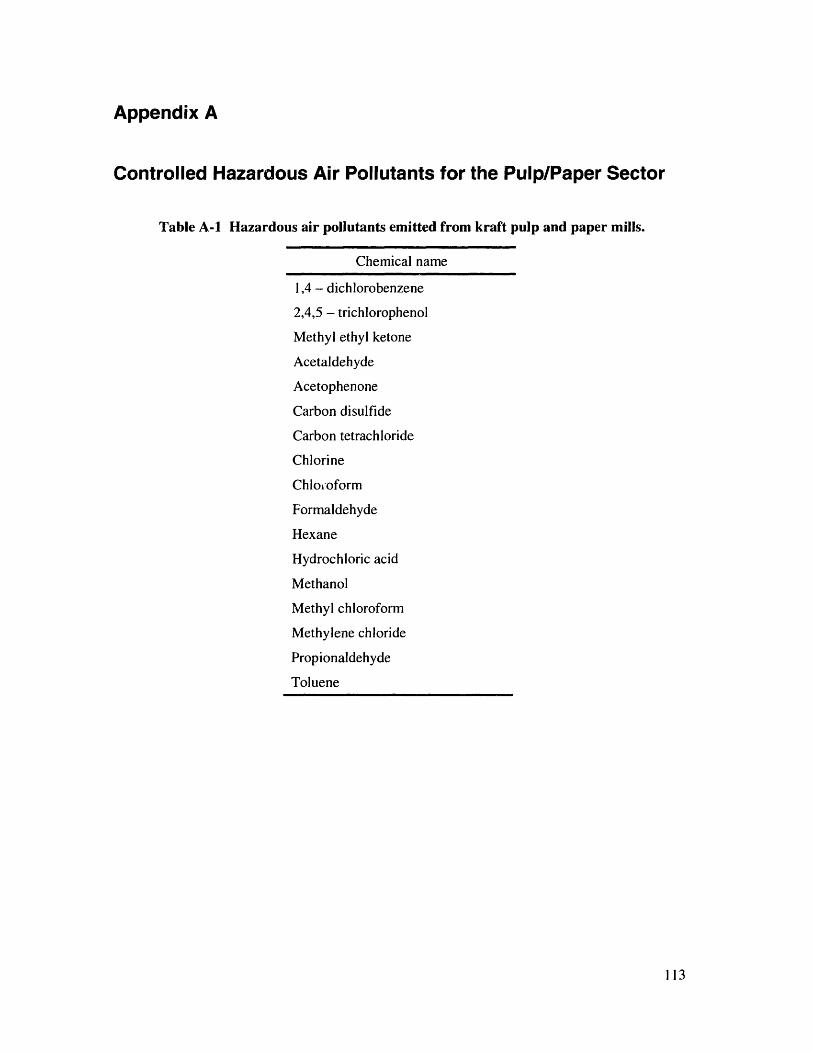
Appendix A
Controlled Hazardous Air Pollutants for the Pulp/Paper Sector
Table A-1 Hazardous air pollutants emitted from kraft pulp and paper mills.
Chemical name
1,4 - dichlorobenzene
2,4,5 - trichlorophenol
Methyl ethyl ketone
Acetaldehyde
Acetophenone
Carbon disulfide
Carbon tetrachloride
Chlorine
Chloioform
Formaldehyde
Hexane
Hydrochloric acid
Methanol
Methyl chloroform
Methylene chloride
Propionaldehyde
Toluene
113