Embed Size (px)
Citation preview

UNIVERSITY OF OSLO
Department of Informatics
Master thesis
Assessment of
Indoor Positioning
System (IPS)
technology
Thomas
Fagerland Wiig
May 3, 2010

Preface
The thesis is part of the fulfillment of my Masters degree at the Department of Informatics
at the University of Oslo (IFI) and the University Graduate Center at Kjeller (UniK).
I would like to thank my supervisor Professor Knut Øvsthus for his help and guidance
through out the work on this thesis, but also for making it possible for me and my fellow HiB
students to achieve this Master’s degree without having to leave Bergen ,. I would also like
to thank Øystein Taskjelle and Espen D. Steine, which I have studied with the last five years,
for good discussions and help whenever I got stuck.
Fulfilling this Master’s degree is a big milestone for me personally, and I would never have
made it without a big support from my family, especially my parents.
i

Assessment of Indoor Positioning System (IPS) technology INF5960
ii
Summary
Indoor Positioning Systems (IPS) have lead to increased efficiency in many types of organi-
zations and industries, and more and more companies embrace the new opportunities and
functionality found in IPS solutions. Because of IPS’s importance and usage potential in
creating new services, there is a significant interest in the industry for IPS and Real Time
Locating Systems (RTLS). The market potential for companies that develop and sell IPS and
RTLS systems are thus predicted to be large in the coming years.
An IPS system may consist of only one technology, or be a hybrid of two or more technolo-
gies. Although the biggest difference between IPS systems are the technology they are based
on, it is often the performance, usage, ease of deployment, cost, or a combination of these,
that matters. Examples of technologies that are used in IPS systems and assessed in this
thesis are Radio Frequency Identification (RFID), Wi-Fi, Ultrasound and Ultra-Wideband
(UWB).
The technology assessment showed that UWB is probably the best technology for use in
indoor positioning systems. Ultra-Wideband is however in its early phases and are therefore
not regulated for use in all countries, for instance Norway. Wi-Fi is on the other hand a
good choice for open indoor environments such as office or class rooms where some level of
positioning error is accepted as long as the decreased performance is reflected in the price
of the system. The testing program build in this thesis, including the proposed positioning
methods, show that it is possible to create a low cost indoor positioning system by re-using
the existing wireless network infrastructure and still achieve an acceptable level of accuracy.
iii

Assessment of Indoor Positioning System (IPS) technology INF5960
iv

Contents
1 Introduction 1
1.1 Indoor Positioning Systems (IPS) . . . . . . . . . . . . . . . . . . . . . . . . . 1
1.2 Motivation . . . . . . . . . . . . . . . . . . . . . . . . . . . . . . . . . . . . . 2
1.3 Problem description . . . . . . . . . . . . . . . . . . . . . . . . . . . . . . . . 3
1.4 Demarcation . . . . . . . . . . . . . . . . . . . . . . . . . . . . . . . . . . . . 4
1.5 Privacy concerns . . . . . . . . . . . . . . . . . . . . . . . . . . . . . . . . . . 4
1.6 Structure of the report . . . . . . . . . . . . . . . . . . . . . . . . . . . . . . . 5
2 Theory and background 7
2.1 Technology overview . . . . . . . . . . . . . . . . . . . . . . . . . . . . . . . . 7
2.1.1 Radio Frequency Identification (RFID) . . . . . . . . . . . . . . . . . . 7
2.1.2 Wi-Fi . . . . . . . . . . . . . . . . . . . . . . . . . . . . . . . . . . . . 8
2.1.3 Ultrasound . . . . . . . . . . . . . . . . . . . . . . . . . . . . . . . . . 10
2.1.4 Ultra-Wideband (UWB) . . . . . . . . . . . . . . . . . . . . . . . . . . 11
2.2 Real-Time Locating System (RTLS) standards . . . . . . . . . . . . . . . . . 15
2.3 Real-Time Locating System (RTLS) methodologies . . . . . . . . . . . . . . . 16
2.3.1 Received Signal Strength Indication (RSSI) . . . . . . . . . . . . . . . 17
2.3.2 Time Difference of Arrival (TDoA) . . . . . . . . . . . . . . . . . . . . 19
2.3.3 Time of Arrival (ToA) . . . . . . . . . . . . . . . . . . . . . . . . . . . 20
2.3.4 Angle of Arrival (AoA) . . . . . . . . . . . . . . . . . . . . . . . . . . 20
3 Requirements 23
3.1 Performance and reliability . . . . . . . . . . . . . . . . . . . . . . . . . . . . 23
3.1.1 Tracking accuracy . . . . . . . . . . . . . . . . . . . . . . . . . . . . . 23
v
Assessment of Indoor Positioning System (IPS) technology INF5960
3.1.2 Coverage . . . . . . . . . . . . . . . . . . . . . . . . . . . . . . . . . . 24
3.1.3 Reliable transmission and interference . . . . . . . . . . . . . . . . . . 24
3.1.4 Fault tolerance . . . . . . . . . . . . . . . . . . . . . . . . . . . . . . . 25
3.2 Regulations . . . . . . . . . . . . . . . . . . . . . . . . . . . . . . . . . . . . . 25
3.3 Standards . . . . . . . . . . . . . . . . . . . . . . . . . . . . . . . . . . . . . . 26
3.4 Cost . . . . . . . . . . . . . . . . . . . . . . . . . . . . . . . . . . . . . . . . . 26
3.5 Requirement summary . . . . . . . . . . . . . . . . . . . . . . . . . . . . . . . 27
4 Technology assessment 29
4.1 Radio Frequency Identification (RFID) . . . . . . . . . . . . . . . . . . . . . . 29
4.2 Wi-Fi . . . . . . . . . . . . . . . . . . . . . . . . . . . . . . . . . . . . . . . . 30
4.3 Ultrasound . . . . . . . . . . . . . . . . . . . . . . . . . . . . . . . . . . . . . 31
4.4 Ultra-Wideband (UWB) . . . . . . . . . . . . . . . . . . . . . . . . . . . . . . 32
4.5 Choice of technology . . . . . . . . . . . . . . . . . . . . . . . . . . . . . . . . 33
5 Building a test program 35
5.1 How to get RSSI values . . . . . . . . . . . . . . . . . . . . . . . . . . . . . . 35
5.2 About the test program . . . . . . . . . . . . . . . . . . . . . . . . . . . . . . 38
5.3 Implemented trilateration logic . . . . . . . . . . . . . . . . . . . . . . . . . . 42
6 Positioning methods and models 45
6.1 Log-distance path loss model . . . . . . . . . . . . . . . . . . . . . . . . . . . 45
6.2 Measurement filtration method . . . . . . . . . . . . . . . . . . . . . . . . . . 47
6.3 Wall attenuation method . . . . . . . . . . . . . . . . . . . . . . . . . . . . . 48
6.4 Border check method . . . . . . . . . . . . . . . . . . . . . . . . . . . . . . . . 49
6.5 Speed filtration . . . . . . . . . . . . . . . . . . . . . . . . . . . . . . . . . . . 50
6.6 Statistical position estimation . . . . . . . . . . . . . . . . . . . . . . . . . . . 51
6.7 Wall check method . . . . . . . . . . . . . . . . . . . . . . . . . . . . . . . . . 51
6.8 Positioning method summary . . . . . . . . . . . . . . . . . . . . . . . . . . . 51
7 Test setup 53
7.1 Test area . . . . . . . . . . . . . . . . . . . . . . . . . . . . . . . . . . . . . . 53
7.2 Equipment and hardware used . . . . . . . . . . . . . . . . . . . . . . . . . . 55
vi
Assessment of Indoor Positioning System (IPS) technology INF5960
7.3 Hardware configuration . . . . . . . . . . . . . . . . . . . . . . . . . . . . . . 57
7.4 Configuring the test program . . . . . . . . . . . . . . . . . . . . . . . . . . . 59
8 Test results and evaluation 63
8.1 Test results . . . . . . . . . . . . . . . . . . . . . . . . . . . . . . . . . . . . . 63
8.2 Evaluation of the test results . . . . . . . . . . . . . . . . . . . . . . . . . . . 65
8.3 Positioning methods evaluation . . . . . . . . . . . . . . . . . . . . . . . . . . 67
9 Conclusion 73
9.1 Future work . . . . . . . . . . . . . . . . . . . . . . . . . . . . . . . . . . . . . 73
References . . . . . . . . . . . . . . . . . . . . . . . . . . . . . . . . . . . . . . . . . 75
A Measurement data 79
A.1 Finding PL(d0) . . . . . . . . . . . . . . . . . . . . . . . . . . . . . . . . . . . 79
A.2 Measurements at different distances . . . . . . . . . . . . . . . . . . . . . . . 79
A.3 Wall attenuation measurements . . . . . . . . . . . . . . . . . . . . . . . . . . 80
A.4 Measurements for positioning example . . . . . . . . . . . . . . . . . . . . . . 80
B Logs from the test program 83
vii

Assessment of Indoor Positioning System (IPS) technology INF5960
viii
List of Figures
1.1 IDTechEx market forcast for Real-Time Locating Systems 2008-2018 [13] . . 3
2.1 Time and frequency use of a conventional radio . . . . . . . . . . . . . . . . . 11
2.2 Time and frequency use for a UWB radio . . . . . . . . . . . . . . . . . . . . 11
2.3 Narrowband (NB), spread spectrum (SS) and Ultra-Wideband (UWB) signal
concepts . . . . . . . . . . . . . . . . . . . . . . . . . . . . . . . . . . . . . . . 12
2.4 Trilateration [9] . . . . . . . . . . . . . . . . . . . . . . . . . . . . . . . . . . . 17
2.5 RSSI pattern example because of interference from obstructions and other sources 18
2.6 Example of an area where RF fingerprinting is used [28] . . . . . . . . . . . . 18
2.7 The Time Difference of Arrival (TDoA) method [9] . . . . . . . . . . . . . . . 19
2.8 The Time of Arrival (ToA) method [9] . . . . . . . . . . . . . . . . . . . . . . 20
2.9 The Angle of Arrival (AoA) method. [9] . . . . . . . . . . . . . . . . . . . . . 21
5.1 Packets containing RSSI values from AP’s captured in Wireshark . . . . . . . 37
5.2 WDS packet analysis in search for the correct RSSI byte . . . . . . . . . . . . 37
5.3 Finally, the RSSI value ”revealed” itself in the 8 first bits using two’s complement 38
5.4 Selecting access points to use and tag to locate . . . . . . . . . . . . . . . . . 39
5.5 Select and configure positioning methods to use . . . . . . . . . . . . . . . . . 39
5.6 Selecting a map of the testing area . . . . . . . . . . . . . . . . . . . . . . . . 40
5.7 Calibrating/configuring the map . . . . . . . . . . . . . . . . . . . . . . . . . 40
5.8 Example of the Locator screen, with positioning circles turned on . . . . . . . 41
5.9 Example of the Graphs screen . . . . . . . . . . . . . . . . . . . . . . . . . . . 41
5.10 Example of two intersecting circles in (a), and no intersection points in (b) . 42
5.11 Trilateration example with three access points . . . . . . . . . . . . . . . . . . 43
ix
Assessment of Indoor Positioning System (IPS) technology INF5960
6.1 Point-In-Polygon examples: (a) is outside and (b) is inside, because of the
straight lines even and un-even intersections with the border . . . . . . . . . 50
6.2 Positioning steps overview . . . . . . . . . . . . . . . . . . . . . . . . . . . . . 52
7.1 Overview of the testing area, 3rd floor, wing E at Bergen University College . 54
7.2 Overview of wireless networks in the testing area, seen by ThinkVantage Access
Conn. . . . . . . . . . . . . . . . . . . . . . . . . . . . . . . . . . . . . . . . . 55
7.3 Cicso 1232AG Access Point and 2.2 dBi omni-directional antenna . . . . . . . 55
7.4 Cicso Catalyst 2940 switch . . . . . . . . . . . . . . . . . . . . . . . . . . . . 56
7.5 AeroScout T2 . . . . . . . . . . . . . . . . . . . . . . . . . . . . . . . . . . . . 56
7.6 AeroScout Tag Activator . . . . . . . . . . . . . . . . . . . . . . . . . . . . . . 57
7.7 The tag configuration done on both tags in AeroScout Tag Manager . . . . . 59
7.8 Map calibration in the testing program . . . . . . . . . . . . . . . . . . . . . . 61
8.1 Measurement results . . . . . . . . . . . . . . . . . . . . . . . . . . . . . . . . 63
8.2 Distance error on each measurement point . . . . . . . . . . . . . . . . . . . . 64
8.3 All estimated tag positions . . . . . . . . . . . . . . . . . . . . . . . . . . . . 64
8.4 Distance error data for the three biggest rooms . . . . . . . . . . . . . . . . . 65
8.5 The estimated tag positions furthest out creates a ”diamond” shape . . . . . 67
8.6 AP and tag positions in the test example . . . . . . . . . . . . . . . . . . . . 68
8.7 Temporary position estimation . . . . . . . . . . . . . . . . . . . . . . . . . . 70
8.8 Final position estimation of tag . . . . . . . . . . . . . . . . . . . . . . . . . . 72
x
List of Tables
2.1 The two UWB proposals [32] . . . . . . . . . . . . . . . . . . . . . . . . . . . 13
3.1 Requirement summary overview . . . . . . . . . . . . . . . . . . . . . . . . . . 27
6.1 Path loss exponents for different environments . . . . . . . . . . . . . . . . . 46
7.1 Room number overview . . . . . . . . . . . . . . . . . . . . . . . . . . . . . . 53
7.2 Aeroscout T2 and T3 tag specifications . . . . . . . . . . . . . . . . . . . . . 56
7.3 Frequency channel configuration on each AP . . . . . . . . . . . . . . . . . . 58
7.4 Model and method parameters used in the testing . . . . . . . . . . . . . . . 60
8.1 AP coordinates, in meters . . . . . . . . . . . . . . . . . . . . . . . . . . . . . 68
8.2 The highest RSSI value measured by each AP . . . . . . . . . . . . . . . . . . 69
8.3 RSSI values after Wall attenuation method . . . . . . . . . . . . . . . . . . . 69
8.4 Estimated and actual distances from AP’s to tag . . . . . . . . . . . . . . . . 69
8.5 RSSI values after the second phase of the Wall attenuation method . . . . . . 71
8.6 Estimated and actual distances from AP’s to tag . . . . . . . . . . . . . . . . 71
xi
Chapter 1
Introduction
In this chapter, an introduction to the topic of this thesis is given in section 1.1 Indoor
Positioning Systems (IPS), the motivation behind the thesis is explained in 1.2, problem
description in 1.3, privacy concerns in 1.4, and demarcation of the problem description in
1.5. In the end, an overview of the report structure is found in 1.6.
1.1 Indoor Positioning Systems (IPS)
Indoor Positioning Systems (IPS) is a type of a Real-Time Locating System (RTLS). RTLS
locates or track persons/assets in ”real-time”. Sometimes RTLS systems are also being re-
ferred to as Local Positioning Systems (LPS), or simply Positioning Systems. This thesis will
focus on indoor positioning, and thus IPS. The development and use of IPS systems have
increased radically in the last few years. More and more wireless technologies are being used,
resulting in more feature rich systems capable of solving numerous big and small tasks in a
company, factory or organization buildings. The big range of services the IPS systems can
offer are mainly the reason for its extremely success and popularity in the recent years.
A IPS system consists of several steps, and the locating is not done in a single process.
First sensors or receivers/readers receive signals from transmitting devices or tags. The
sensors or receivers then sends the collected data values, to a central locating engine which
calculates the approximate position of the device or asset using different algorithms/models.
The collected data values could be either the Received Signal Strength Indication (RSSI),
Time Difference of Arrival (TDoA) or the Angle of Arrival (AoA). How accurate the results
1

Assessment of Indoor Positioning System (IPS) technology INF5960
are, depends on the technology used in the system. The calculated result is then sent from
the locating engine in x and y coordinates (and z in 3D systems) to a user interface. The
user interface is basically just an application where the calculated position is shown to the
user on a map of the monitored area.
Although IPS is a type of RTLS, it is despite its name, usually not ”real-time” in the
true meaning. Real-time is when the system adjust itself whenever there is a change in the
environment with a small or no delay, for instance when a person or an asset has changed its
position. If a person on the move is being positioned, the position given to the user interface
will often be slightly delayed in relation to the actual position because of the time it takes to
collect data, calculate, and pass the information to the user interface. In real-life applications,
this is not a problem since it is not often a true real-time system is actually needed. Therefore,
most positioning systems on the market today do not perform ”real” real-time positioning.
Furthermore, another challenge is the real-time vs long battery life ”battle”, since it is
hard to fulfill them both. To get as close as possible to real-time, the device or tag have to
transmit its position as often as possible, but this results in high power consumption and a
low battery life. In reality, most IPS/RTLS tags contains a motion sensor which is used to
differentiate transmitting intervals between when the asset/person is moving or not to save
power. It’s normal to use a transmitting interval of only a few seconds when the asset/person
is moving, and several minutes when it’s not. This enables a battery lifetime for up to 3 or 4
years before it needs to be changed.
1.2 Motivation
Indoor Positioning Systems (IPS) have lead to increased efficiency in many types of organi-
zations and industries, and more and more companies embrace the new opportunities and
functionality found in a IPS solution. IPS have many usage areas, and is for instance used in
logistics, health care, critical/dangerous asset tracking, emergency services, personnel/visitor
identification, security, and so on. They all rely on the IPS system to give them the highest
possible efficiency, security and safety. This gives the technology behind the IPS systems
several challenges and requirements. Research on the technologies used in IPS systems is
thus an ongoing process to always get the most out of the existing technology and solution.
Furthermore, because of IPS’s importance and usage potential in offering new services,
2
Assessment of Indoor Positioning System (IPS) technology INF5960
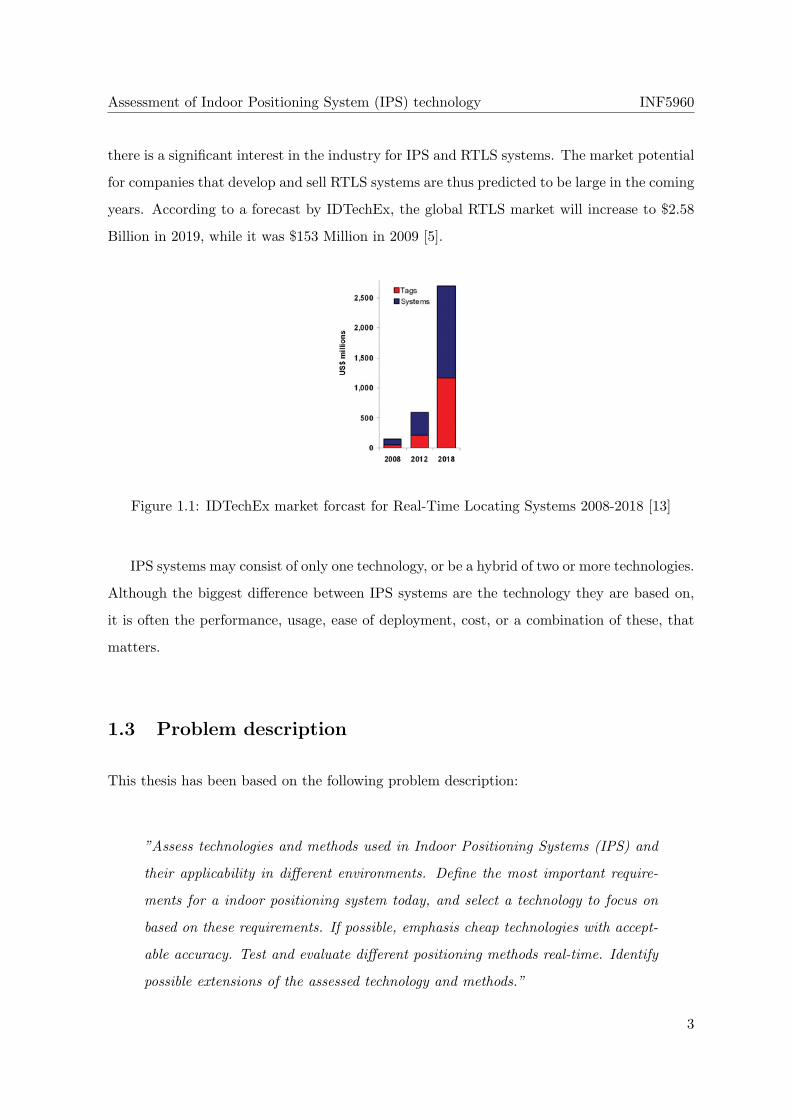
there is a significant interest in the industry for IPS and RTLS systems. The market potential
for companies that develop and sell RTLS systems are thus predicted to be large in the coming
years. According to a forecast by IDTechEx, the global RTLS market will increase to $2.58
Billion in 2019, while it was $153 Million in 2009 [5].
Figure 1.1: IDTechEx market forcast for Real-Time Locating Systems 2008-2018 [13]
IPS systems may consist of only one technology, or be a hybrid of two or more technologies.
Although the biggest difference between IPS systems are the technology they are based on,
it is often the performance, usage, ease of deployment, cost, or a combination of these, that
matters.
1.3 Problem description
This thesis has been based on the following problem description:
”Assess technologies and methods used in Indoor Positioning Systems (IPS) and
their applicability in different environments. Define the most important require-
ments for a indoor positioning system today, and select a technology to focus on
based on these requirements. If possible, emphasis cheap technologies with accept-
able accuracy. Test and evaluate different positioning methods real-time. Identify
possible extensions of the assessed technology and methods.”
3
Assessment of Indoor Positioning System (IPS) technology INF5960
1.4 Demarcation
The thesis will focus on the following technologies: Radio Frequency Identification (RFID),
Wi-Fi, Ultrasound and Ultra-Wideband (UWB). Although there exist IPS systems that use
other wireless technologies, like Infrared, Bluetooth and ZigBee, they are not by far as com-
mercially available as the former mentioned technologies. Wi-Fi and RFID were chosen
because of its wide deployment and low cost equipment. Ultrasound and UWB on the other
hand was chosen because many see them as the ”newcomers” in the indoor positioning arena,
for its high potential to increase the performance of such systems.
In addition, the focus will be on open environments, typically class room and office envi-
ronments.
1.5 Privacy concerns
Although positioning and localization systems offer new opportunities in terms of efficiencies,
security and safety, it may also be seen as a threat to privacy. Specially when it is applied to
persons, either directly, or on equipment worn by persons. The development of positioning
systems have increased in the last years, with all sorts of technologies and functionality im-
plemented. Positioning systems have resulted in a new market for localization services, and
can be found in most part of our society today. Some examples are cell phone localization:
AutoZeek1 and mBuddy2, localization of cars involved in a traffic accident: eCall, and in-
door positioning systems used in different scenarios: dating, asset/patient/staff tracking at
hospitals and passenger tracking in airports.
As a result, our society is more and more turning into a surveillance society. Localization,
tracking and storage of personal data are hence regulated in most countries. In Norway it is
The Data Inspectorate (in Norwegian: Datatilsynet) that have the mandate and task to control
and regulate ”..violation of persons right to privacy through the processing of personal data”.
They have, not surprisingly, been very skeptical[33] to the new localization and tracking
services.
The most relevant statements I was able to find (at 03.05.2009) from The Data Inspec-
1http://www.zeekit.no/2http://www.mbuddy.no
4
Assessment of Indoor Positioning System (IPS) technology INF5960
torate concerning RTLS systems where an IPS system based on ultrasound, where it was used
as a dating/friend-finding tool[7] at Samfundet in Trondheim. The goal was to be able to see
where you’re friends or possible partners were in the building. The Data Inspectorate thought
there were no need to warn about this as long as the participants were given full information
of what the collected data was going to be used for, and could get all its information deleted
whenever he or she wanted it to be done.
In addition to the example above, I also found an statement were a new passenger tracking
solution at airports[10] were proposed. The idea was that the passengers receive a RFID
oblate to either keep on them, or to put on their luggage so the airport staff could be able to
track either them or their luggage. The Data Inspectorate was very critical to this project,
and called it a ”...dramatically monitoring project”, and didn’t think the project would pass
because of regulation restrictions. Further in the article, Gunnel Helmers which is a Senior
Adviser in The Data Inspectorate, said that ”..for it to be worth the loss of privacy, it must
prove a very positive effect on the system”. She claims that people with bad intentions will
most likely find a way around the system anyway, resulting in a mass monitoring of a large
group of innocent people.
Hence, for localization and tracking systems to be accepted, the persons involved have to
know the systems purpose and operations, give its permission to be located/tracked, and the
systems must prove a very positive effect on the system it’s implemented in.
1.6 Structure of the report
The structure of the report are as follows; in section 2, Theory and background, the tech-
nologies assessed in this thesis are presented. In section 3, Requirements, the requirements
for the technologies in this thesis is set, were section 4, Technology assessment, discuss the
assessed technologies in relation to the requirements presented and choose a technology that
the rest of the thesis focus on. Furthermore, in section 5, Building a test program, presents
the testing program made to test the positioning methods and models presented in section
6, Positioning methods and models. Section 7, Test setup, presents the test area, equipment
used and configuration. In the end, the test results and positioning methods are presented
and evaluated in section 8, Test results and evaluation, and section 9 contains the Conclusion
of the thesis.
5

Assessment of Indoor Positioning System (IPS) technology INF5960
In addition, all the details around testing done in this thesis are found in appendix A, and
logs from the positioning testing are found in appendix B.
6
Chapter 2
Theory and background
In this chapter, an technology overview of the assessed technologies in this thesis are given
in 2.1. In addition, section 2.2 and 2.3 gives an overview of existing RTLS standards and
methodologies.
2.1 Technology overview
2.1.1 Radio Frequency Identification (RFID)
RFID is a technology used to identify objects or assets by using RF. The objects or assets
wear RFID tags which are then identified by a RFID reader. A RFID tag contains two parts;
the antenna that receive and transmits RF signals, and a micro chip which stores and process
information in addition to modulating and demodulating the RF signals. The antennas varies
in size and shape, depending on the range and properties it shall have.
RFID tags are usually divided into either being passive or active, but are in fact two
different technologies. Passive tags do not contain a battery, and are thus smaller in size.
When a passive tag is read by a reader, the tags antenna induces enough power from the
reader so the tag is able to transmit its reply. Passive tags is often used as bar codes in shops
or on packages at logistics.
Active tags contain its own battery, and are hence bigger compared to passive tags, but
have in addition greater memory and RF transmission range. Active tags are furthermore
able to transmit at a higher effect than passive tags. This usually makes active tags more
”trustworthy” to actually reach the reader with its reply in noisy areas. However, a drawback
7
Assessment of Indoor Positioning System (IPS) technology INF5960
with active tags are the increase in price compared to passive tags.
When it comes to standards[23], The International Organization for Standardization (ISO)
have created several standards for RFID to be used in different usage scenarios. In this
context, the most relevant standards are the ISO 11784 and 1175 which defines how data is
structured on the tag and the air interface protocol for tracking cattle. In addition, ISO 18046
and 18047 defines a standard for testing respectively the performance and the conformance of
RFID tags and readers. Conformance is when the equipment are tested to determine whether
an implemented system fulfills its requirements against the standard or not.
Because of its simple and mature technology, in addition to its many usage areas, RFID is
therefore one of the most common used technologies in IPS systems. By knowing the location
of the RFID reader, you also know the location of the asset or object that wear a RFID tag,
since the transmission range is limited and the reader identifies the tags unique number. In
IPS systems it is more common to use active tags, but some vendors offer passive tags. RFID
is often used together with Wi-Fi in IPS systems to achieve higher accuracy, for example by
using an exciter, sometimes called a chokepoint. Exciters are placed between rooms or floors,
to achieve a 100% room level accuracy.
2.1.2 Wi-Fi
Wi-Fi is a trademark of the Wi-Fi Alliance1, and refers to the IEEE 802.11 standard[14].
IEEE 802.11 was first published in 1997 and was the first wireless networking standard.
Many extensions have been made since then and the original protocol is now obsolete. The
standard are today the most widely adopted wireless technology in use. Most laptops and cell
phones on the market today comes with an integrated IEEE 802.11 wireless interface card.
Wireless LANs are mainly used for transmitting data, but it is also used for wireless Voice
over IP (VoIP).
IEEE 802.11 uses spread spectrum techniques, which are different methods of generated
electromagnetic energy in a particular bandwidth, spread in the frequency domain. This
results in a signal with a wider bandwidth. IEEE 802.11 consist of many parts, describing
different modulation techniques, security (802.11i) and more. The most important parts are
802.11a, 802.11b, 802.11g, and 802.11n, which will be briefly explained below.
1http://www.wi-fi.org/
8
Assessment of Indoor Positioning System (IPS) technology INF5960
First, IEEE 802.11a was first published in 1999, and was the first standard in the 802.11
”family” which supported a maximum data rate of 54 Mbit/s. 802.11a uses a modulation
method called Orthogonal Frequency Division Multiplexing (OFDM). 802.11a operates in the
5 GHz band called Unlicensed National Information Infrastructure (U-NII).
Next, IEEE 802.11b was published in 1999, and uses the same data link layer as the
original 802.11 standard. The high data rate for 802.11b (11 Mbit/s), compared to the
original standard 802.11 (1-2 Mbit/s), made it widely accepted as the new standard for
wireless technology. 802.11b uses a modulation technique called Complementary Code Keying
(CCK), and operates in the 2.4 GHz Industrial, Scientific and Medical (ISM) band.
IEEE 802.11g was published in 2003, and it has a maximum theoretical data bit rate of
54 Mbit/s in the 2.4 GHz ISM band. This was only possible in the 5 GHz band (802.11a)
before this standard were published. 802.11g is backwards compatible with 802.11b hardware,
and are thus sharing many of the same characters and qualities. For a data rate of 1 and 2
Mbit/s, 802.11g uses DBPSK/DQPSK+DSSS for modulation, for 5.5 and 11 Mbit/s it uses
CCK, and for data rates 6, 9, 12, 18, 24, 36, 48, and 54 Mbit/s it uses the same technique
as 802.11a - OFDM. Even though 802.11b and 802.11g operate in the same frequency band,
it is because of the modulation technique 802.11g have ”copied” from 802.l1a, that makes it
achieve greater data rates.
The IEEE 802.11n standard have at the time this was written (09.05.2009) not yet been
published. It is expected to be published in November 2009, and is significantly going to
improve network throughput over wireless LANs with a theoretical data rate of up to 600
Mbps. This is possible by using a new method called Multiple In, Multiple Out (MIMO),
which is going to be one of the big advantages with IEEE 802.11n.
The 802.11a/b/g standards are used differently in many countries because of regulations
to the operating bands (2.4 and 5 Ghz). In Norway, The Norwegian Post and Telecommuni-
cations Authority2 (NPT) is the regulator, and have allowed[30] use of these standards in the
following frequencies; 2400-2483.5 MHz, 5150-5350 MHz and 5470-5725 MHz. This means in
practice that you have a maximum of 3 non-overlapping channels in the 2.4 GHz band; for
example channel 1, 6 and 11 for use with 802.11b/g. For the 5 GHz band there are 22[27]
non-overlapping channels for use with the 802.11a standard. Without going into too much
2http://www.npt.no
9

Assessment of Indoor Positioning System (IPS) technology INF5960
details, the different frequency ranges mentioned above have some additional requirements in
for instance, transmitting power and channel spacing.
Wi-Fi is, in addition to RFID, one of the most widely adopted technologies in IPS systems.
IPS through Wi-Fi, is a simple way of re-using existing infrastructure, and the installation
of such systems are often simple. Wi-Fi-IPS systems are often combined with the RFID
technology to increase the accuracy.
2.1.3 Ultrasound
The term Ultrasound describes a vibration of cyclic sound pressure which are similar to sound
waves, but with a frequency higher than the upper limit of human hearing. Although this
limit varies from person to person, it is approximately between 10-20 kHz [3]. For any given
person this threshold frequency decreases with increasing age. The study and applications
of these vibrations are called ultrasonics. Some animals have a higher upper frequency limit
than the human ear, and can thus hear ultrasound. Some examples are bats, cats, dogs, mice,
and dolphins. Ultrasound frequencies just above the audible range share most of the same
properties as human speech [12].
Ultrasound are today used in a wide range of applications, such as in sonography, at
frequencies between 1-15 MHz. Sonography is used routinely during pregnancy to, among
other things, determine the sex of the baby. Another common use of ultrasound is in range
finding, called SONAR3, where an ultrasonic pulse is generated in a particular direction.
SONAR works similar to RADAR4. Various industries use ultrasound, often in the range of
2 to 10 MHz, to either find flaws in materials or to measure the thickness of objects.
In the recent years, Ultrasound Identification (USID) have been used to automatically
locate or track objects and assets in a given area indoor. Tracking and locating is done
by having inexpensive badges/tags attached to objects or assets, which transmits an unique
sound usually between 35-45 kHz to receivers (microphones) nearby. Based on this sound,
the system can locate the asset or object. Sound is usually measured in Pascal (Pa), but is
often written as Decibel (dB) in relation to a standardized pressure of 20 µPa. Propagation
speed of sound through air is approximately 340 m/s, but this varies with the air pressure,
3Sound Navigation And Ranging4Radio Detection And Ranging
10
Assessment of Indoor Positioning System (IPS) technology INF5960
temperature and humidity [12]. A USID system typically uses a pressure up to 115 dB,
because of several noise sources in the ultrasound specter [12]. Ultrasound waves reflects very
easily, and this is one of the reasons ultrasound is used in IPS systems.
2.1.4 Ultra-Wideband (UWB)
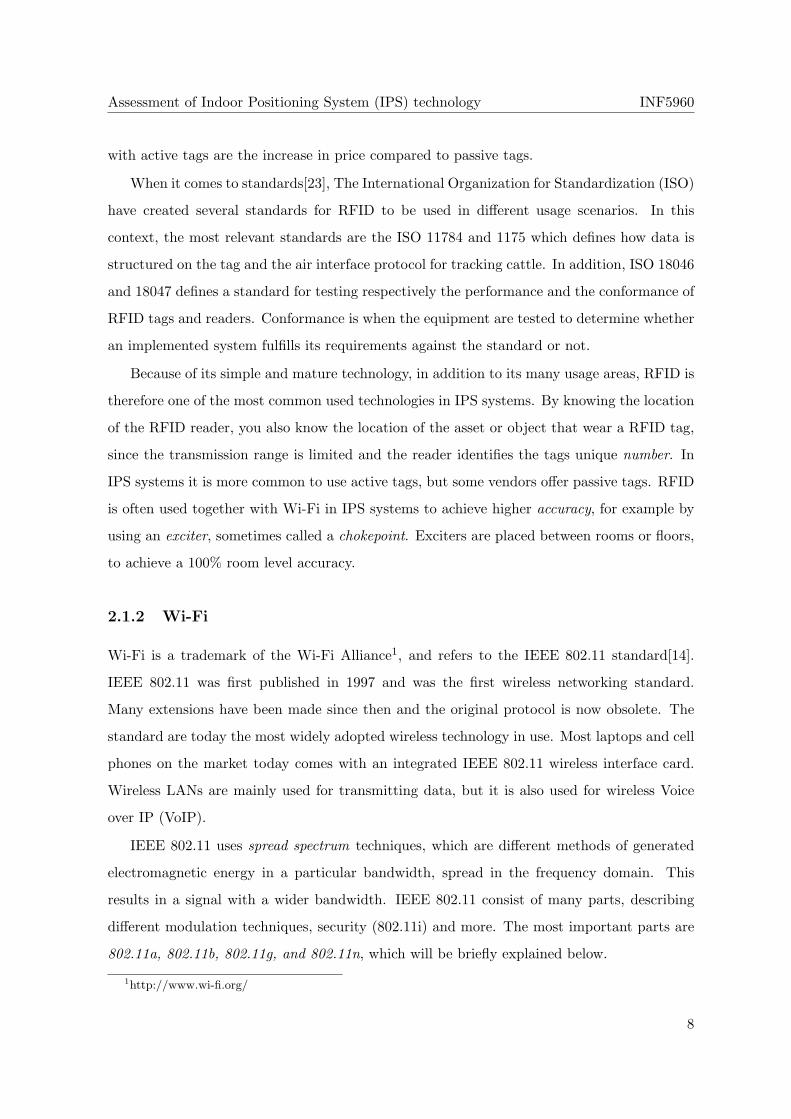
Ultra-Wideband (UWB), sometimes called an Impulse Radio, is an unconventional type of
radio technology for transmitting information at very low energy levels by using a large
portion (>500 MHz) of the radio spectrum. This makes UWB good for short-range high-
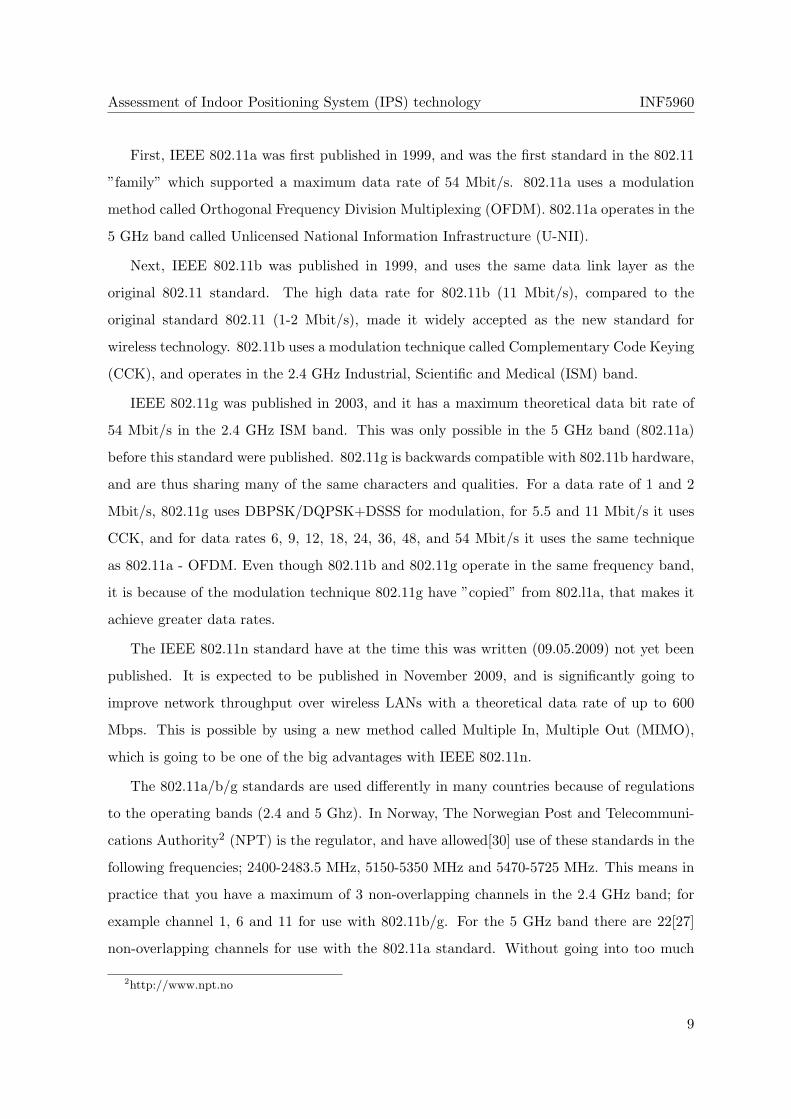
bandwidth communications. UWB transmits short pulses with sharp transitions, without
carrier (baseband). A conventional radio is modulating a carrier giving a narrow spectral
peak[35]. The difference between normal radio and UWB is shown in the figures[35] below:
Figure 2.1: Time and frequency use of a conventional radio
Figure 2.2: Time and frequency use for a UWB radio
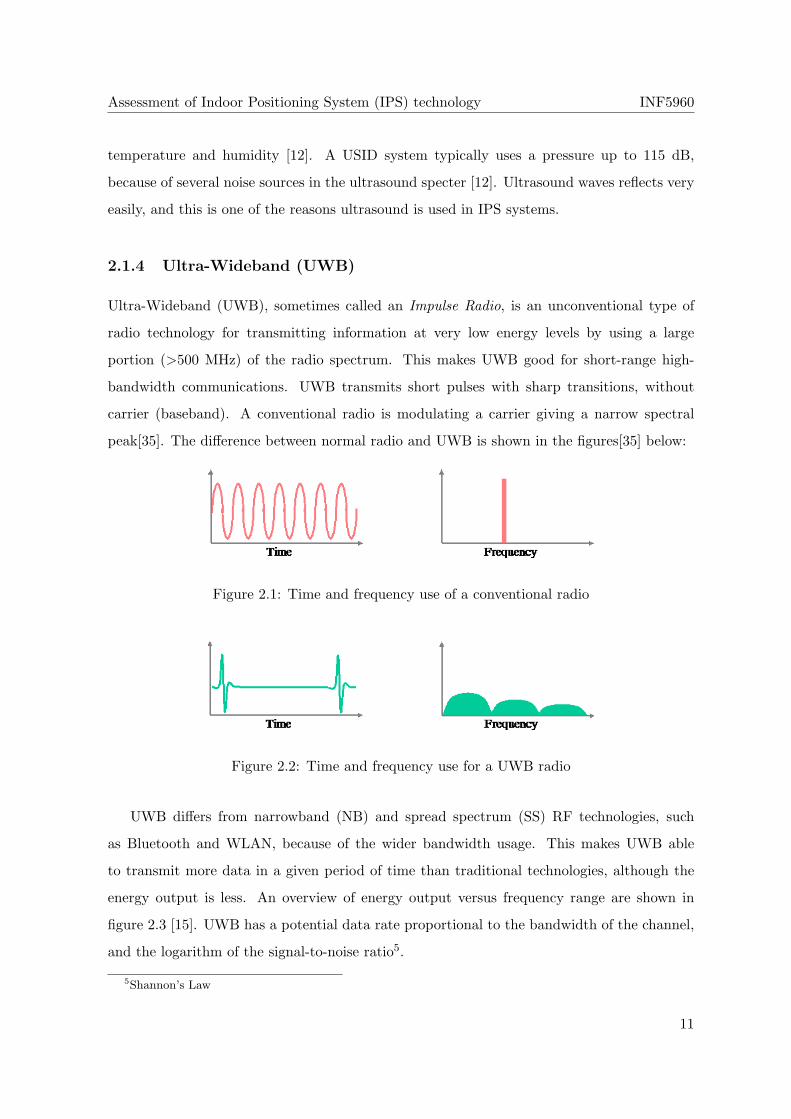
UWB differs from narrowband (NB) and spread spectrum (SS) RF technologies, such
as Bluetooth and WLAN, because of the wider bandwidth usage. This makes UWB able
to transmit more data in a given period of time than traditional technologies, although the
energy output is less. An overview of energy output versus frequency range are shown in
figure 2.3 [15]. UWB has a potential data rate proportional to the bandwidth of the channel,
and the logarithm of the signal-to-noise ratio5.
5Shannon’s Law
11
Assessment of Indoor Positioning System (IPS) technology INF5960
Figure 2.3: Narrowband (NB), spread spectrum (SS) and Ultra-Wideband (UWB) signal
concepts
In 2002 IEEE authorized a PAR6 which goal was to agree on an personal area network
(WPAN) UWB standard[11]. IEEE 802.15.3a Task Group (TG3a) were launched, and started
out with 23 proposals for the physical layer (PHY) for UWB. They managed to consolidate
the number of proposals into two, but then the process stopped. The task group was divided
in half between these two proposals and each camp formed its own consortia, which was the
WiMedia Alliance and the UWB Forum. WiMedia Alliance supported the MultiBand OFDM
(MB-OFDM) UWB proposal, while the UWB Forum supported Direct Sequence UWB (DS-
UWB).
6Project Authorization Request
12
Assessment of Indoor Positioning System (IPS) technology INF5960
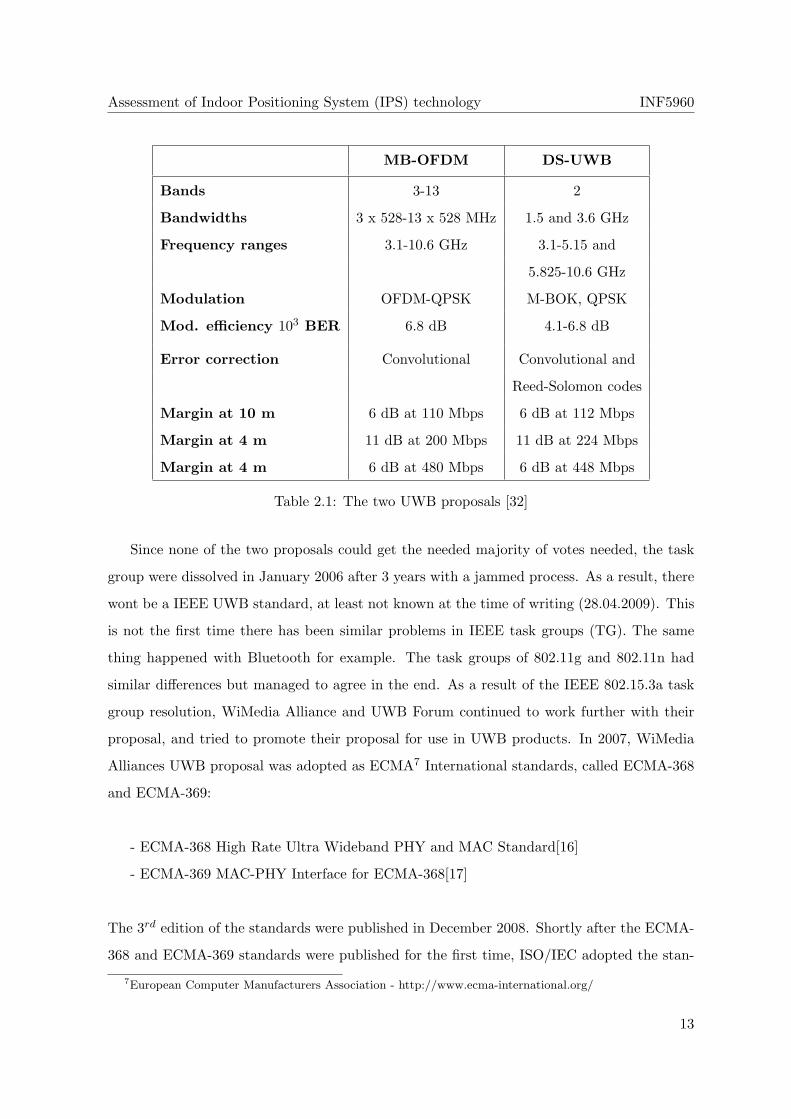
MB-OFDM DS-UWB
Bands 3-13 2
Bandwidths 3 x 528-13 x 528 MHz 1.5 and 3.6 GHz
Frequency ranges 3.1-10.6 GHz 3.1-5.15 and
5.825-10.6 GHz
Modulation OFDM-QPSK M-BOK, QPSK
Mod. efficiency 103 BER 6.8 dB 4.1-6.8 dB
Error correction Convolutional Convolutional and
Reed-Solomon codes
Margin at 10 m 6 dB at 110 Mbps 6 dB at 112 Mbps
Margin at 4 m 11 dB at 200 Mbps 11 dB at 224 Mbps
Margin at 4 m 6 dB at 480 Mbps 6 dB at 448 Mbps
Table 2.1: The two UWB proposals [32]
Since none of the two proposals could get the needed majority of votes needed, the task
group were dissolved in January 2006 after 3 years with a jammed process. As a result, there
wont be a IEEE UWB standard, at least not known at the time of writing (28.04.2009). This
is not the first time there has been similar problems in IEEE task groups (TG). The same
thing happened with Bluetooth for example. The task groups of 802.11g and 802.11n had
similar differences but managed to agree in the end. As a result of the IEEE 802.15.3a task
group resolution, WiMedia Alliance and UWB Forum continued to work further with their
proposal, and tried to promote their proposal for use in UWB products. In 2007, WiMedia
Alliances UWB proposal was adopted as ECMA7 International standards, called ECMA-368
and ECMA-369:
- ECMA-368 High Rate Ultra Wideband PHY and MAC Standard[16]
- ECMA-369 MAC-PHY Interface for ECMA-368[17]
The 3rd edition of the standards were published in December 2008. Shortly after the ECMA-
368 and ECMA-369 standards were published for the first time, ISO/IEC adopted the stan-
7European Computer Manufacturers Association - http://www.ecma-international.org/
13
Assessment of Indoor Positioning System (IPS) technology INF5960
dards, as ISO/IEC 26907[21] and 26908[22] respectfully.
In Norway, NPT have not yet regulated use of UWB technology (as of 28.04.2009), and
there are only a few documents published by NPT concerning UWB. In 2004 they published
a document describing the Strategic Goals for Frequency Management [29] in the future, and
here UWB had its own section. They basically conclude that they will await EU regulations
of UWB, in addition to the results of CEPT8 and ETSI’s9 standardization work for UWB in
Europe. In 2009, NPT published an Action Plan 2009 [31], describing what they will focus
on in 2009-2011. In this document they stated that they would work for the introduction of
UWB in Norway, ”..without creating harmful interference to other radio systems”.
In Europe, the work of regulating UWB have come further than in Norway, although
the regulations are not finished and is still an ongoing progress[6] by CEPT/ECC after a
mandate by the European Commission (EC). So far, the regulation work have concentrated
on indoor use of UWB equipment. They want to minimize the outdoor use because of the risk
for interference. For indoor use, they have regulated different power density throughput and
different mitigation techniques in the frequency range 3.4 - 4.8 GHz and 8.5 - 9.0 GHz. It is
expected that this frequency range will be expanded as the ongoing regulation work proceeds.
In USA, FCC10 have regulated a greater use of high power density throughput than
Europe, on a wider range of frequencies. UWB can in the USA be used in the frequency
range of 3.1 - 10.6 GHz.
UWB technology can enable a wide variety of WPAN applications [15] because of its high
bandwidth possibilities at short range, such as ad-hoc connectivity between mobile devices or
replacing the USB cable with high-speed wireless universal serial bus (WUSB) connectivity
for PCs, printers and external storage devices. Because of its performance properties, UWB
have also been adopted for use in IPS systems.
8European Conference of Postal and Telecommunications Administration9European Telecommunications Standards Institute
10Federal Communications Commission
14
Assessment of Indoor Positioning System (IPS) technology INF5960
2.2 Real-Time Locating System (RTLS) standards
IPS is as earlier mentioned a type of a RTLS system, and since there are no available standards
at the moment only for IPS, the RTLS standards are presented instead. They share most
of the same properties, and the biggest difference is that RTLS systems includes outdoor
positioning while IPS are obviously only for indoor use. The standardization work for RTLS
systems are still in its early phases, and the standards that have been published so far only
explains lightly the basic issues of an RTLS system. These standards have been published by
ISO/IEC, which is the International Organization for Standardization11 and the International
Electrotechnical Commission12. Here is a list of the published RTLS/locating standards so
far:
• ISO/IEC FDIS 19762-5[18] Information technology AIDC techniques Harmonized vo-
cabulary, Part 5 Locating systems
• ISO/IEC 24730-1[19] Information technology real-time locating systems (RTLS) Part
1: Application Program Interface (API)
• ISO/IEC 24730-2[20] Information technology real-time locating systems (RTLS) Part
2: 2,4 GHz Air interface protocol (WhereNet/Zebra approach).
ISO/IEC FDIS 19762-5 addresses the vocabulary used concerning RTLS systems. According
to this standard, a RTLS system is a combination of hardware and software that is used to
continuously determine and provide the real-time position of assets and resources equipped
with devices designed to operate with systems. Hence, the current layout of this ISO/IEC
standardization by definition does not cover all types of discontinuous locating systems, like
simple passive RFID concepts.
ISO/IEC 24730 are divided into two parts which respectfully defines two air interface
protocols in part two and a single application program interface (API) for RTLS in part
one. Part one open up for 3rd party software developing. The API enables the possibility
to retrieve location data and other information from the systems that support this standard.
11http://www.iso.org12http://www.iec.ch
15
Assessment of Indoor Positioning System (IPS) technology INF5960
The API uses well known XML-based standards including XML13 and SOAP14. SOAP is a
protocol for exchanging XML-based messages over computer networks.
The second part describes as mentioned an air-interface protocol for RTLS systems. The
air-interface protocol are divided into three sections[24]. One addresses the tag-reader air-
interface at 2.4 GHz and defines a location system providing x and y coordinates. The
second section describes the air interface for low-frequency devices known as exciters, roughly
around 120-125 kHz. Exciters are usually placed outside doors to provide 100% room or floor
accuracy. And the third section describes a third interface, known as an On/Off Key (OOK).
The OOK enables an active 2.4 GHz RTLS tag to communicate with a simple hand held
reader. The system is designed for good coexistence with other wireless services in the 2.45
GHz ISM band, and is based on a system from Zebra WhereNet.
Part 3 was supposed to standardize Air Interface at 433 MHz (RFID systems) for use in
RTLS, and in part 4 the goal was to incorporate Global Locating Systems into RTLS, but
both projects are withdrawn[2].
Part 5 is still under development, but refers to the standardized communication according
to IEEE 802.15.4a Chirp Spread Spectrum (CSS). CCS is a spread spectrum technique that
uses wideband linear frequency modulated chirp pulses to encode information15. It was orig-
inally designed to compete with Ultra-Wideband (UWB) for precision ranging and low-rate
wireless networks in the 2.45 GHz band, but is no longer actively being considered by IEEE
for standardization in the area of precision ranging.
2.3 Real-Time Locating System (RTLS) methodologies
There exists a numerous methodologies for retrieving values that can be used in a locating
engine to calculate a person or an assets position. Only the most widely used methodologies
will be explained.
13eXtensible Markup Language14Service Oriented Architecture Protocol15IEEE Computer Society, (August 31, 2007). IEEE Standard 802.15.4a-2007
16
Assessment of Indoor Positioning System (IPS) technology INF5960
2.3.1 Received Signal Strength Indication (RSSI)
The Received Signal Strength Indication (RSSI) method measures the signal strength from a
tag or device to several sensors or receivers. It then determines the tag/device position based
on the measured RSSI values from at least 3 sensors/receivers.
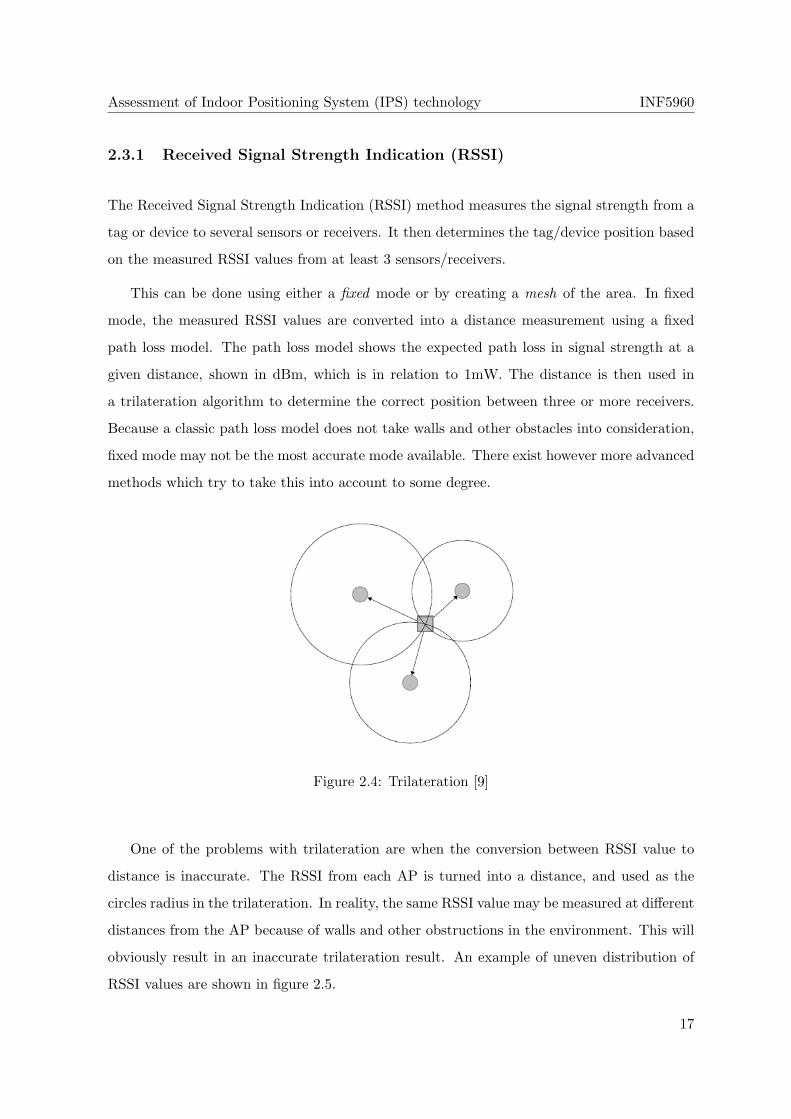
This can be done using either a fixed mode or by creating a mesh of the area. In fixed
mode, the measured RSSI values are converted into a distance measurement using a fixed
path loss model. The path loss model shows the expected path loss in signal strength at a
given distance, shown in dBm, which is in relation to 1mW. The distance is then used in
a trilateration algorithm to determine the correct position between three or more receivers.
Because a classic path loss model does not take walls and other obstacles into consideration,
fixed mode may not be the most accurate mode available. There exist however more advanced
methods which try to take this into account to some degree.
Figure 2.4: Trilateration [9]
One of the problems with trilateration are when the conversion between RSSI value to
distance is inaccurate. The RSSI from each AP is turned into a distance, and used as the
circles radius in the trilateration. In reality, the same RSSI value may be measured at different
distances from the AP because of walls and other obstructions in the environment. This will
obviously result in an inaccurate trilateration result. An example of uneven distribution of
RSSI values are shown in figure 2.5.
17
Assessment of Indoor Positioning System (IPS) technology INF5960
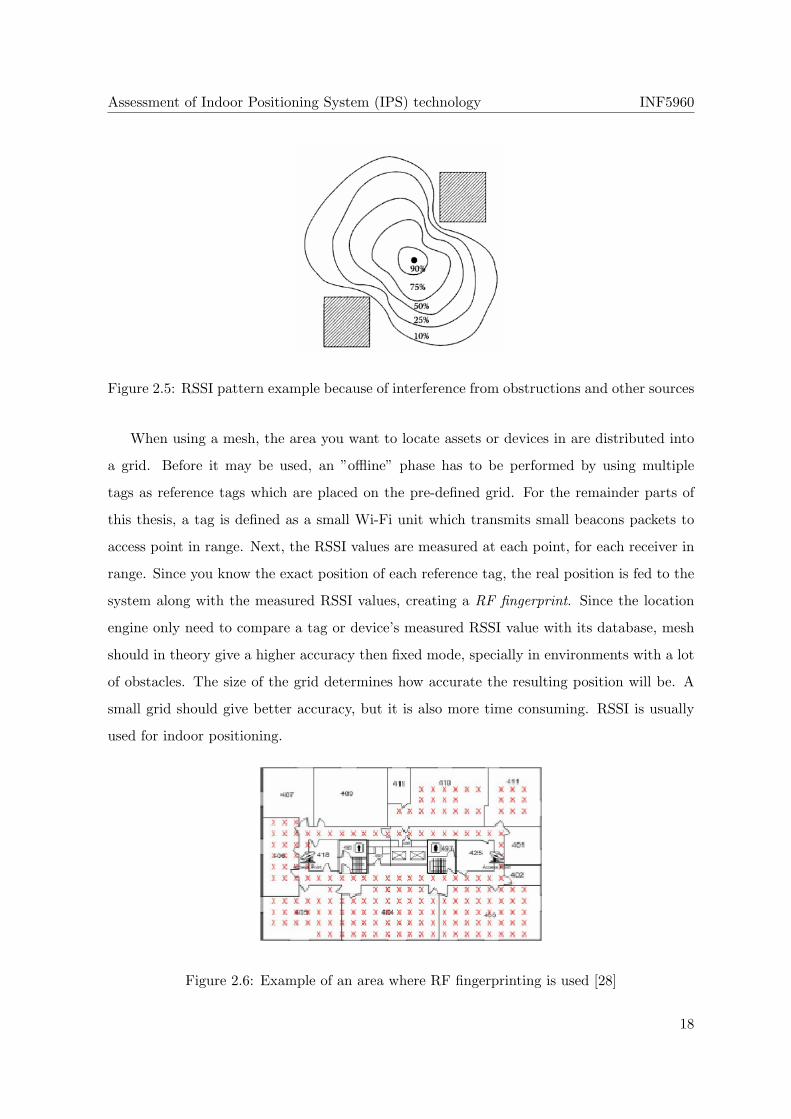
Figure 2.5: RSSI pattern example because of interference from obstructions and other sources
When using a mesh, the area you want to locate assets or devices in are distributed into
a grid. Before it may be used, an ”offline” phase has to be performed by using multiple
tags as reference tags which are placed on the pre-defined grid. For the remainder parts of
this thesis, a tag is defined as a small Wi-Fi unit which transmits small beacons packets to
access point in range. Next, the RSSI values are measured at each point, for each receiver in
range. Since you know the exact position of each reference tag, the real position is fed to the
system along with the measured RSSI values, creating a RF fingerprint. Since the location
engine only need to compare a tag or device’s measured RSSI value with its database, mesh
should in theory give a higher accuracy then fixed mode, specially in environments with a lot
of obstacles. The size of the grid determines how accurate the resulting position will be. A
small grid should give better accuracy, but it is also more time consuming. RSSI is usually
used for indoor positioning.
Figure 2.6: Example of an area where RF fingerprinting is used [28]
18
Assessment of Indoor Positioning System (IPS) technology INF5960
2.3.2 Time Difference of Arrival (TDoA)
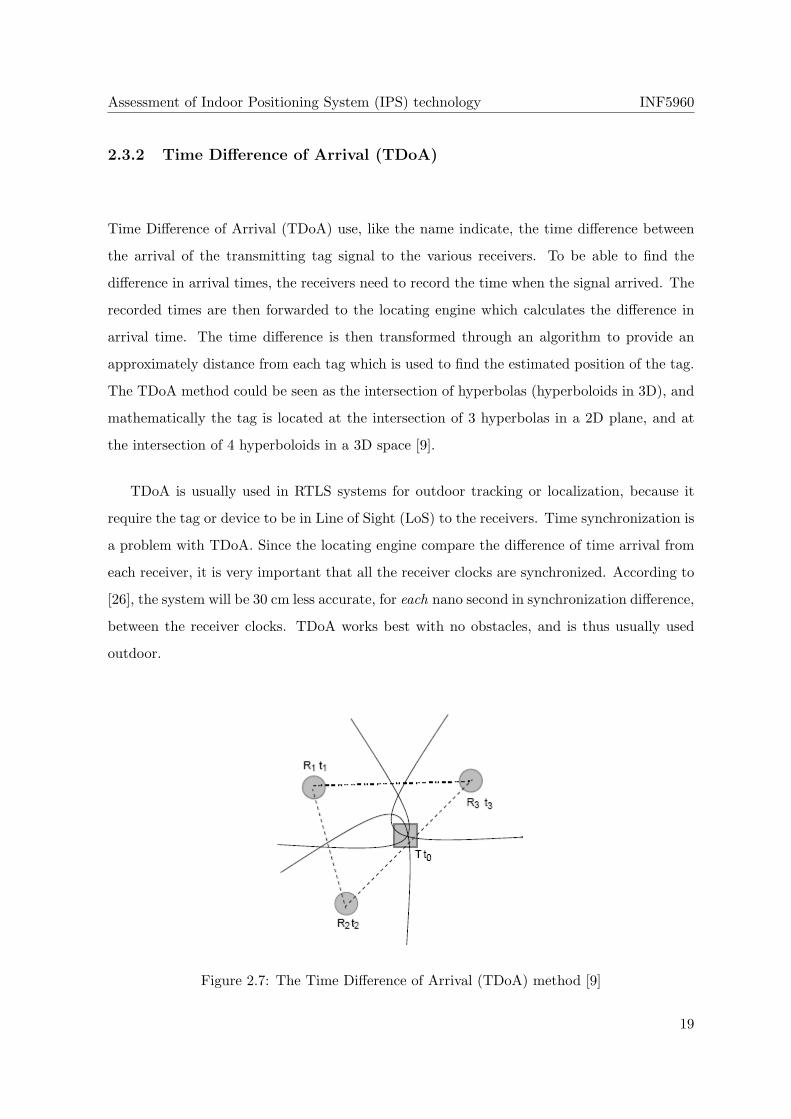
Time Difference of Arrival (TDoA) use, like the name indicate, the time difference between
the arrival of the transmitting tag signal to the various receivers. To be able to find the
difference in arrival times, the receivers need to record the time when the signal arrived. The
recorded times are then forwarded to the locating engine which calculates the difference in
arrival time. The time difference is then transformed through an algorithm to provide an
approximately distance from each tag which is used to find the estimated position of the tag.
The TDoA method could be seen as the intersection of hyperbolas (hyperboloids in 3D), and
mathematically the tag is located at the intersection of 3 hyperbolas in a 2D plane, and at
the intersection of 4 hyperboloids in a 3D space [9].
TDoA is usually used in RTLS systems for outdoor tracking or localization, because it
require the tag or device to be in Line of Sight (LoS) to the receivers. Time synchronization is
a problem with TDoA. Since the locating engine compare the difference of time arrival from
each receiver, it is very important that all the receiver clocks are synchronized. According to
[26], the system will be 30 cm less accurate, for each nano second in synchronization difference,
between the receiver clocks. TDoA works best with no obstacles, and is thus usually used
outdoor.
Figure 2.7: The Time Difference of Arrival (TDoA) method [9]
19

Assessment of Indoor Positioning System (IPS) technology INF5960
2.3.3 Time of Arrival (ToA)
The Time of Arrival (ToA) method, sometimes called Time of Flight (ToF), is a method
based on the measurement of the propagation delay of the radio signal between a transmitter
(tag/device) and one or more receivers (readers/sensors). The propagation delay is basically
the amount of time it takes for a radio signal to travel from a source tag (TX) to its destination
reader (RX) [9]. It can be calculated using t1 − t0, and figure 2.8 shows the basic principle
of ToA. After all receivers in range have calculated its ToA, the ToA values are converted
into distance by multiplying the propagation time (t1− t0) with the propagation speed of the
signal. The distance values are then being used for trilateration. Trilateration requires data
from at least three receivers to work.
Figure 2.8: The Time of Arrival (ToA) method [9]
Since ToA and TDoA share many similarities, they also share the time synchronization
problem. To be able to get the highest possible accuracy when using this method, it is
very important that the calculated propagation delays are comparable. To achieve time
synchronization with precision up to a nanosecond would be very costly, and would result in
a very high cost [9] for the RTLS system.
2.3.4 Angle of Arrival (AoA)
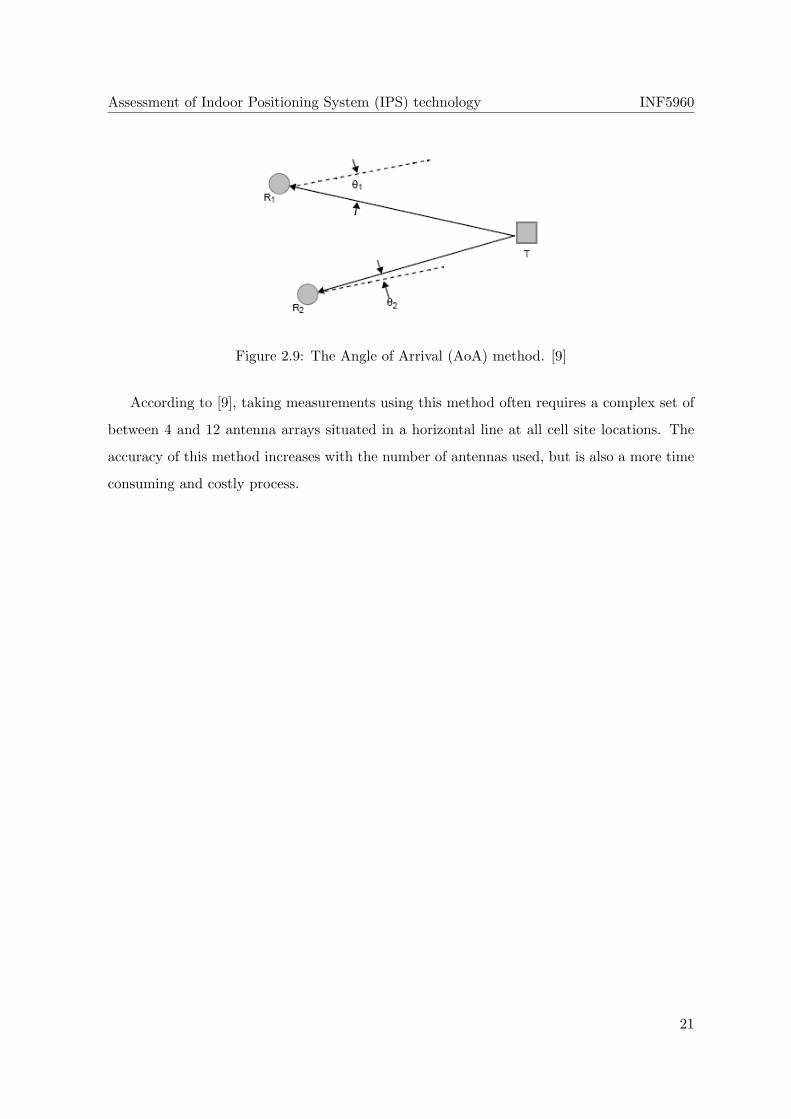
The Angle of Arrival (AoA) method determines the direction of a RF signal propagation
received from a tag at a receiver (reader). This is possible by using direction sensitive antennas
on the receivers [9]. The AoA value is determined by measuring the angle between the received
signal and a pre-defined direction, for instance north. This is illustrated by the readers R1,
R2 and tag T in figure 2.9.
20
Assessment of Indoor Positioning System (IPS) technology INF5960
Figure 2.9: The Angle of Arrival (AoA) method. [9]
According to [9], taking measurements using this method often requires a complex set of
between 4 and 12 antenna arrays situated in a horizontal line at all cell site locations. The
accuracy of this method increases with the number of antennas used, but is also a more time
consuming and costly process.
21

Assessment of Indoor Positioning System (IPS) technology INF5960
22

Chapter 3
Requirements
There are several challenges surrounding IPS systems. The technologies explained in section
2 have different pros and cons, depending on the intended use. Some usage areas have
greater demands to the systems than others, and thus the underlying technology. In this
chapter, several requirements are defined, based on the goal that an IPS system should be
cheap, widely adopted and regulated, but still offer a good coverage and tracking accuracy
to some degree. The importance of each requirement is dependent on the systems intended
use and environment, which in this thesis are people or asset localization in office/class room
environments. Some of the requirements have direct or indirectly relation to one or more of
the other requirements.
3.1 Performance and reliability
3.1.1 Tracking accuracy
Depending on the intended use of a localization system, tracking accuracy may be one of the
most important factors, and is thus a big challenge if there is a demand for high accuracy.
The tracking accuracy differs from 15 cm to 10+ meters, depending on the technology used.
However, the actual precision error in meters are not as important as the ability to deter-
mine what room the tag is in, and this are usually called room separation accuracy. Room
separation accuracy is the likelihood of being in the room the system displays you in. If you
are close to walls, the system may think you are on the other side of the wall (or on another
floor), resulting in an unintended system behavior.
23
Assessment of Indoor Positioning System (IPS) technology INF5960
Requirement: Based on the intended use of a IPS system in this thesis, tracking accuracy
should be at least within 5 meters, with room separation if possible. In other words, first the
correct room should be chosen, and then the estimated accuracy should be no longer then
five meters apart from the real position.
3.1.2 Coverage
Highest possible coverage area for each reader/receiver is important, since it indirectly have
significance to another requirement which will be discussed later; Cost. Higher coverage from
each receiver does also make the deployment easier, since you need less receivers and thus
less cabling and configuration. With a small coverage area on the other hand, each receiver
is more likely to receive signals from transmitting tags, and hence in theory increase the ac-
curacy. This is because there will be more reference points to determine the location of the tag.
Requirement: In this thesis, coverage should be large enough so there wont be any need
for multiple receivers in each room. If there are small office rooms right next to each other,
the receiver should be able to handle more than one room.
3.1.3 Reliable transmission and interference
In positioning, it’s very important for the location engine to get the best available measure-
ments, at any time, so it is able to calculate a tags position based on the best data available.
Interference may lead to lost packets, which can contain ”good” measurements which again
decrease the quality (accuracy) of the calculated position. With a high refresh rate in the
user interface, lost packets may also result in a longer delay before the user interface can show
the new tags position.
The uncertainty in reliable transmission comes from the physical medium used: wireless.
The wireless medium have many advantages, like for instance in this context making posi-
tioning possible, but does also have some drawbacks since it are a shared medium. To cope
with these issues, many technologies have built-in techniques to make sure that two parties
do not transmit at the same time (for example Clear Channel Assessment (CCA) in Wi-Fi),
to avoid possible interference. Interference are still a problem, since this only works for par-
24
Assessment of Indoor Positioning System (IPS) technology INF5960
ties connected to the same receiver. A lot of consumer equipment like wireless phones, PC
equipment and microwave ovens use the same frequencies as many IPS systems, and they can
easily interfere with transmitting tags. It is hard, if not impossible, to remove the interfer-
ence challenge completely, as long as a wireless medium is being used. In most cases a 100%
reliable transmission are not required, the solution is thus to try and minimize the risk for
interference instead.
Requirement: There should not be a major risk for interference, and if there are, it should
not result in a dropped packet limit above 5% of all packets sent.
3.1.4 Fault tolerance
Fault tolerance is another reliability challenge when using IPS. What happens if a receiver
in a given area stops working, and are no longer functioning properly? Usually the receivers
overlap each other to some degree, hence the only problem is that the localization accuracy
has decreased, but not all technologies works through walls. In areas where there are only one
receiver, a worst case scenario could be that a person or asset wearing a tag are no longer able
to be positioned, for instance in case of an emergency. Fault tolerance is hence an important
design consideration and requirement in IPS.
Requirement: To be able to support a good fault tolerance, multiple receivers need to be
able see the tag at any given position.
3.2 Regulations
All wireless technologies transmit and receive on one or more frequencies, occupying the fre-
quencies in use in a given area. Since frequencies are a resource with limited capacity, it needs
to be regulated by each country. Without regulations, wireless systems would have performed
badly since the likelihood of interfering with other systems using the same frequency band
would drastically increase. Although everyone agrees that frequencies should be regulated, it
is done differently in each country. Also, regulations of new technologies in some countries
are delayed compared to others because they want to see what other countries do first.
25
Assessment of Indoor Positioning System (IPS) technology INF5960
Requirement: The chosen technology should be widely adopted by all countries, especially
in Norway, and by that legal to use.
3.3 Standards
Standards make regulation across borders and 3rd party product development easier. It is also
easier to combine IPS systems/technologies when they support common standards. There ex-
ists numerous standardization organizations across the world. The largest organizations are
Federal Communications Commission (FCC) in USA, and ISO/IEC in Europe.
Requirement: There should exist widely adopted standards for the technology.
3.4 Cost
Since IPS systems use different technologies, they also vary in price. Lets take receivers for
example, in addition to the price itself for each entity, the number of devices needed plays a
significant role in the total price. Like pointed out in the Coverage section; the number of
receiver devices needed depends on the coverage area by each receiver, which again affects
the total price of the system.
The level of accuracy dies also play a significant role in the total price. First of all, different
technologies achieve different accuracy, and are thus priced there after. Second of all, it can
be more costly to deploy a IPS system where you want the highest possible accuracy, because
you have to spend a lot of time calibrating the system for optimal use that environment.
Some systems are easier to deploy than others (i.e. ultrasound versus Wi-Fi) since it don’t
need a frequency planning and a thorough calibration beforehand. This does also affect the
total cost of the system.
Requirement: It is hard to set an exact cost limit for an IPS system, since cost is very
relative, it is also depended on the budget you have, the intended use, and so forth. Cost is
therefore in this context discussed in a high level perspective. For example, new technologies
are often more expensive than widely adopted technologies that have been on the market for
26
Assessment of Indoor Positioning System (IPS) technology INF5960
a long time, but does not necessary give more value in relation to its performance. Therefor,
the exact price difference is not relative in this thesis, but the technology gets a plus if the
equipment is cheap.
3.5 Requirement summary
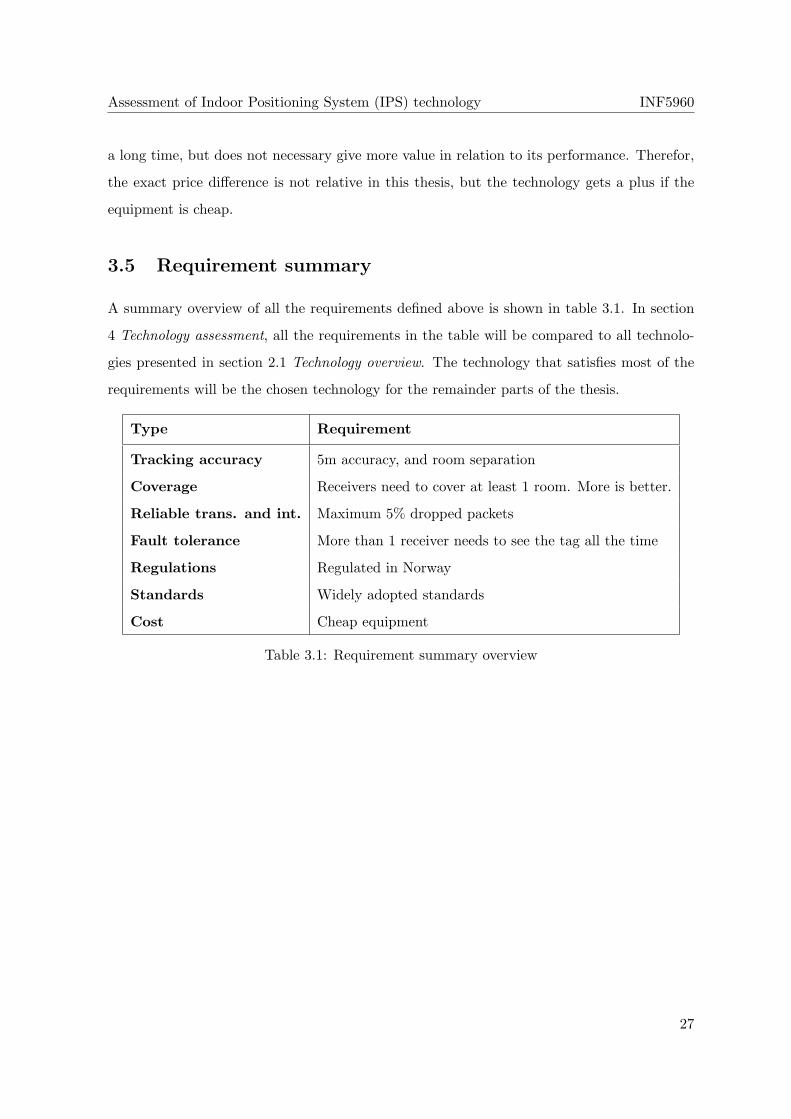
A summary overview of all the requirements defined above is shown in table 3.1. In section
4 Technology assessment, all the requirements in the table will be compared to all technolo-
gies presented in section 2.1 Technology overview. The technology that satisfies most of the
requirements will be the chosen technology for the remainder parts of the thesis.
Type Requirement
Tracking accuracy 5m accuracy, and room separation
Coverage Receivers need to cover at least 1 room. More is better.
Reliable trans. and int. Maximum 5% dropped packets
Fault tolerance More than 1 receiver needs to see the tag all the time
Regulations Regulated in Norway
Standards Widely adopted standards
Cost Cheap equipment
Table 3.1: Requirement summary overview
27

Assessment of Indoor Positioning System (IPS) technology INF5960
28
Chapter 4
Technology assessment
In this chapter, the technologies that was briefly explained in section 2.1 (Technology overview)
will be assessed in relation to the requirements in section 3 (Requirements).
4.1 Radio Frequency Identification (RFID)
RFID is used at small distances to identify people or assets leaving or entering a room/floor,
often called an exciter or chokepoint. The tracking accuracy is therefore limited to room or
floor positioning, and not where you are in that room or floor. While the positioning accuracy
in meters decreases linearly with the size of the room, the room separation accuracy on the
other hand is always 100%, independently of room size. A RFID IPS system alone would not
fulfill the requirement set for tracking accuracy in this thesis.
Coverage is limited in an RFID system since its only purpose is to track a small area.
Usual coverage area for a RFID receiver is approximately 20cm to 3-5m. It does therefore
not meet the coverage requirement.
Depending on the system, RFID may operate at many different frequencies. AeroScouts1
RFID solution for instance operates at 125 kHz[1] where there are low chance for interference.
Because of its low range, the RFID system is not likely to cause interference for other receivers.
RFID does therefore meet the interference requirement set.
The fault tolerance is none existing in RFID systems. If a receiver is not able to perform
its task for some reason, people or assets entering or leaving the room would not be identified.
1http://www.aeroscout.com
29
Assessment of Indoor Positioning System (IPS) technology INF5960
This would result in a wrong position for the person or asset on the user interface. The fault
tolerance requirement is therefore not met.
RFID is not regulated in EU or Norway, but is still legal to use as long as its not interfering
with existing equipment. This is mainly due to RFID’s short range and coverage. However,
[4] indicates that RFID needs to be regulated in the future as the technology and use of the
technology evolves.
There exists numerous standards for RFID, depending on the usage, and the most im-
portant ones are briefly mentioned in section 2.1.1 (RFID). The huge number of different
standardizations may however be a drawback for RFID, since it may result in different ven-
dors using different standards. Despite this, RFID meets the standardization requirement set
in section 3.3.
Although RFID is a widely adopted technology and the cost per product continues to
decrease, it do require a lot of receivers to be deployed in the positioning area. Since all the
doors in an area needs to have a receiver, the total amount of receivers may result in a high
cost. In addition, cabling must be done to each door to connect the receivers to a centralized
engine.
4.2 Wi-Fi
IPS systems based on the Wi-Fi technology usually achieves an tracking accuracy between
3-10m, depending on the environment and the positioning method used. In fixed mode, the
accuracy depends on good models that reflects the environment the system are positioning in.
This is clearly a difficult task and the accuracy are suffering from this. If a mesh map of the
environment is created, with RSSI fingerprints of the entire environment with approximately
1m separation, it is possible to get a tracking accuracy as low as 3m (at average). Wi-Fi
does not however guarantee room or floor separation. This can be solved by combining Wi-Fi
with RFID, or by creating methods that increase the floor separation accuracy by using math
logic. Wi-Fi is almost fulfilling the accuracy requirement.
Depending on the transmitted effect and the environment, the coverage in Wi-Fi systems
are very good. According to the Wi-Fi Alliance2, the Wi-Fi range in a office/light industrial
setting is approximately 30-45m at 11 Mbps. This meets the coverage requirement.2http://www.wi-fi.org/
30
Assessment of Indoor Positioning System (IPS) technology INF5960
Interference is one of the biggest challenges with Wi-Fi. The reason is mainly due to the
frequency band the technology operates in, the ISM band. IEEE 802.11a does however not
use this frequency band, but the use of IEEE 802.11b/g is far superior than the usage of
802.11a. Like mentioned in section 2.2 (Wi-Fi), the ISM band are also being used by other
wireless equipment and can be used by anyone. This can cause interference that may affect
the system significantly. Interference can to some degree be dealt with by doing a thorough
channel planning in the environment you are operating in, but its impossible to control it
completely. Wi-Fi does not satisfy the interference requirement completely.
Since coverage in Wi-Fi systems are very good, there may be overlap between Wi-Fi access
points (AP) which gives a fault tolerance at an acceptable level. A tag needs to be in range
of 3 or more AP’s to be able to be positioned, but because of the good range from each AP
this number may be 4 or more. This makes the Wi-Fi IPS system still able to position a tag
even if one AP should fail. Based on this, the fault tolerance requirement is satisfied.
Wi-Fi is furthermore regulated for use in Norway in the ISM frequency band as mentioned
above. This meet the requirement set.
Moving on to the standard requirement. IEEE 802.11 is the widely adopted standard for
Wi-Fi and is a trademark from the Wi-Fi Alliance for hardware vendors, but it supports the
standard by the IEEE organization. This requirement is therefore satisfied.
Wi-Fi is one of the most widely adopted technology around the world, which have resulted
in cheap hardware. Since Wi-Fi AP’s also have good coverage, there is no need for having
AP’s in all the small rooms. In addition, since most companies already have a wireless network
infrastructure already in place, it is one of the cheapest technologies to use in a IPS system.
4.3 Ultrasound
Tracking accuracy in a ultrasound system is limited to room separation, and not where you are
in the room. The reason for this is because the sound wave sent by the tag doesn’t penetrate
walls, so the only receiver that will hear the sound wave is the receiver in the same room as
the tag. This means that ultrasound only satisfy parts of the tracking accuracy requirement.
The coverage area for each receiver is like stated above, the room the receiver is in, and
nothing more. In theory, a receiver would be able to pick up a sound wave if it was penetrated
through a wall, but this is usually not the case with ultrasound. This is however, also one of
31
Assessment of Indoor Positioning System (IPS) technology INF5960
the advantages with an ultrasound system, depending on the intended use. In this context it
does not satisfy the coverage requirement.
The main challenges in ultrasound communication are the large Doppler shifts, reverber-
ation and background noise [12]. Doppler shift happens when the tag is moving at a given
velocity relative to the receiver, and results in a small change in the wavelength. Reverberation
is the lingering of sound in a room, once the source of the sound has stopped producing[12].
Background noise in a room may be everything from mechanic machines, normal conversa-
tions or music, to tinkling keys and slamming doors. They can all affect the transmission of
sound waves, but the risk is not high. This satisfy the interference requirement.
The fault tolerance is the same in a ultrasound system as in a RFID system. Since the
system depends on one reader in each room/area, the system will position the person or asset
incorrectly if a receiver fails. This does not meet the requirement set.
Ultrasound are only sound waves that propagates through the air, and are therefore not
regulated, at least to the authors knowledge. In addition, there exist no standards for ultra-
sound.
Since ultrasound is only sound, the main components you need are a microphone (receiver)
and a speaker (tag), which is very cheap to make. Cabling are still needed to all the receivers,
since an ultrasound IPS system is a centralized system, but it is still a cheap technology to
use in an IPS system.
4.4 Ultra-Wideband (UWB)
Ultra-Wideband (UWB) is a new technology in IPS context, and there are not many com-
mercial available products at the market. Ubisense3 and Timedomain4 were two of the first
vendors of such products, and according to them an UWB system may provide an accuracy
between 15-30cm at best. This definitely meets the accuracy requirement set.
The coverage area for UWB is limited by output power regulations, but are still able to
reach approximately 50m despite its low power output. This is mainly because its unique
strength to penetrate walls and objects. The coverage requirement is therefore satisfied.
UWB performs very good against interference because it uses short pulses as small as
3http://www.ubisense.com4http://www.timedomain.com
32
Assessment of Indoor Positioning System (IPS) technology INF5960
2ns, which makes the wavelength less than 60cm. This makes the pulse arrive at its desti-
nation before it can self-interference with itself. In addition, UWB are thus resistant against
multipath delays of more than one wavelength. UWB meets the reliable transmission and
interference requirement.
The fault tolerance for UWB is similar to Wi-Fi. Because of a good coverage, and 5-10%
overlap from other receivers, tag positioning should still be possible. The fault tolerance
requirement is therefore met.
UWB may be a big interference source for other systems since it uses a wide range of the
frequency spectrum (3.1-10.6 GHz), which are already regulated for other use. As a result,
use of UWB has been prohibited in most countries. As explained in section 2.4, USA with
FCC were the first to regulate and allow use of UWB systems. Norway have not yet regulated
UWB, and it is therefore illegal to use in Norway at the time being (28.04.2009).
Providing a standard for UWB has been a difficult task, and because of disagreement
in the work for a common IEEE standard there are now two proposals, each provided and
supported by different vendors. The standardization process for UWB will continue, and it is
very likely that a new standard is going to be available in the future. UWB does only partly
satisfy this requirement since the standardization process its still in its early stages.
Since the UWB technology is very new in IPS context, the available products are thus
priced there after. In other words, UWB IPS systems are very costly and is going to stay
that way until the technology and products get more mature.
4.5 Choice of technology
RFID is a simple technology, that makes up an easy and cheap IPS system, but this is also
the drawback. The technology doesn’t achieve high enough ”score” when comparing it to the
requirements in section 3.
Ultrasound satisfy almost the same requirements as RFID, and vice versa. Ultrasound is
also an inexpensive technology, but is only able to achieve room level separation accuracy.
UWB have the best tracking accuracy, but the lack of regulations and standards, in
addition to a high cost, makes it not mature enough for use at the time being. UWB will
however, clearly be the technology for the future when the missing pieces have been sorted
out.
33
Assessment of Indoor Positioning System (IPS) technology INF5960
Based on the requirement set in section 3, the technology that satisfied most of the
requirements are Wi-Fi. Wi-Fi is therefore the chosen technology for the remaining parts
of this thesis. It is also easier to obtain Wi-Fi equipment for testing purposes than the other
technologies assessed. This have also affected the technology decision.
It is inspirational to see that it’s possible to make an IPS system that re-use existing
wireless infrastructures to also perform positioning tasks. Although Wi-Fi offer inexpensive
hardware to IPS systems, it is not the technology with the highest accuracy. This is mainly
because RSSI was never intended to be used in this context. RF fingerprinting increase the
accuracy compared to fixed mode, but since it is a time consuming (and costly) process to
build a fingerprint map, some of the point with cheap hardware disappear. The goal is to
build a test program that uses ”fixed” RSSI models and positioning methods that performs
close to the accuracy given by RF fingerprinting methods (3-5m), but with limited deployment
costs. To be able to test RSSI models and positioning methods, a testing program is needed.
34
Chapter 5
Building a test program
A test platform needs to be built before RSSI models and positioning methods/techniques
can be implemented and tested. Originally, the plan was to code a small program on top of
AeroScout’s API, since we have an AeroScout system available at school. It quickly turned out
however, that the API was only able to give (x, y) coordinates, and not the actual RSSI values.
The coordinates have already been calculated by RSSI algorithms/models implemented by
AeroScout, and it was therefore not possible to do the testing I wanted. As a result, I decided
to build a positioning program from scratch where I could do the testing I wanted.
In this chapter, an explanation is given on how the RSSI values were retrieved before a
positioning program could be build in section 3.1 (How to get RSSI values). In the next
section, the positioning program is presented in section 3.2 (About the framework), and the
different logic and math used to calculate a tags coordinate by the results from the RSSI
models are presented in section 3.3 (Implemented positioning logic).
5.1 How to get RSSI values
Except for minor programming challenges in the making of the test program, the biggest
challenge was by far how to retrieve RSSI values into the program. Of course, without
RSSI values positioning would not be possible, and the program would have had no function.
Finding a solution to this problem were very time consuming and took a huge part of the
total amount of time spent on the entire thesis. The original goal was to be able to locate all
35
Assessment of Indoor Positioning System (IPS) technology INF5960
devices with a Wi-Fi adapter. The first plan was to use SNMP1 to retrieve the RSSI values
from the AP’s. It was however soon clear that the only SNMP MIB2 available on the AP’s
used in this thesis, were only able to pass the RSSI for the associated clients to each AP,
and not all devices/clients in range. Since each client is only able to associate to one AP at
a time, trilateration would be impossible. This could however be solved by making a script
that turns the radio on/off on all AP’s except one, and then change the AP that is on with a
five second interval. This would make the clients automatically connect to the AP that is on,
as long as the same SSID is used. This solution would first of all be very inaccurate, since it
would take a long time before the program has enough RSSI values to perform one position
estimation. Second, this would destroy the possibility to use AP’s for other tasks at the same
time, like Internet or network sharing. The latter is an important point, since making existing
equipment to perform more than one task is one of the main reasons for using Wi-Fi in this
thesis.
Another solution to retrieve RSSI from clients, is to make a software that needs to be
installed on all the clients, which measure how the clients ”sees” all the AP’s. The RSSI
values are then passed to the location engine/server. The first problem with this solution,
is that every AP needs to have different SSID’s. If not, the client only stores the AP with
the best signal strength for the given SSID. The second problem is the need for installing
software on all the clients. It is also unsure how accurate this solution would have been, since
for example a PC with Windows operating system displays the RSSI values in % and not
dBm. The values are therefore needed to be converted, and I was unable to find an accurate
conversion method in my research.
I decided to use tags from AeroScout, which we already had available at school, since they
worked fine in AeroScout’s own Wi-Fi positioning solution. The tags do not associate with
any AP, but transmit beacon packets at given intervals depending on the tag is in motion
or not. The beacon packet is transmitted to the multicast address 010c.cc00.0000. All AP’s
were configured to listen to this multicast address, measure the RSSI from the received packet
and forward a 39 bytes packet to the location server running the positioning framework at
port 12091. There were no documentation of the data packet format available at the web,
to my knowledge. AeroScout didn’t want to help either, and said it was because they had a
1Simple Network Management Protocol2Management Information Base
36
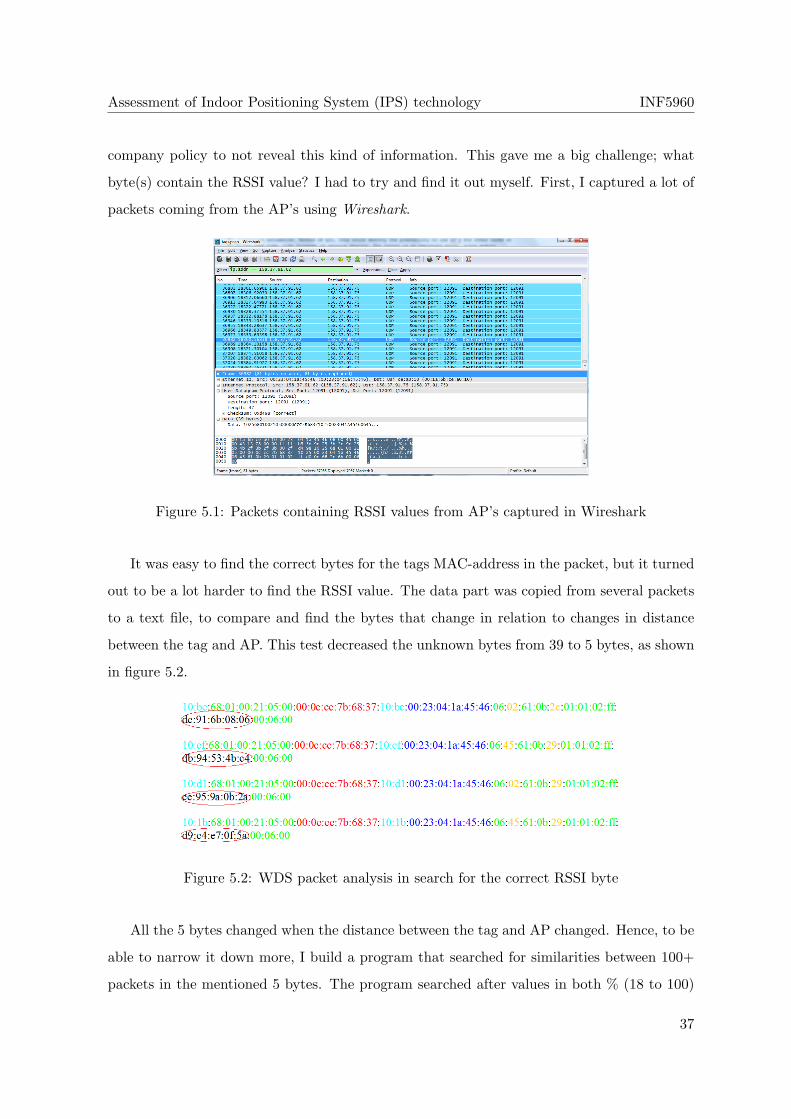
Assessment of Indoor Positioning System (IPS) technology INF5960
company policy to not reveal this kind of information. This gave me a big challenge; what
byte(s) contain the RSSI value? I had to try and find it out myself. First, I captured a lot of
packets coming from the AP’s using Wireshark.
Figure 5.1: Packets containing RSSI values from AP’s captured in Wireshark
It was easy to find the correct bytes for the tags MAC-address in the packet, but it turned
out to be a lot harder to find the RSSI value. The data part was copied from several packets
to a text file, to compare and find the bytes that change in relation to changes in distance
between the tag and AP. This test decreased the unknown bytes from 39 to 5 bytes, as shown
in figure 5.2.
Figure 5.2: WDS packet analysis in search for the correct RSSI byte
All the 5 bytes changed when the distance between the tag and AP changed. Hence, to be
able to narrow it down more, I build a program that searched for similarities between 100+
packets in the mentioned 5 bytes. The program searched after values in both % (18 to 100)
37

Assessment of Indoor Positioning System (IPS) technology INF5960
and dBm3 (-10 to -94), since I didn’t know the correct RSSI value format. I also didn’t know
if I were looking for 7 or 8 bits. 7 bits are needed to represent the numbers mentioned, but 8
bits are needed to represent a signed number. The big question was also, how is that signed
value represented in bits, if the RSSI value is in dBm? Sometimes the first bit represents
an unsigned (0) or a signed (1) value, but the most common method is to use a method
called Two’s complement. All these formats and methods where coded into the ”RSSI-finder”
program and after a while it found similarities in the first byte using all 8 bits, with the dBm
number range and the two’s complement method for binary operations. Figure 5.3 shows a
screenshot of the breakthrough.
Figure 5.3: Finally, the RSSI value ”revealed” itself in the 8 first bits using two’s complement
5.2 About the test program
Building the positioning program from scratch took a lot more time than first expected, but
were at the same time a nice learning process. The total amount of code lines in the program
are approximately 4500 and were written in Microsoft Visual C# (2008). Visual C# were
chosen because it’s the programming language I am most experienced with.
The program can be divided into three main phases: the configuration and calibration
phase, the positioning phase, and the data collection phase. The configuration and calibration
phase is where the user enters all the data needed to find a tags position. In step 1, the user
enters the IP address for all the available access points. A scan is then performed to find any3Effect in decibel (dB) in relation to milliwatt (mW)
38
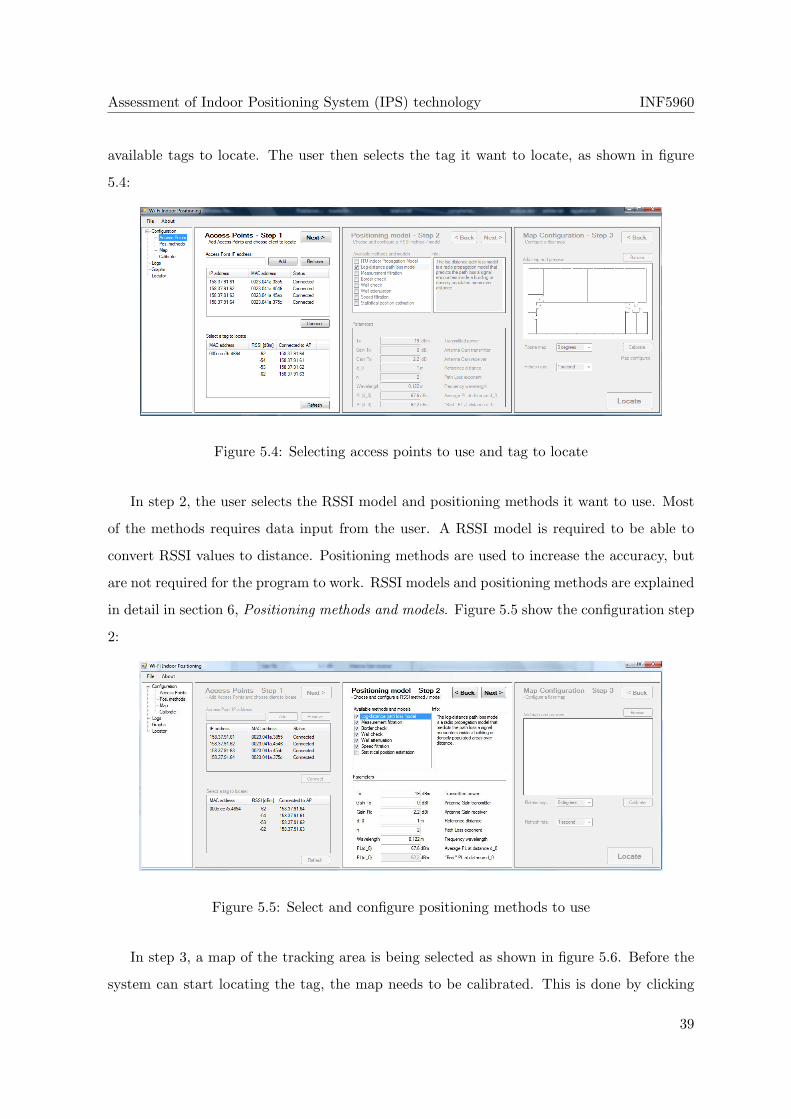
Assessment of Indoor Positioning System (IPS) technology INF5960
available tags to locate. The user then selects the tag it want to locate, as shown in figure
5.4:
Figure 5.4: Selecting access points to use and tag to locate
In step 2, the user selects the RSSI model and positioning methods it want to use. Most
of the methods requires data input from the user. A RSSI model is required to be able to
convert RSSI values to distance. Positioning methods are used to increase the accuracy, but
are not required for the program to work. RSSI models and positioning methods are explained
in detail in section 6, Positioning methods and models. Figure 5.5 show the configuration step
2:
Figure 5.5: Select and configure positioning methods to use
In step 3, a map of the tracking area is being selected as shown in figure 5.6. Before the
system can start locating the tag, the map needs to be calibrated. This is done by clicking
39
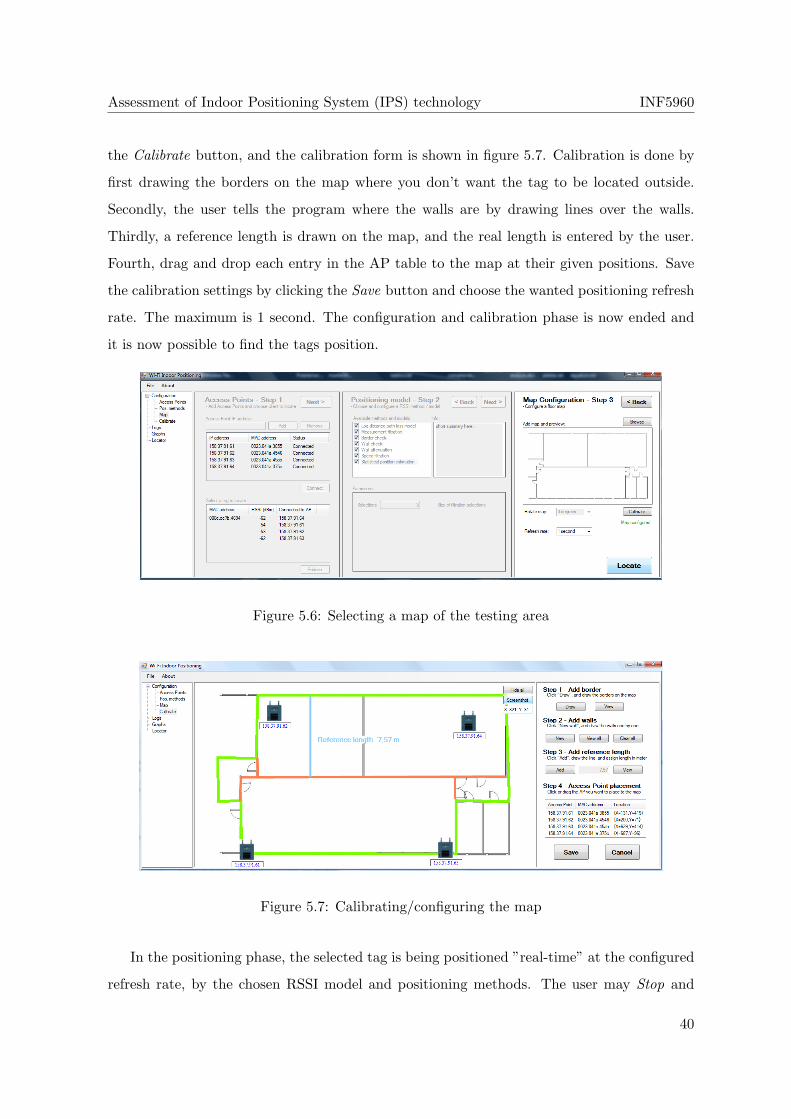
Assessment of Indoor Positioning System (IPS) technology INF5960
the Calibrate button, and the calibration form is shown in figure 5.7. Calibration is done by
first drawing the borders on the map where you don’t want the tag to be located outside.
Secondly, the user tells the program where the walls are by drawing lines over the walls.
Thirdly, a reference length is drawn on the map, and the real length is entered by the user.
Fourth, drag and drop each entry in the AP table to the map at their given positions. Save
the calibration settings by clicking the Save button and choose the wanted positioning refresh
rate. The maximum is 1 second. The configuration and calibration phase is now ended and
it is now possible to find the tags position.
Figure 5.6: Selecting a map of the testing area
Figure 5.7: Calibrating/configuring the map
In the positioning phase, the selected tag is being positioned ”real-time” at the configured
refresh rate, by the chosen RSSI model and positioning methods. The user may Stop and
40
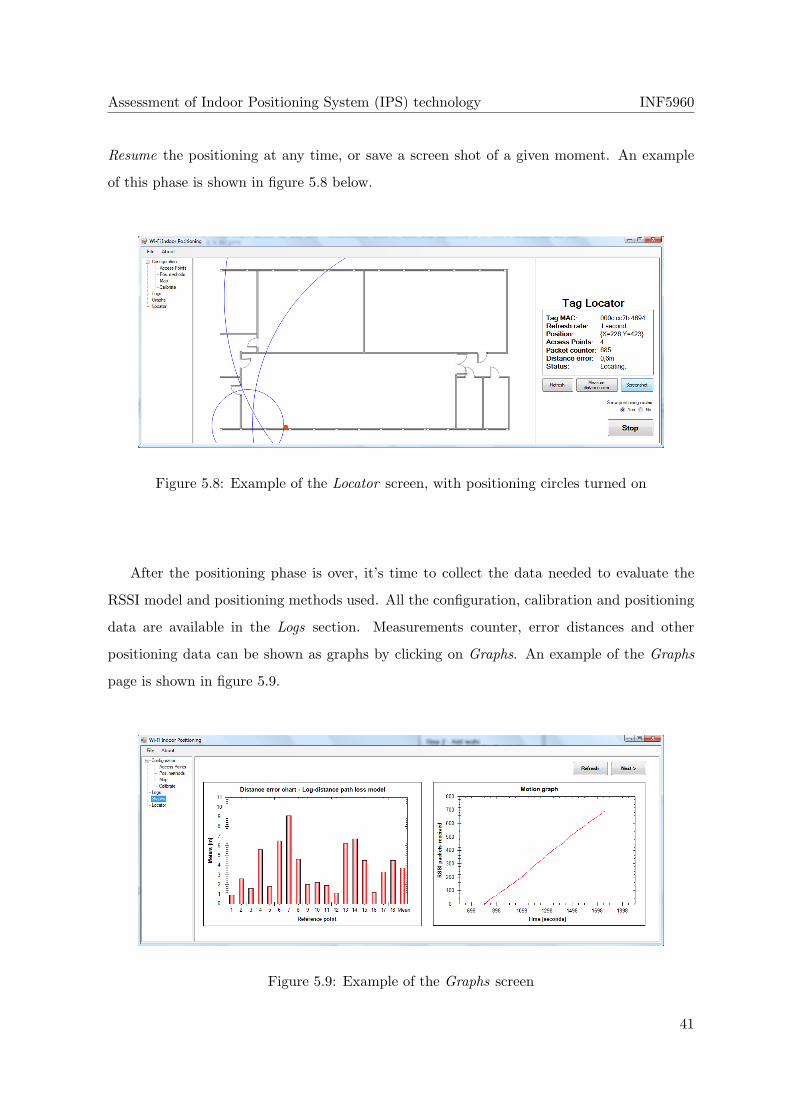
Assessment of Indoor Positioning System (IPS) technology INF5960
Resume the positioning at any time, or save a screen shot of a given moment. An example
of this phase is shown in figure 5.8 below.
Figure 5.8: Example of the Locator screen, with positioning circles turned on
After the positioning phase is over, it’s time to collect the data needed to evaluate the
RSSI model and positioning methods used. All the configuration, calibration and positioning
data are available in the Logs section. Measurements counter, error distances and other
positioning data can be shown as graphs by clicking on Graphs. An example of the Graphs
page is shown in figure 5.9.
Figure 5.9: Example of the Graphs screen
41
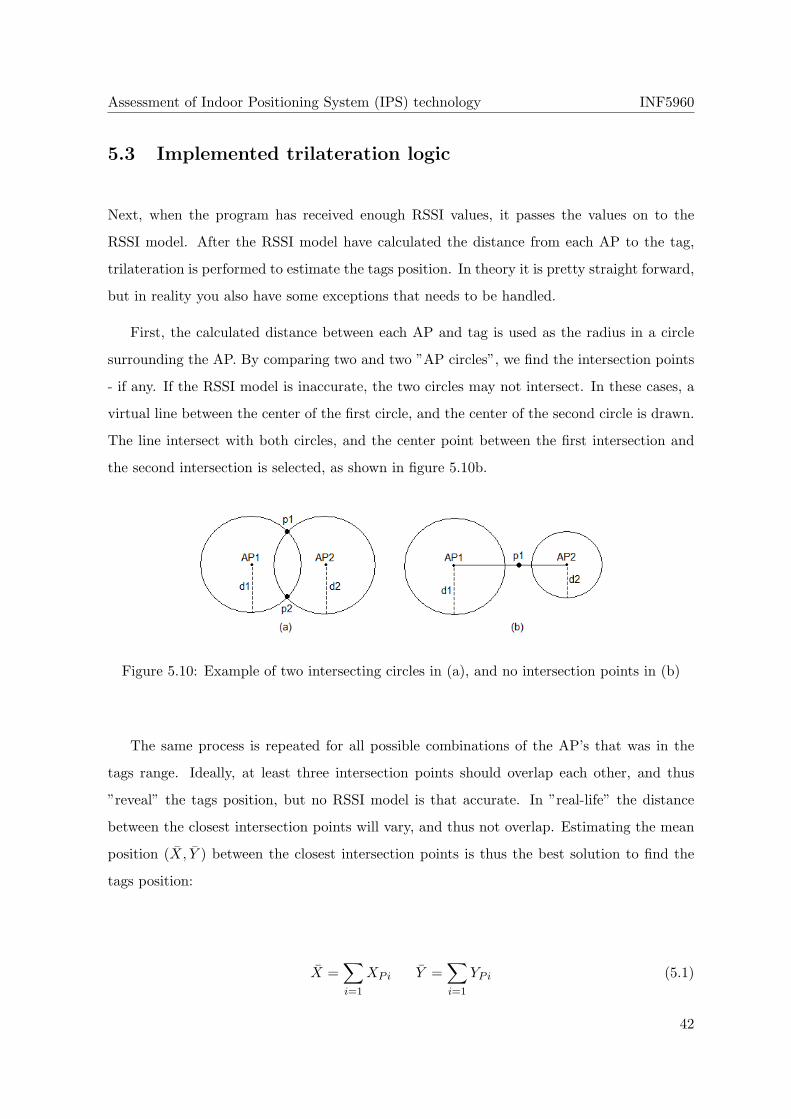
Assessment of Indoor Positioning System (IPS) technology INF5960
5.3 Implemented trilateration logic
Next, when the program has received enough RSSI values, it passes the values on to the
RSSI model. After the RSSI model have calculated the distance from each AP to the tag,
trilateration is performed to estimate the tags position. In theory it is pretty straight forward,
but in reality you also have some exceptions that needs to be handled.
First, the calculated distance between each AP and tag is used as the radius in a circle
surrounding the AP. By comparing two and two ”AP circles”, we find the intersection points
- if any. If the RSSI model is inaccurate, the two circles may not intersect. In these cases, a
virtual line between the center of the first circle, and the center of the second circle is drawn.
The line intersect with both circles, and the center point between the first intersection and
the second intersection is selected, as shown in figure 5.10b.
Figure 5.10: Example of two intersecting circles in (a), and no intersection points in (b)
The same process is repeated for all possible combinations of the AP’s that was in the
tags range. Ideally, at least three intersection points should overlap each other, and thus
”reveal” the tags position, but no RSSI model is that accurate. In ”real-life” the distance
between the closest intersection points will vary, and thus not overlap. Estimating the mean
position (X, Y ) between the closest intersection points is thus the best solution to find the
tags position:
X =∑i=1
XPi Y =∑i=1
YPi (5.1)
42
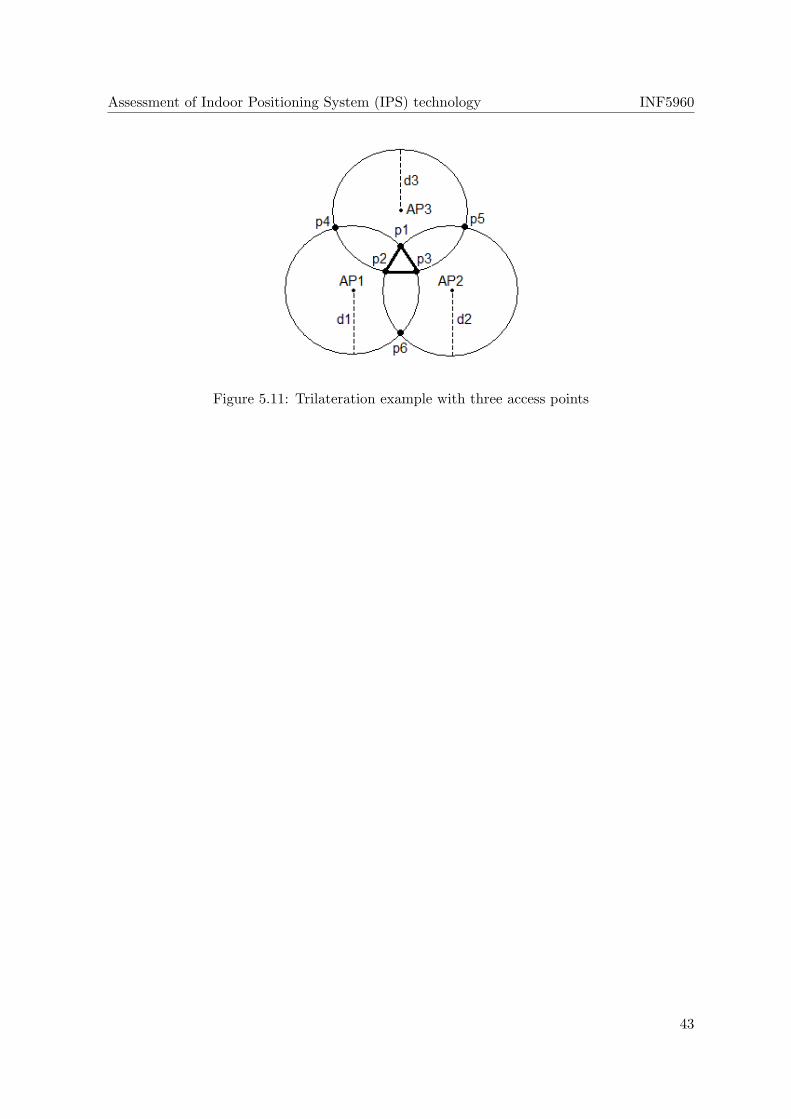
Assessment of Indoor Positioning System (IPS) technology INF5960
Figure 5.11: Trilateration example with three access points
43

Assessment of Indoor Positioning System (IPS) technology INF5960
44
Chapter 6
Positioning methods and models
In this chapter, different RSSI models and positioning methods are discussed. The positioning
methods try to increase the accuracy of the RSSI model. First, the RSSI model Log-distance
path loss model is discussed in section 6.1. Then, different positioning methods are proposed
in section 6.2-6.7, ending with a summary in section 6.8.
6.1 Log-distance path loss model
The log-distance path loss model is a radio propagation model that predicts the path loss
a signal encounters in a given environment over distance. Propagation models such as this
one show that the average received signal strength decreases logarithmically with distance[8].
Since the received signal strength is measured by the AP’s, the model is able to predict an
approximate distance by comparing the received signal strength with the transmitted signal
minus the predicted signal loss.
Log-distance path loss model is based on the Friis free-space equation[25], which gives the
received power in free-space at distance d, with transmission power Ptx, antenna gain (Gt and
Gr) at transmitter and receiver side, and with wavelength λ. The Friis free-space equation:
Prcvd(d) =Ptx ·Gt ·Gr · λ2
(4π)2 · d2 · L=Ptx ·Gt ·Gr · λ2
(4π)2 · d20 · L
·(d0
d
)2
= Prcvd(d0) ·(d0
d
)2
(6.1)
Distance d has to be bigger than d0, since d0 is a reference distance depending on the
antenna technology. The exponential value 2 is for free space, so by changing the parameter
45
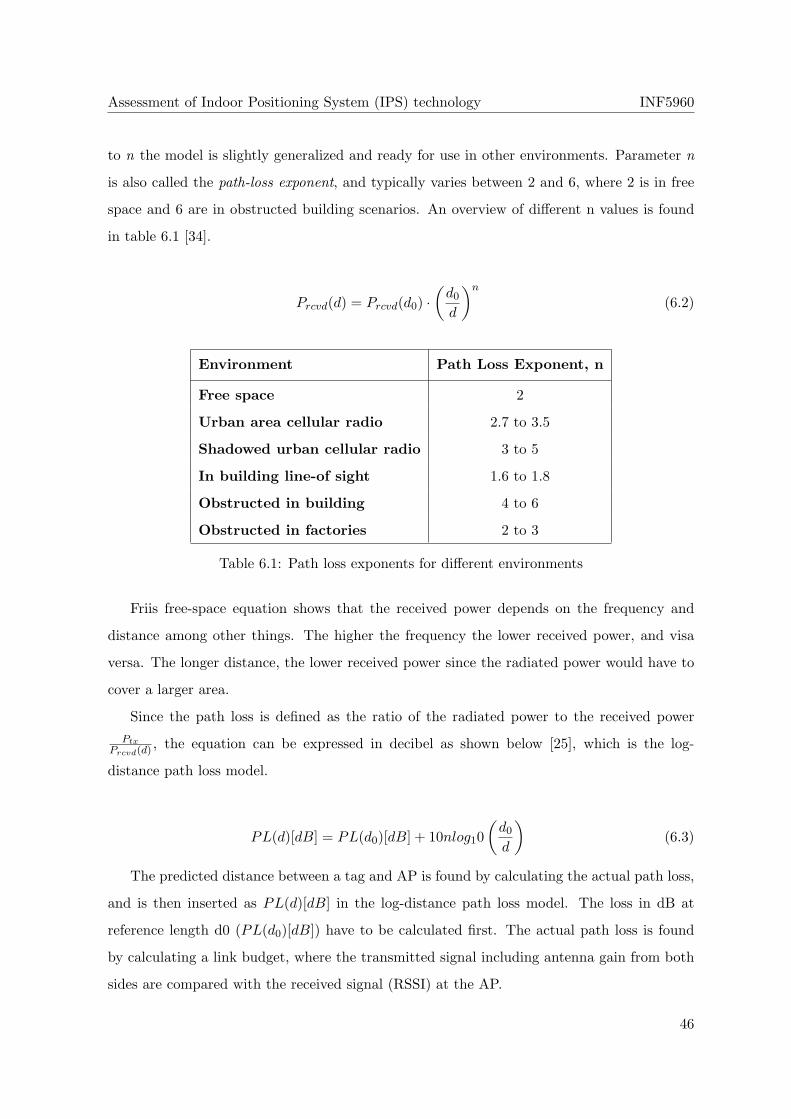
Assessment of Indoor Positioning System (IPS) technology INF5960
to n the model is slightly generalized and ready for use in other environments. Parameter n
is also called the path-loss exponent, and typically varies between 2 and 6, where 2 is in free
space and 6 are in obstructed building scenarios. An overview of different n values is found
in table 6.1 [34].
Prcvd(d) = Prcvd(d0) ·(d0
d
)n
(6.2)
Environment Path Loss Exponent, n
Free space 2
Urban area cellular radio 2.7 to 3.5
Shadowed urban cellular radio 3 to 5
In building line-of sight 1.6 to 1.8
Obstructed in building 4 to 6
Obstructed in factories 2 to 3
Table 6.1: Path loss exponents for different environments
Friis free-space equation shows that the received power depends on the frequency and
distance among other things. The higher the frequency the lower received power, and visa
versa. The longer distance, the lower received power since the radiated power would have to
cover a larger area.
Since the path loss is defined as the ratio of the radiated power to the received powerPtx
Prcvd(d) , the equation can be expressed in decibel as shown below [25], which is the log-
distance path loss model.
PL(d)[dB] = PL(d0)[dB] + 10nlog10(d0
d
)(6.3)
The predicted distance between a tag and AP is found by calculating the actual path loss,
and is then inserted as PL(d)[dB] in the log-distance path loss model. The loss in dB at
reference length d0 (PL(d0)[dB]) have to be calculated first. The actual path loss is found
by calculating a link budget, where the transmitted signal including antenna gain from both
sides are compared with the received signal (RSSI) at the AP.
46
Assessment of Indoor Positioning System (IPS) technology INF5960
d = d0 · 10
Ptx − Prx +Gtx +Grx − PL(d0)10n
(6.4)
Log-distance path loss model is a very simple model, and the only value that reflects
possible obstructions in the environment are the path loss exponent n. Instead of predicting
the loss in a given environment, the path loss exponent n is often ”tuned” in beforehand to
the right value to represent the path loss in the given environment. The model gives however,
some level of accuracy in open environments. Several positioning methods will be made and
used together with this model to try and increase the accuracy.
6.2 Measurement filtration method
When using RSSI values as input parameter in positioning models, one of the challenges
is the big fluctuations in the received values, even at small changes in the tags position.
Sometimes, the tag doesn’t even have to move for the RSSI value to change. Changes in
the environment has just enough impact on the measured RSSI value as the changes in the
tags own position. Changes in the environment could be door being closed, people walking
around or interference. The program receives therefore a lot of RSSI measurements that do
not give a good picture of the real change in the tags position. This results in a lot of position
estimation based on false data. Hence, the program need to have some sort of logic to filter
out poor RSSI measurements before the program passes the values on to the RSSI models.
Therefor, a method named measurement filtration were created, which saves the last RSSI
measurements from each AP in a table. Two options are available. The program can be told
to always use the best RSSI measurement in this table, or the mean value. When a new
measurement is available, delete the oldest one and put the new measurement in the table.
The table size differs from when the tag is in motion or not. When the tag is in motion, the
AP receives a new packet every second and is able to measure the RSSI every second. If the
table were too big (i.e. 50+ measurements) and the tag were in motion, the RSSI values gets
”old” very fast, and old measurements do not give a good picture of the new position. When
the tag is not moving, the refresh rate of RSSI values are 10 seconds, and the best possible
measurement available in a long time frame should be used since its not moving. Interference
47
Assessment of Indoor Positioning System (IPS) technology INF5960
does usually result in worse RSSI values than expected, and not better. It is possible to
get better measurements than you should because of interference, but my own measurements
(see appendix A) shows that this is rare. The best RSSI value would therefore often give the
best picture of the tags position. Both the mean and ”best” filtration option available in this
method would also make the RSSI fluctuations less visible to the user while the tag is not in
motion. The table size is set to 3 measurements when the tag is in motion, and dynamically
increasing to ∞ when it is not in motion, by looking the time difference between the last two
received measurements.
6.3 Wall attenuation method
Since the log-distance path loss model do not take into account signal attenuation for walls,
a method named wall attenuation were created. The method performs two tasks; first the
method finds the AP with the highest (”best”) RSSI value, and adds the wall attenuation to
the RSSI measurement from the other AP’s that is entered into the testing program. The
reason for this is that the system do not know where the tag is, and thus not know how many
walls there are between the tag and the AP. Since there usually are only one AP in each
room, it assumes that the AP with the highest RSSI value is in that room in this first phase,
and the AP in this room do not add any attenuation. This will not always be true, but some
assumptions must be made to add wall attenuation to the measurements. The goal in the
first step is not to estimate the correct position, but to increase the probability to estimate a
position in the correct room.
After the first step, trilateration is then performed to estimate the tags room and position
in that room. In step two of the wall attenuation method, the exact number of walls between
the estimated position and each AP are counted. If there were more readers in the same
room as the tag, the attenuation added in step one is removed. If there are more than one
wall between the tag and AP, more attenuation is added in relation to the counted number of
walls. Trilateration is once again performed after this step, and the estimated position should
hopefully be more accurate.
48
Assessment of Indoor Positioning System (IPS) technology INF5960
6.4 Border check method
Although the measurement filtration method minimizes the significance of the worst RSSI
measurements, there are cases where even the best RSSI measurement is not a good one. In
other words, the best or mean RSSI measurement(s) may not always represent the correct
signal loss, and the given distance from the tag to the access point. In a trilateration process,
this would result in an in-accurate position estimation even when the two other measurements
are correct. Hence, to try and correct this, a method named border check were created. The
method performs two different tasks, and is thus a two-step phase. The first phase checks
each estimated distance from each AP with the longest possible distance on the map. If the
estimated distance is longer, it is changed to the max distance. After the first phase are done
for all AP’s, trilateration is then performed.
After the estimated position is known, the second phase determines whether the position
is inside or outside the border drawn in the map calibration. Since the border drawn can
be seen as a polygon, a method in computational geometry called Point-In-Polygon (PIP) is
used. A polygon is defined as a plane figure that is bounded by a closed path, composed of
a finite sequence of straight line segments. Point-In-Polygon checks whether a given point in
the plane is inside or outside the border of the closed polygon. This is done by counting how
many borders that needs to be crossed between a point entirely on the border of the map
or figure, and to the position we want to check. If the number is un-even (1,3,5, etc.), the
point is inside the border/polygon and the function returns true. If the counted number is
even, (2, 4, 6, etc.) the point is outside the border/polygon and the function returns false. A
Point-In-Polygon example is shown in figure 6.1. If the function returns false, a new function
measures the closest point inside the border/polygon, from the estimated position point. The
tags estimated position is then replaced with the new estimated position inside the border.
49
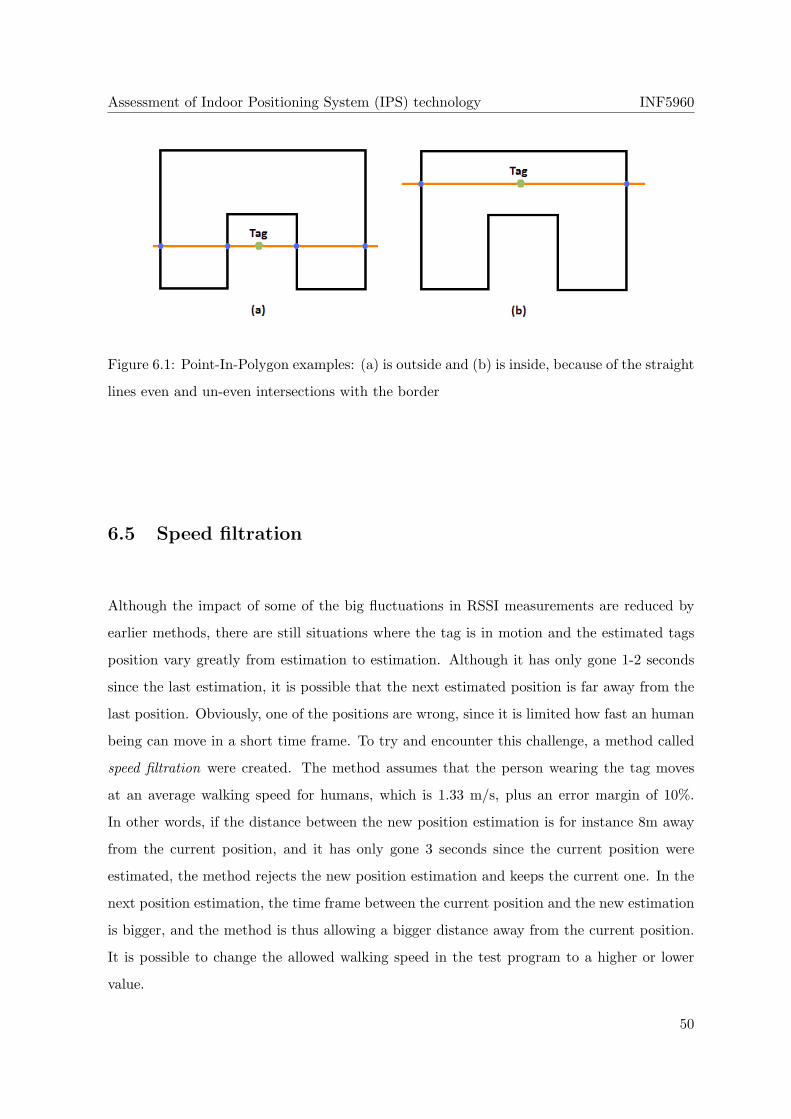
Assessment of Indoor Positioning System (IPS) technology INF5960
Figure 6.1: Point-In-Polygon examples: (a) is outside and (b) is inside, because of the straight
lines even and un-even intersections with the border
6.5 Speed filtration
Although the impact of some of the big fluctuations in RSSI measurements are reduced by
earlier methods, there are still situations where the tag is in motion and the estimated tags
position vary greatly from estimation to estimation. Although it has only gone 1-2 seconds
since the last estimation, it is possible that the next estimated position is far away from the
last position. Obviously, one of the positions are wrong, since it is limited how fast an human
being can move in a short time frame. To try and encounter this challenge, a method called
speed filtration were created. The method assumes that the person wearing the tag moves
at an average walking speed for humans, which is 1.33 m/s, plus an error margin of 10%.
In other words, if the distance between the new position estimation is for instance 8m away
from the current position, and it has only gone 3 seconds since the current position were
estimated, the method rejects the new position estimation and keeps the current one. In the
next position estimation, the time frame between the current position and the new estimation
is bigger, and the method is thus allowing a bigger distance away from the current position.
It is possible to change the allowed walking speed in the test program to a higher or lower
value.
50
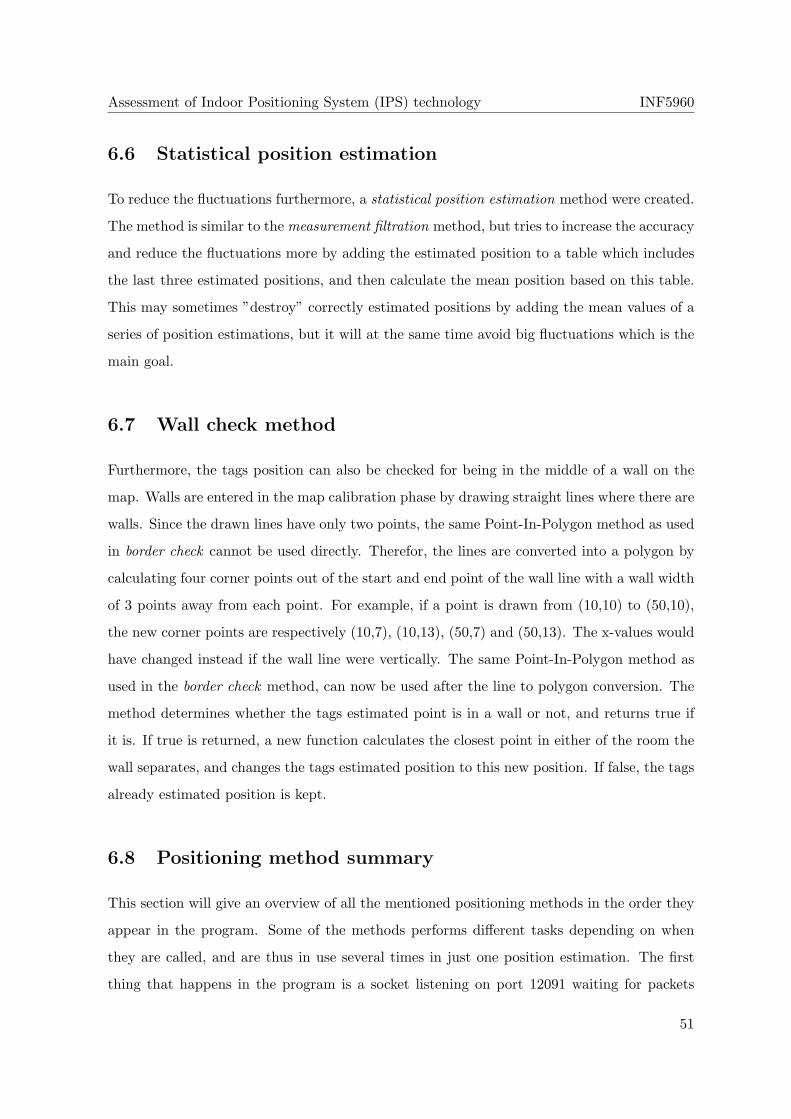
Assessment of Indoor Positioning System (IPS) technology INF5960
6.6 Statistical position estimation
To reduce the fluctuations furthermore, a statistical position estimation method were created.
The method is similar to the measurement filtration method, but tries to increase the accuracy
and reduce the fluctuations more by adding the estimated position to a table which includes
the last three estimated positions, and then calculate the mean position based on this table.
This may sometimes ”destroy” correctly estimated positions by adding the mean values of a
series of position estimations, but it will at the same time avoid big fluctuations which is the
main goal.
6.7 Wall check method
Furthermore, the tags position can also be checked for being in the middle of a wall on the
map. Walls are entered in the map calibration phase by drawing straight lines where there are
walls. Since the drawn lines have only two points, the same Point-In-Polygon method as used
in border check cannot be used directly. Therefor, the lines are converted into a polygon by
calculating four corner points out of the start and end point of the wall line with a wall width
of 3 points away from each point. For example, if a point is drawn from (10,10) to (50,10),
the new corner points are respectively (10,7), (10,13), (50,7) and (50,13). The x-values would
have changed instead if the wall line were vertically. The same Point-In-Polygon method as
used in the border check method, can now be used after the line to polygon conversion. The
method determines whether the tags estimated point is in a wall or not, and returns true if
it is. If true is returned, a new function calculates the closest point in either of the room the
wall separates, and changes the tags estimated position to this new position. If false, the tags
already estimated position is kept.
6.8 Positioning method summary
This section will give an overview of all the mentioned positioning methods in the order they
appear in the program. Some of the methods performs different tasks depending on when
they are called, and are thus in use several times in just one position estimation. The first
thing that happens in the program is a socket listening on port 12091 waiting for packets
51
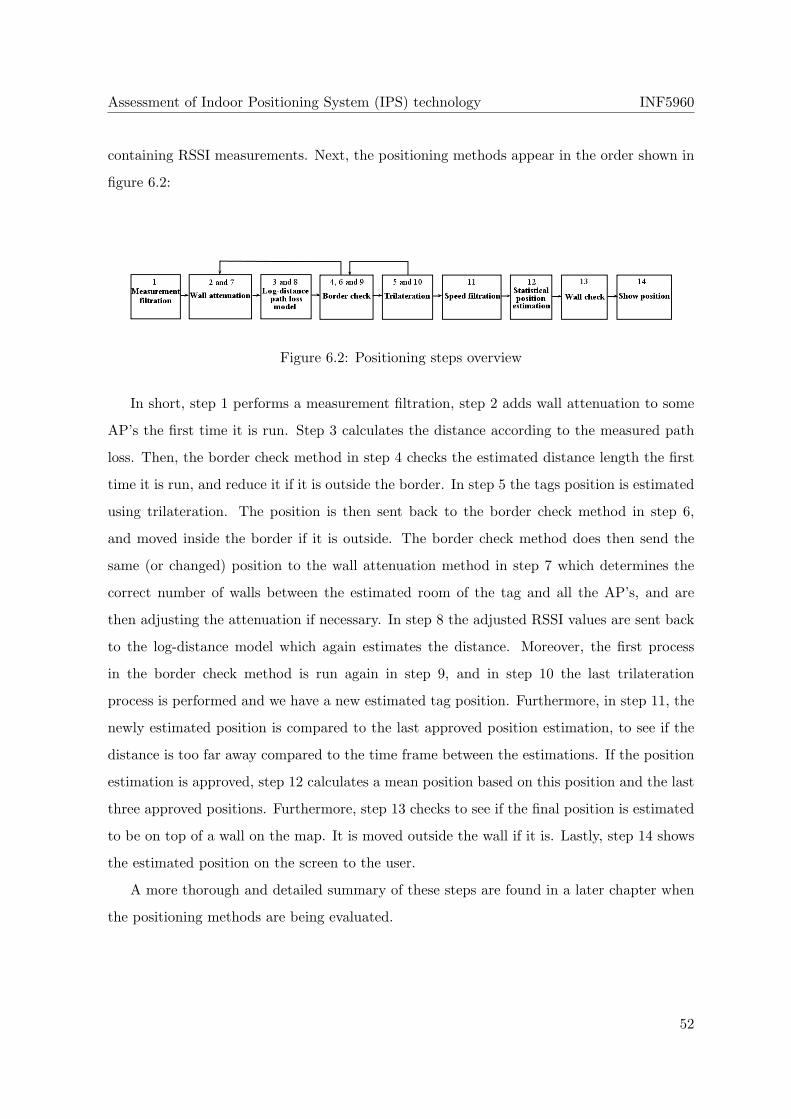
Assessment of Indoor Positioning System (IPS) technology INF5960
containing RSSI measurements. Next, the positioning methods appear in the order shown in
figure 6.2:
Figure 6.2: Positioning steps overview
In short, step 1 performs a measurement filtration, step 2 adds wall attenuation to some
AP’s the first time it is run. Step 3 calculates the distance according to the measured path
loss. Then, the border check method in step 4 checks the estimated distance length the first
time it is run, and reduce it if it is outside the border. In step 5 the tags position is estimated
using trilateration. The position is then sent back to the border check method in step 6,
and moved inside the border if it is outside. The border check method does then send the
same (or changed) position to the wall attenuation method in step 7 which determines the
correct number of walls between the estimated room of the tag and all the AP’s, and are
then adjusting the attenuation if necessary. In step 8 the adjusted RSSI values are sent back
to the log-distance model which again estimates the distance. Moreover, the first process
in the border check method is run again in step 9, and in step 10 the last trilateration
process is performed and we have a new estimated tag position. Furthermore, in step 11, the
newly estimated position is compared to the last approved position estimation, to see if the
distance is too far away compared to the time frame between the estimations. If the position
estimation is approved, step 12 calculates a mean position based on this position and the last
three approved positions. Furthermore, step 13 checks to see if the final position is estimated
to be on top of a wall on the map. It is moved outside the wall if it is. Lastly, step 14 shows
the estimated position on the screen to the user.
A more thorough and detailed summary of these steps are found in a later chapter when
the positioning methods are being evaluated.
52
Chapter 7
Test setup
In this chapter, a presentation of the test area is found in section 7.1, Test area, overview of
the equipment and hardware used is found in section 7.2, furthermore are the configuration
of the equipment and testing program found in respectively section 7.3 and 7.4.
7.1 Test area
All the testing are being performed in a test area with size 28,5m x 14,5m which contains one
classroom, two labs and two hallways at the Bergen University College. Some of the rooms
are separated by wooden walls, and some of the walls have areas with brick/concrete. All the
rooms have wooden doors. Furthermore, each room has several big windows along side one of
the sides. In addition, each room has been given a number, so its easier to understand which
room is which before they are explained further:
Room type Room number
Classroom 2
Labs 3 and 4
Hallways 1 and 5
Table 7.1: Room number overview
The classroom contain normal classroom interior like desks. The two labs have in addition
to desks, also some cabinets. Especially the lab in room 3 on the map, which have cabinets
along side the entire wall between room 3 and 4, in addition to three iron cabinets placed in
53
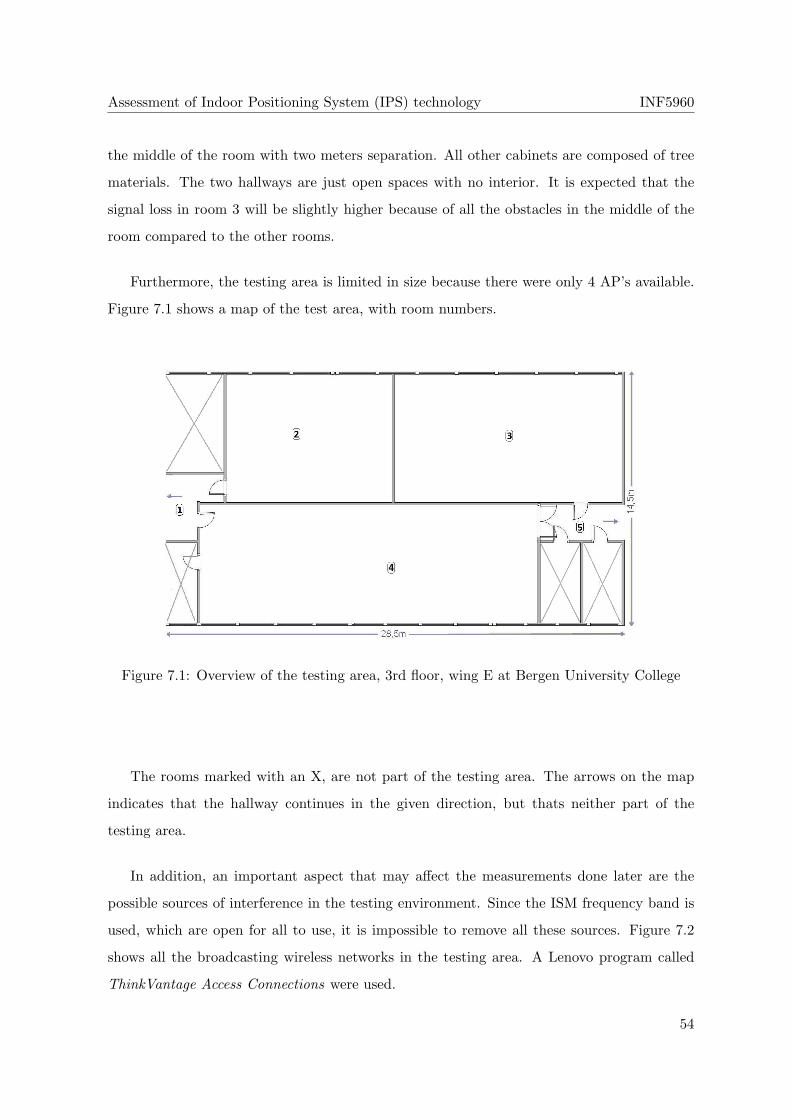
Assessment of Indoor Positioning System (IPS) technology INF5960
the middle of the room with two meters separation. All other cabinets are composed of tree
materials. The two hallways are just open spaces with no interior. It is expected that the
signal loss in room 3 will be slightly higher because of all the obstacles in the middle of the
room compared to the other rooms.
Furthermore, the testing area is limited in size because there were only 4 AP’s available.
Figure 7.1 shows a map of the test area, with room numbers.
Figure 7.1: Overview of the testing area, 3rd floor, wing E at Bergen University College
The rooms marked with an X, are not part of the testing area. The arrows on the map
indicates that the hallway continues in the given direction, but thats neither part of the
testing area.
In addition, an important aspect that may affect the measurements done later are the
possible sources of interference in the testing environment. Since the ISM frequency band is
used, which are open for all to use, it is impossible to remove all these sources. Figure 7.2
shows all the broadcasting wireless networks in the testing area. A Lenovo program called
ThinkVantage Access Connections were used.
54
Assessment of Indoor Positioning System (IPS) technology INF5960
Figure 7.2: Overview of wireless networks in the testing area, seen by ThinkVantage Access
Conn.
All the testing were done late in the evening in an attempt to reduce the surrounding
wireless networks impact on the results. Hence, its likely that the only interference from
these wireless networks are the broadcasted SSID1 beacons which are transmitted at given
intervals. Furthermore, there are to my knowledge, no other equipment in the testing area
which occupies the same frequency band at the time of the testing.
7.2 Equipment and hardware used
An overview of the equipment and hardware used in the testing will be given in this section.
First, four Cisco 1242AG Access Points were used as seen in figure 7.3, with two omni-
directional antennas at each AP with a 2.2 dBi gain.
Figure 7.3: Cicso 1232AG Access Point and 2.2 dBi omni-directional antenna
Furthermore, an 8-port Cisco Catalyst 2940 switch as seen in figure 7.4 were used to
connect the AP’s and the location server together, with a port speed of 100 Mbits/s.1Service Set Identifier
55
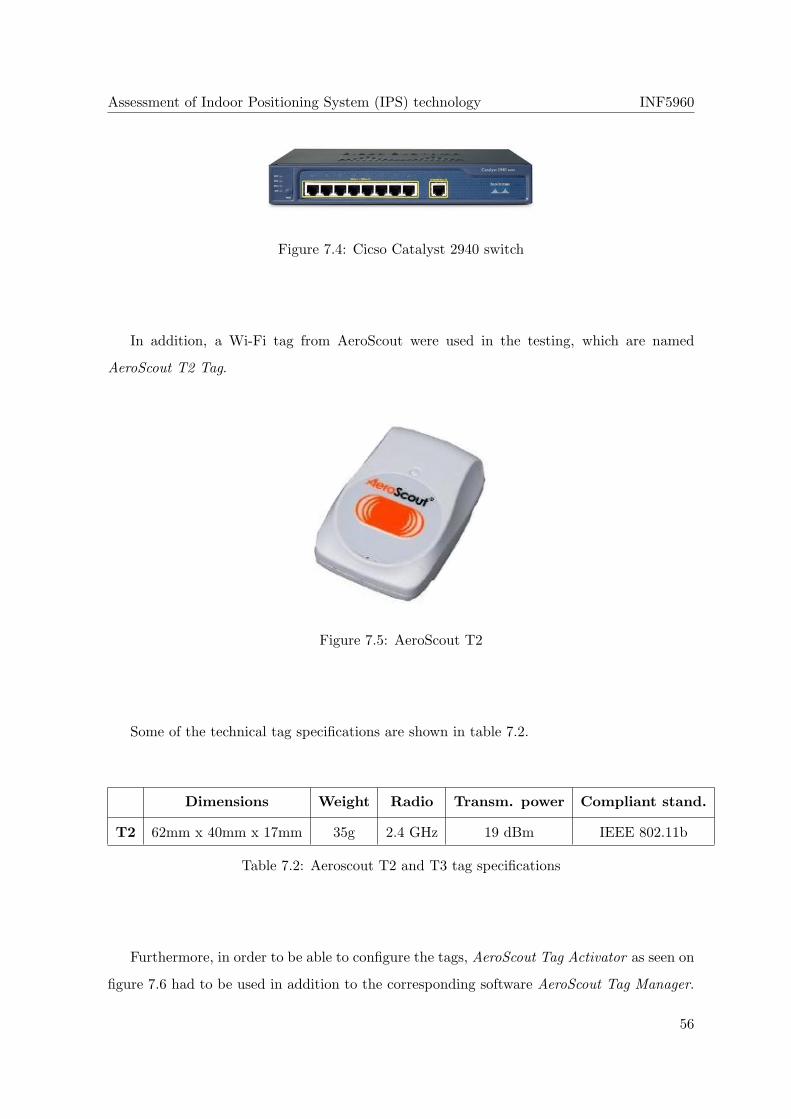
Assessment of Indoor Positioning System (IPS) technology INF5960
Figure 7.4: Cicso Catalyst 2940 switch
In addition, a Wi-Fi tag from AeroScout were used in the testing, which are named
AeroScout T2 Tag.
Figure 7.5: AeroScout T2
Some of the technical tag specifications are shown in table 7.2.
Dimensions Weight Radio Transm. power Compliant stand.
T2 62mm x 40mm x 17mm 35g 2.4 GHz 19 dBm IEEE 802.11b
Table 7.2: Aeroscout T2 and T3 tag specifications
Furthermore, in order to be able to configure the tags, AeroScout Tag Activator as seen on
figure 7.6 had to be used in addition to the corresponding software AeroScout Tag Manager.
56
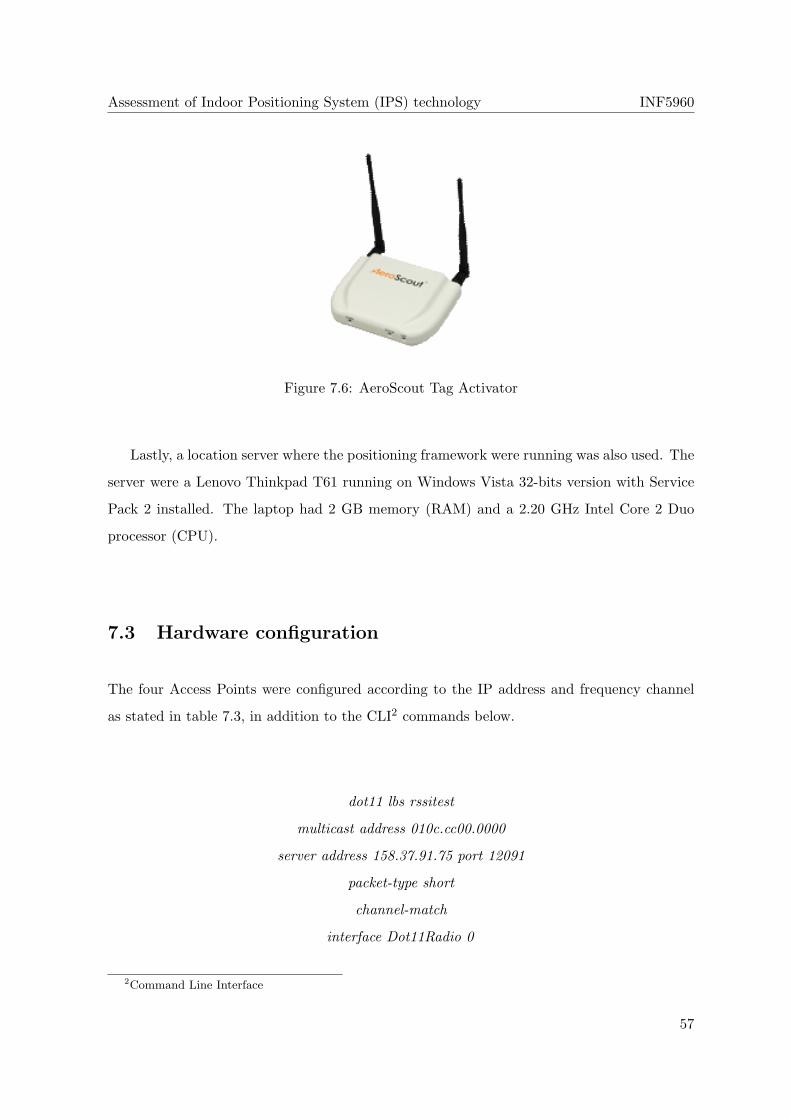
Assessment of Indoor Positioning System (IPS) technology INF5960
Figure 7.6: AeroScout Tag Activator
Lastly, a location server where the positioning framework were running was also used. The
server were a Lenovo Thinkpad T61 running on Windows Vista 32-bits version with Service
Pack 2 installed. The laptop had 2 GB memory (RAM) and a 2.20 GHz Intel Core 2 Duo
processor (CPU).
7.3 Hardware configuration
The four Access Points were configured according to the IP address and frequency channel
as stated in table 7.3, in addition to the CLI2 commands below.
dot11 lbs rssitest
multicast address 010c.cc00.0000
server address 158.37.91.75 port 12091
packet-type short
channel-match
interface Dot11Radio 0
2Command Line Interface
57
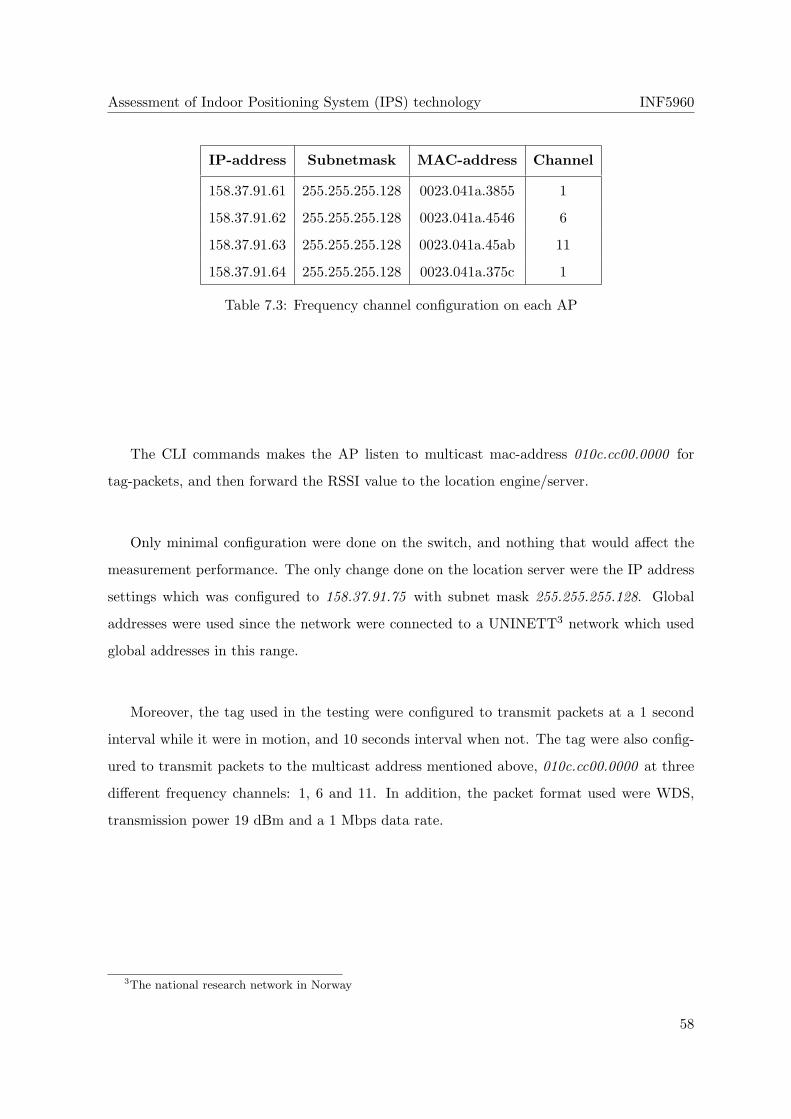
Assessment of Indoor Positioning System (IPS) technology INF5960
IP-address Subnetmask MAC-address Channel
158.37.91.61 255.255.255.128 0023.041a.3855 1
158.37.91.62 255.255.255.128 0023.041a.4546 6
158.37.91.63 255.255.255.128 0023.041a.45ab 11
158.37.91.64 255.255.255.128 0023.041a.375c 1
Table 7.3: Frequency channel configuration on each AP
The CLI commands makes the AP listen to multicast mac-address 010c.cc00.0000 for
tag-packets, and then forward the RSSI value to the location engine/server.
Only minimal configuration were done on the switch, and nothing that would affect the
measurement performance. The only change done on the location server were the IP address
settings which was configured to 158.37.91.75 with subnet mask 255.255.255.128. Global
addresses were used since the network were connected to a UNINETT3 network which used
global addresses in this range.
Moreover, the tag used in the testing were configured to transmit packets at a 1 second
interval while it were in motion, and 10 seconds interval when not. The tag were also config-
ured to transmit packets to the multicast address mentioned above, 010c.cc00.0000 at three
different frequency channels: 1, 6 and 11. In addition, the packet format used were WDS,
transmission power 19 dBm and a 1 Mbps data rate.
3The national research network in Norway
58
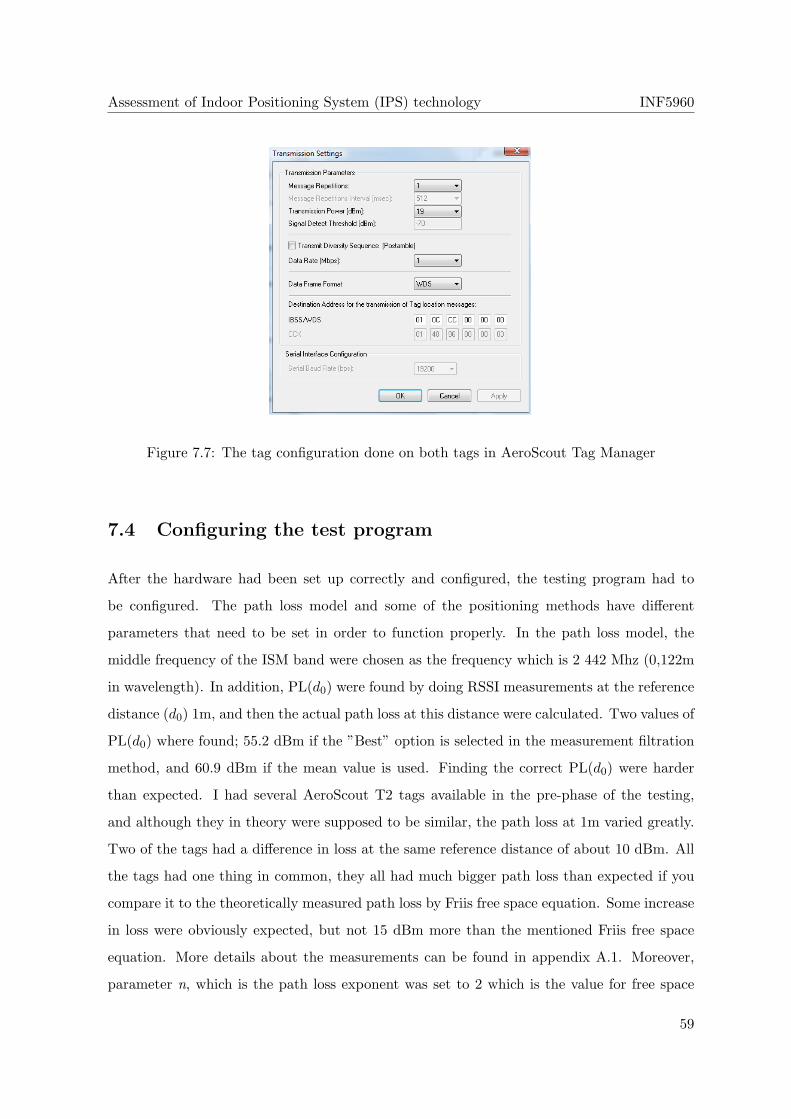
Assessment of Indoor Positioning System (IPS) technology INF5960
Figure 7.7: The tag configuration done on both tags in AeroScout Tag Manager
7.4 Configuring the test program
After the hardware had been set up correctly and configured, the testing program had to
be configured. The path loss model and some of the positioning methods have different
parameters that need to be set in order to function properly. In the path loss model, the
middle frequency of the ISM band were chosen as the frequency which is 2 442 Mhz (0,122m
in wavelength). In addition, PL(d0) were found by doing RSSI measurements at the reference
distance (d0) 1m, and then the actual path loss at this distance were calculated. Two values of
PL(d0) where found; 55.2 dBm if the ”Best” option is selected in the measurement filtration
method, and 60.9 dBm if the mean value is used. Finding the correct PL(d0) were harder
than expected. I had several AeroScout T2 tags available in the pre-phase of the testing,
and although they in theory were supposed to be similar, the path loss at 1m varied greatly.
Two of the tags had a difference in loss at the same reference distance of about 10 dBm. All
the tags had one thing in common, they all had much bigger path loss than expected if you
compare it to the theoretically measured path loss by Friis free space equation. Some increase
in loss were obviously expected, but not 15 dBm more than the mentioned Friis free space
equation. More details about the measurements can be found in appendix A.1. Moreover,
parameter n, which is the path loss exponent was set to 2 which is the value for free space
59

Assessment of Indoor Positioning System (IPS) technology INF5960
since the point was to make methods that takes attenuation of walls and other obstacles into
account to try and increase the accuracy.
Furthermore, in the measurement filtration method the ”best” RSSI value option was
chosen because it gave the most accurate results in the pre-testing. Both the packet and
position memory in the measurement filtration method and the statistical position estimation
method were set to 3. Lastly, the wall attenuation method had to be configured, and after
measuring the mean attenuation for all the walls in the environment, a wall attenuation of
4.4 dB were used. Details about the wall attenuation measurements can be viewed in more
detail in appendix A.3.
An overview of the propagation model and positioning method parameters are shown in
table 7.4.
Model or method Parameter Value
Log-distance path loss
Tx 19 dBm
Gtx 0
Grx 2.2 dBi
d0 1m
n 2
λ 0.122m
PL(d0) - ”Best” 55.2
PL(d0) - Mean 60.9
Measurement filtr.Packet memory 3
Filtration method Use the ”best” RSSI value
Wall attenuation Mix of wood/concrete 4.4 dB
Speed filtration Average walking speed 1.33 m/s
Statistical pos. estima. Position memory 3
Table 7.4: Model and method parameters used in the testing
In the end, before the testing could take place, the map of the test area had to be con-
figured/calibrated. The result can be seen in figure 7.8. The four Cisco AP’s were placed in
the test area as shown in figure 7.8, at 2,5m in height. It may seem like the two access points
at the bottom is placed outside the room, but it is the center point of the AP icon on the
60
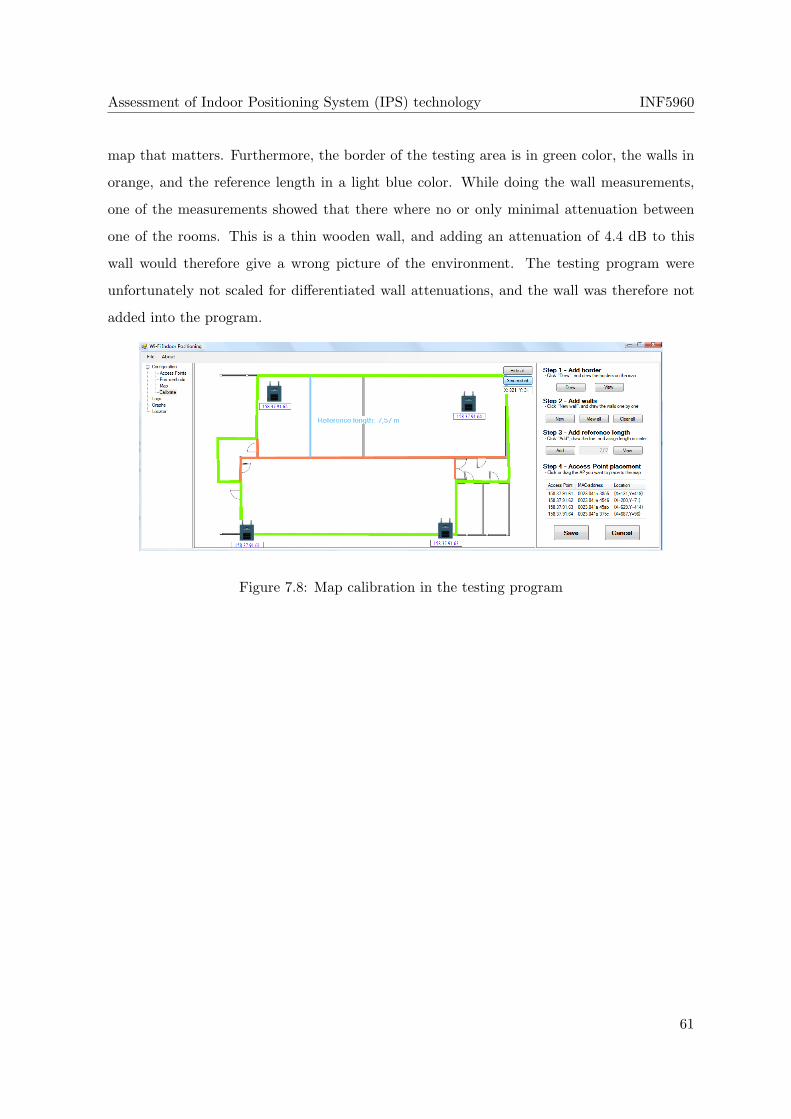
Assessment of Indoor Positioning System (IPS) technology INF5960
map that matters. Furthermore, the border of the testing area is in green color, the walls in
orange, and the reference length in a light blue color. While doing the wall measurements,
one of the measurements showed that there where no or only minimal attenuation between
one of the rooms. This is a thin wooden wall, and adding an attenuation of 4.4 dB to this
wall would therefore give a wrong picture of the environment. The testing program were
unfortunately not scaled for differentiated wall attenuations, and the wall was therefore not
added into the program.
Figure 7.8: Map calibration in the testing program
61

Assessment of Indoor Positioning System (IPS) technology INF5960
62
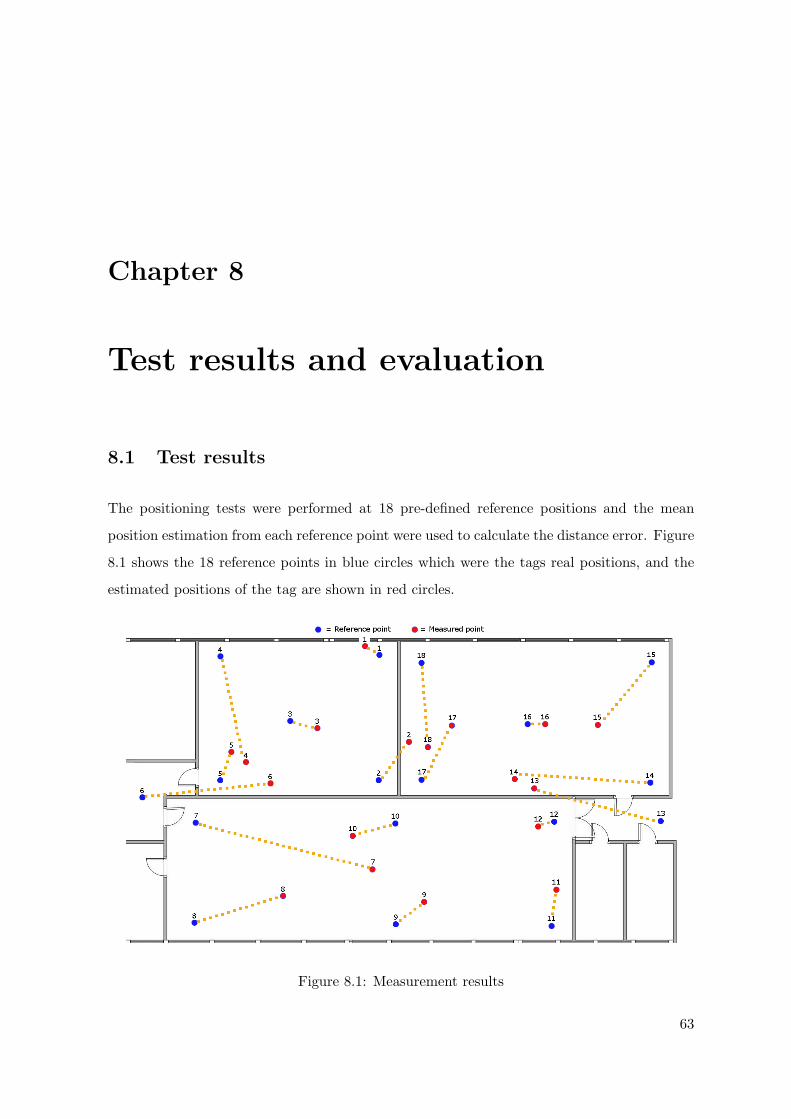
Chapter 8
Test results and evaluation
8.1 Test results
The positioning tests were performed at 18 pre-defined reference positions and the mean
position estimation from each reference point were used to calculate the distance error. Figure
8.1 shows the 18 reference points in blue circles which were the tags real positions, and the
estimated positions of the tag are shown in red circles.
Figure 8.1: Measurement results
63
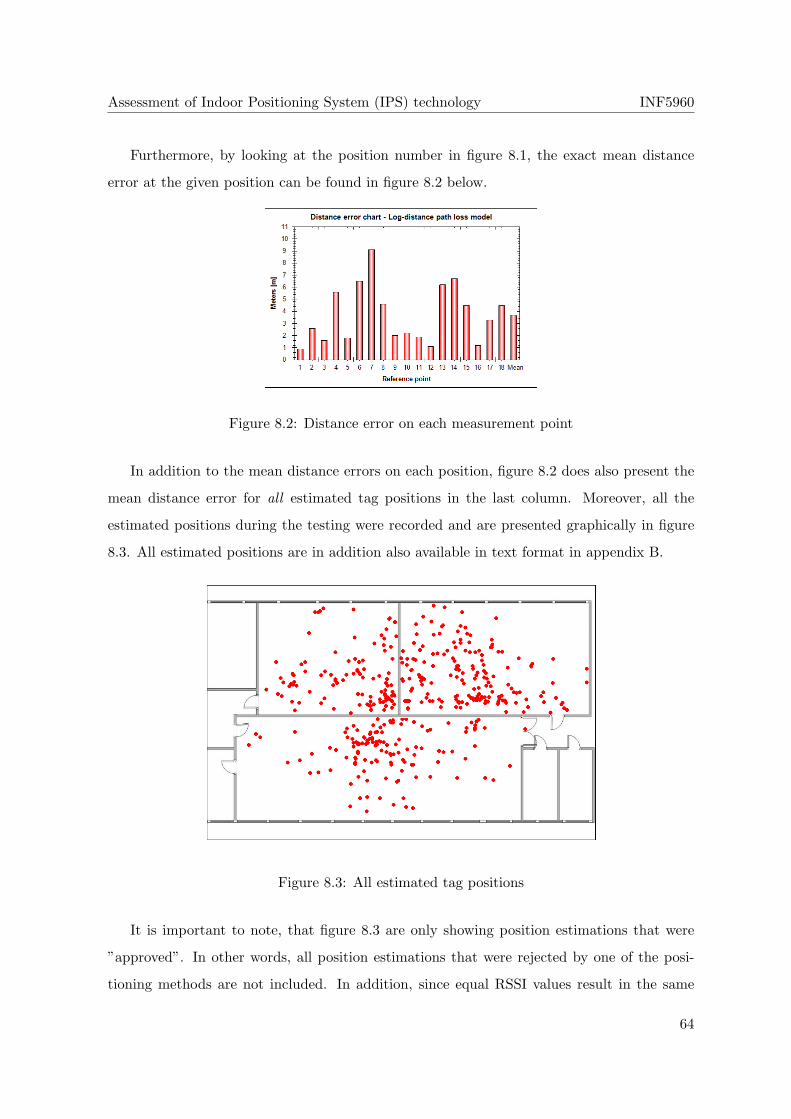
Assessment of Indoor Positioning System (IPS) technology INF5960
Furthermore, by looking at the position number in figure 8.1, the exact mean distance
error at the given position can be found in figure 8.2 below.
Figure 8.2: Distance error on each measurement point
In addition to the mean distance errors on each position, figure 8.2 does also present the
mean distance error for all estimated tag positions in the last column. Moreover, all the
estimated positions during the testing were recorded and are presented graphically in figure
8.3. All estimated positions are in addition also available in text format in appendix B.
Figure 8.3: All estimated tag positions
It is important to note, that figure 8.3 are only showing position estimations that were
”approved”. In other words, all position estimations that were rejected by one of the posi-
tioning methods are not included. In addition, since equal RSSI values result in the same
64
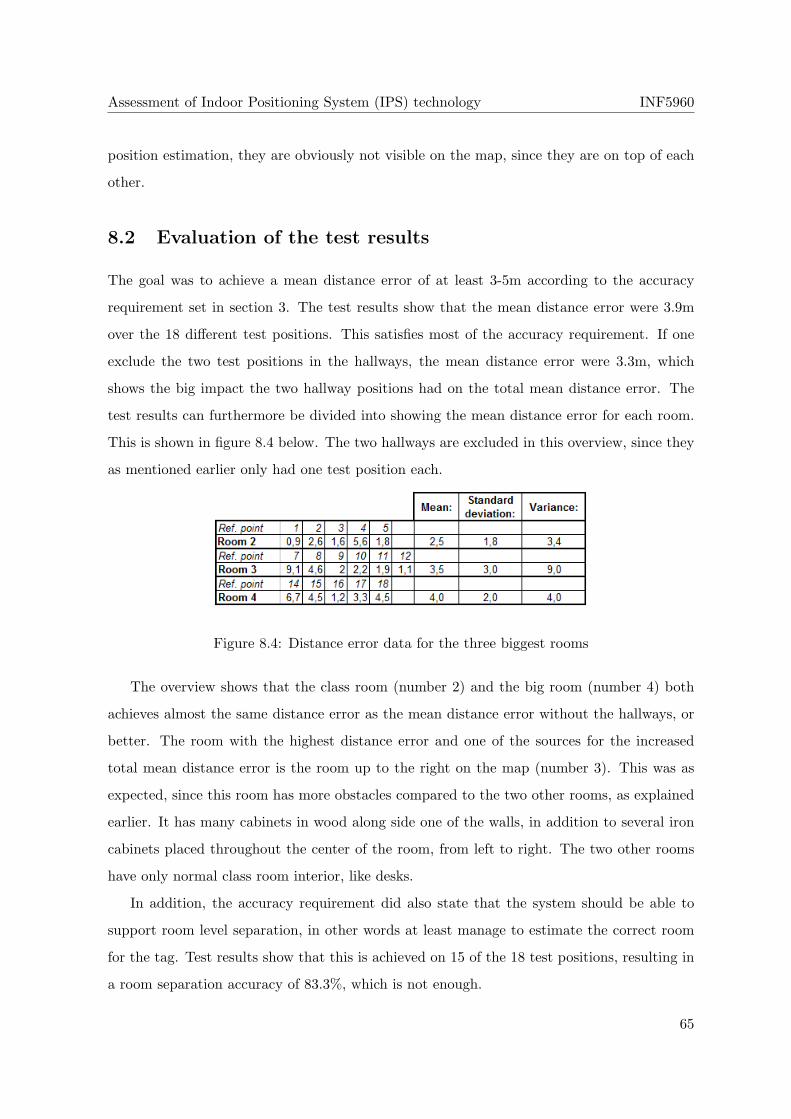
Assessment of Indoor Positioning System (IPS) technology INF5960
position estimation, they are obviously not visible on the map, since they are on top of each
other.
8.2 Evaluation of the test results
The goal was to achieve a mean distance error of at least 3-5m according to the accuracy
requirement set in section 3. The test results show that the mean distance error were 3.9m
over the 18 different test positions. This satisfies most of the accuracy requirement. If one
exclude the two test positions in the hallways, the mean distance error were 3.3m, which
shows the big impact the two hallway positions had on the total mean distance error. The
test results can furthermore be divided into showing the mean distance error for each room.
This is shown in figure 8.4 below. The two hallways are excluded in this overview, since they
as mentioned earlier only had one test position each.
Figure 8.4: Distance error data for the three biggest rooms
The overview shows that the class room (number 2) and the big room (number 4) both
achieves almost the same distance error as the mean distance error without the hallways, or
better. The room with the highest distance error and one of the sources for the increased
total mean distance error is the room up to the right on the map (number 3). This was as
expected, since this room has more obstacles compared to the two other rooms, as explained
earlier. It has many cabinets in wood along side one of the walls, in addition to several iron
cabinets placed throughout the center of the room, from left to right. The two other rooms
have only normal class room interior, like desks.
In addition, the accuracy requirement did also state that the system should be able to
support room level separation, in other words at least manage to estimate the correct room
for the tag. Test results show that this is achieved on 15 of the 18 test positions, resulting in
a room separation accuracy of 83.3%, which is not enough.
65
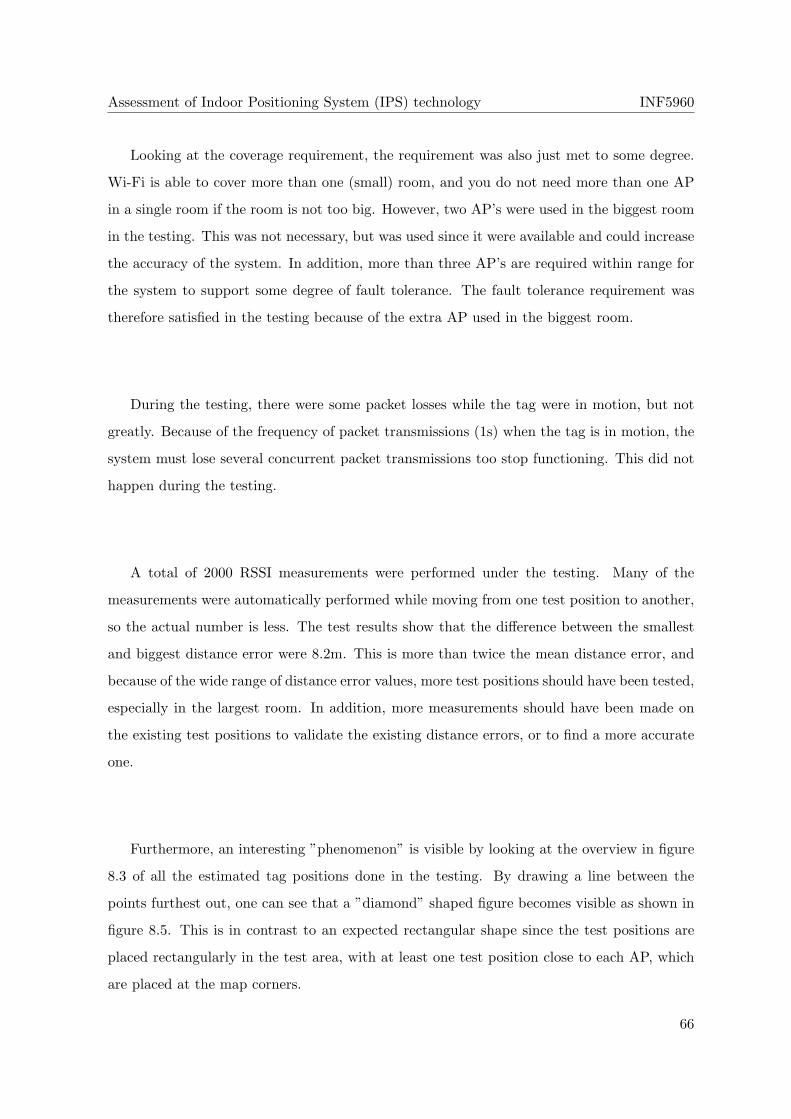
Assessment of Indoor Positioning System (IPS) technology INF5960
Looking at the coverage requirement, the requirement was also just met to some degree.
Wi-Fi is able to cover more than one (small) room, and you do not need more than one AP
in a single room if the room is not too big. However, two AP’s were used in the biggest room
in the testing. This was not necessary, but was used since it were available and could increase
the accuracy of the system. In addition, more than three AP’s are required within range for
the system to support some degree of fault tolerance. The fault tolerance requirement was
therefore satisfied in the testing because of the extra AP used in the biggest room.
During the testing, there were some packet losses while the tag were in motion, but not
greatly. Because of the frequency of packet transmissions (1s) when the tag is in motion, the
system must lose several concurrent packet transmissions too stop functioning. This did not
happen during the testing.
A total of 2000 RSSI measurements were performed under the testing. Many of the
measurements were automatically performed while moving from one test position to another,
so the actual number is less. The test results show that the difference between the smallest
and biggest distance error were 8.2m. This is more than twice the mean distance error, and
because of the wide range of distance error values, more test positions should have been tested,
especially in the largest room. In addition, more measurements should have been made on
the existing test positions to validate the existing distance errors, or to find a more accurate
one.
Furthermore, an interesting ”phenomenon” is visible by looking at the overview in figure
8.3 of all the estimated tag positions done in the testing. By drawing a line between the
points furthest out, one can see that a ”diamond” shaped figure becomes visible as shown in
figure 8.5. This is in contrast to an expected rectangular shape since the test positions are
placed rectangularly in the test area, with at least one test position close to each AP, which
are placed at the map corners.
66
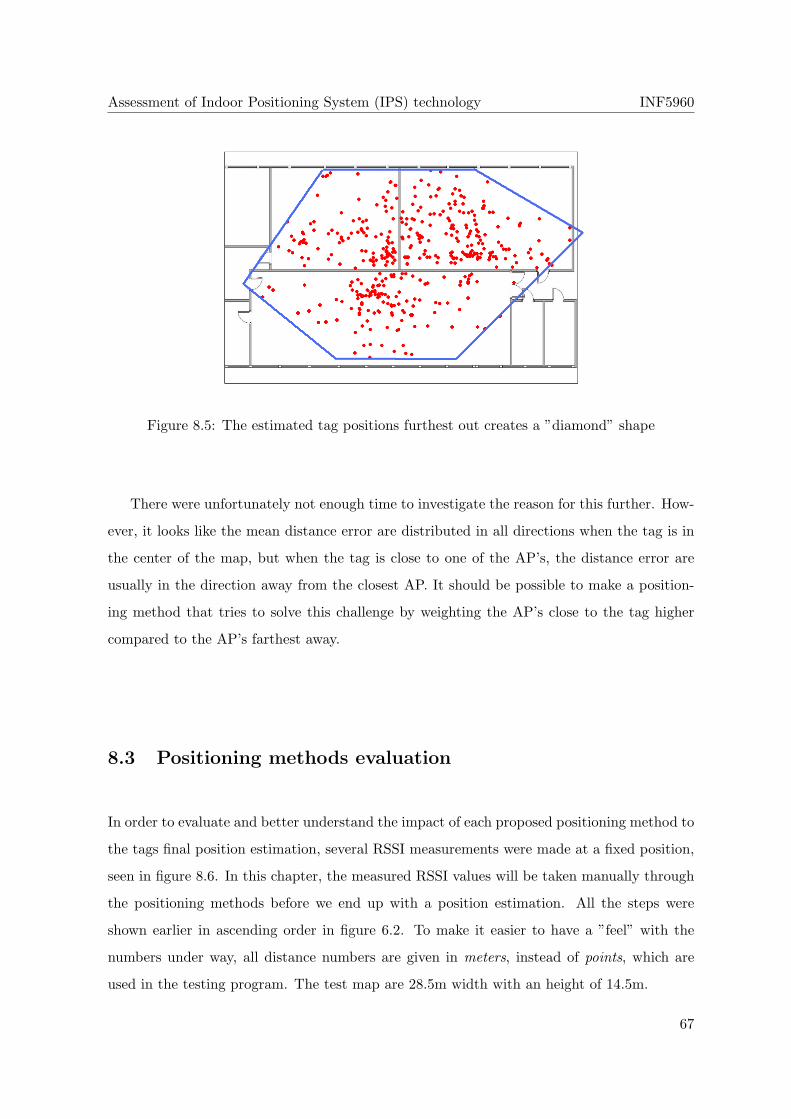
Assessment of Indoor Positioning System (IPS) technology INF5960
Figure 8.5: The estimated tag positions furthest out creates a ”diamond” shape
There were unfortunately not enough time to investigate the reason for this further. How-
ever, it looks like the mean distance error are distributed in all directions when the tag is in
the center of the map, but when the tag is close to one of the AP’s, the distance error are
usually in the direction away from the closest AP. It should be possible to make a position-
ing method that tries to solve this challenge by weighting the AP’s close to the tag higher
compared to the AP’s farthest away.
8.3 Positioning methods evaluation
In order to evaluate and better understand the impact of each proposed positioning method to
the tags final position estimation, several RSSI measurements were made at a fixed position,
seen in figure 8.6. In this chapter, the measured RSSI values will be taken manually through
the positioning methods before we end up with a position estimation. All the steps were
shown earlier in ascending order in figure 6.2. To make it easier to have a ”feel” with the
numbers under way, all distance numbers are given in meters, instead of points, which are
used in the testing program. The test map are 28.5m width with an height of 14.5m.
67
Assessment of Indoor Positioning System (IPS) technology INF5960
Figure 8.6: AP and tag positions in the test example
From the fixed position shown in the figure, all the AP’s measured the RSSI from the
tag 34 times each. All measurement details about this test example are going in appendix
A.3. The same model and method configuration as used in the real testing are used in this
example as well. This includes the calibration of the map with walls and borders. The only
difference is the number of AP’s used and the placement of these. Table 8.1 shows all the AP
and tag coordinates.
Coordinates (x,y)
AP1 (10.2 , 14.5)
AP2 (4.2 , 2.2)
AP3 (21.2 , 2.4)
Tag (6.9 , 5.4)
Table 8.1: AP coordinates, in meters
After the RSSI measurements have been aggregated from each AP to the testing program,
the Measurement filtration method is run. Since the ”Best” option was used in the testing
earlier, it will also be used in this example. When the tag is not in motion (as in this
example), the method dynamically increase the memory table and remembers all the RSSI
measurements done since the tag were last in motion. By looking at the table in appendix
A.3, we see that the highest (”Best”) RSSI for AP1 is -60 dBm, for AP2 it is -46 dBm and
for AP3 it’s -56 dBm. This is also shown in table 8.2 below.
68
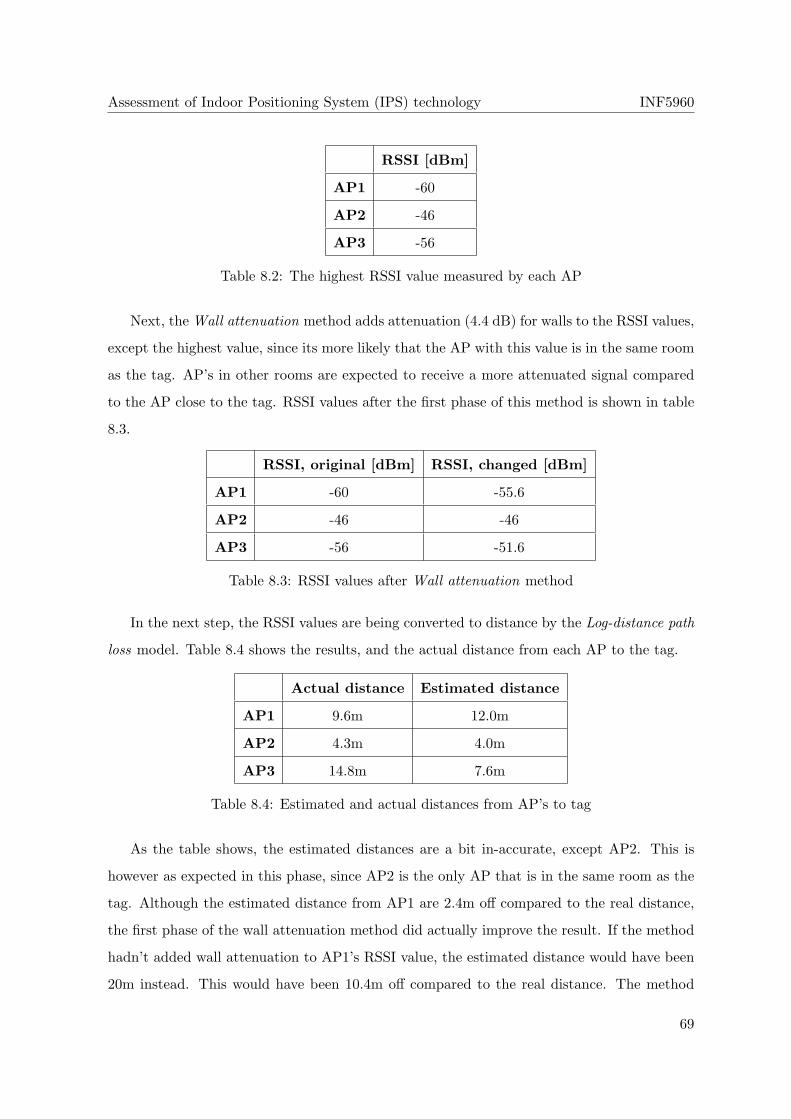
Assessment of Indoor Positioning System (IPS) technology INF5960
RSSI [dBm]
AP1 -60
AP2 -46
AP3 -56
Table 8.2: The highest RSSI value measured by each AP
Next, the Wall attenuation method adds attenuation (4.4 dB) for walls to the RSSI values,
except the highest value, since its more likely that the AP with this value is in the same room
as the tag. AP’s in other rooms are expected to receive a more attenuated signal compared
to the AP close to the tag. RSSI values after the first phase of this method is shown in table
8.3.
RSSI, original [dBm] RSSI, changed [dBm]
AP1 -60 -55.6
AP2 -46 -46
AP3 -56 -51.6
Table 8.3: RSSI values after Wall attenuation method
In the next step, the RSSI values are being converted to distance by the Log-distance path
loss model. Table 8.4 shows the results, and the actual distance from each AP to the tag.
Actual distance Estimated distance
AP1 9.6m 12.0m
AP2 4.3m 4.0m
AP3 14.8m 7.6m
Table 8.4: Estimated and actual distances from AP’s to tag
As the table shows, the estimated distances are a bit in-accurate, except AP2. This is
however as expected in this phase, since AP2 is the only AP that is in the same room as the
tag. Although the estimated distance from AP1 are 2.4m off compared to the real distance,
the first phase of the wall attenuation method did actually improve the result. If the method
hadn’t added wall attenuation to AP1’s RSSI value, the estimated distance would have been
20m instead. This would have been 10.4m off compared to the real distance. The method
69
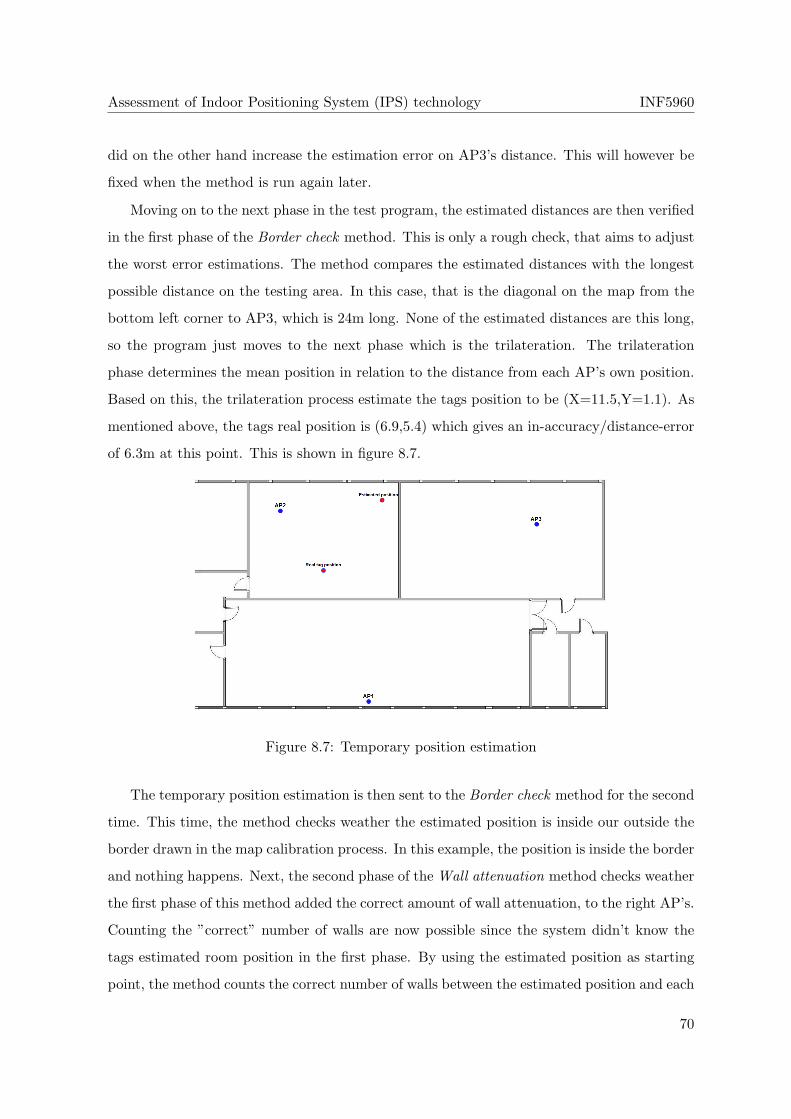
Assessment of Indoor Positioning System (IPS) technology INF5960
did on the other hand increase the estimation error on AP3’s distance. This will however be
fixed when the method is run again later.
Moving on to the next phase in the test program, the estimated distances are then verified
in the first phase of the Border check method. This is only a rough check, that aims to adjust
the worst error estimations. The method compares the estimated distances with the longest
possible distance on the testing area. In this case, that is the diagonal on the map from the
bottom left corner to AP3, which is 24m long. None of the estimated distances are this long,
so the program just moves to the next phase which is the trilateration. The trilateration
phase determines the mean position in relation to the distance from each AP’s own position.
Based on this, the trilateration process estimate the tags position to be (X=11.5,Y=1.1). As
mentioned above, the tags real position is (6.9,5.4) which gives an in-accuracy/distance-error
of 6.3m at this point. This is shown in figure 8.7.
Figure 8.7: Temporary position estimation
The temporary position estimation is then sent to the Border check method for the second
time. This time, the method checks weather the estimated position is inside our outside the
border drawn in the map calibration process. In this example, the position is inside the border
and nothing happens. Next, the second phase of the Wall attenuation method checks weather
the first phase of this method added the correct amount of wall attenuation, to the right AP’s.
Counting the ”correct” number of walls are now possible since the system didn’t know the
tags estimated room position in the first phase. By using the estimated position as starting
point, the method counts the correct number of walls between the estimated position and each
70

Assessment of Indoor Positioning System (IPS) technology INF5960
AP in range. If zero walls are counted, the method removes the added attenuation from the
first phase, and if more than one are counted the method adds attenuation. In this example,
one wall is counted between the estimated tag position and AP1, which is correct. Zero walls
are found to AP2, which is also correct. In the end, zero walls are also counted between
the tag and AP3. The reason for this is explained earlier. Wall measurements showed little
attenuation between these rooms, and the wall between these rooms was therefore excluded
in the map calibration process. The map calibration, which is also used in this example,
may be seen again in figure 7.8. Since the first phase of the wall attenuation method added
attenuation to the RSSI measurement done by AP3, it must be removed. Table 8.5 below
shows the updated RSSI values.
RSSI, original [dBm] RSSI, before [dBm] RSSI, now [dBm]
AP1 -60 -55.6 -55.6
AP2 -46 -46 -46
AP3 -56 -51.6 -56
Table 8.5: RSSI values after the second phase of the Wall attenuation method
Since one of the RSSI values changed, new distances have to be calculated using the log-
distance path loss model again. Table 8.6 shows the new distances, in addition to the old
distances and the actual distances for easy comparison.
Actual distance Estimated distance - before Estimated distance - now
AP1 9.6m 12.0m 12.0m
AP2 4.3m 4.0m 4.0m
AP3 14.8m 7.6m 12.6m
Table 8.6: Estimated and actual distances from AP’s to tag
The table shows that the distance from AP3 have been improved, which means the method
fixed the error it did in the first phase the second time it was run. After the new distances have
been calculated, the trilateration process estimate the new tag position, which is (8.5,2.5).
The distance error is now 3.3m, compared to 6.3m in the first position estimation. The
estimated tag position is now passed on to the next method which is the Speed filtration
method. This method compares the estimated position against the last accepted position
71
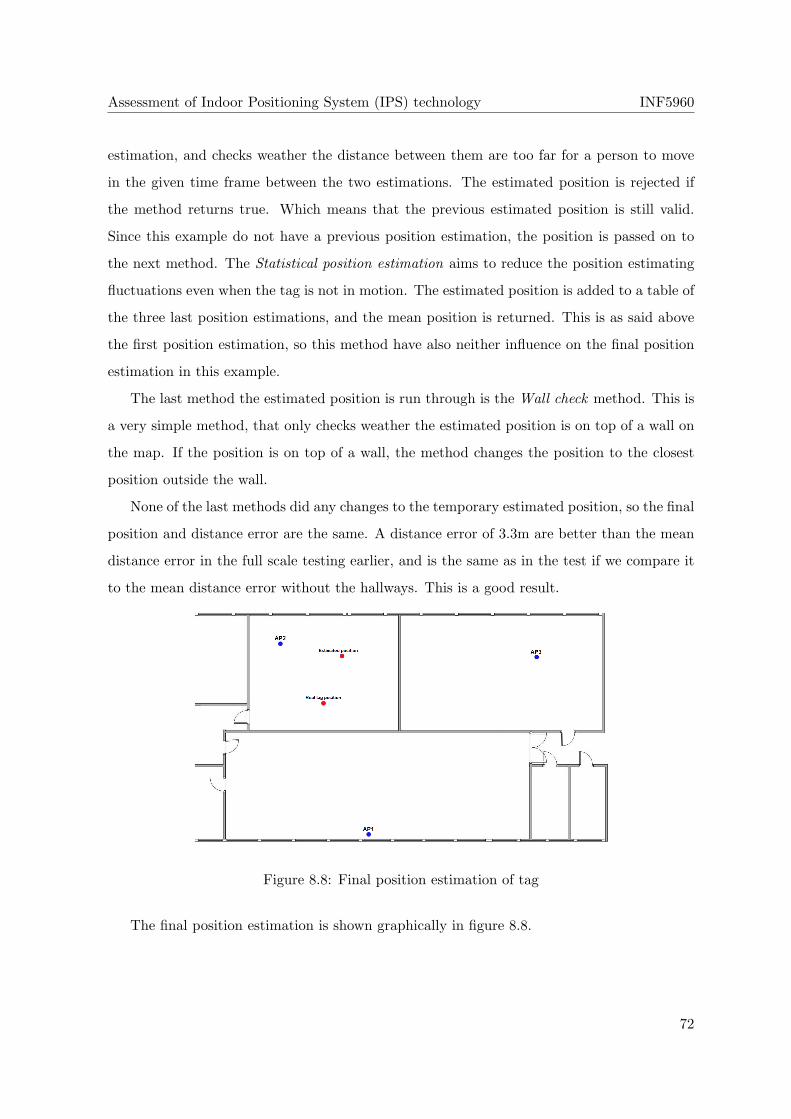
Assessment of Indoor Positioning System (IPS) technology INF5960
estimation, and checks weather the distance between them are too far for a person to move
in the given time frame between the two estimations. The estimated position is rejected if
the method returns true. Which means that the previous estimated position is still valid.
Since this example do not have a previous position estimation, the position is passed on to
the next method. The Statistical position estimation aims to reduce the position estimating
fluctuations even when the tag is not in motion. The estimated position is added to a table of
the three last position estimations, and the mean position is returned. This is as said above
the first position estimation, so this method have also neither influence on the final position
estimation in this example.
The last method the estimated position is run through is the Wall check method. This is
a very simple method, that only checks weather the estimated position is on top of a wall on
the map. If the position is on top of a wall, the method changes the position to the closest
position outside the wall.
None of the last methods did any changes to the temporary estimated position, so the final
position and distance error are the same. A distance error of 3.3m are better than the mean
distance error in the full scale testing earlier, and is the same as in the test if we compare it
to the mean distance error without the hallways. This is a good result.
Figure 8.8: Final position estimation of tag
The final position estimation is shown graphically in figure 8.8.
72
Chapter 9
Conclusion
The assessment of different technologies used in indoor positioning systems showed that Ultra-
Wideband is probably the best technology. Ultra-Wideband is however in its early phases and
are therefore not regulated for use in all countries, for instance Norway. It is also the most
expensive technology to use in an indoor positioning system at the time being, compared to
the other assessed technologies.
Wi-Fi is on the other hand a good choice for open indoor environments such as office
or class rooms where some level of positioning error is accepted as long as the decreased
performance is reflected in the price of the system. The test results showed that it’s difficult
to make a positioning system based on Wi-Fi that is more accurate than 3m. However, the
possibility to re-use the existing wireless network infrastructure makes the proposed system
acceptable in relation to its potential low cost.
The test results also showed that most of the proposed positioning methods did improve
the accuracy of the system. Some of the methods should however be edited to increase the
level of accuracy. This are especially the Wall attenuation method and the Border check
method.
9.1 Future work
The test results showed that the position estimations of the tag are less accurate in the room
with the most obstacles. Therefore, a position method that try and take room obstacles into
account should be investigated. This is not an easy task, and may not increase the accuracy
73
Assessment of Indoor Positioning System (IPS) technology INF5960
since there also lie some significant uncertainty in how the position method is designed, in
addition to the uncertainty in radio wave propagation. Still, it should be tested before a
conclusion is made.
Furthermore, the testing also discovered significant position estimation fluctuations de-
spite that the tag was not in motion. Two of the proposed position methods tried to encounter
this problem, but didn’t succeed 100%. Therefore, the proposed statistical method should
be switched with an implementation of the non-linear version of the Kalman Filter, called
Extended Kalman Filter (EKF).
In the end, testing different types of Wi-Fi tags should be performed, to give a better
understanding of how big part of the positioning uncertainty that are related to the tags
used, and how much is related to the Wi-Fi positioning system itself.
74
Bibliography
[1] AeroScout.com. ”AeroScout Exciter Data Sheet, 2010.
http://www.aeroscout.com/content/library (20.03.2010).
[2] AutoID. ”International Projects Relating To Automatic Data Capture (ADC)”, 2005.
http://www.autoid.org/standards/project\_summary\_old.htm (10.05.2009).
[3] A. P. Cracknell. ”Ultrasonics”, 1980. ISBN 0-85109-770-7.
[4] Den Norske Dataforening. ”RFID Identifikasjon med bruk av radiobrikker gir nye
muligheter”, 2006.
http://www.dataforeningen.no/rfid-a8211-identifikasjon-med-bruk-av-radiobrikker-
gir-nye-muligheter.4598990-134271.html (25.03.2010).
[5] Glyn Holland Dr Peter Harrop and Raghu Das. ”Real Time Locating Systems 2009-
2019”, 2009.
http://www.idtechex.com/research/reports/real_time_locating_systems_2009_
2019_000143.asp (28.04.2009).
[6] Electronic Communications Committee (ECC) and CEPT. ”Report A from CEPT to
European Commission in response to the Mandate 4 on Ultra-Wideband (UWB)”, 2009.
http://www.erodocdb.dk/Docs/doc98/official/pdf/CEPTREP027.PDF (27.04.2009).
[7] Stian Eisentrger. ”Pasjekker’n med ultralyd”, 2007.
http://www.vg.no/teknologi/artikkel.php?artid=153187 (03.05.2009).
[8] Mike Emery and Mieso K. Denko. ”IEEE 802.11 WLAN based Real-time Location
Tracking in Indoor and Outdoor Environments”, 2005.
75
Assessment of Indoor Positioning System (IPS) technology INF5960
http://ieeexplore.ieee.org/iel5/4232658/4232659/04232930.pdf%3Farnumber%
3D4232930&authDecision=-203 (14.03.2010).
[9] Nanotron Technologies GmbH. ”Real Time Location Systems (RTLS)”, 2007.
http://www.nanotron.com/EN/pdf/WP_RTLS.pdf (04.05.2009).
[10] Silje Gomns. ”Vil overvake deg med RFID paflyplassen”, 2006.
http://www.amobil.no/artikler/vil_overvaake_deg_med_rfid_paa_flyplassen/
32483 (03.05.2009).
[11] Bob Heile. ”IEEE 802.15.3a WG mail conversation log”, 2006.
http://standards.ieee.org/board/nes/projects/802-15-3a.pdf (28.04.2009).
[12] Sverre Holm. ”Airborne ultrasound data communications: The core of an indoor
positioning system”, 2005.
http://home.ifi.uio.no/sverre/papers/05_IEEEUltrasonics_IPS.pdf
(04.05.2009).
[13] IDTechEx. ”Rapid Improvements in Real Time Locating Systems”, 2008.
http://www.idtechex.com/research/articles/rapid_improvements_in_real_
time_locating_systems_00001036.asp (28.04.2009).
[14] IEEE. ”IEEE 802.11, 2007.
http://standards.ieee.org/getieee802/download/802.11-2007.pdf (05.05.2009).
[15] Intel. ”Ultra-Wideband (UWB Technology): Enabling high-speed wireless personal area
networks.”, 2005.
http://www.intel.com/technology/comms/uwb/download/Ultra-Wideband.pdf
(06.05.2009).
[16] ECMA International. ”High Rate Ultra Wideband PHY and MAC Standard”, 2008.
http://www.ecma-international.org/publications/files/ECMA-ST/ECMA-368.
pdf (26.04.2009).
[17] ECMA International. ”MAC-PHY Interface for ECMA-368”, 2008.
http://www.ecma-international.org/publications/files/ECMA-ST/ECMA-369.
pdf (27.04.2009).
76
Assessment of Indoor Positioning System (IPS) technology INF5960
[18] ISO/IEC. ”ISO/IEC 19762-3:2005”, 2005.
http://www.iso.org/iso/iso_catalogue/catalogue_tc/catalogue_detail.htm?
csnumber=37434 (10.05.2009).
[19] ISO/IEC. ”ISO/IEC 24730-1:2006”, 2006.
http://www.iso.org/iso/iso_catalogue/catalogue_tc/catalogue_detail.htm?
csnumber=38840 (10.05.2009).
[20] ISO/IEC. ”ISO/IEC 24730-2:2006”, 2006.
http://www.iso.org/iso/iso_catalogue/catalogue_tc/catalogue_detail.htm?
csnumber=40508 (10.05.2009).
[21] ISO/IEC. ”ISO/IEC 26907”, 2007.
http://webstore.iec.ch/preview/info_isoiec26907%7Bed1.0%7Den.pdf
(08.05.2009).
[22] ISO/IEC. ”ISO/IEC 26908”, 2007.
http://webstore.iec.ch/preview/info_isoiec26908%7Bed1.0%7Den.pdf
(08.05.2009).
[23] RFID Journal. ”A Summary of RFID Standards”, 2005.
http://www.rfidjournal.com/article/view/1335/3 (09.05.2009).
[24] RFID Journal. ”ISO Ratifies 2.4 GHz RTLS Standard”, 2007.
http://www.rfidjournal.com/article/print/3277 (10.05.2009).
[25] Holger Karl and Andreas Willig. ”Wireless Sensor Networks”, 2007. ISBN 978-0-470-
51923-3.
[26] Alexander Klapproth and Stefan Knauth. ”Indoor Localisation - Technologies and
Applications”, 2009.
http://www.ceesar.ch/fileadmin/Dateien/PDF/indoorlocalisation_emw07_
Paper_KlapprothKnauth.pdf (06.05.2009).
[27] Jardar Leira. ”The use of wireless networks in Norway”, 2005.
http://forskningsnett.uninett.no/wlan/law.html (09.05.2009).
77
Assessment of Indoor Positioning System (IPS) technology INF5960
[28] P.K. Chrysanthis P. Prasithsangaree, P. Krishnamurthy. ”On Indoor Position Location
With Wireless LANs”, 2002.
http://ieeexplore.ieee.org/xpl/freeabs_all.jsp?arnumber=1047316
(07.05.2009).
[29] The Norwegian Post and Telecommunications Authority. ”Strategiske mal for frekvens-
forvaltning”, 2004.
http://www.npt.no/ikbViewer/Content/31958/Strategisk\_Ver10\_251104.pdf
(28.04.2009).
[30] The Norwegian Post and Telecommunications Authority. ”Informasjon om regelverk for
tradløse nettverk (WLAN)”, 2007.
http://www.npt.no/ikbViewer/Content/102109/Regelverket_WLAN-revidert_
210507.pdf (09.05.2009).
[31] The Norwegian Post and Telecommunications Authority. ”Handlingsplan 2009”, 2009.
http://www.npt.no/ikbViewer/Content/108832/Handlingsplan2009-20081218.
pdf (28.04.2009).
[32] Kazimierz Siwiak and Debra McKeown. ”ultra-wideband radio technology”, 2004. ISBN
0-470-85931-8.
[33] Trude Talberg-Furulund. ”Sporingsteknologi og personvern”, 2008.
http://www.datatilsynet.no/templates/Page____2319.aspx (06.05.2009).
[34] Dinesh Tummala. ”Indoor Propagation Modeling At 2.4 GHz For IEEE 802.11
Networks”, 2005.
http://citeseerx.ist.psu.edu/viewdoc/download?doi=10.1.1.102.8945&rep=
rep1&type=pdf (15.03.2010).
[35] Dag Wisland. ”UWB - Ultra Wide Band Radio”, 2003.
http://www.ifi.uio.no/forskning/grupper/mes/Research/UWB/index.html
(10.05.2009).
78
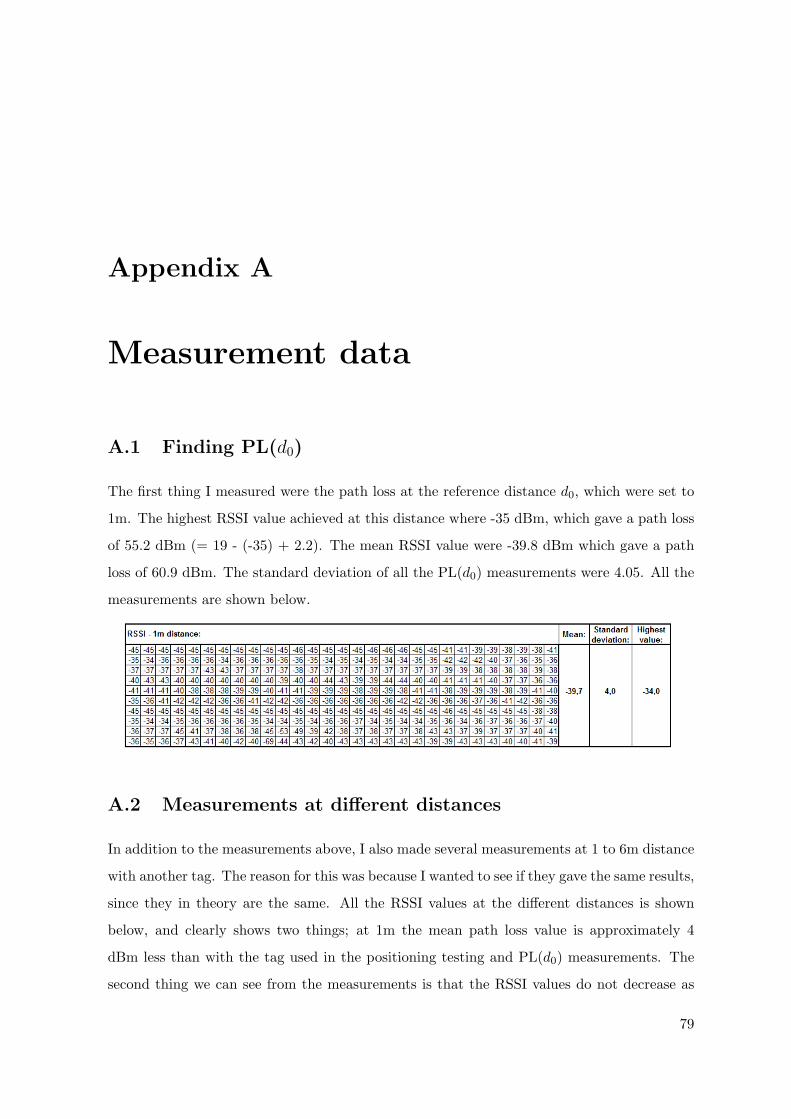
Appendix A
Measurement data
A.1 Finding PL(d0)
The first thing I measured were the path loss at the reference distance d0, which were set to
1m. The highest RSSI value achieved at this distance where -35 dBm, which gave a path loss
of 55.2 dBm (= 19 - (-35) + 2.2). The mean RSSI value were -39.8 dBm which gave a path
loss of 60.9 dBm. The standard deviation of all the PL(d0) measurements were 4.05. All the
measurements are shown below.
A.2 Measurements at different distances
In addition to the measurements above, I also made several measurements at 1 to 6m distance
with another tag. The reason for this was because I wanted to see if they gave the same results,
since they in theory are the same. All the RSSI values at the different distances is shown
below, and clearly shows two things; at 1m the mean path loss value is approximately 4
dBm less than with the tag used in the positioning testing and PL(d0) measurements. The
second thing we can see from the measurements is that the RSSI values do not decrease as
79

Assessment of Indoor Positioning System (IPS) technology INF5960
the distance increases, as one would expect according to Friis free space loss equation. All
details is found in the figure below.
A.3 Wall attenuation measurements
One of the positioning methods described in the thesis tries to add wall attenuation to signals
that penetrate walls. In order for this method to be as accurate as possible, several wall
attenuation measurements were performed. The two tables below show respectively the RSSI
measurement through one of the walls at the same reference distance as earlier (1m) and
measurements from both sides of a wall. In the latter one, two AP’s were used, one on each
side of the wall, and the tag was on one of the sides. Interestingly enough, the measurements
showed that there were no or just minimal signal loss through this wall.
A.4 Measurements for positioning example
To be able to evaluate the proposed positioning methods in this thesis, several measurements
were made on three AP’s while the tag were not in motion on the same position on all
measurements. Figure 8.6 shows the AP and tag placement on the map.
80
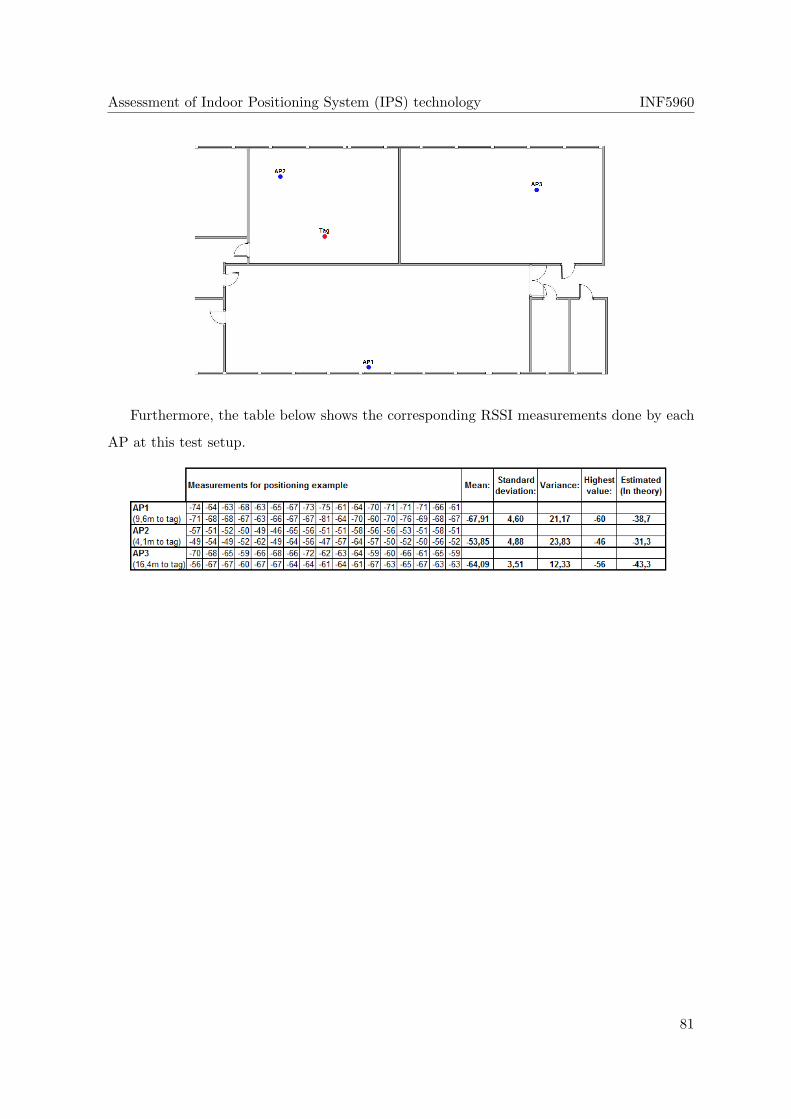
Assessment of Indoor Positioning System (IPS) technology INF5960
Furthermore, the table below shows the corresponding RSSI measurements done by each
AP at this test setup.
81

Assessment of Indoor Positioning System (IPS) technology INF5960
82
Appendix B
Logs from the test program
All logs created by the test program during the positioning test presented in section 7.5 are
shown in this chapter. The last part shows all the estimated tag positions, including the time
stamp of the estimation.
General log:
20:25:37 Tag being located: 000c.cc7b.4694
20:25:37 Number of APs: 4
20:25:37 Refresh rate: 1 second
20:25:37 Map filename: hib-lab3.jpg
Configuration log:
20:26:24 Border coordinates:
20:26:24 X=153,Y=29
20:26:24 X=157,Y=189
20:26:24 X=59,Y=190
20:26:24 X=62,Y=298
20:26:24 X=117,Y=297
20:26:24 X=116,Y=432
20:26:24 X=654,Y=426
20:26:24 X=654,Y=293
20:26:24 X=786,Y=295
83
Assessment of Indoor Positioning System (IPS) technology INF5960
20:26:24 X=781,Y=29
20:26:24 Wall coordinates:
20:26:24 X=422,Y=235 to X=782,Y=238
20:26:24 Reference coordinates:
20:26:24 X=464,Y=32 to X=463,Y=235, length: 7,57m
20:26:24 AP coordinates:
20:26:24 0023.041a.3855: X=132,Y=420
20:26:24 0023.041a.4546: X=208,Y=68
20:26:24 0023.041a.45ab: X=626,Y=414
20:26:24 0023.041a.375c: X=681,Y=79
Locator log - in the format [time stamp : X, Y coordinates]:
[6:X=410,Y=223][9:X=408,Y=265][13:X=430,Y=248][16:X=440,Y=223][18:X=437,Y=223]
[21:X=428,Y=236][23:X=435,Y=223][26:X=442,Y=223][28:X=440,Y=223][30:X=440,Y=248]
[38:X=440,Y=248][40:X=440,Y=248][42:X=440,Y=248][45:X=440,Y=248][47:X=440,Y=248]
[52:X=440,Y=248][54:X=440,Y=248][57:X=440,Y=248][59:X=440,Y=238][62:X=425,Y=248]
[131:X=433,Y=207][133:X=410,Y=213][136:X=397,Y=202][138:X=396,Y=212][141:X=363,Y=230]
[146:X=414,Y=230][148:X=393,Y=225][150:X=390,Y=205][153:X=397,Y=211][155:X=405,Y=219]
[161:X=396,Y=210][163:X=387,Y=220][165:X=368,Y=232][168:X=370,Y=233][170:X=424,Y=205]
[175:X=370,Y=224][177:X=398,Y=218][179:X=371,Y=240][182:X=399,Y=222][187:X=415,Y=213]
[191:X=413,Y=211][199:X=411,Y=205][201:X=409,Y=193][218:X=404,Y=170][222:X=396,Y=126]
[231:X=390,Y=97][241:X=408,Y=119][243:X=446,Y=164][261:X=427,Y=141][263:X=390,Y=97]
[268:X=539,Y=112][272:X=489,Y=96][274:X=539,Y=79][277:X=377,Y=113][280:X=395,Y=103]
[282:X=246,Y=148][284:X=222,Y=171][288:X=276,Y=174][289:X=375,Y=180][291:X=398,Y=233]
[293:X=367,Y=296][294:X=367,Y=296][296:X=379,Y=283][297:X=395,Y=269][298:X=395,Y=269]
[302:X=346,Y=324][305:X=346,Y=320][306:X=346,Y=307][307:X=347,Y=305][308:X=348,Y=306]
[311:X=382,Y=282][312:X=375,Y=270][313:X=325,Y=276][315:X=337,Y=271][316:X=343,Y=303]
[319:X=401,Y=308][320:X=381,Y=301][321:X=423,Y=297][322:X=417,Y=307][324:X=431,Y=336]
[327:X=482,Y=369][328:X=482,Y=369][330:X=482,Y=369][331:X=450,Y=346][332:X=386,Y=300]
[335:X=394,Y=303][336:X=507,Y=321][338:X=466,Y=314][339:X=499,Y=319][341:X=530,Y=215]
[343:X=533,Y=213][344:X=533,Y=213][346:X=533,Y=213][347:X=558,Y=97][349:X=558,Y=97]
84
Assessment of Indoor Positioning System (IPS) technology INF5960
[352:X=566,Y=180][353:X=568,Y=221][354:X=568,Y=221][355:X=568,Y=221][357:X=611,Y=224]
[361:X=659,Y=244][364:X=667,Y=235][366:X=692,Y=214][368:X=696,Y=206][371:X=713,Y=189]
[375:X=572,Y=169][378:X=630,Y=192][383:X=651,Y=206][390:X=617,Y=213][392:X=593,Y=216]
[422:X=555,Y=213][452:X=573,Y=218][454:X=610,Y=229][456:X=539,Y=105][458:X=539,Y=105]
[464:X=524,Y=320][466:X=524,Y=320][469:X=539,Y=236][471:X=559,Y=217][473:X=543,Y=183]
[480:X=531,Y=235][483:X=552,Y=229][488:X=546,Y=190][491:X=572,Y=214][502:X=584,Y=178]
[510:X=640,Y=207][514:X=645,Y=208][518:X=628,Y=159][520:X=607,Y=64][523:X=607,Y=64]
[527:X=607,Y=64][530:X=434,Y=399][532:X=434,Y=399][535:X=434,Y=399][537:X=537,Y=225]
[547:X=569,Y=174][549:X=585,Y=216][552:X=580,Y=217][554:X=570,Y=221][557:X=574,Y=198]
[564:X=549,Y=126][566:X=484,Y=70][657:X=506,Y=78][659:X=552,Y=94][717:X=532,Y=177]
[720:X=497,Y=340][721:X=497,Y=340][722:X=497,Y=340][724:X=497,Y=340][727:X=497,Y=340]
[731:X=709,Y=246][733:X=709,Y=246][734:X=709,Y=246][736:X=709,Y=246][737:X=709,Y=246]
[740:X=616,Y=248][741:X=455,Y=312][743:X=427,Y=268][744:X=395,Y=240][745:X=437,Y=258]
[748:X=452,Y=327][750:X=439,Y=316][751:X=429,Y=357][753:X=409,Y=346][754:X=340,Y=342]
[757:X=259,Y=325][758:X=259,Y=325][760:X=259,Y=325][761:X=259,Y=325][763:X=236,Y=337]
[765:X=139,Y=308][767:X=161,Y=293][769:X=235,Y=227][770:X=153,Y=287][772:X=153,Y=287]
[780:X=293,Y=313][787:X=304,Y=317][790:X=337,Y=304][791:X=337,Y=304][792:X=337,Y=304]
[797:X=337,Y=304][819:X=223,Y=192][822:X=389,Y=29][823:X=373,Y=34][844:X=465,Y=184]
[847:X=465,Y=184][850:X=348,Y=148][852:X=227,Y=241][854:X=221,Y=224][856:X=205,Y=188]
[860:X=230,Y=194][861:X=225,Y=186][863:X=224,Y=174][866:X=265,Y=52][868:X=253,Y=93]
[878:X=274,Y=50][880:X=280,Y=45][906:X=324,Y=34][908:X=413,Y=34][909:X=504,Y=80]
[912:X=456,Y=76][914:X=438,Y=154][916:X=438,Y=154][919:X=439,Y=142][920:X=454,Y=144]
[924:X=471,Y=149][925:X=471,Y=149][926:X=471,Y=149][930:X=337,Y=47][933:X=400,Y=85]
[948:X=405,Y=65][950:X=415,Y=72][952:X=416,Y=71][955:X=426,Y=34][957:X=432,Y=39]
[962:X=489,Y=40][977:X=340,Y=142][979:X=421,Y=117][981:X=328,Y=146][986:X=355,Y=145]
[989:X=339,Y=101][990:X=339,Y=101][991:X=339,Y=101][995:X=303,Y=130][997:X=324,Y=173]
[1001:X=303,Y=181][1003:X=303,Y=184][1006:X=299,Y=193][1034:X=318,Y=183]
[1035:X=401,Y=181][1038:X=386,Y=175][1041:X=430,Y=181][1046:X=420,Y=170]
[1047:X=430,Y=150][1052:X=431,Y=127][1054:X=418,Y=99][1055:X=426,Y=90]
[1056:X=426,Y=90][1064:X=216,Y=195][1085:X=283,Y=166][1086:X=202,Y=214]
[1089:X=194,Y=210][1090:X=173,Y=201][1091:X=191,Y=149][1093:X=191,Y=149]
85
Assessment of Indoor Positioning System (IPS) technology INF5960
[1097:X=246,Y=166][1099:X=350,Y=172][1102:X=357,Y=162][1106:X=346,Y=166]
[1108:X=345,Y=165][1110:X=345,Y=163][1112:X=355,Y=178][1113:X=399,Y=189]
[1115:X=369,Y=215][1116:X=332,Y=247][1118:X=306,Y=189][1120:X=306,Y=189]
[1121:X=346,Y=210][1122:X=402,Y=194][1126:X=200,Y=179][1127:X=200,Y=179]
[1129:X=200,Y=179][1130:X=200,Y=179][1131:X=200,Y=179][1132:X=337,Y=171]
[1135:X=411,Y=142][1136:X=411,Y=142][1137:X=411,Y=142][1138:X=222,Y=172]
[1140:X=222,Y=172][1141:X=222,Y=172][1142:X=222,Y=172][1144:X=282,Y=218]
[1146:X=213,Y=342][1148:X=213,Y=342][1149:X=213,Y=342][1159:X=276,Y=228]
[1163:X=276,Y=228][1164:X=322,Y=283][1170:X=477,Y=280][1173:X=255,Y=205]
[1178:X=255,Y=205][1182:X=349,Y=231][1183:X=300,Y=238][1186:X=300,Y=238]
[1188:X=326,Y=293][1189:X=364,Y=424][1191:X=372,Y=341][1195:X=372,Y=341]
[1196:X=363,Y=376][1206:X=345,Y=279][1207:X=354,Y=305][1221:X=337,Y=311]
[1222:X=357,Y=293][1223:X=373,Y=294][1225:X=380,Y=302][1227:X=424,Y=371]
[1230:X=408,Y=341][1232:X=407,Y=325][1238:X=408,Y=327][1239:X=421,Y=373]
[1242:X=401,Y=367][1244:X=333,Y=414][1246:X=352,Y=398][1247:X=365,Y=396]
[1250:X=389,Y=398][1252:X=451,Y=417][1254:X=439,Y=415][1255:X=415,Y=411]
[1258:X=357,Y=358][1259:X=347,Y=369][1260:X=271,Y=360][1268:X=294,Y=356]
[1269:X=340,Y=332][1270:X=341,Y=345][1272:X=342,Y=334][1273:X=256,Y=362]
[1274:X=256,Y=362][1279:X=324,Y=332][1281:X=400,Y=322][1282:X=390,Y=318]
[1283:X=382,Y=339][1285:X=380,Y=337][1286:X=332,Y=383][1287:X=332,Y=383]
[1288:X=332,Y=383][1291:X=359,Y=336][1292:X=388,Y=274][1294:X=391,Y=284]
[1296:X=456,Y=370][1301:X=434,Y=340][1302:X=422,Y=323][1304:X=413,Y=326]
[1305:X=379,Y=309][1308:X=374,Y=303][1310:X=363,Y=305][1313:X=364,Y=304]
[1315:X=361,Y=306][1320:X=363,Y=299][1322:X=368,Y=287][1324:X=369,Y=284]
[1325:X=407,Y=261][1327:X=418,Y=249][1328:X=477,Y=210][1329:X=502,Y=235]
[1330:X=499,Y=220][1332:X=586,Y=228][1335:X=564,Y=221][1337:X=585,Y=275]
[1338:X=591,Y=257][1339:X=611,Y=250][1340:X=611,Y=250][1341:X=574,Y=259]
[1343:X=510,Y=249][1344:X=510,Y=249][1345:X=569,Y=218][1347:X=536,Y=227]
[1348:X=535,Y=225][1350:X=535,Y=225][1351:X=535,Y=225][1360:X=550,Y=282]
[1365:X=586,Y=371][1367:X=602,Y=375][1369:X=633,Y=348][1377:X=549,Y=334]
[1378:X=382,Y=307][1379:X=382,Y=307][1380:X=382,Y=307][1383:X=382,Y=307]
86
Assessment of Indoor Positioning System (IPS) technology INF5960
[1384:X=533,Y=371][1386:X=533,Y=371][1388:X=533,Y=371][1390:X=482,Y=278]
[1393:X=533,Y=157][1395:X=533,Y=156][1398:X=535,Y=156][1402:X=528,Y=146]
[1405:X=515,Y=126][1407:X=530,Y=120][1410:X=531,Y=162][1412:X=566,Y=275]
[1413:X=560,Y=264][1414:X=566,Y=278][1415:X=566,Y=278][1417:X=566,Y=278]
[1419:X=569,Y=262][1422:X=567,Y=270][1424:X=576,Y=249][1429:X=506,Y=250]
[1431:X=376,Y=230][1432:X=504,Y=224][1434:X=504,Y=224][1435:X=429,Y=233]
[1436:X=383,Y=258][1438:X=383,Y=258][1440:X=422,Y=240][1443:X=475,Y=217]
[1444:X=527,Y=111][1446:X=527,Y=111][1447:X=527,Y=111][1448:X=471,Y=181]
[1450:X=488,Y=156][1451:X=488,Y=156][1452:X=467,Y=192][1454:X=551,Y=275]
[1456:X=543,Y=226][1457:X=598,Y=248][1459:X=598,Y=248][1461:X=587,Y=223]
[1462:X=591,Y=224][1464:X=591,Y=224][1477:X=664,Y=220][1478:X=778,Y=188]
[1480:X=778,Y=161][1481:X=777,Y=83][1482:X=777,Y=83][1486:X=777,Y=83]
[1489:X=777,Y=83][1490:X=777,Y=83][1491:X=777,Y=83][1494:X=714,Y=142]
[1496:X=446,Y=203][1498:X=466,Y=226][1500:X=487,Y=223][1503:X=481,Y=223]
[1505:X=412,Y=265][1513:X=430,Y=258][1514:X=467,Y=272][1516:X=451,Y=263]
[1517:X=476,Y=253][1518:X=476,Y=253][1521:X=662,Y=277][1522:X=662,Y=277]
[1526:X=563,Y=218][1528:X=556,Y=110][1530:X=557,Y=130][1531:X=562,Y=156]
[1563:X=525,Y=141][1564:X=451,Y=112][1567:X=457,Y=95][1568:X=469,Y=61]
[1569:X=549,Y=82][1571:X=534,Y=89][1573:X=598,Y=105][1578:X=618,Y=128]
[1581:X=673,Y=157][1583:X=673,Y=155][1586:X=675,Y=152][1591:X=649,Y=141]
[1593:X=598,Y=120][1594:X=599,Y=115][1600:X=575,Y=126][1603:X=596,Y=120]
[1604:X=611,Y=128][1606:X=596,Y=195][1607:X=602,Y=176][1609:X=599,Y=205]
[1611:X=625,Y=227][1612:X=613,Y=219][1615:X=740,Y=240][1616:X=697,Y=225]
[1617:X=735,Y=237][1619:X=730,Y=230][1620:X=720,Y=217][1623:X=720,Y=217]
[1625:X=496,Y=132][1652:X=563,Y=161][1653:X=468,Y=118][1654:X=463,Y=125]
[1656:X=431,Y=184][1658:X=447,Y=163][1661:X=467,Y=178][1663:X=463,Y=177]
[1666:X=461,Y=173][1688:X=488,Y=133][1690:X=542,Y=53][1696:X=542,Y=53]
[1697:X=500,Y=94][1699:X=354,Y=211][1700:X=354,Y=211][1701:X=354,Y=211]
[1702:X=354,Y=211][1703:X=354,Y=211][1705:X=354,Y=211][1706:X=448,Y=199]
[1709:X=575,Y=210][1711:X=625,Y=245][1714:X=644,Y=227][1716:X=732,Y=227]
[1719:X=544,Y=170][1720:X=544,Y=170][1722:X=636,Y=199][1723:X=588,Y=194]
87
Assessment of Indoor Positioning System (IPS) technology INF5960
[1725:X=588,Y=194][1727:X=599,Y=205][1728:X=576,Y=221][1730:X=508,Y=134]
[1731:X=521,Y=174][1733:X=531,Y=220][1734:X=531,Y=220][1736:X=531,Y=220]
[1737:X=484,Y=189][1738:X=443,Y=180][1740:X=443,Y=180][1741:X=580,Y=145]
[1742:X=536,Y=163][1744:X=584,Y=165][1745:X=587,Y=170][1747:X=589,Y=180]
[1748:X=592,Y=187][1749:X=619,Y=222][1751:X=612,Y=215][1752:X=623,Y=222]
[1754:X=567,Y=129][1769:X=580,Y=135][1790:X=552,Y=57][1797:X=556,Y=69]
[1800:X=566,Y=93][1806:X=568,Y=105][1808:X=584,Y=149][1810:X=584,Y=153]
[1813:X=623,Y=201][1851:X=608,Y=194][1854:X=606,Y=198][1862:X=593,Y=211]
[1864:X=614,Y=219][1866:X=600,Y=225][1868:X=615,Y=224][1869:X=616,Y=227]
[1870:X=632,Y=224][1871:X=632,Y=224][1873:X=632,Y=224][1874:X=583,Y=208]
[1876:X=521,Y=155][1877:X=521,Y=155][1879:X=533,Y=173][1880:X=575,Y=205]
[1882:X=575,Y=205][1883:X=482,Y=60][1885:X=482,Y=60][1890:X=482,Y=60]
[1892:X=474,Y=198][1893:X=387,Y=348][1895:X=381,Y=346][1896:X=401,Y=350]
[1898:X=403,Y=370][1899:X=418,Y=400][1903:X=418,Y=400][1904:X=418,Y=400]
[1905:X=190,Y=247][1908:X=262,Y=295][1910:X=154,Y=300][1913:X=134,Y=252]
[1915:X=162,Y=185][1918:X=64,Y=207][1920:X=66,Y=218][1923:X=72,Y=239]
[1925:X=105,Y=251][1927:X=88,Y=270][1930:X=162,Y=175][1935:X=65,Y=211]
[1936:X=162,Y=179][1937:X=162,Y=179][1938:X=162,Y=179][1943:X=313,Y=297]
[1966:X=274,Y=298][1975:X=471,Y=420][1978:X=162,Y=181][1980:X=211,Y=256]
[1983:X=162,Y=167]
88