Embed Size (px)
Citation preview
Linköping University
Institute of Technology
Master Thesis
Evaluation of potentially eco-efficient solutions: Functional Sales and Industrial Ecology
By: Santiago González Ocón
Supervisors: Tomohiko Sakao (LiU) and Nozomu Mishima (AIST, Tsukuba, Japan)
Linköping – 2009-06-26
ISRN: LIU-EIE-TEK-A—09/00662--SE

Abstract
Design of products permits to yield goods and services to produce satisfaction on customers, which is measured as value. However, it is at this stage in which most of the environmental impact, from a lifecycle perspective, is added to the product. Eco-design aims at increasing value of products while reducing the burdens on the environment by means conscious design towards efficient use of resources. That efficiency, referred to as eco-efficiency, can be increased in a number of manners within environmental engineering. Traditionally, different fields have tackled materials, energy flows and products from different angles or approaches. In this thesis we describe Functional Sales (FS) and Industrial Ecology (IE) as examples of these. Within this latter, we put emphasis on Industrial Symbiosis (IS) and Eco-effectiveness. We consider these approaches are suitable to work in the framework of eco-design to increase eco-efficiency. By adding services to material products, and managing material and energy flows with a more ecological consciousness, we expect to increase value of products while reducing the impact on the environment.
To analyse this potential improvement, we developed a method involving a new eco-efficiency index (VERI), that recursively intends to ease decisions on possible eco-efficient alternatives. This index and its method are applied to a case study on management of olive oil supply in region of Murcia, Spain. Here, we propose three scenarios that will involve the implementation of FS and IE to compare the outcomes in value and environmental performance against an idealised current supply chain. The results obtained, although not accurate, suggest that FS and EI should be more taken into account in eco-design and, this latter, to also consider holistic viewpoints to find more eco-efficient alternatives for a product development.

Acknowledgements
I want to dedicate this thesis to my parents Santiago and Pilar, my girlfriend Verónica and my sister Pilita because they always believed in my work and were there at the best and worst moments. This thesis is as much yours as mine. Also all the support from my friends and classmates has been priceless.
This work has been a hard labour carried out mainly in AIST Tsukuba, Japan, at all costs. I would have not even started without the great amount of help that I received there. I specially thank Dr.Mishima and Dr.Kondoh for their invaluable contribution to the method here developed, their ideas and for covering my lack or expertise in the field. I am really thankful towards AIST for letting me cooperate with them for three months sharing knowledge in their comfortable and productive engineering environment. During my stay in Tsukuba I always felt most welcome by those who surrounded me. I would like to give special gratitude to Dr.Mishima and his wife Kuniko-san, for all their kindness and concern and taking good care of me during my stay, my lab-mates Matsumoto-san, Katsuya-san, Kondoh-san and Kurita-san for the unforgettable feeling of friendship that they gave to me (and dinners and karaoke sessions!). Also I thank to all the members in the Environmentally Conscious Design division for creating a warm atmosphere and their efforts to understand me with my outrageously low level of Japanese.
Back in Linköping, I want to thank to my supervisor Tomohiko Sakao for his comments and give special mention to Michael Martin and Niclas Svensson for their unselfish help with data regarding biodiesel production and environmental impact. At a higher level, I give thanks to Linköping University for easing my experience in AIST to develop this thesis.

Table of contents
1. Introduction .......................................................................................................................................... 1
1.1 Background ................................................................................................................................. 1
1.2 Goal ............................................................................................................................................. 3
1.3 Research Questions ..................................................................................................................... 3
1.4 Limitations ................................................................................................................................... 3
2. Theoretical background ....................................................................................................................... 5
2.1. Eco-efficiency.............................................................................................................................. 5
2.1.1. Definition of Value ................................................................................................................ 5
2.1.2. Environmental impact ............................................................................................................ 7
2.1.3. Eco-efficiency index .............................................................................................................. 9
2.2. Industrial ecology ...................................................................................................................... 10
2.2.1. Managing the flows.............................................................................................................. 11
2.2.2. Eco-effectiveness ................................................................................................................. 12
2.3. Functional Sales (FS) ................................................................................................................ 14
3. Integration of Functional Sales and Industrial Ecology in an eco-design framework ........................ 17
3.1. Potential consequences on eco-efficiency ................................................................................. 17
3.1.1. Functional sales and eco-efficiency: optimising the ratio .................................................... 18
3.1.2. Industrial ecology and eco-efficiency: greening the performance. ...................................... 20
3.2. Measuring gains in eco-efficiency: proposed eco-efficiency index ........................................... 23
3.2.1. Calculating Utility Value (UV) of a product/service ........................................................... 25
3.2.2. Calculating Lifecycle Environmental Impact (LCE) ........................................................... 30
3.2.3. Calculating eco-efficiency: Value-Environment Recursive Index (VERI) .......................... 37
4. Case study: Olive oil material flow management. ............................................................................. 47
4.1. Background of the case study .................................................................................................... 47
4.2. Scope definition: a year of olive oil consumption at homes in city of Murcia .......................... 54
4.3. Method, limitations and assumptions ........................................................................................ 56
Option A. Current Situation: olive oil as a material product available at markets ............................. 58
Option B. Easing supply and collection: olive oil as a functional product ........................................ 61
Option C. Option B plus recycling of waste oil: closing the loops and returning to soil ................... 63
4.4. Application of methodology proposed to those options. Results............................................... 65
4.4.1. Utility Value ........................................................................................................................ 65
4.4.2. Lifecycle Environmental Impact LCE ................................................................................. 69
4.4.3. Value-Environment Recursive Index (VERI) ...................................................................... 74
5. Discussion .......................................................................................................................................... 77
5.1. Answers to the Research Questions ........................................................................................... 82
6. Conclusions ........................................................................................................................................ 83
7. References .......................................................................................................................................... 85
8. Appendix ............................................................................................................................................ 89
Table of figures
Figure 1. Evolution of information and degree of freedom through a design process ............................... 17
Figure 2. General representation of a EI-99 construction .......................................................................... 32
Figure 3. Basic flow chart of a LCE of a coffee-machine (functional Unit) .............................................. 34
Figure 4. Graph LCE-UV depicting basic VERI features. ........................................................................ 38
Figure 5. Suggestions for setting of LCEgoal(z) ....................................................................................... 39
Figure 6. Assessment with VERI for options in positive quadrant (left) and negative quadrant (right) .... 42
Figure 7. Ideal evolution of results by utilising VERI methodology. ........................................................ 42
Figure 8. General sketch for initial status for VERI method: generic depiction of Step 0 ........................ 43
Figure 9. Flowchart of VERI method, including sub-methods (i.e. MCA and LCE methods) for assessment of future designs, in line with EMS goals. ............................................................................... 45
Figure 10. Price moves from harvest 2005/2006 to harvest 2008/2009 in the main oil markets (Spain and Italy) ........................................................................................................................................................... 48
Figure 11. Evolution of average consumption of cooking oils in Spain between years 1987-2007. It includes both consumption at home and outside home .............................................................................. 48
Figure 12.Trends of consumption per capita (in %) of cooking oils in Spain at home and outside home (restaurants, fast-food chains, food industry, etc.). ..................................................................................... 49
Figure 13.Trends of consumption (in %) of cooking oils in Spain outside Spanish homes (restaurants, fast-food chains, food industry, etc) ........................................................................................................... 49
Figure 14.Trends of consumption (in %) of cooking oils at Spanish home. .............................................. 50
Figure 15. Distribution of the population of Spain by their status and type of home in 2007 ................... 51
Figure 16. Statistics of visits to restaurants and bar/taverns for dinning in Spain 2007-200851
Figure 17. Distribution of consumption of main cooking oils, according to a social distribution based on homes structures in Spain, 2007-2008 ........................................................................................................ 53
Figure 18. Contribution to average consumption of main cooking oils by status and homes structures in Spain. .......................................................................................................................................................... 53
Figure 19. Location of region of Murcia in Spain (left) and its capital, city of Murcia, and the other main cities Cartagena and Lorca (right) .............................................................................................................. 54
Figure 20. (left) Annual consumption per inhabitant of main food categories in regions of Spain (kg/person·year); (right) annual total food consumption (Kg/person·year) and food expenditures (€/person·year) per inhabitant in regions of Spain. Data: year 2007 .......................................................... 55
Figure 21. Flowchart considered for Option A .......................................................................................... 58
Figure 22. Basic scheme of transesterification reaction ............................................................................ 60
Figure 23. Flowchart considered for Option B. ......................................................................................... 61
Figure 24. Flowchart considered for Option C. ......................................................................................... 63
Figure 25. Changes (%) in exhaust emissions from combustion, for different tests in a diesel engine (old design from Perkins), of biodiesel produced from waste olive oil against regular fossil diesel ................. 73
Figure 26. VERI method (final results) applied to our case study. ............................................................ 74
Figure 27. Selection of option B as an eco-efficient solution for our EM goals ........................................ 75
List of abbreviations
AHP: Analytical Hierarchy Process BAT’s: Best Available Technologies CSM: Customer Satisfaction Measurement CVD: Customer Value Determination EI/EPI: Environmental Indicators/Environmental Performance Indicators EI-99: Eco-Indicator 99 EM: Environmental Management EMAS: Eco-Management and Audit Scheme EMS: Environmental Management System EVR: Eco-cost/Value Ratio FP: Functional Products FS: Functional Sales FT: Functional Thinking GWP: Global Warming Potential GWP100: Global Warming Potential (time span of 100 years life in the atmosphere) IE: Industrial Ecology INE: National Institute of Statistics (Spain) INIA: National Institute of Research on Agricultural and Food Technology (Spain) IOC: International Olive Council IS: Industrial Symbiosis LCA: LifeCycle Assessment LCC: LifeCycle Cost LCE: LifeCycle Environmental impact MAPA /MARM: Spanish Ministry of Agriculture, Fishing and Food. MCA: Multi-Criteria Analysis MFA: Material Flow Analysis MIPS: Material Intensity Per unit of Service NPK: Nitrogen, Potassium and Phosphorus (basic fertiliser) NS: Normalised Score NW: Normalised Weight PI: Physical Indicators PSS: Product Service Systems QFD/QFDE: Quality Function Deployment/ QFD for Environment RS: Raw Score RW: Raw Weight SE: Service Engineering SFA: Substance Flow Analysis SMART: Sizeable, Measurable, Accepted, Realisable, Timed SME: Small-and-Medium-sized Enterprise TCP: Total Care Products TMR: Total Material Requirement TPI: Total Performance Index UV: Utility Value VoC: Voice of Customer WBCSD: World Business Council for Sustainable Development WS: Weighted Score WWTP: Waste Water Treatment Plan

Page | 1
1. Introduction
There are nowadays many theories and approaches that, in good faith, try to find universal solutions to current and future environmental problems. These approaches come from different perspectives, depending on the field and area of expertise. In many cases environmental causes are linked to other concerns such as economic factors, managerial strategies or the will of improving the wellbeing of humans. Design plays a mayor role in this battle: on the one hand it must comply with creating value in products to please customers; on the other hand, materials, energies and processes are implied, and involve some impact (positive or negative) on the environment. Eco-design is a strategy by which the value of the products is to be increased whilst the negative impact on the environment is minimised, acting from the design stage. When reached those goals, it is said that the product or company is “eco-efficient”. But, how is it possible to measure that eco-efficiency? How is it possible to reach those objectives?
This thesis describes some of the approaches aforementioned. These are Functional Sales (FS), and Industrial Ecology (IE). The idea is to apply them in the framework of eco-design to produce gains in eco-efficiency. With this, we intend to demonstrate the beneficial potential on value creation and the environment that it can have the combination of a variety of approaches that, historically, have been tackled separately. In the following chapters we will describe the underlying theories and will also develop and index (what we will define as VERI later in the thesis) and a method to measure that called eco-efficiency. We also propose a case study based on olive oil material management in a region of Spain, in which the approaches will be applied and the outcomes on eco-efficiency measured with our method and index. Such case study can be understood as an idealised example of application with real data, since in a real scenario deeper considerations should be involved.
1.1 Background
It is rather odd that someone has not heard about problems such as global warming, material depletion or animal extinction that affect us all. Since industrial revolution on late 18th and through 19th century, productions have expanded all over the world making it possible to process huge flows of materials for production with the energy released from combustion of fuels. As the wellbeing was increasing, so was the competiveness in the market and the demand on new products and services for which more materials and energy where needed. In 1992, during the Earth Summit in Rio de Janeiro, terms such as sustainability where discussed on the basis of a more rational, equitable and long-term-perspective-aimed use of resources. In this scenario, eco-efficiency emerged as a paradigm towards which every sustainable aim should focus. This concept was defined by the World Business Council for Sustainable Development (WBCSD), which involves around 200 international companies, as follows:
‘Eco-efficiency is reached by the delivery of competitively priced goods and services that satisfy human needs and bring quality of life, while progressively reducing ecological impacts and resource intensity throughout the life cycle, to a level at least in line with the earth’s estimated carrying capacity’ [7, p.2].
Page | 2
This term, involving environmental, economic and social issues, meaning “obtaining the most requiring the least”, has been rather widespread. But, what does this term involve? What are the factual consequences of its application in processes and in the environment? How can it be effectively measured and compared for evaluation of alternatives? These are some questions that may not have such an easy answer as compared with the meaning of the term in it self.
As well, the ultimate goal of a product or service is to please some demand and needs in a “satisfactory” way, which is a rather abstract concept. It seems to be clear that the more “valuable” a product/service is, the more it seems to satisfy the needs in a more or less expected manner and to some certain extent. The term eco-efficiency is inevitably linked to this concept. We, as daily consumers of products and service, have an idea of what “value” is. However, Walid and Yannou [8] demonstrate a wide variety of definitions and ideas about it, depending on the actor, shareholder or field that is evaluating. Also they argue that, in any way, value is built up within a company by means of processes and management whereas it will be judged in the market [8, p.170], that is becoming more and more competitive. Hence, there ought to be some definition of value such that can be applied in a business so that the needs via products and services are covered effectively and create satisfaction in the customer. An effort to unify criteria to combine the company’s, shareholders’ and consumers’ wishes must be carried out so that the term can be effectively applied in eco-efficiency. In other words, a need for a unifying definition of value in the bridge business-customer involving both points of view is to be found.
Meanwhile, the global concern about environmental issues increases. It is becoming usual that customers do not want to, or cannot, receive the desired product/service for satisfaction when the environmental and social burdens associated overpass a level of acceptance [9]. Alternatively, Rodriguez-Ibeas [20], by way of a detailed economic analysis, concludes that the increase of awareness may not be ‘good news’ for the environment owing to market prices; green products nowadays are more expensive as a result of the care they require, and more pollutant companies will take and advantage of reduced price to capture non-devoted green consumers. Environmentally friendly production should experience a change towards competitiveness. As technologies advance, information is more openly available which suggests that the social concern will continue to increase the pressure over companies towards cleaner managements and processes. Whatever means is not and will not be acceptable to cover the human needs and wishes if sustainability is not the leading machinery to make the system work.
Hence, the present and future scenarios require that companies continue offering products and services competitively in the market i.e. increasing value, whilst the burdens in the environment are minimised. Both parameters (value and environmental impact) may be expected to be the reference for a company’s success. Any approach that can help to improve those factors should be evaluated for further consideration and possible application together with eco-design.
Page | 3
1.2 Goal
The aim of this thesis is to show the potential effects on eco-efficiency of FS and IE. For this evaluation we must develop a suitable eco-efficiency index. Such index is intended not only to evaluate the current performance, but also to guide and assess future eco-designs. It must involve a methodology, and be exemplified by a case study. This latter shall clearly demonstrate the possible benefits and drawbacks of FS, IE and the index proposed.
From the academic viewpoint, the thesis intends to propose some “conciliation” among the disciplines available in environmental management and engineering, and propose a new method to calculate eco-efficiency to be applied at a systems level.
In practice, the thesis must provide a simple tool for companies to evaluate eco-efficiency of their products. Likewise, it aims at broadening the scope of solutions for eco-designers, by combining other available approaches that tackle similar issues but from holistic viewpoint.
1.3 Research Questions
This research should clearly respond to the following questions
RQ1. Is there a representation of value that could satisfy eco-efficiency index expressions?
RQ2. Could functional sales serve as a means to increase value of a product while reducing environmental impact?
RQ3. Is eco-effectiveness an issue to be considered more in product/service design according to the results?
RQ4. How applicable is in fact the theory suggested in the research to the case study selected?
RQ5. Is it possible to apply the evaluation method (VERI), in general, to other cases?
1.4 Limitations
Owing to geographical and economic differences, policies, dynamism and arrangements all over the world we estimated convenient not to depict value in economic terms. Nor will we detail economic consequences from the application of the theories here introduced. Even though some facts at a global level may be mentioned in this thesis, as we are concerned of their real implication in the systems proposed, no major economic details or analysis should be expected in this sense, leaving them for further research. The theoretical background considered, the analysis, case study and conclusions will interpret value as a rate of customer’s level of satisfaction.
The case study to support the theoretical background has been selected according to practical reasons such as data availability and potential applicability. The scope and boundaries of that case are to create a hypothetically ideal business situation involving a simple case of material flow. As a result, the outcomes of the application of the theory to real cases of higher
Page | 4
complexity or different nature could be somewhat unpredictable. Nonetheless, the results are expected to, at least, offer some hints of the potential benefits on eco-efficiency.
There were no up-to-date values of Eco-indicator 99 (proposed in section 2.1.2) accurate enough so as to be applied in the case study. Nevertheless, we explain the use of Eco-indicator 99 for being a good example of integrated indicator (i.e. involves various types of effects) that can be applied to the method proposed in section 3.2.3. Any similar indicator can be likewise used instead (just as it has been in the case study) by extrapolating the requirements of the methodology of the index proposed to the alternative ones. Global Warming Potential (GWP) was used instead.
The assumptions made, due to the short time-span and data availability at the time of the research, have affected the accuracy of the results. Such assumptions do not take into account practicability, feasibility or viability of the system proposed, although we believe the technical system proposed could be interesting. As it is an idealisation, many other alternative systems including those approaches could have been considered. Anyhow, we would prefer it to be taken rather as an example of application that makes use of real data.

Page | 5
2. Theoretical background
2.1. Eco-efficiency
In the introduction we defined eco-efficiency as a concept that comprises ecological and economic and social concerns in the creation of value to satisfy human needs and create wellbeing. In order to be able to define this concept further, we must understand what value and environmental impact are. In the following sections, we define these parameters. We will also set a framework to at a later stage explain the possible means to improve them.
2.1.1. Definition of Value
In the introduction we noted a lack of clear unified definition of value that may satisfy both the producer and the customer’s viewpoints. This concept depends greatly upon the arena from which it is tackled. Walid & Yannou [8] discuss that this concept depends on the expertise, the actors, the circumstances, et cetera. Even within a same company many different perspectives can be found. Table 1 below summarises some ideas gathered from experts in the field of value, according to their roles in the chain. From this summary, some global idea seems to exist among all the definitions although it is rather complex to find the right words and explanation to gather all the focuses. Some general hints may suggest that value is something that, as a consequence of a customer’s contentment for having their goal and perspectives satisfied, generates a feedback in the company such that permits and economic and/or strategic growth.
Table 1. Some criteria and basis that define value within a company (source: A. Walid & B. Yannou [8]) and from a customer viewpoint (source: R. Woodruff [10])
Roles/fields Perception or criteria of value
Economics Based on value-utility theories. ‘Related to the quality of the product’. ‘It is an intrinsic feature’
that makes it possible to distinguish products. ‘A same object can see its value increasing or
decreasing as the desire of the subject that needs it increases or decreases’.
Finance Based on returned value theories. ‘The value of the company is comparable to a capital, which,
placed at a certain rate of capitalization, gets an income equal to the amount of the profit of
the company’. It is also usual to add the ‘goodwill’ to the arithmetic.
Marketing Comprise ‘value of purchase’ and ‘value of consumption’. They refer to the value a customer
perceives at the time of purchasing a product and its value when making use of it. The
transaction between both involves ‘moral values’.
Design ‘Value is materialised into a product (or service)’. High value means satisfying customers’
expectations at a relatively low cost for the company.
Management High value means that it satisfies a triple constraint: shareholders, customers, employees.
The surrounding community is also becoming important to satisfy when creating value in a
company or product.
Customer ‘Customer value is a customer's perceived preference for and evaluation of those product
attributes, attribute performances, and consequences arising from use that facilitate (or block)
achieving the customer's goals and purposes in use situations’.
Theories on economics have somehow translated throughout centuries this abstract concept into money and materialised it into different currencies all over the world (e.g. [12, p.5]). Such concept has been so deep-rooted in society that even to trade goods of similar nature (e.g. a pair of trousers and a shirt) is not unusual to unconsciously convert its value into currencies for fair trading. But in line with Woodruff when he states that ‘customer value is something perceived by customers rather than objectively determined by a seller’ [10, p.141], unless there is a real proximity between customer and producer, an “appropriate” price that satisfies both actors is
Page | 6
unlikely to be fitted. He also argues that ‘consumers may consider somewhat different attributes and consequences” at the time of the purchase and at the time of usage [10, p.141]. This suggests that after an experience with a product or service, the valuation of these latter may change, and it will rarely be perceived by the seller or producer – at least in the short term.
Some techniques such as Customer Satisfaction Measurement (CSM) or Customer Value Determination (CVD) have proposed an approach to capture customers’ perception of the products and services. Furthermore, some computer-based systems have been presented to include the customer’s perception of current products into design and production stages to “recommend” alternatives to customise a family of products [13]. But even such technologies fail in the adaption of the customer’s insights on the perception of value in a certain arena at the very moment they are being surveyed. This view coincides with Woodruff [10] who, apart from that fact, argues that related approaches such as CSM or CVD to determine a customer’s value perspective, should be able to analyse hundreds of different attributes, being them all different for each customer and that possible surveys would reflect today’s situation but not future. These approaches seem to be somewhat tricky then.
Moreover, currencies all over the world are changing their relative price. Consequently, someone in a different country, using their currency unit as a reference, may see how value of a product/service is enhanced or decreased even when the producer has not applied changes on it. In other words, the quality and satisfaction coming from the use of a product/service might be the same whilst from abroad it can be perceived a change in its valuation due to fixation of price to a certain currency. To depict this idea let us compare a punctual trend of Yens and Euros. The price of Japanese Yens in Euros arose 29% in a matter of a year1. This means that some European traveller that has gone to Japan a year ago and bought a sandwich-maker, if visiting today, would have to pay around 29% more for the same sandwich-maker, even though the model and the price in Yens remained the same i.e. the value of the item has not changed but the cost for that customer arose.
If monetary value is considered, it is expected that it does not reflect by itself the actual link between what the customer appreciates and to what extent that was understood by the company, and will also vary in time and space. It is obvious that price will influence our decisions, but one cannot offer high prices if the goods do not fulfil requirements. As well, when prices are relatively close amongst different alternatives, other non monetary factors gain in priority [20].
Therefore, taking into consideration all the arguments written above, a definition of value other than merely a price or economic based one is to be considered in this research. The core shall be more focused onto customer’s perception of different options or alternatives given that may fulfil their expectations. As we will see in section 3.2.1we will refer to it as Utility Value (UV).
1 Information provided by Bloomberg as of 30th of January 2009. (available at: http://www.bloomberg.com/apps/news?pid=20602081&sid=ahvrBCZnV_OI&refer=benchmark_currency_rates )
Page | 7
2.1.2. Environmental impact
People have an idea in mind about what environmental impact is. Yet, there are many definitions and concepts associated to it that link this concept with technical, economic or social aspects for strategic use. The definition will depend then on the field of application, its needs and goals. It is not the goal of this research to gather all those definitions although it is worth to present some that could be of interest for the development of the ideas presented on this thesis.
From the ecological viewpoint, environmental impact is a consequence on the environment – positive or negative – of an action, be it human or not, that alters the present ecological state at a local or global level. Probably the straightest ideas could be about the emissions of a car, or the pollution of rivers and seas due to uncontrolled disposal of waste from industries and transportation. However, the emissions from a volcano, the unusual settlement of some specie in an area or a tsunami can likewise harm the environment. These impacts are known as negative since they “destroy” the equilibrium on the biosphere as we know it now. On the other hand, reforestation of typical local trees and protection of wild areas from human reach are some examples of positive impacts of actions. As natural processes are not controllable, we will focus the discussion on the human activities and its consequences.
What is “positive” or “negative” still can be subjected to discussion. Any society on earth aims at increasing or at least keep their wellbeing, being more or less in harmony with their surroundings. But intrinsically (as no other animal specie would) none of them will sacrifice their existence to save the environment, and the interaction between humans and resources is inevitable. For example, even little extraction of mineral to produce tools in an isolated tribe has some ecological effect as the original materials come in a natural rock. The useful material has to be extracted, processed and moulded. For that they may need other tools also and likely use some energy resource. The surroundings will not only have affected the landscape by the extraction of the rock, but also by some “extra” material that will not be useful part and will become, thus, a waste. When we translate similar systems to a macro-economy level, it is expected a huge impact on the environment. This unused material flows related to extraction and processing of materials is referred to as ‘ecological rucksack’ [2] and represents only a part of the impacts of human activity. The goods themselves will become waste to some extent at the end of their useful life. In addition, energy inputs and outputs from generation processes contribute greatly to the consequences on the environment, releasing particles, chemicals and residual heat in amounts that cannot be accepted by the surroundings without affecting the biosphere. Materials, goods, wastes and their ecological rucksacks are spread all over the earth, and giving rise to a dissipative use of materials and concentration in areas where they are rare. Every duality material-energy, according to Cohen-Rosenthal [56] creates unavoidable entropy that is to be minimised or else taken an advantage of to reach sustainability.
To minimise the impact, it is necessary to identify flows of energy and materials. There are several theories and ways to tackle the quantification based on the type of results that are pursued. For instance, the Material Intensity Per unit of Service (MIPS) concept, developed by the Wuppertal Institute for climate, environmental and energy (Germany), distinguishes among abiotic and biotic raw materials, soil movements, water and air flows involved in a determined region, generally at a national level [2]. By doing this, it is possible to do a balance of inputs and outputs within the boundaries to identify accumulation or depletion of materials, to spot possible burdens on the environment. However this method is a mere counting of flows and

Page | 8
does not give away much information about the causes and sources of the emissions to have an actuation over them. Material Flow Analysis (MFA) and Substance Flow Analysis (SFA) yield an inventory of flows of materials or specific substances, respectively, to produce a functional unit or rather a unit of service (e.g. [57], [58]). These inventories permit to identify the sources and quantities and, thus, what could harm the environment in the selected time and geographical scope. It can be further expanded to visualise the situation in future scenarios. Yet, their results are not normative i.e. do not state how good or bad that impact is or could be. Moreover, the results are strictly useful for the boundaries selected and not expansible to other cases.
So as to state what is bad or and what is not, it is usual to measure the impact according to a common substance that causes some well-known impact. They are known as indicators. The activity of carbon dioxide (CO2) in greenhouse effect is perhaps the most utilised reference when talking about global warming issues. Any substance that is likely to produce such effect is then compared to carbon dioxide by CO2 equivalent meaning that that equivalent amount of carbon dioxide would have the same impact on global warming. In this example the impact would be measured by Global Warming Potential (GWP) indicator. By making such comparison it is possible to evaluate the consequences of, for example, a certain emission from an energy source on the environment these terms. This method can be extrapolated to a wide variety of types of ecological and non-ecological impacts, by using a large list of indicators. Be that as it may, and despite the efforts put into this standardization, there is always a level of subjectivity which carries some uncertainty (more information regarding one of this approaches can be found in section 3.2.2). Therefore the numbers obtained should be used as a great reference when making a decision regarding environmental actuation, yet never as normative result. Attending only at ecological consequences, the solutions would be then perhaps easier but it is not the case. Several indicators can be used together to create a richer picture of the impacts. Municipalities are using them alongside social and economic indicators for making decisions, and they are due to comply with all those aspects, not only the ecological face.
Alternatively, large and small technical systems have developed much the economic aspect to evaluate the environmental performance i.e. the environmental impact has been measured in economic terms. It can be seen from many experts as the cost associated to an action to take the environment from the affected state to the previous state once that action is executed. This includes concepts such as integration of Best Available Technologies (BAT’s), reuse/recycling processes, maintenance, cleaning, etc. This strategy is used for instance in LifeCycle Cost (LCC) where direct and indirect costs – externalities – are calculated and compared to find out whether or not an alternative or product is viable or not. More technical approaches consider the economic savings from green practices (e.g. recycling, energy recovery, eco-design) and measure creation of economic value in goods and services compared against its externalities (e.g. [42], [43]) for decision making and comparing scenarios to chose the most cost-effective and less pollutant alternative.
In summary, in this section we give a brief picture of some of the ways by which environmental impact can be understood and measured. Of course, there are many other alternatives to describe such impact, perhaps more accurately than those presented here. By the aforesaid, the idea of an unavoidable impact on the environment and its interconnection with other important issues for society is presented, though. By understanding sustainability as the ability to reach one’s goals today not jeopardising future generation to reach theirs, it seems to be clear that ecological, economic and social aspects should be combined when making decisions about reducing the
Page | 9
environmental impact. Then it must be measured in a most suitable way for proper recognition of the real situation and the potential harm or benefits from an action.
2.1.3. Eco-efficiency index
The prefix “eco” stands not only for ecological concern, but also involves economic interests. It was noted in section 1.1 that the definition of eco-efficiency was about how to increase value of a product while decreasing the environmental impact of a performance. However, this idea could become somewhat ambiguous when an actor intends to measure how eco-efficient their actions are. The concept of eco-efficiency index was coined to help to solving this problem, although this has expanded to high complexity. Value and ecology are interconnected (refer to previous section) and seemingly is its difficult not to influence one another and not to take into consideration economic issues on the way. In its simplest form it is the ratio between value and environmental impact as2
��� � ��������� � ��� ���������������� � ��� �� �����
Yet, we have found that it is possible to measure these two parameters in a variety of ways depending on the criteria taken. How do companies deal with this ambiguity?
There is a wide range of indexes that represent eco-efficiency in diverse manners which makes about impossible to compare them. Following we introduce some to reflect this inconsistency. For instance, the Delft University of Technology in the Netherlands proposes Eco-cost/Value Ratio (EVR) as an index for eco-efficiency [59]. This ratio understands the relation between price of a product as value, divided by the direct costs plus those that it would involve the compensation of the harm in the environment caused in the entire lifecycle of a product i.e. externalities. In AIST in Japan, the environmentally conscious design group developed Total Performance Index (TPI, [42], [43]). Here, value is expressed as a sum of the contribution to the possible price in the market of the different stages in the lifecycle of a product; this is divided by the square root of the sum of the stages costs (internal) and the square root of the lifecycle environmental costs (externalities). Toshiba, instead, makes use of the “Factor T” [60], a self-invented indicator to show the evolution in performance of similar products through time. Factor T is referred to the improvements in a product of some technical parameters associated to increasing its value against the main impacts on the environment, also in a lifecycle perspective. Sakao et al. [41] propose a comparative index, in line with the Toshiba group’s idea. They compare improvements of a pair of products in technical characteristics as value creation against reduction of environmental impact, this time measured as Total Material Requirement (TMR).
All those examples reflect an individual approach to define eco-efficiency in a way, with understandable and reasonable background. However it is not possible to compare among them as they measure and calculate different concepts. Furthermore, the units do not coincide. Thus, we are in line with WBCSD [7, p.8] when they claim for some standardisation of an index for applicability at any level.
2As proposed in its original conception by the WBCSD [7; p.2]. It will be further developed later

Page | 10
Welford [62] compiled an amount of articles that describe how companies make use of eco-indexes in many different Environmental Management (EM) strategies to fulfil their objectives. For example, Toshiba provided its Factor T report enhancing the improvements in their products. But the lack of unification of criteria and interests produce diversity at tackling “eco” issues. An index, regardless the factors for its calculation, has to be clearly defined and represent what it was thought for: a number that unambiguously depicts the state of eco-efficiency of a company or product. In the Toshiba Factor T it is not completely clear the process of calculation and the parameters taken into account. In the article written by Erkko et al. [61] they reflect how Finish EMAS’s3 have been making use of environmental indicators liking them with the idea of sustainability, but there is no consistency on the reports. The type of information varies greatly among them and in the end the environmental aspects are diluted in a compendium of “extra” information. We can see that, so as not to create confusion, an index should be conveniently accompanied of documentation of sources that produce the factor for calculation. Moreover, the goals and objectives of a company should be also included so as to have an idea of the motivations and intentions and have some criterion of how well or badly the outcomes are and evaluate the determination of the entity towards eco-efficiency. All in all, an eco-efficiency index can be a tool for internal and external EM strategies, moreover as environmental concerns among population increase.
Hence, an eco-efficiency index can be of great utility for internal management and evaluation of the actuation. On the other hand, because of the lack of standardisation, the parameters value and environmental impact must be clearly defined to all stakeholders and supported by verifiable data in a report. This must include all the information that can be relevant to the affected actors – including final consumers. An index is, thus, just a mere summarising number that reflects the eco-actuation of the company; further information is mandatory regarding (among others) what is being analysed, what was expected, how the index has been calculated, what are the support data and what are the consequences of the actions, from value and environment perspective.
2.2. Industrial ecology
Industrial Ecology (IE) can be defined as “the study of industrial systems (materials and energy flows) from the perspective of natural ecosystems” [27, p.37]. Graedel and Allenby [2] developed this definition by claiming that it is the “means by which humanity can deliberately and rationally approach and maintain sustainability, given continued economic, cultural and technological evolution”. It is then a field of application of ecological systems to make the “synthetic” or industrial ones behave similarly aiming at sustainability as the ultimate goal. For Cohen-Rosenthal, one of the most fervent supporters of this field, it is about how to increase value of the products and systems, at present and future, by a less dissipative use of resources [56, p.1111]. All this implies that IE is mainly focused on the management of material and energy flows from the optimisation perspective to reduce raw material consumption, waste generation and production of noxious components in the life-cycle, to tackle environmental problems. This field includes a variety of green-oriented approaches. In the following sections, we present the general ideas and two specific trends that will be used in our case study.
3 EMAS is acronym for Eco-Management and Audit Scheme
Page | 11
2.2.1. Managing the flows
IE does not talk about eco-efficiency directly, although it may be intimately related to it at the very core of its conception. Managing the flows is the main idea behind. Here, it is intended to change the current waste-oriented mentality by means of strategies towards a more efficient use of materials. Graedel and Allenby defined this field as a ‘systems view in which one seeks to optimise the total materials cycle from virgin material, to finished material, to component, to product, to obsolete product and to ultimate disposal’ involving ‘ resources, energy and capital’[2, p.18]. Hence, IE inherently has to do with optimisation of materials, energy, economy, taking as a reference the resource administration the earth practises itself.
Managing material and energy flows in IE has two main strategies [2]: reducing the flow and closing the flow. These are to comply with for main principles that guide this approach.
1. Dispersal of substances from the lithosphere to the ecosphere must not occur faster than the rate by which this latter withdraws them and naturally returns them to the former.
2. Substances produced must be biodegradable and/or able to be integrated into natural cycles to be returned to the lithosphere. Also, production must not be faster than depletion.
3. The use of natural resources must pursue a definite goal and must be planned consciously. Usage must not systematically degrade the biosphere.
4. Basic human needs are to be met with as small an impact on the ecosphere as possible.
Reducing the flow implies a much more efficient use of resources so that the inputs in a lifecycle of a product are decreased. By reducing the flow, it may be possible to also reduce the costs associated in extraction, processes, transportation, et cetera. It is obvious that if the same product is obtained with less amount or resources, we have produced more efficiently and that can be translated into gains for the company. Should this reduction in the flow imply a reduction in the burdens on the environment, we can also talk about eco-efficiency. Some sub-strategies in design related to this strategy are miniaturisation, multifunctionality or repairability. Therefore, reducing the flow involves a careful planning of the usage that is to be given to the products to, first, reduce the amount of resources and, second, lengthen the life of a product to avoid production from raw materials. It is thus, a precautionary approach.
Within this idea, we want to make a brief introduction of Industrial Symbiosis (IS) as part of the material management that will be proposed in the case study in chapter 4. Chertow [3] has the vision of IS as some collective approach of traditionally separate industries to make use of physical exchange of resources and by-products. It is an inter-company arrangement in which a set of companies may share inputs and produce utility out of some outputs (material and/or energy) from other companies involved that, otherwise, may mean a waste stream for the source company. In our case study, glycerine by-product from biodiesel production will be an input for biogas production in the vicinity. The boundaries in this approach should involve the lot of companies included in the sharing system. The main aim of IS, then, is a more efficient use of inputs and outputs by considering systems not in isolation but from a collective stand point, having gains in the environment by reducing the needs of raw inputs for the global set of companies.
Page | 12
Closing the loop, instead, has to do with reusing waste streams i.e. it tackles the materials flows from the end of the lifecycle of products. It may be, at a systems level, the equivalent in IE of an end-of pipe solution. Once a material product has lost its UV, it will be disposed of by some mean. The first and second principles require this disposal to be handled in such a way that neither the biosphere nor the lithosphere suffer the consequences. Also, these materials will have passed through a variety of processes in which energy and other materials are introduced. By returning these materials to some previous stage of a lifecycle it is possible to avoid consumption of raw ones, diminishing in many cases the energy inputs in a product, and reducing the rate at which the waste is disposed of.
According to Cohen-Rosenthal [56], the natural entropy guiding all processes in the universe implies that to take a material to a higher level of order (e.g. to purify and concentrate a metal from its ore) energy inputs are needed and the usage will cause natural degradation in it. Thus, although closing the loop tries to avoid the final disposal of waste, this scenario must have already had to be considered at the design stage. Under adequate utilisation, the useful life of a product can be lengthened by appropriate design and functionality. However, the materials proposed for production must cause the smallest ecological impact possible, have reduced inputs on energy to improve properties during production and ease recycling. At this latter the inputs for recycling process must not be higher than those for raw materials and technology to be feasible. Many are the possibilities for reutilising the waste materials. These will depend on the level of degradation that they suffered and the aforementioned “extra” inputs. If the materials are in good conditions and shape, it would be possible to disassemble them and introduce them for semi-new products. Higher degradation could still permit its return to the production cycle by remanufacturing. When the material has been severely degraded, perhaps it would be more beneficial to practice down-cascading i.e. recycling of materials to produce one with lower quality. In the last instance, the option can be combustion of materials for energy recovery. Ultimately, the least wanted scenario would be landfilling.
Some issues to tackle from the design stage are transmaterialisation and detoxification. An emerging concept that means a revolution at in this field is eco-effectiveness, which is further described in the following section (section 2.2.2) for being one of the core approaches that is to be treated in this document.
Then, proper material and energy management, can to reduce consumption of raw resources, reduce waste at the last lifecycle stage and reduce the burdens on the biosphere and lithosphere.
2.2.2. Eco-effectiveness
In this thesis we would like to introduce eco-effectiveness as a concept that could be relevant in future designs with regard to material flows and, mainly, their environmental impacts. The potential consequences of its application will be discussed both in chapter 3 (theoretically) and chapter 4 (practically) in a case study kindly chosen to reflect such potential.
This concept was coined around year 2001 by architect William McDonough and chemist Michael Braungart. It means a twist for material flow management in industries compared to that proposed by eco-efficiency. According to Cote [1, p.250] ‘eco-efficiency merely reduces the impacts of an ecologically destructive industrial system at the margins’ and represents a ‘cradle-to grave’ material flow that only represents an ‘illusion of change’’. Based on similar
Page | 13
understanding, their creators described in what they called the ‘Next Industrial Revolution’ three principles by means of which the material cycles are ‘regenerative rather than depletive’ [5, p.5]. These principles are: 1) waste equals food, 2) respect diversity and 3) use solar energy.
The first principle summarises the idea of eliminating from the entire supply chains synthetic materials that are estrange to nature, to make it possible a totally environmentally friendly use, reuse and/or disposal of materials. Materials in use are divided into two categories: ‘technical nutrients’ and ‘biological nutrients’ [5, p.7]. The former would be designed to be re-used in a closed industrial loop letting preserve their quality or even upgrade it; the latter would be designed to be returned to a natural biological cycle by means of disposal for bacteriologic decomposition. Both categories must not be irreversibly mixed to avoid the disposal of synthetic materials to soil, air and/or water and organic loses when biological nutrients are withdrawn from the biological cycle. Hence, potential pollution is kept away from the environment and the materials are naturally recycled closing a totally “effective” cycle.
The second principle involves that, if the material flows in contact with nature are utterly compatible with it, no possible negative impact from production-supply chains or use phase is to be expected. They would thus respect ‘the regional, cultural and material uniqueness of a place’ [5, p.10]. Hence ‘wastes and emissions will regenerate rather than deplete, and design will be flexible, to allow for changes in the needs of people and communities’ [5, p.10]. Designs must, then, take into account not only material and technical factors to avoid the impact, but also the possible uses from them to make it possible.
Finally, the third principle suggests making the most of solar energy. This resource can be used not only directly in terms of direct heating or lighting but also in modified ways, just as the nature itself does with biological transformations such as photosynthesis, water evaporation to form clouds, etcetera. Biofuels are a resource to be exploited under this principle.
Therefore, eco-effectiveness pays attention to the results of the actions in themselves instead of comparing the results with the input. Edwards states that ‘whereas eco-efficiency emphasizes reductions in resource consumption, energy use, emissions and waste, eco-effectiveness promotes optimal design strategies that support both human and ecological systems’ [6; p.111]. Eco-effectiveness consists of avoiding the impact from the design by means of non harmful natural materials (i.e. detoxification) with flexible possibilities and making the most of the sun power to achieve the goals. To ease that, McDonough and Braungart advocate for selling services [5, p.9] - concept that will be discussed in detail in section 2.3 under the title of functional sales. When selling services, the producer can have a control over the materials of the product that supports that service. Thus, it is possible to carry out the actions (e.g. reuse, recycle, upgrade, disposal of ‘nutrients’) necessary to sustain the quality of the service while keeping the material flows on the right path.
The most direct outcomes and benefits coming from the application of eco-effectiveness4 are not, therefore, linked to a reduction of material and energy consumption, since they are recycled in a cradle-to-cradle cycle where inputs are not measured. The outcomes are that, be the magnitude of the flow as it may, the flows will lean on and support to the natural biological cycles that have given the earth its biodiversity and richness. As McDonough states “Nature—highly industrious, astonishingly productive and creative, even ‘wasteful’—is not efficient but effective” [5, p.4].
4 Some factual cases are available at http://www.mbdc.com/profile_clients.htm (as of 6th of February, 2009)
Page | 14
2.3. Functional Sales (FS)
Here we present FS as a strategy to consider at the design stage, to yield a different angle to tackle value of products. This is below compared to traditional product design to offer some hints about its pros and cons. Nevertheless, with regard to eco-design and eco-efficiency, the potential gains and drawbacks of FS will be further analysed in section 3.1.1.
Yet FS in itself is focused upon satisfying the needs of the customer not paying much attention on environmental consequences [17, p.4], we would like keep the focus of Product Service Systems (PSS) ([18], [19]), which is an environmentally conscious “branch” of FS that may give a slight different touch. In PSS the primary goal is to reduce the environmental impact of consumption, for which FS are applied. Hence, it matches smoothly with the purpose of this research, linking improving value by ways of services with the aim to reducing the burdens on the environment. Nevertheless, for being a better known approach, we will refer in this thesis to the general concept of FS.
FS are referred by many authors with different names, definitions, viewpoints et cetera. Sakao and Shimomura [11] discuss about Service Engineering (SE) explaining that a physical product is a physical means to provide service, although it can be a service in itself, and it provides value by taking the receiver to a ‘state they prefer’ through functionality; product and service are equally regarded in this approach. Alonso et al. [16] offer the perspective of Total Care Products or Functional Products (TCP or FP) where they describe a system in which a set of support services permits the total operability of hardware to provide functions to the customer. Morelli tackles PSS approach and defines it as ‘a marketable set of products and services capable of jointly fulfilling a user’s need’ [28, p.72], which goes in the line of TCP; however Morelli emphasises the role of social contact with the (potential) customer and not much the environmental outcomes that should aim this approach. Mont [29] gathers many other different definitions comprised by the concept of Functional Thinking (FT) where he describes a futuristic society moved by the consumption of functions provided by a system that includes technical, economic and societal aspects.
In any way the approach is taken, FS has the core on satisfying the needs of the customer to generate value, for which a combination of physical and/or non physical products and/or services are combined to achieve that goal. Lindahl and Ölundh [17] pint the difference between FS and selling services recalling that services “could” be a solution for the former, but it is not mandatory, since also material goods offer some functions. In comparison with traditional design, for this it is this material product-function link the focus for improvement, estimating the use those products would have once the customers purchases them i.e. physical products are developed to improve their functionality “trying” to fit them to customers’ needs.
The new focal point by FS is to cover the utility – and not necessarily material - needs of the customers. It implies integrating functions not only into physical goods, but also considering services as strategies, and where the company owns the resources – material and non material - and the customer makes use of them. In other words, the customer receives functionality, whilst the company manages their resources to provide that [16]. Hence, some interesting differences can be addressed between both sides (goods sales and functional sales). In Table 2 below the main ones are summarised, and further explained as follows.
Page | 15
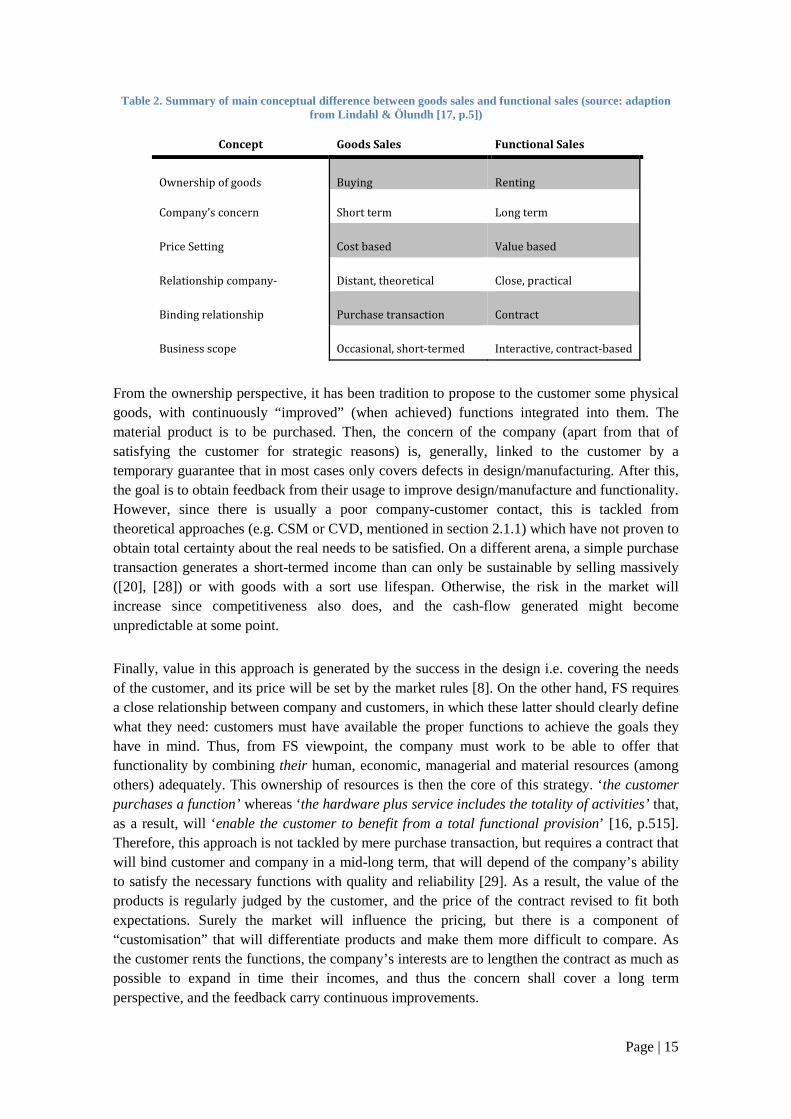
Table 2. Summary of main conceptual difference between goods sales and functional sales (source: adaption from Lindahl & Ölundh [17, p.5])
Concept Goods Sales Functional Sales
Ownership of goods Buying Renting
Company’s concern Short term Long term
Price Setting Cost based Value based
Relationship company-
customer
Distant, theoretical Close, practical
Binding relationship Purchase transaction Contract
Business scope Occasional, short-termed Interactive, contract-based
From the ownership perspective, it has been tradition to propose to the customer some physical goods, with continuously “improved” (when achieved) functions integrated into them. The material product is to be purchased. Then, the concern of the company (apart from that of satisfying the customer for strategic reasons) is, generally, linked to the customer by a temporary guarantee that in most cases only covers defects in design/manufacturing. After this, the goal is to obtain feedback from their usage to improve design/manufacture and functionality. However, since there is usually a poor company-customer contact, this is tackled from theoretical approaches (e.g. CSM or CVD, mentioned in section 2.1.1) which have not proven to obtain total certainty about the real needs to be satisfied. On a different arena, a simple purchase transaction generates a short-termed income than can only be sustainable by selling massively ([20], [28]) or with goods with a sort use lifespan. Otherwise, the risk in the market will increase since competitiveness also does, and the cash-flow generated might become unpredictable at some point.
Finally, value in this approach is generated by the success in the design i.e. covering the needs of the customer, and its price will be set by the market rules [8]. On the other hand, FS requires a close relationship between company and customers, in which these latter should clearly define what they need: customers must have available the proper functions to achieve the goals they have in mind. Thus, from FS viewpoint, the company must work to be able to offer that functionality by combining their human, economic, managerial and material resources (among others) adequately. This ownership of resources is then the core of this strategy. ‘the customer purchases a function’ whereas ‘the hardware plus service includes the totality of activities’ that, as a result, will ‘enable the customer to benefit from a total functional provision’ [16, p.515]. Therefore, this approach is not tackled by mere purchase transaction, but requires a contract that will bind customer and company in a mid-long term, that will depend of the company’s ability to satisfy the necessary functions with quality and reliability [29]. As a result, the value of the products is regularly judged by the customer, and the price of the contract revised to fit both expectations. Surely the market will influence the pricing, but there is a component of “customisation” that will differentiate products and make them more difficult to compare. As the customer rents the functions, the company’s interests are to lengthen the contract as much as possible to expand in time their incomes, and thus the concern shall cover a long term perspective, and the feedback carry continuous improvements.

Page | 16

3. Integration of Functional S
eco-design framework
3.1. Potential consequences
Analysing all the theories and facts mentioned in previous chapters, it seems to be reasonable to advocate for a combination of different approaches available in environmental engineering towards maximising the gains coming fromliterature hindrances regarding their combination. However, seemingly all themostly tackled separately and in isolation. For example, Cote [eco-efficiency as a poor remedy that only reduces impact but does not environmental burdens and advocate for ecowith our perspective when he claims that thare ‘complementary’ to solve, in his research, problems regarding electronic commerce.
Eco-efficiency index is a ratio that reflects the improvements in an ecopresented some different definitions, they all agree service with relation to the environmental impact further details). To increase value whilst reducing environmental impact eco-design. It is worth to say that it isit is depicted the high risk that design should be taken, the availability of information about requirements and needs is rather reduced.On the other hand, ‘a poorly conceived product cannot reach the satisfaction of the customer despite the efforts made in the stages downstreamchanges over the design when
A trail of consequences can be addressed from a poor design. it would affect the economic results, butfrom many different points. For instance, let us say thatcustomer would decide not to consume the product/servicemanipulation of goods to provide that would become waste. In productionthat most probably would generate a considerable environmental isection 2.1.2). It is arguable that materials could be recycled to create new goodsway it would require extra energy supply some environmental impact. Attending to the definition of econot be achieved at all, and the eco
Figure 1. Evolution of information and degree of freedom through a design process (source:
Functional Sales and Industrial Ecology
framework
consequences on eco-efficiency
d facts mentioned in previous chapters, it seems to be reasonable to advocate for a combination of different approaches available in environmental engineering
ising the gains coming from all of them. Moreover, it has not been found in rding their combination. However, seemingly all the
tackled separately and in isolation. For example, Cote [1] and McDonough [remedy that only reduces impact but does not
and advocate for eco-effectiveness, whilst Abuckhander [with our perspective when he claims that these two approaches do not exclud
to solve, in his research, problems regarding electronic commerce.
is a ratio that reflects the improvements in an eco-design.presented some different definitions, they all agree basically in including value of a product or service with relation to the environmental impact caused in the lifecycle (see
value whilst reducing environmental impact revealsworth to say that it is at this stage where most costs are undertaken
the high risk that design implies since at early stages, where most of the decisions , the availability of information about requirements and needs is rather reduced.
a poorly conceived product cannot reach the satisfaction of the customer despite the efforts made in the stages downstream’ [8, p.166]; the degree of freedom to mchanges over the design when information is available decreases as the design process
A trail of consequences can be addressed from a poor design. Perhaps, the mostresults, but there would also be an important environmental impact
For instance, let us say that the required value is not achieved.customer would decide not to consume the product/service; this leads to producmanipulation of goods to provide that product/service that will have no us
waste. In production there are involved both energy and material consumption, that most probably would generate a considerable environmental impact (discussed in detail in
). It is arguable that materials could be recycled to create new goodsenergy supply - and other material considerations Attending to the definition of eco-efficiency [7, p
not be achieved at all, and the eco-efficiency index would be outrageously low.
. Evolution of information and degree of freedom through a design process (source: Sakao T., Linköping University, 2008)
Page | 17
and Industrial Ecology in an
d facts mentioned in previous chapters, it seems to be reasonable to advocate for a combination of different approaches available in environmental engineering
t has not been found in rding their combination. However, seemingly all these approaches are
] and McDonough [5] describe remedy that only reduces impact but does not eliminate the
, whilst Abuckhander [14] goes in line two approaches do not exclude one another but
to solve, in his research, problems regarding electronic commerce.
design. Yet we have value of a product or (see section 2.1.3 for reveals, then, a good
e most costs are undertaken. In Figure 1, since at early stages, where most of the decisions
, the availability of information about requirements and needs is rather reduced. a poorly conceived product cannot reach the satisfaction of the customer
the degree of freedom to make information is available decreases as the design process evolves.
Perhaps, the most obvious is that environmental impact
required value is not achieved. The ; this leads to production and
that will have no use and, therefore, are involved both energy and material consumption,
(discussed in detail in ). It is arguable that materials could be recycled to create new goods, but in any
and other material considerations - involving again , p.2], its goal would
ndex would be outrageously low.
. Evolution of information and degree of freedom through a design process (source:

Page | 18
We believe that, if we are to create a design system to give support to sustainability, this definitely should not be based on uncertainties and risks, but rather on reliability, confidence, proximity to the customer and their needs and the security of that the environment will not be harmed. Eco-design is a great founding towards sustainability, but it should not be considered in isolation. On the next sections we will dive in depth to find the potential that FS and IE can provide to eco-design and their effect in eco-efficiency. 3.1.1. Functional sales and eco-efficiency: optimising the ratio
Having some means to obtain vital information about what the customer “values”, in what extent and how it is possible to satisfy it, is of utmost importance. If one takes a look upon the core of FS, it is found that a strong relation between customer and company must be created, since both are ‘involved and integrated in co-creation and co-production activities’ [15, p.16]. Alonso-Rasgado et al. argue that the provider, meaning the company offering their services, shares ‘the business risk with the customer and therefore needs to know much about the technological and business activities of the customer’ [16, p.516]. We can state that the product or service is created “by” the customer and “for” the customer, by means of the resources of the company. Proximity between customer and company permit to have access to relevant information that will be used at early stages of design, reducing the risk of failure at satisfying the customer’s wishes.
Another important gain from FS, from the company’s perspective, is that a market is assured since nearness creates a sense of reliability on the brand. This statement agrees with that from Woodruff, where he mentions that perhaps the biggest gains from satisfying a customer deeply come from creating a feeling of ‘loyalty’ that will ‘ reduce the customer’s motivation from “shopping around”’ [10, p.148].
Altogether, from the business perspective, the strong relations created by FS may contribute to eco-design and company strategies by
• Improving value of a product/service at a lower risk of failure in design.
• Reducing uncertainties at early stages minimising risk in costs for fixing errors in design or marketing.
• Creating and assuring a smooth cash-flow from a regular payment from the customers.
• Generating a feeling of loyalty towards a brand or a company, reducing competition.
• Providing long-business perspectives as a consequence of this latter.
From the environmental perspective, it is well known that in many cases the use-phase of a product is the stage at which most of the burdens on the environment are released. In FS, the company would take over the management of the resources for the customer only to concentrate on enjoying the “benefits” of the service provided by those resources. This means, that the use-phase still would depend on the customer but it will be covered and assessed permanently by the management of the company, which provides the technology and knowledge for an efficient utilisation. Then the client benefits from [16, p.516] the following facts.
Page | 19
• Latest technology available due to competitiveness in the market and knowledge generated by continuous feedback.
• Guaranteed availability.
• Minimal capital expenditure to receive the service that, all in all, means the value.
We can suggest an example of a man buying a car. To redeem the investment in the car, the buyer might make use of it until it does not work anymore. Furthermore, he might take it for close commutation to make the most of it, releasing unnecessary emissions. He would cover other expenses such as taking the car to the mechanic (paying both for the spares and service), or buying cleaning products (and probably doing the cleaning himself). On the other hand, technologically the efficiency of the car will decrease along time. Newer cars will be available in the market showing lesser emissions, include the latest technologies and possibility use renewable fuels. They could also be more comfortable. Nonetheless, until the car has paid off its value (i.e. has given in service the results expected) the buyer will not change the car and will continue with that pattern. If we consider the amount of vehicles that are sold every year, the environmental consequences of a poorly efficient value-product relation are then enormous.
Now let us consider if the man does not “own” the car but equally needs it daily to cover his needs. A rental company would offer him a top-of-the-class car (owing to competitiveness) with a good environmental performance (because the latest technologies are then available), clean (services are included in price) and ready to work every day since a technician has assured it. Further, perhaps this man does not even have to worry about parking it. The rental company would undertake all those parallel activities for the user at a lower cost as they own the resources of which they must make an efficient use to increase profits. They would learn from the preferences and habits of the clients, as there is a close relationship fed every day. As a result, the use of resources are minimised, the latest technology applied, and the customer pays a lower price for being able to commute daily, which is the core of the value in this example. To increase value whilst decreasing environmental impact means being eco-efficient.
However, implementation of FT in the core of a business presents some important drawbacks that are worth to discuss. The first one gives regard to the company’s structure and hierarchy. Owing to customisation of the products, each of them may be tackled as a single project in its design stage, for which some structural requirements in the company are necessary. Shenhar and Dvir [30] depict the risky situation to fulfil projects at a system or array level (i.e. involving two or more functional operational units) when data availability is insufficient and the complete need for a flexible structure within the company. As it was argued, the core of FS would support data availability. But the company must be flexible enough, mainly in terms of human resources and costs allocation, to have available their resources when and where it is required [31]. This is commonly achieved by a strong matrix organisation, in which generally project managers control resources and make decisions towards a goal. Unfortunately, this kind of structure is rather new and thus still uncommonly integrated in companies, even less in small-and-medium-sized enterprises (SMEs). So the first step for integration of FS goes through a tricky organisational restructuration of the (human) resources of the company.
Page | 20
Secondly, FS introduces a social factor as a key component of the design process. Morelli finds ‘designer’s capability to observe and interpret cultures, social needs and attitudes with respect to certain technological phenomena’ [28, p.76] a must-have prerequisite. Because of that fact, he also claims the following important.
• The design culture of the engineer.
• The provider’s approach to the service.
• The customer’s culture and capability to infer and use the service’s innovative contents.
• The technological knowledge embedded in the artefacts used for the service.
Therefore, the socio-technical solutions must go through a thorough analysis for which special social skills and/or knowledge in the field seem to be advisable to succeed.
Also, there are some social aspects that may act as barriers to FS. Within those social aspects there is one addressed by Lindahl and Ölundh [17] with regard to the strong capitalistic feeling that ownership has over goods. This is seen as a barrier for implementation but can be also extended to justify cases in which FS would not be supported. For example, a company can cover a wedding celebration involving ornaments, catering and wardrobe services, and even the ceremony in itself. Nonetheless, an important part of that ceremony involves the wedding rings that, undoubtedly, the holders will want to own. The company could assess and provide the rings, but once it all is ended (meaning the wedding), they could not claim for them. In such case, it is a simple purchase transaction of goods. Likewise, a company supporting FS will “own” material goods to some extent to undertake their tasks that, again, would have been provided by a third party (more purchase transactions). Therefore, although FS were widely adopted, the strong feeling of material ownership would somehow sustain material sales and would be an option in the market in some share.
Altogether, FS offer a great scope for improvement for an environmental, strategic and possibly economic perspective. Nonetheless, its implementation must overcome structural needs, social knowledge acquirement in design and some cultural barriers of which we emphasised the capitalistic factor. Therefore, the final decision on its adoption must arise from the global picture and a thorough balance pros, cons and capabilities.
3.1.2. Industrial ecology and eco-efficiency: greening the performance.
In section 2.2 we gave hints about the possible links between IE and eco-design. IE aims at implementing the best practice possible over the resources so as to diminish the harm on the biosphere. For that, it is needed to define the strategy on the design stage. There, decisions about, for example, the type of usage, the materials required or the expected waste management are made. It was also exposed in previous chapters that improvements in eco-design are usually measured in numerical terms by an index that combines value of a product divided by its environmental impact. Taking this expression as a reference, we can argue about the potentials of IE within the framework of eco-design.
The creation of value (discussed in section 2.1.1) departs from the very beginning in the task of design [8]. It has also been said that the concern on ecological impact from a product is becoming more and more important (e.g. [15], [20]) and will influence in some measure the decision about the choice of a product. Although it might not be a parameter of utmost
Page | 21
importance for the practical (application) utility of a product, it is for the image of the company and product, and also for the considerations taken by the customer, and should be taken into account. It seems to be sensible to believe that a product that provides much value for customers will even have better consideration if it is ecologically friendly. This label can be seen therefore as a strategic factor that can mean the final difference between one product and another, should not price be much relevant.
When value is tackled from an economic perspective, the potential gains from IE can become even more appealing. Being able to reduce the amount of raw material at production, being less spendthrift in energy usage, having access to waste materials for reassembly or remanufacturing and detoxifying the chain, not only satisfy the four guiding points on IE. Economic benefits from re-usage of sources, savings in energy and raw materials and compliance with legislation on waste disposal and hazardous substances, make of “green” thinking an economically appealing issue. Although this perspective is not handled in this thesis, we could not neglect such clear point.
But the one to benefit the most from IE strategies is the environment itself. Appropriate management of resources reduces the need of extraction of materials from the lithosphere. As less material is input, in the long run, less material will be subjected to ultimate disposal. Comparatively with a scenario without such green concerns, the biosphere would not be exposed to that large amount of waste, landfilling would become a less usual practice. For example, Sweden, a cutting edge country when in comes to environmental protection, in 2006, has been able to recycle about 47.2% of their waste (36.8% as material recovery and 10.4% as biological treatment), and some similar percentage (46.8%) is sent for energy recovery through incineration in a power plant [21]. This implied the reduction of 15% of the landfilling from 2002 to 2006, and the possibility to make more use of a 94% of the waste stream. The choice between recycling and combustion will depend on a variety of considerations, such as the type of fuel avoided in combustion or the additional inputs to the recyclable stream to factually recycle it. The 470ktonnes biologically treated (year 2006) permits the country to have access to biogas to run cars and avoid gasoline, or to replace non-renewable combustible such as natural gas in a combined heat and power plant (CHP).
In section 2.2.1, we emphasised the possible role of IS. Its successful application helps the local, regional or national authorities to have more control over industrial waste streams from the perspective that the ecological rucksacks from material extraction and the amounts of waste to treat and disposed of are severely reduced. The success of implementation of this strategy in eco-industrial parks has been reported by Chertow [3] and summarised by Wolf [4], as a process in which the most important factors are trust, openness and reliability among the companies involved to overcome the main threats: risk in supply, technological stagnation and reduction of flexibility in production. Over that, there are other factors such as policies and governmental support that can boost the implementation or dynamite the initiative.
The most well-known eco-industrial park is that developed in Kalundborg, Denmark, that, according to Chertow, could success thanks to the open business environment set by the Danish government and the freedom to develop green proposals. Heeres et al. [22] reported how the initiatives carried out in the Netherlands were more successful than an amount in USA due the fact that they were initiatives that came from the companies themselves towards a more convenient use of resources, and supported by the competent authorities. In USA, instead, the

Page | 22
initiatives came from the local, regional and national governments as an economic plan, and the involvement of the authorities in the process caused refusals from companies. For IS to be success, the idea must arise from the set of industries involved. The amount of fruitful cases reveals IS as a promising alternative that produces interesting outcomes. In the case of Kalundborg, the economic savings are of over 15million $/year. The environmental savings are quantified 5 in 1.9Mm3/year of ground water, 1Mm3/year of surface water, 200ktonnes/year of gypsum, 20ktonnes oil-eq/year, among a high amount of reduced emissions to air and water.
Hence, with regard to eco-design, the implementation of IS will involve the tackling of the production and resources scheme taking into account the neighbour industries and their streams. This will influence the selection of materials, the energy usage, the disposal scenarios of by-products during production stages and the availability of resources at a, perhaps, more economic price. The designer must consider the systems perspective rather than an internal one, and link the company with its surroundings for higher competence. The results of the successful implementation in the running eco-industrial parks worldwide reveal that sharing resources can suppose great savings on material, waste management, and energy. The potential reduction of the negative impact on the environment, together with the economic savings, and the possibility to exploit a green label in products, makes of IE and its material management, with eco-effectiveness and IS as our prime examples, an attractive and most potentially eco-efficient solution for design at a system level.
The other role of which we are to analyse the potential consequences in this thesis is eco-effectiveness. This does have a strong focus onto achieving the desired results on design i.e. being effective, regardless the amount of resources required. This last statement means that at a glance, efficiency is not a priority, and even sounds as a conflict of interests. The amounts of materials and energy utilised are not relevant as long as it is guaranteed that the entire chain is free from toxic substances, the materials are completely biodegradable in a relatively short term, the substances are not estrange to the part of the biosphere they are in contact with, and the energy utilised is entirely renewable. Thus, given this freedom for resource usage, what are the potential gains when trying to increase eco-efficiency?
The core of eco-effectiveness is the concept of transmaterialisation by which materials in products will be replaced by biodegradable and non-harmful ones. This switching will carry with it detoxification of the chain to some extent, and noxious substances will be avoided for the lifecycle at the very first step. The use of renewable resources, based on continuous energy supply from the Sun, would provide the energy inputs at the rest of the stages. Therefore, all the inputs and outputs are said to be utterly harmless for the environment, and the environmental impact reduced greatly. Waste management is also eased and compliance with laws on waste treatment is achieved from the design of the product. The raw resources are naturally restored on the lithosphere and reutilised in what is referred to as a ‘cradle-to-cradle’ lifecycle [6] where, according to thermodynamic theories, the only real input is the solar energy [5] to overcome entropy needs [56]. Then the environmental performance would go in line with the natural sustainability of the biosphere and thus the negative impact would tend to a minimum. Reducing the environmental impact does improve only one part of eco-efficiency.
5 Data provided by Anna Wolf (PhD), at a magisterial lecture on Industrial Symbiosis in spring 2008.

Page | 23
Therefore, to be consistent with eco-design goals, eco-effectiveness should be applied along with other strategies suggested in IE (e.g. dematerialisation, reutilisation, recycling). Thus it could be also possible to increase value by making more use out of existing streams and reducing the need of raw materials. In this thesis we suggest to combine transmaterialisation and detoxification from eco-effectiveness with efficient use of material and energy streams of IS. From this mixture it is expected to contribute to eco-efficiency by
• Reducing material and energy flows, with reduction of costs of managing resources.
• Easing waste management by avoidance of toxic materials in the lifecycle, meaning possible reutilisation and recycling of materials, or reduction in the costs associated with treating waste according to existing legislation.
• Enhancing the use of renewable energies, that will increase demand as non-renewable ones continue their depletion and lose quality.
• Reducing the environmental impact importantly.
• Increasing value from green labelling of products.
• Providing a higher scope for improvement at tackling design of products from a system perspective.
We are aware about the youth of IE as compared with traditional design. The coupling of these will require more research on the former and more exploration “out of the box” from the latter. However, despite there is a long way to go, in theory IE in the framework of eco-design can be of interest. As an example for analysis, we propose a case of implementation in a material flow in chapter 4.
3.2. Measuring gains in eco-efficiency: proposed eco-efficiency index
We already exposed that, in order to be able to quantify improvements in performance involving environmental issues, nowadays it is usual to rely on eco-efficiency indexes. There are many of these available in the literature. For example, Sakao et al. [41] propose an index based on relative improvement of value and environmental performances of new alternatives against existing ones, linking functionality criteria with technical facts by means of Multi-Criteria Analysis (MCA) matrix. Kondoh et al. ([42];[43]) developed indexes linking value creation through production stages with their harm on the environment to identify possible improvements. However, most of the indexes found imply a methodology and knowledge that can become somewhat complex if there is lack of expertise in this field. Besides, most of them tackle the design at a process’s level when perhaps a system’s level could work better. Moreover, using monetary units at a system’s level may result quite arduous as it can be painfully difficult to allocate costs.
We estimated appropriate to create our own index supported by simpler methodology involving straightforward concepts so that it may be applicable at any level in the market. This index should answer questions such as: to what extent the approaches described in the theory are to have some effect on eco-efficiency? How much do those approaches affect to the core magnitudes (i.e. value and environmental impact) when applied in real cases? The information obtained by this new index should assess new designs not by providing data for technical design
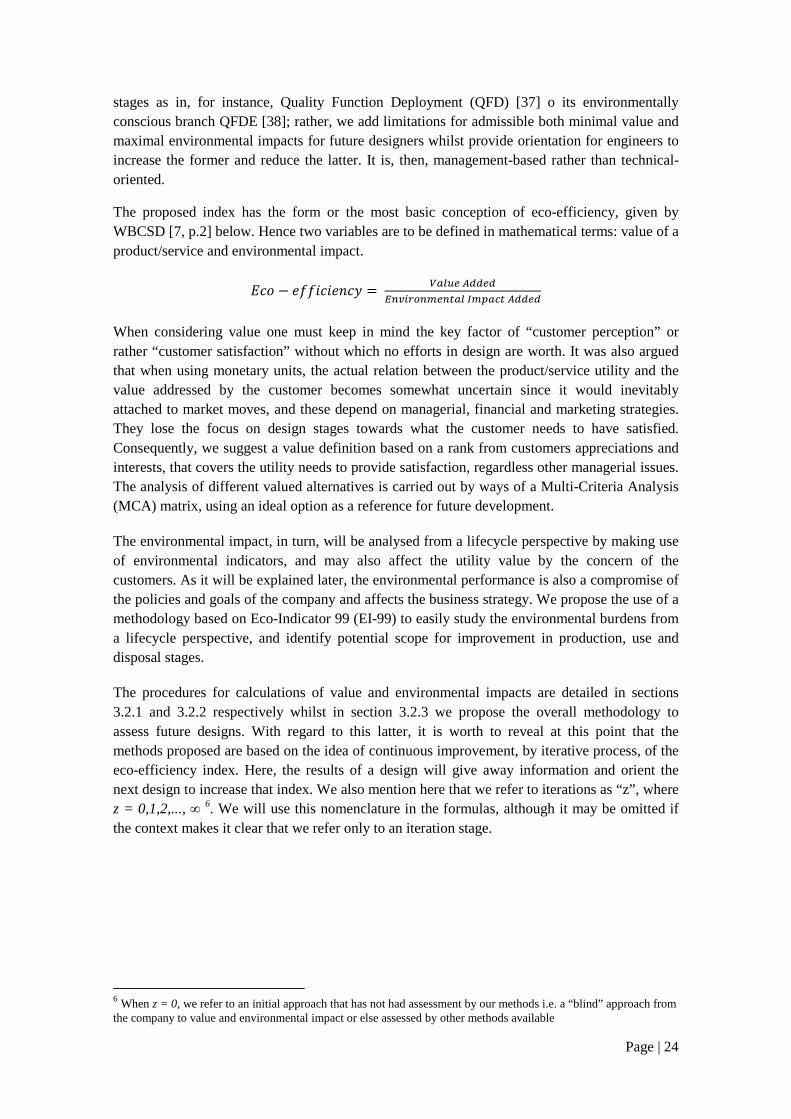
Page | 24
stages as in, for instance, Quality Function Deployment (QFD) [37] o its environmentally conscious branch QFDE [38]; rather, we add limitations for admissible both minimal value and maximal environmental impacts for future designers whilst provide orientation for engineers to increase the former and reduce the latter. It is, then, management-based rather than technical-oriented.
The proposed index has the form or the most basic conception of eco-efficiency, given by WBCSD [7, p.2] below. Hence two variables are to be defined in mathematical terms: value of a product/service and environmental impact.
��� � ��������� ����� ������ !"#$ %� &�� '%(�)& �����
When considering value one must keep in mind the key factor of “customer perception” or rather “customer satisfaction” without which no efforts in design are worth. It was also argued that when using monetary units, the actual relation between the product/service utility and the value addressed by the customer becomes somewhat uncertain since it would inevitably attached to market moves, and these depend on managerial, financial and marketing strategies. They lose the focus on design stages towards what the customer needs to have satisfied. Consequently, we suggest a value definition based on a rank from customers appreciations and interests, that covers the utility needs to provide satisfaction, regardless other managerial issues. The analysis of different valued alternatives is carried out by ways of a Multi-Criteria Analysis (MCA) matrix, using an ideal option as a reference for future development.
The environmental impact, in turn, will be analysed from a lifecycle perspective by making use of environmental indicators, and may also affect the utility value by the concern of the customers. As it will be explained later, the environmental performance is also a compromise of the policies and goals of the company and affects the business strategy. We propose the use of a methodology based on Eco-Indicator 99 (EI-99) to easily study the environmental burdens from a lifecycle perspective, and identify potential scope for improvement in production, use and disposal stages.
The procedures for calculations of value and environmental impacts are detailed in sections 3.2.1 and 3.2.2 respectively whilst in section 3.2.3 we propose the overall methodology to assess future designs. With regard to this latter, it is worth to reveal at this point that the methods proposed are based on the idea of continuous improvement, by iterative process, of the eco-efficiency index. Here, the results of a design will give away information and orient the next design to increase that index. We also mention here that we refer to iterations as “z”, where z = 0,1,2,..., ∞ 6. We will use this nomenclature in the formulas, although it may be omitted if the context makes it clear that we refer only to an iteration stage.
6 When z = 0, we refer to an initial approach that has not had assessment by our methods i.e. a “blind” approach from the company to value and environmental impact or else assessed by other methods available

Page | 25
3.2.1. Calculating Utility Value (UV) of a product/service
The method we propose to calculate value has arisen from that suggested by Neap and Celik [23]. They make use of a MCA method, where a matrix that includes different alternatives (usually in columns) and their attributes or characteristics (in rows), gathers some quantitative or semi-quantitative data to depict the situation for making a decision upon a set of alternatives. Neap and Celik include in this MCA matrix real data from some customer’s perspective that will somehow “weight” the attributes for every alternative. These authors’ viewpoint of value added - which is price-based in their method - involves marginal theories where scarcity and desirability combined create the value, which is then ‘variable and depends on the subject and the context of the exchange’ [8, p.159]. The value of a product is a linear combination of fixed costs – related to production, management, materials, etc – and a marginal cost that will appear as a result of the customer’s perception at a given time, and will provide the actual economic profit. In this thesis we will modify their procedure in some ways to eliminate the price-based value to be consistent with our previous reflection. Hence, we will focus only on the second term (“marginality”) as the source of value linked to the desires of the customer, leaving further economic considerations aside as part of market and operational strategies. Our goal will be here to obtain dimensionless numbers that summarise the perception of the customer for all different alternatives. This will ease comparative analysis of utility value amongst them, and is introduced as numerator parameter in our eco-efficiency index (proposed in section 3.2.3) for decision making about most sustainable alternatives. To gain comparability the numbers obtained are normalised and contrasted with an ideal alternative which serves both as a reference and as a target.
The method presented, thus, integrates the Voice of Customer (VoC) into MCA matrix for comparison of what we refer to as Options or Alternatives which represent different scenarios, services, goods or, generally, products, that are proposed by the company (e.g. different cars in a car franchisee, possible trips in a travel agency or shoes in shoe-shop) that a customer inevitably and regularly would have to evaluate in a market to make a decision before they choose. In order to succeed with this, the VoC should include any aspect that could be of some relevance to the customers. We consider the following ones
• Attributes or Criteria: the customer defines which attributes are needed for the good or service to provide them satisfaction i.e. what characteristics are important or rather what are they looking for, that will satisfy their needs as a customer? Some suggestions or explanations from the company may be convenient when the options to be evaluated are rather new or the customer has scarce expertise7
• Weight: they also rate the importance of those attributes within a scale i.e. how important are those requirements to find satisfaction with the product/service?
• Opinion: for a certain attribute, the customer ranks to what extent the different options presented (i.e. designs) fulfil the requirements; in other words, how much the different alternatives succeed in providing they are looking for or need?
7 It is usual to find some expert assessment in a shop or company and integrate their information to find more support in our final decision. For example, an assistant in a computer shop would tell us about some requirements that a last generation computer should have if we have not much experience with them, and that we will integrate with our own requirements to find the best deal.
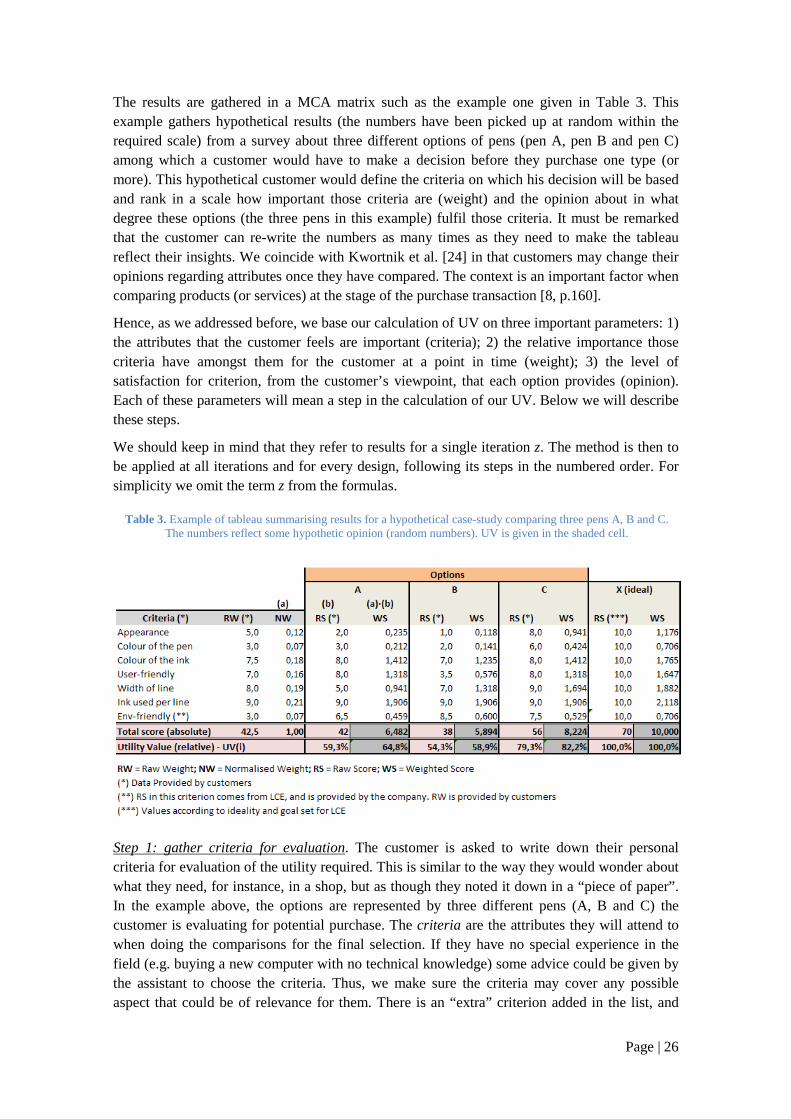
Page | 26
The results are gathered in a MCA matrix such as the example one given in Table 3. This example gathers hypothetical results (the numbers have been picked up at random within the required scale) from a survey about three different options of pens (pen A, pen B and pen C) among which a customer would have to make a decision before they purchase one type (or more). This hypothetical customer would define the criteria on which his decision will be based and rank in a scale how important those criteria are (weight) and the opinion about in what degree these options (the three pens in this example) fulfil those criteria. It must be remarked that the customer can re-write the numbers as many times as they need to make the tableau reflect their insights. We coincide with Kwortnik et al. [24] in that customers may change their opinions regarding attributes once they have compared. The context is an important factor when comparing products (or services) at the stage of the purchase transaction [8, p.160].
Hence, as we addressed before, we base our calculation of UV on three important parameters: 1) the attributes that the customer feels are important (criteria); 2) the relative importance those criteria have amongst them for the customer at a point in time (weight); 3) the level of satisfaction for criterion, from the customer’s viewpoint, that each option provides (opinion). Each of these parameters will mean a step in the calculation of our UV. Below we will describe these steps.
We should keep in mind that they refer to results for a single iteration z. The method is then to be applied at all iterations and for every design, following its steps in the numbered order. For simplicity we omit the term z from the formulas.
Step 1: gather criteria for evaluation. The customer is asked to write down their personal criteria for evaluation of the utility required. This is similar to the way they would wonder about what they need, for instance, in a shop, but as though they noted it down in a “piece of paper”. In the example above, the options are represented by three different pens (A, B and C) the customer is evaluating for potential purchase. The criteria are the attributes they will attend to when doing the comparisons for the final selection. If they have no special experience in the field (e.g. buying a new computer with no technical knowledge) some advice could be given by the assistant to choose the criteria. Thus, we make sure the criteria may cover any possible aspect that could be of relevance for them. There is an “extra” criterion added in the list, and
Table 3. Example of tableau summarising results for a hypothetical case-study comparing three pens A, B and C. The numbers reflect some hypothetic opinion (random numbers). UV is given in the shaded cell.
Page | 27
provided by the company that considers some ecological concerns, represented by “environmentally friendly” performance in the example above. We do so since it is possible that environmental worries may affect somehow the comparisons and thus final decisions, given that the environmental performance for each option is revealed. This behaviour is becoming more and more popular day by day from many perspectives [20], so it should not be neglected. Anyhow, the importance of this and the rest of the criteria are to be ranked by the customer, which is explained in the next step.
Step 2: weight and normalise importance for criteria (calculate NW). Customers will give “importance” in the form of weight or rather Raw Weight (RW) to their criteria in a scale from 0 to 10, where 0 means that it is not important in the slightest and 10 means that it is of utmost importance - note that this weigh also will affect to the environmental performance criterion added by the company, and will be then cancelled if so it is decided. Free numbering is allowed between those limits to reflect their opinion. These results are normalised in column Normalised Weight (NW) for some standardisation and rank importance among them. Thanks to this normalisation, any other linear scale is also suitable and yields similar scores. Mathematically we can calculate the NW for a criterion j out of m as follows
*+,-./ ,-./∑ ,-./%123,-./4 50; 109 : The design process should start right after this evaluation and the criteria and weight provided by the customer will give hints. For instance, according to the results in Table 3, the “amount of ink per line”, its “width” and its “colour of line” seem to have relatively high importance whereas “colour of the pen” and “environmental performance”, although somehow influencing, are not much relevant for the customer. These criteria are to take into consideration when working on new designs as they magnify or reduce the value utility perception.
Design stages or subsystems can be addressed to the VoC by different methodologies, of which perhaps the most widely applied and accurate may be QFD [37] or its application to environmentally conscious design QFDE [38]. The options proposed may be factual at the moment of the survey (and possibly modified according to these results), redesigned to fulfil most important criteria, or new designs of product/services.
Step 3: rank of fulfilment of criteria (obtain RS). Once presented the options to choose from (in the case in Table 3 to chose a pen out of three), customers are asked to evaluate how much these realise the requirements for each criterion. These results are gathered in the columns Raw Score (RS). Again, the scale for the rank is given from 0 to a 10 with similar meaning i.e. if an option shows that fulfils the requirements for a certain criterion that score will be high, or low otherwise. In the given example, the three pens please much the customer’s requisites in amount of “ink per line”, option A shows a “so-so” “width of line”, and A and B have some unattractive “appearance”.
At the end of the tableau there is an ideal option X that works as the ideal alternative i.e. the case in which the product or service is completely successful at fulfilling all the requirements. By definition, the score for each criterion for option X would be 10 out of 10. This alternative X will serve later for formal comparison of what the company offers and the distance to the top

Page | 28
feasible value in a time. In this sense it can also guide in what direction improvements in new designs should be aimed.
It is important to say that the opinion on environmentally friendly performance is ranked in RS columns by the company, since they have all the information regarding how well or badly they do in these terms. In a way it is an assessment for the customer’s inexperience in the field, but that will be given importance by means of the weight, as it was previously mentioned. Its RS requires a Life Cycle Environmental Impact (LCE) calculation, dealt with in the methodology presented in section 3.2.2, so we would rather hold this issue for later. What we can address here is that the scale used for this criterion is basically the same as for the rest with a little clarification: in principle there is no best or worst environmental performance, although the goodness can be measured in terms of achievement in relation to pre-set goals and restrictions. This fact implies that the results on this criterion will be as objective as the company would want by setting a challenging goal and not just some easy-to-reach one to inflate the RS’s. However, the method proposed in MCA still keeps its meaning and the weighted score incorporates the weight given by customers, so this will be somewhat levelled.
Summarising we can mathematically state that, for options i out of n real options, and where n+1 represents the ideal alternative, and criterion j out of m (j = m is the environmentally friendly performance criterion)
* ;<-�, ./4 50; 109 > . 1,2, … , �;<-�, �/ �-AB�-�//;<-� C 1, ./ 10 > . 1,2, … , �: Step 4: calculate UV. To claim that we have obtained a good UV for a product or service means that customers have a highly positive opinion over important attributes, given proposed options. We do it in two parts. In the first one (the next formula) we summarise the three previous steps into Weighted Scores (WS) for each option i to, afterwards, obtain a dimensionless number UV(i), representative of the non-price-based value at a time of each alternative. For an option i and m criteria we can state that
D,<-�, ./ +,-./ · ;<-�, ./F�-�/ G ,<-�, ./%
123:
The UV(i) results for the example in Table 3 are represented by the shaded cells (namely UV(A), UV(B), UV(C) and UV(X) in the example). The formula above calculates the score in terms of individual WS. But to judge these values, they must be compared against a reference. The upper limit for the UV will be, of course, set by the one obtained by the ideal option X, formally option n+1. In the example the ideal option scores UV(n+1) = 10. Thus, taking such score as a reference, it is possible to calculate a percentile score for each option that remarks how close or far they are from the complete satisfaction of the requirements. The formula can be written as follows, and will yield the value parameter for our index 8
F�-�/-%/ F�-�/F�-� C 1/ · 100
8 UV(i) will be regarded to as UV(z,i) to describe the UV of an option “i” within a design iteration “z”.
Page | 29
According to these results in Table 3, option C obtains a score that means that could reach some 82% of he customer’s absolute satisfaction, which may be interesting. Meanwhile, A and B are lower with roughly 65 and 59% respectively. At a glance, it seems to be reasonable that option C is the most pleasant. Nevertheless, value only represents a half in eco-efficiency. To be consistent, we need to analyse the environmental impact from a lifecycle approach. In next section we confront this issue.
The use of MCA method to obtain value of a product/service has been argued with pros and cons from many different fields and applications. Weighting, and along with this, ranking, is probably the main drawback, since it includes an important degree of subjectivity in the calculations ([33], [23]). Moreover, customers can change theirs mind towards criteria with relatively easiness or rank them differently depending on the way the questions are made [24] – we will see this actuality in the case study in section 4.4.1. This leads to the fact that the stakeholders that are to make decisions have access to data with arguable reliability. Kiker et al. mention that by such manipulation of data ‘decision makers are prevented from identifying all plausible alternatives and form making full use of all available and necessary information in choosing between identified project alternatives’ [39, p.95]. Also, price has been used as a main stream for value integration in companies and it is true that it will influence most of our decisions when purchasing goods or services. Nevertheless, pricing only makes sense when the company knows that the good is sealable in the market, which means that it contains some appreciation beforehand [8]. Also, if prices are high, customers will be more demanding and stricter in their judgements, and the UV may not vary in the expected direction. This can be, on the other hand of some help to evaluate prices by the company. Anyway, this is left to marketing practices that, as we stated, are not the goal of this thesis. We would like to offer a method such that eases decision-making processes putting aside economic considerations. Hence, we strictly pay attention at “what is what the customer wants”, which is a prior or parallel to “how can we make it economically viable”.
It is frustratingly complex and so far it has not been possible to find the perfect way to evaluate customers’ insights. We discussed in section 2.1.1 the wide variety of definitions of value and the disparity and aims amongst all of them. Thus, it is also questionable the accuracy of other methods, if the value definition is different to the one we support. Besides, this methodology has been utilised by many important bodies such as United States Environmental Protection Agency (USEPA) or the US Department of Energy to solve dilemmas with regard to environmental issues achieving successfully their goals as reported by Kiker et al. [39]. These authors as well propose some tools such as Analytical Hierarchy Process (AHP) to reduce the uncertainties when using weights. Other authors (e.g. [34], [32], [33]) propose the inclusion of standardised tools such as physical or environmental indicators in MCA to provide reliability. The tool that is proposed in this thesis is simply the proximity to the customer that FS involve. The long term relation between customer and company may help to understand the insights of the former and adjust the ideal service to the real needs of the customer after every iteration process. When this informational gap is shortened, results will become more and more reliable and it will be more likely to provide high-valued products covering important customers’ needs. This step is strategically vital since, in line with Walid and Yannow, ‘the organization has to satisfy them [the customers] first in order to satisfy the other two categories [shareholders and employees] in the long run’ [8, p.169]. Moreover, since the customer is implicated in the design of the products, the information available at early stages increases and thus uncertainties and risks in design decrease.
Page | 30
Finally, we believe that the practicality of this method and the easy conceptual background supporting it makes it suitable to be applicable by companies with different resources willing to have a near relation to customers. Additionally, in section 3.2.3 it will be shown the practical gains from MCA method when tackling eco-efficiency and in chapter 4 the implications of FS modelling applied to a case study.
3.2.2. Calculating Lifecycle Environmental Impact (LCE)
Eco-efficiency, deals with the ratio between value generated and the environmental burdens arising form its creation, from a lifecycle perspective. In the previous section it has been proposed a method for comparison of different alternatives, in a design iteration z, in terms of value as customer’s satisfaction level. All the same, one must attend also at the environmental consequences that are linked to such alternatives to be able to choose “eco-efficiently” amongst them. Furthermore, in the previous method, a criterion regarding environmental performance and its score in a scale, are also included for customer’s evaluation. Yet it is necessary to define such score by some method that.
There is extended literature providing methods to calculate the LCE of products or services (e.g. [33], [34]) i.e. the impacts on the environment from extraction of material and energy resources for the creation of value, to its final fate, or rather, from a cradle-to-grave standpoint. Those calculations and their evaluation are tackled by LyfeCycle Assessment (LCA) and its tools. Basically, in LCA, a set of temporal (usually a year) and geographical (local, regional, national) boundaries are fixed, for which the materials and energy flows, including emissions to water, air and soil, are measured, counted or, in some cases, estimated, with regard to a unit of reference. The balance of inputs and outputs per unit of reference will give as a result some impacts on the environment. Such inputs and outputs are regarded as Physical Indicators (PI) and are measured in mass/time or energy/time units9. Since a mass or energy flow is not “good or bad” in itself, they must be turned into Environmental Indicators (EIs) or Environmental Performance Indicators (EPIs), ‘which must be able to provide the appropriate information support to allow such a value judgement’ [32, p.455]. There are many EPIs available and ways in which LCA and EPIs can be matched to present the results. For instance, the European Environmental Agency (EEA) proposes ten main EPIs10 that comprise from citizen satisfaction with the local community to noise pollution, to be used at a local-to-national level. Thus, the first task is to define the LCA tool by which our assessment is intended to be carried out, and that satisfies our needs in design.
In this thesis we will follow a methodology based on the Eco-indicator 99 (EI-99) ([35], [36]) - steps from 1 to 5 below are summaries of these references. Nevertheless, similar linear EPI’s can be applicable to our eco-efficiency index (e.g. LIME method in Japan, ISO-14031 or Eco-Indicator 95). EI-99 methodology is to be used by designers to evaluate the burdens on the environment of a variety of alternatives. It presents a dimensionless number that intends to summarise the LCE of a product/process. It is developed in a set of five steps11 where the performer decides the accuracy of the information to be included in it. Thoroughness is proportional to reliability of results. The authors, as well, provide a manual with standard 9 For material flows it is usual to use kg/year or tonnes/year while the energy unit is typically MWh/year, although it is open to using any unit of flow that may be representative of the case study. 10 Available at http://www.eea.europa.eu/ (last access on 2009/02/18) 11 We added an extra sixth step to match the results from EI-99 to our needs
Page | 31
tableaus (see Appendix I) and application software to ease the procedure. This methodology allows single assessment of alternatives or comparison among a variety, which is our case. Nonetheless, the authors state that the scores should always ‘be used for internal purposes and are not suitable to use in public comparisons, marketing and eco-labelling, as they lack the necessary transparency’. At the same time, they also state that if complete documentation and data, as well as intermediate results are presented together with the results, they may be used in that sense. Be that as it may, its goal, adaptability, and procedures make of it most suitable for our purposes that, all in all, are for decision making at a company level. Once obtained this score, this will be transformed, by a sixth step, to provide the rank for environmental performance in the value method developed in the previous section.
We will describe the EI-99 methodology in two parts: firstly, we will explain the concepts inherent to the indicators; secondly we present a practical guideline in five steps to obtain the results by EI-99 methodology plus a sixth to translate those results into our required scale for our MCA method.
In order to know what these indicators involve, it is necessary some basic background. To abridge the theoretical description, a summary sketch is shown in Figure 2. An EI-99 is an index measured in mpt/PI 12, calculated with data from study of impact on production, processing, disposal and recycling of a material or energy source, and transportation. These indexes are a combination of three damage categories, namely:
• Human Health: comprises the impact by which life expectancy of human beings is altered to be worsened or/and shortened.
• Ecosystem Quality: involves the percentage of all species that have disappeared in an area as a consequence of human activities that led to environmental loads.
• Resources: related to resource depletion that it is here referred to as the quality of the remaining mineral and fossil resources.
These categories intend to represent the most relevant impacts on the environment, among other that may be addressed. This simplification has been carried out due to the fact that weighting impact categories (i.e. evaluating the “importance” of these categories amongst them in a percentile scale) to obtain an index such as EI-99 has proven to be a most difficult task. Lesser amount of categories eases the process. Since this process is rather subjective, it is important that the developers are aware of the consequences coming from each category.
Each category portrays quite dissimilar impacts. Then, it is not wonder then that they comprise different units, and different units cannot be added. Therefore, it is necessary a normalisation of values obtained in each category. In a normalisation process, the numbers are divided by a reference quantity in order to obtain a dimensionless value and ease comparability. As EI-99 refers exclusively to environmental burdens within European boundaries, European normalisation values are considered (these values are given away in the practical guide of the authors). This is an important point since, for the sake of accuracy these indicators can only be used within European territory.
12 “mpt/PI” refers to millipoints, which is a dimensionless unit that involve the damage caused by a unit of physical indicator (PI). Although this unit is the usual unit pt/PI may be used as well, where 1pt < > 1000mpt
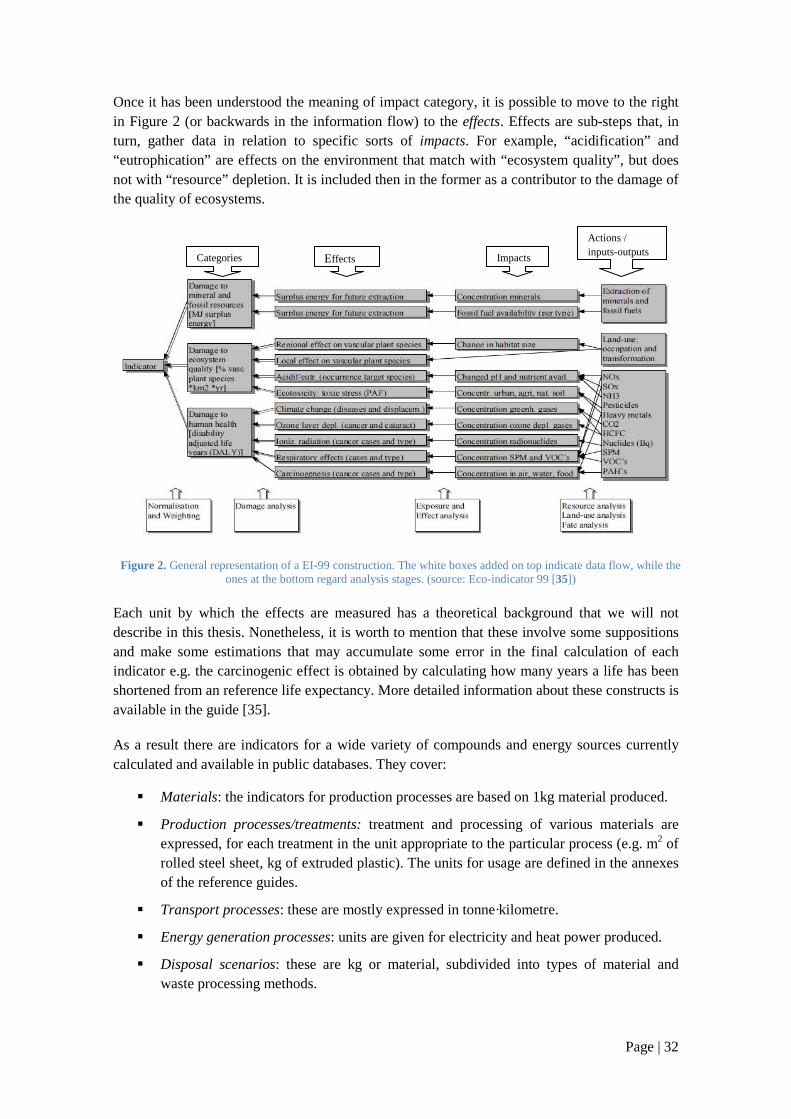
Page | 32
Once it has been understood the meaning of impact category, it is possible to move to the right in Figure 2 (or backwards in the information flow) to the effects. Effects are sub-steps that, in turn, gather data in relation to specific sorts of impacts. For example, “acidification” and “eutrophication” are effects on the environment that match with “ecosystem quality”, but does not with “resource” depletion. It is included then in the former as a contributor to the damage of the quality of ecosystems.
Each unit by which the effects are measured has a theoretical background that we will not describe in this thesis. Nonetheless, it is worth to mention that these involve some suppositions and make some estimations that may accumulate some error in the final calculation of each indicator e.g. the carcinogenic effect is obtained by calculating how many years a life has been shortened from an reference life expectancy. More detailed information about these constructs is available in the guide [35].
As a result there are indicators for a wide variety of compounds and energy sources currently calculated and available in public databases. They cover:
� Materials: the indicators for production processes are based on 1kg material produced.
� Production processes/treatments: treatment and processing of various materials are expressed, for each treatment in the unit appropriate to the particular process (e.g. m2 of rolled steel sheet, kg of extruded plastic). The units for usage are defined in the annexes of the reference guides.
� Transport processes: these are mostly expressed in tonne·kilometre.
� Energy generation processes: units are given for electricity and heat power produced.
� Disposal scenarios: these are kg or material, subdivided into types of material and waste processing methods.
Effects Impacts
Actions / inputs-outputs Categories
Figure 2. General representation of a EI-99 construction. The white boxes added on top indicate data flow, while the ones at the bottom regard analysis stages. (source: Eco-indicator 99 [35])
Page | 33
EI-99 methodology assumes that each EI represents a level of damage considered in isolation from the rest. Likewise, the five bullets above can be measured by PI for different substances, energy sources, etc. For example, production of cement has an EI-99 of 20mpt/kg that includes the processes implied to produce an amount (kg) of cement. The impact is yielded by multiplying the proper EI-99 by its PI. In the previous example, if the design requires the production of 2,000kg of concrete to satisfy the functional unit, the impact from cement production is 40,000mpt (or rather 40pt). Similar procedure is utilised for calculation of impact of material production, transportation et cetera, by using the proper units and amounts. On the other hand, a lifecycle can be divided into the following independent stages.
1. Production: It involves materials, treatments, transports and extra energy.
2. Use: includes transport, energy and possible auxiliary materials.
3. Disposal: different scenarios and processes for each material type.
Each stage will contain combinations of the previous individual impacts, and therefore will have their own partial score. The partial scores from the single stages can be, thus, added to obtain a final overall score.
So far, it has been explained the meaning of EI-99s and what they represent. Next we describe the steps to follow in application. Again, for more detailed information about the procedure, consequences and limitations refer to [36].
Step 1: establish the purpose of the calculations. First and foremost, the designer should define if the analysis will be focused on a single alternative or on a comparison of different alternatives; in the case of a comparison, it will be crucial to specify what exactly is to be compared. As it was mentioned before in this section, this will determine the level of accuracy of the results. It is expected that for an evaluation of the environmental impact of a design the information collected will depend on how detailed the study is intended to be, and that is up to the designer’s or company’s criteria. On the other hand, should it be for comparative analysis, the more detailed it is carried out, the more reliable and comparable the results become. Different processes, materials and, in general, lifecycles may be involved. If no special care is taken in the description, errors will accumulate through calculations and it might not be possible to decide among an alternative or to do it wrongly.
Step 2: define the Lifecycle. The designer creates a flowchart that includes the parties contributing, to more or less extent, to the environmental impact of the product - the accuracy has been previously defined in step 1. When comparing several alternatives, each of them should have its own flowchart. These should be split into the three stages defined above to facilitate the use of EI-99s. This requires identifying them and linking them with their materials, transportation, processes and/or energy needs. An example is provided by Figure 3 below describing the environmental impact a coffee machine.
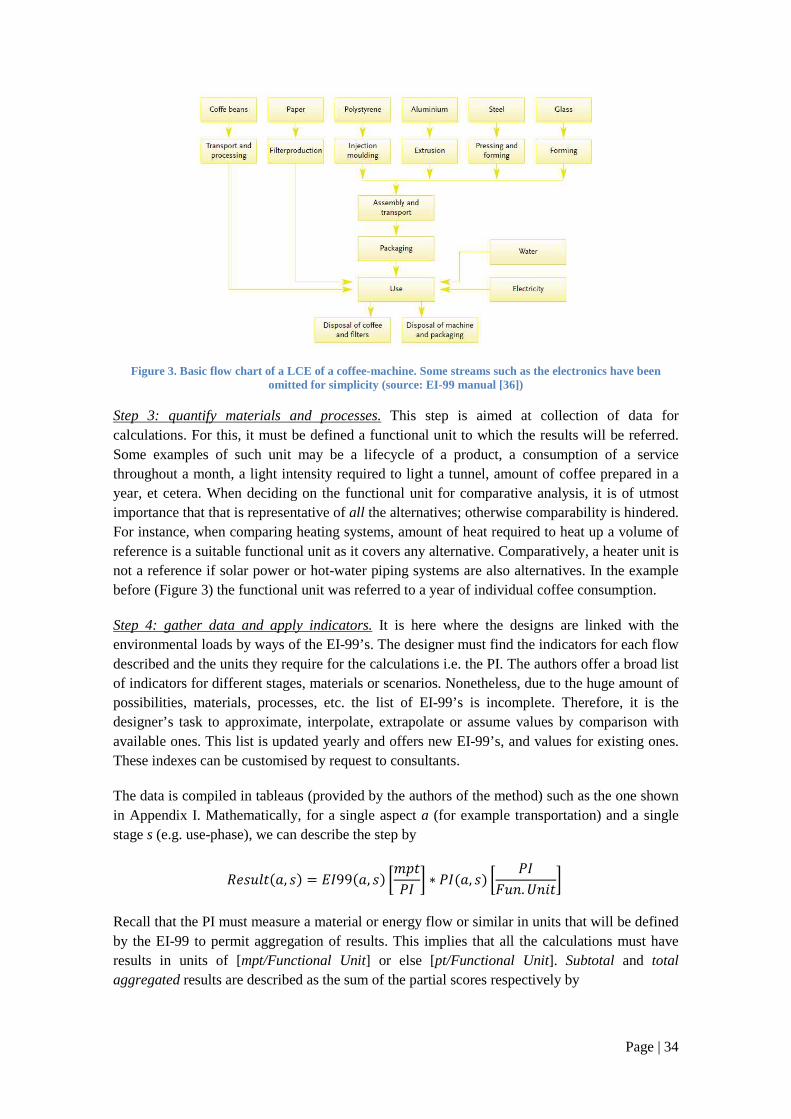
Page | 34
Figure 3. Basic flow chart of a LCE of a coffee-machine. Some streams such as the electronics have been omitted for simplicity (source: EI-99 manual [36])
Step 3: quantify materials and processes. This step is aimed at collection of data for calculations. For this, it must be defined a functional unit to which the results will be referred. Some examples of such unit may be a lifecycle of a product, a consumption of a service throughout a month, a light intensity required to light a tunnel, amount of coffee prepared in a year, et cetera. When deciding on the functional unit for comparative analysis, it is of utmost importance that that is representative of all the alternatives; otherwise comparability is hindered. For instance, when comparing heating systems, amount of heat required to heat up a volume of reference is a suitable functional unit as it covers any alternative. Comparatively, a heater unit is not a reference if solar power or hot-water piping systems are also alternatives. In the example before (Figure 3) the functional unit was referred to a year of individual coffee consumption.
Step 4: gather data and apply indicators. It is here where the designs are linked with the environmental loads by ways of the EI-99’s. The designer must find the indicators for each flow described and the units they require for the calculations i.e. the PI. The authors offer a broad list of indicators for different stages, materials or scenarios. Nonetheless, due to the huge amount of possibilities, materials, processes, etc. the list of EI-99’s is incomplete. Therefore, it is the designer’s task to approximate, interpolate, extrapolate or assume values by comparison with available ones. This list is updated yearly and offers new EI-99’s, and values for existing ones. These indexes can be customised by request to consultants.
The data is compiled in tableaus (provided by the authors of the method) such as the one shown in Appendix I. Mathematically, for a single aspect a (for example transportation) and a single stage s (e.g. use-phase), we can describe the step by
;�I���- , I/ ��99- , I/ K���L� M N L�- , I/ K L�O��. F���M Recall that the PI must measure a material or energy flow or similar in units that will be defined by the EI-99 to permit aggregation of results. This implies that all the calculations must have results in units of [mpt/Functional Unit] or else [pt/Functional Unit]. Subtotal and total aggregated results are described as the sum of the partial scores respectively by
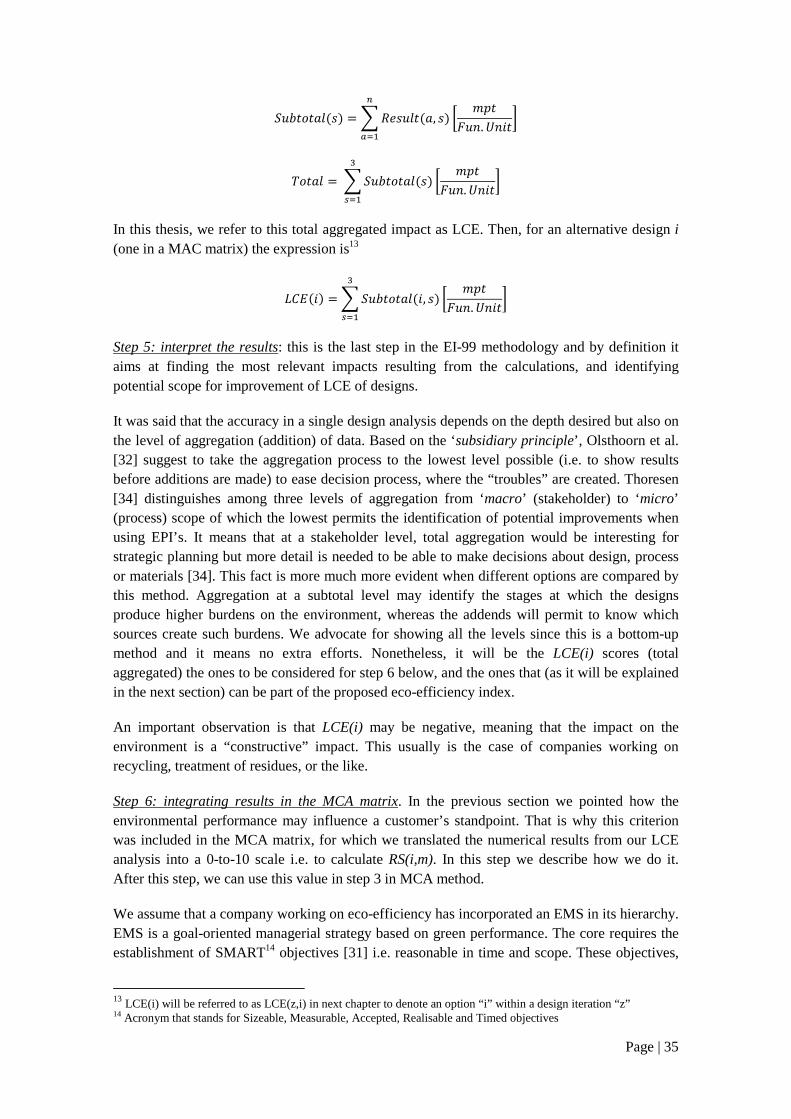
Page | 35
<�Q��� �-I/ G ;�I���- , I/ K ���O��. F���M �23
R�� � G <�Q��� �-I/ K ���O��. F���MST23
In this thesis, we refer to this total aggregated impact as LCE. Then, for an alternative design i (one in a MAC matrix) the expression is13
AB�-�/ G <�Q��� �-�, I/ K ���O��. F���MST23
Step 5: interpret the results: this is the last step in the EI-99 methodology and by definition it aims at finding the most relevant impacts resulting from the calculations, and identifying potential scope for improvement of LCE of designs.
It was said that the accuracy in a single design analysis depends on the depth desired but also on the level of aggregation (addition) of data. Based on the ‘subsidiary principle’, Olsthoorn et al. [32] suggest to take the aggregation process to the lowest level possible (i.e. to show results before additions are made) to ease decision process, where the “troubles” are created. Thoresen [34] distinguishes among three levels of aggregation from ‘macro’ (stakeholder) to ‘micro’ (process) scope of which the lowest permits the identification of potential improvements when using EPI’s. It means that at a stakeholder level, total aggregation would be interesting for strategic planning but more detail is needed to be able to make decisions about design, process or materials [34]. This fact is more much more evident when different options are compared by this method. Aggregation at a subtotal level may identify the stages at which the designs produce higher burdens on the environment, whereas the addends will permit to know which sources create such burdens. We advocate for showing all the levels since this is a bottom-up method and it means no extra efforts. Nonetheless, it will be the LCE(i) scores (total aggregated) the ones to be considered for step 6 below, and the ones that (as it will be explained in the next section) can be part of the proposed eco-efficiency index.
An important observation is that LCE(i) may be negative, meaning that the impact on the environment is a “constructive” impact. This usually is the case of companies working on recycling, treatment of residues, or the like.
Step 6: integrating results in the MCA matrix. In the previous section we pointed how the environmental performance may influence a customer’s standpoint. That is why this criterion was included in the MCA matrix, for which we translated the numerical results from our LCE analysis into a 0-to-10 scale i.e. to calculate RS(i,m). In this step we describe how we do it. After this step, we can use this value in step 3 in MCA method.
We assume that a company working on eco-efficiency has incorporated an EMS in its hierarchy. EMS is a goal-oriented managerial strategy based on green performance. The core requires the establishment of SMART14 objectives [31] i.e. reasonable in time and scope. These objectives,
13 LCE(i) will be referred to as LCE(z,i) in next chapter to denote an option “i” within a design iteration “z” 14 Acronym that stands for Sizeable, Measurable, Accepted, Realisable and Timed objectives
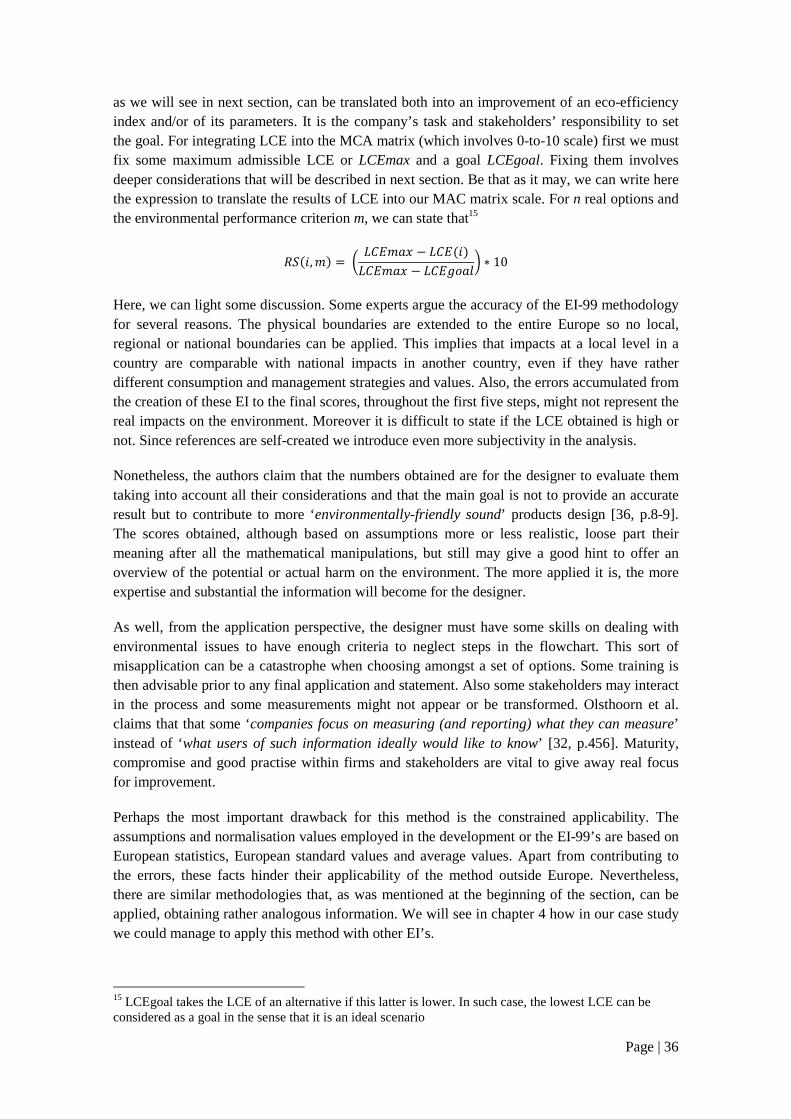
Page | 36
as we will see in next section, can be translated both into an improvement of an eco-efficiency index and/or of its parameters. It is the company’s task and stakeholders’ responsibility to set the goal. For integrating LCE into the MCA matrix (which involves 0-to-10 scale) first we must fix some maximum admissible LCE or LCEmax and a goal LCEgoal. Fixing them involves deeper considerations that will be described in next section. Be that as it may, we can write here the expression to translate the results of LCE into our MAC matrix scale. For n real options and the environmental performance criterion m, we can state that15
;<-�, �/ U AB�� V � AB�-�/AB�� V � AB�W� �X N 10
Here, we can light some discussion. Some experts argue the accuracy of the EI-99 methodology for several reasons. The physical boundaries are extended to the entire Europe so no local, regional or national boundaries can be applied. This implies that impacts at a local level in a country are comparable with national impacts in another country, even if they have rather different consumption and management strategies and values. Also, the errors accumulated from the creation of these EI to the final scores, throughout the first five steps, might not represent the real impacts on the environment. Moreover it is difficult to state if the LCE obtained is high or not. Since references are self-created we introduce even more subjectivity in the analysis.
Nonetheless, the authors claim that the numbers obtained are for the designer to evaluate them taking into account all their considerations and that the main goal is not to provide an accurate result but to contribute to more ‘environmentally-friendly sound’ products design [36, p.8-9]. The scores obtained, although based on assumptions more or less realistic, loose part their meaning after all the mathematical manipulations, but still may give a good hint to offer an overview of the potential or actual harm on the environment. The more applied it is, the more expertise and substantial the information will become for the designer.
As well, from the application perspective, the designer must have some skills on dealing with environmental issues to have enough criteria to neglect steps in the flowchart. This sort of misapplication can be a catastrophe when choosing amongst a set of options. Some training is then advisable prior to any final application and statement. Also some stakeholders may interact in the process and some measurements might not appear or be transformed. Olsthoorn et al. claims that that some ‘companies focus on measuring (and reporting) what they can measure’ instead of ‘what users of such information ideally would like to know’ [32, p.456]. Maturity, compromise and good practise within firms and stakeholders are vital to give away real focus for improvement.
Perhaps the most important drawback for this method is the constrained applicability. The assumptions and normalisation values employed in the development or the EI-99’s are based on European statistics, European standard values and average values. Apart from contributing to the errors, these facts hinder their applicability of the method outside Europe. Nevertheless, there are similar methodologies that, as was mentioned at the beginning of the section, can be applied, obtaining rather analogous information. We will see in chapter 4 how in our case study we could manage to apply this method with other EI’s.
15 LCEgoal takes the LCE of an alternative if this latter is lower. In such case, the lowest LCE can be considered as a goal in the sense that it is an ideal scenario
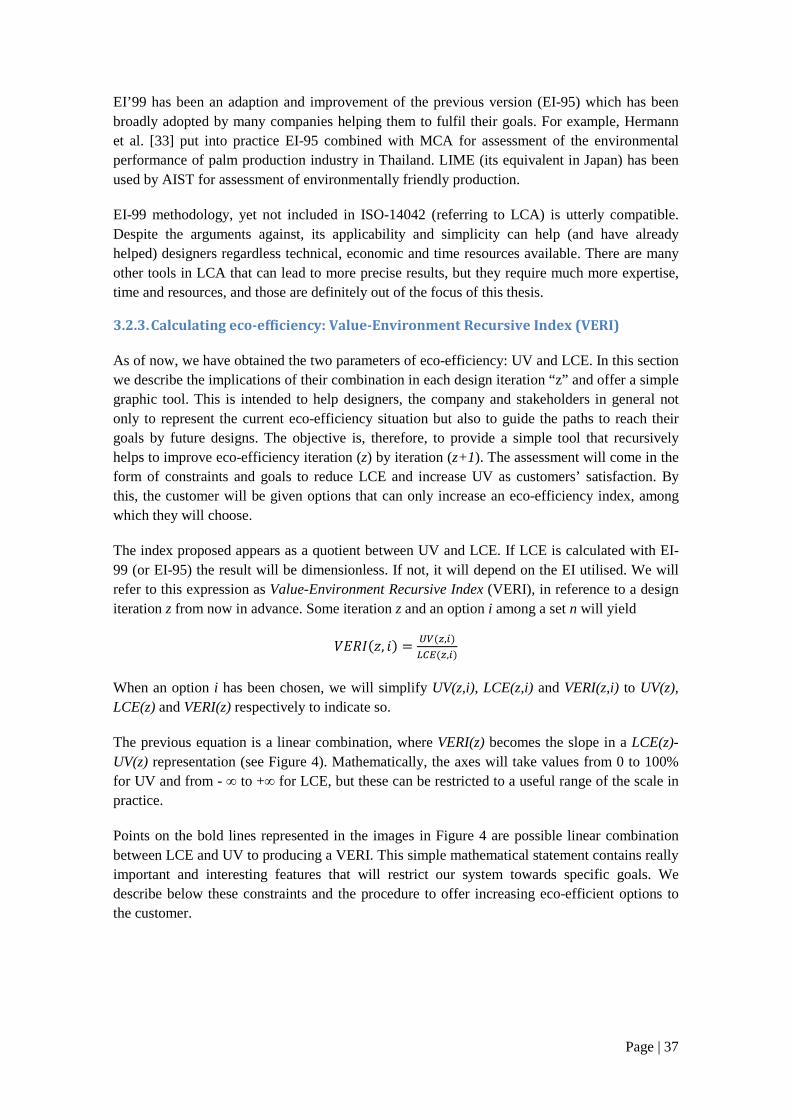
Page | 37
EI’99 has been an adaption and improvement of the previous version (EI-95) which has been broadly adopted by many companies helping them to fulfil their goals. For example, Hermann et al. [33] put into practice EI-95 combined with MCA for assessment of the environmental performance of palm production industry in Thailand. LIME (its equivalent in Japan) has been used by AIST for assessment of environmentally friendly production.
EI-99 methodology, yet not included in ISO-14042 (referring to LCA) is utterly compatible. Despite the arguments against, its applicability and simplicity can help (and have already helped) designers regardless technical, economic and time resources available. There are many other tools in LCA that can lead to more precise results, but they require much more expertise, time and resources, and those are definitely out of the focus of this thesis.
3.2.3. Calculating eco-efficiency: Value-Environment Recursive Index (VERI)
As of now, we have obtained the two parameters of eco-efficiency: UV and LCE. In this section we describe the implications of their combination in each design iteration “z” and offer a simple graphic tool. This is intended to help designers, the company and stakeholders in general not only to represent the current eco-efficiency situation but also to guide the paths to reach their goals by future designs. The objective is, therefore, to provide a simple tool that recursively helps to improve eco-efficiency iteration (z) by iteration (z+1). The assessment will come in the form of constraints and goals to reduce LCE and increase UV as customers’ satisfaction. By this, the customer will be given options that can only increase an eco-efficiency index, among which they will choose.
The index proposed appears as a quotient between UV and LCE. If LCE is calculated with EI-99 (or EI-95) the result will be dimensionless. If not, it will depend on the EI utilised. We will refer to this expression as Value-Environment Recursive Index (VERI), in reference to a design iteration z from now in advance. Some iteration z and an option i among a set n will yield
��;�-Y, �/ Z�-[,"/\]�-[,"/ When an option i has been chosen, we will simplify UV(z,i), LCE(z,i) and VERI(z,i) to UV(z), LCE(z) and VERI(z) respectively to indicate so.
The previous equation is a linear combination, where VERI(z) becomes the slope in a LCE(z)-UV(z) representation (see Figure 4). Mathematically, the axes will take values from 0 to 100% for UV and from - ∞ to +∞ for LCE, but these can be restricted to a useful range of the scale in practice.
Points on the bold lines represented in the images in Figure 4 are possible linear combination between LCE and UV to producing a VERI. This simple mathematical statement contains really important and interesting features that will restrict our system towards specific goals. We describe below these constraints and the procedure to offer increasing eco-efficient options to the customer.
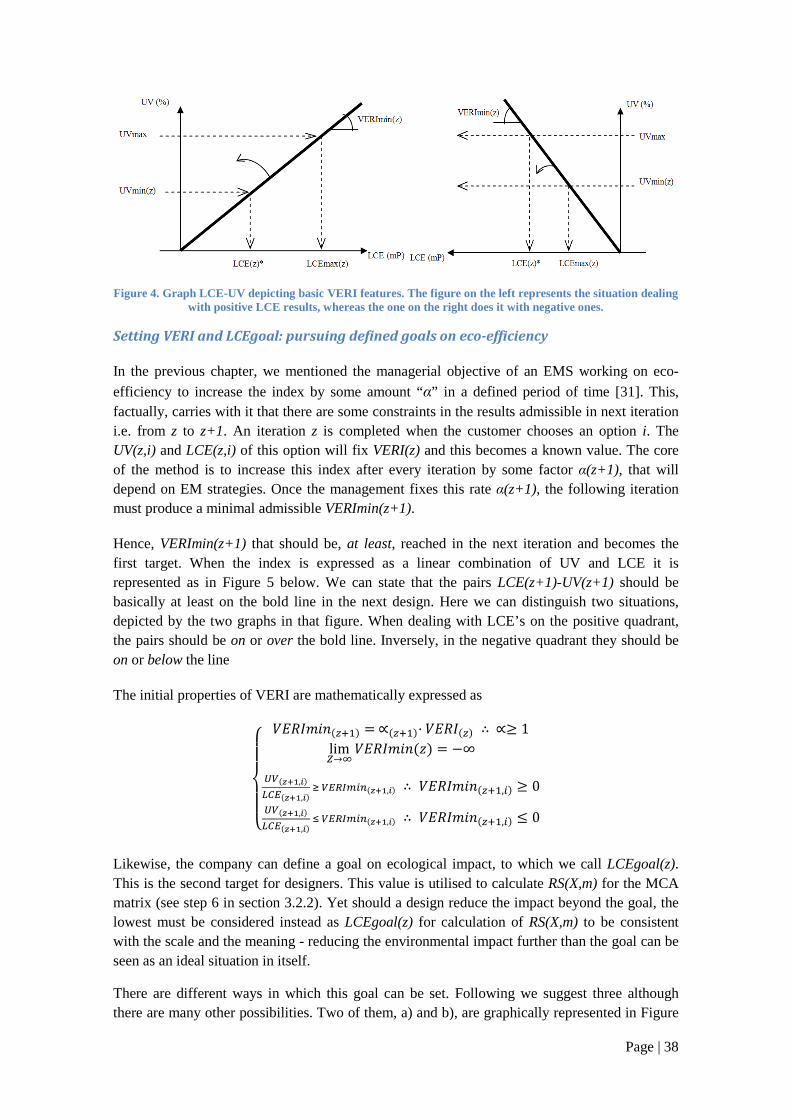
Page | 38
Figure 4. Graph LCE-UV depicting basic VERI features. The figure on the left represents the situation dealing with positive LCE results, whereas the one on the right does it with negative ones.
Setting VERI and LCEgoal: pursuing defined goals on eco-efficiency
In the previous chapter, we mentioned the managerial objective of an EMS working on eco-
efficiency to increase the index by some amount “α” in a defined period of time [31]. This, factually, carries with it that there are some constraints in the results admissible in next iteration i.e. from z to z+1. An iteration z is completed when the customer chooses an option i. The UV(z,i) and LCE(z,i) of this option will fix VERI(z) and this becomes a known value. The core of the method is to increase this index after every iteration by some factor α(z+1), that will depend on EM strategies. Once the management fixes this rate α(z+1), the following iteration must produce a minimal admissible VERImin(z+1).
Hence, VERImin(z+1) that should be, at least, reached in the next iteration and becomes the first target. When the index is expressed as a linear combination of UV and LCE it is represented as in Figure 5 below. We can state that the pairs LCE(z+1)-UV(z+1) should be basically at least on the bold line in the next design. Here we can distinguish two situations, depicted by the two graphs in that figure. When dealing with LCE’s on the positive quadrant, the pairs should be on or over the bold line. Inversely, in the negative quadrant they should be on or below the line
The initial properties of VERI are mathematically expressed as
_̂_̀__a ��;����-[b3/ c-[b3/d ��;�-[/ > ce 1limijk ��;����-Y/ �∞ Z�-mno,p/\]�-mno,p/ q ��r'%" -mno,p/ > ��;����-[b3,"/ e 0Z�-mno,p/\]�-mno,p/ s ��r'%" -mno,p/ > ��;����-[b3,"/ t 0
:
Likewise, the company can define a goal on ecological impact, to which we call LCEgoal(z). This is the second target for designers. This value is utilised to calculate RS(X,m) for the MCA matrix (see step 6 in section 3.2.2). Yet should a design reduce the impact beyond the goal, the lowest must be considered instead as LCEgoal(z) for calculation of RS(X,m) to be consistent with the scale and the meaning - reducing the environmental impact further than the goal can be seen as an ideal situation in itself.
There are different ways in which this goal can be set. Following we suggest three although there are many other possibilities. Two of them, a) and b), are graphically represented in Figure
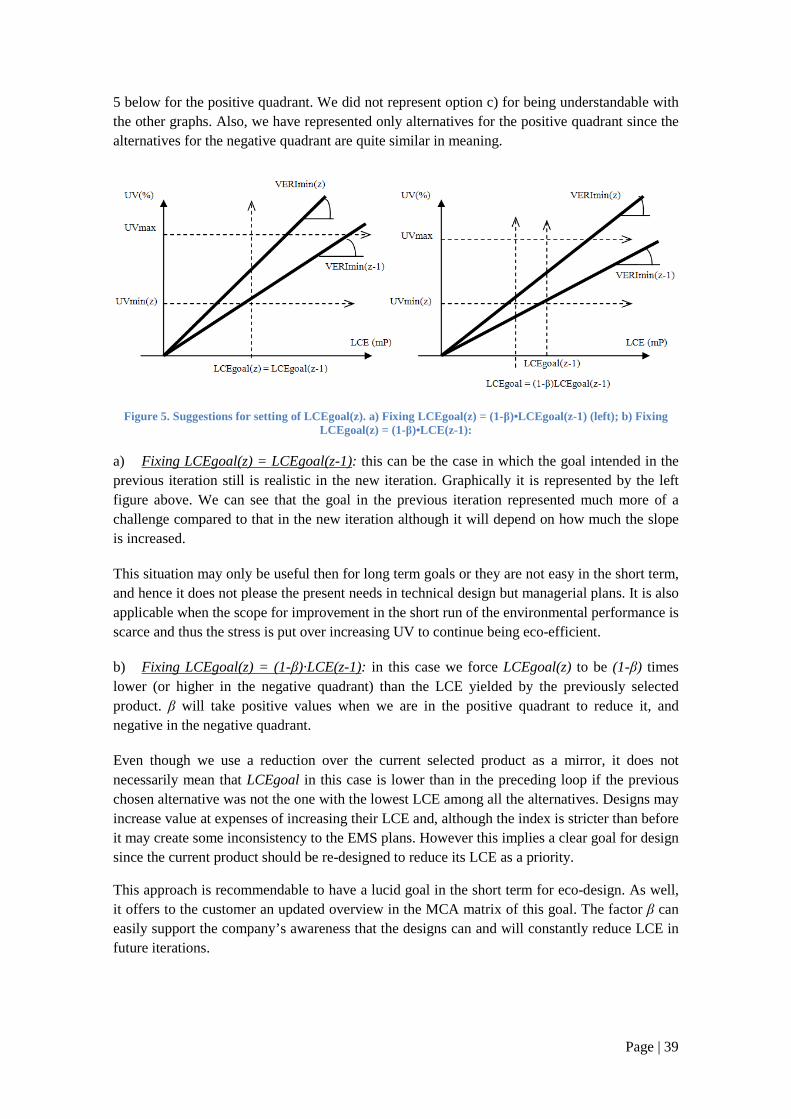
Page | 39
5 below for the positive quadrant. We did not represent option c) for being understandable with the other graphs. Also, we have represented only alternatives for the positive quadrant since the alternatives for the negative quadrant are quite similar in meaning.
Figure 5. Suggestions for setting of LCEgoal(z). a) Fixing LCEgoal(z) = (1-β)•LCEgoal(z-1) (left); b) Fixing LCEgoal(z) = (1-β)•LCE(z-1):
a) Fixing LCEgoal(z) = LCEgoal(z-1): this can be the case in which the goal intended in the previous iteration still is realistic in the new iteration. Graphically it is represented by the left figure above. We can see that the goal in the previous iteration represented much more of a challenge compared to that in the new iteration although it will depend on how much the slope is increased.
This situation may only be useful then for long term goals or they are not easy in the short term, and hence it does not please the present needs in technical design but managerial plans. It is also applicable when the scope for improvement in the short run of the environmental performance is scarce and thus the stress is put over increasing UV to continue being eco-efficient.
b) Fixing LCEgoal(z) = (1-β)·LCE(z-1): in this case we force LCEgoal(z) to be (1-β) times lower (or higher in the negative quadrant) than the LCE yielded by the previously selected product. β will take positive values when we are in the positive quadrant to reduce it, and negative in the negative quadrant.
Even though we use a reduction over the current selected product as a mirror, it does not necessarily mean that LCEgoal in this case is lower than in the preceding loop if the previous chosen alternative was not the one with the lowest LCE among all the alternatives. Designs may increase value at expenses of increasing their LCE and, although the index is stricter than before it may create some inconsistency to the EMS plans. However this implies a clear goal for design since the current product should be re-designed to reduce its LCE as a priority.
This approach is recommendable to have a lucid goal in the short term for eco-design. As well, it offers to the customer an updated overview in the MCA matrix of this goal. The factor β can easily support the company’s awareness that the designs can and will constantly reduce LCE in future iterations.
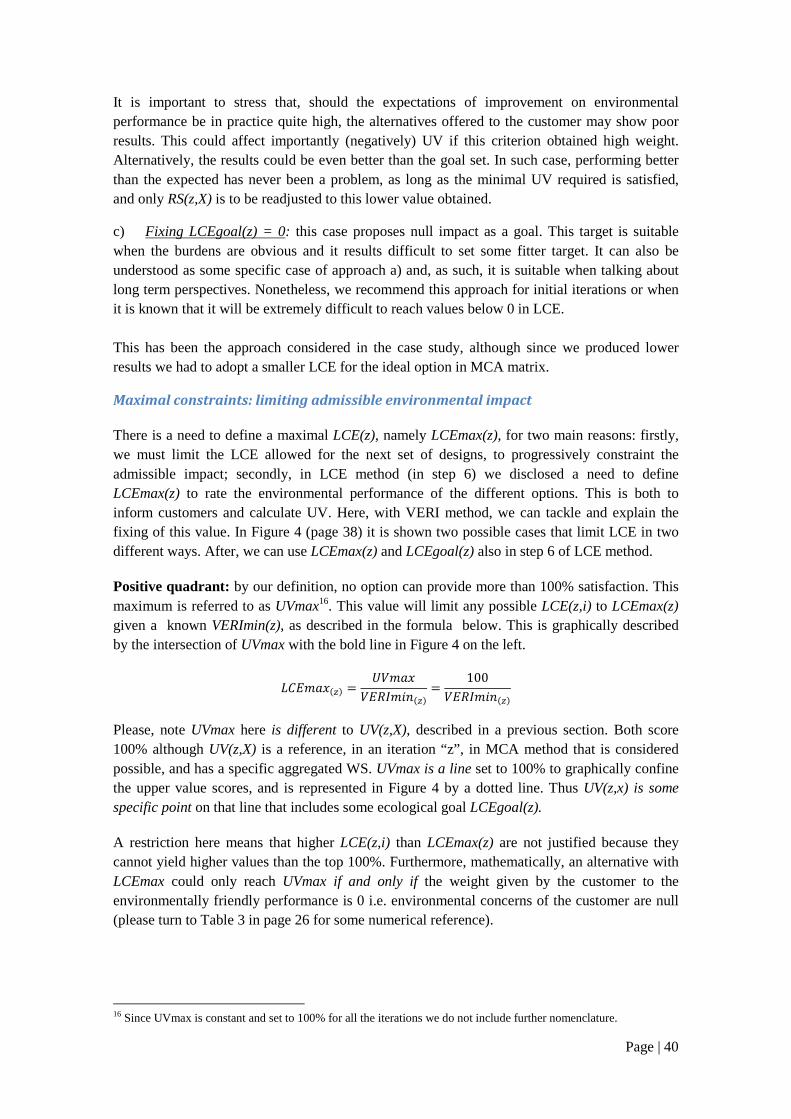
Page | 40
It is important to stress that, should the expectations of improvement on environmental performance be in practice quite high, the alternatives offered to the customer may show poor results. This could affect importantly (negatively) UV if this criterion obtained high weight. Alternatively, the results could be even better than the goal set. In such case, performing better than the expected has never been a problem, as long as the minimal UV required is satisfied, and only RS(z,X) is to be readjusted to this lower value obtained.
c) Fixing LCEgoal(z) = 0: this case proposes null impact as a goal. This target is suitable when the burdens are obvious and it results difficult to set some fitter target. It can also be understood as some specific case of approach a) and, as such, it is suitable when talking about long term perspectives. Nonetheless, we recommend this approach for initial iterations or when it is known that it will be extremely difficult to reach values below 0 in LCE. This has been the approach considered in the case study, although since we produced lower results we had to adopt a smaller LCE for the ideal option in MCA matrix.
Maximal constraints: limiting admissible environmental impact
There is a need to define a maximal LCE(z), namely LCEmax(z), for two main reasons: firstly, we must limit the LCE allowed for the next set of designs, to progressively constraint the admissible impact; secondly, in LCE method (in step 6) we disclosed a need to define LCEmax(z) to rate the environmental performance of the different options. This is both to inform customers and calculate UV. Here, with VERI method, we can tackle and explain the fixing of this value. In Figure 4 (page 38) it is shown two possible cases that limit LCE in two different ways. After, we can use LCEmax(z) and LCEgoal(z) also in step 6 of LCE method.
Positive quadrant: by our definition, no option can provide more than 100% satisfaction. This maximum is referred to as UVmax16. This value will limit any possible LCE(z,i) to LCEmax(z) given a known VERImin(z), as described in the formula below. This is graphically described by the intersection of UVmax with the bold line in Figure 4 on the left.
AB�� V-[/ F�� V��;����-[/ 100��;����-[/ Please, note UVmax here is different to UV(z,X), described in a previous section. Both score 100% although UV(z,X) is a reference, in an iteration “z”, in MCA method that is considered possible, and has a specific aggregated WS. UVmax is a line set to 100% to graphically confine the upper value scores, and is represented in Figure 4 by a dotted line. Thus UV(z,x) is some specific point on that line that includes some ecological goal LCEgoal(z).
A restriction here means that higher LCE(z,i) than LCEmax(z) are not justified because they cannot yield higher values than the top 100%. Furthermore, mathematically, an alternative with LCEmax could only reach UVmax if and only if the weight given by the customer to the environmentally friendly performance is 0 i.e. environmental concerns of the customer are null (please turn to Table 3 in page 26 for some numerical reference).
16 Since UVmax is constant and set to 100% for all the iterations we do not include further nomenclature.
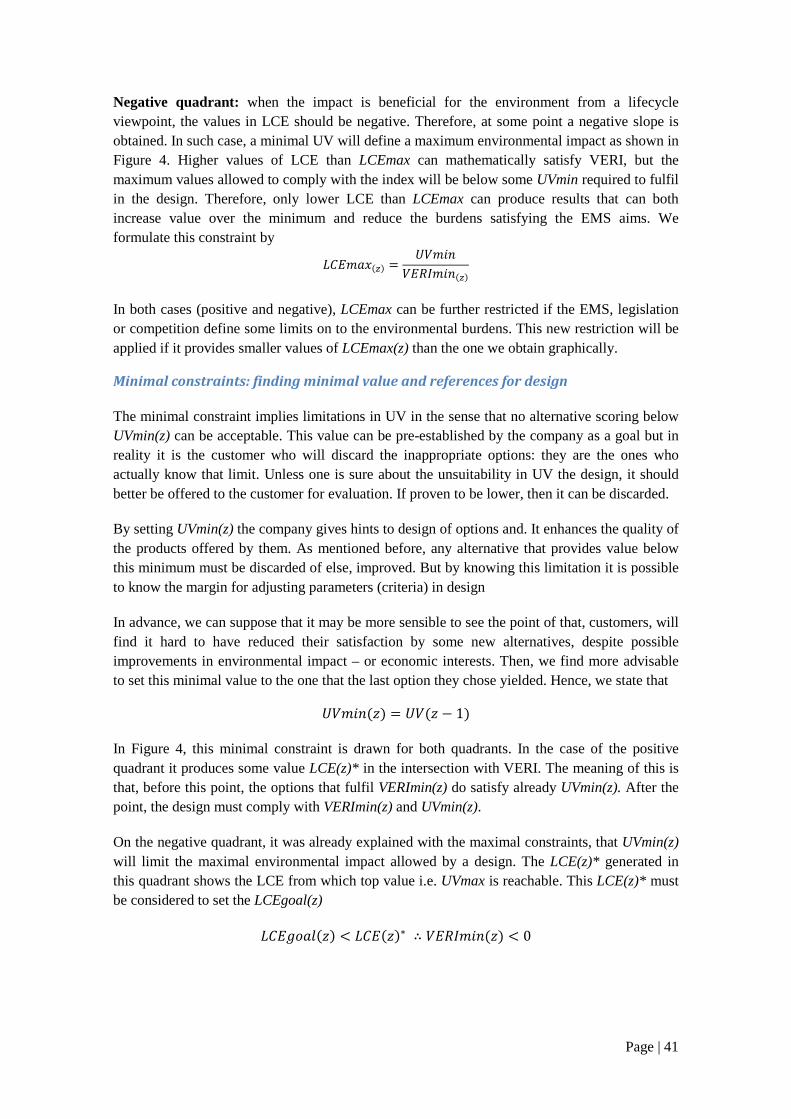
Page | 41
Negative quadrant: when the impact is beneficial for the environment from a lifecycle viewpoint, the values in LCE should be negative. Therefore, at some point a negative slope is obtained. In such case, a minimal UV will define a maximum environmental impact as shown in Figure 4. Higher values of LCE than LCEmax can mathematically satisfy VERI, but the maximum values allowed to comply with the index will be below some UVmin required to fulfil in the design. Therefore, only lower LCE than LCEmax can produce results that can both increase value over the minimum and reduce the burdens satisfying the EMS aims. We formulate this constraint by AB�� V-[/ F������;����-[/ In both cases (positive and negative), LCEmax can be further restricted if the EMS, legislation or competition define some limits on to the environmental burdens. This new restriction will be applied if it provides smaller values of LCEmax(z) than the one we obtain graphically.
Minimal constraints: finding minimal value and references for design
The minimal constraint implies limitations in UV in the sense that no alternative scoring below UVmin(z) can be acceptable. This value can be pre-established by the company as a goal but in reality it is the customer who will discard the inappropriate options: they are the ones who actually know that limit. Unless one is sure about the unsuitability in UV the design, it should better be offered to the customer for evaluation. If proven to be lower, then it can be discarded.
By setting UVmin(z) the company gives hints to design of options and. It enhances the quality of the products offered by them. As mentioned before, any alternative that provides value below this minimum must be discarded of else, improved. But by knowing this limitation it is possible to know the margin for adjusting parameters (criteria) in design
In advance, we can suppose that it may be more sensible to see the point of that, customers, will find it hard to have reduced their satisfaction by some new alternatives, despite possible improvements in environmental impact – or economic interests. Then, we find more advisable to set this minimal value to the one that the last option they chose yielded. Hence, we state that
F����-Y/ F�-Y � 1/
In Figure 4, this minimal constraint is drawn for both quadrants. In the case of the positive quadrant it produces some value LCE(z)* in the intersection with VERI. The meaning of this is that, before this point, the options that fulfil VERImin(z) do satisfy already UVmin(z). After the point, the design must comply with VERImin(z) and UVmin(z).
On the negative quadrant, it was already explained with the maximal constraints, that UVmin(z) will limit the maximal environmental impact allowed by a design. The LCE(z)* generated in this quadrant shows the LCE from which top value i.e. UVmax is reachable. This LCE(z)* must be considered to set the LCEgoal(z)
AB�W� �-Y/ u AB�-Y/N > ��;����-Y/ u 0
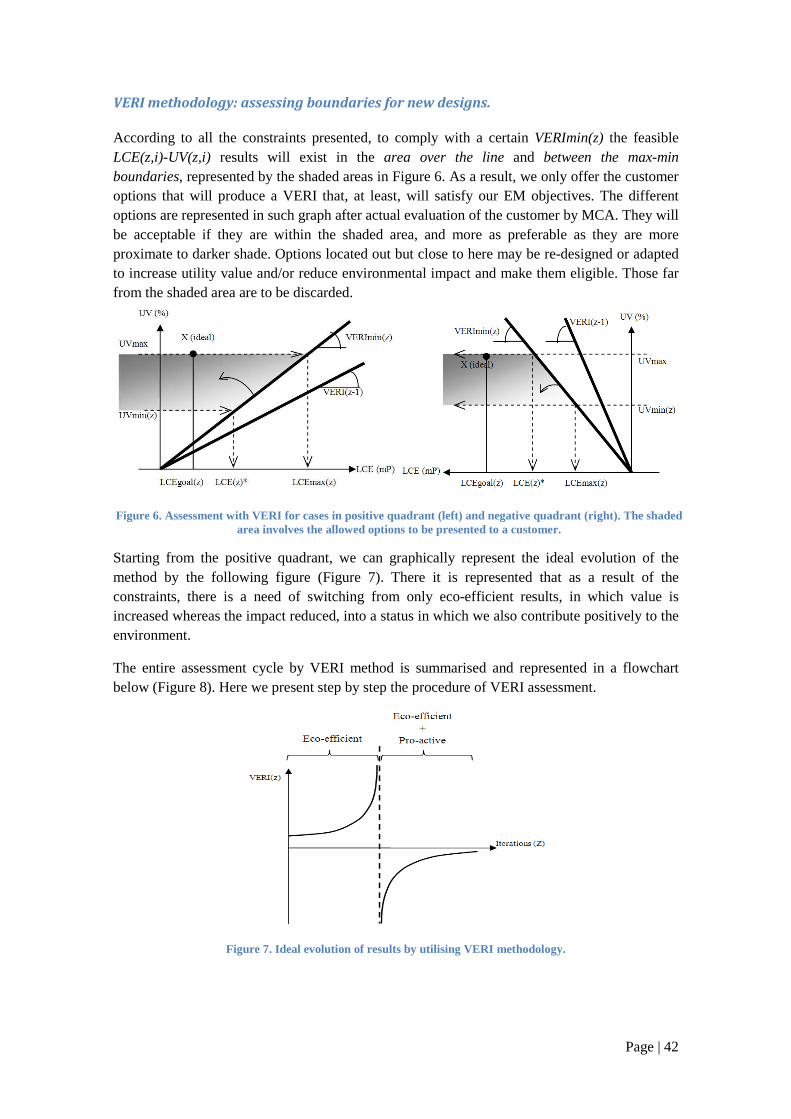
Page | 42
VERI methodology: assessing boundaries for new designs.
According to all the constraints presented, to comply with a certain VERImin(z) the feasible LCE(z,i)-UV(z,i) results will exist in the area over the line and between the max-min boundaries, represented by the shaded areas in Figure 6. As a result, we only offer the customer options that will produce a VERI that, at least, will satisfy our EM objectives. The different options are represented in such graph after actual evaluation of the customer by MCA. They will be acceptable if they are within the shaded area, and more as preferable as they are more proximate to darker shade. Options located out but close to here may be re-designed or adapted to increase utility value and/or reduce environmental impact and make them eligible. Those far from the shaded area are to be discarded.
Starting from the positive quadrant, we can graphically represent the ideal evolution of the method by the following figure (Figure 7). There it is represented that as a result of the constraints, there is a need of switching from only eco-efficient results, in which value is increased whereas the impact reduced, into a status in which we also contribute positively to the environment.
The entire assessment cycle by VERI method is summarised and represented in a flowchart below (Figure 8). Here we present step by step the procedure of VERI assessment.
Figure 7. Ideal evolution of results by utilising VERI methodology.
Figure 6. Assessment with VERI for cases in positive quadrant (left) and negative quadrant (right). The shaded area involves the allowed options to be presented to a customer.
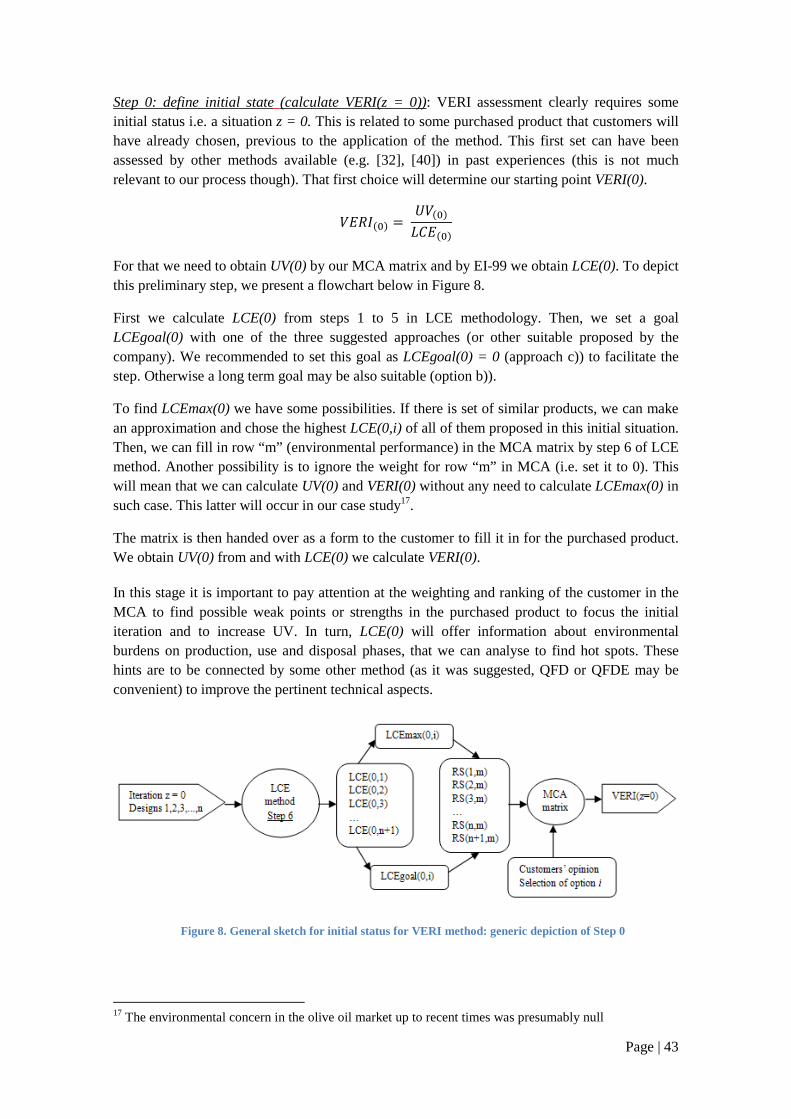
Page | 43
Step 0: define initial state (calculate VERI(z = 0)): VERI assessment clearly requires some initial status i.e. a situation z = 0. This is related to some purchased product that customers will have already chosen, previous to the application of the method. This first set can have been assessed by other methods available (e.g. [32], [40]) in past experiences (this is not much relevant to our process though). That first choice will determine our starting point VERI(0).
��;�-v/ F�-v/AB�-v/ For that we need to obtain UV(0) by our MCA matrix and by EI-99 we obtain LCE(0). To depict this preliminary step, we present a flowchart below in Figure 8.
First we calculate LCE(0) from steps 1 to 5 in LCE methodology. Then, we set a goal LCEgoal(0) with one of the three suggested approaches (or other suitable proposed by the company). We recommended to set this goal as LCEgoal(0) = 0 (approach c)) to facilitate the step. Otherwise a long term goal may be also suitable (option b)).
To find LCEmax(0) we have some possibilities. If there is set of similar products, we can make an approximation and chose the highest LCE(0,i) of all of them proposed in this initial situation. Then, we can fill in row “m” (environmental performance) in the MCA matrix by step 6 of LCE method. Another possibility is to ignore the weight for row “m” in MCA (i.e. set it to 0). This will mean that we can calculate UV(0) and VERI(0) without any need to calculate LCEmax(0) in such case. This latter will occur in our case study17.
The matrix is then handed over as a form to the customer to fill it in for the purchased product. We obtain UV(0) from and with LCE(0) we calculate VERI(0).
In this stage it is important to pay attention at the weighting and ranking of the customer in the MCA to find possible weak points or strengths in the purchased product to focus the initial iteration and to increase UV. In turn, LCE(0) will offer information about environmental burdens on production, use and disposal phases, that we can analyse to find hot spots. These hints are to be connected by some other method (as it was suggested, QFD or QFDE may be convenient) to improve the pertinent technical aspects.
17 The environmental concern in the olive oil market up to recent times was presumably null
Figure 8. General sketch for initial status for VERI method: generic depiction of Step 0
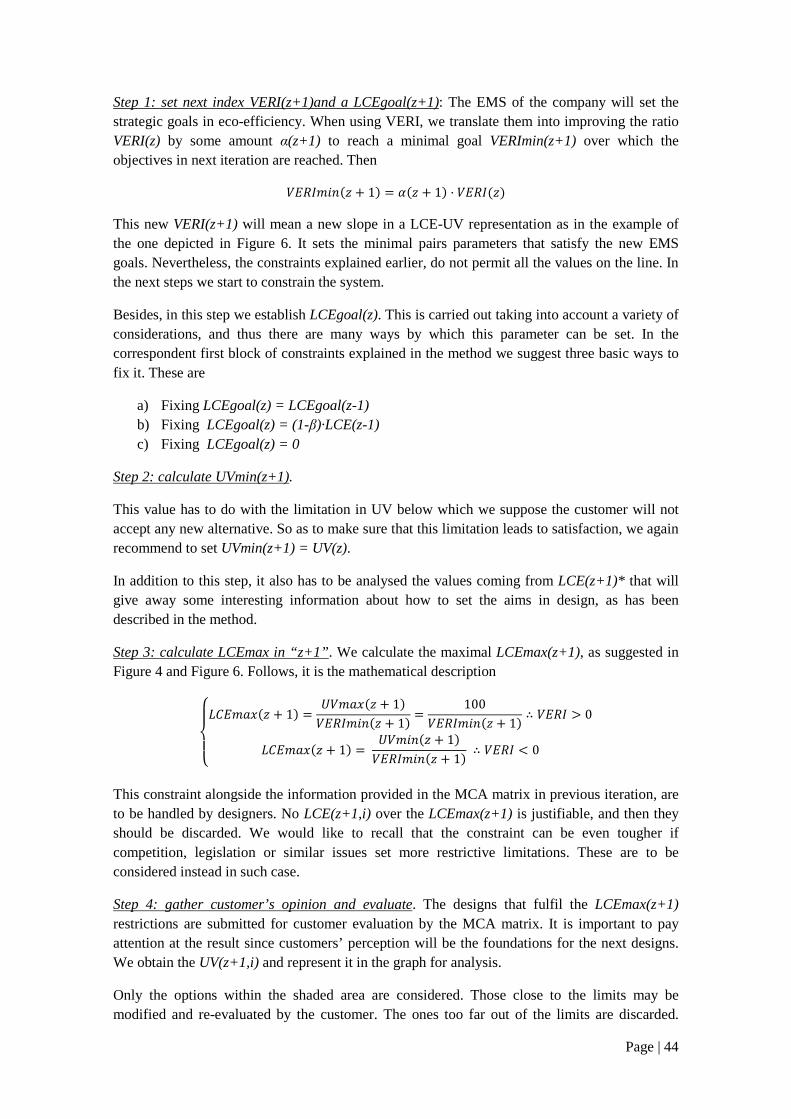
Page | 44
Step 1: set next index VERI(z+1)and a LCEgoal(z+1): The EMS of the company will set the strategic goals in eco-efficiency. When using VERI, we translate them into improving the ratio VERI(z) by some amount α(z+1) to reach a minimal goal VERImin(z+1) over which the objectives in next iteration are reached. Then
��;����-Y C 1/ w-Y C 1/ d ��;�-Y/
This new VERI(z+1) will mean a new slope in a LCE-UV representation as in the example of the one depicted in Figure 6. It sets the minimal pairs parameters that satisfy the new EMS goals. Nevertheless, the constraints explained earlier, do not permit all the values on the line. In the next steps we start to constrain the system.
Besides, in this step we establish LCEgoal(z). This is carried out taking into account a variety of considerations, and thus there are many ways by which this parameter can be set. In the correspondent first block of constraints explained in the method we suggest three basic ways to fix it. These are
a) Fixing LCEgoal(z) = LCEgoal(z-1) b) Fixing LCEgoal(z) = (1-β)·LCE(z-1) c) Fixing LCEgoal(z) = 0
Step 2: calculate UVmin(z+1).
This value has to do with the limitation in UV below which we suppose the customer will not accept any new alternative. So as to make sure that this limitation leads to satisfaction, we again recommend to set UVmin(z+1) = UV(z).
In addition to this step, it also has to be analysed the values coming from LCE(z+1)* that will give away some interesting information about how to set the aims in design, as has been described in the method.
Step 3: calculate LCEmax in “z+1”. We calculate the maximal LCEmax(z+1), as suggested in Figure 4 and Figure 6. Follows, it is the mathematical description
_̀̂_aAB�� V-Y C 1/ F�� V-Y C 1/��;����-Y C 1/ 100��;����-Y C 1/ > ��;� x 0
AB�� V-Y C 1/ F����-Y C 1/��;����-Y C 1/ > ��;� u 0 : This constraint alongside the information provided in the MCA matrix in previous iteration, are to be handled by designers. No LCE(z+1,i) over the LCEmax(z+1) is justifiable, and then they should be discarded. We would like to recall that the constraint can be even tougher if competition, legislation or similar issues set more restrictive limitations. These are to be considered instead in such case.
Step 4: gather customer’s opinion and evaluate. The designs that fulfil the LCEmax(z+1) restrictions are submitted for customer evaluation by the MCA matrix. It is important to pay attention at the result since customers’ perception will be the foundations for the next designs. We obtain the UV(z+1,i) and represent it in the graph for analysis.
Only the options within the shaded area are considered. Those close to the limits may be modified and re-evaluated by the customer. The ones too far out of the limits are discarded.
Page | 45
Among the allowed options, the customer will select an alternative i whose UV(z+1,i) and LCE(z+1,i) will define the new VERI(z+1).
We remind here that VERI(z+1) is equal to or greater than VERImin(z+1). This is an index that fulfils our minimal EMS objectives for iteration z+1 whilst VERI(z+1) is the actual index for the product selected by the customer.
The iterations end up here, with the customer’s selection. For next iteration we loop back to step 1 in VERI method. VERI(z+1) will be the new reference to calculate VERImin(z+2), and so forth. Figure 9 below represents the flowchart of procedures involved in VERI assessment, starting from some general VERI(z). Step 0 should be added if it is the first iteration.
Figure 9. Flowchart of VERI method, including sub-methods (i.e. MCA and LCE methods) for assessment of future designs, in line with EMS goals.

Page | 46
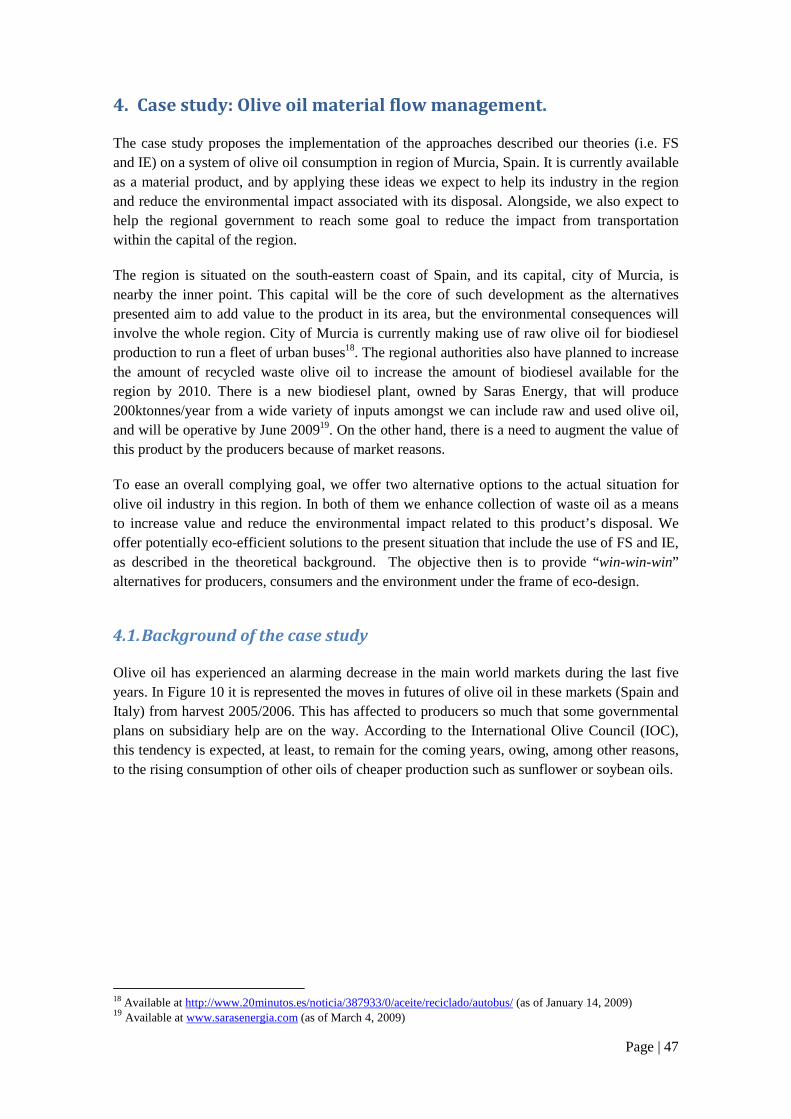
Page | 47
4. Case study: Olive oil material flow management.
The case study proposes the implementation of the approaches described our theories (i.e. FS and IE) on a system of olive oil consumption in region of Murcia, Spain. It is currently available as a material product, and by applying these ideas we expect to help its industry in the region and reduce the environmental impact associated with its disposal. Alongside, we also expect to help the regional government to reach some goal to reduce the impact from transportation within the capital of the region.
The region is situated on the south-eastern coast of Spain, and its capital, city of Murcia, is nearby the inner point. This capital will be the core of such development as the alternatives presented aim to add value to the product in its area, but the environmental consequences will involve the whole region. City of Murcia is currently making use of raw olive oil for biodiesel production to run a fleet of urban buses18. The regional authorities also have planned to increase the amount of recycled waste olive oil to increase the amount of biodiesel available for the region by 2010. There is a new biodiesel plant, owned by Saras Energy, that will produce 200ktonnes/year from a wide variety of inputs amongst we can include raw and used olive oil, and will be operative by June 200919. On the other hand, there is a need to augment the value of this product by the producers because of market reasons.
To ease an overall complying goal, we offer two alternative options to the actual situation for olive oil industry in this region. In both of them we enhance collection of waste oil as a means to increase value and reduce the environmental impact related to this product’s disposal. We offer potentially eco-efficient solutions to the present situation that include the use of FS and IE, as described in the theoretical background. The objective then is to provide “win-win-win” alternatives for producers, consumers and the environment under the frame of eco-design.
4.1. Background of the case study
Olive oil has experienced an alarming decrease in the main world markets during the last five years. In Figure 10 it is represented the moves in futures of olive oil in these markets (Spain and Italy) from harvest 2005/2006. This has affected to producers so much that some governmental plans on subsidiary help are on the way. According to the International Olive Council (IOC), this tendency is expected, at least, to remain for the coming years, owing, among other reasons, to the rising consumption of other oils of cheaper production such as sunflower or soybean oils.
18 Available at http://www.20minutos.es/noticia/387933/0/aceite/reciclado/autobus/ (as of January 14, 2009) 19 Available at www.sarasenergia.com (as of March 4, 2009)
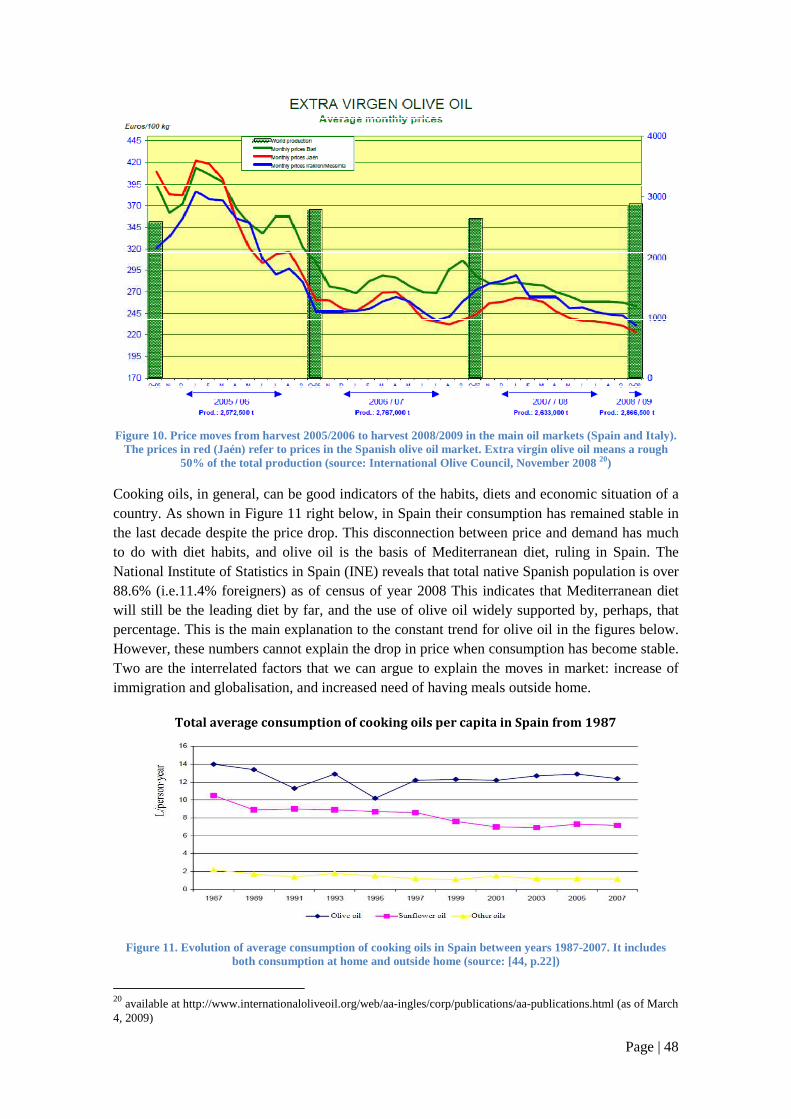
Page | 48
Figure 10. Price moves from harvest 2005/2006 to harvest 2008/2009 in the main oil markets (Spain and Italy).
The prices in red (Jaén) refer to prices in the Spanish olive oil market. Extra virgin olive oil means a rough 50% of the total production (source: International Olive Council, November 2008 20)
Cooking oils, in general, can be good indicators of the habits, diets and economic situation of a country. As shown in Figure 11 right below, in Spain their consumption has remained stable in the last decade despite the price drop. This disconnection between price and demand has much to do with diet habits, and olive oil is the basis of Mediterranean diet, ruling in Spain. The National Institute of Statistics in Spain (INE) reveals that total native Spanish population is over 88.6% (i.e.11.4% foreigners) as of census of year 2008 This indicates that Mediterranean diet will still be the leading diet by far, and the use of olive oil widely supported by, perhaps, that percentage. This is the main explanation to the constant trend for olive oil in the figures below. However, these numbers cannot explain the drop in price when consumption has become stable. Two are the interrelated factors that we can argue to explain the moves in market: increase of immigration and globalisation, and increased need of having meals outside home.
Figure 11. Evolution of average consumption of cooking oils in Spain between years 1987-2007. It includes both consumption at home and outside home (source: [44, p.22])
20 available at http://www.internationaloliveoil.org/web/aa-ingles/corp/publications/aa-publications.html (as of March 4, 2009)
Total average consumption of cooking oils per capita in Spain from 1987
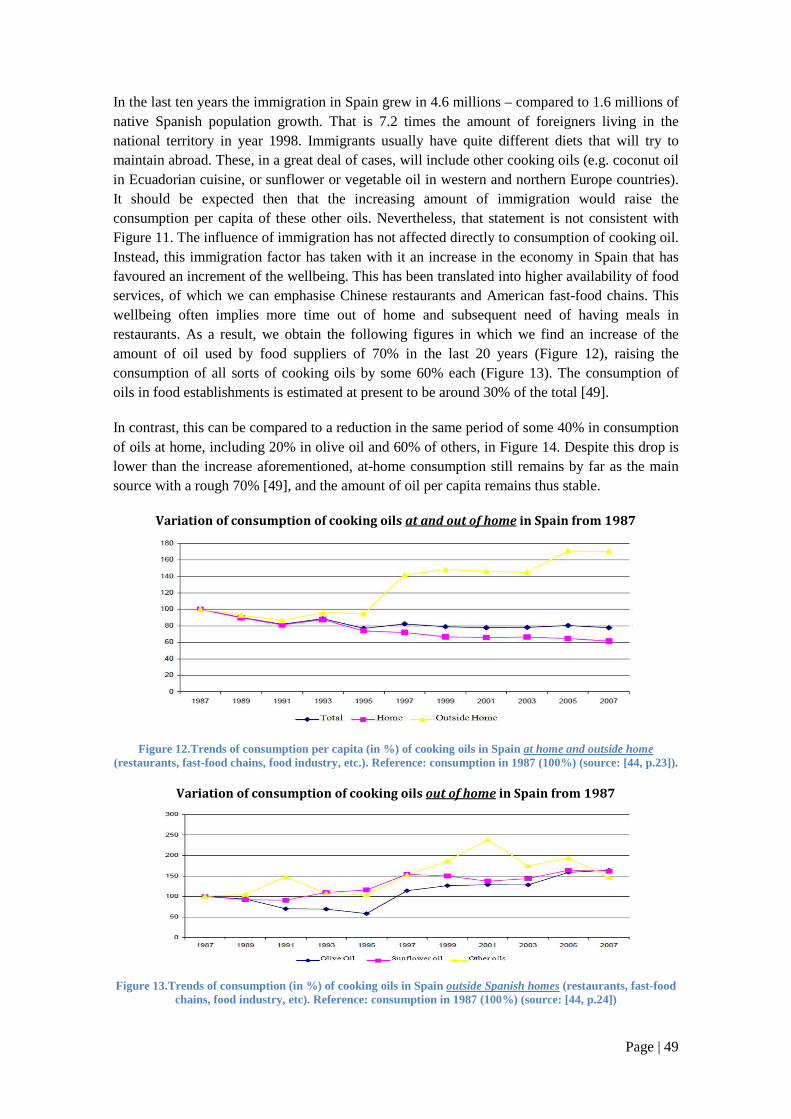
Page | 49
In the last ten years the immigration in Spain grew in 4.6 millions – compared to 1.6 millions of native Spanish population growth. That is 7.2 times the amount of foreigners living in the national territory in year 1998. Immigrants usually have quite different diets that will try to maintain abroad. These, in a great deal of cases, will include other cooking oils (e.g. coconut oil in Ecuadorian cuisine, or sunflower or vegetable oil in western and northern Europe countries). It should be expected then that the increasing amount of immigration would raise the consumption per capita of these other oils. Nevertheless, that statement is not consistent with Figure 11. The influence of immigration has not affected directly to consumption of cooking oil. Instead, this immigration factor has taken with it an increase in the economy in Spain that has favoured an increment of the wellbeing. This has been translated into higher availability of food services, of which we can emphasise Chinese restaurants and American fast-food chains. This wellbeing often implies more time out of home and subsequent need of having meals in restaurants. As a result, we obtain the following figures in which we find an increase of the amount of oil used by food suppliers of 70% in the last 20 years (Figure 12), raising the consumption of all sorts of cooking oils by some 60% each (Figure 13). The consumption of oils in food establishments is estimated at present to be around 30% of the total [49].
In contrast, this can be compared to a reduction in the same period of some 40% in consumption of oils at home, including 20% in olive oil and 60% of others, in Figure 14. Despite this drop is lower than the increase aforementioned, at-home consumption still remains by far as the main source with a rough 70% [49], and the amount of oil per capita remains thus stable.
Figure 12.Trends of consumption per capita (in %) of cooking oils in Spain at home and outside home (restaurants, fast-food chains, food industry, etc.). Reference: consumption in 1987 (100%) (source: [44, p.23]).
Figure 13.Trends of consumption (in %) of cooking oils in Spain outside Spanish homes (restaurants, fast-food chains, food industry, etc). Reference: consumption in 1987 (100%) (source: [44, p.24])
Variation of consumption of cooking oils out of home in Spain from 1987
Variation of consumption of cooking oils at and out of home in Spain from 1987
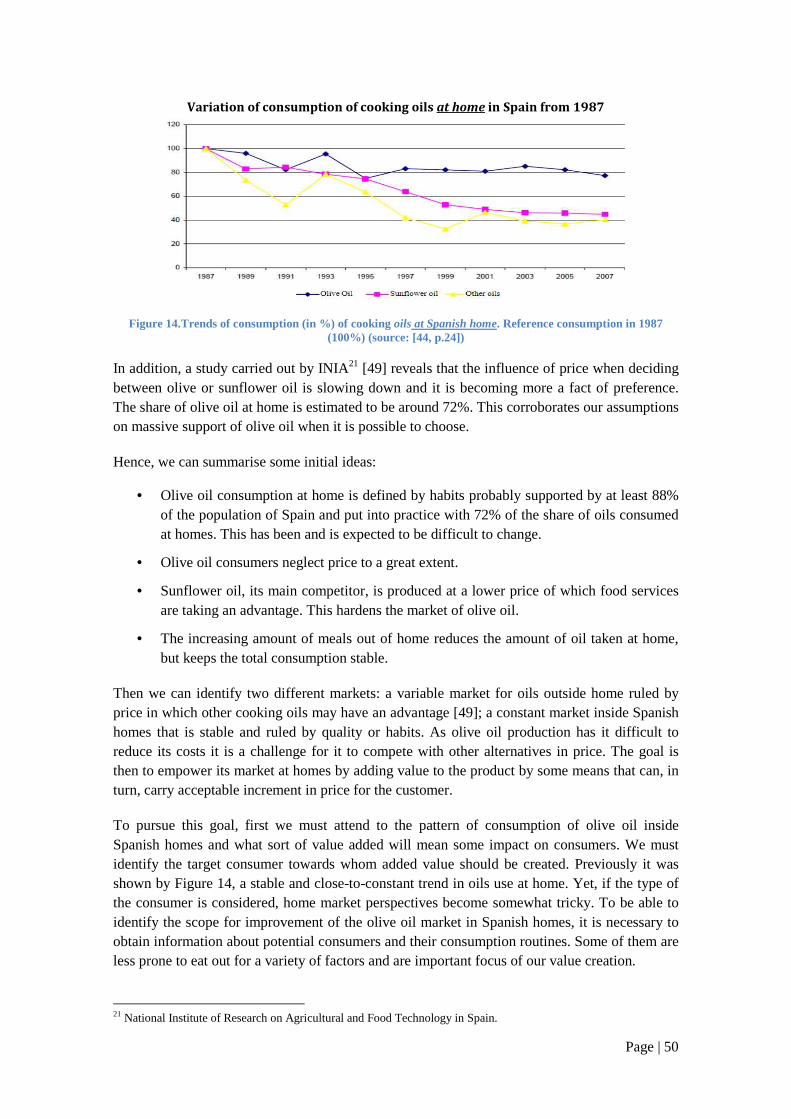
Page | 50
Figure 14.Trends of consumption (in %) of cooking oils at Spanish home. Reference consumption in 1987 (100%) (source: [44, p.24])
In addition, a study carried out by INIA21 [49] reveals that the influence of price when deciding between olive or sunflower oil is slowing down and it is becoming more a fact of preference. The share of olive oil at home is estimated to be around 72%. This corroborates our assumptions on massive support of olive oil when it is possible to choose.
Hence, we can summarise some initial ideas:
• Olive oil consumption at home is defined by habits probably supported by at least 88% of the population of Spain and put into practice with 72% of the share of oils consumed at homes. This has been and is expected to be difficult to change.
• Olive oil consumers neglect price to a great extent.
• Sunflower oil, its main competitor, is produced at a lower price of which food services are taking an advantage. This hardens the market of olive oil.
• The increasing amount of meals out of home reduces the amount of oil taken at home, but keeps the total consumption stable.
Then we can identify two different markets: a variable market for oils outside home ruled by price in which other cooking oils may have an advantage [49]; a constant market inside Spanish homes that is stable and ruled by quality or habits. As olive oil production has it difficult to reduce its costs it is a challenge for it to compete with other alternatives in price. The goal is then to empower its market at homes by adding value to the product by some means that can, in turn, carry acceptable increment in price for the customer.
To pursue this goal, first we must attend to the pattern of consumption of olive oil inside Spanish homes and what sort of value added will mean some impact on consumers. We must identify the target consumer towards whom added value should be created. Previously it was shown by Figure 14, a stable and close-to-constant trend in oils use at home. Yet, if the type of the consumer is considered, home market perspectives become somewhat tricky. To be able to identify the scope for improvement of the olive oil market in Spanish homes, it is necessary to obtain information about potential consumers and their consumption routines. Some of them are less prone to eat out for a variety of factors and are important focus of our value creation.
21 National Institute of Research on Agricultural and Food Technology in Spain.
Variation of consumption of cooking oils at home in Spain from 1987
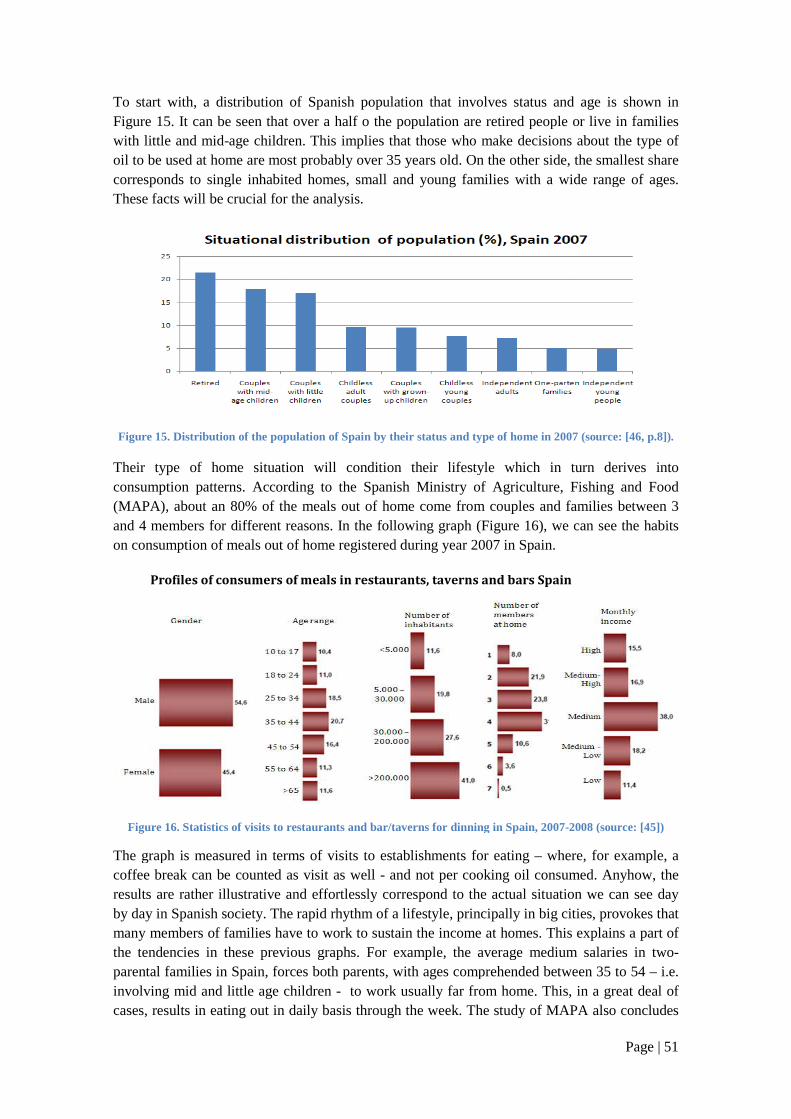
To start with, a distribution Figure 15. It can be seen that over with little and mid-age children. oil to be used at home are most probably over 35 years olcorresponds to single inhabited homes,These facts will be crucial for the analysis.
Figure 15. Distribution of the population
Their type of home situation will condition theconsumption patterns. According to the Spanish Ministry of Agriculture, Fishing a(MAPA), about an 80% of the meals out of home come from couples and families between 3 and 4 members for different reasonson consumption of meals out of home
Figure 16. Statistics of visits to restaurants and bar/taverns for dinning
The graph is measured in terms coffee break can be counted as visit as well results are rather illustrative and effortlesslyby day in Spanish society. The rapid rhythm of amany members of families havethe tendencies in these previous graphsparental families in Spain, forces both involving mid and little age children cases, results in eating out in dail
Profiles of consumers of meals in restaurants,
distribution of Spanish population that involves status and age iIt can be seen that over a half o the population are retired people or live in
age children. This implies that those who make decisions about the type of oil to be used at home are most probably over 35 years old. On the other side, the smallest share
nds to single inhabited homes, small and young families with a wide range of ages. for the analysis.
. Distribution of the population of Spain by their status and type of home in 2007 (source: [
situation will condition their lifestyle which in turn derives into consumption patterns. According to the Spanish Ministry of Agriculture, Fishing a
, about an 80% of the meals out of home come from couples and families between 3 d 4 members for different reasons. In the following graph (Figure 16), we can see
of meals out of home registered during year 2007 in Spain.
cs of visits to restaurants and bar/taverns for dinning in Spain, 2007-2008 (source: [
he graph is measured in terms of visits to establishments for eating – where, for example, a coffee break can be counted as visit as well - and not per cooking oil consumedresults are rather illustrative and effortlessly correspond to the actual situation we can see day
he rapid rhythm of a lifestyle, principally in big citiesof families have to work to sustain the income at homes. This
previous graphs. For example, the average medium salaries in forces both parents, with ages comprehended between 35 to 54
mid and little age children - to work usually far from home. This, in daily basis through the week. The study of MAPA also concludes
ers of meals in restaurants, taverns and bars Spain
Page | 51
of Spanish population that involves status and age is shown in a half o the population are retired people or live in families
This implies that those who make decisions about the type of On the other side, the smallest share
families with a wide range of ages.
in 2007 (source: [46, p.8]).
lifestyle which in turn derives into consumption patterns. According to the Spanish Ministry of Agriculture, Fishing and Food
, about an 80% of the meals out of home come from couples and families between 3 ), we can see the habits
2008 (source: [45])
where, for example, a oil consumed. Anyhow, the
situation we can see day in big cities, provokes that
explains a part of age medium salaries in two-
s comprehended between 35 to 54 – i.e. in a great deal of
The study of MAPA also concludes
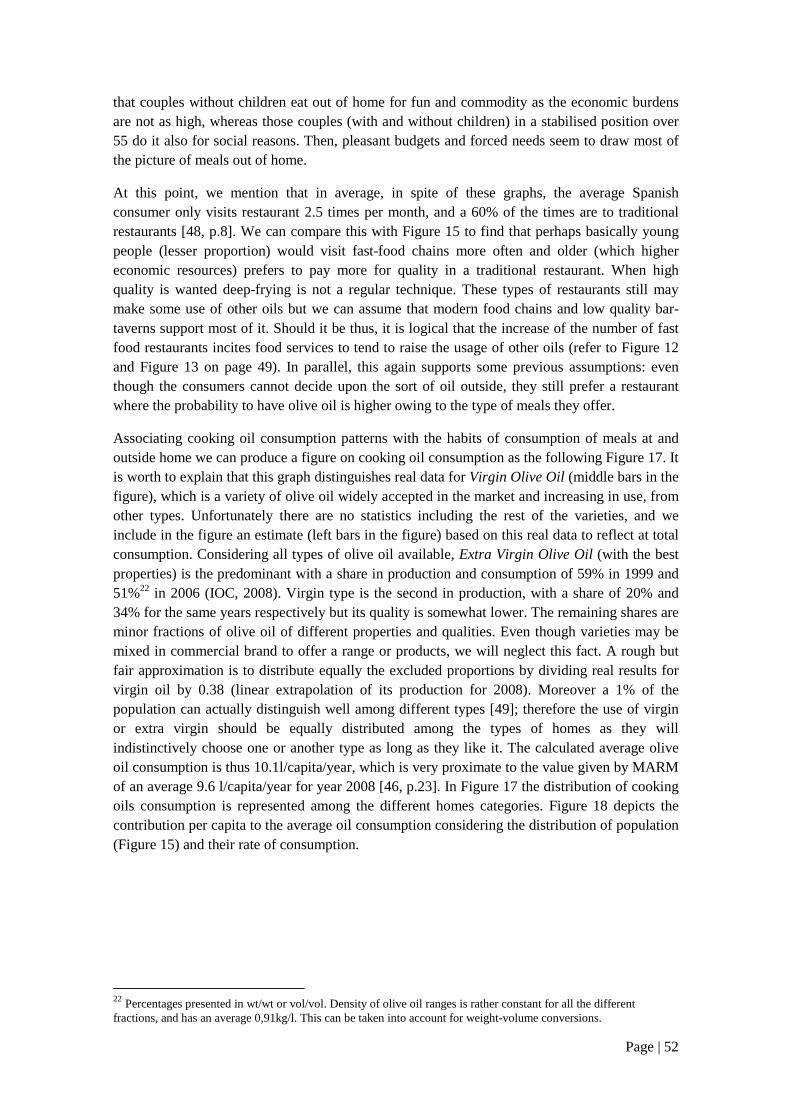
Page | 52
that couples without children eat out of home for fun and commodity as the economic burdens are not as high, whereas those couples (with and without children) in a stabilised position over 55 do it also for social reasons. Then, pleasant budgets and forced needs seem to draw most of the picture of meals out of home.
At this point, we mention that in average, in spite of these graphs, the average Spanish consumer only visits restaurant 2.5 times per month, and a 60% of the times are to traditional restaurants [48, p.8]. We can compare this with Figure 15 to find that perhaps basically young people (lesser proportion) would visit fast-food chains more often and older (which higher economic resources) prefers to pay more for quality in a traditional restaurant. When high quality is wanted deep-frying is not a regular technique. These types of restaurants still may make some use of other oils but we can assume that modern food chains and low quality bar-taverns support most of it. Should it be thus, it is logical that the increase of the number of fast food restaurants incites food services to tend to raise the usage of other oils (refer to Figure 12 and Figure 13 on page 49). In parallel, this again supports some previous assumptions: even though the consumers cannot decide upon the sort of oil outside, they still prefer a restaurant where the probability to have olive oil is higher owing to the type of meals they offer.
Associating cooking oil consumption patterns with the habits of consumption of meals at and outside home we can produce a figure on cooking oil consumption as the following Figure 17. It is worth to explain that this graph distinguishes real data for Virgin Olive Oil (middle bars in the figure), which is a variety of olive oil widely accepted in the market and increasing in use, from other types. Unfortunately there are no statistics including the rest of the varieties, and we include in the figure an estimate (left bars in the figure) based on this real data to reflect at total consumption. Considering all types of olive oil available, Extra Virgin Olive Oil (with the best properties) is the predominant with a share in production and consumption of 59% in 1999 and 51%22 in 2006 (IOC, 2008). Virgin type is the second in production, with a share of 20% and 34% for the same years respectively but its quality is somewhat lower. The remaining shares are minor fractions of olive oil of different properties and qualities. Even though varieties may be mixed in commercial brand to offer a range or products, we will neglect this fact. A rough but fair approximation is to distribute equally the excluded proportions by dividing real results for virgin oil by 0.38 (linear extrapolation of its production for 2008). Moreover a 1% of the population can actually distinguish well among different types [49]; therefore the use of virgin or extra virgin should be equally distributed among the types of homes as they will indistinctively choose one or another type as long as they like it. The calculated average olive oil consumption is thus 10.1l/capita/year, which is very proximate to the value given by MARM of an average 9.6 l/capita/year for year 2008 [46, p.23]. In Figure 17 the distribution of cooking oils consumption is represented among the different homes categories. Figure 18 depicts the contribution per capita to the average oil consumption considering the distribution of population (Figure 15) and their rate of consumption.
22 Percentages presented in wt/wt or vol/vol. Density of olive oil ranges is rather constant for all the different fractions, and has an average 0,91kg/l. This can be taken into account for weight-volume conversions.
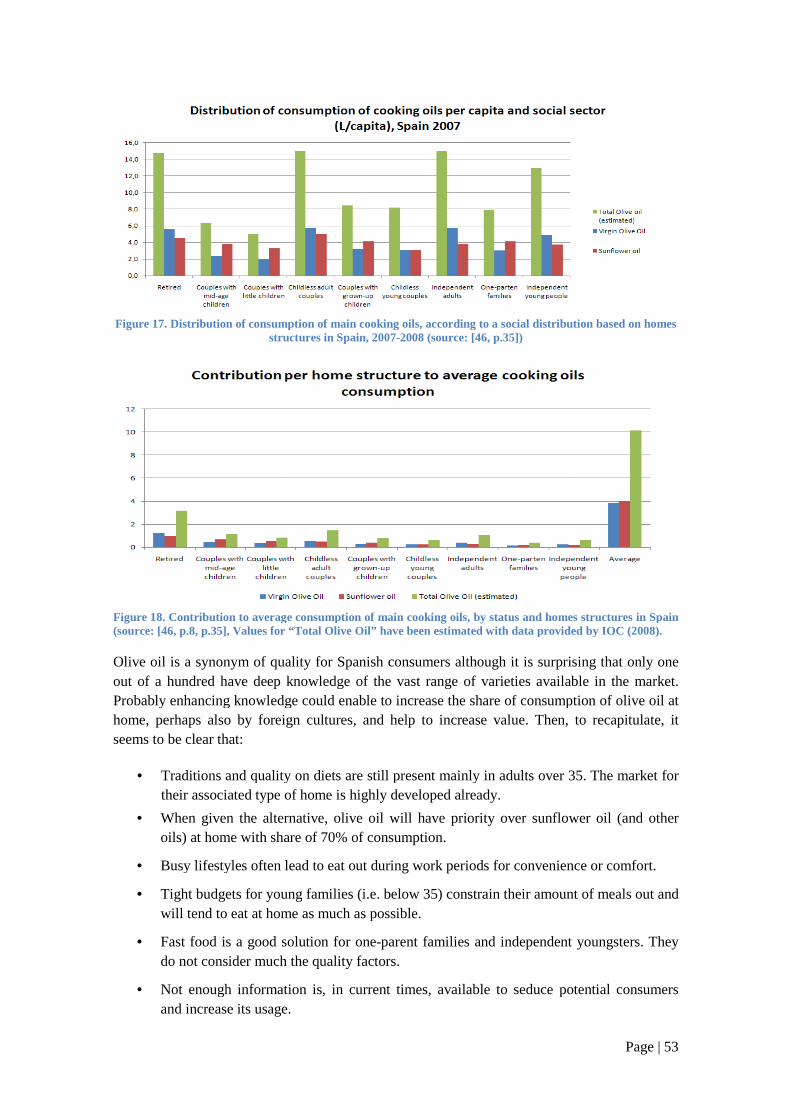
Figure 17. Distribution of consumption of main cooking oils, according to a social distribution based on homes structures in Spain, 2007
Figure 18. Contribution to average consumption(source: [46, p.8, p.35], Values for “Total Olive Oil” have been estimated with data
Olive oil is a synonym of quality for Spanish consumers althoughout of a hundred have deep knowledge of the vast range of Probably enhancing knowledge could enable to increase the share of consumhome, perhaps also by foreign cultures, and help to increase value.seems to be clear that:
• Traditions and quality on diets are still present mainly in adults over 35their associated type of
• When given the alternative,oils) at home with share of
• Busy lifestyles often lead to e
• Tight budgets for youngwill tend to eat at home as much as possi
• Fast food is a good solution for onedo not consider much the quality fac
• Not enough information isand increase its usage
. Distribution of consumption of main cooking oils, according to a social distribution based on homes structures in Spain, 2007-2008 (source: [46, p.35])
. Contribution to average consumption of main cooking oils, by status and homes structures in Spain alues for “Total Olive Oil” have been estimated with data provided by IOC (2008).
oil is a synonym of quality for Spanish consumers although it is surprisinout of a hundred have deep knowledge of the vast range of varieties available in the marketrobably enhancing knowledge could enable to increase the share of consumption of olive oil at
rhaps also by foreign cultures, and help to increase value. Then, t
Traditions and quality on diets are still present mainly in adults over 35of home is highly developed already.
When given the alternative, olive oil will have priority over sunflower oil (and other share of 70% of consumption.
Busy lifestyles often lead to eat out during work periods for convenience or
s for young families (i.e. below 35) constrain their amount of meals outwill tend to eat at home as much as possible.
Fast food is a good solution for one-parent families and independent youngsters. They nsider much the quality factors.
Not enough information is, in current times, available to seduce potentialand increase its usage.
Page | 53
. Distribution of consumption of main cooking oils, according to a social distribution based on homes
homes structures in Spain
provided by IOC (2008).
surprising that only one available in the market.
ption of olive oil at Then, to recapitulate, it
Traditions and quality on diets are still present mainly in adults over 35. The market for
priority over sunflower oil (and other
for convenience or comfort.
eir amount of meals out and
es and independent youngsters. They
to seduce potential consumers
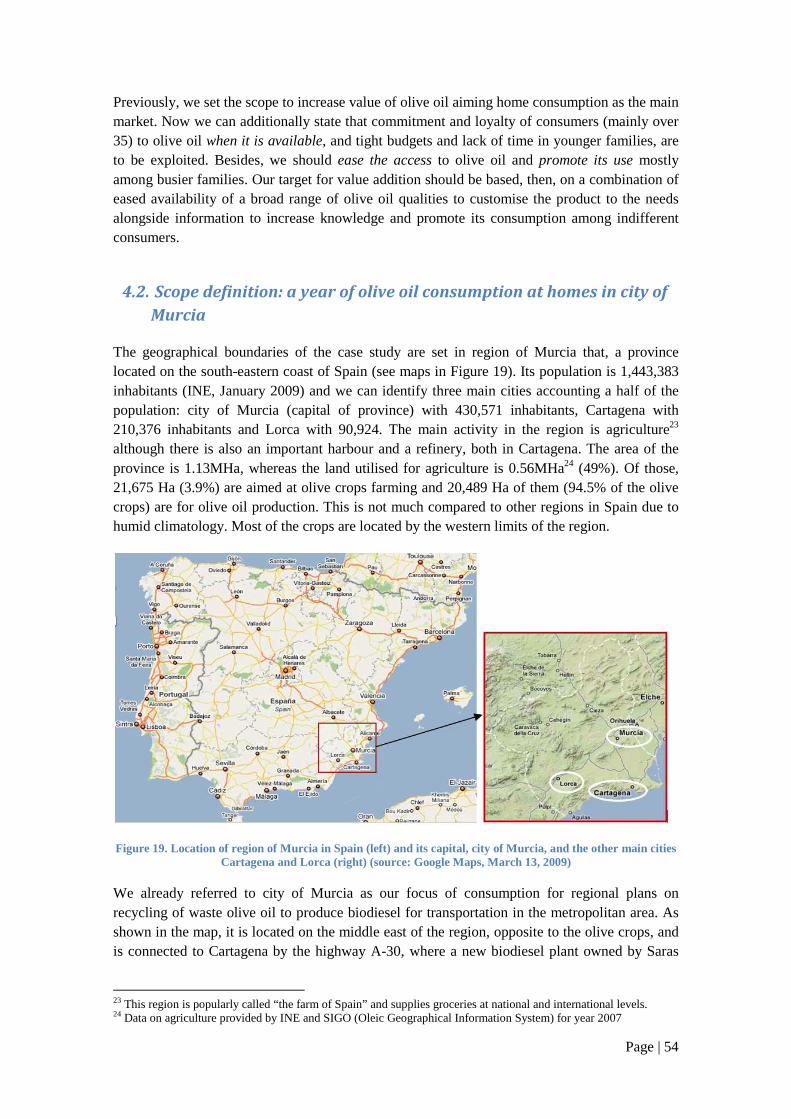
Page | 54
Previously, we set the scope to increase value of olive oil aiming home consumption as the main market. Now we can additionally state that commitment and loyalty of consumers (mainly over 35) to olive oil when it is available, and tight budgets and lack of time in younger families, are to be exploited. Besides, we should ease the access to olive oil and promote its use mostly among busier families. Our target for value addition should be based, then, on a combination of eased availability of a broad range of olive oil qualities to customise the product to the needs alongside information to increase knowledge and promote its consumption among indifferent consumers.
4.2. Scope definition: a year of olive oil consumption at homes in city of
Murcia
The geographical boundaries of the case study are set in region of Murcia that, a province located on the south-eastern coast of Spain (see maps in Figure 19). Its population is 1,443,383 inhabitants (INE, January 2009) and we can identify three main cities accounting a half of the population: city of Murcia (capital of province) with 430,571 inhabitants, Cartagena with 210,376 inhabitants and Lorca with 90,924. The main activity in the region is agriculture23 although there is also an important harbour and a refinery, both in Cartagena. The area of the province is 1.13MHa, whereas the land utilised for agriculture is 0.56MHa24 (49%). Of those, 21,675 Ha (3.9%) are aimed at olive crops farming and 20,489 Ha of them (94.5% of the olive crops) are for olive oil production. This is not much compared to other regions in Spain due to humid climatology. Most of the crops are located by the western limits of the region.
Figure 19. Location of region of Murcia in Spain (left) and its capital, city of Murcia, and the other main cities Cartagena and Lorca (right) (source: Google Maps, March 13, 2009)
We already referred to city of Murcia as our focus of consumption for regional plans on recycling of waste olive oil to produce biodiesel for transportation in the metropolitan area. As shown in the map, it is located on the middle east of the region, opposite to the olive crops, and is connected to Cartagena by the highway A-30, where a new biodiesel plant owned by Saras
23 This region is popularly called “the farm of Spain” and supplies groceries at national and international levels. 24 Data on agriculture provided by INE and SIGO (Oleic Geographical Information System) for year 2007

Page | 55
Energy is located. The connection from the capital to the crops is around 70km of secondary and tertiary roads through the agricultural fields.
The consumption pattern in city of Murcia, represented in Figure 20, is no different to the national average: the numbers found are about the same (however we also show the large scale picture to ease the description). The main circumstance that defers from the national situation is that region of Murcia is mainly a rural region, in which their lifestyle is rather simpler as compared to bigger ones such as Madrid, Barcelona or Seville. This implies that having a meal at home will happen more regularly than in busy cities. However, in accordance with MARM ([45], [46]) Murcia is an average region in terms of market. Living expenses are as well considerably lower but consumption costs (i.e. kg/person) are rather close to the average ones for Spain.
Figure 20. (left) Annual consumption per inhabitant of main food categories in regions of Spain (kg/person·year); (right) annual total food consumption (Kg/person·year) and food expenditures
(€/person·year) per inhabitant in regions of Spain. Data: year 2007 (source: [46])
Regarding olive oil consumption in the region, we can see in the figure above a value of 7.9l/person for year 2007. Data estimated by INIA [49] for 2010 sets consumption of olive oil at home about 78% of the its total, that we can use for calculations in current year 2009. With this, we can assume that the average consumption of olive oil at home in region of Murcia is of some 6.2 l/person/year. Considering 430,571 inhabitants in the metropolitan area (INE, January 2008), the amount of oil for home consumption in city of Murcia is 2.7million l/year. The annual consumption at homes in city of Murcia is our functional unit for FS and LCE calculations.
The total consumption in region of Murcia is 8.9 million litres/year; therefore we are considering a 30% of the total annual consumption (further information about olive oil production and consumption is available in Appendix II). The total production for year 2006/2007 in the region was 5.09 million litres (i.e. 4,631 million tonnes by IOC and MARM25) which could satisfy the demand of 2.7 million litres/year required. We suppose that the entire production in the region will be to satisfy their total demand. We also assume that Murcian production will cover the needs of their capital, and only 2.4million litres/year produced in the region would be available for the rest of its municipalities and still some 3.8 million litres/year
25 Available at http://intereweb.mapa.es/pwAgenciaAO/InfMercadosAceite.aao?dato_de=PRODUCCION&opcion_seleccionada=4120&control_acceso=S&idioma=ESP (last access on March11, 2009)
Page | 56
would be required from external supply. The lands dedicated to olive farming are mostly located in the western side of the land with olives farms rather close amongst them. This barely means a 2% of the total land (source: SIG, 200926), and it could be easily managed by a single company.
In line with all this, we will consider an option in which a company (may be as well the regional government) owns the entire production in the region, and is responsible for the success in its regional market with emphasis in city of Murcia. For this, not only will the company carry out the entire production process but also will undertake, at least, delivery for commercialisation, marketing, etc. Although this is not the real situation, it is still a feasible possibility that ought to be considered in a future. This basic option will be further expanded to include FS and IE. The characteristics of each alternative will be described in next sections.
4.3. Method, limitations and assumptions
There will be three options presented and compared with VERI analysis:
• Option A. Current situation: olive oil is sold as a material product in city of Murcia and the disposal of waste oil is a mixture of collection at “green sites” and disposal through the kitchen sink. The collected is taken for biodiesel production.
• Option B. Supply and collection service: the product involves material olive oil and a service of at-home delivery /collection of raw and waste oil respectively. This is taken for biodiesel production.
• Option C. Option B plus further use of waste streams: from biodiesel production it is possible to gather glycerine, suitable feeding for biogas production, and to recycle some solid sludge (from biogas production) for fertilising.
Option A will help define then our initial data for which we calculate VERI(0). We define VERI(1) as an increment of a 15% of VERI(0) - i.e. α = 1.15. Also LCEgoal(1) = 0 for not having other references. These coefficients have been chosen for convenience. To calculate VERI(0) we neglect the environmental criterion in option A for MCA. In the actual option A, this criterion is considered and evaluated by consumers. Options A, B and C will have to comply with the constraints of the system. With this, there will be an appraisal of value, LCE and eco-efficiency as required by VERI and the possible consequences of the alternatives will be described in detail. As a result, the best alternative will arise.
The case study assumes that the producer owns the olive oil company brand, and as such they can have clear access to customer market. By this we mean that the company is utterly capable to make final decisions on (environmental) management strategies to increase value and/or reduce LCE. We do not take into account the companies exploiting the crops in current times.
The information for value in MCA matrix is gathered by integration of criteria, weight and opinion of 9 regular consumers (4 of them from city of Murcia) with regard to the three given alternatives. The data was obtained by direct contact with them in continuous bidirectional information, to make viewpoints for each side clear. The results for each consumer will be given the same relevance and weighted equally to produce unique matrixes for any option, yielding
26 Available at http://www.mapa.es/es/sig/pags/sig/intro2.htm (last access on March 2, 2009)
Page | 57
some globalised results. We also carried out a customer differentiation analysis (see Appendix III and Appendix IV) but no relevant differences in the global results were found, and the average values are thus considered. The product evaluated is olive oil in general (i.e. involving any variety) and the opinions reflected do not refer to any specific brand. Thus the results are to show the perception of the customer of the market itself and any type of olive oil.
With regard to LCE, we give notice here that, owing to time constraints in the development of the thesis, no reliable values of EI-99 were found and, alternatively, we decided to use GWP100 instead. This will be accompanied by a qualitative analysis of the alternatives to try to depict al possible impacts. However, we still believe the most suitable indicator would be EI-99. We claim once again that the goal by using VERI is not to be accurate, but to make comparisons of alternatives clear.
To ease comparison, the lifecycles do not involve olive oil production or cooking stages since they will not be changed in any alternative – for further information in this regard please refer to EI-99 in the literature [36]. This can be likewise applicable to GWP100. Only the use and disposal phases will be described.
The material streams utilised will include real data from 2006, 2007 and 2008, period during which the situation has not experienced relevant changes. The geographical scope involves the entire region of Murcia and the impact will be described, thus, at a regional level. It is important to mention that as the region is devoted to agriculture the environmental impact can cause severe damages; a more thorough analysis before making final decisions about alternatives to develop their olive oil industry must be performed once the chosen alternative presents clear benefits (recall that the time available has not permitted a more detailed analysis in this aspect).
It will be assumed that, since production and consumption patterns have not changed importantly in the last decade, the demand will remain equal for the coming years. The consumption is the average consumption in the region. It was not possible to find accurate data about the amount of olive oil disposed of. Part of the oil used for frying will remain in the food and some share is used as an ingredient (e.g. salads, toasts, traditional cooking...) and it is not possible to assume equal inlets and outlets. Since the uses given to olive oil vary a great deal, it is a challenge to evaluate the amounts disposed of by the users and, on the verge of the impossible, to know the final fate. Consistent with the information obtained from the surveys, we suppose that 2/3 of the oil are disposed of.
The olive oil mill has been ideally located at an average distance from the crops. This point was set for convenience in Caravaca de la Cruz (CdlC), a village in the western side of the region and from which local road C-415 is available. The delivery/collection central is pointed right in the city centre of city of Murcia. We assume this fact since its population, markets and distances are relatively uniform, circularly distributed around it, and thus the average point would be approximately in the geometric origin of the circle.
The biodiesel plant and the biogas plant in option C are located in the same industrial area to develop IS. Since a piping system could be suitable, transportation among them will be neglected. Diesel for transportation will contain 20% biodiesel (currently established by law and available in gas stations) or 100% biodiesel (ultimate goal in the region) depending on the case.
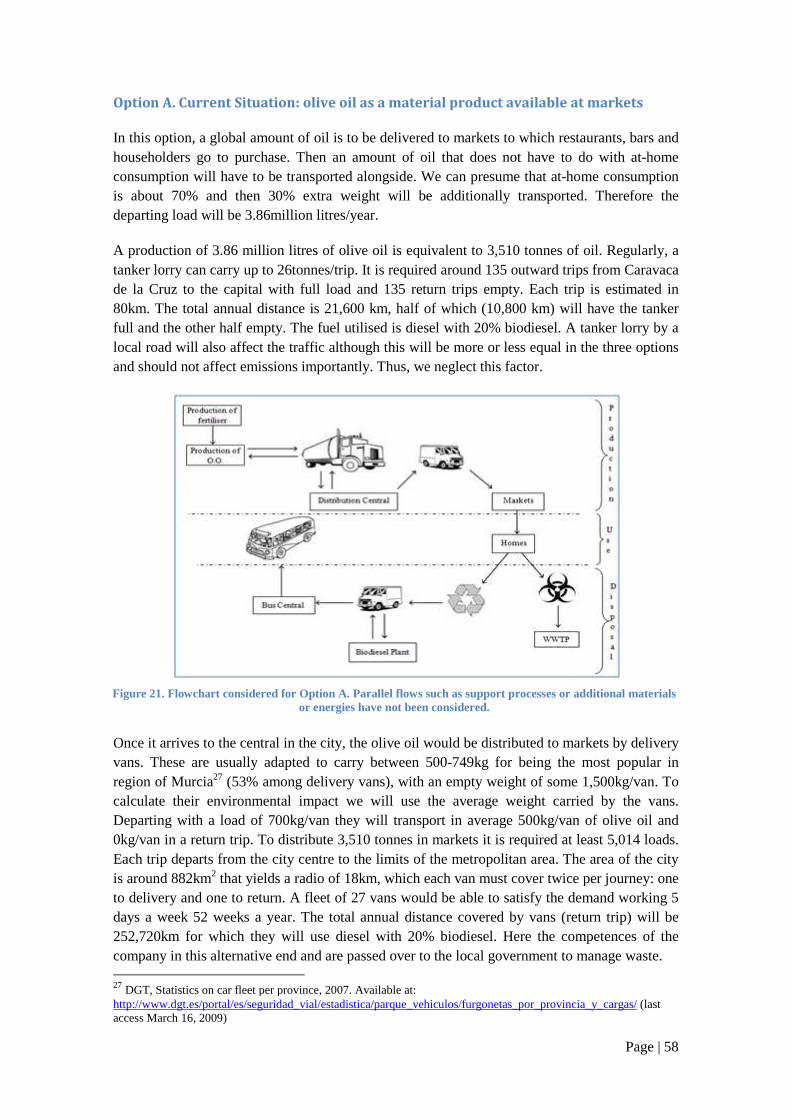
Option A. Current Situation:
In this option, a global amount of oil is to be deliverhouseholders go to purchaseconsumption will have to be tris about 70% and then 30% extra weight will be additionally transported. Thereforedeparting load will be 3.86million litres/year.
A production of 3.86 million litres of olive oil is equivaltanker lorry can carry up to 26tonnesde la Cruz to the capital with80km. The total annual distance full and the other half empty.local road will also affect the and should not affect emissions
Once it arrives to the central in the city, the olive oilvans. These are usually adapted to carry between 500region of Murcia27 (53% among delivery vans)calculate their environmental impact we will use tDeparting with a load of 700kg/van0kg/van in a return trip. To distribute 3Each trip departs from the city centre to the lis around 882km2 that yields ato delivery and one to return. A fleet of 27days a week 52 weeks a year.252,720km for which they will usecompany in this alternative end and are pass 27 DGT, Statistics on car fleet per province, 2007. Available at: http://www.dgt.es/portal/es/seguridad_vial/estadistica/parque_vehiculos/furgonetas_por_provincia_y_cargas/access March 16, 2009)
Figure 21. Flowchart considered for Option A. Parallel flows such as support processes or additional materials
Option A. Current Situation: olive oil as a material product available at
a global amount of oil is to be delivered to markets to which restaurants, bars and householders go to purchase. Then an amount of oil that does not have to do with
l have to be transported alongside. We can presume that at-hom30% extra weight will be additionally transported. Therefore
86million litres/year.
illion litres of olive oil is equivalent to 3,510 tonnes of oil6tonnes/trip. It is required around 135 outward trips
with full load and 135 return trips empty. Each trip is edistance is 21,600 km, half of which (10,800 km) will have the tanker
The fuel utilised is diesel with 20% biodiesel. Aaffect the traffic although this will be more or less equal in th
ions importantly. Thus, we neglect this factor.
in the city, the olive oil would be distributed to markets by delivery dapted to carry between 500-749kg for being the most popular in
(53% among delivery vans), with an empty weight of some 1calculate their environmental impact we will use the average weight carried by the vansDeparting with a load of 700kg/van they will transport in average 500kg/van
o distribute 3,510 tonnes in markets it is required at leastcity centre to the limits of the metropolitan area. The area of the city
that yields a radio of 18km, which each van must cover twice per journey: one . A fleet of 27 vans would be able to satisfy the demand working 5
days a week 52 weeks a year. The total annual distance covered by vans (retfor which they will use diesel with 20% biodiesel. Here the competences of the
end and are passed over to the local government to manage
DGT, Statistics on car fleet per province, 2007. Available at: http://www.dgt.es/portal/es/seguridad_vial/estadistica/parque_vehiculos/furgonetas_por_provincia_y_cargas/
. Flowchart considered for Option A. Parallel flows such as support processes or additional materials or energies have not been considered.
Page | 58
aterial product available at markets
restaurants, bars and . Then an amount of oil that does not have to do with at-home
home consumption 30% extra weight will be additionally transported. Therefore the
of oil. Regularly, a outward trips from Caravaca
empty. Each trip is estimated in km) will have the tanker
A tanker lorry by a in the three options
to markets by delivery the most popular in
weight of some 1,500kg/van. To he average weight carried by the vans.
/van of olive oil and 0 tonnes in markets it is required at least 5,014 loads.
imits of the metropolitan area. The area of the city , which each van must cover twice per journey: one
vans would be able to satisfy the demand working 5 s (return trip) will be
Here the competences of the to manage waste.
http://www.dgt.es/portal/es/seguridad_vial/estadistica/parque_vehiculos/furgonetas_por_provincia_y_cargas/ (last
. Flowchart considered for Option A. Parallel flows such as support processes or additional materials
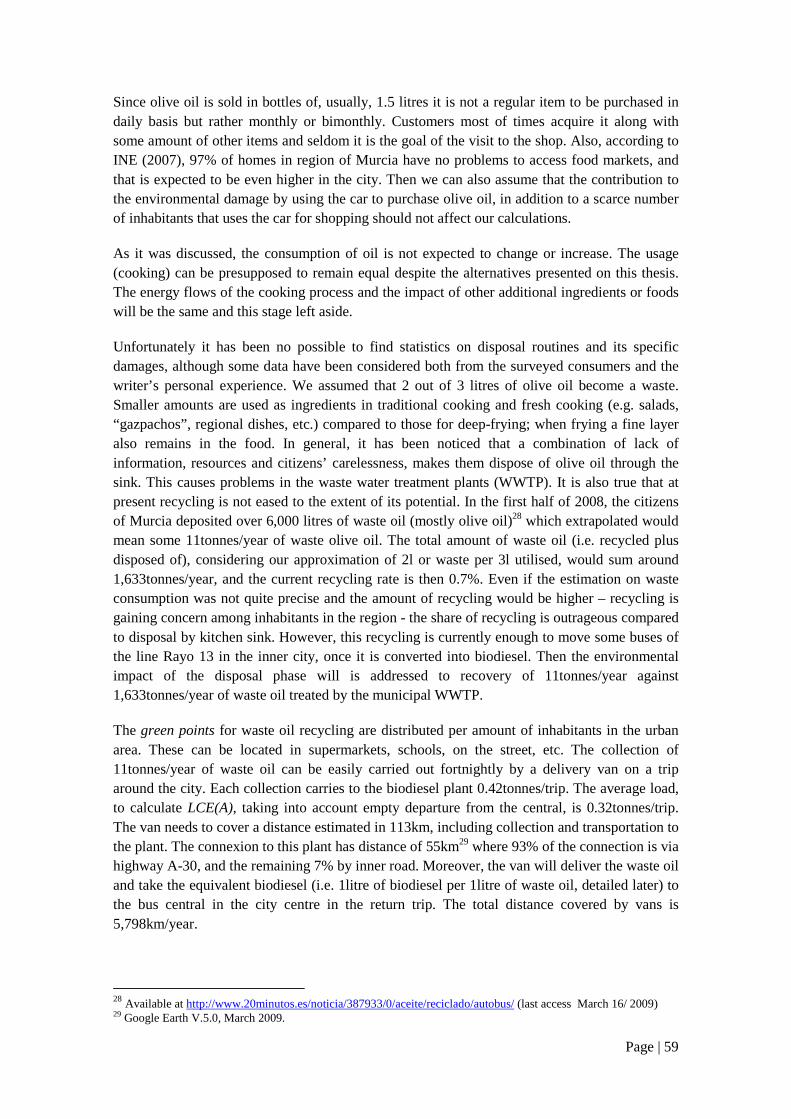
Page | 59
Since olive oil is sold in bottles of, usually, 1.5 litres it is not a regular item to be purchased in daily basis but rather monthly or bimonthly. Customers most of times acquire it along with some amount of other items and seldom it is the goal of the visit to the shop. Also, according to INE (2007), 97% of homes in region of Murcia have no problems to access food markets, and that is expected to be even higher in the city. Then we can also assume that the contribution to the environmental damage by using the car to purchase olive oil, in addition to a scarce number of inhabitants that uses the car for shopping should not affect our calculations.
As it was discussed, the consumption of oil is not expected to change or increase. The usage (cooking) can be presupposed to remain equal despite the alternatives presented on this thesis. The energy flows of the cooking process and the impact of other additional ingredients or foods will be the same and this stage left aside.
Unfortunately it has been no possible to find statistics on disposal routines and its specific damages, although some data have been considered both from the surveyed consumers and the writer’s personal experience. We assumed that 2 out of 3 litres of olive oil become a waste. Smaller amounts are used as ingredients in traditional cooking and fresh cooking (e.g. salads, “gazpachos”, regional dishes, etc.) compared to those for deep-frying; when frying a fine layer also remains in the food. In general, it has been noticed that a combination of lack of information, resources and citizens’ carelessness, makes them dispose of olive oil through the sink. This causes problems in the waste water treatment plants (WWTP). It is also true that at present recycling is not eased to the extent of its potential. In the first half of 2008, the citizens of Murcia deposited over 6,000 litres of waste oil (mostly olive oil)28 which extrapolated would mean some 11tonnes/year of waste olive oil. The total amount of waste oil (i.e. recycled plus disposed of), considering our approximation of 2l or waste per 3l utilised, would sum around 1,633tonnes/year, and the current recycling rate is then 0.7%. Even if the estimation on waste consumption was not quite precise and the amount of recycling would be higher – recycling is gaining concern among inhabitants in the region - the share of recycling is outrageous compared to disposal by kitchen sink. However, this recycling is currently enough to move some buses of the line Rayo 13 in the inner city, once it is converted into biodiesel. Then the environmental impact of the disposal phase will is addressed to recovery of 11tonnes/year against 1,633tonnes/year of waste oil treated by the municipal WWTP.
The green points for waste oil recycling are distributed per amount of inhabitants in the urban area. These can be located in supermarkets, schools, on the street, etc. The collection of 11tonnes/year of waste oil can be easily carried out fortnightly by a delivery van on a trip around the city. Each collection carries to the biodiesel plant 0.42tonnes/trip. The average load, to calculate LCE(A), taking into account empty departure from the central, is 0.32tonnes/trip. The van needs to cover a distance estimated in 113km, including collection and transportation to the plant. The connexion to this plant has distance of 55km29 where 93% of the connection is via highway A-30, and the remaining 7% by inner road. Moreover, the van will deliver the waste oil and take the equivalent biodiesel (i.e. 1litre of biodiesel per 1litre of waste oil, detailed later) to the bus central in the city centre in the return trip. The total distance covered by vans is 5,798km/year.
28 Available at http://www.20minutos.es/noticia/387933/0/aceite/reciclado/autobus/ (last access March 16/ 2009) 29 Google Earth V.5.0, March 2009.
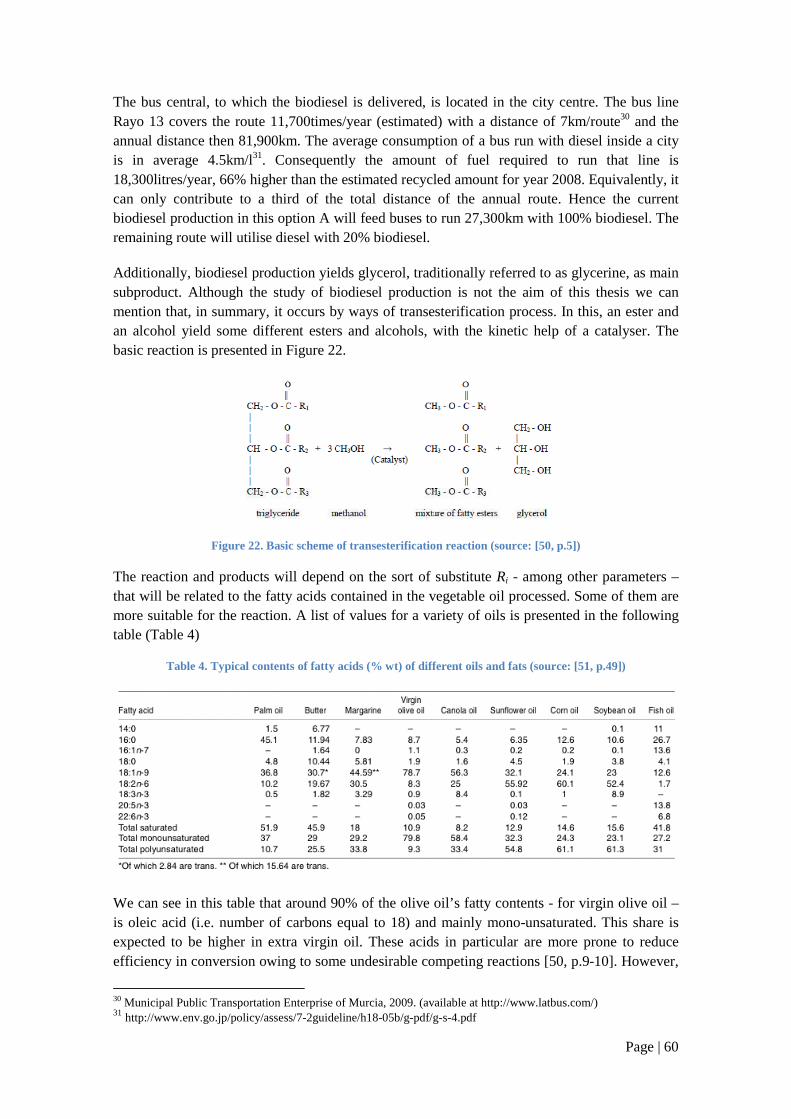
Page | 60
The bus central, to which the biodiesel is delivered, is located in the city centre. The bus line Rayo 13 covers the route 11,700times/year (estimated) with a distance of 7km/route30 and the annual distance then 81,900km. The average consumption of a bus run with diesel inside a city is in average 4.5km/l31. Consequently the amount of fuel required to run that line is 18,300litres/year, 66% higher than the estimated recycled amount for year 2008. Equivalently, it can only contribute to a third of the total distance of the annual route. Hence the current biodiesel production in this option A will feed buses to run 27,300km with 100% biodiesel. The remaining route will utilise diesel with 20% biodiesel.
Additionally, biodiesel production yields glycerol, traditionally referred to as glycerine, as main subproduct. Although the study of biodiesel production is not the aim of this thesis we can mention that, in summary, it occurs by ways of transesterification process. In this, an ester and an alcohol yield some different esters and alcohols, with the kinetic help of a catalyser. The basic reaction is presented in Figure 22.
Figure 22. Basic scheme of transesterification reaction (source: [50, p.5])
The reaction and products will depend on the sort of substitute Ri - among other parameters – that will be related to the fatty acids contained in the vegetable oil processed. Some of them are more suitable for the reaction. A list of values for a variety of oils is presented in the following table (Table 4)
Table 4. Typical contents of fatty acids (% wt) of different oils and fats (source: [51, p.49])
We can see in this table that around 90% of the olive oil’s fatty contents - for virgin olive oil – is oleic acid (i.e. number of carbons equal to 18) and mainly mono-unsaturated. This share is expected to be higher in extra virgin oil. These acids in particular are more prone to reduce efficiency in conversion owing to some undesirable competing reactions [50, p.9-10]. However,
30 Municipal Public Transportation Enterprise of Murcia, 2009. (available at http://www.latbus.com/) 31 http://www.env.go.jp/policy/assess/7-2guideline/h18-05b/g-pdf/g-s-4.pdf
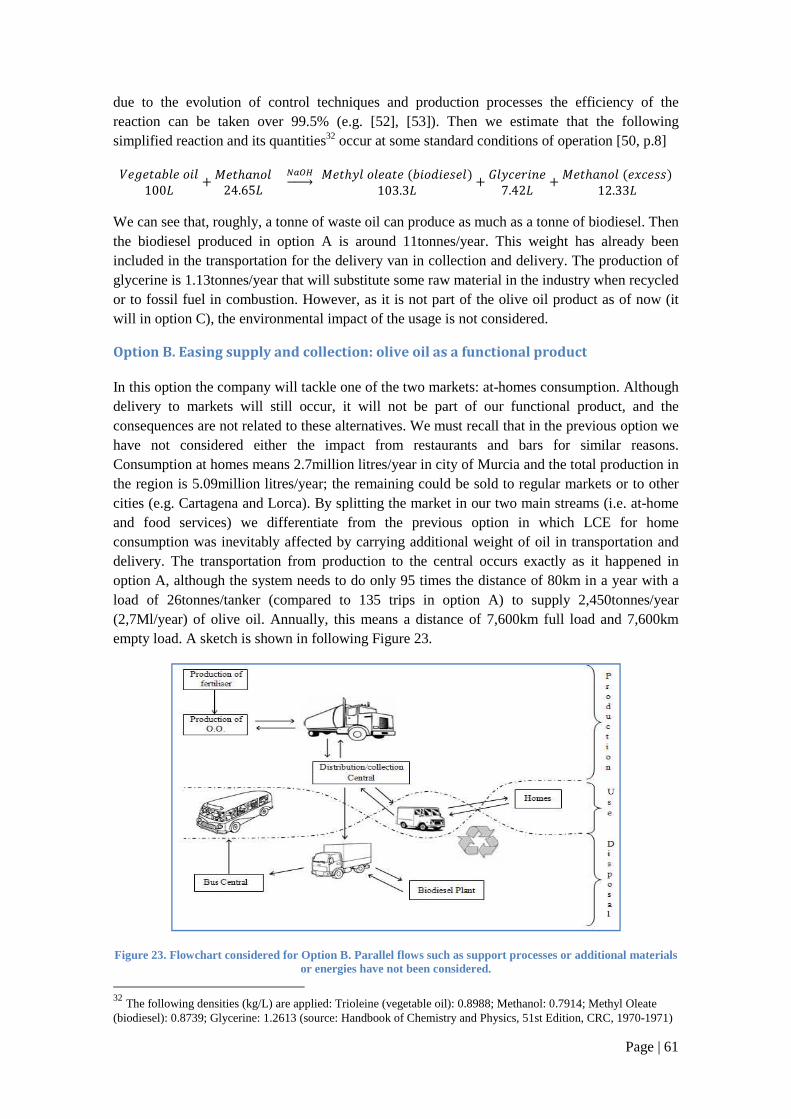
Page | 61
due to the evolution of control techniques and production processes the efficiency of the reaction can be taken over 99.5% (e.g. [52], [53]). Then we estimate that the following simplified reaction and its quantities32 occur at some standard conditions of operation [50, p.8]
��W�� Q�� ���100A C y��z ���24.65A ~������� y��z� ��� �� -Q�����I��/103.3A C ��������7.42A C y��z ��� -�V��II/12.33A
We can see that, roughly, a tonne of waste oil can produce as much as a tonne of biodiesel. Then the biodiesel produced in option A is around 11tonnes/year. This weight has already been included in the transportation for the delivery van in collection and delivery. The production of glycerine is 1.13tonnes/year that will substitute some raw material in the industry when recycled or to fossil fuel in combustion. However, as it is not part of the olive oil product as of now (it will in option C), the environmental impact of the usage is not considered.
Option B. Easing supply and collection: olive oil as a functional product
In this option the company will tackle one of the two markets: at-homes consumption. Although delivery to markets will still occur, it will not be part of our functional product, and the consequences are not related to these alternatives. We must recall that in the previous option we have not considered either the impact from restaurants and bars for similar reasons. Consumption at homes means 2.7million litres/year in city of Murcia and the total production in the region is 5.09million litres/year; the remaining could be sold to regular markets or to other cities (e.g. Cartagena and Lorca). By splitting the market in our two main streams (i.e. at-home and food services) we differentiate from the previous option in which LCE for home consumption was inevitably affected by carrying additional weight of oil in transportation and delivery. The transportation from production to the central occurs exactly as it happened in option A, although the system needs to do only 95 times the distance of 80km in a year with a load of 26tonnes/tanker (compared to 135 trips in option A) to supply 2,450tonnes/year (2,7Ml/year) of olive oil. Annually, this means a distance of 7,600km full load and 7,600km empty load. A sketch is shown in following Figure 23.
Figure 23. Flowchart considered for Option B. Parallel flows such as support processes or additional materials or energies have not been considered.
32 The following densities (kg/L) are applied: Trioleine (vegetable oil): 0.8988; Methanol: 0.7914; Methyl Oleate (biodiesel): 0.8739; Glycerine: 1.2613 (source: Handbook of Chemistry and Physics, 51st Edition, CRC, 1970-1971)
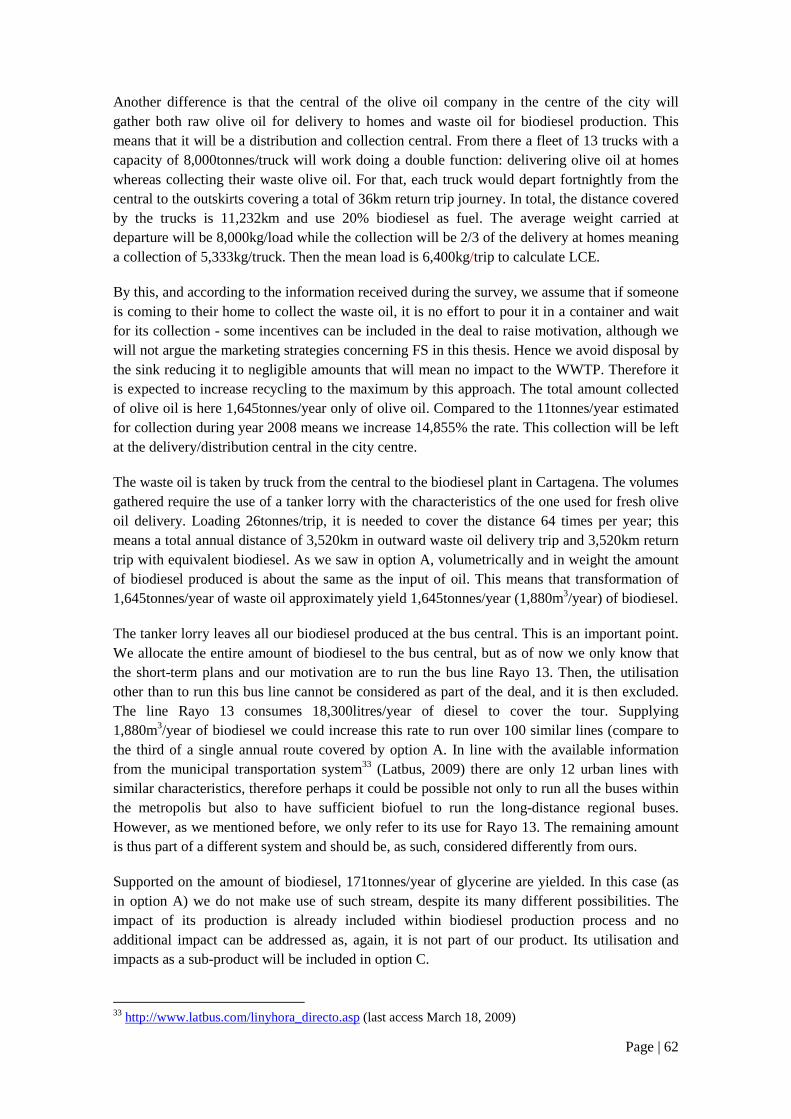
Page | 62
Another difference is that the central of the olive oil company in the centre of the city will gather both raw olive oil for delivery to homes and waste oil for biodiesel production. This means that it will be a distribution and collection central. From there a fleet of 13 trucks with a capacity of 8,000tonnes/truck will work doing a double function: delivering olive oil at homes whereas collecting their waste olive oil. For that, each truck would depart fortnightly from the central to the outskirts covering a total of 36km return trip journey. In total, the distance covered by the trucks is 11,232km and use 20% biodiesel as fuel. The average weight carried at departure will be 8,000kg/load while the collection will be 2/3 of the delivery at homes meaning a collection of 5,333kg/truck. Then the mean load is 6,400kg/trip to calculate LCE.
By this, and according to the information received during the survey, we assume that if someone is coming to their home to collect the waste oil, it is no effort to pour it in a container and wait for its collection - some incentives can be included in the deal to raise motivation, although we will not argue the marketing strategies concerning FS in this thesis. Hence we avoid disposal by the sink reducing it to negligible amounts that will mean no impact to the WWTP. Therefore it is expected to increase recycling to the maximum by this approach. The total amount collected of olive oil is here 1,645tonnes/year only of olive oil. Compared to the 11tonnes/year estimated for collection during year 2008 means we increase 14,855% the rate. This collection will be left at the delivery/distribution central in the city centre.
The waste oil is taken by truck from the central to the biodiesel plant in Cartagena. The volumes gathered require the use of a tanker lorry with the characteristics of the one used for fresh olive oil delivery. Loading 26tonnes/trip, it is needed to cover the distance 64 times per year; this means a total annual distance of 3,520km in outward waste oil delivery trip and 3,520km return trip with equivalent biodiesel. As we saw in option A, volumetrically and in weight the amount of biodiesel produced is about the same as the input of oil. This means that transformation of 1,645tonnes/year of waste oil approximately yield 1,645tonnes/year (1,880m3/year) of biodiesel.
The tanker lorry leaves all our biodiesel produced at the bus central. This is an important point. We allocate the entire amount of biodiesel to the bus central, but as of now we only know that the short-term plans and our motivation are to run the bus line Rayo 13. Then, the utilisation other than to run this bus line cannot be considered as part of the deal, and it is then excluded. The line Rayo 13 consumes 18,300litres/year of diesel to cover the tour. Supplying 1,880m3/year of biodiesel we could increase this rate to run over 100 similar lines (compare to the third of a single annual route covered by option A. In line with the available information from the municipal transportation system33 (Latbus, 2009) there are only 12 urban lines with similar characteristics, therefore perhaps it could be possible not only to run all the buses within the metropolis but also to have sufficient biofuel to run the long-distance regional buses. However, as we mentioned before, we only refer to its use for Rayo 13. The remaining amount is thus part of a different system and should be, as such, considered differently from ours.
Supported on the amount of biodiesel, 171tonnes/year of glycerine are yielded. In this case (as in option A) we do not make use of such stream, despite its many different possibilities. The impact of its production is already included within biodiesel production process and no additional impact can be addressed as, again, it is not part of our product. Its utilisation and impacts as a sub-product will be included in option C.
33 http://www.latbus.com/linyhora_directo.asp (last access March 18, 2009)
Page | 63
Option C. Option B plus recycling of waste oil: closing the loops and returning to soil
Although options A and B make use of recycling, which is one of the maxims of IE, it is through this option where we tackle this practice more in depth. Basically the flowchart is the same as in option B yet we introduce some extra stages at disposal phase aiming at making the global chain “greener”. Here we introduce the topic of IS and eco-effectiveness where the former will help to transform the glycerine output of biodiesel produced into an input for biogas production and the latter to take back an amount of olive oil to soil in the form of fertiliser for olives crops. Hence, the layout and the management of the flows up to biodiesel production remains equal, and the flows up to there are supposed to be the same. The flowchart of this option is shown in Figure 24, and can be compared with the one for option B in Figure 23.
Busch et al. [54] describe several biogas production processes considering different systems and inputs. There, they describe how an input of glycerine from biodiesel production mixed with water in 50- 85% wt can yield up to 540m3CH4/tonne glycerine that will be concentrated in 65-72% vol. Although we are ignorant of whether this method is being actually applied in existing biogas plants, we can still state that it is potentially possible to produce 171tonnes/year of glycerine output stream and produce 128,250m3/year of biogas in concentration of 72%. However, this material stream in isolation cannot stand the idea of building a biogas plant for its treatment. The biogas plant would treat other types of inputs, from farm waste and manure to the sludge produced at the local WWTP, to be mixed with the glycerine stream and the outputs will vary. Anyway, apart from purity and possible outputs, the production of pure methane from our stream can be estimated in 92,340m3/year and there will be some amount of solid residue, whose properties make it suitable for agricultural purposes.
The biogas could be either combusted for energy production, replacing some fossil fuel or else upgraded for use in transportation (over 97% purity). The former seems to be the most suitable solution in current times owing to technical factors. The energy from combustion of some portion could be used also in previous stages (i.e. production, use or disposal) to improve the
Figure 24. Flowchart considered for Option C. Parallel flows such as support processes or additional materials or energies have not been considered.
Page | 64
performance. If used for transportation, a normal cubic meter of upgraded biogas can provide the same energy as a litre of gasoline. Whichever the use is, the collection of olive oil waste by means of functional sales could potentially substitute about 1,880m3/year of fossil diesel plus 132.22m3/year of gasoline (assuming 97% purity in biogas), and environmental consequences are most positive. Again, this is mere speculation since we do not include such uses in the case study. Our product does not involve energy production, and the impact of the use of biogas is left for a different case.
On the other hand, there is a “residual” sludge excellent for agriculture. This is being used by farmers in Linköping that, this way, increase value of their raw material (waste from slaughter houses and manure) by having in return biofertiliser for their crops. Although some complaints have arise from the stench of this sludge at handling, the fact is that it is most suitable for the land when it is proven not to have other compounds such as cadmium or heavy metals in its composition. The amount of fertiliser required in olive crops is 186kg/ha/year [55, p.150]. For our crops of 22,691ha this means an input of fertiliser of 4,220tonnes/year. Real plants from Swedish Biogas AB34 show differences in production of biofertiliser depending on the inlet substrate. Considering that perhaps the best option is to process agriculture-based raw materials, and taking into consideration the plan existing in Örebro, Sweden, processing similar input, the production of biofertiliser is 57%wt/wt. An analogue plant in Cartagena should treat at least 7,400tonnes/year of agricultural waste. In the region, only in vegetable waste it is gathered over 115,000tonnes/year (INE, 2006)35, followed by 110.400tonnes/year from manure and other animal waste. Therefore, the possibility of producing biofertiliser to satisfy our production is in principle utterly feasible.
As the material is returned to soil in ecological conditions and helps the system to regenerate, the concept of eco-effectiveness is implemented. This will be more accurate if the biofuels produced are also used at every stage requiring energy input such as transportation. The main issue in along this eco-efficient chain is the management of the flows. These are to be dealt with by the responsible heads in each stage which must also comply with their goals and satisfy their own stakeholders. For example, we could even improve the performance of the flow by locating both bio-production plants in the same industrial area and connect them by a piping system, avoiding road transportation, to share outlet streams and energy flows i.e. IS. When applying IS, the environmental benefits seem to be clear: reduction of waste by reuse of outputs and consequent reduction of raw material consumption. Nonetheless, sharing streams carries certain risks in supply, requires reliability and trust among stakeholders. The most credible possibility would be that both plants belong to the same company, although the famous case of Kalundbörg in Denmark, and other smaller eco-parks indicate that other possibilities are also real.
Having these factors in mind, and considering the biogas plant adjoining the biodiesel plant in Cartagena, the biofertiliser must be transported to Caravaca de la Cruz. The distance between both is about 120km by tertiary road C-415 and secondary A-30. With trucks carrying 8,000kg/load of biofertiliser we need 525 loads. Transportation towards Caravaca de la Cruz will be at full load, while the return to the biogas will be empty. Possibilities for optimisation (e.g. linear optimisation of resources) could improve all the alternatives, but as of now that is not the main goal.
34For more information visit http://www.swedishbiogas.eu/1/1.0.1.0/17/2/ (last access March 23, 2009) 35Available at http://www.ine.es/jaxi/menu.do?type=pcaxis&path=%2Ft26%2Fe068%2Fp01&file=inebase&L= (last access March 23, 2009)
Page | 65
4.4. Application of methodology proposed to those options. Results
4.4.1. Utility Value
A total of 9 people where surveyed of which 4 come from region of Murcia. The results are consistent in general with the expected, yet we are aware that more time and resources would have been required to have more accurate value scores. The scores have been explained to the participants and they agreed with the meaning, which increases confidence on their reliability. The consumers gave away that the most used criteria for evaluation of olive oil are
• Acidity: although this is technically linked to the olive oil properties, it has also much to do with the taste and applicability of oil. Usually consumers prefer lower acidity when it is used as an ingredient and higher for frying (the flavour of this latter is stronger).
• Applicability: purchasing a type of oil or another is related to the specific use it will be given. Just as in the case of acidity, the needs at a time will favour one type of olive oil over others, regardless brands or other criteria.
• Brand: regular brands commonly available in Spanish markets are well known and offer similar products. The choice will be subjected to a number of factors as the number of brands available at shops or markets and the experience the consumer had with them. In general this criterion is relatively important since consumers put their trust in them as an equivalent to quality.
• Quality: it is a synonym of good taste. Since the consumer is not given much information, this parameter is somehow related to the reliance on the common brands, although it involves the personal satisfaction when using the oil. Yet in general the surveyed had not much experience with a wide variety of products; they refer to this criterion taking into consideration the short range of products they know.
• Proximity to source: this criterion refers to how near or far the consumer’s source of olive oil is and the importance this factor has when purchasing their favourite products.
• Availability at home: need of having olive oil at home. This is among the most important criteria. The consumers surveyed have it rather difficult to suggest meals for a day not making use of olive oil. The lack of it at home makes them move to the closest market to purchase some available type. However, they also mentioned the possibility of home delivery by telephoning some shops although they do not use this service as more olive oil is bought before it is over.
• Information: although they admit that they do not pay much attention to information in the bottles or TV-advertisements for not providing important knowledge of the product. They all agree in that having the opportunity to taste the oil beforehand would be an excellent and highly appreciated point.
• Type of container: this criterion is intimately related to easiness to use. Olive oil is a viscous and greasy product that makes a mess when it leaks. Some formats of packages offer some advantages that are valued by consumers. This factor will also affect somewhat the appearance.
• Appearance: attractive look of the oil enhances (or blinds) its quality. Nonetheless, this parameter showed to be less important than the brand, the taste or the type of container.
Page | 66
With regard to the environmental performance criterion, the survey has demonstrated a high interest on these issues, although it had to be suggested by the surveyor. This is possibly because, up to now, no alternatives offering environmental concerns had been broadly promoted and therefore this factor was not commonly considered.
Before we present the results, we would like to give notice of an interesting fact that arose during the surveys and affected them. As proposed in the theory, we consider that there is a gap between customers’ value and price. That could be easily noticed during the interviews. Price demonstrated not to have much relevance compared to diet habits. In fact it was not mentioned as a criterion by any of the surveyed consumers. However, price has had a remarkable role when weighting the criteria and evaluating the options. The surveyed gave their importance to their criteria, according to the method, giving some values from 0 to 10. But we found that they felt somewhat confused about what weight is and in general they yielded numbers rather high, low or medium, meaning what is utterly important, what is not at all, and what has some relevance, respectively. The formula of the question was of the type “how important is this criterion X for you in a scale from 0 to 10?” Faced with the subjectivity, we made a change in the formula and introduced price in the sentence by asking “If you had to pay more for this criterion X, how important is it in a scale from 0 to 10?” We realised that the consumers “fit” much more the scores of the weights.
Similarly, when they had to evaluate the options, they always mentioned that everything could always be improvable. Therefore, despite for some criteria in option A they could set a score of 10 - which intrinsically means that they are absolutely happy with the perception of the option with regard to a criterion – they still left the door open for receiving improvements. The initial formula of the question was “to what extent (from 0 to 10) this option satisfies this criterion?” Having had analogous problems with weight, we decided to ask the additional question “would you pay more for an option that improves this criterion?” This revealed that when giving the highest score (i.e. 10) they mean that they are very happy with the results but there is still some scope for improvement that they would appreciate by willing to pay for it. Then this result was better scoring 8 or 9 points. On the other hand when they said they would not, we assumed that the parameter has reached the top and no improvement is economically justified for the consumer; we gave value 10 to this type of response. We adjusted those values according to their answers with their approval.
In addition, we found that we could distinguish two groups of consumers: demanding consumers and non demanding consumers (see Appendix III and Appendix IV). The former would give high scores for many criteria showing their concern, and go more thoroughly in their evaluation of options. The non-demanding would not be much interested in many parameters and they seem to be pleased with the results. However, the values gathered and the numbers of surveys carried out do not produce many differences in the calculations of value. Therefore we utilise the average of both types of consumers to calculate UV and will discuss the overall results. Anyhow, we wanted to remark this factor for further study in this olive oil case or other case studies.
Having said this, we present the results in the following Table 5.
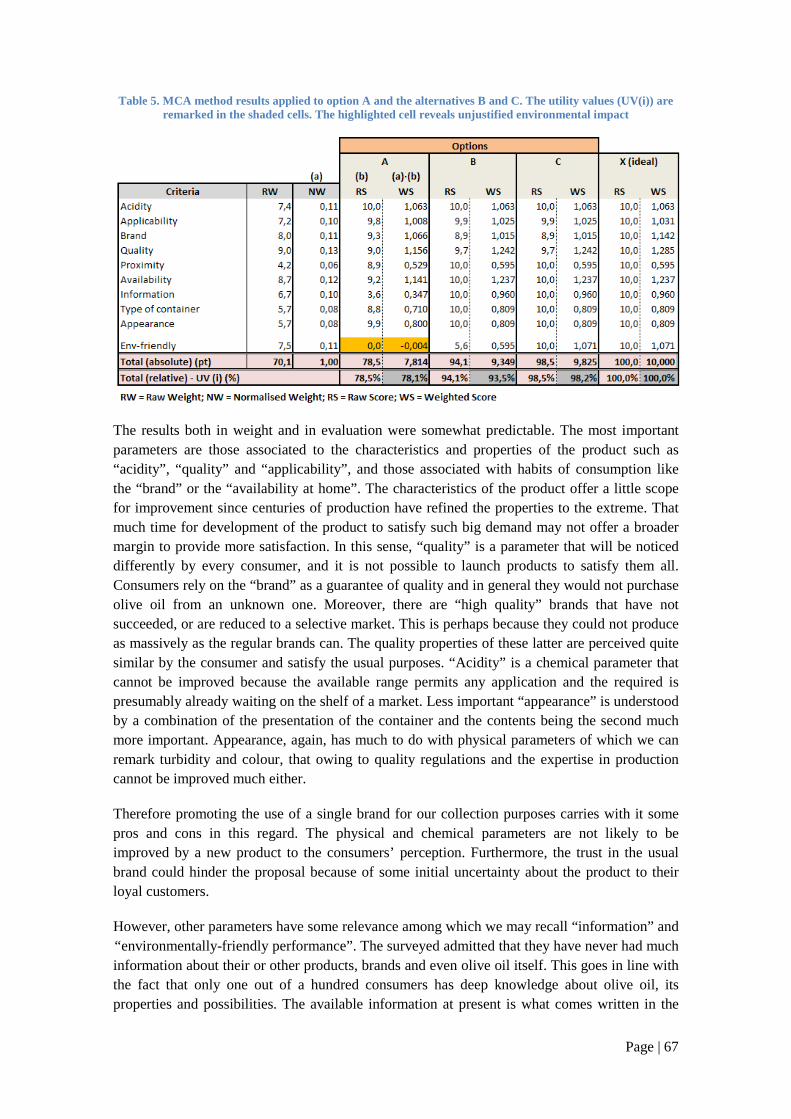
Page | 67
Table 5. MCA method results applied to option A and the alternatives B and C. The utility values (UV(i)) are remarked in the shaded cells. The highlighted cell reveals unjustified environmental impact
The results both in weight and in evaluation were somewhat predictable. The most important parameters are those associated to the characteristics and properties of the product such as “acidity”, “quality” and “applicability”, and those associated with habits of consumption like the “brand” or the “availability at home”. The characteristics of the product offer a little scope for improvement since centuries of production have refined the properties to the extreme. That much time for development of the product to satisfy such big demand may not offer a broader margin to provide more satisfaction. In this sense, “quality” is a parameter that will be noticed differently by every consumer, and it is not possible to launch products to satisfy them all. Consumers rely on the “brand” as a guarantee of quality and in general they would not purchase olive oil from an unknown one. Moreover, there are “high quality” brands that have not succeeded, or are reduced to a selective market. This is perhaps because they could not produce as massively as the regular brands can. The quality properties of these latter are perceived quite similar by the consumer and satisfy the usual purposes. “Acidity” is a chemical parameter that cannot be improved because the available range permits any application and the required is presumably already waiting on the shelf of a market. Less important “appearance” is understood by a combination of the presentation of the container and the contents being the second much more important. Appearance, again, has much to do with physical parameters of which we can remark turbidity and colour, that owing to quality regulations and the expertise in production cannot be improved much either.
Therefore promoting the use of a single brand for our collection purposes carries with it some pros and cons in this regard. The physical and chemical parameters are not likely to be improved by a new product to the consumers’ perception. Furthermore, the trust in the usual brand could hinder the proposal because of some initial uncertainty about the product to their loyal customers.
However, other parameters have some relevance among which we may recall “information” and “ environmentally-friendly performance”. The surveyed admitted that they have never had much information about their or other products, brands and even olive oil itself. This goes in line with the fact that only one out of a hundred consumers has deep knowledge about olive oil, its properties and possibilities. The available information at present is what comes written in the
Page | 68
label of the bottles and advertisements on the media. They all coincided in that, if other products were properly presented by, for example, giving samples to taste in markets, they would change their minds about what they regularly purchase and select some new options. This practice is customary for other types of products. This is reflected in Table 5 in a broad field of improvement with potentially 6 percentile points of the UV.
Other criteria such as “proximity” of the sources and the “type of container” are as possible to be increased, although they are not as relevant as the rest. Purchasing olive oil is not the regular purpose of shopping sessions; instead the customers take and advantage of the trip to the shop, which happens in average about sixteen times per month [47], to get the oil in the case of scarcity at home. This is the fact why “availability” (i.e. to actually have it at home) is so valued presently and why “proximity” does not mean an important concern. On the other hand, the “type of container” is a factor that can affect the choice of a product over others when shopping because of the appearance. It can have great influence in the next shopping session when utilised at home. Although this is one of the least important factors, it is possible to be improved by closer contact between the consumer and the company. This is, then, another beneficial point of sharing knowledge with the consumer by FS.
In relation to the environmental performance, the outcomes from greener systems are evident. Option B shows better results in comparison with option A. Environmental performance would be as much as valued as other important criteria such as acidity or applicability. In the scale of value this means that we could increase over 10 percentile points with the proposed approaches.
When making the chain greener by implementing IE (option C) we do not yield any improvement on the product’s parameters but merely on the environmental performance criterion. The value is only raised by some 3 percentile points while by applying FS to the current system the improvement is of about 17 points. Despite that, with our eco-efficiency index this approach will signify a promising option since the LCE will be greatly reduced.
Parallel to these numerical results, we also obtained the personal opinion from the consumers for contrast. They all show much concern about the environment and are open to put into practice the new alternatives as far as the characteristics of the product are not adversely altered and they can at least make the same use of the oil. This means that a contract of delivery and collection supported by FS system, including enhancement of information and product customisation – to some extent – would be accepted by the consumers if the properties of the olive oil offered by the company are not worsened at the consumer’s perception.
One may represent this situation as the two sides of a coin. On the one side, when expressing value in terms of wishes, the consumers seem to feel free to express their needs and likings. Still, a mathematical rank is difficult and it is thus translated into a semi-quantitative scale meaning very important, not important and relevant. On the other hand, price is a well known scale that is everyday used as a reference but as it has been argued, the link with what customers want can be questioned in many cases. By interpreting the second question, they seemed to understand that there is some “constraint” in their wishes and that by wanting more they would have to pay more for it. Then, there is a fitting of the semi-quantitative results towards something more quantitative by regulating or, rather, pricing their criteria. We consulted the NW’s with the surveyed along with the rank among these and they agreed completely with them. Then, although price has not been a criterion for any of them, it has been used to help the results to be tighter than just good, bad or average.
Page | 69
4.4.2. Lifecycle Environmental Impact LCE
It has been not possible to calculate the environmental impact with EI-99’s. The values in our database where either obsolete (e.g. old models of transportation vehicles consuming excessive fuel) or referred to other types of processes (e.g. biodiesel produced from raw material instead, involving land use) making the results confusing. In the LCE method it has been mentioned that these indicators are constantly updated and specific ones can be calculated. Although it was possible to adapt these to our case, resources and time available have not permitted it. Instead, we used of GWP100 limiting the quantitative results to the impact on the environment of the emission of greenhouse effect gases. The rest of the impacts (e.g. eutrophication, emission of other chemicals, etc) were tackled qualitatively.
This solution has sounded suitable since much of the impact is supposed to come from the use of fuels for transportation, which are directly linked to the GWP. The numerical values for LCE in VERI assessment will then be calculated with GWP100 and the conclusions about the best practice possible (alternatives A, B or C) according to VERI method will be supported by the qualitative analysis of other ecological consequences. The LCE results of the options presented are shown in the shaded cells in the summary tables Table 6, Table 7 and Table 8 below. These, although quite shallow, show great differences in GWP between options A and B and C. Other types of impacts will be discussed later on this section.
Before we start the analysis of the calculations, we discuss that it is possible to reach both positive and negative values in relation of the contribution to the emissions of greenhouse gasses of the streams of processes. Processes that serve as a drain of carbon dioxide i.e. produce materials that in a lifecycle retain carbon dioxide or other greenhouse effect gas, will yield negative (positive for the environment) results. Olives crops withdraw carbon dioxide in photosynthesis and incorporates it in the chemistry of olive oil. The carbon chains are due to this absorption of dioxide. When transesterified the chain is sustained and the CO2 remains in the composition of the oil. Then, if not combusted, the carbon dioxide absorbed is kept out of the atmosphere and the balance of the production is then negative.36 The same idea, although less straight to identify and more or less extensively, can be applied to biogas production. Therefore, positive LCE will mean bad impact on the environment; conversely, negative LCE indicate a global withdrawal of the impact on the environment (good for the environment).
The product offered is to satisfy the ecological goal of the regional government to run the bus line Rayo 13 with biodiesel 100%, along with creating value among the consumers of olive oil at home. Other uses given to the product or its streams, processes involved or possible disposal scenarios are then omitted. The product shows, then, the LCE for its given utility, leaving the rest (e.g. remaining biodiesel in options B and C, glycerine in option B or biogas and fertiliser in option C), open to utilisation within other or broader scope and goals. Our scope and boundaries of the thesis must be consistent with the goal and the functional unit pursued. If, for instance, the biogas is utilised to replace some of the natural gas combusted in the combined-cycle power plant in Las Escombreras37 (Cartagena) for fuel conversion in electricity
36 A rough example would be the case of burning a tree. This grows absorbing CO2 that is released in combustion. The global emissions are here null. If we only burn a branch, then the overall is negative. 37 The power plant comprises diesel-based thermal power unit with 553MW installed and a combined cycle power unit with 831MW installed, owned by Iberdrola available at (http://www.iberdrola.es/webibd/corporativa/iberdrola?IDPAG=ENWEBCONLINLIBESPRODPOTINST&codCache=12430737439584407 (last access May 23, 2009)
Page | 70
production, the impact of such process should be included also in the three options. In options A and B biogas is not produced, and the impact would come from natural gas combustion, adding CO2-eq to the total sum. The effects of electricity production would be lower in option C in terms of global warming because of the usage of biogas to some extent. Then option C would have shown much better performance in CO2-emissions than the rest and the total scores in LCE would be different.
All the same, transportation in the supply chain means a great share of the negative impact on the environment. In alternatives B and C there is an unused biodiesel stream of around 1,860m3/year, that could be used for transportation in our system, reducing the impact. But again, this should have been included along the goals of the thesis and present in the three alternatives. It would have meant further improvement in the results for alternatives B and C for having available this resource, improving LCE against option A. Likewise, biodiesel can be used as a fuel in the region for another unit of the local power plant (also in Las Escombreras) that runs a single thermal process with liquid (diesel) fuel as combustible. Again, the impact in options B and C would have been much more reduced compared to that in option A. Combining both power units using biodiesel and biogas for electricity production, the most suitable solution against carbon dioxide emission would have been option C. Also biogas is apt as a combustible for vehicles, but the technical deployment is a drawback of utmost importance. We do not inquire more in this possibility.
The impact of production of glycerine is already included in production of biodiesel, for being a sub-product. The impact of glycerine would come from its utilisation, replacing its industrial production from raw material. In option B the total amount obtained is not utilised for any purpose. In option C it serves as an input for biogas production, and the impact of its utilisation is already included in this biogas process. The best use of glycerine (substitution of its industrial production or production of biogas) would come from the balance of the different scenarios, where energy and glycerine production in the region is involved. Since it that is not among the goals in this thesis, these consequences are not included in the results. For the same reasons as in the case of biodiesel and biogas, other uses of glycerine cannot be included in A and B.
Here we tackle the important contribution of fertiliser in LCE. We must admit that we do not know for sure if the production of fertiliser for olives crops occurs within the boundaries of the region. Most probably it will come from Fertiberia S.A. in Huelva (hundreds of kilometres away from our province), which is Spain’s largest producer of fertilisers. However, we propose production of biogas to show the effect of making use of biofertiliser, and we include a hypothetic chemical production within the regional boundaries. According to the results, the environmental impact of industrial production of the nitrogen, phosphorus and potassium fertiliser (NPK) is higher than any other contribution to LCE; even higher than transportation altogether. Hence, reduction of these emissions is a great focus in design towards reducing LCE.
The impact of biogas production is already included in option C, and has as a solid residue a rich sludge suitable to be used as a fertiliser. The composition of such fertiliser is variable and will depend much on the input to the process. We suggest the use of agricultural waste for this process, which is rich in nitrogen, together with glycerine. Our fertiliser requires nearly 60%
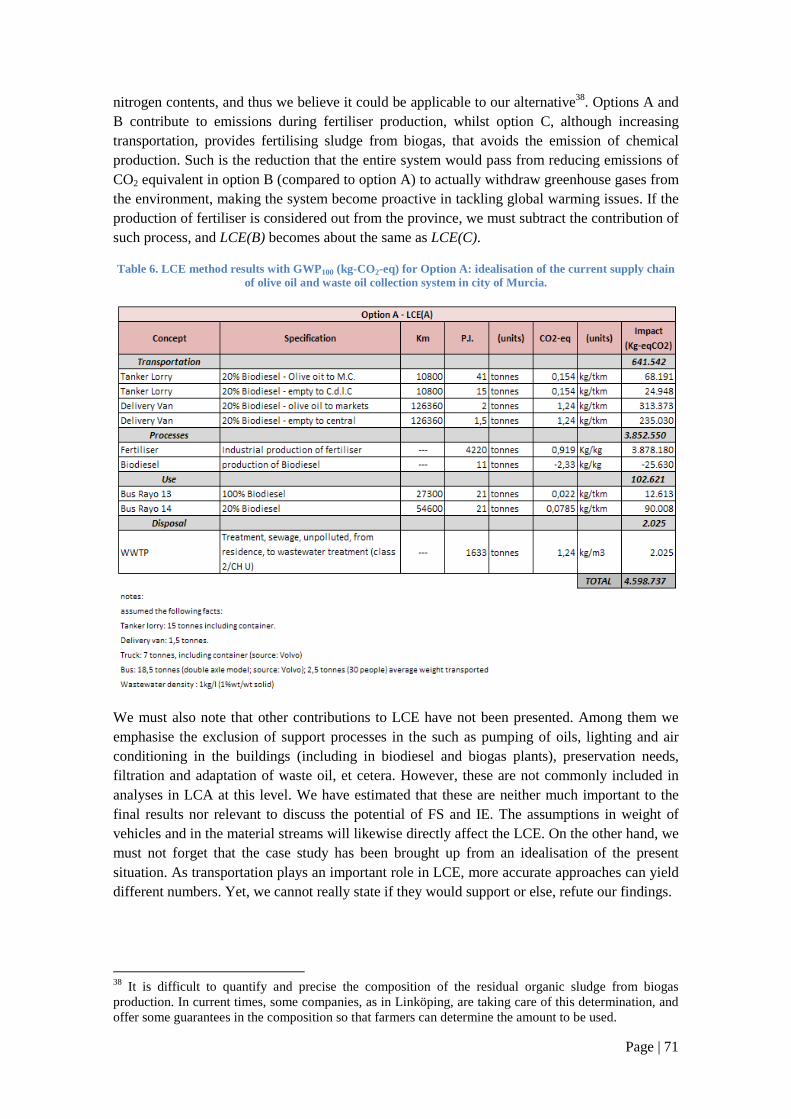
Page | 71
nitrogen contents, and thus we believe it could be applicable to our alternative38. Options A and B contribute to emissions during fertiliser production, whilst option C, although increasing transportation, provides fertilising sludge from biogas, that avoids the emission of chemical production. Such is the reduction that the entire system would pass from reducing emissions of CO2 equivalent in option B (compared to option A) to actually withdraw greenhouse gases from the environment, making the system become proactive in tackling global warming issues. If the production of fertiliser is considered out from the province, we must subtract the contribution of such process, and LCE(B) becomes about the same as LCE(C).
Table 6. LCE method results with GWP100 (kg-CO2-eq) for Option A: idealisation of the current supply chain of olive oil and waste oil collection system in city of Murcia.
We must also note that other contributions to LCE have not been presented. Among them we emphasise the exclusion of support processes in the such as pumping of oils, lighting and air conditioning in the buildings (including in biodiesel and biogas plants), preservation needs, filtration and adaptation of waste oil, et cetera. However, these are not commonly included in analyses in LCA at this level. We have estimated that these are neither much important to the final results nor relevant to discuss the potential of FS and IE. The assumptions in weight of vehicles and in the material streams will likewise directly affect the LCE. On the other hand, we must not forget that the case study has been brought up from an idealisation of the present situation. As transportation plays an important role in LCE, more accurate approaches can yield different numbers. Yet, we cannot really state if they would support or else, refute our findings.
38 It is difficult to quantify and precise the composition of the residual organic sludge from biogas production. In current times, some companies, as in Linköping, are taking care of this determination, and offer some guarantees in the composition so that farmers can determine the amount to be used.
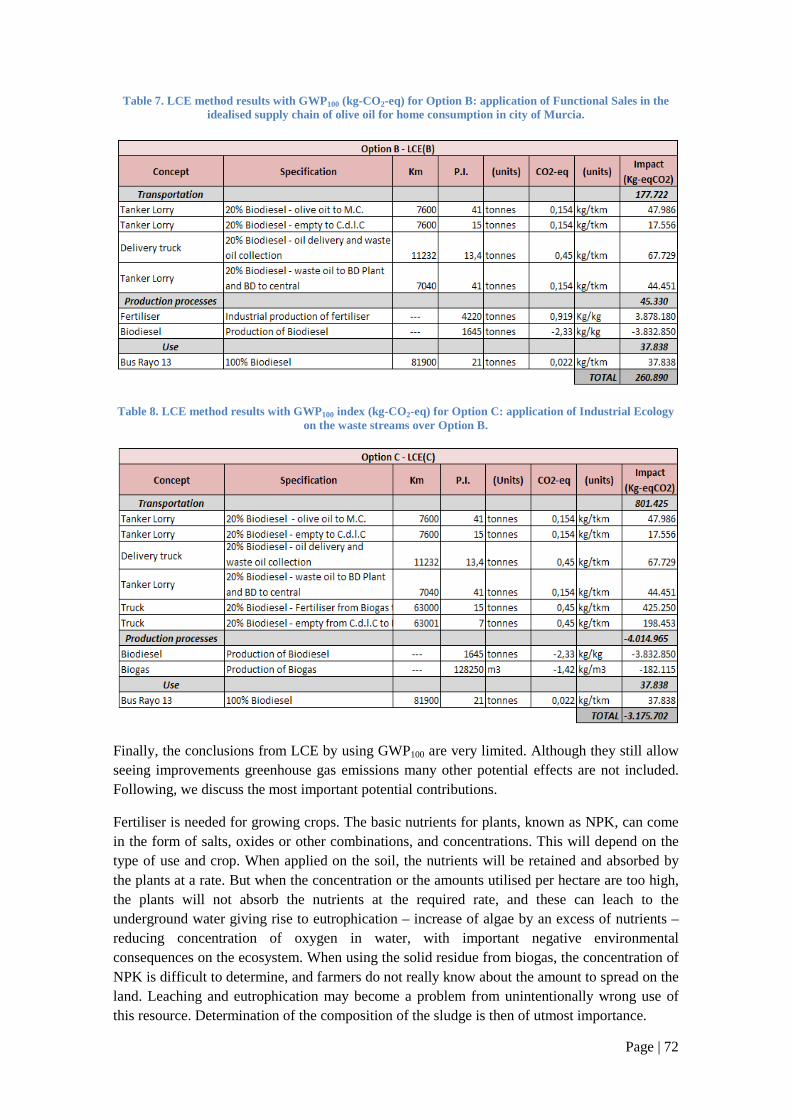
Page | 72
Table 7. LCE method results with GWP100 (kg-CO2-eq) for Option B: application of Functional Sales in the idealised supply chain of olive oil for home consumption in city of Murcia.
Table 8. LCE method results with GWP100 index (kg-CO2-eq) for Option C: application of Industrial Ecology on the waste streams over Option B.
Finally, the conclusions from LCE by using GWP100 are very limited. Although they still allow seeing improvements greenhouse gas emissions many other potential effects are not included. Following, we discuss the most important potential contributions.
Fertiliser is needed for growing crops. The basic nutrients for plants, known as NPK, can come in the form of salts, oxides or other combinations, and concentrations. This will depend on the type of use and crop. When applied on the soil, the nutrients will be retained and absorbed by the plants at a rate. But when the concentration or the amounts utilised per hectare are too high, the plants will not absorb the nutrients at the required rate, and these can leach to the underground water giving rise to eutrophication – increase of algae by an excess of nutrients – reducing concentration of oxygen in water, with important negative environmental consequences on the ecosystem. When using the solid residue from biogas, the concentration of NPK is difficult to determine, and farmers do not really know about the amount to spread on the land. Leaching and eutrophication may become a problem from unintentionally wrong use of this resource. Determination of the composition of the sludge is then of utmost importance.
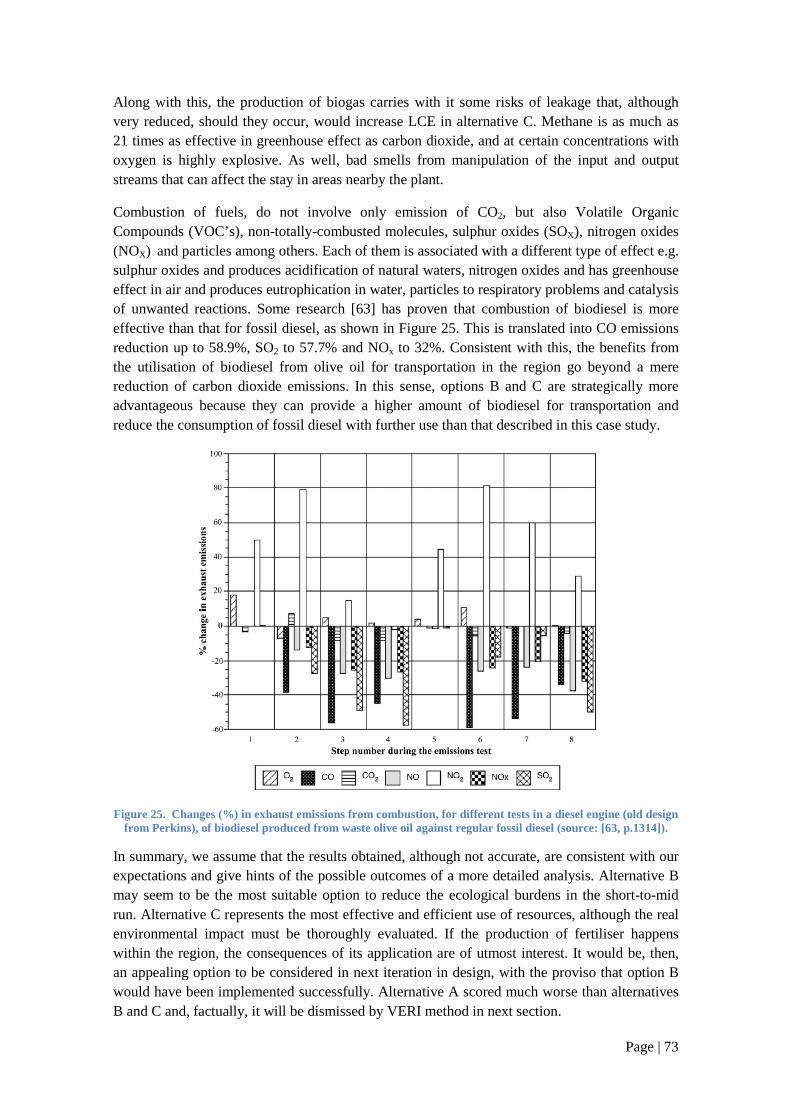
Page | 73
Along with this, the production of biogas carries with it some risks of leakage that, although very reduced, should they occur, would increase LCE in alternative C. Methane is as much as 21 times as effective in greenhouse effect as carbon dioxide, and at certain concentrations with oxygen is highly explosive. As well, bad smells from manipulation of the input and output streams that can affect the stay in areas nearby the plant.
Combustion of fuels, do not involve only emission of CO2, but also Volatile Organic Compounds (VOC’s), non-totally-combusted molecules, sulphur oxides (SOX), nitrogen oxides (NOX) and particles among others. Each of them is associated with a different type of effect e.g. sulphur oxides and produces acidification of natural waters, nitrogen oxides and has greenhouse effect in air and produces eutrophication in water, particles to respiratory problems and catalysis of unwanted reactions. Some research [63] has proven that combustion of biodiesel is more effective than that for fossil diesel, as shown in Figure 25. This is translated into CO emissions reduction up to 58.9%, SO2 to 57.7% and NOx to 32%. Consistent with this, the benefits from the utilisation of biodiesel from olive oil for transportation in the region go beyond a mere reduction of carbon dioxide emissions. In this sense, options B and C are strategically more advantageous because they can provide a higher amount of biodiesel for transportation and reduce the consumption of fossil diesel with further use than that described in this case study.
Figure 25. Changes (%) in exhaust emissions from combustion, for different tests in a diesel engine (old design from Perkins), of biodiesel produced from waste olive oil against regular fossil diesel (source: [63, p.1314]).
In summary, we assume that the results obtained, although not accurate, are consistent with our expectations and give hints of the possible outcomes of a more detailed analysis. Alternative B may seem to be the most suitable option to reduce the ecological burdens in the short-to-mid run. Alternative C represents the most effective and efficient use of resources, although the real environmental impact must be thoroughly evaluated. If the production of fertiliser happens within the region, the consequences of its application are of utmost interest. It would be, then, an appealing option to be considered in next iteration in design, with the proviso that option B would have been implemented successfully. Alternative A scored much worse than alternatives B and C and, factually, it will be dismissed by VERI method in next section.

Page | 74
4.4.3. Value-Environment Recursive Index (VERI)
Once obtained the results for UV and LCE, the results of VERI come quite straightforward. Table 9 and Figure 26 summarise the numbers, and depict the situation of the alternatives in the current iteration according to the method proposed.
Table 9. Summary results from the application of VERI method to the options A, B and C. The parameters selected have been: α(1) = 1,15 ; UVmin(1) = 0,88; LCEgoal(1) = 0 (initially). As LCE has been improved
beyond the initial goal, the new minimal value has been considered as the goal.
Figure 26. VERI method (final results) applied to our case study. Options B and C are eligible for complying with all the requirements. Option A does not comply with the eco-index VERI and thus should be discarded.
The results seem to be quite obvious from the management objective. The goal set on VERImin(1) on eco-efficiency is clearly complied by options B and C. Likewise, they fulfil the design requirements at setting UV(i) over the minimal limitation UVmin(1) and reducing LCE below the maximum LCEmax(1). Option A instead does not comply with any of the requirements, and therefore should be discarded as an alternative at present. Here we can also argue that should the parameter α be set below the established (α = 1.15), increase in the slope, option A would have complied with the LCEmax(1) but still it would have been discarded for being out from the shaded feasible area.
Alternative C, besides, improves the LCEgoal(1) proposed (i.e. LCE(1) = 0) and sets a lower value towards which the rest of the results are to be contrasted. Then, although option B is an interesting alterative from all the viewpoints, its environmental performance is blackened by the existence of alternative C. This fact reduces UV(B) as its RS(B,m) (i.e. Raw Score in the environmental criterion) is lower than if it was compared against the initial LCEgoal(1). On the other hand, we discussed in the previous section that option C could be located nearby option B if the fertiliser is produced outside the boundaries of the region. Under that circumstance, LCEgoal(1) would be equal to 0, and could guide the next iteration on ecological objectives.
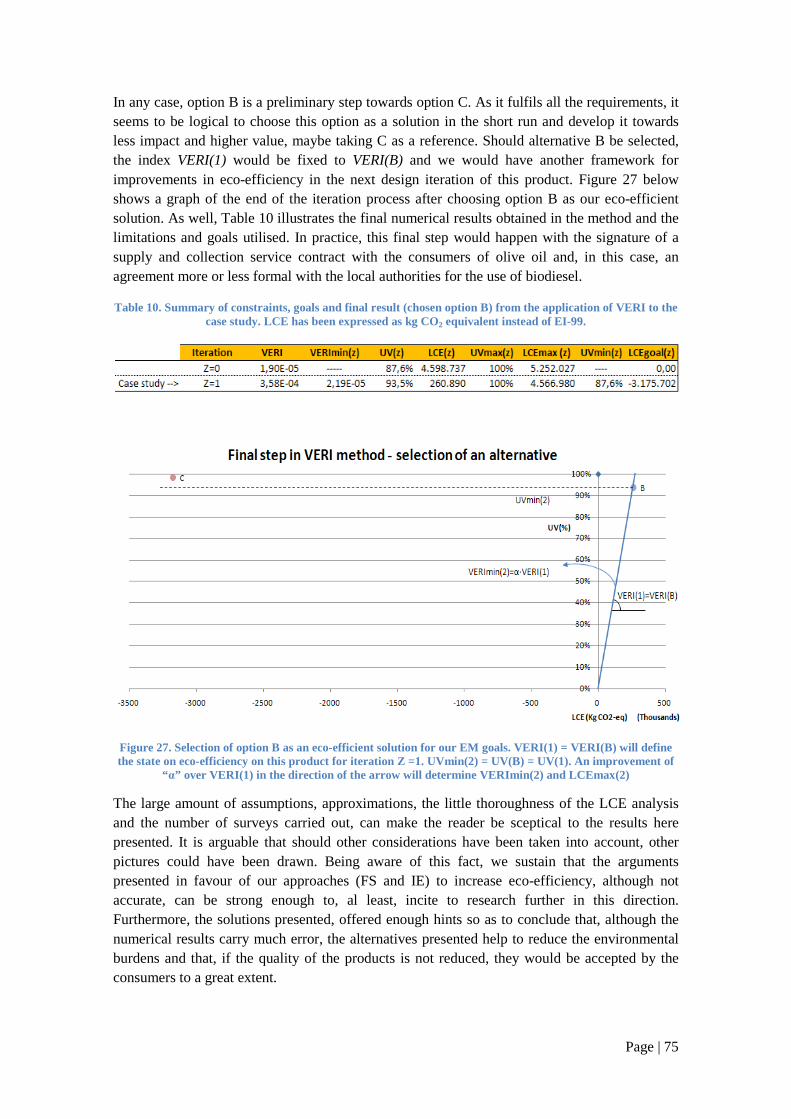
Page | 75
In any case, option B is a preliminary step towards option C. As it fulfils all the requirements, it seems to be logical to choose this option as a solution in the short run and develop it towards less impact and higher value, maybe taking C as a reference. Should alternative B be selected, the index VERI(1) would be fixed to VERI(B) and we would have another framework for improvements in eco-efficiency in the next design iteration of this product. Figure 27 below shows a graph of the end of the iteration process after choosing option B as our eco-efficient solution. As well, Table 10 illustrates the final numerical results obtained in the method and the limitations and goals utilised. In practice, this final step would happen with the signature of a supply and collection service contract with the consumers of olive oil and, in this case, an agreement more or less formal with the local authorities for the use of biodiesel.
Table 10. Summary of constraints, goals and final result (chosen option B) from the application of VERI to the case study. LCE has been expressed as kg CO2 equivalent instead of EI-99.
Figure 27. Selection of option B as an eco-efficient solution for our EM goals. VERI(1) = VERI(B) will define the state on eco-efficiency on this product for iteration Z =1. UVmin(2) = UV(B) = UV(1). An improvement of
“ α” over VERI(1) in the direction of the arrow will determine VERImin(2) and LCEmax(2)
The large amount of assumptions, approximations, the little thoroughness of the LCE analysis and the number of surveys carried out, can make the reader be sceptical to the results here presented. It is arguable that should other considerations have been taken into account, other pictures could have been drawn. Being aware of this fact, we sustain that the arguments presented in favour of our approaches (FS and IE) to increase eco-efficiency, although not accurate, can be strong enough to, al least, incite to research further in this direction. Furthermore, the solutions presented, offered enough hints so as to conclude that, although the numerical results carry much error, the alternatives presented help to reduce the environmental burdens and that, if the quality of the products is not reduced, they would be accepted by the consumers to a great extent.

Page | 76
MCA, LCE and VERI methods permitted an easy analysis of the situation, albeit it is needed to investigate more to include other important factors such as the economic or the technical viabilities of alternatives. When these are acceptably included in the method, we believe this tool can help to analyse alternatives from every stand to assure somehow their success. In this case study, these factors have been neglected, and owing to that, we cannot state that the solution hereby presented can be utterly feasible but rather of interest for further analysis.

Page | 77
5. Discussion
By ways of the case study we tried to depict some example both to prove the utility of VERI as a new evaluation method and index, and the potential that FS and IE can represent, measured in terms of such index. The results obtained, at a glance, go in line with the arguments given in the theoretical background. Albeit, unluckily, it has not been possible to gather more opinions from consumers or perform LCA more in detail to produce more accurate numbers for LCE, we can still identify some interesting points. It is necessary to discuss them so as to understand its further applicability by finding some pros and cons, before it is utilised for other situations. Some other points, mainly economic and technical viabilities, will be left open for further analysis and research.
Understanding value as a rate of customer’s perception has proven to be convenient to quantify the goodness of the alternatives given. It is an easy approach whose results can be also checked with the customers themselves to evaluate on time their accuracy. In the case study, once shown the calculations to the consumer and explained the meaning of them, they were offered the chance to make changes over opinions, weights, etc. Some of them did, as comparisons are easier for human beings than absolute ranks [24]. Thus, it is possible to somehow catch some hints of the likings and desires of the surveyed. By studying the weights, information about what should be offered is given away and that can help to orient the focus of the designers towards more specific goals in design.
As well, when introducing FS as a “complement” of product, we still keep the physical properties of those goods yet we increase the range of criteria to the customers, and the focus is spread. All of a sudden, the stress on the attributes that were so important for the customer to obtain the utility they pursue is softened by some additional service or combination of resources that are strictly designed to please the particular customer’s need. Taking back the example given in the theory of value (section 2.1.1), considering a car for transportation, if a customer is to buy it to commute daily to go to work, the stress will be put over the physical qualities such as power of engine, consumption per kilometre, internal and external colour, etc. If a rental service is considered instead, a lack on those criteria could be compensated by some good cleaning or car-parking services, or the chance to have different models every day, for instance. In the case study, this fact arose while performing the poll. The surveyed only mentioned physical qualities as acidity or quality, whereas others criteria as availability or information where left out as they had never experienced olive oil including a service. These were, in fact, suggested by the surveyor and evaluated by them. Taking a look at the results, it can be seen that the material product cannot easily be improved yet when added a service of supply we offer some new scope for improvement that will increase its value i.e. it will be more appreciated by the customer and as a result it is expected that they would be willing to pay more for it, given these new features. It does not mean that we should neglect the others though. Instead, we can consider that we have some margin to increase utility value by “playing” with the new parameters, and have the evaluation of the customer.
In this sense, all the consumers surveyed agreed that they would like to contribute positively to the environment and they would pay more for an environmentally friendly olive oil, and would adopt the delivery/collection service. Still, they would not accept it if the physical properties are worse since they would condition the applicability and quality, which are key parameters.
Page | 78
Should they kept stable, they would agree with that they would value more the new approaches for offering interesting features that increase their wellbeing.
As new technologies or approaches are more available day by day, eco issues will always mean some area for progress, that the consumer will weight. If there is no alteration on important parameters (criteria), improvement towards green performance will always offer some alternative to the company to advance in eco-efficiency whilst also pleasing the customer to the given weight extent.
We have also included the idea of price in the discussion in section 4.4.1 when we stated that it should be kept aside. This was only to give notice of some innate concern on this factor that could have influenced the numbers. Actually, in the case study, price has not been even mentioned by the customer possibly for two reasons. Firstly, the price of most products available in the market is around some average with little variations. That makes the customer not to make it a primary parameter. Secondly, although it is a usual good with daily use, this average price is not considered high. However, price is still a most well-known scale for the customers and, as we exposed in the results for value, the questions had to be reformulated including price as a constraint not let them be sloppy with the results. By assuming that they would pay more they may also know what it would be the limit in “extra” price to pay for the “extra” satisfaction added. Then, we can suggest that somehow, taking as a reference the current situation, they can figure out the price they would accept. Finally, the ultimate decision will take into account not only customers’ satisfaction of criteria, but also the price the company sets. The more the customers and the company agree in the price of the product, the less this will affect the final decision. If the price for an alternative given by the company is too high to the customer’s expectations, the alternative is likely to be rejected even if it presents the highest utility value. Alternatively, if that price set is lower, customer will take an advantage of the “bargain” and chose it even though it might be less interesting. All the same, this is an issue to be studied by other areas such as marketing or related and we leave this issue open for further research.
Hence, when offering a set of options to the customer in a design loop, these must have passed some analysis on economic viability that assures the affordability of the projects, the availability of resources and the competitiveness in price in the market. MCA method in the case study is then a mere approach to be able to asses customers’ level of satisfaction (and possibly with that assess the price setting), analyse the parameters to take into account in future iterations, and fix the present situation on eco-efficiency to establish new goals on UV and LCE with VERI.
But MCA also shows some other weak points. Performing MCA with customers’ perception is only possible when the contact is really close and there is really a possibility to integrate, in a short period of time, the information into feasible alternatives. Customers’ criteria, interests, needs and perception are rather fickle and what is valued at a time might be importantly different in a relatively reduced time span [8]. This idea is easy to see when, for example, the products are related to the world of fashion or travelling. Hence, also a constant contact with the customer is required which consequently means to set permanent human and material resources for support. Then, systems other than those that adopted FS as the core of business, will find this concept of value somewhat impractical.
Page | 79
Here we give rise to the question about the type of company that would most likely succeed with using MCA. The answer is not easy since it not only depends on the managerial strategy adopted by the company and the field of business but also on the type of internal structure [30]. The company must be easily adaptable with its resources to tackle each product and its particularities appropriately. In the study, we do not consider any special organisational structure, although here we give our opinion that options B and C could be much more easily carried out by the regional government than by a single company. An olive oil producer bases its management on material streams, while the regional government have the contact with the people and are used to administrate other services. In this sense, we suggest that possibly those more service-oriented will be more used to deal with this system and externalise their material resources. In the case study we neglected the difficulties of a producer to undertake the entire production-supply-collection-recycling chain when that could be the first and main hindrance. We should understand that the case study is presented from the perspective of “assuming that it is technically feasible, what would happen if...?” As we mentioned before, some previous study on viability should have been carried out during the design process, including economic issues.
When customising products, the amount of clients included in a MCA matrix will influence the results value calculations because of the range of criteria, weights and opinions that can be gathered. In our case study, the UV(i) represents the average of nine interviewees and not to some particular customer. By taking a look at each consumer’s appreciations (see Appendix III and Appendix IV) we can see that their insights, although rather similar amongst them, are to some extent different. Then, olive oil does not please them equally in any of the options presented. This will place to the producer in a dilemma. On the one hand we have that it will be easier for a company to please, differently, many customers at a time with some “standard” product that with mass production. In return this generates a hotchpotch of weights and opinion to yield an average UV with our MCA method. Value misses focus on the wishes of specific customers and the essence of FS is dissipated. Mass production aims at the satisfying to a large a mount of customers with a set of products. We can sense that when a broad amount of customers are the market of the company or this has massive production, using MCA for value estimation might be neither an accurate nor a useful method, as it would provide only vague hints of the wants of some average customer.
On the other hand, when only few customers are considered to gain focus, the market becomes reduced. The design must involve a long term contract with important revenues to be worth. This is then more in accordance with what we exposed for FS. A long term relation involving bidirectional flow of information consequently has more chances to success when value is understood as fulfilment of customers’ wishes. The method proposed can be quite convenient and useful in such case, and the gains in design approach should be analysed against business risks in the design stage.
We can conclude here that had the UV addressed to a high number of customers, MCA can be used to obtain an average UV and hints about the success of the alternative in the market. When addressed to a smaller group, the result is more accurate and reflects the customer’s insights. This latter can be more the field for FS, being the ideal situation an assumption that everybody will accept the deal of the service offered. Then, in line with the discussion on structure issues, this approach of UV may be more fruitful for a service-based company with high dynamism in its structure than in a traditionally hierarchical one producing material (or energy) goods for massive sales.
Page | 80
With regard to LCE, the use of indicators eases the accounting of the burdens on the environment. But finding an appropriate indicator is difficult. Moreover when social and economic issues are involved, the interpretation of the results must be meticulous. In the definition of sustainability given by WBCSD [7], environmental aspects are related to these latter, and decisions on sustainability cannot be based merely on some measurement on the potential or actual harm on environment. However, quantitative results allow comparing different results better than quantitative analysis. Therefore, the qualitative analysis should lead the arguments on favour or against whereas supported by qualitative facts. In the case study, alternative C showed rather smaller impact in terms of CO2 emissions than alternative B. However, some potential problems on eutrophication and the feasibility of the options made us incline towards option B instead. Therefore, LCE measured as a number cannot be accepted in isolation as representative of the influence on “eco” issues.
Also, as it was discussed in section 4.4.2, the numerical results obtained when using LCA tools depend enormously on how detailed the analysis is wanted to be. More thorough studies can be more reliable but will require much resource (time and knowledge) [58] and the objective of the method and this thesis is then missed.
The role of eco-effectiveness opens the door to a new way of managing the flows from the very beginning, guaranteeing the reutilisation of resources along the chain. By assuring that the product is completely natural, olive oil can be taken back to soil in the form of biofertiliser, closing the loop. This is, besides, one of the main ambitions of IE, so they are complementary and do not exclude one another. This benefits the environment from the side that it can provide some renewable energy from a waste stream while removes the environmental impact of chemical production of fertiliser. The economic consequences have not been studied in this thesis, although we can learn from fruitful experiences such as the one in Linköping. Anyhow, in theory, eco-effectiveness gives rise to a new way of design in which the goal to be pursued is to provide what is wanted, i.e. being “effective”, with or without an efficient use of resources. But in practice it is combinable with other approaches to increase efficiency and empower the gains. Waste olive oil, until recent times, was considered in Spain a waste with difficult disposal. By deciding to take back to soil most of the stream – also consider that some of the CO2 emitted by combustion of biodiesel and biogas in the region will be again absorbed by the crops – a great deal of impact is avoided and waste is transformed into valuable biofuel and nutrients.
Perhaps, the main hindrance of eco-effectiveness is that much of the technology and materials that are basic in our regular life are not possible to be offered by completely natural materials and productions. Furthermore, its first and second principles are in contradiction with the third (please refer to section 2.2.2 Eco-effectiveness for explanation) if we consider, for instance, a solar cell in current times. To make the most of the solar energy, we produce a device that involves rare materials in its composition and is basically inorganic; organic conductor materials for solar cell are under development but the studied systems, with around 5% of conversion efficiency compared to over 10% of silica-based cells, is far beyond its viable applicability. Then, if applied the first and second principles to this device, with the present technology, the amount of photovoltaic energy collected will be dramatically reduced. Therefore, we can understand that the substitution of the known materials towards degradable ones is, as of now, a utopia at a great scale. But still, at a reduced scale, the concept can succeed. The company MBDC, founded by McDonough and Braungart (fathers of the eco-effectiveness)
Page | 81
in 1995, designs products and processes for a cradle-to-cradle lifecycle, following the principles (please, visit http://www.c2ccertified.com/ for more information). In the information of the company, they give reference to a large amount of examples of success in the implementation of their products. They also provide a cradle-to-cradle certificate to companies that are willing to follow and put into practice their principles. The list of eco-effective companies, products and processes is still increasing.
Therefore, we can anticipate that eco-effectiveness will be gaining importance year by year and that in a future will be a model or rather a philosophy for design. But for it to play a major role, much more research is needed. It has a long way to lead design strategies but in its short history of application it has shown – also noticeable in the case study – that it can be successful and is a promising concept to, at least, keep in mind nowadays.
Finally, we can say that VERI offers a new viewpoint in evaluation of eco-efficiency. It shapes the framework for design by a series of constraints and goals while keeping a strong focus on what it is to be accomplished to produce customer’s satisfaction. When proximity to the customer is possible, the application of MCA matrix proposed is rather easy and it gives away, in a simple scale, important information about relevant criteria. In the case study we found out that, despite the physical parameters of olive oil are quite difficult to improve, there is some scope for improvement of UV by including some delivery service and reducing the ecological burdens. In parallel, using the LCE method proposed, permits to compare among different options to improve stages along the lifecycle. VERI has also demonstrated versatility during the development of the thesis since EI-99 could not be used and GWP100 was used instead. The method is simple and does not require much technical skill to be executed. The visualisation tool and the openness for decision making on goals and constraints in the management, eases the choice of the best solutions. This may make it understandable and accessible to anyone pursuing a measure on eco-efficiency.
In contrast, the reliability of the results depends greatly on how accurately the method is carried out. Our MCA method utilised increases its uncertainty with the number of customers surveyed. Even if customer differentiation is included, the designs may be much more focused to successfully fulfil the requirements with reduced amount of customers. On the contrary, LCE method will gain credibility with a thorough analysis of the system and with as much data related is applied. These factors sustain that VERI method is most suitable when the product will withstand a mid or long term contract with some relatively low number customers; the relation with them must be rather tight and the revenues interesting. Otherwise, the opinions of a big amount will blur the focus of MCA and the efforts on a reliable LCE calculation might not be worth. As well, due to the characteristics of the index, the method is intended to support design at a system level and should be, perhaps, supported by other design methods such as QFDE to develop the technical side.
To conclude with this broad discussion we will now answer our research questions.
Page | 82
5.1. Answers to the Research Questions
RQ1. Is there a representation of value that could satisfy eco-efficiency index expressions?
In the theories we presented a differentiation between the concepts of economic and utility value that we put into practice in the case study. In the practice we could measure value as customer satisfaction but still the economic factor must be introduced to provide a reliable representation of value. This is due to the fact that customers’ satisfaction cannot, itself, demonstrate the economic viability and/or competitiveness of a product, which are part of the aims of eco-efficiency.
RQ2. Could functional sales serve as a means to increase value of a product while reducing environmental impact?
The case study opened the gates to a new possible way to increase customers’ satisfaction by introducing FS, in accordance with the results. Although the environmental impact could not be accurately described, it seemed to offer interesting reductions on the environmental impact. Therefore, proven its economic and technical practicability, it can be proposed as an appealing solution to increase value and/or reduce the environmental impact of a product
RQ3. Is eco-effectiveness an issue to be considered more in product/service design according to the results?
Eco-effectiveness has proven to offer a great scope for improvement of the environmental impact of the olive oil material flow towards a more proactive actuation. With the technology available, the principles should be applied when possible.
RQ4. How applicable is in fact the theory suggested in the research to the case study selected?
The results obtained support entirely the theoretical background. The case study permitted us to show the potential of the approaches aforementioned. Nevertheless, an analysis of the feasibility (both technical and economic) of the alternatives presented must be carried out to know if they can be, reasonably, put into practise.
RQ5. Is it possible to apply the evaluation method (VERI), in general, to other cases?
Two are the key parameters for effective application of VERI: nearness to clients and time availability. To apply the MCA matrix properly, the company must have eased access to the customer and their requirements. Also, LCE method is to be carried out with as much as detail as possible to be reliable, which involves, essentially, time and designated personnel. Lack of proximity to clients and/or time for thorough LCE calculation reduces VERI’s consistency and applicability.
Page | 83
6. Conclusions
In this thesis we presented a series of theories and methods, together with a case study for application and analysis of potential results. Here we conclude with the following main points.
• IE and FS helped to tackle our case study from a wider perspective. • FS can offer a new scope to overcome the current market problems of olive oil in region
of Murcia, Spain. • Reutilisation of waste streams increased production of renewable energies. • Application of VERI does not require special technical skills and its visual tool may
help to make decision on eco-efficiency.
However
• The viability of the projects has not been proven. • We provided scarce accuracy due time constraints and data availability. • Economic implications ought to be addressed.
Therefore, we claim that
• Viability and economic analyses are required in the case study to make ultimate statements.
• More work is needed to prove the benefits of integration of FS and IE to improve eco-efficiency.
• FS, IE and eco-design have common purposes with different paths, which could be combined to increase the range of solutions.

Page | 84
Page | 85
7. References
1 Cote, R.,(Editor). Linking Industry and Ecology: A Question of Design. Vancouver, BC, CAN: University of British Columbia Press, 2005
2 Industrial Ecology, Graedel, T.E., Allenby, B.R., Second Edition, 2003. Pearsons Education Inc. Uper Saddle River, New Jersey.
3 Chertow M.R., Industrial Symbiosis: Literature and Taxonomy, Annual Review on Energy and Environment, No.25, 2000. Pages: 313-337.
4 Wolf, A., Industrial Symbiosis: a short review, Environmental Technology and Management Department, University of Linköping, 2008.
5 McDonough W. & Braungart M., The Next Industrial Revolution, Eco- efficiency, Greenleaf publishing, 2001.
6 Edwards, Andres R. Sustainability Revolution: Portrait of a Paradigm Shift. Gabriola Island, BC, CAN: New Society Publishers, Limited, 2005.
7 Lehni M., WBCSD Project on Eco-Efficiency Metrics & Reporting: State-Of-Play-Report, World Business Council for Sustainable Development, 1998.
8 Ben Ahmed, W., Yannow, B., Polysemy of Values or Conflict of Interests: A multi-Disciplinary Analysis, International Journal of Value-Based Management No. 16, 2003. Pages: 153-179.
9 Preuss, L., Should you buy your customer’s Value?On the transfer of moral Values in industrial purchasing, International Journal of Value-Based Management No. 13. Pages:141–158.
10 Woodruff, R.B., Customer Value: The Next Source for Competitive Advantage, Journal of the Academy of Marketing Science, Volume 25, No.2, 1997. Pages: 139-153
11 Sakao T. & Shimomura Y., Service Engineering: a novel engineering discipline for producers to increase value combining service and product, Journal of Cleaner Production No. 15, 2007. Pages: 590-604
12 Anderson, J. C., Dipak C. J, & Pradeep K. C., Customer Value Assessment in Business Markets: A State-of-Practice Study, Journal of Business to Business Marketing No.1, 1993. Pages: 3-30
13 Ki Moon, S., Simpson, T.W., Kumara, S.R.T., An agent-based recommender system for developing customized families of products, Journal of Intelligent Manufacturing, Springer Science+Business Media, LLC, 2008
14 Abukhader, S.M., Eco-efficiency in the era of electronic commerce - should ‘EcoEffectiveness’ approach be adopted, Journal of Clean Production No..xx, 2007. Pages.1-8
15 Graf A, Maas, P., Customer value from a customer perspective: a comprehensive review, JfB No.58, 2008. Pages 1-20
16 Alonso-Rasgado, T., Thompson, G., Elfström, B., The design of functional (total care) products, Journal of Engineering Design, No.15:6, 2004. Pages: 515-540
17 Lindahl, M., Ölundh, G., The Meaning of Functional Sales, Proceedings – Life Cycle Engineering: Challenges & Opportunities 8th International Seminar on Life Cycle Engineering, June 18/20, 2001, CIRP, Varna – Bulgaria
18 Oksana M. Product Service Systems – Final Report, The International Institute of Industrial Environmental Economics, Lund University, Sweden, 2000. ISSN 1102-6944
19 Besch, K., Product-service systems for office furniture: barriers and opportunities on the European market, Journal of Cleaner Production No.13, 2005. Pages: 1083-1094
20 Rodríguez-Ibeas, R,, Environmental Product Differentiation and Environmental Awareness, Environmental & Resource Economics No.36, 2007. Pages:237–254
21 Avfal Sverige (Swedish waste management), Annual (2006) report on Swedish waste management. Published: 2007.
22 Heeres, R. R., Vermeulen, W. J. V., de Walle, F. B., Eco-industrial park initiatives in the USA and the Netherlands: first lessons, Journal of Cleaner Production, No. 12, 2004. Pages: 985-995.
Page | 86
23 Neap, H.S., Celik, T., Value of a Product: A definition, International Journal of Value-Based Management No.12, 1999. Pages:181–191.
24 Kwortnik, R.J.Jr., Creyer E.H., Ross, W.T. Jr., Usage-Based versus Measure-Based Unit Pricing: Is there a Better Index of Value?, Journal of Consumer Policy ,2006.No 29. Pages:37–66
25 Zopounidis, C., Doumpos, M., Multicriteria classification and sorting methods: A literature review, European Journal of Operational Research No.138, 2002. Pages: 229–246.
26 Saaty TL., How to make a decision: the analytic hierarchy process, European Journal of Operational Research No.48, 1990. Pages: 9-26.
27 The Industrial Green Game: Implications for Environmental Design and Management, National Academy of Engineering (NAE), National Academy Press, Washington DC, 1997.
28 Morelli, N., Product-service systems, a perspective shift for designers: A case study: the design of a telecentre, Design Studies No.1 (24), 2003. Pages: 73–99
29 Mont, O., Functional Thinking - The role of functional sales and product service systems for a function-based society, The International Institute for Industrial Environmental Economics (IIIEE), Lund University, Sweden, 2002.
30 Shenhar, A.J., Dvir, D., Toward a typological theory of project management, Research Policy No.25, 1996. Pages: 607-632
31 Project Management, Tonnquist, B, Bonnier Utbildning, Stockholm, 2008.
32 Olsthoorn, X., Tyteca, D., Wehrmeyer, W., Wagner, M., Environmental indicators for business: a review of the literature and standardisation methods, Journal of Cleaner Production No.9, 2001. Pages: 453-463.
33 Hermann, B.G., Kroeze, C., Jawjit, W., Assessing environmental performance by combining life cycle assessment, multicriteria analysis and environmental performance indicators, Journal of Cleaner Production No.15, 2007. Pages 1787-1796
34 Thoresen, J., Environmental performance evaluation – a tool for industrial improvement, Journal of Cleaner Production No.7, 1999. Pages: 365-370.
35 Eco-indicator 99 – A damage oriented method for Lice Cycle Impact Assessment (Nr. 1999/36A), Ministry of Housing, Spatial Planning and the Environment, The Hague, The Netherlands, 2000.
36 Eco-indicator 99 – Manual for Designer, Ministry of Housing, Spatial Planning and the Environment, The Hague, The Netherlands, 2000.
37 Akao, Y., Quality Function Deployment, Productivity Press, Cambridge, MA. 1990.
38 Masui, K., Sakao, T., Kobayashi, M., Inaba, A., Applying Quality Function Deployment to environmentally conscious design, International Journal of Quality & Reliability Management, No. 20 (1), 2003. Pages:90-106.
39 Kiker, G.A., Bridges T.S., Varghese, A., Seager, Thomas P., Linkov, I., Application of Multicriteria Decision Analysis in Environmental Decision Making, Integrated Environmental Assessment and Management, No.1 (2), 2005. Pages: 95-108.
40 Sakao, T., Watanabe, K., Shimomura, Y., A Method to Support Environmentally Conscious Service Design Using Quality Function Deployment (QFD), The Third International Symposium of Environmentally Conscious Design and Inverse Manufacturing (Ecodesign 2003), Tokyo, IEEE Computer Society, 2003. Pages: 567-574.
41 Sakao, T., Toyoda, S., Halada, K., Development of an Improvement Index of a New Material Processing Technology for Material Efficiency, The Sixth International Conference on Eco-Balance, 2004. Pages: 559-562.
42 Kondoh, S. , Mishima, N., Hotta Y., Watari, K., Kurita, T., Masui, K., A Study on Evaluation and Design of Environmentally Conscious Manufacturing Processes Proceeding of 15th CIRP International Conference on Life Cycle Engineering, 17 - 19 March 2008, Sydney, Australia
43 Kondoh, S. , Mishima, N., Hotta Y., Watari, K., Kurita, T., Masui, K., Evaluation and Re-Design Method of Manufacturing Processes, International Design Conference, Design 2008, Dibrovnik (Croatia), May 1-22 2008.
44 Martín Cerdeño V.J., Evolución de los hábitos de compra y consumo en España - 1987-2007, dos décadas del panel de consume Alimentario, the Spanish Ministry of Agriculture, Fishing and Food (MAPA) & Universidad
Page | 87
Complutense of Madrid (UCM), 2008. (available at http://www.mapa.es/es/alimentacion/pags/consumo/resumen.htm, as of March 3, 2009).
45 Consumo Alimentario en España 2007-2008, the Spanish Ministry of the Environment, Rural and Marine Affairs (MARM). Nov 2008 (available at http://www.mapa.es/es/alimentacion/pags/consumo/resumen.htm, as of March 3, 2009)
46 La Alimentación en España 2007- Total Consumption (Homes, Restaurants, Hotels and Insitutions) ,the Spanish Ministry of the Environment, Rural and Marine Affairs (MARM). Nov 2008 (available at http://www.mapa.es/es/alimentacion/pags/consumo/resumen.htm, as of March 3, 2009)
47 La Alimentación en España 2007- Lugar Donde Compran los Hogares ,the Spanish Ministry of the Environment, Rural and Marine Affairs (MARM). Nov 2008 (available at http://www.mapa.es/es/alimentacion/pags/consumo/resumen.htm, as of March 3, 2009)
48 La Alimentación en España 2007- Hábitos de Compra ,the Spanish Ministry of the Environment, Rural and Marine Affairs (MARM). Nov 2008 (available at http://www.mapa.es/es/alimentacion/pags/consumo/resumen.htm, as of March 3, 2009)
49 Calatraba Requena, J., Análisis de situación, prospectiva y potencial del consumo y de la demanda de aceites de oliva en España: comportamiento de los consumidores y estudio de los factores que lo determinan, National Institute of Agricultural and Food Technology Research (INIA), Subprogramme VII, 2002 (available at: http://www.inia.es/inia/contenidos/redestem/proyectos/detalle.jsp?tema=oliva&raiz=354&idredestemproyecto=64)
50 Van Gerpen, J., Shanks, B., and Pruszko, R. (Iowa State University), Clements, D. (Renewable Products Development Laboratory) Knothe, G.(USDA/NCAUR), Biodiesel Production Technology, National Renewable Energy Laboratory, Colorado (USA), Subcontractor report, NREL/SR-510-36244, August 2002-January 2004
51 Olive Oil and Health. Quiles, J.L., Wallingford, Oxfordshire, UK: CABI Publishing, 2006.
52 Lee, J.H., Kwon, C.H., Kang, J.W., Park, C., Tae, B., Kim, S.W., Biodiesel Production from Various Oils Under Supercritical Fluid Conditions by ‘Candida antartica’ Lipase B Using a Stepwise Reaction Method, Applied Biochemistry and Biotechnology, Humana Press, 2009.
53 Sanchez, F., Vasudevan, P., Enzyme Catalyzed Production of Biodiesel From Olive Oil, Applied Biochemistry and Biotechnology, Humana Press, 2006.
54 Busch, G., Großmann, J., Sieber, M., Burkhardt, M., A New and Sound Technology for Biogas from Solid Waste and Biomass, Water Air Soil Pollution: Focus, Springer, 2008
55 Hernández Laguna, E., López Bermúdez, F, Alonso Sarría, F, Conesa García, C, Álvarez Rogel, Y., La huella ecológica del cultivo del olivo en España y su aplicabilidad como indicador de agricultura sostenible, Papeles de geografía, No. 39, 2004. Pag: 141-155
56 Cohen-Rosenthal, E., Making sense out of industrial ecology: a framework for analysis and action, Journal of Cleaner Production No.12, 2004. Pages 1111-1123.
57 Hendriks, C., Obernosterer, R., Müller, D., Kytzia, ., Baccini. P., Brunner, P.H., Material Flow Analysis: a tool to support environmental policy decision making. Case-studies on the city of Vienna and the Swiss lowlands. Local Environment Vol.5, No.3, 2000. Pages: 311-328
58 Lindqvist A., von Valmborg, F., What can we learn from local substance flow analyses? The review of cadmium flows in Swedish municipalities, Journal of Cleaner Production, No.12., 2004. Pages: 909-918
59 Vogtländer, J.G., Bijma, A., Brezet, H.C., Communicating the eco-efficiency of products and services by means of the eco-costs/value model, Journal of Cleaner Production No. 10, 2002. Pages: 57–67
60 Toshiba group, Factor T Now, a new indicator for products, Toshiba innovation brochure, 2007
61 Erkko, S., Melanen, M., Mickwitz, P., Eco-efficiency in the Finish EMAS reports – a buzz word?, Journal of Cleaner Production No.13, 2005. Pages: 799-813.
62 Corporate Environmental Management, Welford R., Earthscan 2007, UK.
63 Dorado, M. P., Ballesteros, E., Arnal, J. M., Gómez, J., López, F. J., Exhaust emissions from a Diesel engine fueled with transesterified waste olive oil, Fuel No. 82, 2003. Pages: 1311–1315

Page | 88

Page | 89
8. Appendix
Appendix I. Summary tableau for application of EI-99 methodology
Concept Description Amount
(A)
EI-99
(B)
Units req. Result
(A)*(B)
Production
Subtotal
Use
Subtotal
Disposal
Subtotal
Total
Aggregated
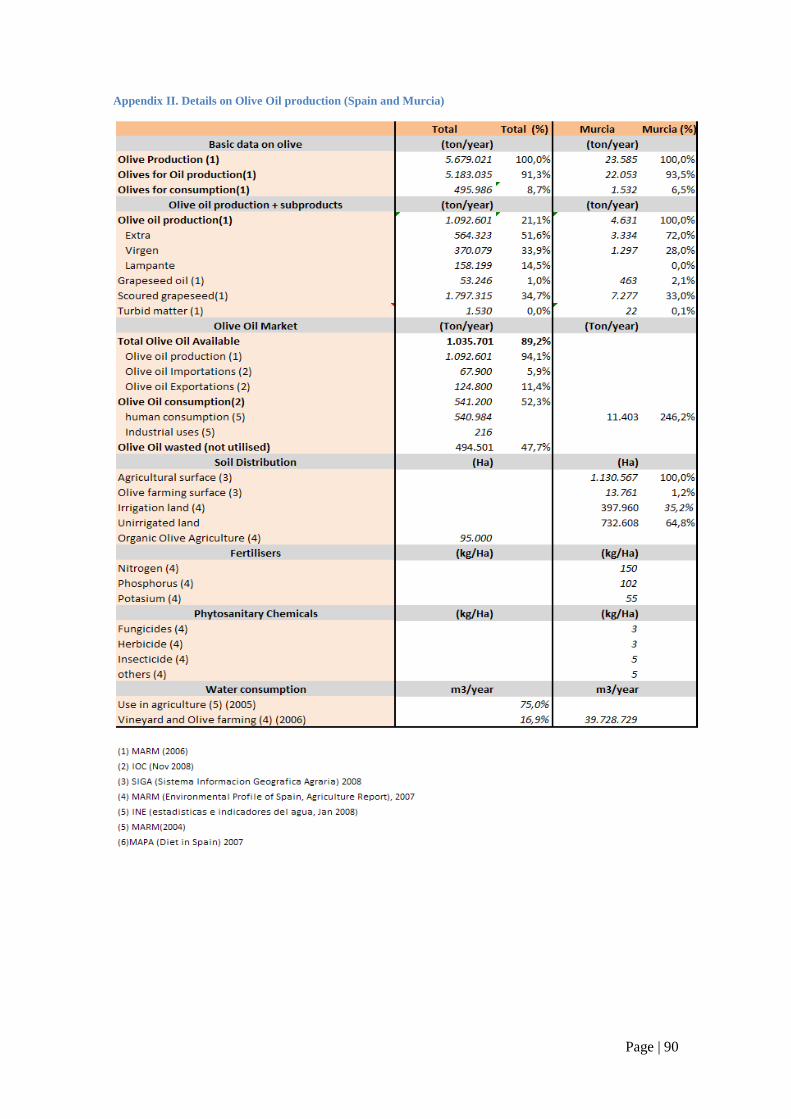
Page | 90
Appendix II. Details on Olive Oil production (Spain and Murcia)
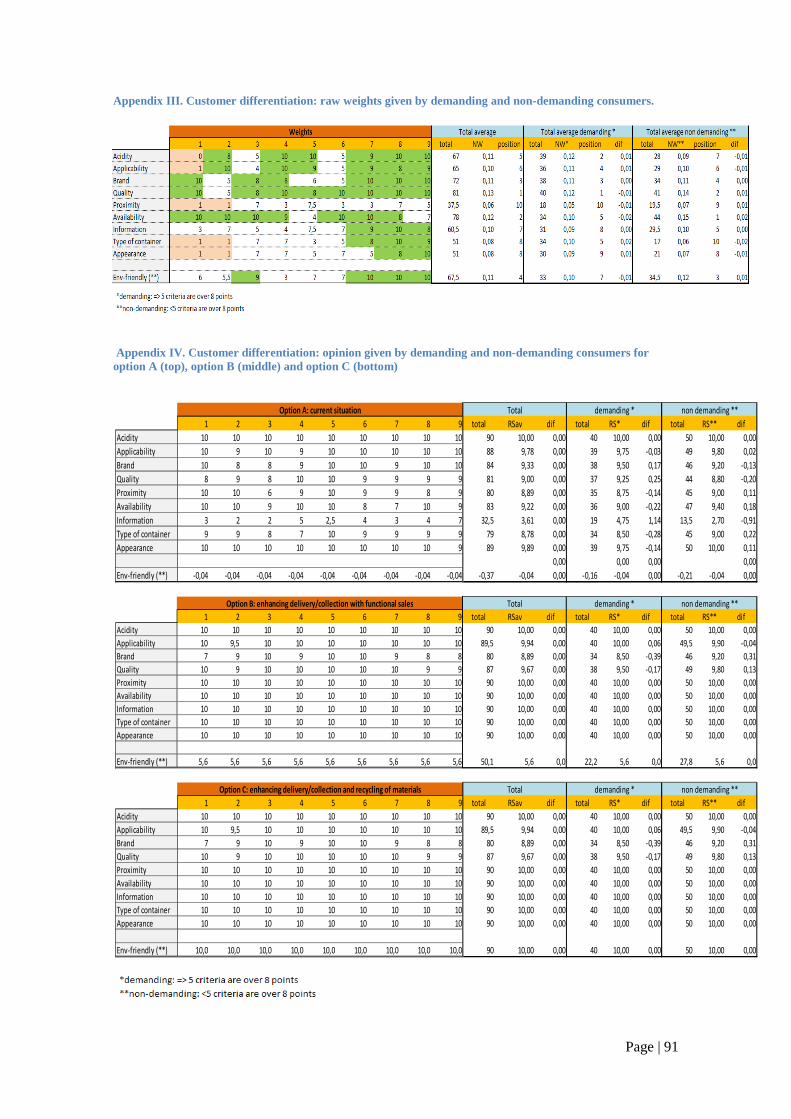
Page | 91
Appendix III. Customer differentiation: raw weights given by demanding and non-demanding consumers.
Appendix IV. Customer differentiation: opinion given by demanding and non-demanding consumers for option A (top), option B (middle) and option C (bottom)
1 2 3 4 5 6 7 8 9 total RSav dif total RS* dif total RS** dif
Acidity 10 10 10 10 10 10 10 10 10 90 10,00 0,00 40 10,00 0,00 50 10,00 0,00
Applicability 10 9 10 9 10 10 10 10 10 88 9,78 0,00 39 9,75 -0,03 49 9,80 0,02
Brand 10 8 8 9 10 10 9 10 10 84 9,33 0,00 38 9,50 0,17 46 9,20 -0,13
Quality 8 9 8 10 10 9 9 9 9 81 9,00 0,00 37 9,25 0,25 44 8,80 -0,20
Proximity 10 10 6 9 10 9 9 8 9 80 8,89 0,00 35 8,75 -0,14 45 9,00 0,11
Availability 10 10 9 10 10 8 7 10 9 83 9,22 0,00 36 9,00 -0,22 47 9,40 0,18
Information 3 2 2 5 2,5 4 3 4 7 32,5 3,61 0,00 19 4,75 1,14 13,5 2,70 -0,91
Type of container 9 9 8 7 10 9 9 9 9 79 8,78 0,00 34 8,50 -0,28 45 9,00 0,22
Appearance 10 10 10 10 10 10 10 10 9 89 9,89 0,00 39 9,75 -0,14 50 10,00 0,11
0,00 0,00 0,00 0,00
Env-friendly (**) -0,04 -0,04 -0,04 -0,04 -0,04 -0,04 -0,04 -0,04 -0,04 -0,37 -0,04 0,00 -0,16 -0,04 0,00 -0,21 -0,04 0,00
Option A: current situation Total demanding * non demanding **
1 2 3 4 5 6 7 8 9 total RSav dif total RS* dif total RS** dif
Acidity 10 10 10 10 10 10 10 10 10 90 10,00 0,00 40 10,00 0,00 50 10,00 0,00
Applicability 10 9,5 10 10 10 10 10 10 10 89,5 9,94 0,00 40 10,00 0,06 49,5 9,90 -0,04
Brand 7 9 10 9 10 10 9 8 8 80 8,89 0,00 34 8,50 -0,39 46 9,20 0,31
Quality 10 9 10 10 10 10 10 9 9 87 9,67 0,00 38 9,50 -0,17 49 9,80 0,13
Proximity 10 10 10 10 10 10 10 10 10 90 10,00 0,00 40 10,00 0,00 50 10,00 0,00
Availability 10 10 10 10 10 10 10 10 10 90 10,00 0,00 40 10,00 0,00 50 10,00 0,00
Information 10 10 10 10 10 10 10 10 10 90 10,00 0,00 40 10,00 0,00 50 10,00 0,00
Type of container 10 10 10 10 10 10 10 10 10 90 10,00 0,00 40 10,00 0,00 50 10,00 0,00
Appearance 10 10 10 10 10 10 10 10 10 90 10,00 0,00 40 10,00 0,00 50 10,00 0,00
Env-friendly (**) 5,6 5,6 5,6 5,6 5,6 5,6 5,6 5,6 5,6 50,1 5,6 0,0 22,2 5,6 0,0 27,8 5,6 0,0
Option B: enhancing delivery/collection with functional sales Total demanding * non demanding **
1 2 3 4 5 6 7 8 9 total RSav dif total RS* dif total RS** dif
Acidity 10 10 10 10 10 10 10 10 10 90 10,00 0,00 40 10,00 0,00 50 10,00 0,00
Applicability 10 9,5 10 10 10 10 10 10 10 89,5 9,94 0,00 40 10,00 0,06 49,5 9,90 -0,04
Brand 7 9 10 9 10 10 9 8 8 80 8,89 0,00 34 8,50 -0,39 46 9,20 0,31
Quality 10 9 10 10 10 10 10 9 9 87 9,67 0,00 38 9,50 -0,17 49 9,80 0,13
Proximity 10 10 10 10 10 10 10 10 10 90 10,00 0,00 40 10,00 0,00 50 10,00 0,00
Availability 10 10 10 10 10 10 10 10 10 90 10,00 0,00 40 10,00 0,00 50 10,00 0,00
Information 10 10 10 10 10 10 10 10 10 90 10,00 0,00 40 10,00 0,00 50 10,00 0,00
Type of container 10 10 10 10 10 10 10 10 10 90 10,00 0,00 40 10,00 0,00 50 10,00 0,00
Appearance 10 10 10 10 10 10 10 10 10 90 10,00 0,00 40 10,00 0,00 50 10,00 0,00
Env-friendly (**) 10,0 10,0 10,0 10,0 10,0 10,0 10,0 10,0 10,0 90 10,00 0,00 40 10,00 0,00 50 10,00 0,00
Option C: enhancing delivery/collection and recycling of materials Total demanding * non demanding **