Embed Size (px)
Citation preview

Master Thesis in Entrepreneurship
Do National and Entrepreneurial Framework Conditions influence
economic growth? Using path analysis (PA) on the example of Nordic
countries between the years 2005-2014
Author: Andrea Slabenakova
Supervisor: Erik Rosell
Examiner: Daniel Ericsson
Date: 2016
Subject: Degree Project
Level: Master Thesis
Course code: 4FE16E

i
Abstract
This paper investigates whether national and entrepreneurial framework conditions
positively affect economic growth via its effects on entrepreneurial activity more
significantly than via its effects on technological innovation intensity1. The revised
GEM conceptual model is tested for a sample of Nordic countries (Norway, Finland,
Sweden, Denmark, Iceland), between the years 2005-2014, using path analysis. The
variables representing national and entrepreneurial framework conditions,
entrepreneurial activity, technological innovation intensity and economic growth are
Global Competitiveness Index (which includes also number of procedures to start a
business and number of days to start a business, venture capital availability etc.), self-
employed workers (expressed as % of total employed), RD expenditures (expressed as
% of GDP) and GDP per capita. In each of the models, the author finds out a positive
effect of national and entrepreneurial framework conditions. The hypotheses stating the
positive indirect influence of national and entrepreneurial framework conditions on
economic growth via entrepreneurial activity (H1) and the positive indirect influence of
national and entrepreneurial framework conditions via technological innovation
intensity (H2) have been accepted. The calculated total effect on economic growth
indicates that the path via entrepreneurship (H1) is more significant (H3).
Keywords
Economic growth, National Framework Conditions, Entrepreneurial Framework
Conditions, GCI, GEM, Path Analysis
JEL classification
M21, O11, O32, O34, O40
Acknowledgement
I would like to thank Erik Rosell and Daniel Ericsson for the contributing remarks and
their expertise during writing this thesis. The most thanks belong to my parents for
believing in me all the time and for their support.
1 Revised GEM Conceptual Model, 2015/2016

ii
Contents
1 Introduction _________________________________________________________ 1
2 Theoretical Background _______________________________________________ 3
2.1 Role of National Framework Conditions and Business Environment in Process of
Economic Growth: Introductory Frameworks ______________________________ 3
2.1.1 Linking entrepreneurship and economic growth ______________________ 3
2.1.2 Framework of Entrepreneurship at the macro level ___________________ 5
2.1.3 Nordic Growth Entrepreneurship Review (NGER) Model ______________ 6
2.1.4 Cultural Norms and Institutions __________________________________ 7
2.2 Global Entrepreneurship Monitor (GEM) ______________________________ 9
2.2.1 The Revised GEM Conceptual Model ______________________________ 9
2.2.2 Description of the Model _______________________________________ 11
3 Research Techniques and Methodology _________________________________ 18
4 Path Analysis _______________________________________________________ 20
4.1 Path diagram ____________________________________________________ 20
4.2 Data ___________________________________________________________ 21 4.3 Stationarity _____________________________________________________ 24 4.4 Results ________________________________________________________ 25
4.5 Standardized beta coefficients ______________________________________ 28
Conclusion ___________________________________________________________ 31
References ___________________________________________________________ 34
Online References _____________________________________________________ 35
1
1 Introduction
Since the world becomes more interconnected and disparities between the
countries intensify, policy makers, business leaders, academics and other globally
minded citizens, all of them, require a better understanding of the forces that contribute
to economic growth.
One of the pivotal aim of policy makers is to generate economic growth and
create employment. There are many economic and non-economic variables that
influence economic growth (climate, schooling, rule of law index, inflation, ethnic
diversity, saving propensity, political freedom, etc.) (Bleaney and Nishiyama, 2002;
Sala-i-Martin, 1997). Unfortunately, entrepreneurship has failed to be included in this
list of variables. One reason that entrepreneurship disappeared from economic theory is
that it did not play any role in neoclassical growth models as in Solow growth model
(Solow, 1970). This growth model assumes that technological improvement is
exogenous and not dependent of economic incentives (Carree, Thurik 2002).
Endogenous theory of economic growth (explicitly focused on the -human- capital
formation and innovation) tries to fit entrepreneurship and innovation into growth
models but entrepreneurship still remains mainly implicit. Moreover, this theory does
not shed light on the conditions of the entrepreneurial activity necessary for the capital
formation and innovation (Wennekers, Thurik, 1999).
The positive contribution of entrepreneurship on economic growth has been
already proved by many scholars in entrepreneurial studies (Carree and Thurik, 2010;
Van Praag and Versloot, 2007). Both, entrepreneurship and innovation are conceived to
be the powerful drivers of economic growth and job creation (Europa, 2016).
Should Nordic economic policy makers be primarily focused on
entrepreneurship ecosystem or on innovation-friendly environment? The main aim of
this paper is to find out if national and entrepreneurial framework conditions positively
affect economic growth via its effects on entrepreneurial activity more significantly than
via its effects on technological innovation intensity. It is tested for a sample of Nordic
countries (Norway, Finland, Sweden, Denmark, Iceland), between the years 2005–2014.
The author tests national and entrepreneurial framework conditions of the
revised GEM model, because the GEM´s unique contribution is to describe, in detail,
the conditions under which entrepreneurship and innovation can thrive.

2
In addition, the revised GEM model has not been tested before by using
path analysis. Nordic countries have been chosen because firstly, this kind of study has
not been done before for Nordic countries as well and secondly, Nordic countries have a
higher GDP per capita than the EU, therefore, it seems reasonable to choose Nordic
countries. In Norway, GDP per capita is double the size of the EU. Then, followed by
Sweden, Iceland, Denmark and Finland with more or less the same figures (Norden,
2016)
Figure 1: Gross domestic product (GDP) per person in PPS (Purchasing Power Standards)
Source: Norden (2016)
The paper is divided into a theoretical and empirical part. First, the author is
going to describe a pivotal role of national framework conditions and business
environment in a process of economic growth according to the previous studies.
Second, the author is going to present the Global Entrepreneurship Monitor
(GEM) and its revised conceptual model. The author chooses to test this model because
it complements widely known global competitiveness model and explains the role of a
range of national and entrepreneurial framework conditions in the process of economic
growth in one framework.
At the beginning of the empirical part, the author is going to visualize two path
diagrams and then, the author will estimate the path coefficients representing the
relationship between national framework conditions, entrepreneurial framework
conditions, entrepreneurial activity, technological innovation intensity and economic
growth.

3
2 Theoretical Background
The theoretical background comprises two parts. Firstly, it presents introductory
frameworks, how scholars describe the role of national framework conditions and
business environment in the process of economic growth.
Secondly, the paper focuses on presentation of the revised GEM conceptual
model because previous research did not undertake such detailed explanation what can
be imagined under national framework conditions and business environment in the
process of economic growth. Also, visual presentation of the revised GEM conceptual
model is provided for better understanding of the model.
2.1 Role of National Framework Conditions and Business Environment in Process of Economic Growth: Introductory Frameworks
For understanding the role of national framework conditions and business
environment in the process of economic growth, it requires introductory frameworks.
These frameworks are adopted because there is usually no direct link between national
framework conditions and business environment and economic growth. That is why it is
needed to have different intermediate variables or linkages explaining how national
framework conditions and business environment are linked to economic growth.
See Figure 2, Figure 3, Figure 4 and Figure 5 where existing empirical literature
on the role of national framework conditions and business environment in the process of
economic growth, is provided.
2.1.1 Linking entrepreneurship and economic growth
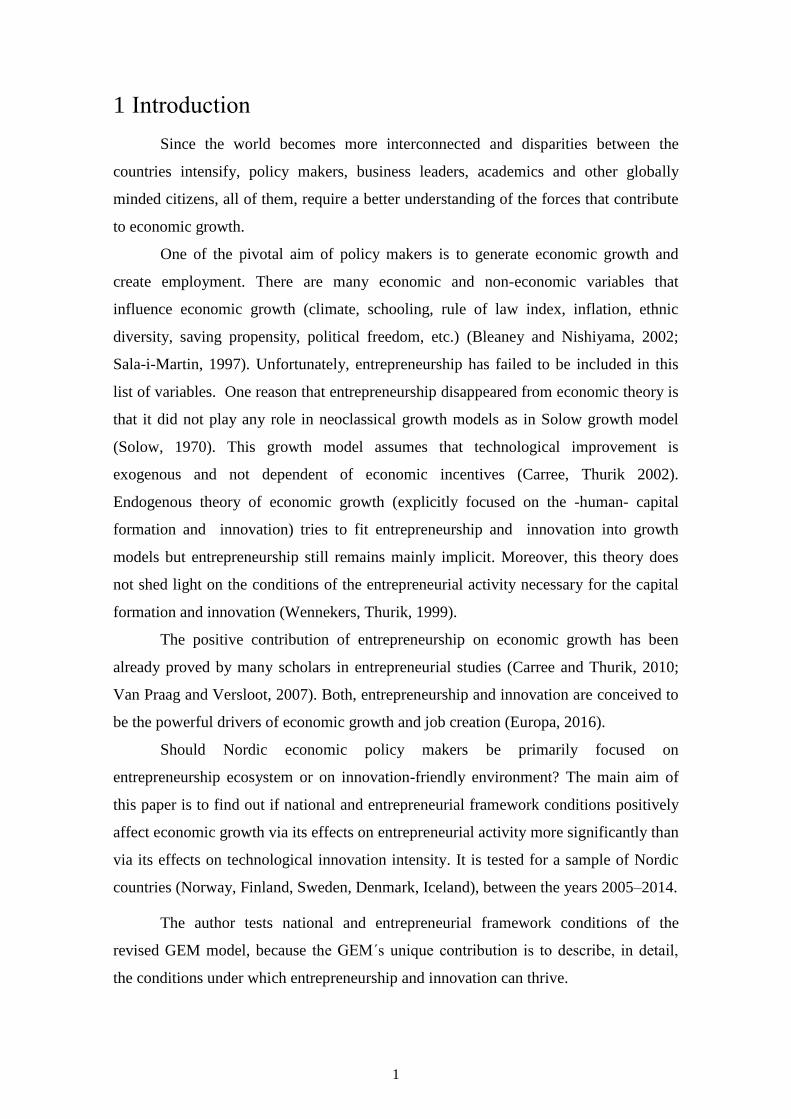
In discussing the first introductory framework, the author concentrates on
entrepreneurship and economic growth and what factors link them together. Figure 2
illustrates a framework inspired by many insights in the literature.
It is also necessary to take into account wider ranging relationships. More
concretely, linking entrepreneurship to economic growth means linking the individual
level to the firm and the macro level.
4
Figure 2: Linking entrepreneurship and economic growth
Source: Wennekers, Thurik (1999)
The outcome of these dynamic processes is determined by a set of conditions.
Given entrepreneurial endowments, environment, in which an entrepreneur carries out
the entrepreneurial activity, represents these conditions. Firstly, this refers to national
cultural environment (open-mindedness, acceptance of risk, etc.) and internal culture of
corporations (business culture – open-mindedness, proactiveness, trust in employees,
internal rules and procedures, incentives).
Secondly, institutional framework (property rights, incentives, competition rules,
entry barriers) on the firm level and national level defines the incentives for individuals
to turn ambitions into actions. Institutional framework also determines to which extent
unnecessary barriers will hamper these individuals. Thurik and Wennekers (1999)
highlight that the importance of institutions, for the development of entrepreneurship, is
paramount and that it deserves further study.
On the firm level, entrepreneurial action needs a vehicle that transforms the
person qualities into actions. Small firms where an entrepreneur has a controlling stake
can be the vehicle. Larger firms mimic small firms by introducing corporate
entrepreneurship. The outcome of entrepreneurial activities on the firm level is
“newness” (newness through product, process and organizational innovation, entry into
new markets, innovative business start-up).
At the aggregate level (industries, regions and national economies), many
individual entrepreneurial actions are characterised by new experiments. The process of
competition occurs continuously between the variety of new ideas and it leads to the
selection of the most viable firms and industries. Then, variety, competition, selection
5
and imitation expand and transform the productive potential of a regional or national
economy (replacement or displacement of obsolete firms, higher productivity,
expansion of new niches and industries) Moreover, it enhances international
competitiveness and its market share (Carree and Thurik, 2002).
There are also important feedback mechanisms. Competition and selection,
amidst variety, enable individuals and firms to learn from the own and other´s successes
and failures. This learning process also increases the individuals´ skills and adapt their
attitudes. (Thurik, Wennekers, 1999). Thurik and Wennekers (1999) assume that
outcome of this chain of variables linking the individual level to the macro level is
economic growth.
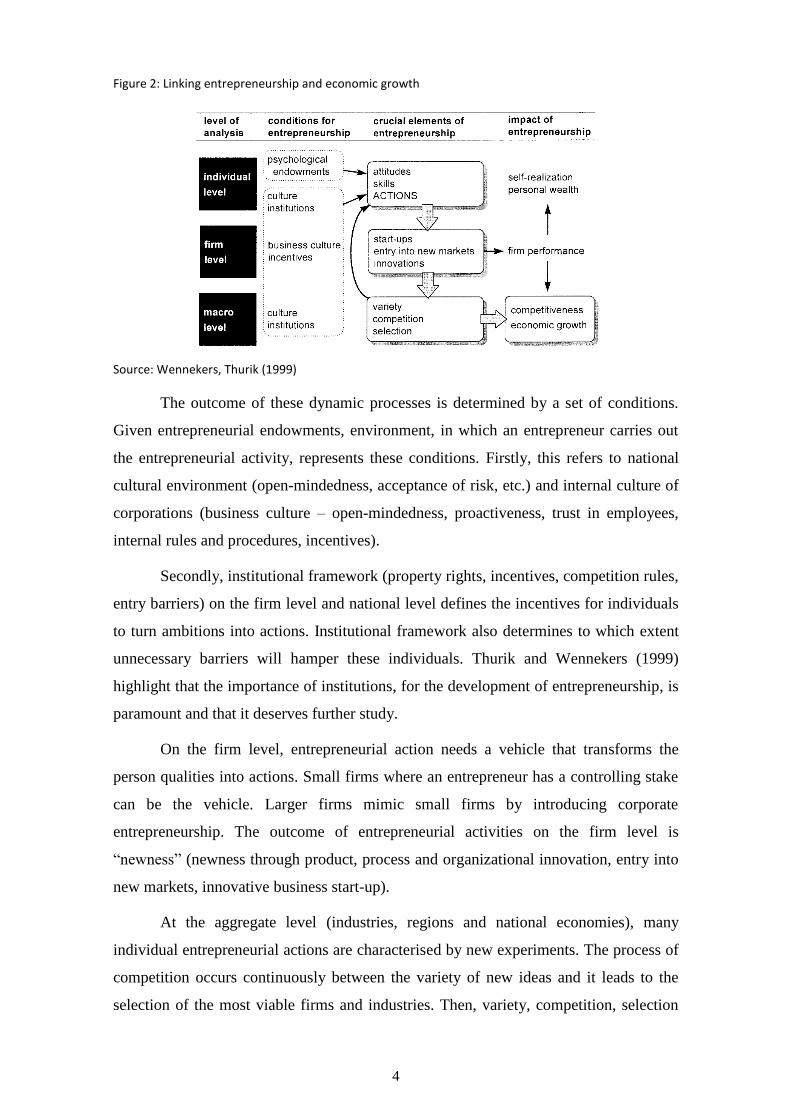
2.1.2 Framework of Entrepreneurship at the macro level
Figure 3 depicts the framework at the macro level. The first part of
framework explains how various conditions as technological, economic, demographic,
cultural and institutional exert the influence on nascent entrepreneurship (the attempt to
establish a new company) by way of individual occupational choice.
Figure 3: A Framework of Entrepreneurship at Macro Level
Source: Wennekers, Uhlaner, Thurik (2002)
In the second part of framework, Wennekers, Uhlaner and Thurik (2002)
shed light on how nascent entrepreneurship influence the actual rate of business
ownership.
6
The third part explains the linkages between nascent entrepreneurship,
start-ups and business ownership and economic growth at the individual, firm and
macro level.
Individuals choose between the wage-employment and business
ownership by assessing potential financial and non-financial rewards and risks. The
assessment of potential financial and non-financial rewards and risks are influenced by
the perception of opportunities and personal capabilities and preferences. These
occupational choices have the impact on nascent entrepreneurship. The framework also
links technology, economic development, demography, institutions, and culture with the
individual assessments through either demand-side (opportunities available for starting
a business) of entrepreneurship or supply-side (pool of individuals with capabilities and
preferences to start a business) (Thurik, Wennekers and Uhlaner, 2002). The nascent
entrepreneurs are those who intent and/or intensively try to start a business. Thurik,
Wennekers and Uhlaner (2002) highlight that only certain proportion of entrepreneurs
succeed in setting up and running the business. They express this proportion, in their
model, by the variable -start-ups- that represent the firms which are entering market
(firm level variable). They also state that merely some proportion of new firms foster
innovation (introducing new products, finding new ways of producing and/or delivering
existing products and delivering goods).
Then, start-ups start restructuring an economy through adoptive reaction
such as business exits, mergers, reengineering (diffusion) and new innovations by
incumbents. Decisions that lead to these reactions are made on firm level but the
accumulated effects also influence the aggregate level. The accumulated effect of these
start-ups, change the structure of industry in the term of number of businesses (the rate
of business ownership). This restructuralization takes place at the aggregate level of
sectors, regions and national economies. The new industry structure is crucial input for
variety and competition at aggregate level. New industrial constellations lead to the new
forms of static and dynamic competition, when new products and processes are
manifested (innovation). This variety and competition has the impact on the process of
restructuring through selection of the most viable firms and the best ideas.
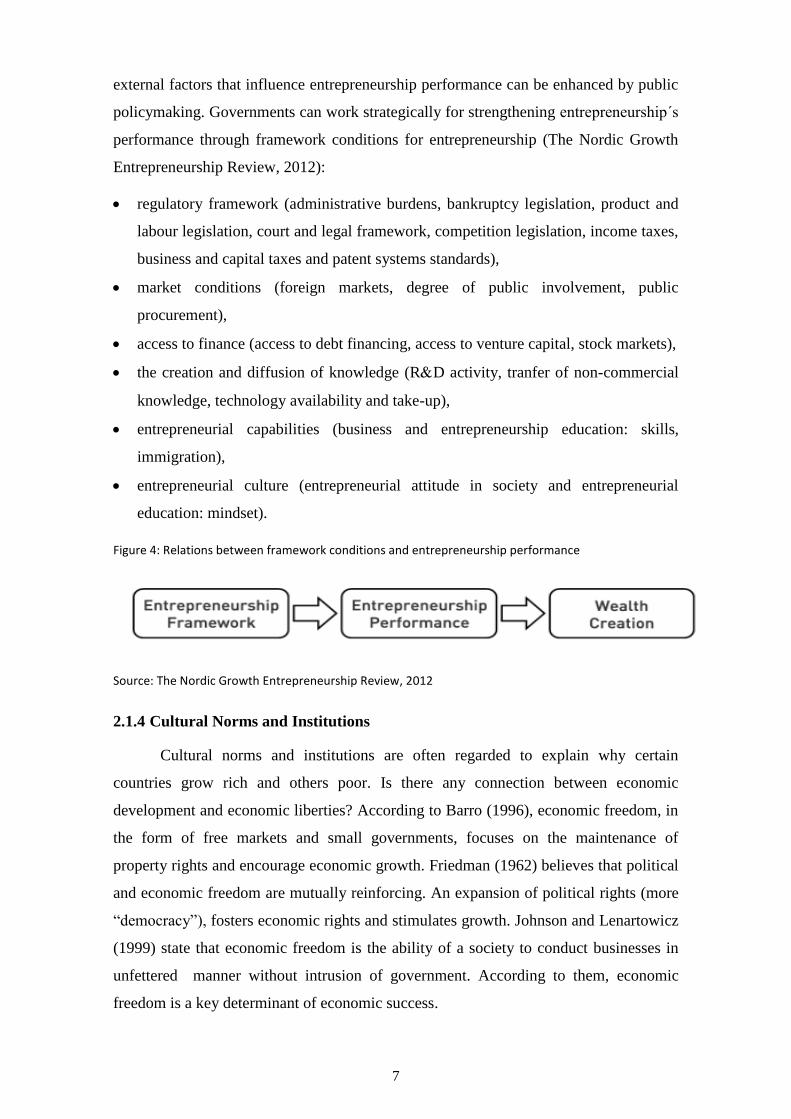
2.1.3 Nordic Growth Entrepreneurship Review (NGER) Model
According to the Nordic Growth Entrepreneurship Review (NGER) model, the
companies´ entrepreneurship performance is viewed as a driver of wealth creation. The
7
external factors that influence entrepreneurship performance can be enhanced by public
policymaking. Governments can work strategically for strengthening entrepreneurship´s
performance through framework conditions for entrepreneurship (The Nordic Growth
Entrepreneurship Review, 2012):
regulatory framework (administrative burdens, bankruptcy legislation, product and
labour legislation, court and legal framework, competition legislation, income taxes,
business and capital taxes and patent systems standards),
market conditions (foreign markets, degree of public involvement, public
procurement),
access to finance (access to debt financing, access to venture capital, stock markets),
the creation and diffusion of knowledge (RD activity, tranfer of non-commercial
knowledge, technology availability and take-up),
entrepreneurial capabilities (business and entrepreneurship education: skills,
immigration),
entrepreneurial culture (entrepreneurial attitude in society and entrepreneurial
education: mindset).
Figure 4: Relations between framework conditions and entrepreneurship performance
Source: The Nordic Growth Entrepreneurship Review, 2012
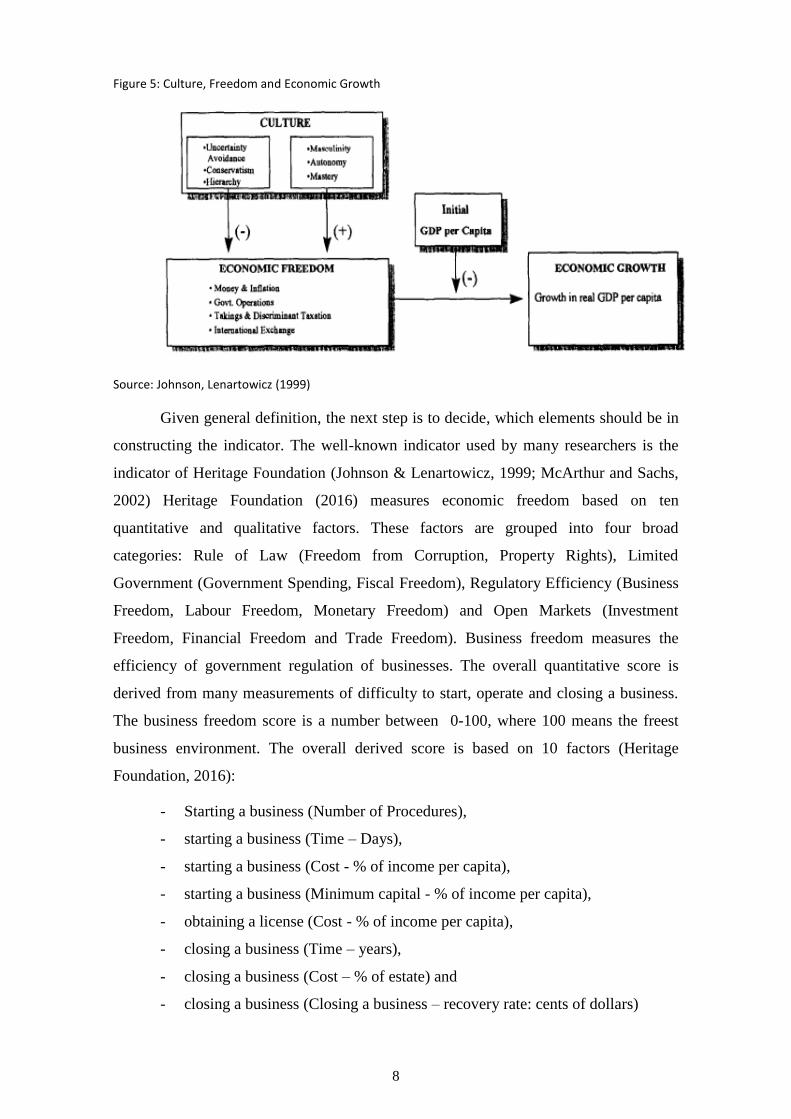
2.1.4 Cultural Norms and Institutions
Cultural norms and institutions are often regarded to explain why certain
countries grow rich and others poor. Is there any connection between economic
development and economic liberties? According to Barro (1996), economic freedom, in
the form of free markets and small governments, focuses on the maintenance of
property rights and encourage economic growth. Friedman (1962) believes that political
and economic freedom are mutually reinforcing. An expansion of political rights (more
“democracy”), fosters economic rights and stimulates growth. Johnson and Lenartowicz
(1999) state that economic freedom is the ability of a society to conduct businesses in
unfettered manner without intrusion of government. According to them, economic
freedom is a key determinant of economic success.
8
Figure 5: Culture, Freedom and Economic Growth
Source: Johnson, Lenartowicz (1999)
Given general definition, the next step is to decide, which elements should be in
constructing the indicator. The well-known indicator used by many researchers is the
indicator of Heritage Foundation (Johnson & Lenartowicz, 1999; McArthur and Sachs,
2002) Heritage Foundation (2016) measures economic freedom based on ten
quantitative and qualitative factors. These factors are grouped into four broad
categories: Rule of Law (Freedom from Corruption, Property Rights), Limited
Government (Government Spending, Fiscal Freedom), Regulatory Efficiency (Business
Freedom, Labour Freedom, Monetary Freedom) and Open Markets (Investment
Freedom, Financial Freedom and Trade Freedom). Business freedom measures the
efficiency of government regulation of businesses. The overall quantitative score is
derived from many measurements of difficulty to start, operate and closing a business.
The business freedom score is a number between 0-100, where 100 means the freest
business environment. The overall derived score is based on 10 factors (Heritage
Foundation, 2016):
- Starting a business (Number of Procedures),
- starting a business (Time – Days),
- starting a business (Cost - % of income per capita),
- starting a business (Minimum capital - % of income per capita),
- obtaining a license (Cost - % of income per capita),
- closing a business (Time – years),
- closing a business (Cost – % of estate) and
- closing a business (Closing a business – recovery rate: cents of dollars)

9
Where framework of linking entrepreneurship and economic growth, framework
of entrepreneurship at the macro level, Nordic Growth Entrepreneurship Review Model
and framework of culture, freedom and economic growth were focus in the previous
sections, the paper will now focus upon the well-known Global Entrepreneurship
Monitor (GEM) and its revised conceptual model.
2.2 Global Entrepreneurship Monitor (GEM)
The Global Entrepreneurship Monitor (GEM) was presented in September 1999
as a joint research initiative by Babson College and London Business School. The core
aim was to bring together the best world´s scholars in entrepreneurship for studying
comprehensive relationship between entrepreneurship and economic growth. The GEM
research design includes data from national secondary sources, adult population
surveys, in-depth interviews with the key informants in each participating country. For
understanding the role of entrepreneurship in economic growth, the GEM defined
entrepreneurship as: “…Any attempt at new business or new venture creation, such as
self-employment, a new business organization, or the expansion of an existing business,
by an individual, a team of individuals, or an established business…” (Reynolds et al.,
1999, p. 3) For understanding its core aim, GEM developed a conceptual model
(Reynolds et al, 1999).
2.2.1 The Revised GEM Conceptual Model
The GEM model was created by Paul Reynolds based on an idea by Michael
Hay in 1997 for the World Enterprise Index that would become the equivalent for an
entreprise and entrepreneurship of IMD´s World Competitiveness Yearbook and the
World Economic Forum´s Global Competitiveness Index (Levie & Autio, 2008).
Reynolds wished to provide the model that complements the Global Competitiveness
Model. It was an alternative to thinking that only large established firms are significant.
After ten years of collecting the empirical evidence, and continuous improvements in
the measurement adopted, GEM researchers revised the GEM model for reflecting the
comprehensiveness of the casual interdependence between entrepreneurship and
economic development globally (Bosma et al., 2010).
The GEM conceptual model is based on the concept that the contribution of
entrepreneurs to an economic growth varies according to the phase of economic
development, which drives the institutional settings to certain extent.
10
The GEM distinguishes economies that participate in the study as factor-driven,
efficiency-driven and innovation-driven. These categories are based on the World
Economic Forum´s Global Competitiveness Report that recognizes three phases of
economic development based on GDP per capita and the share of exports consisting of
primary goods (Kelley et al., 2015/2016).
According to World Economic Forum (WEF) classification, in the first stage of
development, the economy is factor-driven and countries compete based on their factor
endowment. The factor endowment is represented mainly by unskilled labour and
natural resources. For maintaining the competitiveness, it is necessary to focus on well-
functioning private and public institutions, on well-developed infrastructure, a stable
macroeconomic environment and healthy workforce that has at least basic education. As
far as the economy becomes more competitive, productivity and subsequently wage will
increase with advancing development. Afterwards, the countries will move into the
efficiency-driven phase.
In the efficiency-driven phase, countries have to start with more efficient
production processes and increase the quality of products because wages have risen and
they cannot raise the prices of the products. In this stage, the increasing competitiveness
is driven by higher education and training, efficient good markets, well-functioning
labour markets, developed financial markets, the capability to harness the benefits of
existing technologies and finally, a large domestic/foreign market.
According to the World Economic Forum´s Global Competitiveness Report,
Nordic countries belong to the innovation-driven economies (Schwab et al., 2015/2016).
In the innovation-driven phase, businesses are more knowledge-intensive and the
service sector expands. The wages raise so much that to be able to sustain those wages
and the associated standard of living is only possible if the businesses are able to
compete through the most sophisticated production processes and to modern the old
ones. (Schwab et al., 2015/2016).
According to Acs (Acs, 2006), entrepreneurial economies should strengthen
technology transfer, make early-stage funding available and support entrepreneurial
activity at the state, corporate and university level. Moreover, higher education system
should play the important role in research and development and technology
commercialization.
11
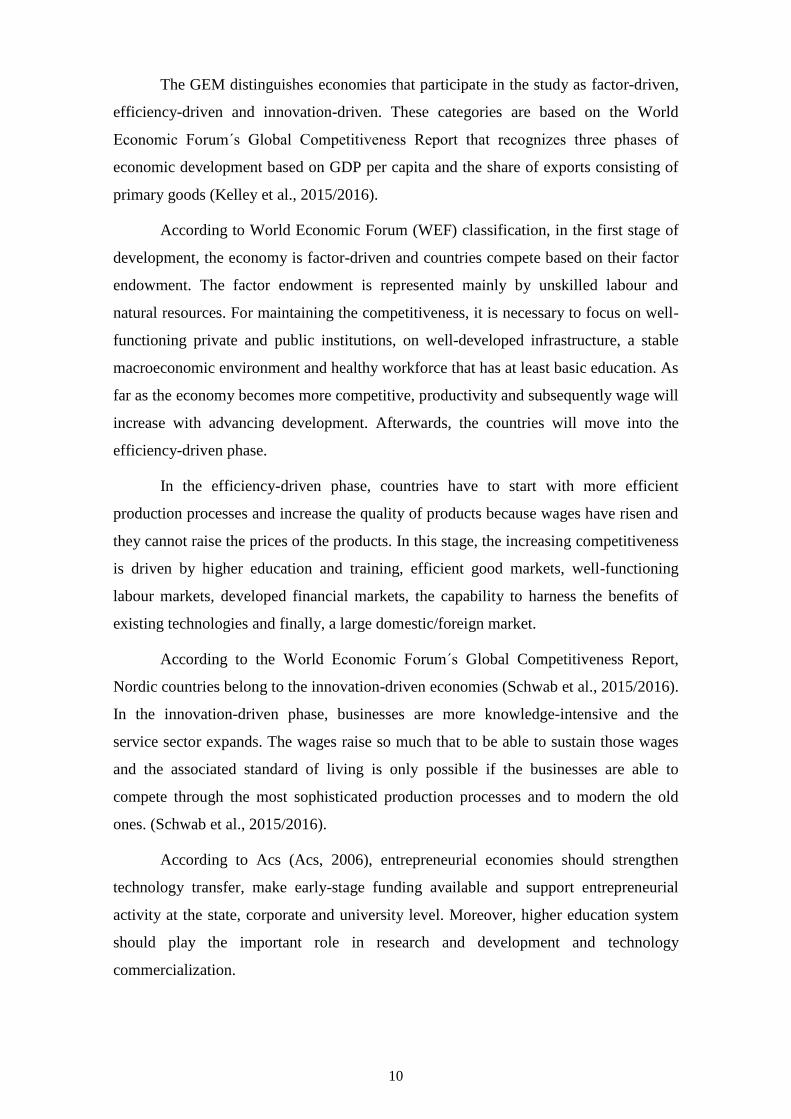
Table 1: National Framework Conditions
Economic
development
phases
National Framework Conditions based on World Economic Forum pillars for
profiling economic development phases
Key to Innovation-
driven economies Business
sophistication
Two linked elements
The quality of country´s overall business networks (measured by the quality and quantity of local suppliers and the extent of their interaction)
The quality of individual firms´ operations and strategies
Innovation Investment in research and development (R&D)
The presence of high quality scientific research institutions
Extensive collaboration in R&D between universities and industry
Protection of intellectual property
Source: Singer et al., 2014
2.2.2 Description of the Model
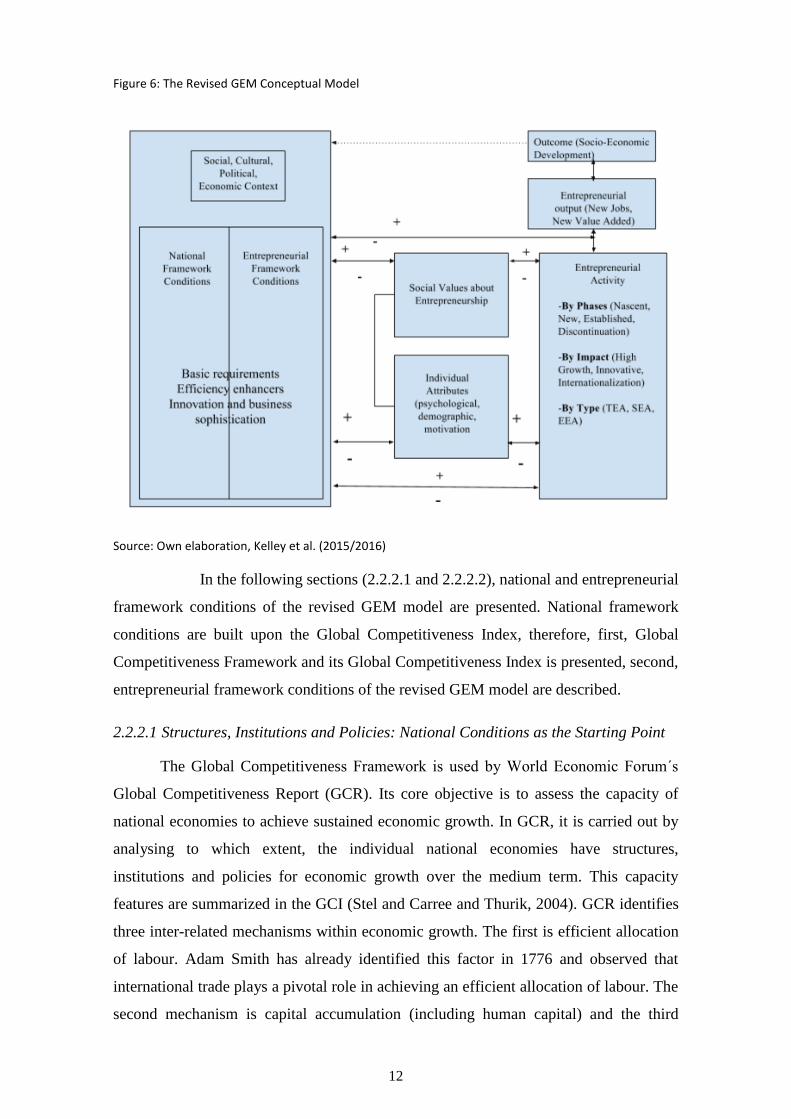
In the model, social, cultural, political and economic context is represented by
national framework conditions and entrepreneurial framework conditions. The latter is
conceived to influence the entrepreneurial activity more directly.
Social values about entrepreneurship cover how a society values
entrepreneurship as a good career choice, whether entrepreneurs have a high social
status and whether media attention to entrepreneurship is contributing to the
development of a national entrepreneurship culture.
Individual attributes comprise demographic characteristics (age, gender, etc.)
self-perception (how entrepreneurs perceive capabilities and opportunities, fear of
failure and if the entrepreneur is opportunity/necessity driven for starting a new
business.
Entrepreneurial activity encompasses multiple phases of the business process,
potential impact and the kind of activity: TEA (Total Early-Stage Entrepreneurial
Activity), SEA (Social Entrepreneurial Activity) and EEA (Employee Entrepreneurial
Activity) (Kelley et al., 2015/2016).
Entrepreneurial output (job creation, internationalization, innovation) is
characterized by potential impact of entrepreneurial activity.
12
Figure 6: The Revised GEM Conceptual Model
Source: Own elaboration, Kelley et al. (2015/2016)
In the following sections (2.2.2.1 and 2.2.2.2), national and entrepreneurial
framework conditions of the revised GEM model are presented. National framework
conditions are built upon the Global Competitiveness Index, therefore, first, Global
Competitiveness Framework and its Global Competitiveness Index is presented, second,
entrepreneurial framework conditions of the revised GEM model are described.
2.2.2.1 Structures, Institutions and Policies: National Conditions as the Starting Point
The Global Competitiveness Framework is used by World Economic Forum´s
Global Competitiveness Report (GCR). Its core objective is to assess the capacity of
national economies to achieve sustained economic growth. In GCR, it is carried out by
analysing to which extent, the individual national economies have structures,
institutions and policies for economic growth over the medium term. This capacity
features are summarized in the GCI (Stel and Carree and Thurik, 2004). GCR identifies
three inter-related mechanisms within economic growth. The first is efficient allocation
of labour. Adam Smith has already identified this factor in 1776 and observed that
international trade plays a pivotal role in achieving an efficient allocation of labour. The
second mechanism is capital accumulation (including human capital) and the third
13
mechanism is technological advance. All three mechanisms are very important but
technological advance is pivotal. Without technological advance, the benefits from the
division of labour and higher rate of capital accumulation would led to higher standards
of living, but not to higher economic growth.
Improvements in technology, both new goods and a better manner how to
produce goods, can be accomplished by creating new technology or by adopting and
adapting the technology from abroad. The first process is technological innovation and
the second is technological diffusion. In this regard, the GCR distinguishes core
economies (for example Nordic countries) and non-core economies (for example Czech
Republic). It is stated that economic growth is achieved in different ways in core and
non-core economies. In core economies, the growth is powered by the capacity to
innovate and to win new global markets for the technologically advanced products. The
main innovators, measured for instance by the rate at which they patent new products
and processes, are few in amount (McArthur and Sachs, 2002). High growth rates in
non-core economies are often achieved by rapidly absorbing the advanced technologies
and capital of the core economies. (Stel and Carree and Thurik, 2004). But it is
necessary to highlight that “catch-up” effect has its inherent limits. As a non-core
economy narrows the income gap, its ability to narrow gap gets further to diminish. For
being able to close the income gap fully, the non-core economy has to become
technological innovator (McArthur and Sachs, 2002).
The Global Competitiveness Index (GCI) encompasses a range of explanatory
variables for achieving sustained economic growth (Stel and Carree and Thurik, 2004).
McArthur and Sachs (2002) tested 2001 GCI for a sample of 75 economies. They
investigated the relationship between the GCI and economic growth, during the years
1992-2000, using the following equation: average annual change in GAP = ß0 + ß1 x
GCI + ß2 x natural log (percentage GDP gap in 1992). McArthur and Sachs (2002)
found out that the 2001 GCI had a significantly positive influence on economic growth
over the period 1992-2000. A description of this index could be useful because the
author will use this index in the regression analysis.
The Global Competitiveness Index comprises 114 indicators which captures
concepts that matter for productivity. The indicators are grouped into 12 pillars: (1)
institutions, (2) infrastructure, (3) macroeconomic environment, (4) health and primary
education, (5) higher education and training, (6) goods market efficiency, (7) labour
14
market efficiency, (8) financial market development, (9) technological readiness, (10)
market size, (11) business sophistication and (12) innovation. These indicators are
divided into three sub-indexes: basic requirements, efficiency enhancers and innovation
and sophistication factors. (Schwab et al., 2015/16).
Components of Global Competitiveness Index
1st pillar: Institutions
1.01 Property rights
1.02 Intellectual property protection
1.03 Diversion of public funds
1.04 Public trust in politicians¨
1.05 Irregular payments and bribes
1.06 Judicial independence
1.07 Favoritism in decisions in government
officials
1.08 Wastefulness of government spending
1.09 Burden of government regulation
1.10 Efficiency of legal framework in setting
disputes
1.11 Efficiency of legal framework in
challenging regs
1.12 Transparency of government
policymaking
1.13 Business costs of terrorism
1.14 Business costs of crime and violence
1.15 Organized crime
1.16 Reliability of police services
1.17 Ethical behaviour of firms
1.18 Strength of auditing and reporting
standards
1.19 Efficacy of corporate boards
1.20 Protection of minority shareholders´
interests
1.21 Strength of investor protection, 0-10 best
2nd pillar: Infrastructure
2.01 Quality of overall infrastructure
2.02 Quality of roads
2.03 Quality of railroads infrastructure
2.04 Quality of port infrastructure
2.05 Quality of air transport infrastructure
2.06 Available airline seat km/week, millions
2.07 Quality of electricity supply
2.08 Mobile telephone subscriptions/100 pop.
2.09 Fixed-telephone lines/100 pop.
3rd pillar: Macroeconomic environment
3.01 Government budget balance, % GDP
3.02 Gross national savings, % GDP
3.03 Inflation, annual % change
3.04 General government debt, % GDP
3.05 Country credit ranking, 0-100 (best)
4th pillar: Health and primary education
4.01 Malaria cases/100,000 pop.
4.02 Business impact of malaria
4.03 Tuberculosis cases/100,000 pop.
4.04 Business impact of tuberculosis
4.05 HIV prevalence, % adult pop.
4.06 Business impact of HIV/AIDS
4.07 Infant mortality, deaths/1,000 live births
4.08 Life expectancy, years
4.09 Quality of primary education
4.10 Primary education enrolment, net %
5th pillar: Higher education and training
5.01 Secondary education enrolment, gros %
5.02 Tertiary education enrolment, gros %
5.03 Quality of the education system
5.04 Quality of math and science education
5.05 Quality of management schools
5.06 Internet access in schools
5.07 Availability of specialized training
services
5.08 Extent of staff training
6th pillar: Goods market efficiency
6.01 Intensity of local competition

15
6.02 Extent of market dominance
6.03 Effectiveness of anti-monopoly policy
6.04 Effect of taxation on incentives to invest
6.05 Total tax rate, % profits
6.06 No. Procedures to start a business
6.07 No. Days to start a business
6.08 Agricultural policy costs
6.09 Prevalence of non-tariff barriers
6.10 Trade tariffs, % duty
6.11 Prevalence of foreign ownership
6.12 Business impact of rules on FDI
6.13 Burden of customs procedures
6.14 Imports as a percentage of GDP
6.15 Degree of customer orientation
6.16 Buyer sophistication
7th pillar: Labour market efficiency
7.01 Cooperation in labour-employer relations
7.02 Flexibility in of wage determination
7.03 Hiring and firing practices
7.04 Redundancy costs, weeks of salary
7.05 Effect of taxation on incentives to work
7.06 Pay and productivity
7.07 Reliance on professional management
7.08 Country capacity to retain talent
7.09 Country capacity to attract talent
7.10 Women in labour force, ratio to men
8th pillar: Financial market development
8.01 Availability of financial services
8.02 Affordability of financial services
8.03 Financing through local equity market
8.04 Ease of access to loans
8.05 Venture capital availability
8.06 Soundness of banks
8.07 Regulation of securities exchanges
8.08 Legal rights index, 0-12 best
9th pillar: Technological readiness
9.01 Availability of latest technologies
9.02 Firm-level technology absorption
9.03 FDI and technology transfer
9.04 Individual using Internet, %
9.05 Fixed-broadband Internet subscription/100
pop.
9.06 Int´l Internet bandwidth, kb/s per use
9.07 Mobile broad-band subscriptions/100 pop.
10th pillar: Market size
10.01 Domestic market size index, 1-7 best
10.02 Foreign market size index, 1-7 best
10.03 GDP (PPP$ billions)
10.04 Exports as a percentage of GDP
11th pillar: Business sophistication
11.01 local supplier quantity
11.02 Local supplier quality
11.03 State of cluster development
11.04 Nature of competitive advantage
11.05 Value chain breath
11.06 Control of international distribution
11.07 Production Process sophistication
11.08 Extent of marketing
11.09 Willingness to delegate authority
12th pillar: Innovation
12.01 Capacity for innovation
12.02 Quality of scientific research institutions
12.03 Company spending on R&D
12.04 University-industry collaboration in R&D
12.05 Gov´t procurement of advanced tech
products
12.06 Availability of scientists and engineers
12.07 PCT patents, applications/million pop.
2.2.2.2 Entrepreneurial Framework Conditions
For potential entrepreneurs, who decide about starting a new business, they are
affected by the characteristics within existing business environment. These pillars are

16
called entrepreneurial framework conditions. The entrepreneurial framework conditions
consist of:
1. Entrepreneurial Finance – It represents financial resources (equity, debts) for SMEs.
It includes grants and subsidies as well.
2. Government Policy – The support of public policies towards entrepreneurship. This
entrepreneurial framework condition has two components:
2a. Entrepreneurship as a significant economic issue
2b. Taxes and regulations are either size-neutral or encourage the new and SMEs
3. Government Entrepreneurship Programs – The presence and quality of programs
assigned to SMEs at all levels of government (national, regional, municipal)
4. Entrepreneurship Education – It represents to which extent the training in setting up
and managing SMEs is incorporated in the education and training at all levels.
4a. Entrepreneurship Education at Basic Schools (primary, secondary schools)
4b. Entrepreneurship Education at post-secondary levels (vocational, college,
business schools)
5. Research and Development Transfer (R&D) – It represents to which extent national
research and development lead to new commercial opportunities and if it is available for
SMEs.
6. Commercial and Legal Infrastructure – The presence of property rights, commercial,
accounting and other assessment services and institutions that tend to support SMEs.
7. Entry Regulations – The entry regulations comprise two components:
7a. Market Dynamics: It describes the level of change from year to year
7b. Market Openness: It describes to which extent new firms are free to enter
new markets
8. Physical Infrastructure – It represents the ease of access to communication,
transportation, utilities, and land of space
9. Cultural and Social Norms – It describes if cultural and social norms encourage
actions leading to new business method and creation that can potentially increase the
personal wealth and income (Singer et al., 2014).
17
For the purpose of comparison, the previous sections introduced the
different frameworks on the role of national framework conditions and entrepreneurial
framework conditions in the process of economic growth. The revised GEM conceptual
model is chosen for testing through path analysis from all above models because the
GEM´s unique contribution is to describe and measure, in detail, the conditions under
which entrepreneurship and innovation can thrive. Therefore, for the aims of this paper,
it seems reasonable to choose this conceptual model. Based on the theoretical
background, the author forms these hypotheses:
H1: National framework conditions and entrepreneurial framework conditions
positively affect economic growth via its effects on entrepreneurial activity.
H2: National framework conditions and entrepreneurial framework conditions
positively affect economic growth via its effects on technological innovation intensity.
H3: The positive influence of national framework conditions and entrepreneurial
framework on economic growth via its effects on entrepreneurial activity is more
significant.
According to Van Praag and Versloot (2005), productivity and growth are
measured by (a firm´s or region´s) contribution to a country´s domestic product (GDP)
or GDP growth. For instance, Van Stel, Carree, Thurik (2004) measure economic
growth by GDP growth rates.
GEM´s national framework conditions are drawn upon Global
Competitiveness Index and index has been already explained in section 2.2.
For helping to assess the state of entrepreneurial framework conditions,
GEM designed and implemented a tool: the National Experts´ Survey (NES). The
information provided in Doing Business Report covers some topics which are included
in the GEM expert survey. For example – starting a business – is of important interest of
GEM, as the experts provide subjective valuations on the perceived governmental
support to entrepreneurs. In this paper, the author uses the Global Competitiveness
Index because it also covers number of days to start a business and number of
procedures to start a business, presence of property rights, ease of access to
communication etc.2 (Global Entrepreneurship Monitor, 2012).
Several ways how to measure entrepreneurial activity are known since
Global Entrepreneurship Monitor (2016) does not embed all data necessary for
2 See section 2.2 where the Global Competitiveness Index is explained
18
empirical research. One of the approaches is to use the effect of self-employment rate
on economic growth figures (Blanchflower, 2000) and Carree et al. (2002). The first
advantage is, that while it is not being a direct measure of entrepreneurial activity, it can
be an useful proxy of entrepreneurial activity (Storey, 1991). Secondly, it is available
and it is possible to compare across countries and over time.
Wong and Autio (2005) discuss which variable is convenient as the
measurement of technology innovation intensity. They highlight the ratio of granted
patets to GDP but unfortunately, data source for granted patents were not obtained (only
applications) and hence, the author uses the second variable discussed in Wong´s and
Autio´s paper and it is RD expenditure to GDP. Van Praag and Versloot (2007) also
discuss innovations as a broad concept to which a multitude of indicators is employed.
Concerning a firm´s innovative output (the production of innovations), they highlight
that both measures of its quantity and quality are used. For quantity, commonly research
and development expenditures are used and he has the same opinion as Wong and Autio
(2005) that it measures rather input than output (patents and the introduction of new
products and technologies). The quality of these innovations is often indicated by
patents citations and the importance of innovations. He also states that
commercialization of innovations and also the adoption of innovations are used as
measures of contributions to economic value through innovation.
3 Research Techniques and Methodology
In this paper, following research methods have been used: literature review and
path analysis.
Literature Review – summarizes the current literature on the role of national
framework conditions and business environment in the process of economic growth and
describes, in detail, the Global Entrepreneurship Monitor and its revised conceptual
model and its national framework conditions and entrepreneurial framework conditions.
Path Analysis – this quantitative research method is used to test the revised
GEM conceptual model. Path analysis is a special case of structural equation models
(SEM). SEM are used in a range field of sciences, such as psychology, mineralogy,
palaeontology, chemistry, business administration and economics.
The path analysis begins by assuming a graphical representation (priory known)
of the model through which dependent and independent variables are related. This

19
graphical representation is called path diagram. A path diagram represents the pictorial
representation of a system of simultaneous equations presenting the relationships
assumed to be hold.
In path diagram, we distinguish between these variables:
i. Dependent variables.
ii. Independent variables.
iii. Residuals.
For researchers who are untrained in mathematics these pictures can show
the relationships more obviously than the equations. Path analysis calculates the
strength of the relationship using merely correlation or covariance matrix as input. It is
matter of taste if merely correlation or covariance matrix is used. The relations in the
diagram are the parameters of the equations to be estimated, called path coefficients.
Ordinary Least Squares Method (OLS) is the method most frequently used for path
coefficients estimation. In a path diagram, different symbols and arrows are used for
different kind of variables. The basic notations are:
i. A box symbolizes an observable variable.
ii. An oval symbolizes latent variable.
iii. Residuals are symbolized by a lowercase Greek letter without an outside
border.
iv. A straight arrow is also drawn to each dependent variable from the
dependent variable´s residual.
v. A straight arrow is drawn for a one-directional relation to a dependent
variable
vi. A double headed arrow is drawn between pair of independent variables
hence to have nonzero correlations.
Once the path diagram is obtained; the structure and the parameters of variables are
written in a set of equations.
Finally, the important question here is: What can path analysis do? Within a given
input path diagram, the path analysis can tell which are the more significant paths and
this can have implications for the plausibility of pre-specified causual hypotheses
(University of Exeter, 1997).

20
4 Path Analysis
The empirical part is divided into two parts. Firstly, the paper visualizes
two input path diagrams, then, data source for estimating path coefficients are
presented. Next, parameters of the equations are estimated and written into the output
path diagrams. Finally, the total effect of one variable on another is calculated to find
out the strength of the path and furthermore, the paper investigates which path within
two outcome diagrams is more significant.
4.1 Path diagram
Path diagrams are based on the revised GEM model. The paper supposes that
national framework conditions and entrepreneurial framework conditions affect
economic growth indirectly. The path diagrams are depicted in Figure 7 and Figure 8.
The path diagrams do not investigate latent variables as social values about
entrepreneurship (how society values entrepreneurship as a good career choice, whether
entrepreneurs have the high societal status, whether media positively represents
entrepreneurship in economy), psychological attributes (perceived capabilities,
perceived opportunities, fear of failure) and motivation (necessity driven entrepreneurs
versus opportunity driven entrepreneurs) and demographic characteristics (gender, age
and income of early-stage entrepreneurs) but observed variables.
Figure 7: Input path diagram I based on the GEM Revised Model
Resource: Own elaboration
Entrepreneurial
output
(Technological
Innovation Intensity)
National and
Entrepreneurial
Framework
Conditions
Ɛ2
Socio-Economic
development Ɛ3
Ɛ1
Entrepreneurial
activity (self-
employed)
+
+
+
21
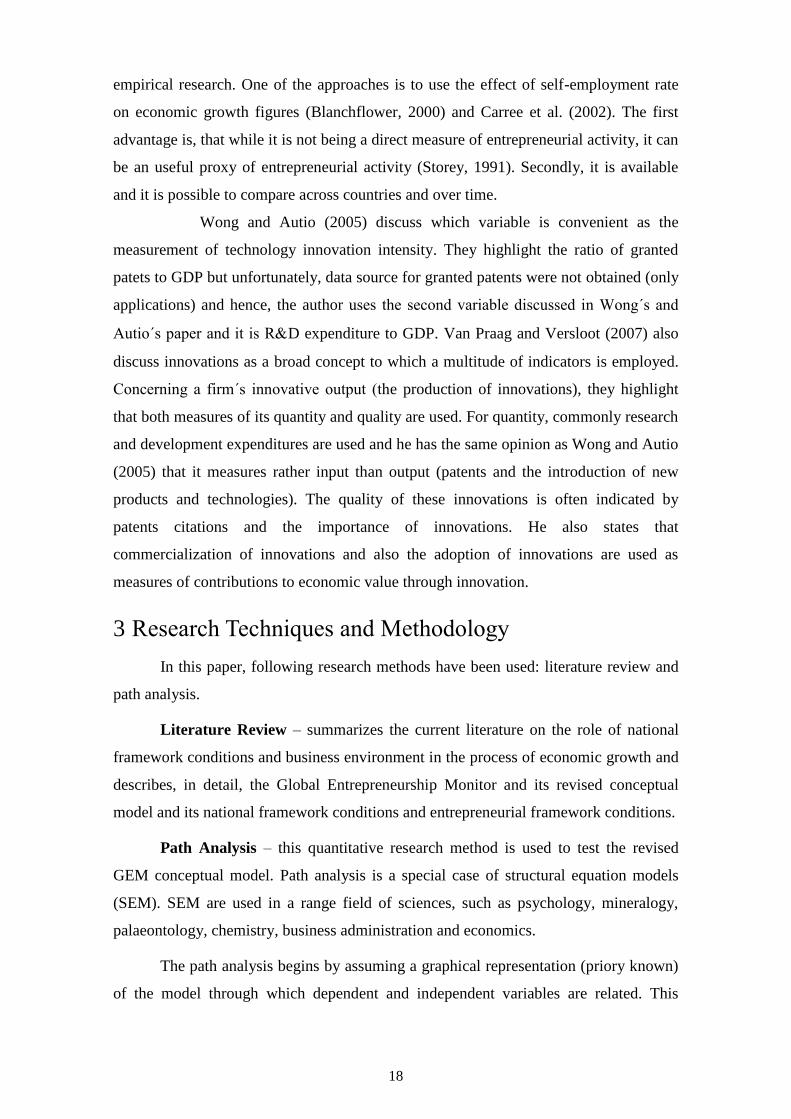
Figure 8: Input path diagram II based on the GEM Revised Model
Source: Own elaboration
4.2 Data
In this section, the author discusses data and estimated models. The author
makes use of Eurostat, World Bank Database and World Economic Forum Database.
Data on four basic variables are used in the model: Global Competitiveness Index, self-
employed workers (as % of total employed), RD expenditures (% of GDP) and GDP
per capita.
GDP per capita, constant 2005US $
GDP per capita represents gross domestic product divided by midyear
population. GDP is characterised by the sum of gross value added by all residents
producers in economy plus product taxes minus subsidies. It is calculated without any
deduction of depreciation of fabricated assets and of depletion and degradation of
natural resources. Data for GDP per capita were obtained from World Bank Database.
National and
Entrepreneurial
Framework
Conditions
Entrepreneurial
output
(Technological
Innovation Intensity)
Entrepreneurial
activity
+
Ɛ1
Socio-Economic
development Ɛ2
+
+
22
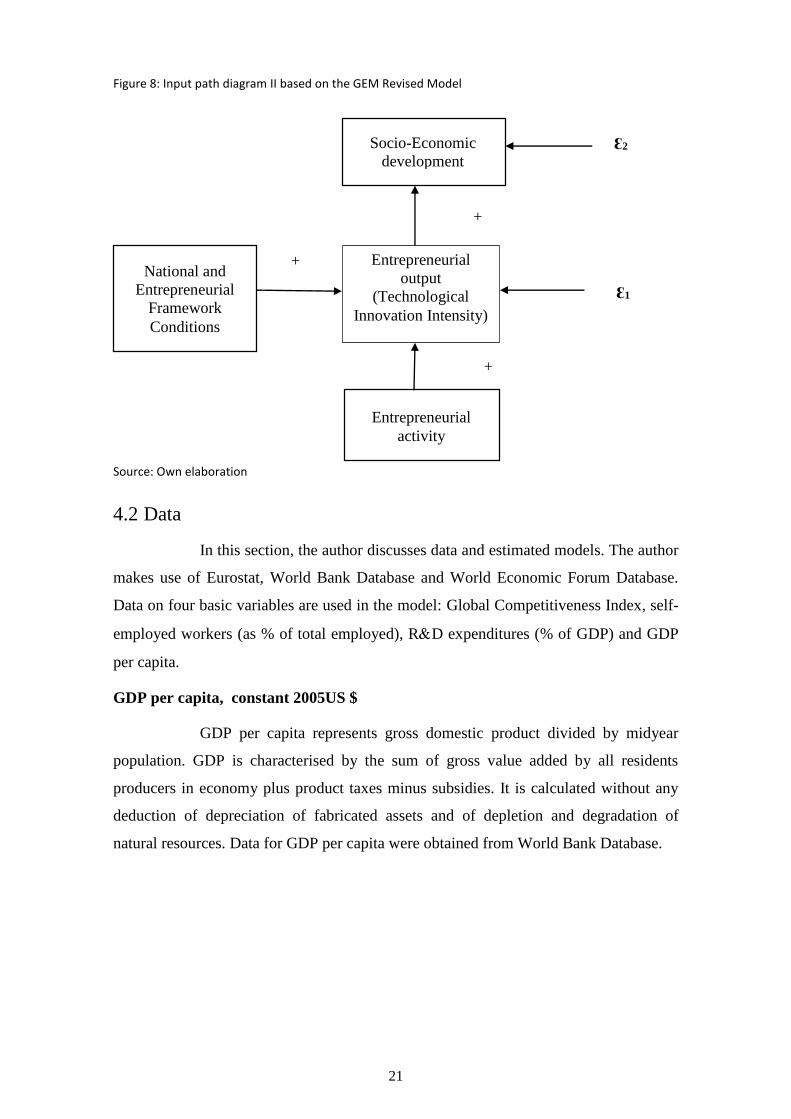
Figure 9: Mean GDP for the Nordic countries 2005-2014
Source: Gretl, own elaboration
GCI
The Global Competitiveness Index is described in section 3.1. Data source
on the Global Competitiveness Index was obtained from the World Economic Forum
dataset (2016).
Figure 10: Mean GCI for the Nordic countries 2005-2014
Source: Gretl, own elaboration
Self-employed (% of total employed)
Data source on self-employed workers was obtained from the World
Bank. The self-employed workers are those who work on their own account, with one
50500
51000
51500
52000
52500
53000
53500
54000
2005 2006 2007 2008 2009 2010 2011 2012 2013 2014
mean G
DP_PER_CAPIT
A
5.2
5.25
5.3
5.35
5.4
5.45
5.5
5.55
5.6
5.65
2005 2006 2007 2008 2009 2010 2011 2012 2013 2014
mean G
CI
23
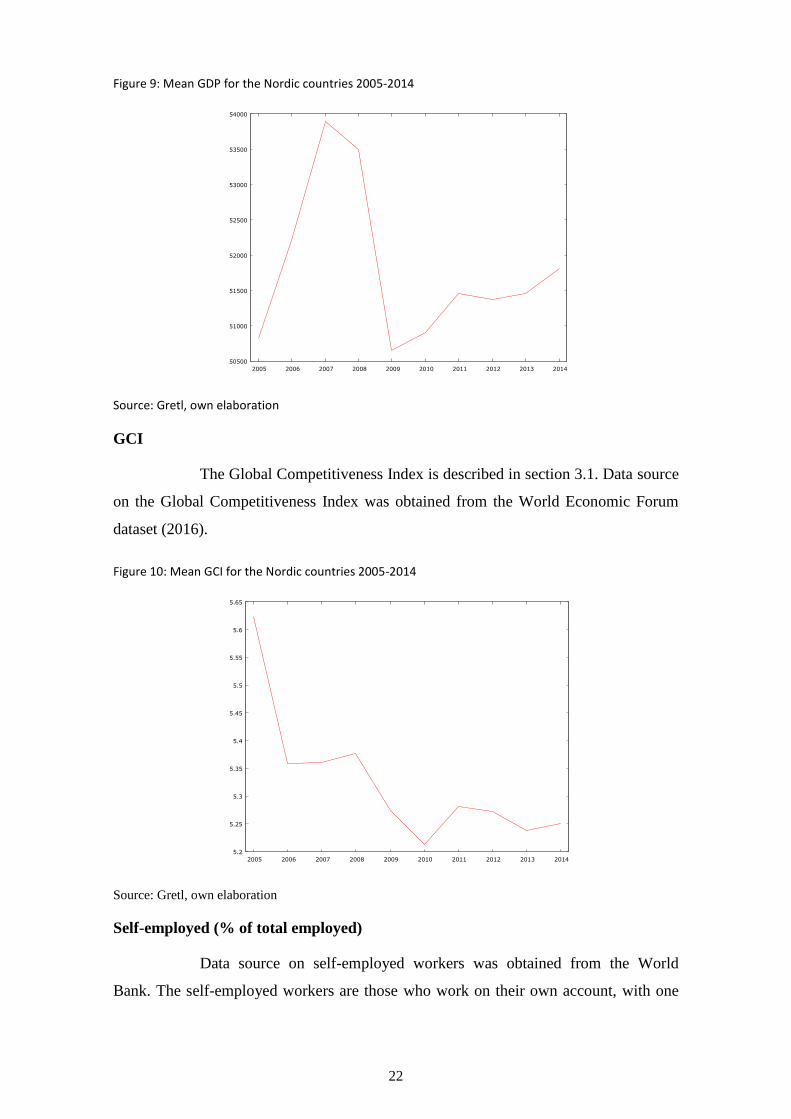
or a few partners or in cooperative and they hold the type of jobs defined as “self-
employment jobs” (World Bank, 2016).
Figure 11: Mean of self-employed in Nordic countries 2005-2014
Source: Gretl, own elaboration
Research and development expenditures (RD)
Research and development expenditures expressed as % of GDP represent
current and capital expenditures, public and private, on creative work for increasing
knowledge, including knowledge of humanity, culture and society and use of
knowledge for new applications. Research and development expenditures cover basic
research, applied research and experimental development. The data source for this
variable was obtained from dataset of World Bank (2016) and Eurostat (2016).
Figure 12: Mean of Research and development expenditures in Nordic countries 2005-2014
Source: Gretl, own elaboration
10.4
10.5
10.6
10.7
10.8
10.9
11
11.1
11.2
2005 2006 2007 2008 2009 2010 2011 2012 2013 2014
mean S
ELF_EM
PLO
YED
2.55
2.6
2.65
2.7
2.75
2.8
2.85
2.9
2.95
2005 2006 2007 2008 2009 2010 2011 2012 2013 2014
mean E
XPEN
DIT
URES_RD

24
The model estimated is as follows:
(1) d_d_log_Self_Employed = b0+ b11d_GCI + ε
d_log_RD_Expenditures = b0 + b21d_GCI + b22d_d_log_Self_Employed + ε
d_log_GDP_PER_CAPITA = b0 + b31d_GCI+ b32d_d_log_Self_Employed +
b33d_log_RD_Expenditures + ε
(2) d_log_RD_Expenditures = b0 + b11d_GCI + b12d_d_I_self_Employed + ε
4.3 Stationarity
All above presented variables are created into panel data (or longitudinal
data) bringing together Nordic countries between the years 2005-2014. The panel data
consists of a time series for each cross-sectional member in data set. For instance, it is
possible to collect data for the same set of counties in the United States on immigration
flows, tax rates, wage rates etc. for the several years (Wooldridge, 2002). Historically,
stationary process plays a significant role in the analysis of time series. For testing
stationarity, the author suggests the unit root test, specifically Augmented Dickey-Fuller
test (ADF) with constant model:
(1-L)y = b0 + (a-1)*y(-1) + e
The author tests the null hypothesis on the chosen statistical level (5 %) of
significance if the variable is non-stationary. If the null hypothesis is rejected (a = 1),
the alternative hypothesis that the variable is stationary can be accepted. When:
Im-Pesaran-Shin t-bar < critical value = we can reject null hypothesis =
stationarity
Im-Pesaran-Shin t-bar > critical value = the null hypothesis can not be
rejected = non-stationarity.
On the 5 % level of significance, the variables used for econometric
models are corrected to be stationary and hence, the author adds first differences of
selected variables to resolve the problem with non-stationarity. The results are depicted
in the table below:

25
Figure 13: Stationarity
Variable Im-Pesaran-Shin t-bar Critical value
d__I_GDP_PER_CAPITA -3.72576 -3.65
d_I_EXPENDITURES_RD -4.07586 -3.65
d_d_I_SELF_EMPLOYED -4.21144 -3.99
d_GCI -5.10857 -3.65
Source: Gretl, own elaboration
4.4 Results
Path coefficients are estimated in econometric software Gretl. Firstly,
when estimating the regression model on panel data, it is necessary to choose between
Pooled Ordinary Least Square Method (OLS), Fixed Effects Estimator or Random
Effects Estimator. After estimation models by Pooled OLS Method, the author runs
panel model diagnostics and tests with Fixed Effect Estimator the null hypothesis that
pooled OLS model is adequate and an alternative hypothesis of fixed effects, then
author also uses Breusch-Pagan test statistic to test the null hypothesis that the pooled
OLS model is adequate and an alternative hypothesis of random effects. For all models,
the null hypothesis that Pooled OLS Method is adequate is accepted:
Model 1: 0.781823 > 0,05
Model 2: 0.987519 > 0,05
Model 3: 0.909326 > 0,05
Model 4: 0,743639 > 0,05
All models are checked for heteroskedasticity by using White´s test and in all
models, the author accepts null hypothesis that the models are healthy without
heteroskedasticity presented. The author also tests if the models are clean to collinearity
by checking Variance Inflation Factors (VIF) and all values are lower than ten and
hence, every model is clean to multicollinearity. Finally, the author tests autocorrelation
using Durbin-Watson and rho statistics and according to these tests, all models are clean
to autocorrelation. The outcomes of the regression analysis and the estimation of the
standardized path coefficients are presented in the following tables.

26
Table 2: Model 1
Source: Gretl, own elaboration
Table 3: Model 2
Source: Gretl, own elaboration

27
Table 4: Model 3
Source: Gretl, own elaboration
Table 5: Model 4
Source: Gretl, own elaboration

28
4.5 Standardized beta coefficients
Estimated Model 1 investigates the relationship between national
framework conditions, entrepreneurial framework conditions and entrepreneurial
activity. In this model, explanatory variable representing national framework conditions
and entrepreneurial framework conditions is GCI and dependant variable is represented
by the self-employed expressed as % of total employed. For estimating standardized
beta coefficient, GCI is lagged up to four years. Lagged by two years, the author is able
to prove its statistical significance. On the 1 % level of significance, beta coefficient for
the Global Competitiveness Index is statistically significant (0,0003 < 0,01). The
coefficient is positive and it means that between the years 2005-2014, in Nordic
countries, higher Global Competitiveness Index (in the form of better national
framework conditions and entrepreneurial framework conditions) led to the higher
entrepreneurial activity.
The estimated Model 2 investigates the relationship between the
entrepreneurial activity next to the national framework conditions, entrepreneurial
framework conditions and technological innovation intensity. In this model, explanatory
variable representing entrepreneurial activity is self-employed expressed as % of total
employed and national framework conditions and entrepreneurial activity are
represented by the GCI and dependent variable is expenditures on R&D expressed as %
of GDP. For quantifying beta coefficient, the explanatory variables are lagged up to
three years. Lagged by two years, the author shows its statistical significance. On the 1
% level of significance, beta coefficient for the self-employed is statistically significant
(0,0030 < 0,01). Moreover, beta coefficient is positive and it means, that between the
years 2005-2014, in Nordic countries, higher entrepreneurial activity next to the
national and entrepreneurial framework conditions led to the higher technological
innovation intensity.
The estimated Model 3 investigates the relationship between technological
innovation intensity next to the national framework conditions, entrepreneurial
framework conditions and next to the entrepreneurial activity and GDP per capita. In
this model, explanatory variables representing national framework conditions,
entrepreneurial activity and entrepreneurial output are GCI, self-employed and
expenditures on R&D and dependant variable is GDP per capita. For quantifying beta
coefficient, the explanatory variables are lagged by two years to prove their statistical
significance. On the 1 % level of significance, beta coefficient for the RD

29
expenditures is statistically significant (0,0057 < 0,01). Moreover, beta coefficient for
the RD expenditures lagged by two years next to the constant self-employed and
constant GCI is positive and it means, that between the years 2005-2014, in the Nordic
countries, higher technological innovation intensity led to higher GDP per capita.
The estimated Model 4 investigates the relationship between national
framework conditions, entrepreneurial framework conditions, entrepreneurial activity
and technological innovation intensity. In the model, explanatory variable representing
national framework conditions, entrepreneurial framework conditions is Global
Competitiveness Index, entrepreneurial activity is represented by the self-employed and
dependent variable representing technological innovation intensity is represented by
RD expenditures expressed as % of GDP. The Global Competitiveness Index and self-
employed lagged by two years prove the statistical significance of these variables. The
beta coefficients are significant on the 1 % level of significance (0,0025 < 0,05; 0,0030
< 0,05). The relationship between the variables is positive and that means that between
the years 2005-2014, in Nordic countries, higher Global Competitiveness Index (in the
form of better national framework conditions and entrepreneurial framework conditions
led to the higher technological innovation intensity) next to the constant self-employed
led to the higher technological innovation intensity. Also, higher self-employed next to
the constant Global Competitiveness Index led to the higher technological innovation
intensity.
All econometric models are statistically significant (p-value (F) < 0,05).
Moreover, model 1 explains 59,41 % of dependant variable, model 2 explains 77,99 %
of dependant variable, model 3 explains 80,28 % of dependant variable and model 4
explains 77,99 % of dependant variable. In all of the models, the author finds out the
positive effect of national framework conditions and entrepreneurial framework
conditions by lagging the explanatory variables. Also, other key variables, in the
regression analysis, are put into the regression models with lags to observe the long-
term impact of the variables on economic growth. When author compares Model 1 to
Model 2, Model 3 and Model 4, the author finds out that the addition of other
explanatory variables to national framework conditions and entrepreneurial framework
conditions increases R2 considerably. Model 3 finds the long-term positive effect of
national framework conditions and entrepreneurial framework conditions,
entrepreneurial activity and technological innovation intensity on economic growth.

30
Figure 14: Output path diagram I based on the GEM Revised Model
Resource: Own elaboration
Figure 15: Input path diagram II based on the GEM Revised Model
Source: Own elaboration
Socio-Economic
development
0,220122
Socio-Economic
development
Entrepreneurial
output (Technological
Innovation Intensity)
0,405933
Entrepreneurial
output
(Technological
Innovation Intensity)
0,19723
e2
0,220122
Entrepreneurial
activity (self-
employed)
National and
Entrepreneurial
Framework
Conditions
0,19723
1,03178 0,347184
e1
0,347184
Entrepreneurial
activity
0,621146
National and
Entrepreneurial
Framework
Conditions
1.89982 0,621146
e1
e2
e3
31
As the next step, the author calculates residuals for endogenous variables
(entrepreneurial activity, technological innovation intensity and socio-economic
development) as 1-R2.
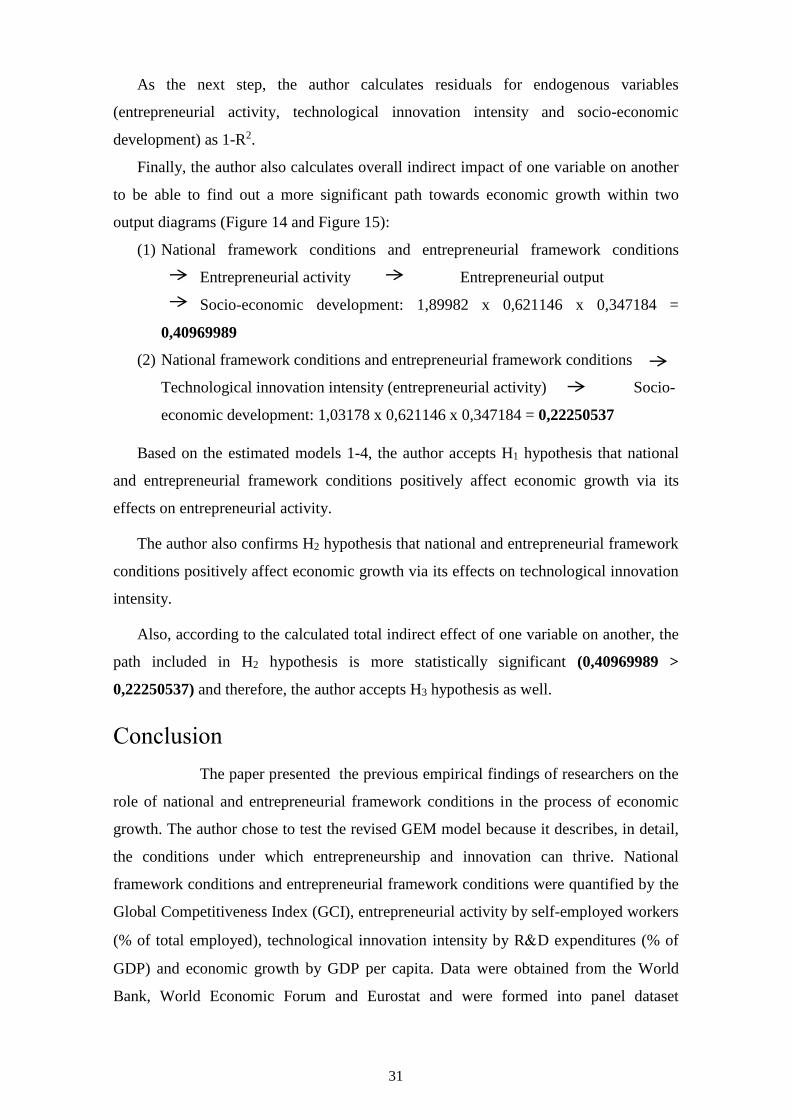
Finally, the author also calculates overall indirect impact of one variable on another
to be able to find out a more significant path towards economic growth within two
output diagrams (Figure 14 and Figure 15):
(1) National framework conditions and entrepreneurial framework conditions
Entrepreneurial activity Entrepreneurial output
Socio-economic development: 1,89982 x 0,621146 x 0,347184 =
0,40969989
(2) National framework conditions and entrepreneurial framework conditions
Technological innovation intensity (entrepreneurial activity) Socio-
economic development: 1,03178 x 0,621146 x 0,347184 = 0,22250537
Based on the estimated models 1-4, the author accepts H1 hypothesis that national
and entrepreneurial framework conditions positively affect economic growth via its
effects on entrepreneurial activity.
The author also confirms H2 hypothesis that national and entrepreneurial framework
conditions positively affect economic growth via its effects on technological innovation
intensity.
Also, according to the calculated total indirect effect of one variable on another, the
path included in H2 hypothesis is more statistically significant (0,40969989 >
0,22250537) and therefore, the author accepts H3 hypothesis as well.
Conclusion
The paper presented the previous empirical findings of researchers on the
role of national and entrepreneurial framework conditions in the process of economic
growth. The author chose to test the revised GEM model because it describes, in detail,
the conditions under which entrepreneurship and innovation can thrive. National
framework conditions and entrepreneurial framework conditions were quantified by the
Global Competitiveness Index (GCI), entrepreneurial activity by self-employed workers
(% of total employed), technological innovation intensity by RD expenditures (% of
GDP) and economic growth by GDP per capita. Data were obtained from the World
Bank, World Economic Forum and Eurostat and were formed into panel dataset

32
bringing together Nordic countries (Norway, Finland, Sweden, Denmark and Iceland)
between the years 2005-2014, using Pooled Ordinary Least Square Method (OLS).
Standardized path coefficients were estimated in software Gretl.
The author visualized two input path diagrams based on the revised GEM
model. The first path diagram showed the indirect influence of national and
entrepreneurial framework conditions on economic growth via its effects on
entrepreneurial activity. The second path diagram depicted the indirect influence of
national and entrepreneurial framework conditions on economic growth via its effects
on technological innovation intensity (influenced by entrepreneurial activity).
Before interpreting results, there were some limitations within the paper.
Firstly, the path analysis was used for the restricted period 2005-2014 because there
were no more data available. Secondly, the path analysis tested merely observable
variables from the revised GEM conceptual model and it did not test latent variables
(social values about entrepreneurship, psychological attributes, motivation and
demographic characteristics), because data source was not available for Nordic
countries. It would be also convenient to use more entrepreneurial conditions than it is
used in the Global Competitiveness Index by using Doing Business Database.
Nevertheless, the extension of the Global Competitiveness Index by entrepreneurial
variables was not the aim of this paper.
In all of the models, the author found out the positive effect of national
and entrepreneurial framework conditions using lagged explanatory variables. The
author also found the positive effect of entrepreneurial activity and technological
innovation intensity on economic growth using lagged explanatory variables.
In addition, the result obtained showed that national and entrepreneurial
framework conditions positively affect economic growth via its effects on
entrepreneurial activity and also that national and entrepreneurial framework conditions
positively affect economic growth via its effects on technological innovation intensity
(influenced by entrepreneurial activity). Nevertheless, the calculated total effect showed
that the path via entrepreneurial activity is more significant.
Therefore, the obtained results suggest that Nordic economic policy
makers should primarily encourage entrepreneurial activity by putting effort to create
friendly entrepreneurship ecosystem (make it easier for entrepreneurs to set up a
business and also to grow entrepreneurs´ businesses) followed by encouraging
technology innovation intensity-friendly environment (capacity for innovation, quality
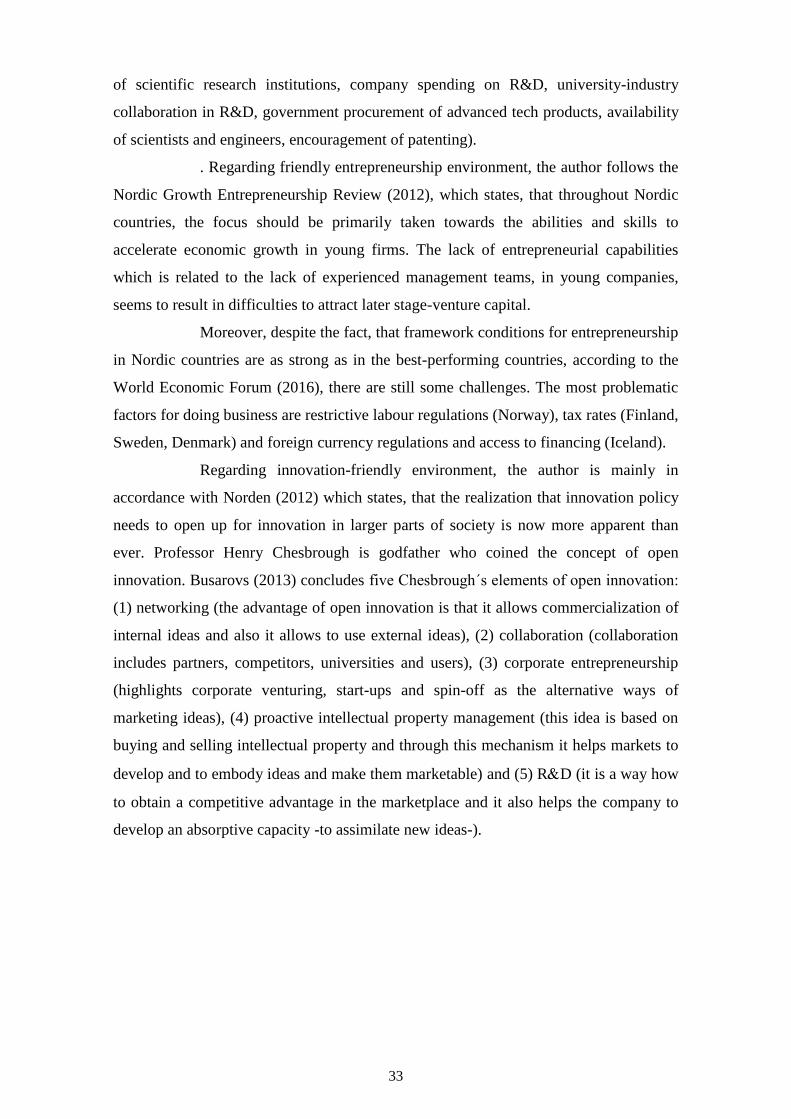
33
of scientific research institutions, company spending on R&D, university-industry
collaboration in R&D, government procurement of advanced tech products, availability
of scientists and engineers, encouragement of patenting).
. Regarding friendly entrepreneurship environment, the author follows the
Nordic Growth Entrepreneurship Review (2012), which states, that throughout Nordic
countries, the focus should be primarily taken towards the abilities and skills to
accelerate economic growth in young firms. The lack of entrepreneurial capabilities
which is related to the lack of experienced management teams, in young companies,
seems to result in difficulties to attract later stage-venture capital.
Moreover, despite the fact, that framework conditions for entrepreneurship
in Nordic countries are as strong as in the best-performing countries, according to the
World Economic Forum (2016), there are still some challenges. The most problematic
factors for doing business are restrictive labour regulations (Norway), tax rates (Finland,
Sweden, Denmark) and foreign currency regulations and access to financing (Iceland).
Regarding innovation-friendly environment, the author is mainly in
accordance with Norden (2012) which states, that the realization that innovation policy
needs to open up for innovation in larger parts of society is now more apparent than
ever. Professor Henry Chesbrough is godfather who coined the concept of open
innovation. Busarovs (2013) concludes five Chesbrough´s elements of open innovation:
(1) networking (the advantage of open innovation is that it allows commercialization of
internal ideas and also it allows to use external ideas), (2) collaboration (collaboration
includes partners, competitors, universities and users), (3) corporate entrepreneurship
(highlights corporate venturing, start-ups and spin-off as the alternative ways of
marketing ideas), (4) proactive intellectual property management (this idea is based on
buying and selling intellectual property and through this mechanism it helps markets to
develop and to embody ideas and make them marketable) and (5) RD (it is a way how
to obtain a competitive advantage in the marketplace and it also helps the company to
develop an absorptive capacity -to assimilate new ideas-).

34
References
Acs, Z., 2006. How is entrepreneurship good for economic growth? Innovations, 1(1),
pp.97-107.
Ayyagari, M., Beck, T., & Demirguc-Kunt, A., 2007. Small and medium enterprises
across the globe. Small Business Economics, 29(4), pp.415-434.
Barro, R. J., 1996. Determinants of economic growth: A cross-country empirical study.
National Bureau of Economic Research (No. w5698).
Blanchflower, D. G., 2000. Self-employment in OECD countries. Labour
economics, 7(5), 471-505.
Bleaney, M. and Nishiyama A., 2002. Explaining growth: a contest between models.
Journal of Economic Growth 7, pp.43-56.
Boldrin, M., Levine K. D., 2008. Against Intellectual Monopoly. Syracuse science &
Technology Law Reporter, 21(6), p.130.
Busarovs, A., 2013. Open innovation: Current trends and future perspectives.
Humanities and Social Sciences: Latvia, 21(2), 103-119.
Carree, M. A., & Thurik, A. R., 2002. The impact of entrepreneurship on economic
growth. Handbook of entrepreneurship research, Springer US, pp.437-471.
Djankov, S., La Porta, R., Lopez-De-Silanes, F., & Shleifer, A., 2002. The regulation of
entry. Quarterly journal of Economics, pp.1-37.
Friedman, M., 1962. Capitalism and Freedom, Chicago, University of Chicago Press.
Griliches, Z., 1990. Patent Statistics as Economic Indicators: A Survey. Journal of
Economic Literature, 28(4), pp.1661–1707.¨
Hair, J. F., Black, W. C., Babin, B. J., Anderson, R. E., & Tatham, R. L., 2006.
Multivariate data analysis (Vol. 6). Upper Saddle River, NJ: Pearson Prentice
Hall.
Johnson, J. P., & Lenartowicz, T., 1999. Culture, freedom and economic growth: do
cultural values explain economic growth?. Journal of World Business, 33(4),
332-356.
Levie, J., & Autio, E., 2008. A theoretical grounding and test of the GEM model. Small
business economics, 31(3), pp.235-263.
Mansfield, E., 1972. Contribution of Research and Development to Economic Growth
in the United States. Science, 175(4021), pp.477-486.

35
McArthur, J. W., and Sachs J. D., 2002. The Growth Competitiveness Index: Measuring
Technological Advancement and the Stages of Development. In: M. E. Porter, J.
D. Sachs, P. K. Cornelius, J. W. McArthur, K. Schwab (eds.), The Global
Competitiveness Report 2001-2002, New York, Oxford University Press, pp.28-
51.
Sala-i-Martin, X., 1997. I just run two million regressions. American Economic Review
87, pp.178-183.
Solow, R., 1970. Growth Theory and Exposition: Oxford University Press, New York.
Solow, R. M., 1956. A Contribution to the Theory of Economic Growth. Quarterly
Journal of Economics, 70(1), pp.65–94.
Storey, D. J., 1991. The birth of new firms—does unemployment matter? A review of
the evidence. Small business economics, 3(3), 167-178.
Thurik, R., Wennekers, S., & Uhlaner, L., 2002. Entrepreneurship and economic
performance: a macro perspective.
Van Praag, C. M., Versloot, P. H. 2007. What is the value of entrepreneurship? A
review of recent research. Small business economics, 29(4), pp. 351-382.
Van Stel, A., Carree, M., & Thurik, R., 2004. The effect of entrepreneurial activity on
national economic growth. Small business economics, 24(3), pp.311-321.
Wennekers, A.R.M. and Thurik A. R., 1999. Linking entrepreneurship and economic
growth. Small Business Economics 13, pp.27-55.
Wennekers, S., Uhlaner, L., & Thurik, R., 2002. Entrepreneurship and its conditions: a
macro perspective. International Journal of Entrepreneurship Education
(IJEE), 1(1), pp.25-64.
Wong, P. K., Ho, Y. P., & Autio, E., 2005. Entrepreneurship, innovation and economic
growth: Evidence from GEM data. Small Business Economics,24(3), 335-350.
Online References
Bosma, N., Wennekers, S., Amorós, E. J., 2011. Global Entrepreneurship Monitor:
2011 Extended Report. [pdf] Global Entrepreneurship Association. Available at:
http://www.gemconsortium.org/report. [Accessed 11 April 16]
Bosma, N., Coduras, A., Litovsky, Y., Seaman J., 2012. GEM Manual: A report on the
design, data and quality control of the Global Entrepreneurship Monitor. [pdf].
[Accessed 26 May 16].
36
European Commission, 2016. Growth. [online] Available at:
http://ec.europa.eu/growth/smes/promoting-entrepreneurship/index_en.htm
[Accessed 23 April 2016].
Eurostat, 2016. Eurostat – Your Key to European Statistics. [online] Available at:
http://ec.europa.eu/eurostat [Accessed 25 April 2016].
Heritage Foundation, 2016. Economic Freedom Index. [online] Available at:
http://www.heritage.org/index/. [Accessed 11 April 16].
Kelley, D. J., Singer, S., & Herrington, M., 2015/16. The global entrepreneurship
monitor: 2015/16 Global Report. [pdf] Global Entrepreneurship Research
Association. Available at: http://www.gemconsortium.org/report [Accessed 11
April 16].
Norden, 2016. Gross Domestic Product (GDP). [online] Available at:
http://www.norden.org/en/nordic-council-of-ministers/ministers-for-co-
operation-mr-sam/sustainable-development/indicators-for-sustainable-
development-1/the-nordic-welfare-model/gross-domestic-product-gdp [Accessed
04 May 16].
Norden, 2012. The Nordic Growth Entrepreneurship Review. [pdf] Nordic Innovation.
Available at:
https://www.tem.fi/files/35549/The_Nordic_Growth_Entrepreneurhip_Review_
2012.pdf [Accessed 04 May 16].
Norden, 2012. Towards a new innovation policy for green growth and welfare in the
Nordic Region. [pdf] Nordic Innovation. Available at:
http://nordicinnovation.org/Global/_Publications/Reports/2012/2012_02%20To
wards%20a%20new%20innovation%20policy%20for%20green%20growth%20
and%20welfare%20in%20the%20Nordic%20Region.pdf [Accessed 30 May 16].
Reynolds, P., Hay, M., and Camp, S., 1999. Global Entrepreneurship Monitor: 1999
Executive Report. [pdf] Kansas City, MO.: Kauffman Foundation. Available at:
file:///C:/Users/Andrea/Downloads/1313073863GEM_1999_Global_Report%20
(2).pdf [Accessed 11 April 2016].
Schwab K., (Ed.) 2015/2016. The global competitiveness report. [pdf] World Economic
Forum. Available at: http://www3.weforum.org/docs/gcr/2015-
2016/Global_Competitiveness_Report_2015-2016.pdf [Accessed 11 April
2016].

37
University of Exeter, 1997. Path analysis. [online] Available at:
http://people.exeter.ac.uk/SEGLea/multvar2/pathanal.html [Accessed 23 April
2016].
Wooldridge, J., M. 2002. Econometric Analysis of Cross Section and Panel Data. The
MIT Press 0, (5(1)), p.735.
World Bank, 2016. Countries and economies. [online] Available at:
http://data.worldbank.org/country [Accessed 11 April 2016].


![[MASTER THESIS, 2007] Sustainopreneurship - Business with a Cause. Conceptualizing Entrepreneurship for Sustainability](https://img.pdfslide.net/doc/110x75/552965a15503467a2e8b4765/master-thesis-2007-sustainopreneurship-business-with-a-cause-conceptualizing-entrepreneurship-for-sustainability.jpg)